centro de referência para energia solar e eólica sérgio brito - cepel · centro de referência...
TRANSCRIPT
Centro de Referência para Energia Solar e Eólica Sérgio Brito – CRESESB www.cresesb.cepel.br
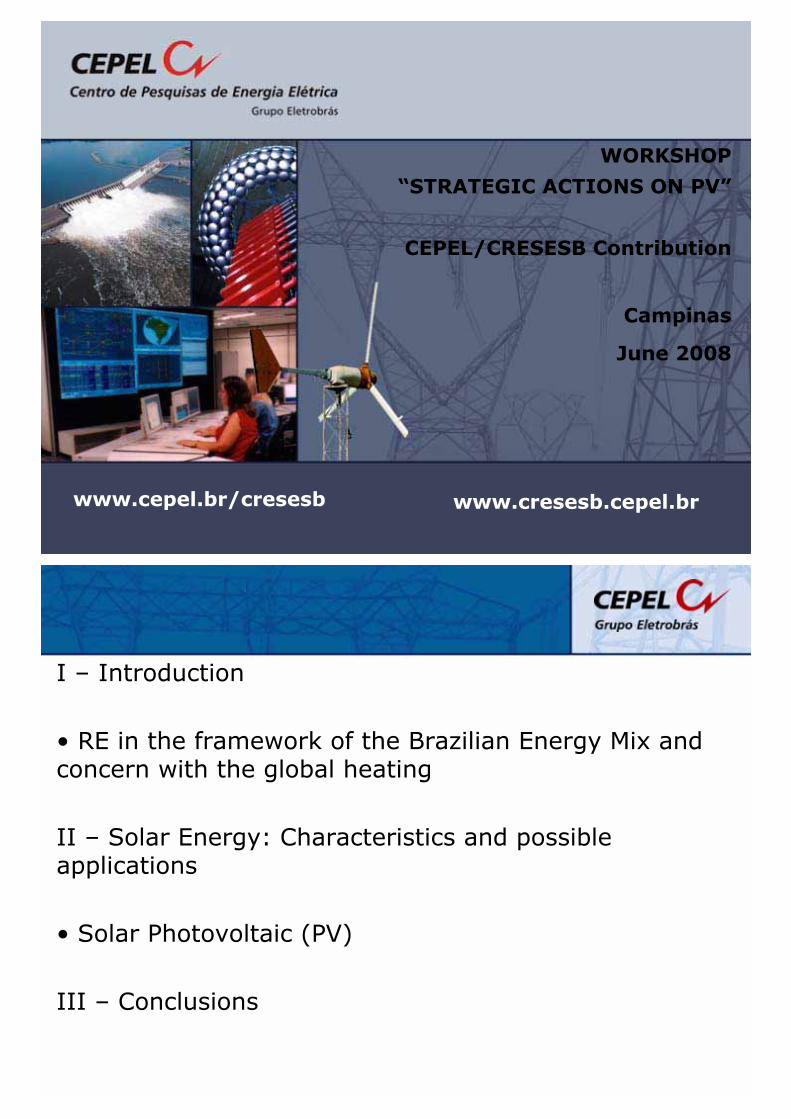
WORKSHOP
“STRATEGIC ACTIONS ON PV”
CEPEL/CRESESB Contribution
Campinas
June 2008
www.cresesb.cepel.brwww.cepel.br/cresesb
I – Introduction
• RE in the framework of the Brazilian Energy Mix and concern with the global heating
II – Solar Energy: Characteristics and possible applications
• Solar Photovoltaic (PV)
III – Conclusions
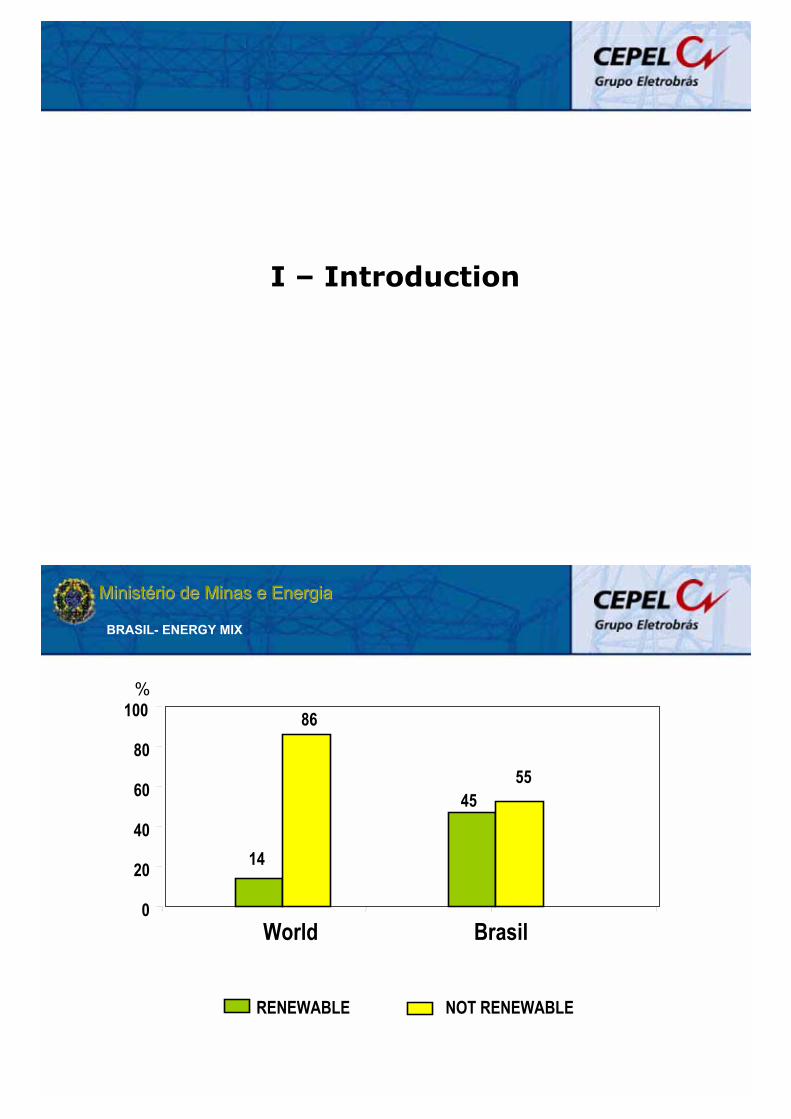
I – Introduction
Brasil
RENEWABLE NOT RENEWABLE
0
20
40
60
80
100
World
14
86
4555
%
BRASIL- ENERGY MIX
84%
2%
10%0%2%2%0%
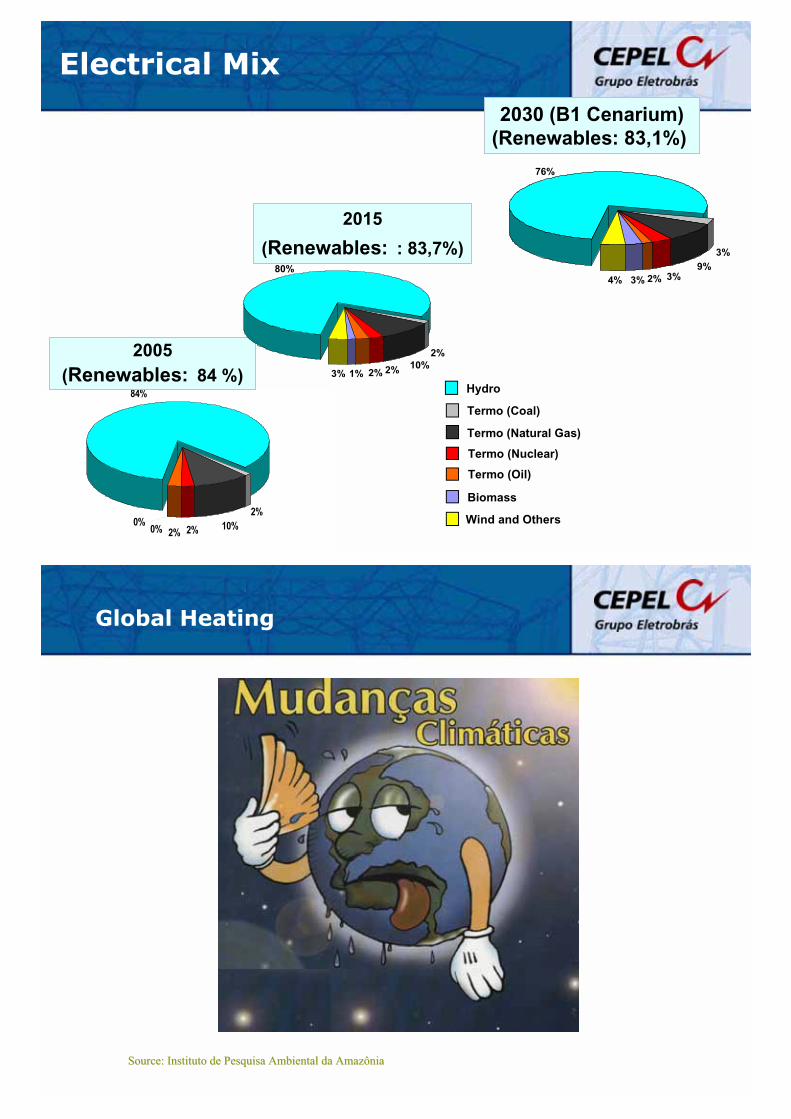
Hydro
Termo (Coal)
Termo (Natural Gas)
Termo (Nuclear)
Biomass
Termo (Oil)
Wind and Others
2005
(Renewables: 84 %)
2030 (B1 Cenarium)
(Renewables: 83,1%)
76%
3%
9%3%2%3%4%
2015
(Renewables: : 83,7%)80%
2%
10%2%2%1%3%
Electrical Mix
Global Heating
SourceSource: Instituto de Pesquisa Ambiental da Amazônia: Instituto de Pesquisa Ambiental da Amazônia
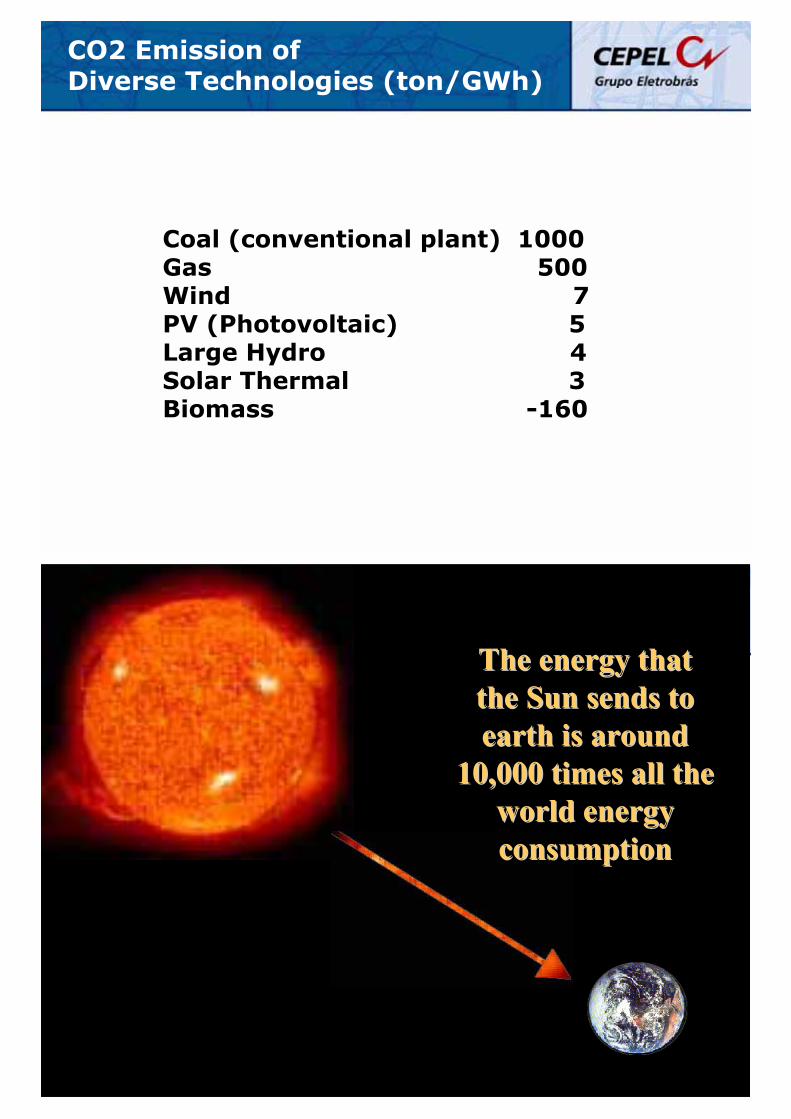
CO2 Emission of Diverse Technologies (ton/GWh)
Coal (conventional plant) 1000Gas 500Wind 7PV (Photovoltaic) 5Large Hydro 4Solar Thermal 3Biomass -160
TheThe energyenergy thatthatthethe SunSun sendssends totoearthearth isis aroundaround
10,000 times 10,000 times allall thetheworldworld energyenergyconsumptionconsumption
Fonte: Wikipedia
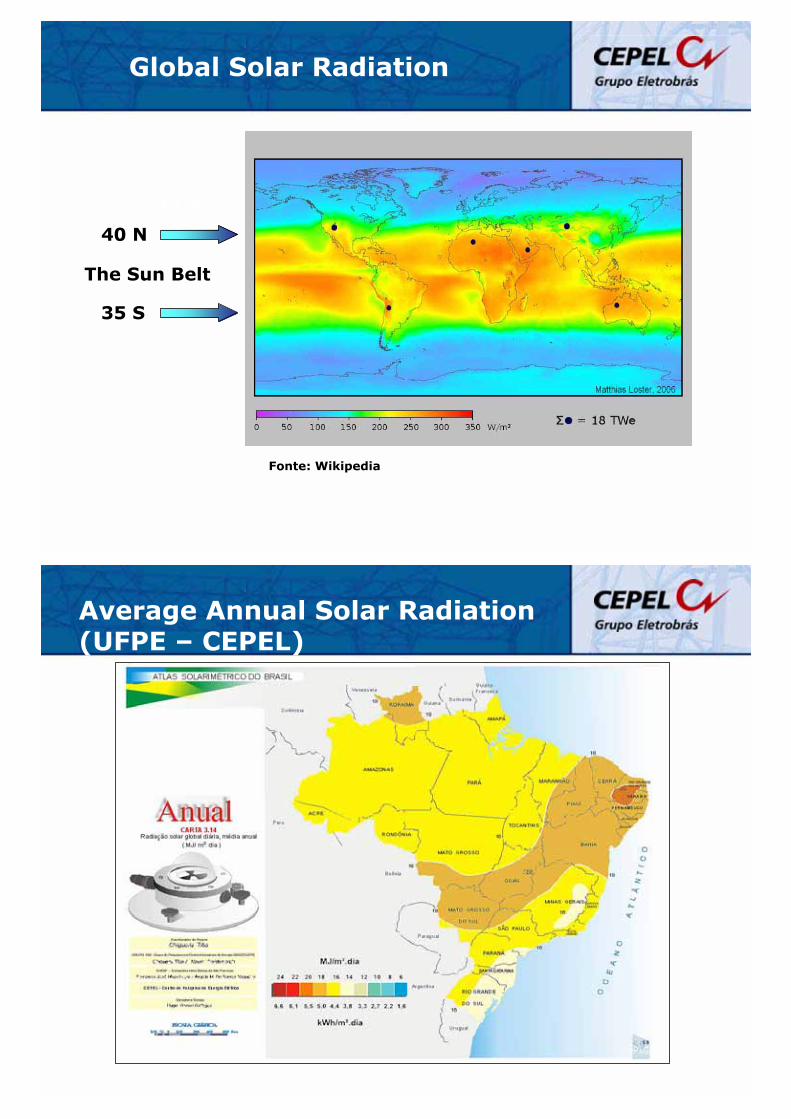
Global Solar Radiation
40 N
40 N
35 S
The Sun Belt
Average Annual Solar Radiation(UFPE – CEPEL)
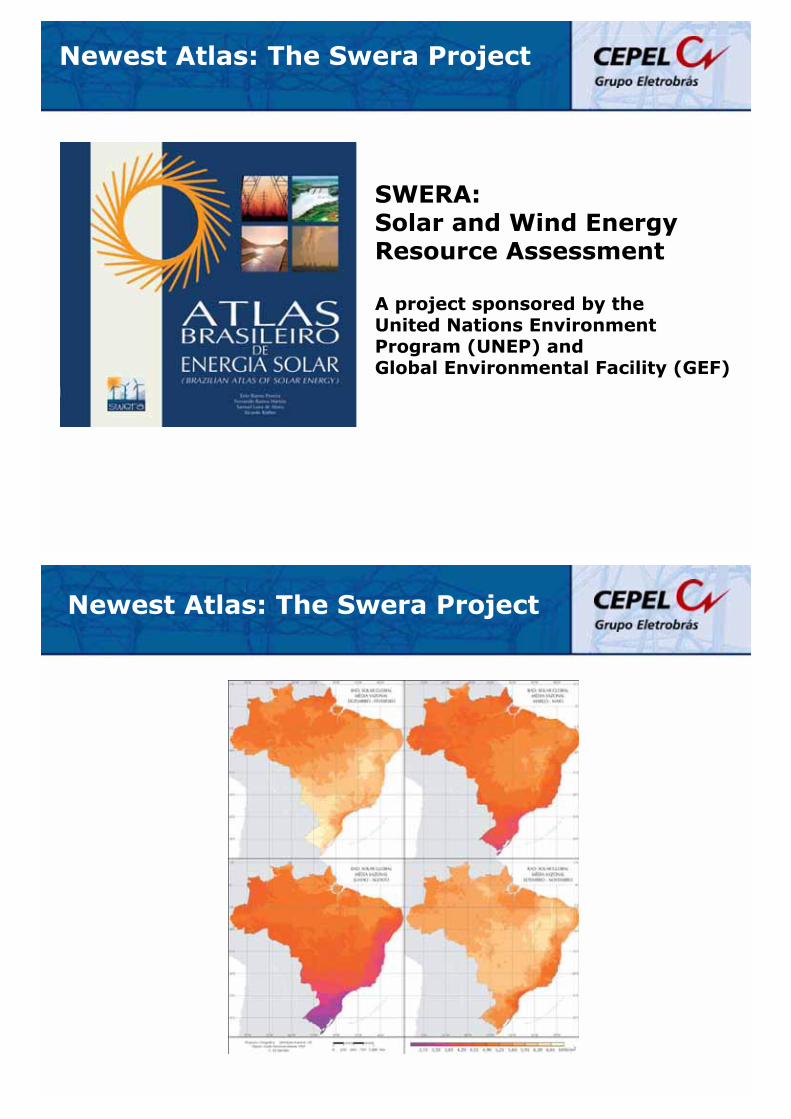
Newest Atlas: The Swera Project
SWERA:Solar and Wind EnergyResource Assessment
A project sponsored by theUnited Nations EnvironmentProgram (UNEP) andGlobal Environmental Facility (GEF)
Newest Atlas: The Swera Project
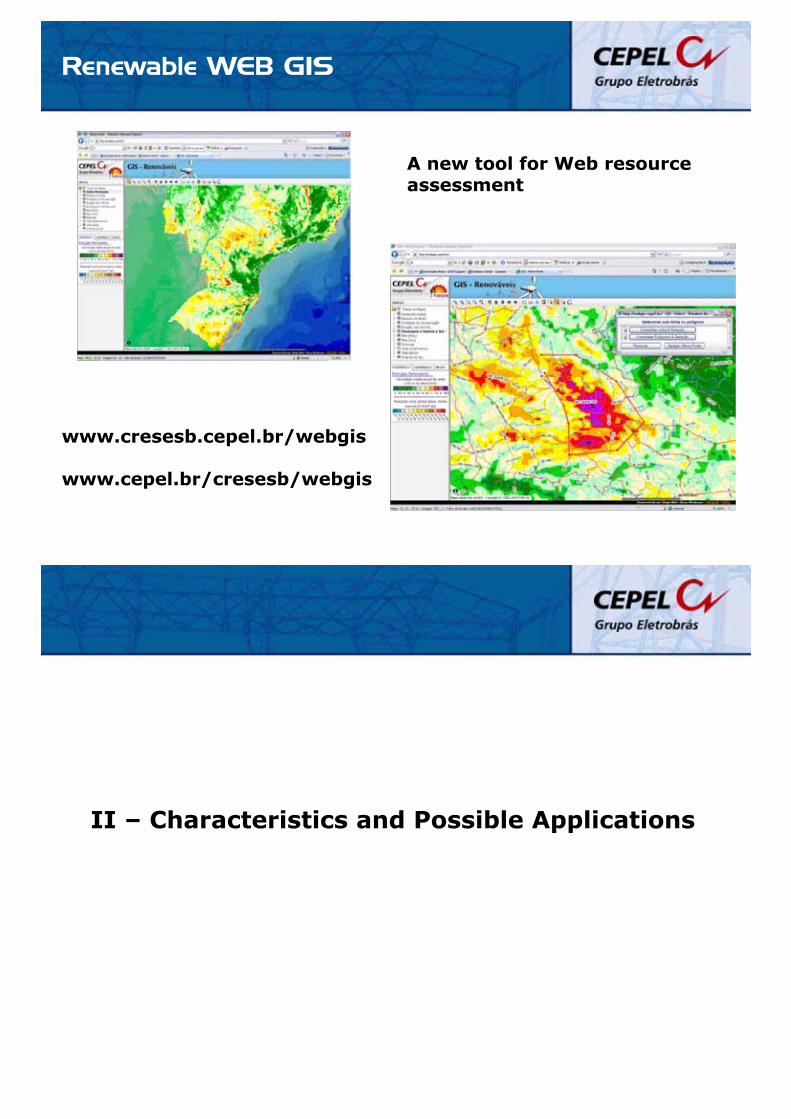
Renewable WEB GIS
www.cresesb.cepel.br/webgis
www.cepel.br/cresesb/webgis
A new tool for Web resourceassessment
II – Characteristics and Possible Applications
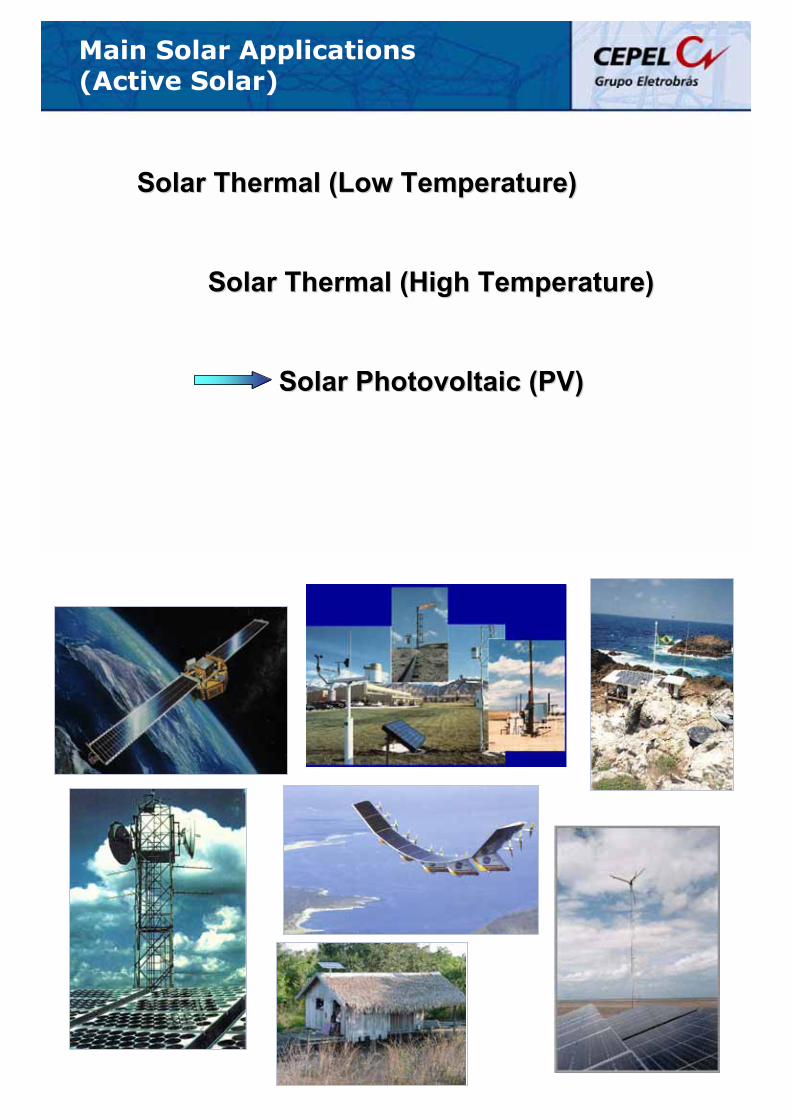
Solar Thermal (Low Temperature)Solar Thermal (Low Temperature)
Solar Thermal (High Temperature)Solar Thermal (High Temperature)
Solar Photovoltaic (PV)Solar Photovoltaic (PV)
Main Solar Applications (Active Solar)
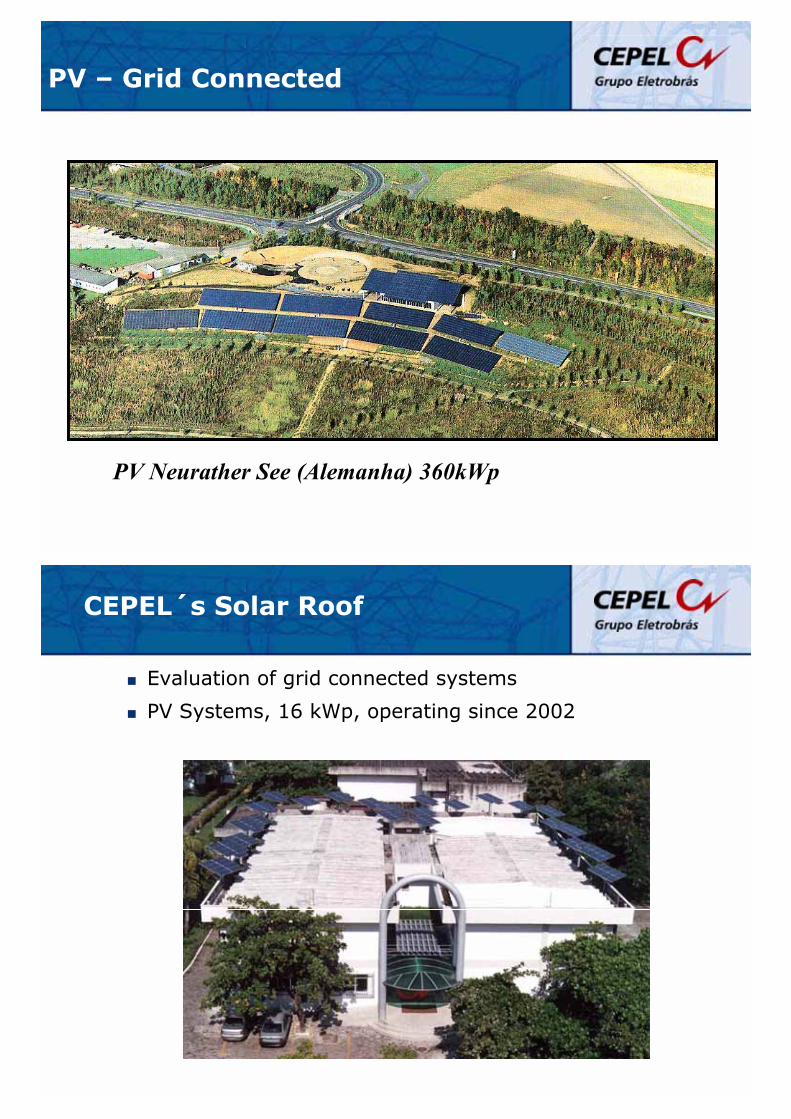
PV Neurather See (Alemanha) 360kWp
PV – Grid Connected
� Evaluation of grid connected systems
� PV Systems, 16 kWp, operating since 2002
CEPEL´s Solar Roof
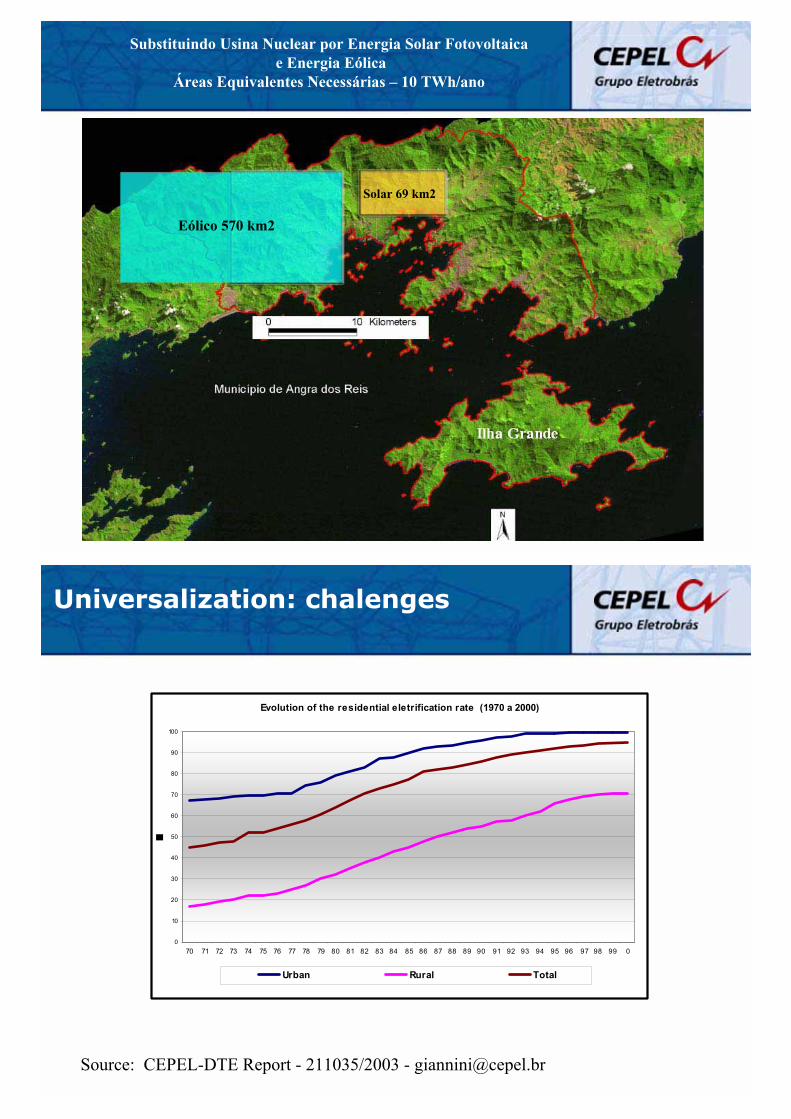
Substituindo Usina Nuclear por Energia Solar Fotovoltaicae Energia Eólica
Áreas Equivalentes Necessárias – 10 TWh/ano
Ilha Grande
Eólico 570 km2
Solar 69 km2
Universalization: chalenges
Evolution of the residential eletrification rate (1970 a 2000)
0
10
20
30
40
50
60
70
80
90
100
70 71 72 73 74 75 76 77 78 79 80 81 82 83 84 85 86 87 88 89 90 91 92 93 94 95 96 97 98 99 0
Urban Rural Total
Source: CEPEL-DTE Report - 211035/2003 - [email protected]
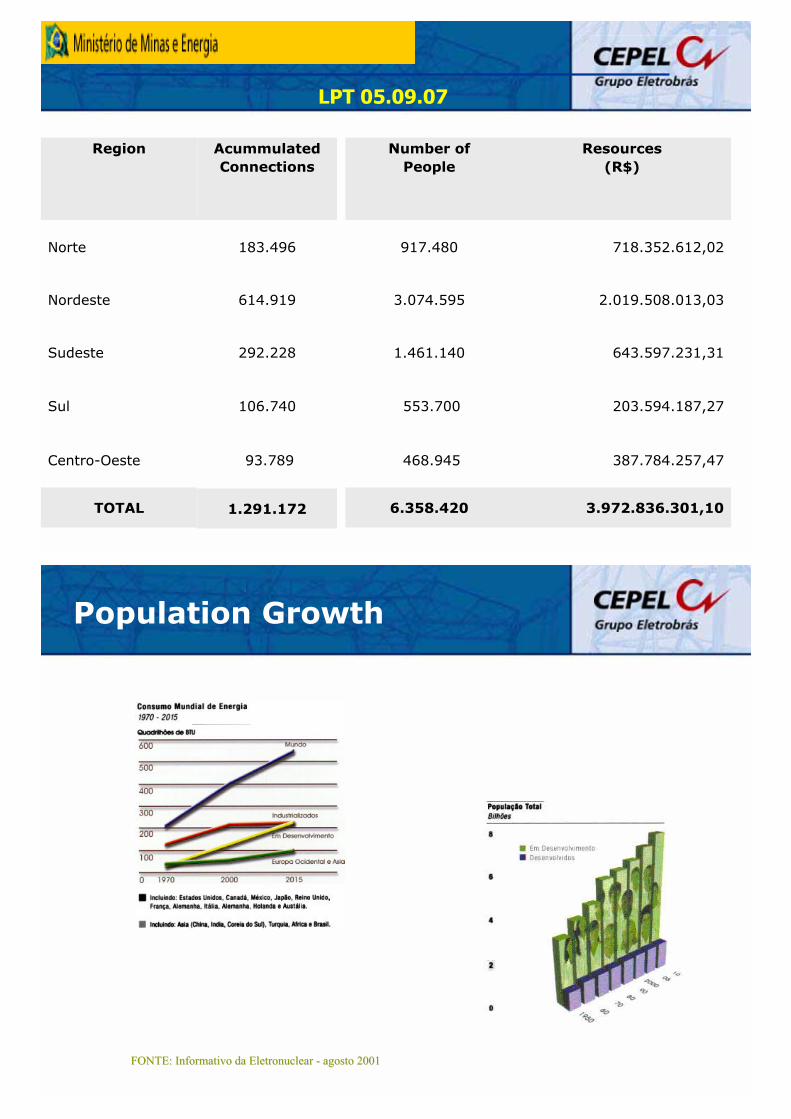
LPT 05.09.07
6.358.420
468.945
553.700
1.461.140
3.074.595
917.480
Number ofPeople
1.291.172
93.789
106.740
292.228
614.919
183.496
AcummulatedConnections
TOTAL
Centro-Oeste
Sul
Sudeste
Nordeste
Norte
Region
3.972.836.301,10
387.784.257,47
203.594.187,27
643.597.231,31
2.019.508.013,03
718.352.612,02
Resources(R$)
Population Growth
FONTE: Informativo da FONTE: Informativo da EletronuclearEletronuclear -- agosto 2001agosto 2001
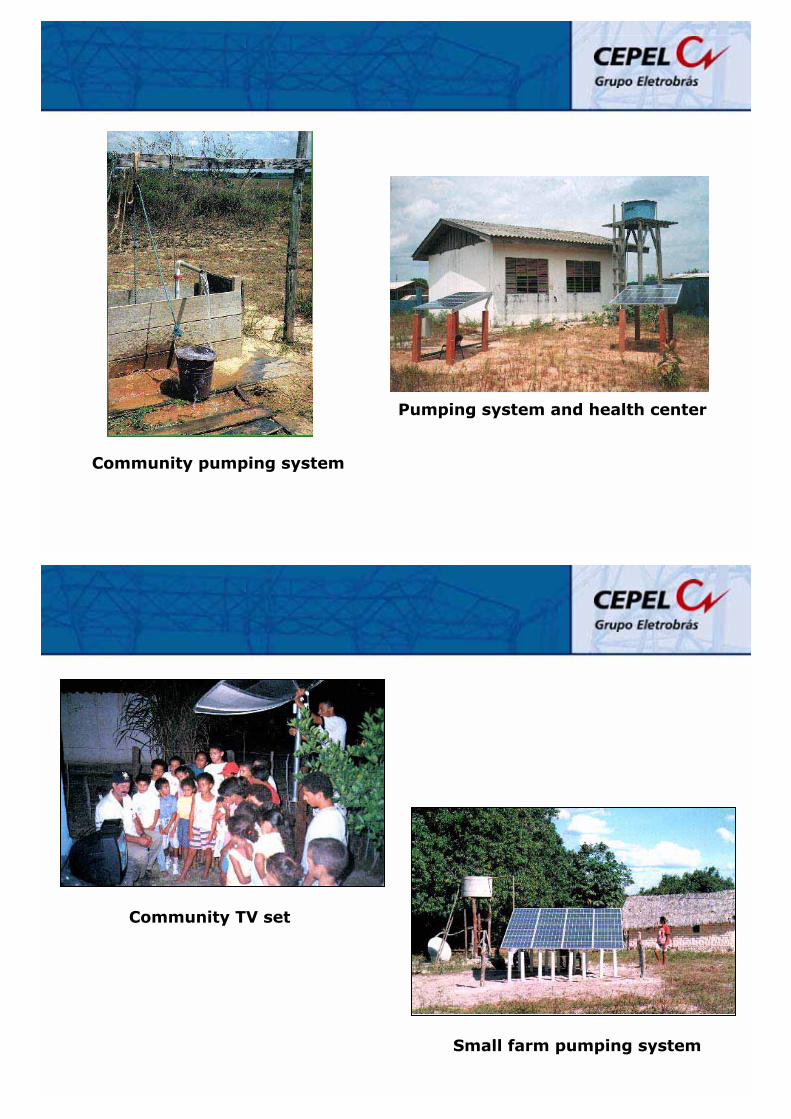
Community pumping system
Pumping system and health center
Community TV set
Small farm pumping system
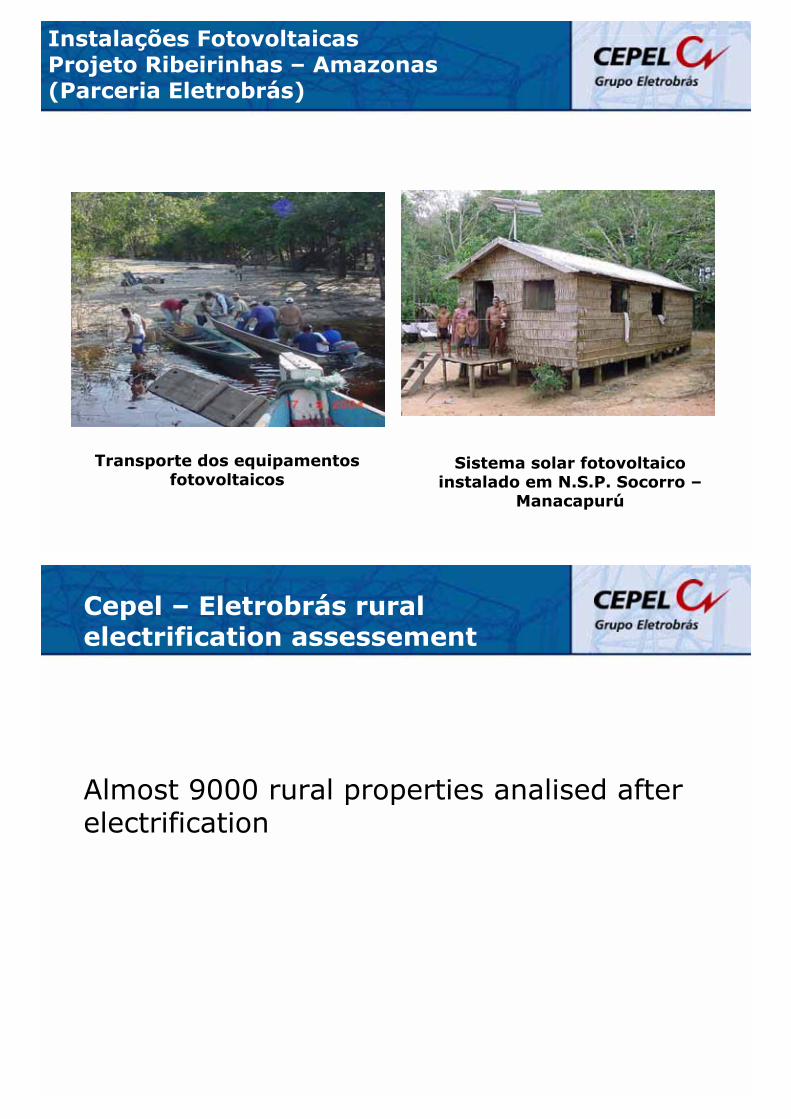
Transporte dos equipamentos fotovoltaicos
Sistema solar fotovoltaico instalado em N.S.P. Socorro –
Manacapurú
Instalações Fotovoltaicas Projeto Ribeirinhas – Amazonas (Parceria Eletrobrás)
Cepel – Eletrobrás rural electrification assessement
Almost 9000 rural properties analised after electrification
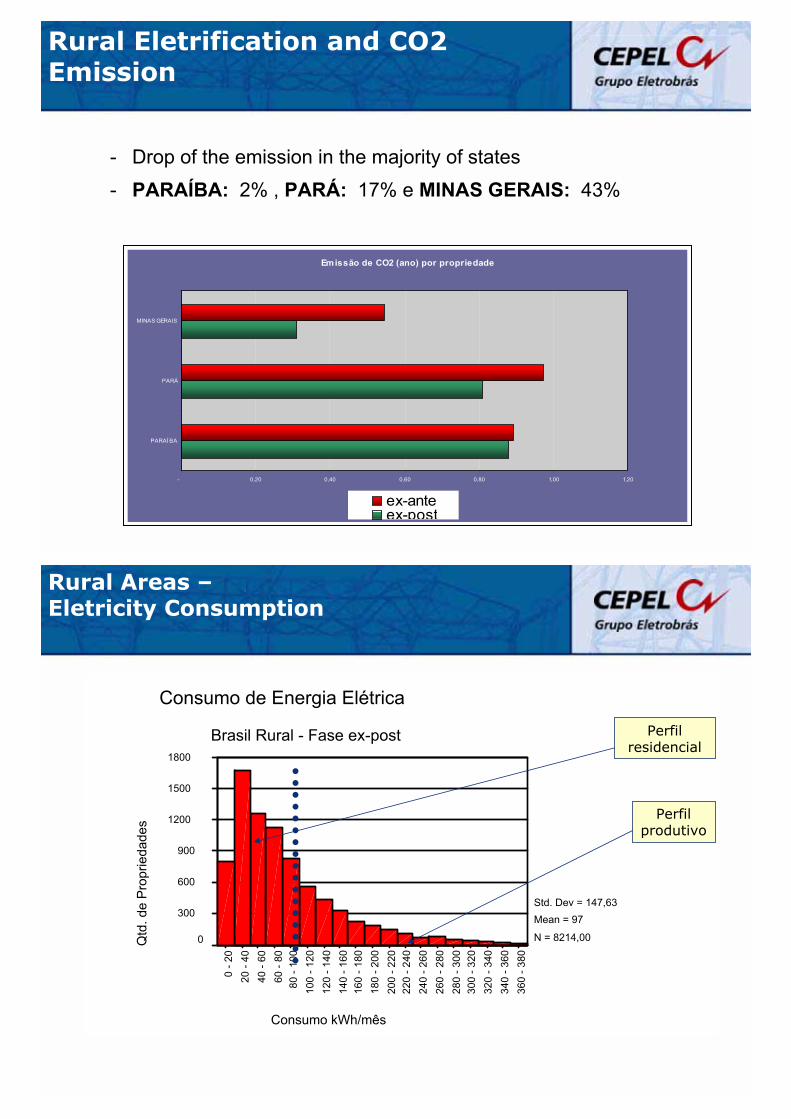
- Drop of the emission in the majority of states
- PARAÍBA: 2% , PARÁ: 17% e MINAS GERAIS: 43%
de indigentes
Emissão de CO2 (ano) por propriedade
- 0,20 0,40 0,60 0,80 1,00 1,20
PARAÍ BA
PARÁ
MINAS GERAIS
ex-anteex-post
Rural Eletrification and CO2 Emission
Consumo kWh/mês
360
- 380
340
- 360
320
- 340
300
- 320
280
- 300
260
- 280
240
- 260
220
- 240
200
- 220
180
- 200
160
- 180
140
- 160
120
- 140
100
- 120
80 -
100
60 -
8040
- 60
20 -
400
- 20
Consumo de Energia Elétrica
Brasil Rural - Fase ex-post
Qtd
. de
Pro
prie
dade
s
1800
1500
1200
900
600
300
0
Std. Dev = 147,63Mean = 97
N = 8214,00
Perfilresidencial
Perfilprodutivo
Rural Areas – Eletricity Consumption
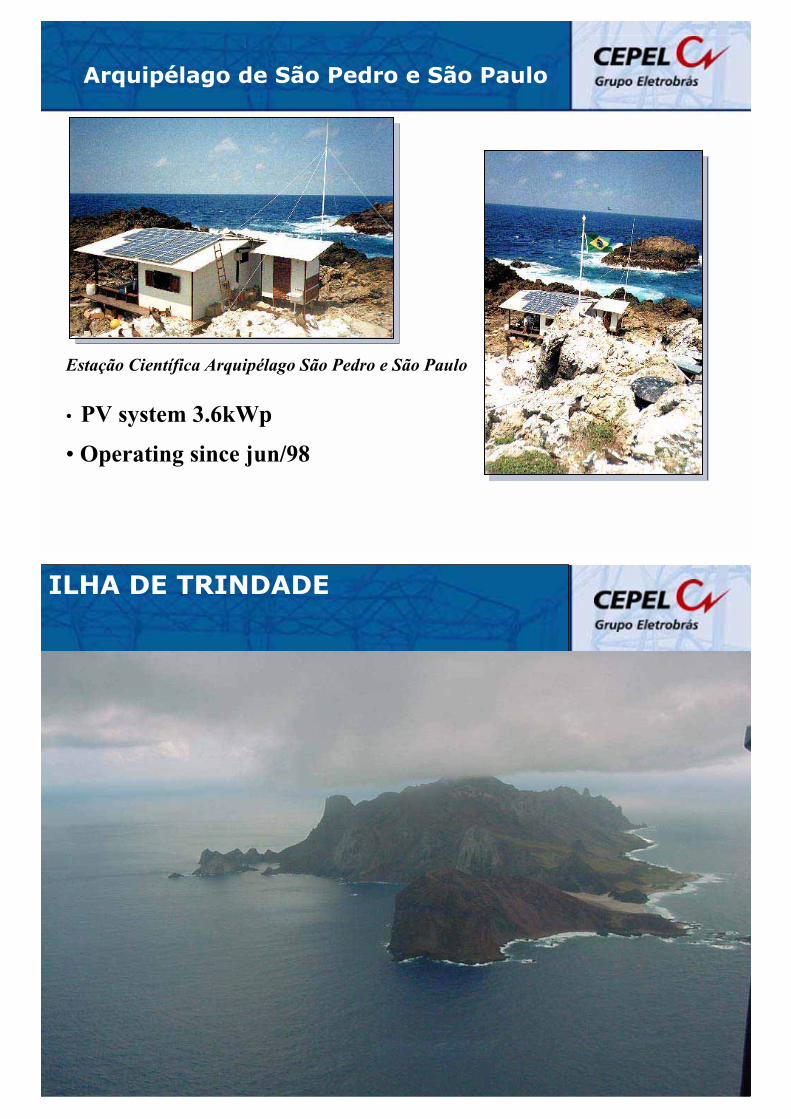
Arquipélago de São Pedro e São Paulo
Estação Científica Arquipélago São Pedro e São Paulo
• PV system 3.6kWp
• Operating since jun/98
ILHA DE TRINDADE
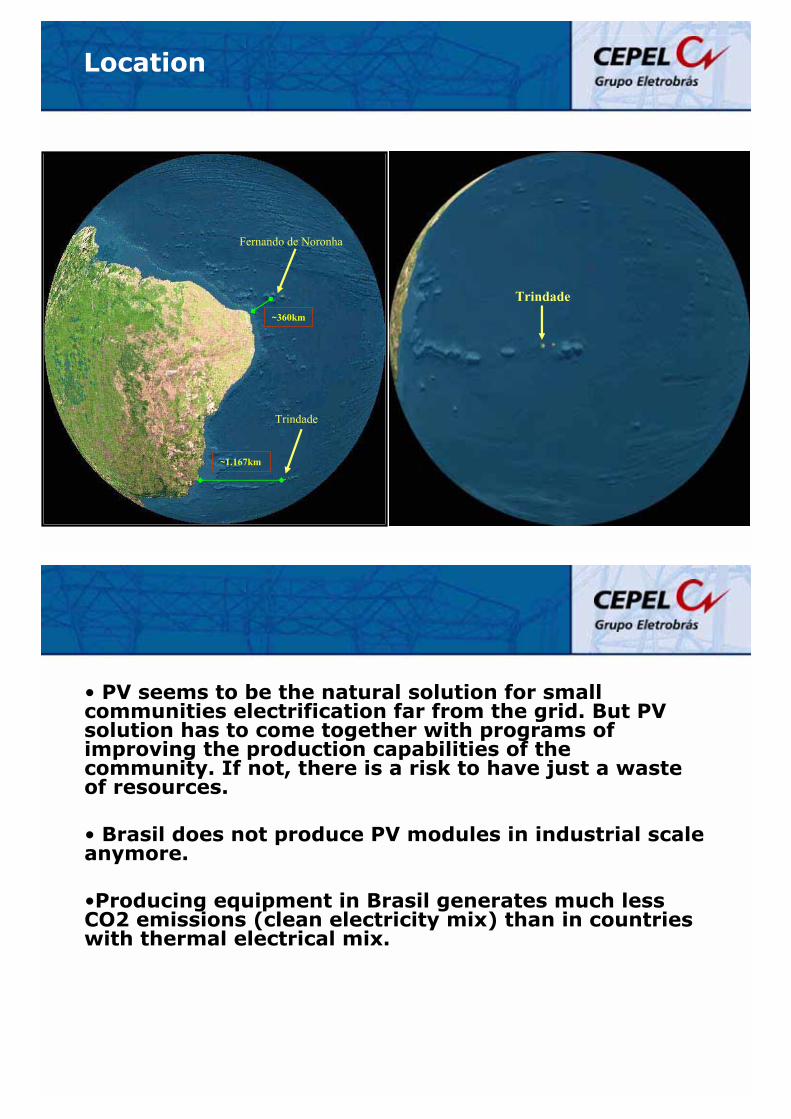
Trindade
Fernando de Noronha
~360km
Trindade
~1.167km
Location
• PV seems to be the natural solution for small communities electrification far from the grid. But PV solution has to come together with programs of improving the production capabilities of the community. If not, there is a risk to have just a waste of resources.
• Brasil does not produce PV modules in industrial scale anymore.
•Producing equipment in Brasil generates much less CO2 emissions (clean electricity mix) than in countries with thermal electrical mix.
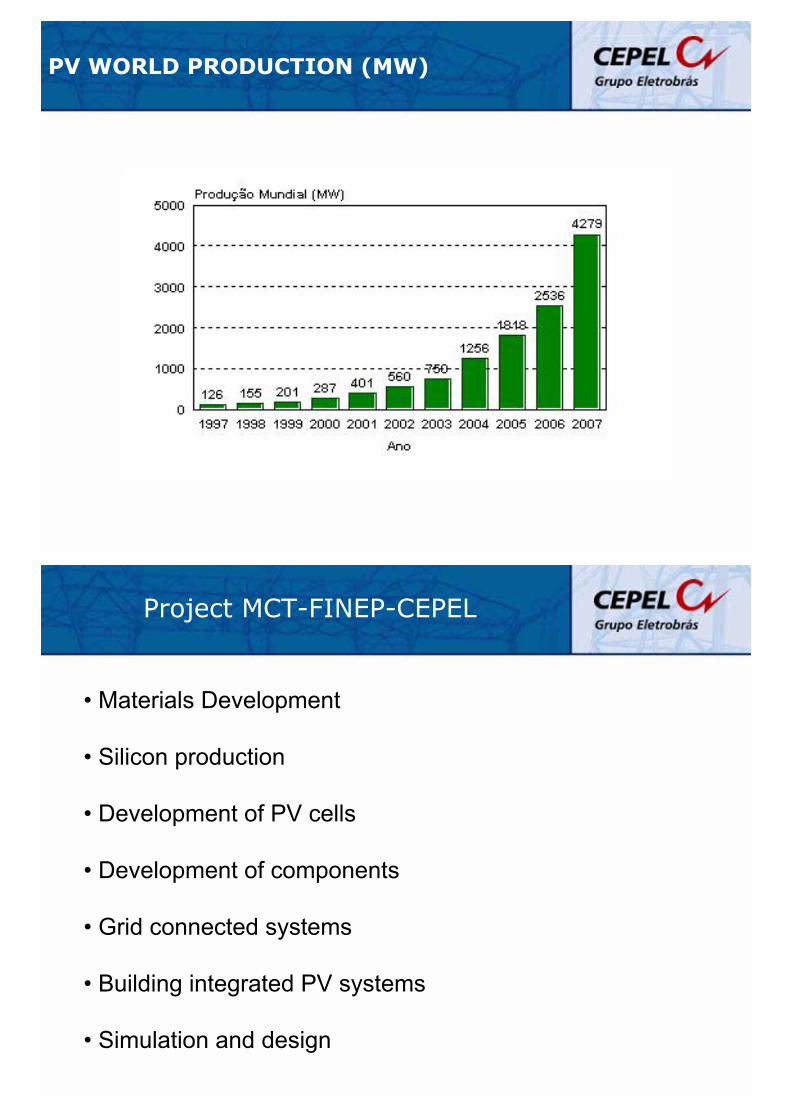
PV WORLD PRODUCTION (MW)
Project MCT-FINEP-CEPEL
• Materials Development
• Silicon production
• Development of PV cells
• Development of components
• Grid connected systems
• Building integrated PV systems
• Simulation and design
III – Conclusions
• Brasil is already a renewable energy country (hydro and biomass). This can be a barrier to the introduction of other renewable sources if their costs are significantly higher than other alternatives.
• With lower prices of equipment (due to technical improvements and production scale) , higher prices of conventional sources and the increasing concern with environmental impacts, the penetration of renewable energies can be higher in Brasil than conservative nowadays forecast. We need efforts to make PV to follow this trend.
• Intermediate and small PV systems are already economically feasible in specific applications even with the present price conditions.
• Joint programs between countries, regions and institutions, changing technology and experiences, exploring synergies and improving production scale, seems to be a way to lower costs and strength the role of PV in the near future.
Workshop Objective
The General objective of this Workshopshould be to create an environment
suitable for promoting a dynamic dialogue able to strength inter-
institutional connections and establish joint actions between
institutions, driven in the direction ofincrease the use of renewable sources of
energy, PV in particular
OBRIGADO PELA ATENOBRIGADO PELA ATENÇÇÃO!ÃO!
Contact: Hamilton Moss de Souza