chad: poverty reduction strategy paper -- 2005 annual - planipolis
TRANSCRIPT

© 2007 International Monetary Fund August 2007 IMF Country Report No. 07/282
[Month, Day], 2001 [Month, Day], 2001
Chad: Poverty Reduction Strategy Paper—2005 Annual Implementation Progress Report
Poverty Reduction Strategy Papers (PRSPs) are prepared by member countries in broad consultation with stakeholders and development partners, including the staffs of the World Bank and the IMF. Updated every three years with annual progress reports, they describe the country's macroeconomic, structural, and social policies in support of growth and poverty reduction, as well as associated external financing needs and major sources of financing. This country document for Chad, dated December 2005, is being made available on the IMF website by agreement with the member country as a service to users of the IMF website.
To assist the IMF in evaluating the publication policy, reader comments are invited and may be sent by e-mail to [email protected].
Copies of this report are available to the public from
International Monetary Fund • Publication Services 700 19th Street, N.W. • Washington, D.C. 20431
Telephone: (202) 623-7430 • Telefax: (202) 623-7201 E-mail: [email protected] • Internet: http://www.imf.org
Price: $18.00 a copy
International Monetary Fund
Washington, D.C.


TRANSLATED FROM FRENCH
REPUBLIC OF CHAD Unité-Travail - Progrès
PRESIDENCY OF THE REPUBLIC
OFFICE OF THE PRIME MINISTER
MINISTRY OF ECONOMY, PLANNING, AND COOPERATION
POVERTY OBSERVATORY
NPRS STEERING COMMITTEE
National Poverty Reduction Strategy Monitoring and Implementation Report
2005
N’Djamena – December 2005

TRANSLATED FROM FRENCH
1
Table of Contents
SUMMARY...........................................................................................................................................................................................3 INTRODUCTION...............................................................................................................................................................................13 A COMPREHENSIVE VIEW OF POVERTY REDUCTION..........................................................................................................15
1.1 Justification for an Integrated Approach to Poverty Reduction ................................................15 1.2 Specific Poverty Reduction Objectives Through 2006.................................................................16
II. INSTITUTIONAL MECHANISM AND MONITORING TOOLS .............................................................................................20 2.1 Status of Implementation of NPRS Monitoring and Assessment Mechanisms .........................20 2.2 Information System for Monitoring the NPRS ...........................................................................22
III. NPRS IMPLEMENTATION – TOWARD GOOD GOVERNANCE........................................................................................25 3.1. The SNBG Program of Action ......................................................................................................25 3.2. The SNBG and the SNRP..............................................................................................................26 3.3. NPRS Implementation in the Area of Governance .....................................................................26 3.4. Assessment of Measures Taken and Governance Reforms Implemented ................................29
IV. IMPLEMENTATION OF THE NPRS – TOWARD SUSTAINED GROWTH........................................................................30 4.1. Supporting Robust Growth by Developing Oil Resources .........................................................30 4.2 Transforming the Structure of the Economy ...............................................................................31 4.3. Favorable Development of Foreign Exchange.............................................................................32 4.4. Basic Infrastructure Development ...............................................................................................32 4.5 Foundations for Sustainable Growth in Agricultural Production..............................................39
V. IMPLEMENTATION OF THE NPRS – DEVELOPING HUMAN CAPITAL..........................................................................42 5.1 The education sector .......................................................................................................................42 5.2. Establish an effective healthcare system......................................................................................45
VI. IMPLEMENTATION OF THE NPRS – IMPROVING THE LIVING CONDITIONS OF VULNERABLE GROUPS.........49 VII. IMPLEMENTATION OF THE NPRS – ENVIRONMENTAL PROTECTION......................................................................50 VIII. OUTLOOK AND RECOMMENDATIONS.............................................................................................................................52
8.1 Provisional Assessment of Economic Policies and Implementation of the NPRS .....................52 8.2 Recommendations ...........................................................................................................................53 8.3 Timing of the revision of the NPRS...............................................................................................55
ANNEXES...........................................................................................................................................................................................56 Annex 1 : Table of pro-poor expenditure in Chad.............................................................................57 Annex 2: Production of major crops ...................................................................................................61 Annex 3: Completed matrix of NPRS performance indicators ........................................................62 Annex 4: Matrix for monitoring NPRS priority actions ...................................................................65
2
ACRONYMS AND ABBREVIATIONS ACORD Agency for Co-operation and Research in Development APICA Association for the Promotion of African Community Initiatives ATRAM Improved Technologies Workshop (Atelier de Technologies Améliorées de Mongo) BDP Program Budget IRSC Institutional Reform Support Credit CID Integrated Expenditure Circuit DDEN Departmental Delegation for National Education EMF Microfinance Institution ENIP National School for Primary Education Inspectors EFA Education For All GEDEL Water Governance and Local Economic Development Program HIPC Heavily Indebted Poor Countries Initiative LRVZ Farcha National Veterinary and Zootechnical Research Laboratory MATUH Ministry of Territorial Administration, Urban Development, and Housing MEN Ministry of National Education MDG Millennium Development Goals ONASA National Food Security Office ONDR National Rural Development Office PAEP Livestock System Support Program PAMFIP Fiscal Modernization Plan PARSET Project Supporting Chadian Education Sector Reforms PASEC Program Supporting Knowledge Monitoring and Evaluation PASEP Pastoralism and Livestock Sector Support Project PCVZS Sudan Area Food Crops Project PDIS Salamat Integrated Development Project PDRPL Préfecture du Lac Rural Development Project PGRN Sudan Area Natural Resources Management Project PIDR Rural Development Intervention Plan PNSA National Food Security Program PODER-K Kanem Rural Development Project PROADEL Local Development Support Program PRODER-B Batha Rural Development Project PROSE Sectoral Capacity-Building Program PSANG North Guéra Food Security Project PSAOP Project Supporting Agricultural Services and Producers Associations PER Public Expenditure Review RDR Rural Development Regions RESEN Forum on the National Education Sector (Réflexion sur le Secteur de l’Education
Nationale) SDR Rural Development Districts NPRS National Poverty Reduction Strategy SSDD Comprehensive Expenditure Tracking System ZDR Rural Development Zones

3
SUMMARY
In April 2000, the government of Chad began to prepare a National Poverty Reduction Strategy (NPRS) as part of a participatory process involving the private and the public sector, opinion leaders, academia, and civil society organizations. Adopted by the High Interministerial Committee in June 2003, the NPRS was approved by the IMF and the World Bank in November 2003. The NPRS presents an overall view of the country’s economic and social policies and proposes to cut poverty by half in less than 15 years (by 2015). The strategy is based on the attainment of five core objectives: good governance, robust and sustained growth, the development of human capital, improved living conditions for the most vulnerable segments of the population, and environmental protection. In 2004, the first implementation report noted the progress made in applying the strategy. The report described several obstacles, such as the delays in creating institutions responsible for monitoring the NPRS, as well as the inconsistencies between NPRS objectives and the focus of some sectoral programs. However, it also highlighted the efforts of several sectors to define and implement sectoral strategies that were more tailored to poverty reduction. This report aims to provide a more comprehensive account of the measures taken and results achieved since the beginning of NPRS implementation: after reviewing the institutional mechanisms set up to monitor and evaluate the strategy, the report assesses the actions taken to achieve each of the five core objectives of the strategy since the NPRS was adopted. A. Establishment of a Consistent Institutional System for Monitoring the NPRS The decree creating the institutional mechanisms for monitoring and assessing NPRS implementation and its enabling legislation were adopted in 2005. A Poverty Observatory was set up under the supervision of the High Committee for NPRS Supervision. This unit comprises a Steering Committee, as well as sectoral and local entities, which act as the technical interface for this initiative. These institutions are supported by a Technical Secretariat and a Communications Unit. The NPRS Coordination and Monitoring Unit began operations in June 2005 (with UNDP support). The Steering Committee, which brings together representatives of the National Assembly, the public sector, the private sector, and civil society, is an extension of the participatory process that characterized the preparation of the NPRS. This committee disseminates information on the NPRS concept and objectives, validates sectoral and inter-sectoral strategies and programs for poverty reduction, assesses the impact of measures on the beneficiaries, and proposes periodic reviews of the strategy. B. Toward Good Governance The government believes that given the situation in Chad, promoting good governance is the most important reform to spur the country’s development and reduce poverty. In this area, the core objectives of the SNRP are: administrative reforms and decentralization, fiscal consolidation, justice reform, and the security of people and property. (a) In terms of administrative reforms, the primary measures taken were to conduct institutional and organizational audits of nine key ministries. The purpose of these audits was to review the structure of these ministries and their capacity for optimizing the use of government

4
resources. Some of the measures that should be taken to gradually boost the effectiveness of general government are to revise specific regulations, reform pay scales, establish a compensation system that accounts for the particular constraints of the different categories of public officials, and set up performance incentives. The deconcentration process, which took place between 2002 and 2005, will be used as the basis for a smooth decentralization process. Local elections, originally slated for 2005, should take place next year. (b) Fiscal consolidation was achieved mainly by increasing tax and nontax receipts, reducing deficits, and restructuring public expenditures.
The ratio of tax and non-tax revenues increased from 7.4 percent of GDP in 2001 to 8-8.7 percent in 2002-2003, and to 10.5 percent in 2004. That ratio is expected to reach 12.4 percent in 2005, partially due to increased oil revenues, but other revenues also grew significantly over the past three years;
The stabilization of current and total expenditures since 2002-20031 transformed the primary fiscal deficit of 1-2 percent of GDP recorded in 2001-2002 into a surplus of 1-2 percent in 2004-2005, and considerably reduced the overall deficit (on a commitment basis, excluding grants) from 10-13 percent of GDP in 2001-2003 to around 7-8 percent in 2004-2005; and
The government also implemented key measures to improve the structure of public expenditure. The relative weight of the nine priority2 economic and social sectors increased from 32 percent of total expenditures (executed) in 2001-2002 to 66 percent in 2004. A total of 66 percent of the scheduled 2005 budget allocations are earmarked for priority sectors.
The government also made a commitment to modernize and increase the transparency of fiscal management:
Program budgets are being prepared to implement the objectives and priorities of the sectoral strategies;
A series of provisions were adopted to enhance the monitoring of budget execution and tighten fiscal discipline, including: setting up an integrated expenditure circuit (CID), tracking expenditures in two priority sectors (education and health), preparing a Fiscal Modernization Plan (PAMFIP), reviewing the end-year treasury account, approving the budget review law, and creating a ministry responsible for general oversight of the government and ethics [moralisation], which introduced controls and penalized violations; and
Another key reform is the adoption of a new public procurement code: commissions responsible for assessing bids were established, eight quarterly bulletins were published, and the government contracts awarded in 2001 and 2002 were audited by an international auditing firm and the Audit Office.
1Current expenditures shrank from 10 percent of GDP in 2002 to approximately 7 percent in 2004-2005, and total expenditures fell from 24 percent of GDP in 2003 to 18-19 percent in 2004-2005. 2 Education, health, social action, public works, agriculture, stockbreeding, environment and water, land management, and justice.

5
(c) The government also made a commitment to reform and modernize the justice system:
A participatory Justice Forum (Etats Généraux de la Justice) was held in 2003 and a High Council on Justice, the legal authority responsible for judicial conduct, was established;
Training was provided to numerous juges de paix, who replaced subprefects in dispute settlement cases; and
The functions of notaries and bailiffs were separated; commercial tribunals were set up in the country’s 18 regional capitals, an essential measure for creating an environment favorable to the development of business and the private sector.
(d) The following measures were implemented to reestablish the security of people and property, another essential measure for encouraging development and reducing poverty:
A ministry responsible for security and immigration was established and steps were taken to collect weapons of war and suspend the purchase of handguns;
At a general meeting in April 2005, the armed forces proposed reforms to professionalize the army and strengthen its role in development; and
A draft law on migratory herds (transhumance) and nomadism is being prepared. This bill acts as a code of conduct for mediating farmer-stockbreeder conflicts, which have multiplied in recent years, and better organizes the movement of cattle in the territory; the adoption and implementation of this law should help to reestablish social peace in the affected rural areas.
C. Toward Sustainable Growth Efforts in this area produced significant results. After two years of stagnation and recession in 1999-2000, the recent development of Chad’s economy has been dominated by a strong resurgence in growth. (a) The GDP growth rate reached almost 9 percent in 2001-2002 and growth accelerated in 2003, climbing to an annual average of around 25 percent in 2003-2004. This is due primarily to the development (up until 2003) and exploitation (beginning in October 2003) of oil resources. The end of the oil investment period and the temporary stabilization of production will result in a growth slowdown. The GDP growth rate for 2005, however, should hover around 13 percent. GDP growth and oil exploitation did not create excessive inflationary pressures; on the contrary, consumer prices fell in 2003 and 2004, and the price increases of 2005 were mainly the delayed result of declining food production in 2004. (b) It is obviously difficult to determine to what extent GDP growth has improved poverty indicators. Poverty trends in rural and urban areas and the priorities of the affected segments of the population will be determined only through new studies. The following factors should be considered, however:
Thanks to GDP growth rates that far exceed demographic growth rates, GDP per capita has increased markedly over the past five years, particularly in 2003-2004;
Not only has oil GDP increased, non-oil GDP also recorded annual growth of around 6 percent in 2001-2002 and close to 6.5 percent in 2003-2004. The growth rate is expected to reach 8.6 percent in 2005; and

6
Growth in GDP and GDP per capita did not significantly increase gross national income. The primary sector (essentially agriculture and livestock) has barely grown since 2001 (average annual growth rate of close to zero from 2002 to 2004). In fact, in 2004, drought and locust invasions seriously compromised the performance of the food crops sector, and the relatively sound performance of export crops (cotton and gum arabic) did little to offset the decline in food crop production. That said, agriculture and stock farming have the most impact on the situation of the poorest segments of the population, who should be the main beneficiaries of the poverty reduction strategy.
(c) In terms of the National Strategy for the Rural Sector, discussions were held on the methods of fostering sustainable development in the sector. The sectoral policies, programs, and projects aim to boost agricultural productivity, diversify production, and increase the security of food crop production.
Agriculture and stock farming as a proportion of total public expenditure rose from 6.9 percent in 2001-2002 to 7.3 percent in 2003, and to 11.1 percent in 2004 (actual disbursements). Budget allocations to the two sectors account for 11.3 percent of the expenditures projected under the 2005 budget;
Investments financed from oil revenue helped to increase the mechanization rate of farms (from 24 percent in 2004 to 26 percent in 2005);
More agricultural waterworks projects have made it possible to expand cultivated areas by 35 percent, from 20,000 to 27,000 hectares;
Efforts are being made to increase the responsibility of producers and involve them in managing the rural sector. Representatives of these organizations sit on project steering committees and participate in the design and execution of sector reforms;
The government and its partners reached an agreement on a basic roadmap for restructuring and privatizing Cotonchad, the national cotton company; and
Little is known of the stock farming sector; the livestock census, to be conducted in 2006/2007, will be an important step; the sinking of 80 wells and the construction of 25 pumping stations in the stock farming sector will spur the development of this sector.
(d) The development of transport infrastructure should also help to encourage rural development, provide improved access to the most marginalized areas, and reduce poverty.
Public works accounted for 4.9 percent of Chad’s total public spending (actual disbursements) in 2001-2002 and rose to more than 23 percent in 2003-2004;
In the transport sector, large investments were made to promote growth and to benefit the poorest regions: secondary roads were built to improve access to the most underserved regions and to improve road links with the main international transportation corridors to which Chad has access (Cameroon, Nigeria and the Sudan). The total length of asphalt-paved road increased from 287 kilometers in 1999 to 650 kilometers in 2004, and will reach 736 kilometers by end-2005;
Just as important as the construction of new roads to foster rural development and reduce poverty is the gradual increase in resources allocated to maintaining them (from CFAF 3.7 billion in 2002-2003 to CFAF 5.7 billion in 2003-2004). On average, more than 2,000 kilometers of roads were maintained in 2004 and 2005. The increased allocations planned for the future should help to improve performance in the years ahead; and
The government recently drew up a five-year investment plan for investing CFAF 4 billion a year in rural roads during the period 2006 to 2010. This program, which

7
will be funded from oil revenues, will rehabilitate 3,000 to 4,000 kilometers of rural roads each year.
(e) The development of other infrastructures also has a significant impact on growth and poverty:
Since the approval of the Water and Sanitation Master Plan for the period 2003-2020, marked efforts have been made—focusing on a participatory approach at the local level—to rapidly improve access to drinking water in urban and rural areas, and particularly to benefit the poorest segments of the population. The access rate grew from 23 percent in 2000 to 28 percent in 2002, 32 percent in 2003, and 36 percent in 2004;
The energy sector is largely underdeveloped. Consumption of conventional energy (electricity and petroleum products) accounts for only 10 percent of national consumption. The exorbitant cost and scarcity of electricity poses a major obstacle to Chad’s economic development. In addition to measures aimed at making electricity available to users at a more reasonable cost, the main goal is to promote alternative sources of energy (solar, wind, etc.) to limit the cutting of firewood, which is exacerbating desertification; and
In the telecommunications sector, the goal is to ensure coverage of urban and rural areas by developing mobile telephony. This initiative has improved the population’s access to telephone service, from 1.5 to 15 of every 1,000 people. As part of the rural telephony project, VSAT antennas were installed in 15 secondary towns. One of the solutions to the exorbitant cost of telecommunications is to link Chad to the international fiber optic communications network. A subregional project (Chad, Cameroon, and the Central African Republic) has been developed for this purpose and will begin at end-2005.
D. Developing Human Capital Significant efforts were made to develop the country’s human resources, mainly in the education and public health sectors. (a) Education There are two basic factors that make education one of the cornerstones of the development process: low economic productivity, which is due in large part to the limited training of human capital, and the positive influence of education on the other priority sectors for poverty reduction: health (particularly maternal and infant health), fertility, and environmental management. Chad’s education system has long been subjected to a number of constraints: the population explosion has made it difficult to meet enrollment demand; programs are not tailored to meet the needs of the national economy; and teacher training is insufficient. Several reform attempts have produced disappointing results. The political strife that Chad endured for so many years impelled communities to take a proactive role in their children’s education. This community dynamic remains strong in the face of weak and often poorly-designed public education programs. Today, these communities, which organized a Parent Teachers Association (Associations de Parents d’Elèves -APE), are responsible for more than 60 percent of primary school teachers (community teachers) and spend more than CFAF 2 billion on school operations (their contribution adds around 10 percent to the State budget allocation for basic education). One of the consequences of

8
this initiative is that an average of 1.3 percent of the expenditure3 of poor families goes to education, twice the amount spent by nonpoor households. Beginning in the year 2000, the government adopted a new vision for its education policy, which was incorporated into the NPRS. The main objectives of the policy are to increase access to education, make the system more equitable, and improve its quality. This final goal is particularly important: recent studies show that Chad lags far behind in the quality of primary education. Only 38 percent of students reach the CM2 level (end of primary school). Despite the impact of community education on the budget of poor families, the NPRS does not propose altering the current system; rather, it seeks only to validate it while gradually reducing the level of financial support provided by the poorest communities. In this context, the government decided to fund the training of 2,000 community teachers every year to enable them to qualify for entry into the civil service. This funding is provided through subsidies to APEs (a total of CFAF 2 billion for 2003-2004). Moreover, as a supplement to other initiatives being implemented by the government in this sector, special subsidies were granted to strengthen academic infrastructure in the most deprived communities. As a result, some 2,000 classrooms were built in these areas. A dynamic partnership was subsequently set up between the government and the communities, and the Agency for the Promotion of Community Initiatives in Education was created in 2003. The government’s strategy has produced spectacular quantitative results. From 2000 to 2004, school enrollment grew by 7.6 percent a year on average. The rate of access to primary school jumped from 87 percent in 2000 to 107 percent in 2004, and the gross school enrollment rate rose from 72 percent to 88 percent during that same period. These results mask significant regional disparities, however. The main challenge over the next few years is to vigorously attack the serious problem of quality in education. (b) Public health The NPRS focuses on the main strategic pillars set out by the government in its 1999 national health policy. These are to facilitate access to quality health services throughout the country, optimize the use of existing resources, and improve the core indicators of the sector. Another component of the strategy is to combat three devastating scourges: HIV/AIDS, malaria, and malnutrition. To attain these goals, the government substantially increased funding for the Ministry of Public Health: actual expenditure on the sector climbed from 4.8 percent of total public spending in 2001-2002 to 8.6 percent in 2003, and to 9.7 percent in 2004. This percentage has been decreased to 7.8 percent of total allocations in the 2005 budget. Improving access to quality services first requires a comprehensive infrastructure program. In 2005, the completion of projects that began in 2003-2004 will give users access to 52 new health centers, six new district hospitals, and four district hospital administrative offices. Most health districts (42 of 43) are regularly monitored. 3 These data are based on the results of the 1996 surveys (ECOSIT 1). While the figure of 1.3 percent represents the average contribution of poor households in rural and urban areas, the contribution of poor households in urban areas is in fact far higher.

9
A special effort was made to provide and improve care for pregnant women. The number of health centers with the proper equipment to provide obstetric care rose from 406 in 2004 to 433 in 2005. The number of hospitals equipped for obstetric emergencies has doubled since 2004 (from 15 to 32). More than 75 percent of all hospitals (32 of 45) are now properly equipped. Finally, 98 percent of all health centers and district hospitals provide postnatal care. One of the methods applied to better use the resources allocated to healthcare is community participation, which fosters constructive dialogue between healthcare personnel and users and organizes a partial cost recovery system for government healthcare expenditure. Community training sessions were organized in 453 health centers in 2004, and in 569 centers in 2005. The number of management personnel receiving training in hospital administrative and financial management increased from 33 to 37, or 86 percent of total management personnel. Their role is to help the poorest segments of the population to meet their obligation to contribute to the cost of their healthcare. Available data do not show how cost recovery is distributed between the poorest segments of the population and the rest of population. This would be worth studying in greater detail. In an effort to combat HIV/AIDS, the number of regions holding preventive public awareness meetings jumped from 7 in 2004 to 18 today (900 meetings were held in 2005). The number of operational voluntary testing centers rose from 22 in 2004 to 52 in 2005, and the number of hospitals dispensing ARVs increased from 14 to 18. A government subsidy reduced the price of ARVs from CFAF 50,000 in 2000 to the current rate of CFAF 5,000 per person per month. All functioning healthcare facilities now have a malaria unit. The use of insecticide-treated nets, however, has fallen sharply, from 29.4 percent in 2003 to just seven percent in 2005. The fight against malnutrition emphasizes breastfeeding. The number of public awareness campaigns increased from 4 in 2004 to 16 in 2005. While significant efforts have been made, the results have not always been satisfying, particularly in terms of prevention. The number of endemic disease awareness campaigns fell from 1,005 in 2004 to 168 in 2005. The DTP3 vaccination rate remained stable at 47 percent. The same holds true for the rate of iodized salt use. Finally, the contraceptive prevalence rate decreased from 4.7 percent in 2004 to 2.5 percent in 2005. One of the main problems in this sector is the lack of qualified personnel in health centers and hospitals. Chad has only one physician per 27,000 population (the WOH standard is one physician per 10,000 population), one midwife per 9,000 women of childbearing age, and one State-certified nurse per 49,000 population.4 The lack of qualified personnel is felt most keenly in rural areas and the poorest regions. However, health indicators are improving:
The rate of health coverage increased from 66 percent in 2000 to 72 percent in 2002, and to 73.3 percent in 2003;
4 Source: EDST 2 (Demography and Health Survey).
10
The infant/child mortality rate fell from 214 per 1,000 live births in 2000 to 191 in 2004. The infant mortality rate dropped from 129 per 1,000 live births in 2000 to 102 in 2004;
Although the percentage of medically assisted births increased from 18.3 percent in 2002 to 21 percent in 2004, this change has yet to bring about a decline in maternal mortality rates, which rose from 827 per 100,000 live births in 1996 to 1,099 in 2004.
E. Improving Living Conditions for the Most Vulnerable Segments of the Population The government launched a study on social protection, which will be used to define a strategy and operational programs that benefit the most vulnerable segments of the population. This strategy will focus on two courses of action:
Ensuring that sectoral strategies and programs are better targeted to meet the needs of the poorest segments of the population; and
Organizing more specific actions to benefit the disabled, orphans, and the urban unemployed, as well as women, who play a critical role not only in the economy, but also in family health and childhood education.
Regarding the first initiative, additional efforts should be made to improve economic performance and social services to benefit the poorest. Recent GDP growth barely affected the rural sector, in which the majority of the poorest segments of the population live and work. Poor families shoulder a relatively heavy burden in terms of the cost of primary education and the most vulnerable regions are those in which the lack of trained personnel seriously compromises the availability and quality of health services. In terms of initiatives to benefit the disabled, orphans, and the urban unemployed, it is primarily NGOs, particularly those that are well-established at the local level, that are best able to manage programs targeting the specific problems experienced by these segments of society. Nevertheless, a public sector-NGO partnership could make it easier to define and implement coherent strategies that would serve as frameworks for NGO action. Regarding women’s issues, huge steps have been taken to better integrate women into national economic and social activities. In particular, school enrollment for girls has increased and efforts have been made to improve maternal and child health. The measures planned to develop microfinance could have a large impact on the economic activity and lives of women. The adoption of the new Family and Individual Persons Code could also play a key role in improving the lives of women. F. Environmental Protection Poverty reduction also involves protecting ecosystems and the environment. In a country such as Chad, protecting natural resources—forests, grasslands, water resources, and arable land—is essential for the continuance of core economic activities and for meeting the priority needs of families. Long-standing legal and regulatory provisions protect the forests and biodiversity, but these laws are little respected. The population places enormous pressure on forested areas (firewood and encroaching farmland) and it is very difficult to prevent poaching, overlogging, and uncontrolled brush fires.

11
The energy problem is central to environmental protection policies. Wood fuels (wood and charcoal) provide 90 percent of the energy consumed in Chad. Gas consumption is on the rise, growing from 69 metric tons in 1999 to 367 metric tons in 2004, but only a small percentage of the population uses this type of energy. Fewer than 11,000 households are equipped with gas heaters, and 90 percent of those households are located in N’Djamena The measures taken to better organize migratory herds should have a positive impact on the environment, in terms of both protecting crops and better organizing the movement of livestock during the dry season. G. Conclusion An overall assessment of NPRS implementation shows that substantial progress had been made on several fronts. Economic growth accelerated and fiscal performance improved; in addition, expenditure restructuring is focused on the priority sectors for poverty reduction. At the sectoral level, priority economic and social infrastructures developed considerably, the primary school enrollment rate jumped, and access to health services showed substantial improvement. This assessment of the sector is still not satisfactory, however, to the extent that growth has had little impact on the rural sector; in addition, the programs designed to meet the needs of the most vulnerable groups and environmental protection measures lack effectiveness. Future actions should be vigorous and focus on the following four areas:
The NPRS must and should continue to be a joint initiative in which all development actors participate. A permanent communications strategy should be implemented to involve all segments of the population in the definition and execution of this strategy;
The public sector clearly plays a key role in NPRS formulation and execution. Most ministries have already designed sectoral strategies aimed at reducing poverty. This initiative should be pursued by preparing program budgets that clearly define (based on realistic funding projections) coherent intra-sectoral policies that will have an impact on budget decisions during the budget programming and execution stage; and
Public expenditure monitoring and execution must be improved, as should the oversight of spending agencies. The national statistics system should also be strengthened so that it can better monitor economic activity, poverty, and the impact of measures implemented.
Finally, efforts should be made with the international community to address the problem of resources which, despite oil revenues, continues to hinder government initiatives and poverty reduction, so that these areas receive equal attention and tailored solutions.
In this context, the follow-up report identified some core recommendations: The NPRS should be updated, not so much to fundamentally alter the focus of the strategy, but to refine certain goals and take action to achieve them. To this end, the government and its partners should reach an agreement on a realistic schedule so that:
The revised strategy contains an analysis of the final results of the Household and Informal Sector Consumption Survey (ECOSIT 2) in terms of poverty profiles, household data, and the incidence of poverty by region. These data are essential for better tailoring the actions proposed;

12
Sectoral strategies are systematically reviewed and their effectiveness and consistency with the national strategy objectives evaluated. Integrating these strategies will increase the accuracy of the operational content of the second version of the NPRS; and
A discussion is held on the sources of growth and their impact on poverty. The NPRS review should be conducted as part of the same participatory process that characterized the preparation of the original document. Given its structure, the NPRS Steering Committee will play a key role in organizing this process. The recommendations made by all segments of the population should be incorporated into the new document. The High Interministerial Committee’s recommendations in the following areas should very much be taken into account: governance (personal security, justice, decentralization and deconcentration, State control), agricultural waterworks, infrastructure development (improved access and transportation costs), energy regulation, private-sector promotion (improved legal and institutional environment), pursuing fiscal consolidation, the regular payment of pensions, and eliminating arrears. The NPRS review, therefore, will be a relatively intensive activity that will likely require most of 2006 to complete.

13
INTRODUCTION
The National Poverty Reduction Strategy (NPRS) was adopted in 2002 and 2003 by the first Steering Committee, which comprised 33 members representing the public sector, the private sector, civil society groups, NGOs, and the National Assembly. The information used to prepare this strategy was collected from the population during a “macro-participation” exercise, held throughout Chad. Some constituent groups (academia, women in business, youth, the physically disabled, healthcare providers, religious figures, etc.) were consulted, and their views on poverty were taken into consideration. Also taken into account was the experience accumulated in the execution of some projects that helped to improve living conditions in rural areas. Finally, statistical data from a number of surveys were used to prepare a poverty diagnosis and define mid-term (2006) objectives. The NPRS was adopted on June 4, 2003 by the High Interministerial Committee and subsequently approved by the executive boards of the International Monetary Fund and the World Bank on November 17 and 23, 2003, respectively. The main objective of this strategy is to address problems related to poverty and cut poverty indicators by half between now and 2015. The key tool for implementing the strategy is the set of sectoral strategies prepared by the technical ministries responsible for poverty reduction projects and programs. The NPRS has been implemented in the following national and international context: (a) Two highly positive factors characterized the economic and financial situation in Chad:
- The first is the beginning of oil production in October 2003 and the start of additional resource transfers to the government at end-October 2004; and
- The second is the G-8 decision to cancel the multilateral debt of the poorest and most heavily indebted countries, which should enable beneficiary countries to increase the amount of public resources earmarked for economic and social development initiatives. Chad could use these resources if the conditions were met.
(b) A number of other factors had a less favorable impact on the country’s economic situation:
- In economic terms, the price of cotton, Chad’s second-largest traditional export behind cattle, slumped. For many years, the cotton market has been profoundly influenced by the size of the subsidies granted by several industrialized countries to their own producers who, without this type of support, would be incapable of competing with Third-World producers, particularly those in sub-Saharan Africa; and
- In political terms, the political conflicts raging along Chad’s eastern and northern borders have triggered a massive influx of refugees fleeing Sudan and the Central African Republic.
The first NPRS implementation report, released in December 2004, also highlighted other fundamental problems that adversely affected the implementation of the priority measures outlined in the strategy. Specifically, it explained the impact of weather changes, which compromise food security and significantly obstruct the modernization of the agricultural sector. The report also drew attention to the country’s inadequate resources for supporting and funding priority government programs. Regarding the development of the modern sector, the report reemphasized how the weak purchasing power of the population, coupled with overly high production costs (particularly electricity), slows industrial and private-sector expansion.

14
The first report listed several recommendations:
- In the rural sector, it is important to support efforts to organize peasant farmers and promote irrigation farming, a cornerstone of agricultural development that makes crops less vulnerable to the vagaries of the weather. The report also encouraged the country’s farmers to pioneer in this area by starting farms along large bodies of water and extending the use of new techniques throughout rural areas;
- In economic and social matters, microfinance should be developed, not only to encourage income-generating activities, but also to meet primary social needs, such as healthcare and school expenses. The report underlined the significance of housing and recommended various methods (setting up a specialized agency, guarantee funds, the use of oil resources) for spurring the development of housing credits; and
- In the energy sector, the Farcha Refinery should be completed so that it can provide heavy fuel for the Chadian Water and Electric Power Corporation (STEE); neighboring towns should use the electricity generated in oil-producing areas in the future; and a study should be conducted on a connection with Cameroon’s electrical grid. The report also recommended using alternative sources of energy (solar, wind, and biofuels) to meet the needs of rural areas. Finally, in the area of environmental protection, the report recommended gradually replacing charcoal, the main source of household energy, with gas in urban areas.
The report also outlined general measures that should be implemented to facilitate the attainment of NPRS objectives:
- Review the concept of the priority sector or ministry so that oil revenues could be used to fund other core activities in the poverty reduction plan. One of its applications could be to identify and codify public expenditures on poverty-reduction; and
- Organize a donor roundtable, in the context of NPRS implementation, to mobilize additional financing to accelerate the fight against poverty.
Execution of some of these measures (the development of irrigation systems, home financing, the beginning of discussions to identify pro-poor spending) has begun and the very notion of a priority sector is evolving based on the points that emerged during the Geneva IV Roundtable. Nevertheless, making significant progress toward accomplishing the goals of the strategy could hardly be expected after just one year of implementation. This report attempts to present a more complete view of the measures taken and the results achieved since the adoption of the NPRS. It was prepared by the Technical Secretariat of the Poverty Observatory and the technical units of the various sectoral ministries. The contents of the report were corrected and expanded during a validation workshop, held December 19 and 20, 2005. The report is organized as follows:
- Part I reiterates the objectives of the strategy in the context of a comprehensive vision of poverty reduction;
- Part II examines the institutional mechanisms set up to implement and monitor the NPRS;
- Parts III through VII assess the progress made toward accomplishing the five central pillars of the strategy; and
- Part VIII describes the future challenges for implementing the strategy and makes a number of recommendations for executing, updating, and revising the NPRS.

15
I. A COMPREHENSIVE VIEW OF POVERTY REDUCTION
1.1 Justification for an Integrated Approach to Poverty Reduction
The core objective of the National Poverty Reduction Strategy is to cut the poverty indicators by half between now and 2015. In light of Chad’s current socioeconomic situation, attaining this goal requires consistent and coordinated action in most sectors of the national economy and in the country’s institutional life. Sustainable growth is an essential condition for social progress and poverty reduction; it assumes the development of a diversified economy that is less vulnerable to the internal and external shocks that have long plagued Chad. In addition, growth can be made sustainable only by fulfilling two conditions: first, it must go hand-in-hand with environmental protection, and second, its overall focus must be accepted by the general population. The participatory consultations that preceded the formulation of the NPRS showed that the population’s priorities were the security of people and property, good governance, and broad-based support for grassroots initiatives. Reducing poverty is a multifaceted and complex endeavor that comprises actions ranging from establishing democracy and consolidating social peace to decentralizing power and involving civil society: in short, poverty reduction is about striking a new balance between representative democracy and the direct participation of the population in managing the issues that affect them. More concretely, defining and executing well-coordinated sectoral policies and programs is the key operational instrument of the overall poverty reduction strategy.
- In economic terms, the spillover from the oil economy should spur the development of traditional production sectors in which the majority of the population is involved, in particular the poorest families. In this respect, the rural sector (agriculture, stock farming, fishing, forestry, and hunting), which employs 80 percent of the active population and generates more than 60 percent of rural household income, must play a primary role in the implementation of this strategy. This sector should be able to respond to the demands of a more solvent domestic market and better compete with imports of food products from Cameroon and Nigeria. The sector should gradually boost its productivity;
- The ongoing development of the primary sector, the expansion of traditional industries, the emergence of new industries, and the development of closer economic and commercial links between urban and rural areas will result in the increased mobility of people and goods. The infrastructure network—particularly roadways—should adapt to these trends and help reduce factor costs and boost national productivity; and
- The oil and post-oil economy requires a skilled labor force. Economic development and social peace require the social sectors to develop at a more rapid pace, both quantitatively (improved access, expanded coverage rates) and qualitatively.
Consequently, the future of poverty reduction is contingent upon a coherent set of effective, well-coordinated intra- and intersectoral initiatives.

16
1.2 Specific Poverty Reduction Objectives Through 2006
The NPRS is based on five main pillars: (i) promoting good governance; (ii) ensuring strong and sustainable growth; (iii) developing human capital; (iv) improving the living conditions of vulnerable groups; and (v) protecting ecosystems. Each pillar comprises a series of specific objectives, and priority actions have been identified to attain them. The table below lists the priority actions planned for each objective.
Strategic Pillars – Objectives – Priority Actions
Strategic Pillar Objectives Priority Actions Civil service reform Build capacity of stakeholders in public sector, private sector, and civil society
1.1. Make government agencies effective and efficient
Fight corruption Boost the credibility of the judicial system Guarantee the security of people and property Professionalize the armed forces and shift their focus to development
I. Promote good governance
1.2. Improve the legal environment
Deconcentration and decentralization Sustainably increase the real GDP growth rate Implement pro-poor fiscal policies
2.1. Stabilize the macroeconomic framework Achieve African integration and insert Chad’s economy into the world
economy Promote and support entrepreneurship Improve relations between public enterprises and the government Develop the financial sector and microfinance Improve access to microfinance
2.2. Promote development of the private sector
Promote exports Build institutional, technical, and human capacities of sectoral ministries Establish a basic grid of roads for domestic and external access to isolated areas that are usable in all seasons Maintain transportation infrastructure Improve road safety Support the development of local modes of transport Extend access to water in rural areas Ensure sanitation services in major urban areas Develop energy Develop postal services and telecommunications
2.3. Develop basic infrastructure
Improve the administrative and financial management of basic infrastructure Increase investment in agricultural and pastoral water resources Expand access to quality agricultural equipment and inputs Expand access to quality support services for farmers and stockbreeders Expand access to credit and tailored financial services Diversify agricultural production Improve the functioning of distribution circuits and markets for major products Develop emerging industries
II. Ensure strong and sustainable growth
2.4. Sustainably increase rural output
Protect crops Ensure adequate access to quality health services throughout the country
III. Develop human capital
3.1. Establish an effective healthcare system Improve health indicators

17
Improve the use of resources allocated to the health sector Combat HIV/AIDS Fight malaria
Combat malnutrition Ensure more equitable access to education and higher attendance rates at elementary schools Improve the effectiveness and quality of the education system
3.2.Ensure appropriate development of the education sector
Build capacity for planning, management and steering the development of the education system Match the qualifications of graduates to the needs of the labor market through specific initiatives Increase the enrollment capacity of the technical and vocational training institution (ETFP), which will offer more relevant courses and have better trained and equipped teachers Increase the basic knowledge of 15,000 youth aged 8-14 through nonformal basic education (EBNF) Teach at least 50,000 persons aged 15-50, of whom 60 percent are women, to read and write
3.3. Promote the labor market
Test bilingual curricula in CP classes
Prepare and implement land management and urban development plans Develop urban infrastructure and services Guarantee access to drinking water Support the management and emergence of professional service providers Resume ATETIP activities Rehabilitate technical training and apprenticeship centers Create an economic and technological documentation and information center Disseminate educational programs to promote a culture of entrepreneurship Improve consensus-building around and coordination of actions in support of MFIs Lead IEC campaigns on key risk-prevention measures Revise family law and land law Adapt the social security and pension systems Support existing informal crisis-response systems
IV. Improve living conditions of vulnerable groups
4.1. Integrated urban development 4.2. Support for microenterprises, SMEs, and employment 4.3. Social protection
Guarantee government assistance in case of major disasters Combat desertification Pass laws transferring certain choices for natural resource management to users Establish local natural resource management committees Build the capacity of institutions in charge of natural resource management Introduce an environmental information system Draft a national program to mobilize the population in support of the environment Promote sustainable firewood production in rural areas around the major towns Develop forest resources as a source of revenue for rural communities Increase the involvement of rural populations in natural resource management Ensure that the tax system applicable to wood and wood byproducts has a regulatory role
V. Restore and safeguard ecosystems
5.1. Strengthening the regulatory framework and capacity for managing natural resources 5.2. Improved domestic energy management
Promote the use of furnaces and other high-performance instruments for producing household energy

18
The quantitative targets for 2006 are listed in the table below.
Quantitative Targets for 2006
Indicators Reference Year
Initial Data
Targets for 2006
1-Poverty and human development indicators IDH 2000 0.365 0.600 Food poverty threshold (CFAF per capita per day) 1995 194 500 (US$1) Overall poverty threshold (CFAF per capita per day) 1997 253 1,000 Incidence of food poverty 1997 44.2% 38% Incidence of overall poverty 1997 54.0% 40% Depth of overall poverty 1997 27.5 25 Consumption per adult equivalent (CFAF per capita per day) 1995 1,720 2,160 Proportion of population not reaching minimum caloric intake 1995 44.2% 30% 2-Economic and political governance Capital expenditure/total expenditure 2001 50% 53% Public investment rate (except Doba oilfield project) 2001 9.4% 7.1% Rate of growth of capital expenditure financed with own revenues 2001 6.5% 17.5% Change in external arrears (in billions of CFAF) 2001 -2.4 0.0 Share of education expenditure in current budget 2001 13.1% 20% Share of health expenditure in current budget 2001 14.8% 20% Share of military budget in total government budget 2001 8.7% 6.6% Number of political parties represented in Parliament 2002 15 15 Land area polluted by mines and unexploded ordnance, in sq. km 2002 1,081 1,000 3-Economic growth GDP at constant 1995 prices (in billions of CFAF), broken down by sector
2001 907.4 1,870
Rate of growth 2001 8.5% 4.4% Current per capita GDP in CFAF 2001 153,037 352,464 Per capita growth rate 2001 0.12% 0.05% Grain production (in thousands of metric tons) 2002 1,123 1,600 Heads of livestock (in thousands of Tropical Livestock Units) 2003 7,500 8,500 Fish production (in thousands of metric tons) 2002 144 160 Gum arabic production (in metric tons) 2002 18,000 20,000 Rate of mechanization of farms 2000 24% 26% 4- Education, training, and literacy Gross enrollment ratio, primary (boys) 1998/1999 80% 90% Gross enrollment ratio, primary (girls) 1998/1999 50% 60% Net enrollment ratio, primary (boys) 1999/2000 56.6% 65% Net enrollment ratio, primary (girls) 1999/2000 42% 50% Net enrollment ratio, secondary (boys) 1998 29% 35% Net enrollment ratio, secondary (girls) 1998 3% 5% Literacy ratio of women age 15 to 24 2001 31% 40% Literacy ratio of men age 15 to 24 2000 59.4% 70% Adult literacy ratio 1999/2000 25.5% 35% Student/teacher ratio, primary 2001 74 65 Student/teacher ratio, secondary 2001 85 40 5- Health sector, fight against HIV/AIDS, and nutrition Maternal mortality ratio per 100,000 live births 2000 827 700 Infant/child mortality ratio per 1,000 live births 2000 222 150

19
Indicators Reference Year
Initial Data
Targets for 2006
Vaccination rate of children under age 1 2000 15.2% 23% HIV/AIDS prevalence ratio 2001 5%-12% 3%-10% Number of children orphaned by AIDS 2002 55,000 44,000 Malaria prevalence ratio 2001 20.7% 15% Tuberculosis prevalence ratio 2000 0.02% 0.01% Ratio of inhabitants per physician 2000 36,000 34,186 Ratio of inhabitants per State-certified nurse 2000 28,502 15,517 Ratio of women of childbearing age per qualified midwife (SFDE) 2000 13,692 13,000 Rate of deliveries assisted by medical personnel 1997 11.2% 20% Percentage of children under 5 suffering from malnutrition 1999 40% 30% Proportion of children under 5 who are underweight 2000 27.6% 20% 6- Social affairs and protection of vulnerable groups Proportion of women in government 2002 7.14% 20% Proportion of seats in the National Assembly held by women 2002/2006 6.45% 6.45% Number of disabled persons with training in trades 2002 36 100 Number of fitting and readaptation centers created 2002 7 15 Number of education centers for street children 1999 7 15 Proportion of disabled persons 1995 7.3% 7- Housing and urban planning Proportion of households living in modern housing 1998 10% 15% Proportion of households with latrines 1998 7% 20% Proportion of households with access to safe drinking water 2000 23% 44% Proportion of population with access to an improved sanitation system
2000 1.4% 3%
8- Basic economic infrastructures Length of paved national roads 2002 557 km 900 km Length of rehabilitated national dirt roads 2002 2,990 km 3,000 km Major bridges reconstructed and rehabilitated 2002 18 28 Length of regional and local dirt roads (rural roads) rehabilitated 2002 2,750 km 3,460 km Length of national roads that can be maintained under the FER budget
2002 3,550 km 3,900 km
Length of regional and local dirt roads (rural roads) maintained 2002 170 km 900 km Proportion of households with access to electricity 1993 1.1% 20% Proportion of households with a telephone 97 3% 30% Proportion of households with a radio 96 29% 50% Proportion of households with an automobile 96 1% 20% Share of microfinance in credit to the economy 2001 1.5% 6% Proportion of long-term loans 2001 2.2% 25% Proportion of short-term loans 2001 72.5% 50% 9- External debt Outstanding external debt/GDP 2001 53.9% 40% Debt service/Exports Debt service/GDP Change in domestic arrears (in billions of CFAF) 2001 10.9 -4.5 Change in external arrears (in billions of CFAF) 2001 -0.9 0.0 10- Demographics Population growth rate 93 2.5% 2.5% Total fertility rate 97 6.6% 5.6% Proportion of youths under age 15 97 50.3% 48%

20
II. INSTITUTIONAL MECHANISM AND MONITORING TOOLS
2.1 Status of Implementation of NPRS Monitoring and Assessment Mechanisms
The mechanisms for monitoring and assessing the NPRS were established in Decree 056/PM/2005 of February 4, 2005, and finalized by Order 023/MPDC/SG/2005 of July 19, 2005. These mechanisms are built around the following three units:
• The High Committee for NPRS Supervision; • The Poverty Observatory; and • Local and sectoral entities, which act as the technical interface.
The High Committee for NPRS Supervision is the political entity responsible for supervising the implementation of the strategy. Chaired by the Prime Minister, its membership comprises 21 ministers and the Secretary General of the Office of the President. The government’s economic partners may be invited to take part in meetings. The High Committee is responsible for defining the major guidelines of the strategy, supervising its implementation, and taking the necessary measures to ensure the proper functioning of the units involved to achieve NPRS objectives. It also reviews and adopts the reports and documents prepared by the NPRS Steering Committee. The government makes decisions based on the results of the High Committee’s work, and the institutions and personnel involved then execute those decisions. The administrative aspects of the High Committee are handled by the Economic Unit Coordinator, who prepares the meetings, drafts minutes, and submits them to the entities concerned. In technical and administrative terms, the Poverty Observatory is responsible for the monitoring mechanism, which comprises a Steering Committee, a Technical Secretariat, and a Communications Unit. The Steering Committee is the central entity of the Poverty Observatory. Its primary functions are to:
Disseminate the NPRS, the Millennium Development Goals (MDGs), and the principles of Sustainable Human Development (SHD), and promote the ownership of these various objectives by all partners involved and by the population as a whole;
Validate the sectoral strategies and programs required to implement the NPRS, the MDGs, and SHD;
Adopt the schedule proposed for monitoring and assessing the NPRS, the MDGs, and SHD;
Ensure that poverty reduction projects and programs are consistent at the sectoral and intersectoral levels, as well as regionally and locally;
Assess the impact of NPRS implementation on the beneficiaries; Prepare and implement a communications plan for the NPRS, the MDGs, and SHD; Guide and monitor the activities of the Poverty Observatory’s Technical Secretariat and
provide the necessary support so that it can carry out its work; Adopt the budget required to set up and ensure the operation of mechanisms for
coordinating the implementation, monitoring, and assessment of the NPRS, the MDGs, and SHD; and
Propose periodic reviews of the NPRS.

21
The Steering Committee has 49 members who represent the public sector (26), civil society organizations and NGOs (16), the private sector (3), the National Assembly (3), and the Oil Revenue Control and Supervision Board (Collège de contrôle et de surveillance des revenus pétroliers – CCSRP) (1). The public-sector representatives are mainly the general secretaries of the stakeholder ministries. Other public entities, such as the Office of the President of the Republic, the Office of the Prime Minister, the university, the City Hall of N’Djamena, and the Bank of Central African States (BEAC) are also represented in the Steering Committee, which is chaired by the Secretary-General of the Ministry of Planning. The Committee is subdivided into the following five subcommittees, which are responsible for monitoring the priority actions programmed under the five main pillars of the NPRS:
(i) Promoting good governance; (ii) Ensuring strong, sustainable development; (iii)Developing human capital; (iv) Improving the living conditions of vulnerable groups; and (v) Restoring and protecting ecosystems.
Each subcommittee monitors the priority actions associated with a given strategic pillar. The subcommittees are made up of individuals selected on the basis of their expertise and area of specialization. If necessary, subcommittee members can take part in the work of another subcommittee. The work of the monitoring subcommittees is supported by the Technical Secretariat of the Poverty Observatory. The Technical Secretariat of the Poverty Observatory is a small unit attached to the General Secretariat of the Ministry of Finance, Planning, and Cooperation. Comprised of both national and international experts, it is responsible for supporting the Steering Committee’s activities of monitoring and assessing the strategy. Its main duties are to:
• Prepare the meetings of the monitoring subcommittees and the NPRS Steering Committee;
• Draft monitoring reports on the NPRS, the MDGs, and SHD; and • Help to build the capacity of the units in the sectoral and local entities acting as a
technical interface.
The Technical Secretariat works with the Directorate of Development Planning, which serves as the Steering Committee Secretariat. The Communications Unit is responsible for disseminating the NPRS, the MDGs, and SHD. It designs public outreach activities on NPRS objectives and carries out such activities with the support of the public and private media. The Communications Unit operates under the authority of the Secretary-General of the Ministry of Communications and has a staff of four, two each representing the public media and the private media. The unit prepares and implements a communications strategy for the NPRS, and is supported by the Technical Secretariat of the Poverty Observatory. The sectoral and local entities that act as a technical interface are units responsible for providing the Steering Committee with appropriate data on NPRS implementation by the various ministries

22
and administrative units concerned. These are mainly the National Statistics and Economic and Demographic Research Institute (Institut National de Statistique, des Etudes Economiques et Démographiques - INSEED), the General Directorate of the Budget, the General Directorate of the Treasury, the Directorates of Research and Planning of ministries in the priority sectors, as well as the regional offices of the ministries involved. These entities are responsible for providing data on poverty trends and the impact of projects on beneficiaries in a given area; coordinating public expenditure reviews in all the priority sectors; and helping to prepare, implement, and monitor program budgets in the ministries concerned. The authorities in the sectoral entities acting as a technical interface attend the meetings of the Steering Committee and the NPRS monitoring subcommittees. In the administrative regions, regional committees were set up in October 2003, even before the organic laws now in force had been approved. Their structure and function should therefore be adapted based on the new laws to ensure that social and economic activities focusing on poverty reduction are monitored locally. In addition, the regional committees are responsible for: (i) increasing public awareness of NPRS objectives; (ii) accurately analyzing the areas concerned; and (iii) producing reports on the implementation status of poverty reduction initiatives. Chaired by the governors of the regions, these Committees are composed of representatives of public services (3), civil society associations (2), NGOs (2), decentralized local governments (2), and the private sector (1). The different NPRS monitoring units have been established gradually since June 2005, thanks to the technical and financial support of the UNDP through the project to support the monitoring/assessment of the NPRS, the MDGs, and SHD. The NPRS Steering Committee has met five times since June 2005. This report was prepared with the participation of the NPRS monitoring subcommittees.
2.2 Information System for Monitoring the NPRS
The quality of the NPRS monitoring report depends on the availability of recent, accurate, and relevant statistics (choice of appropriate indicators), and on the quality of the analysis conducted on the results of sectoral policies and strategies and their links to the NPRS. 2.2.1. Choice of NPRS indicators A national workshop was held in December 2003, during which all members of the NPRS Steering Committee, the INSEED, and the statistical units of the sectoral ministries initially selected 206 indicators. The number of indicators selected was subsequently considered to be unrealistic for the following reasons:
- Chad has limited statistical resources; and - Many indicators require data sources and compilation methods that have not yet been
identified. In August 2005, another national workshop was held to review the list, which contained 109 indicators (91 quantitative and 18 qualitative) divided into three categories:
23
• The first category comprises ten indicators that measure structural phenomena, such as
monetary poverty and mortality; these trends are normally observed through ECOSIT, EDST, or EIMT surveys, conducted every five years;
• The second category contains a core of 53 indicators for tracking NPRS and MDG execution (25 performance indicators and 28 results indicators), which are used to perform an annual assessment of NPRS implementation status. In principle, these indicators are observable. Furthermore, researchers were able to reconstruct the benchmark conditions and recent trends for these indicators and use them to estimate the current values; and
• The third category is a supplementary list of 28 indicators for monitoring the NPRS and the MDGs (9 performance indicators and 19 results indicators). These indicators can no longer be systematically monitored; consequently, they should be further defined and observation and calculation methods for producing reliable indicators for the implementation of NPRS objectives and corresponding sectoral strategies should be identified.
2.2.2. Observability of changes in indicators The groundwork has been laid for the 53 indicators in the second category, which are the core NPRS and MDG tracking indicators. This task was completed thanks to recent surveys and the use of appropriate administrative sources. (a) The surveys • Agricultural statistics are calculated using the permanent agricultural survey (Enquête
Permanente Agricole - EPA). This survey provides data on production factors, cultivated land, crop yields, and production. Data on cotton, tobacco, sugarcane and gum arabic, the main cash crops, are collected using specific mechanisms.5 Despite external financing being ended in 1999, the EPA has continued without interruptions (it is financed from the national budget); provisional results are available in October of the year in progress and are used to calculate the cereals balance sheet for the crop year. The statistical yearbook, published in March of the following year, provides the final results for the crop year.
• The Demographic and Health Survey in Chad (Enquête Démographique et de Santé au Tchad -
EDST) was conducted in 2004 and published in 2005 by INSEED. Data are collected on household characteristics, particularly the status of women (fertility, family planning, marriage rate, pregnancy risk exposure, mother and child health, mother/child nutrition status, infant mortality, and maternal mortality); and on STDs, HIV/AIDS, and the availability of community services.
5 Under the responsibility of the National Office for Rural Development, the Cigarette Manufacturing Company (Société Manufacturière de Cigarettes), the Chadian Sugar Company (Société Sucrière du Tchad), and the Customs Service.
24
(b) Administrative sources of data The sectoral ministries and other units provide the following data:
- Stock farming statistics: problems with tracebacks are the reason why data publication has been delayed and why the 2004 Statistical Report has not yet been published. Data on livestock are approximate and the variables for which data are available are limited. A livestock survey project is scheduled for 2007/2008, however. The preparatory phase will be launched in 2006 with FAO financing.
- Education statistics: these data are compiled, processed, and published by the Ministry of National Education, based on an annual school census6 (conducted in February/March) of basic, secondary, and post-secondary education. The most recent data available, however, are for 2003/2004.
- Health statistics: the publication of this statistical yearbook is behind schedule (the most recent yearbook is the 2003 edition). Nevertheless, data for the 1996-2003 period are available.
Improving the formulation of poverty reduction policies and programs and the monitoring of NPRS implementation means also improving the conditions under which statistical data are generated (quantitative and qualitative data). To that end, plans have been made to perform a detailed study of the national statistics system—focusing on meeting user needs—and of the capacities of sectoral statistics producers and INSEED.
6 The school census is used as the basis for processing education statistics, but it should be noted that units prepare administrative reports for the beginning and end of the academic year that may be used to support (or monitor) statistical data.

25
III. NPRS IMPLEMENTATION – TOWARD GOOD GOVERNANCE
In 2001-2002, the National Secretariat for Capacity Building (Secrétariat National pour le Renforcement des Capacités - SENAREC) prepared a National Good Governance Strategy (Stratégie Nationale de Bonne Gouvernance - SNBG), which was adopted by the High Interministerial Committee in August 2002. Several of the SNBG objectives that give top priority to governance and security were included in the NPRS, in accordance with the wishes of the population consulted during the NPRS preparatory phase.
3.1. The SNBG Program of Action
The main goal of this strategy is to improve the administration of public affairs based on the following five pillars:
1. Administrative reform to improve the performance and increase the transparency of public sector management. This involves: (i) systematically assessing public institutions to redefine the State’s role and mission; (ii) reforming the justice system to increase its independence and enhance its integrity; (iii) building the capacities of the Audit Office, the final auditor of government finances; and (iv) supporting deconcentration and decentralization by building human and institutional capacities and through communications.
2. Fiscal consolidation, in particular: (i) controlling expenditure and revenue management;
(ii) reforming public procurement by streamlining procedures, preparing a simplified guide for purchasers (government units) and bidders (providers), and publishing an information bulletin containing procurement procedures and the result of invitations to bid.
3. Reforming high-priority sectors so that they can play a more effective role in the country’s
economic and social development and, in particular, in combating poverty.
4. Strengthening the partnership between the public sector, the private sector, civil society organizations, and citizens through the following measures: (i) implementing a communications plan for public affairs management with the support of public and private media; (ii) strengthening national dialogue between public and private actors; (iii) implementing a capacity-building program for human rights organizations; and (iv) creating a national mediation office (la Médiature) to settle disputes between communities or between the State and groups of individuals.
5. Improving security for people and property, by: (i) effectively controlling the program for
the demobilization of military personnel and their reintegration into civilian life; (ii) systematically disarming civilians who possess weapons of war; (iii) cleaning up (demining) mined areas; and (iv) reinforcing public security forces and establishing a partnership between the police and the population.
A joint committee comprising representatives of the public sector, the private sector, and civil society, set up in 2003, is responsible for implementing this strategy.

26
3.2. The SNBG and the SNRP
In accordance with the wishes of the government and the Chadian people, the NPRS places high priority on good governance and has incorporated many of the main objectives outlined in the SNBG:
(a) improve the effectiveness and efficiency of general government through the following measures: (i) pursuing civil service reforms; (ii) building the capacities of actors in the public sector, the private sector, and civil society; and (ii) fighting corruption; and
(b) improve the legal environment by: (i) reforming the justice system so that it gains
credibility in the eyes of the people; (ii) restoring the security of people and property; and (iii) reforming the National Army into a professional army focused on development work.
3.3. NPRS Implementation in the Area of Governance
General government reform:
(a) An organizational and institutional audit has been performed in nine pilot ministries (national education, public health, social action and families, postsecondary education, agriculture, stock farming, justice, planning, and finance). The government has adopted an action plan to implement the recommendations and begun the process of recruiting a firm that will be responsible for auditing the other ministries.
(b) Work has begun on revising all government personnel regulations. Thus far, some
common rules have been established but pay scales have yet to be determined. This issue will be addressed in a document that will also determine the types of compensation that should be granted to some categories of civil servants and other government personnel, in light of the special constraints to which they are subject.
Government finance management: the following measures were taken to place overall government finances on a sound footing, increase tax and non-tax revenue, reduce deficits, and restructure spending to benefit the priority sectors:
(a) The ratio of tax and non-tax revenues rose from 7.4 percent of GDP in 2001 to 8 percent in 2002, 8.7 percent in 2003, and 10.5 percent in 2004. This figure should reach 12.4 percent in 2005. This growth is attributable mainly to increased oil revenues (3.4 percent of GDP in 2004 and 5.4 percent in 2005). Other tax revenues also recorded a significant increase over the past five years (from CFAF 79 billion in 2001 to CFAF 119 billion in 2004 and CFAF 143 billion in 2005), despite the fact that their share of GDP has been stable at around 6 percent since 2001;
(b) The government has been able to stabilize current and total expenditures since 2002-2003. In fact, current expenditures fell from 10 percent of GDP in 2002 to around 7 percent in 2004-2005. Total expenditures also dropped, from 24 percent of GDP in 2003 to 18-19 percent in 2004-2005;
(c) The opposing trends in revenues and expenditures have enabled the government to put its fiscal house in order. The primary budget deficit of 1-2 percent of GDP in 2001-2002 became a surplus of 1-2 percent in 2004-2005. The overall deficit (commitment basis,
27
excluding grants) shrank from 10-13 percent of GDP in 2001-2003 to around 7-8 percent in 2004-2005. Recent cash flow problems are due to errors in revenue forecasting and in the management of some expenditures, as well as to the collapse of budget assistance (grants and loans), which totaled CFAF 51 billion in 2002 (around 4 percent of GDP), but barely exceeded CFAF 1 billion in 2004 (0.1 percent of GDP); and
(d) Government expenditure was fundamentally restructured. As shown in the table on trends in government finance attached to this report (Annex 1), the relative share of the nine priority economic and social sectors (education, health, social action, public works, agriculture, stock farming, water/environment, and land management) increased from 32 percent of total expenditures (executed) to 66 percent in 2004. Equally, 66 percent of the 2005 budget allocations are earmarked for the priority sectors.
Fiscal consolidation was accompanied by institutional and structural reforms aimed at improving the monitoring and transparency of financial management and combating corruption:
(a) A simplified and automated expenditure system is now operational, as is the Integrated Expenditure Circuit (CID) and the wiring and linkups between the Treasury, the Payroll Office, and the Information Technology Unit. This reform of public expenditure management and monitoring will be pursued. A fiscal modernization plan (PAMFIP) was prepared with the support of the World Bank;
(b) The concept of program budgets was introduced. All of the priority ministries adopted
this system, which seeks to promote detailed strategic discussions on the relative priority of the ministries’ main activities and spending programs;
(c) Specialized studies were launched to assess expenditure efficiency and verify that
programmed funds did in fact reach their intended recipients and had the expected impact on the quality of public services. A report on the implementation of the Comprehensive Expenditure Tracking System was prepared for the health sector, in the context of the Institutional Reform Support Credit (IRSC). The survey of health services users has been completed and the report was adopted;
(d) A new public procurement code was adopted and the enabling decrees were published.
Bid assessment committees were set up in the priority sectors and in the other ministries as well. Eight quarterly bulletins were published informing the public of prospective invitations to bid and the results of adjudicated competitions; and
(e) With the support of an international auditing firm, the Audit Office of the Supreme Court
audited the government contracts awarded in 2001 and 2002, and these reports were subsequently published. An audit report on the expenditures made in 2003 using poverty reduction funds (HIPC Initiative) was finalized in 2004.
Regarding the fight against corruption, the Ministry for General Oversight of the Government and Ethics launched a series of activities to instill ethics, improve discipline, and create a new climate of transparency and integrity in all areas of governance:
• Design of ads to raise public awareness, activities to promote ethical conduct, and a study on the fight against corruption (broadcast on Chadian national radio (RNT) and television);
• A national survey on the perception of corruption is underway throughout the country;

28
• Numerous meetings with officials responsible for different ministerial departments to encourage them to adhere to the strategy to fight corruption and to respect ethics and the rules of professional conduct;
• Preparation of a draft law on illicit enrichment (underway); and
(f) Finally, the Oil Revenue Control and Supervision Board produced a report on the management of these revenues in 2004 by the relevant units in the priority sectors.
Improving the legal environment:
(a) Following the 2003 Justice Forum, progress was made in 2004 and 2005 with the implementation of justice action plan and the recommendations made during that meeting, in particular:
• A decree was in issued in 2004 appointing the chair and members of the committee responsible for monitoring the recommendations arising from the Justice Forum;
• The Justice Reform program was approved by decree in 2005; • The post of Justice de paix was created in some departments, sub-prefectures, and
arrondissements of N’Djamena; • A draft law was prepared in which some provisions of the Criminal Code
benefiting children are amended and supplemented; and • Five trainers, two of whom are judges and three prison administrators, received
training.
(b) The most significant step is the creation of commercial courts in all the regional capitals other than N’Djamena. The purpose of this initiative is to facilitate the settlement of trade disputes and ensure that the private sector believes the legal and professional criteria underlying judicial decisions to be credible.
(c) In this spirit, the government appointed the judges and clerks for the N’Djamena
commercial court during the first quarter of 2005. Appointments to courts in Bongor, Abéché, Moundou, and Sarh were made in August 2005.
(d) In addition, the 2004 expenditure review of the justice system identified a number of
problems with absorption capacity, which affected how the resources allocated to the Ministry of Justice were used.
(e) Plans are also being made to:
• Build two Courts of Appeal in two major towns (Moundou et Abéché); • Train judges and clerks; and • Build the capacity of judicial personnel.
Security of people and property:
(a) A draft law on migratory herds and nomadism was prepared jointly by the public mediation office and the Ministry of Territorial Administration to replace Law 4 of 1959, which had become obsolete. If adopted, this law will serve as a code of conduct for settling farmer-herder disputes, which have multiplied in recent years. The

29
implementation of the new law should help to reestablish social peace in the affected rural areas by better organizing the movement of livestock.
(b) A Ministry of Public Security and Immigration was created. The program to collect
weapons of war from civilians is now underway. The new minister has decided to suspend all purchases and sales of handguns.
(c) Some mine clearance activities were carried out in the northern region of the country, but
financial constraints delayed the implementation of the National Strategic Plan Against Mines and Unexploded Shells.
(d) The Armed Forces Forum held in April 2005 marks a significant step toward achieving
one of the core objectives of the NPRS and the SNBG. The recommendations adopted during the meetings should encourage the government to promote the reforms necessary to professionalize the military, make it more dynamic, and restore its credibility in the eyes of the people. In particular, this effort would involve: (i) reorganizing the different branches of the military and improving the organization of troops, whose number should not exceed 30,000 by 2007; and (ii) improving the rate of promotions and wage increases, and setting the amount of compensation payable to demobilized troops. A committee was set up to track the implementation of these recommendations.
3.4. Assessment of Measures Taken and Governance Reforms Implemented
Governance reform is a long-term task that should be pursued vigorously by the Chadian authorities, with the support of civil society and the effective participation of all national institutions and the population as a whole. In most of the other sectors, the foundations of reform have been laid and the main guidelines discussed and approved. What remains now is to better define the concrete measures that should be taken and begin their implementation. Administrative reform is a good example of this type of situation. Institutional audits should now be conducted in all the other ministries, and the conclusions and recommendations of completed audits should be implemented. Civil service recruitment methods and incentive systems (salaries and promotions based on merit and performance) should be modernized, as should measures to promote government ethics. The adoption of codes of ethics, the reinforcement of controls, and the sanctioning of infractions are the most important conditions for making progress toward good governance.

30
IV. IMPLEMENTATION OF THE NPRS – TOWARD SUSTAINED GROWTH
The NPRS was prepared in 2001-2003, at the same time as investments were being made to develop the Doba oilfields. The first two years of strategy implementation coincided with the beginning of crude oil development in Chad. Oil production rose from 12.2 million barrels per day in 2003 to 63 million barrels in 2004, and will likely reach 80.7 million barrels in 2005. Nevertheless, Chad benefited little from the surge in international crude prices that began in 2004. In fact, a drop in quality stabilized the price of Chadian oil at around CFAF 15,000-17,000 per barrel. The investment period and the beginnings of development had a considerable impact on GDP growth rates and the structure of Chad’s economy. The main challenge now is to diversify the economy and make all of its sectors more dynamic by implementing structural measures to avoid the polarization of the national economy. In this context, the NPRS places special significance on strategies to ensure strong and sustainable growth that helps to reduce poverty, in particular by: (i) developing infrastructure to support production (roads, communications, energy, and water resources management); and (ii) ensuring the sustainable growth of agricultural production and other productive activities in rural areas.
4.1. Supporting Robust Growth by Developing Oil Resources
While GDP recorded slightly negative growth in 2000, it has since continued to accelerate, from 10.6 percent in 2001 to 7.3 percent in 2002, 15.1 percent in 2003, and finally to 33.4 percent in 2004. The end of the investment period and what will likely be the temporary stabilization of oil production will lead to a slowdown in growth. Nevertheless, the GDP growth rate should remain at around 13 percent in 2005.
GDP Growth (in percent)
Year GDP GDP per Capita
Non-Oil GDP Non-Oil GDP per Capita
2001 10.6 8.2 10.6 8.2 2002 7.3 5.9 7.3 5.9 2003 15.1 12.7 6.0 3.6 2004 33.4 33.7 3.6 1.2 2005 13.0 10.6 5.9 3.5
Source: INSEED The table above shows the growth rate of total GDP and non-oil GDP, as well as the growth rate per capita for each type of GDP measurement over the past five years. It clearly shows the strong growth in GDP per capita, attributable mainly to oil production. With the exception of 2004, however, non-oil GDP growth (overall and per capita) was satisfactory, recording figures well above the average for the past decade. It could be said, then, that oil production had some positive, indirect effects on most of the other sectors of the economy.

31
4.2 Transforming the Structure of the Economy
Oil development has fundamentally shifted the country’s production and trade. Once dominated by agricultural-pastoral activities and services, Chad’s economy now depends largely on oil production. In 2004, the oil GDP already accounted for one-third of total GDP and 80 percent of export proceeds. The two tables below show the annual growth rates for different sectors of the economy and the change in the sectoral distribution of GDP since 2001.
Annual Growth Rates of Different Sectors in Chad’s Economy (In percent)
2001 2002 2003 2004 2005 (Revised Projections)
Primary sector -Food crops -Industrial crops -Livestock -Forestry, fishing, and hunting
10.2% 18.7% 10.2% 2.7% 5.6%
-0.9% -5.0% 3.2% 2.0% 3.9%
4.6% 14.3% -39.9% 2.7% 5.8%
-3.3% -19.3% 95.9% 3.5% -0.8%
6.6% 10.5% 7.9% 2.8% 6.2%
Secondary sector (non-oil) -Cotton-fiber -Other industries -Handicrafts -Public works and civil engineering (BTP) -Water and electricity
14.2% -21.9% 4.1% 3.8% 11.6% 10.5%
21.0% 15.9% 11.8% 8.1%% 15.3% 15.9%
60.1% 1.1% 2.3% 0.0% 16.8% -14.0%
1.2% -28.3% 9.2% 8.0% 12.8% -1.2%
15.7% 53.0% 6.4% 2.7% 27.6% 17.8%
Oil sector - - - 299.5% 22.5% Tertiary sector -Transport and telecommunications -Trade -General government -Other
9.9% 12.8% 10.5% 7.6%
10.2%
8.6% 8.1%
11.3% 6.9% 4.9%
8.4% 5.7% 6.3%
13.5% 8.3%
9.5% 11.4% 5.7%
17.0% 8.4%
7.7% 11.4% -2.3% 23.6% 8.2%
Distribution of GDP by Sector, 2001-2005
(As a percentage of total GDP)
2001 2002 2003 2004 2005 (Revised Projections)
Primary sector -Food crops -Industrial crops -Livestock -Forestry, fishing, and hunting
40.5% 17.6% 2.2% 17.9% 2.9%
37.9% 15.5% 2.0%
16.9% 3.5%
33.6% 13.1% 1.3% 15.7% 3.6%
25.2% 9.4% 1.4% 12.0% 2.4%
23.2% 9.5% 1.3% 10.4% 2.1%
Secondary sector (non-oil) -Cotton-fiber -Other industries -Handicrafts -Public works and civil engineering BTP -Water and electricity
11.2% 1.3% 1.8% 6.1% 1.5% 0.5%
11.2% 1.2% 1.5% 6.4% 1.5% 0.6%
10.1% 1.0% 1.6% 5.4% 1.6% 0.5%
7.0% 0.4% 1.2% 3.8% 1.3% 0.3%
6.8% 0.5% 1.1% 3.5% 1.4% 0.3%
Oil sector 1.9% 3.3% 10.8% 32.8% 38.7% Tertiary sector -Transport and telecommunications -Trade -General government -Other
42.6% 2.7% 20.0% 11.2% 8.8%
43.7% 2.6%
21.4% 11.0% 8.6%
42.0% 2.6% 19.9% 11.4% 8.1%
32.2% 2.0% 14.8% 9.2% 6.7%
28.8% 1.8%% 13.3% 8.2% 5.5%
Weather changes continue to be the main factor affecting the growth or stagnation of the non-oil economy and particularly the primary sector (agriculture, livestock, forestry, fishing, and hunting). After a good harvest and a 4.6 percent growth rate in 2003, the primary sector was

32
seriously affected in 2004 by scant and irregular rainfall, an invasion of migrant locusts that devastated food crops, soil impoverishment, the appearance of striga, desert encroachment, and insufficient pastureland (negative growth of minus 19.3 percent). The good performance of industrial crops (cotton and gum arabic) only partially compensated for declining food production, and the primary sector recorded negative growth (minus 3.3 percent) in 2004. Increased rainfall has led to expectations of a strong upsurge in the production of subsistence crops and satisfactory growth in the primary sector in 2005. Nevertheless, the share of the primary sector in Chad’s GDP fell from more than 40 percent in 2000-2001 to 23-25 percent in 2004-2005. This development is significant, as the majority of the poor population works in the primary sector. Without strong and sustainable growth in agricultural production and stock farming, poverty reduction will be extremely difficult to achieve over the next few years. It is in this context that efforts are being made to develop basic infrastructure and improve rural sector performance.
4.3. Favorable Development of Foreign Exchange
The development of the main foreign trade aggregates is characterized primarily by a strong increase in the trade deficit (CFAF 978 billion in 2002) and the balance of services (CFAF 420 billion in 2002), caused by the jump in goods and services imports during the oil investment period. The beginning of the production period resulted in a net trade surplus (CFAF 763 billion in 2004 and CFAF 1,272 billion in 2005). Oil development also led to an overall decrease in the income balance (remuneration of expatriate employees and particularly the remuneration of private investment), but the current account deficit (CFAF 422 billion in 2001 and CFAF 1,391 billion in 2002) has shrunk significantly since that time (CFAF 156 billion in 2004 to just CFAF 55 billion in 2005).
4.4. Basic Infrastructure Development
Infrastructure development can clearly help to improve the living conditions of the most disadvantaged segments of the population by facilitating the servicing of landlocked areas and by improving access to safe drinking water, new sources of renewable energy, and finally, adequate communication tools. Significant efforts have been made in this area and the proportion of total public spending (actual disbursements) on public works has increased from 4.9 percent in 2001-2002 to more than 23 percent in 2003-2004. 4.4.1. The transport sector Chad’s landlocked geographical position poses one of the greatest obstacles to its economic development, and the isolation of many remote regions is one of the principal factors contributing to Chadian poverty. The nearest seaport, Douala, is 1,700 kilometers from N’Djamena. Other foreign seaports that Chad uses are Lagos (1,900 kilometers from N’Djamena), Cotonou (2,000 kilometers away), Lomé (2,100 kilometers away), Pointe Noire (2,700 kilometers away), and Port Sudan (3,350 kilometers away). Chad’s landlocked position also creates the additional problem of exorbitant transport costs. The government prepared a National Transport Program (PNT) for the period 2000 to 2009, the primary objective of which is to contribute to economic growth and poverty reduction by:
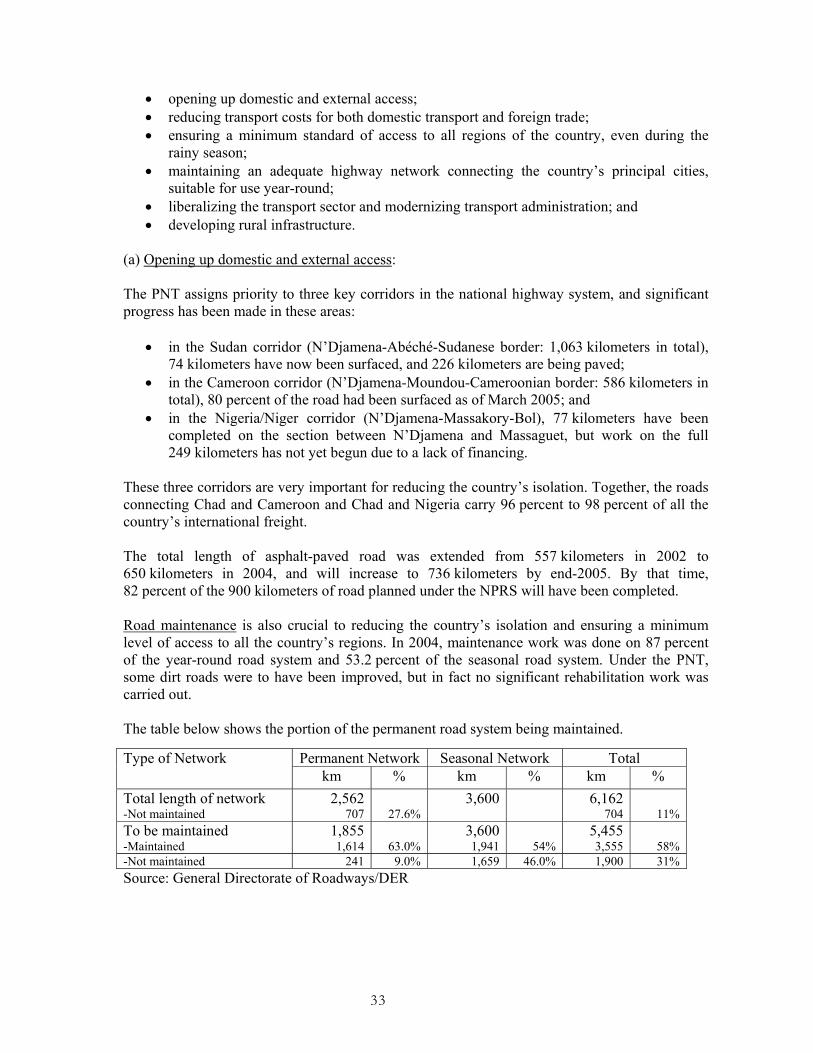
33
• opening up domestic and external access; • reducing transport costs for both domestic transport and foreign trade; • ensuring a minimum standard of access to all regions of the country, even during the
rainy season; • maintaining an adequate highway network connecting the country’s principal cities,
suitable for use year-round; • liberalizing the transport sector and modernizing transport administration; and • developing rural infrastructure.
(a) Opening up domestic and external access: The PNT assigns priority to three key corridors in the national highway system, and significant progress has been made in these areas:
• in the Sudan corridor (N’Djamena-Abéché-Sudanese border: 1,063 kilometers in total), 74 kilometers have now been surfaced, and 226 kilometers are being paved;
• in the Cameroon corridor (N’Djamena-Moundou-Cameroonian border: 586 kilometers in total), 80 percent of the road had been surfaced as of March 2005; and
• in the Nigeria/Niger corridor (N’Djamena-Massakory-Bol), 77 kilometers have been completed on the section between N’Djamena and Massaguet, but work on the full 249 kilometers has not yet begun due to a lack of financing.
These three corridors are very important for reducing the country’s isolation. Together, the roads connecting Chad and Cameroon and Chad and Nigeria carry 96 percent to 98 percent of all the country’s international freight. The total length of asphalt-paved road was extended from 557 kilometers in 2002 to 650 kilometers in 2004, and will increase to 736 kilometers by end-2005. By that time, 82 percent of the 900 kilometers of road planned under the NPRS will have been completed. Road maintenance is also crucial to reducing the country’s isolation and ensuring a minimum level of access to all the country’s regions. In 2004, maintenance work was done on 87 percent of the year-round road system and 53.2 percent of the seasonal road system. Under the PNT, some dirt roads were to have been improved, but in fact no significant rehabilitation work was carried out. The table below shows the portion of the permanent road system being maintained.
Permanent Network Seasonal Network Total Type of Network km % km % km %
Total length of network -Not maintained
2,562707 27.6%
3,600 6,162 704 11%
To be maintained -Maintained
1,8551,614 63.0%
3,6001,941 54%
5,455 3,555 58%
-Not maintained 241 9.0% 1,659 46.0% 1,900 31% Source: General Directorate of Roadways/DER

34
The table shows that particular attention was given to the permanent network, of which only 9 percent was not maintained. Conversely, ongoing preventive maintenance is conducted only on previously rehabilitated seasonal roadways. Maintenance is funded out of the Highway Maintenance Fund (FER), which collects toll revenues, the road freight fees charged by the National Freight Bureau (Bureau National de Fret –BNF), as well as oil tax revenues and resources generated from concession contracts for road network projects. From 2002/2003 to 2003/2004, FER resources increased from CFAF 3,762 billion to CFAF 5,745 billion, nearly 53 percent. In 2004, the Road Maintenance Directorate maintained 2,300 kilometers of road, or 88.4 percent of the annual target of 2,600 kilometers. This progress was achieved through the use of HIPC funds and the improved mobilization of the enterprises involved. (b) Traffic flows and transport costs In terms of the transport of goods, most domestic traffic flows are concentrated in two regions. All of the country’s major road networks converge on N’Djamena, the capital, which is the point of origin for 24 percent of such traffic flows and the destination for 46 percent of total traffic. Although the region of Mandoul and its capital city, Koumra, have no paved roads, they receive 52 percent of domestic traffic flows (221,324 metric tons). In fact, the region is a hub for Tandjilé, Moyen Chari, and Eastern Logone, and receives goods from N’Djamena, Nigeria, and Cameroon destined for the region or in transit to Moyen Chari.
Source: BNF The fact that the N’Djamena–Moundou tract of highway is fully paved makes it very attractive to economic agents. Its market should also be one of the largest in the region. The Hadjer Lamis region, situated near N’Djamena, produces cereals and provides food products to the capital. The regions of Batha and BET are the most disadvantaged in terms of domestic trade. The BET region, located in the middle of the desert, is enormously constrained by the lack of roadways. The Batha region lacks road links with the two large cities of N’Djamena and Abéché, which explains the lack of road traffic. The Lac, Salamat, Guera, and South Ouaddaï regions, which have significant agricultural potential, are also limited by an underdeveloped road network.
Domestic Trade by Origin/Destination in 2004
0 50 000
100 000 150 000 200 000 250 000
N'D
jam
ena
Logo
ne O
c
Logo
ne O
ri
Tand
jilé
Moy
en C
hari
Moy
o K
eb E
st
May
o K
ebO
uest
M
ando
ul
Cha
ri B
ag
Had
jer L
amis
Bat
ha
BE
T W
adi F
arah
Kan
em
Gue
ra
Sal
ama
Lac
Oua
dda ï
Regions
Dom
estic
Flo
ws
(met
ric to
ns)
Destination Origin
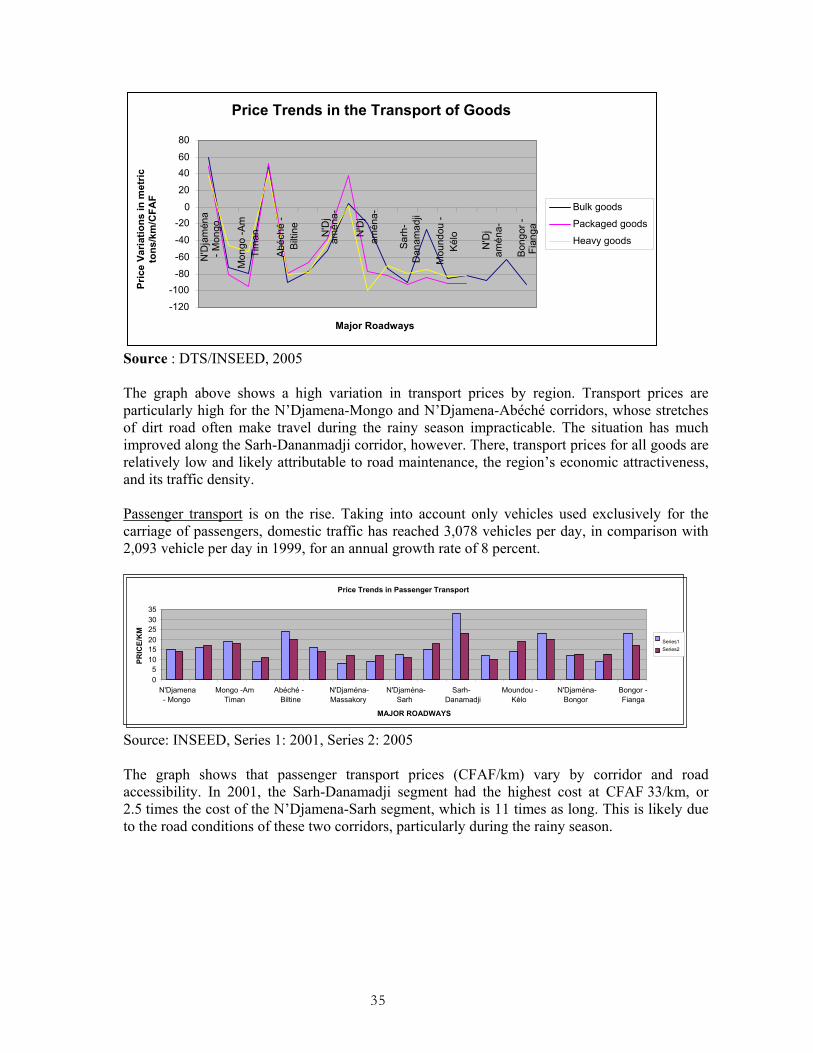
35
Source : DTS/INSEED, 2005 The graph above shows a high variation in transport prices by region. Transport prices are particularly high for the N’Djamena-Mongo and N’Djamena-Abéché corridors, whose stretches of dirt road often make travel during the rainy season impracticable. The situation has much improved along the Sarh-Dananmadji corridor, however. There, transport prices for all goods are relatively low and likely attributable to road maintenance, the region’s economic attractiveness, and its traffic density. Passenger transport is on the rise. Taking into account only vehicles used exclusively for the carriage of passengers, domestic traffic has reached 3,078 vehicles per day, in comparison with 2,093 vehicle per day in 1999, for an annual growth rate of 8 percent.
Source: INSEED, Series 1: 2001, Series 2: 2005 The graph shows that passenger transport prices (CFAF/km) vary by corridor and road accessibility. In 2001, the Sarh-Danamadji segment had the highest cost at CFAF 33/km, or 2.5 times the cost of the N’Djamena-Sarh segment, which is 11 times as long. This is likely due to the road conditions of these two corridors, particularly during the rainy season.
Price Trends in the Transport of Goods
-120 -100
-80 -60 -40 -20
0 20 40 60 80
N'D
jam
éna
- Mon
go
Mon
go -A
m
Tim
an
Abéc
hé -
Bilti
ne
N'D
j am
éna-
N'D
j am
éna-
Sarh
- D
anam
adji
Mou
ndou
- Ké
lo
N'D
j am
éna-
Bo
ngor
- Fi
anga
Major Roadways
Pric
e Va
riatio
ns in
met
ric
tons
/km
/CFA
F
Bulk goods Packaged goods Heavy goods
Price Trends in Passenger Transport
0 5 10
15 20 25 30 35
N'Djamena - Mongo Mongo -Am
TimanAbéché -
Biltine N'Djaména-Massakory
N'Djaména-Sarh
Sarh-Danamadji
Moundou -Kélo
N'Djaména- Bongor Bongor -
Fianga MAJOR ROADWAYS
PRIC
E/K
M
Series1Series2

36
Source: INSEED, 2005 Transport costs are tending to decline, however. Admittedly, the cost of the Bongor-Pala segment has increased significantly, due in part to the worsening state of the roads (despite maintenance) and a demand for transport that exceeds supply, as well as distance and the rainy season. Conversely, the Bongor-Fianga and Sarh-Dananmadji segments show a much more favorable price trend due to better road conditions. (c) Development of rural infrastructure One of the objectives of the PNT is to improve the transport system in rural areas. Thus far, the progress made in this area has been limited. To boost efforts in this area, the government has established the Rural Roads Directorate (DRPR), which will assume responsibility for implementing the rural transport component of the National Transport Program Support Project (PAPRONAT) financed by the World Bank. The government recently drew up a five-year investment plan for investing CFAF 4 billion a year in rural roads during the period 2006 to 2010. This plan will make it possible to rehabilitate 3,000-4,000 kilometers of rural roads, using government funding from oil revenues. In addition, some major projects include a rural roads component. Examples are the construction of 100 kilometers of rural roads in the target area identified under the sixth EDF (financed by the European Union), the project to rehabilitate rural roads in the old Biltine region (financed by the Swiss development cooperation agency), and the project to rehabilitate and maintain rural roads in the old Mayo-Kebbi region (financed by the German development cooperation agency, KFW).
4.4.2. Access to water The Master Plan for Water and Sanitation (SDEA) for 2003-2020 follows up on the recommendations made at the United Nations Conference on integrated water resources management (Harare, 1998), which were adopted at the World Summit on Sustainable Development (Johannesburg, 2002). The participatory, comprehensive, and integrated approach of this plan, as well as its focus on local activities, make it consistent with the approach of the
Trends in Passenger Transport, 2001-2005
-40 -30 -20 -10
0 10 20 30 40 50 60
N'D
jam
ena
- Mon
go
Mon
go -M
anga
lmé
Mon
go -A
m T
iman
N
'Dja
men
a -A
béch
é Ab
éché
- B
iltin
e Ab
éché
-Oum
haje
r N
'Dja
men
a- M
assa
kory
N
'Dja
men
a- M
oito
N
'Dja
men
a- S
arh
Sarh
- Ko
umra
Sarh
- Dan
amad
ji N
'Dja
men
a- M
ound
ou
Mou
ndou
-Kél
o M
ound
ou- D
oba
N'D
jam
ena-
Bon
gor
Bong
or -P
ala
Bong
or F
iang
a
Major Roadways
Pric
e va
riatio
ns
Variation (%)

37
NPRS. The objective is twofold: to improve access to water in urban and rural areas, and to turn over the management of water resources to the population. Clear progress has been made in this area. Thanks to the expansion of infrastructure, the proportion of the population having access to drinking water has increased from 23 percent in 2000 to 28 percent in 2002, 32 percent in 2003, and 36 percent in 2004. In general, beneficiaries are given the responsibility for managing such facilities as soon as they have been completed. Type of Water Supply
2001 2002 2003 2004 Total
Village water supply
550 PMH 789 PMH7 712 PMH 400 PMH 2,430 PMH
Urban and semi-urban water supply
6 AEP8 + Extension
5 AEP + Extension
8 AEP + Extension
17 AEP + Extension
36 AEP + Extension
These projects are financed primarily with HIPC funds and oil revenues. 4.4.3. Energy This sector, still underdeveloped, is characterized by the high consumption of wood fuels (wood-charcoal), which account for 90 percent of Chad’s total energy consumption, while conventional energy sources (oil and electricity) account for only 10 percent. From 2001 to 2005, annual energy consumption increased from 240 to 292 kilograms of oil equivalent per inhabitant. During the past several years, however, the energy sector has been experiencing a crisis that has severely affected the Chadian economy. The main objective of the policy and strategy letter for Chad’s electricity subsector (for 2002-2006) is to meet the electricity needs of the population and expand access to electric power for all other production sectors, all at the lowest possible cost. It also aims to promote alternative sources of energy (solar and wind energy) so as to lessen the impact of the cutting of firewood on the regeneration of forest resources. To this end, the letter contains the following measures, which have been proposed to reduce the cost of each kilowatt-hour and expand access to electricity for much of the population:
- building a new power plant in Farcha; - resuming negotiations on electric interconnections between Chad and Cameroon; - completing the project to develop the Sédigui oilfield; - building a mini-refinery in Farcha; and - concluding the study on the possibility of using crude from Doba or Sédigui or gas-
oil from the distillation column (topping unit) Furthermore, the action plan outlined in this letter is a type of crisis recovery plan. Thus, during this period, the government has been focusing its efforts on rehabilitating resources and boosting
7 PMH: hand pump (pompe à motricité humaine) 8 AEP: drinking water supply (adduction d’eau potable)

38
the production capacity of the Chadian Water and Electric Power Corporation (STEE) by: - acquiring 4 CAT generators with an installed capacity of 5 megawatts (emergency loan)
and installed and operational MBH generators since early 2005 (Crédit Libanais); and - rehabilitating some generators in the old power plant
As a result of these efforts, the production capacity of STEE in N’Djamena increased from 9 MW to nearly 25 MW. Outside the capital, some towns now have electricity and the existing infrastructure has been improved. The crucial problem of electricity in Chad is linked to the fuel supply. National energy resources must be used to resolve this problem. The government is preparing a national energy strategy and a national rural electrification plan. 4.4.4. Postal and telecommunications services
A postal and telecommunications strategy is now being finalized. The aim is to improve the coverage of urban and rural areas, particularly by expanding mobile (cellular) telephone systems. The Sotel Tchad telephone company operates a network consisting of interurban transmission links and infrastructure connecting 16 cities and towns across the country. In 2004, Sotel Tchad had approximately 13,000 subscribers to fixed telephony services.
Fixed Subscriber Growth
2000 2001 2002 2003 2004 Number of subscribers 10,261 10,689 11,835 12,475 13,000 Average growth 5.34 4.17 10.54 5.13 4.04 Penetration rate (per 1,000) 0.14 0.14 0.15 0.15 0.16
Source : OTRT The mobile telephony market has been growing rapidly. In 2004, there were approximately 120,000 mobile subscribers.
Mobile Subscriber Growth Mobile telephony subscriber growth
Dec. 2001 Dec. 2002 Dec. 2003 Dec. 2004
Number of Celtel Tchad subscribers
7,177 16,283 57,086 120,000
Penetration rate (%) 0.20 0.43 1.08 1.57 The growth in mobile telephony has significantly improved the population’s access to telephone service (15 percent in 2004). This percentage is sure to increase when the Millicom company (TIGO) enters the Chadian market. The rural telephony project was able to install VSAT antennas in 15 secondary towns of the 24 originally identified, for a 63 percent completion rate. The Internet penetration rate is only 0.3 per 1,000 population.

39
The Ministry of Posts and New Communications Technologies (MPNTC) is currently drawing up a National Information Technology and Telecommunications Strategy.
4.5 Foundations for Sustainable Growth in Agricultural Production
The National Rural Development Strategy was presented to the international community at the Sectoral Consultation on Rural Development in June 1999. The overall objective of the strategy is to boost sustainable production growth within a more secure environment and to strengthen the capacities of the rural sector. To that end, five specific objectives were established:
• increasing production; • encouraging the emergence of competitive enterprises; • managing and making optimum use of natural resources; • promoting the rural milieu; and • improving the effectiveness of public interventions
Two strategic pillars of the NPRS—strong, sustained growth and protection of ecosystems—reflect the objectives of the National Rural Development Strategy. The implementation of this strategy has involved a number of collaborative efforts by the government, donors, civil society, the private sector, and so on. These efforts resulted in the preparation of the Rural Development Intervention Plan in 2003, comprising a Local Development Support Program (PROADEL) and a Sectoral Capacity Building Program (PROSE). In addition, a National Food Security Program (PNSA) covering the period up to 2015, stemming from the PROSE, and a Master Plan for Agriculture were prepared and adopted in 2005. A subprogram for microfinance development has also been developed. Lastly, a National Stock farming Development Plan is in preparation. A permanent unit responsible for monitoring the agricultural sector has been established and is operational. It publishes an information bulletin, Al Nougara, on the monitoring mechanism of the Sectoral Meeting on Rural Development. Increased production—on which the growth of the sector and poverty reduction depend—is contingent on crop diversification, increased productivity, and ensuring food security in rural areas. As a result of increased investment in water management facilities for crops and livestock, the land area benefiting from such facilities was increased from 20,000 hectares in 2003 to 27,000 hectares in 2005. In the stock farming sector, 80 wells were sunk and 25 pumping stations installed. These accomplishments are not enough, however. Herders continue to travel long distances in search of water, and transhumance often provokes conflicts between farmers and herders, or among herders themselves. Thanks to reduced prices for farm equipment, the proportion of farms with equipment rose from 24 percent in 2004 to 26.12 percent in 2005. By using the resources derived from equipment sales, and with the support of projects now underway, the proportion of farms with equipment should grow by at least 2 percent a year.

40
Achievements in microfinance have paled in comparison with the growing needs of producers. In most cases, microfinance activities are integrated into projects and also support programs for the development and diversification of production, as well as income-generating activities. Finding appropriate solutions to the problems of rural credit and local financial intermediation is the top priority in fighting poverty, particularly in rural areas.
Measures to protect crops are largely inadequate. Chad has received considerable amounts of international assistance from over 20 countries to help it fight locust invasions, but the same is not true for other traditional enemies of crops (caterpillars, Spanish flies, and grain-eating birds) which can also wreak enormous destruction. Despite the investments already made, the country’s food situation continues to be marked by chronic grain shortages. Nationwide production varies sharply from year to year, but it is almost never sufficient to meet the country’s grain demand, which is reckoned at 1,480,000 metric tons a year for a population estimated at 9.3 million (based on a standard of 159 kilograms per inhabitant per year).
Coverage of Grain Demand by Local Production
0
200000
400000
600000
800000
1000000
1200000
1400000
1994/1995 1996/1997 1998/1999 2000/2001 2002/2003
ProductionNeeds
Source: DSA/MA, Grain production from 1994/1995 to 2003/2004
To overcome this shortfall, a package of policies, programs, and projects needs to be implemented to ensure proper water management, access to means of production, and capacity-building in rural areas. Rural development also occurs through the emergence of competitive industries. Cotton growing provides rural dwellers with their largest source of income. Although it is the most well-organized part of the rural economy and has received significant support from the government and donors, it faces serious problems that affect the entire production chain. The amount of cotton produced varies greatly: it reached 186,300 metric tons in 1999-2000, declined sharply in 2002-03, and then increased to 220,000 metric tons in 2003-04. The decline in output was mainly due to unattractively low producer prices and problems in getting the product to market. There are often delays (of up to six months) in paying cotton growers. This situation discourages production and has a highly negative impact on poverty reduction in rural areas. The government and its partners have drawn up a list of measures to be taken—the “road map”—in preparation for the effective privatization of Cotontchad in June 2007.

41
Insofar as a crop diversification policy is concerned, a number of studies have been carried out with a view to developing new sorts of agricultural production, particularly poultry raising, stock farming close to urban centers, spirulina harvesting, and cattle finishing. None of these studies has resulted in new projects being undertaken thus far. Chad is the second largest producer of gum arabic in the world, and this business is thriving. Total production for 2005 was 18,000 metric tons. It contributes 7 percent to GDP. The production of sesame and peanuts could also be significant sources of income for rural populations, although these crops are not well known, and their production is poorly developed and badly organized. One high-priority objective common to all rural sector programs and the poverty reduction strategy is the organization of the rural milieu. The government is aiming to have producers’ organizations take on responsibilities and to involve them in managing the rural sector: Representatives of these organizations sit on project steering committees and participate in the design and execution of sectoral reforms. Efforts to promote the rural milieu increased the number of producers’ organizations from 33,000 in 2003 to 35,000 in 2005. What is needed now is to improve the framework within which these organizations operate to strengthen their capacities and make them true development partners. Another key measure to further the development of the rural sector is the deconcentration of the ministries involved in the rural sector. To improve the effectiveness of the National Bureau of Rural Development, the government decided to give it an organizational structure consisting of one national directorate, seven rural development regions, 45 rural development districts, and 191 rural development zones. These entities are not as effective as they should be, however, because they lack adequate resources and genuine authority. Despite its slow pace of implementation, the rural development strategy has improved producers’ access to means of production, facilitated the dissemination of new techniques, and strengthened the capacities of the main actors. It has also mobilized resources—from both the government and donors—for the development of the rural sector. However, the resources are insufficient, the beneficiaries are not yet well organized, and the responsible entities do not possess the necessary capacities to be able to complete programs and projects, improve the performance of the rural sector, and reduce rural poverty. Agriculture and livestock accounted for 6.9 percent of Chad’s total public spending (actual disbursements) in 2001-02, 7.3 percent in 2003, and 11.1 percent in 2004. Agriculture and livestock appropriations in the 2005 budget amounted to 11.3 percent of total planned spending.

42
V. IMPLEMENTATION OF THE NPRS – DEVELOPING HUMAN CAPITAL
Human resources promotion is essential if Chadians are to assume their rightful role in their country’s socioeconomic development.
5.1 The education sector
5.1.1. Education policy and the NPRS Since early independence, the Chadian educational system inherited from French colonization has been subject to several constraints: poorly designed programs, a system that fails to meet output needs, strong pressure from unsatisfied enrollment demand from a growing population, and insufficient teaching supervision. Attempts at reforms (ruralization of the educational system in the 1960s and 1970s, “Chadization” of schools in the 1970s and 1980s, and a few pedagogical innovations) yielded disappointing results. As a result of the protracted political turmoil experienced by the country, communities took their children’s future into their own hands. This community initiative came about as a result of the education services offered by the government, which were inadequate and unsuitable. Even today, communities organized into Parent Teachers Associations pay over 60 percent of the primary school teachers known as maîtres communautaires, or community teachers, and spend almost CFAF2 billion to run primary schools (30 percent for the physical running of the schools and over 70 percent directly for running classes). According to estimates, the poor account for almost 80 percent of Chad’s population. Of their total expenditure, 1.3 percent is spent on education. This proportion is double that spent by the better-off on education. The problem is particularly acute in urban areas, where, of total expenditure, the share of spending on education is twice that of rural households. In the early 1990s, the government of Chad adopted an “Education-Training-Employment” [EFE] strategy. This strategy was based on two basic approaches, namely: (i) a quality-oriented strategy aimed at improving system performance through a revitalization of educational and training units, and (ii) a quantity-oriented strategy aimed at a moderate expansion of school and university enrollment, so that enrollment can be adjusted on an ongoing basis to keep pace with the country’s demographic, economic, and sociocultural changes. Implementation of this EFE Strategy in 1993 yielded appreciable results. The strategy was strengthened as of 2000 through a new vision of educational policy based on three strategic pillars: (i) better (more equitable) access to education; (ii) an improvement in the quality of teaching and learning conditions; and (iii) building capacity in the administration, planning, management, and steering of the educational system. The National Poverty Reduction Strategy adopted in 2003 by the government and its partners embraced this vision by setting a twofold objective: validate the strides made by the communities while gradually reducing the burden of the schools on poorer communities. The government’s education and training policy is taken into account in the NPRS inasmuch as education is one of the instruments available to the country to reduce hardship and vulnerability. Through education, households are afforded more income options, the labor force becomes more mobile, maternal and child health are improved, and fertility and child mortality can be reduced. Education is therefore a determining factor in sustainable development, because it has a cross-cutting effect on improving results in other poverty sectors and enhances the productivity

43
of the labor force in the informal and agriculture/livestock sectors, which form the backbone of national production, whereas the modern sector provides a mere 5 percent of jobs on the labor market. The recent assessment of performance in the Chadian educational system shows that, as far as the quality of teaching is concerned, the country is lagging far behind other developing countries, in that the continued attendance rate in primary schools is no higher than 38 percent, compared with an average of 64 percent for all of Africa. The Poverty Reduction Strategy incorporates the objectives of the above-mentioned educational reform and is aimed at achieving a CP1 admission rate of 90 percent for boys and 75 percent for girls in 2005-2006 (reducing the gap between girls and boys by 15 points each year); another of its aims is a continued attendance rate of 63 percent in the primary cycle. In pursuit of these objectives, the government adopted the following measures (see 2002 Sectoral Policy Letter): a) The share of GDP allocated to education must be increased and reach at least 4 percent in
2015; b) Nonwage expenditure in the operating budget for education must be increased by at least
20 percent per year until 2015; c) At least 50 percent of the education budget must be allocated to basic education; d) Reforms are needed to redefine priorities, reallocate budgets, and divide the
responsibilities for education among the state, communities, and local authorities, in a decentralized management framework in which schools have greater autonomy.
5.1.2. Progress in education The Chadian educational system, as in the other countries of the Sahel, experienced strong growth in enrollment demand, with a 9.6 percent rate of increase in primary school pupils between 1995 and 2000, and 7.6 percent between 2000 and 2004. The system is characterized by strong community participation in school development; consequently, the 2003-2004 statistics point to 29 percent of students enrolled in community schools and 64 percent in public schools, where the majority of teachers are paid by the communities (in some cases all the teachers are paid by the community). The proportion of teachers paid by the communities was higher than 60 percent in 2003-2004. In 2003-2004, the rate of CP1 admission was 107 percent overall (of which 123% for boys and 91.4 percent for girls), which is a 15 percent increase for boys and 14 percent for girls compared with the 2002-2003 school year. The objective of the NPRS in this area—an admission rate of 90 percent for boys and 75 percent for girls—has already been surpassed by a large margin. The gender parity point on the index moved from 1.5 percent in 1990-2000 to 1.35 percent in 2003-2004, which reflects a clear improvement in establishing equitable access for girls to primary school.

44
Nevertheless, these positive rates conceal major regional differences, as shown in the chart below: It also bears noting that the gross enrollment rate rose from 72 percent in 1999-2000, to 87.58 percent in 2003-2004, which is a far higher rate than the average for the 15 French-speaking African countries (80.4 percent), or an average increase of 22 percent over the past five years. In theory, this means that the universal enrollment rate will be achieved in 2010, not counting repeaters. The main problem is that of drop-outs during the cycle. In Chad, of a cohort of 100 children enrolled in CP1, only 38 percent reach CM2. The situation is even more grave, considering the geographic disparities revealed in 2.2 below: Since implementation of the NPRS, the government maintained education as one of what are known as its priority sectors, even though the tax effort (8.2 percent of GDP in 2004) is still insufficient to enable the sector to promote the human resources essential for sustainable economic development. The table and chart below show the trend of the tax effort, which has been increasing from year to year, despite the pressure from burgeoning needs in the sector. An analysis of changes in the share of national wealth allocated to education shows that the government considers it as being relatively stable—about 2.8 percent of GDP—since implementation of the NPRS. Total expenditure on education accounts for an average of 13 percent of overall government expenditure (non-debt), with an average growth rate of 23 percent per annum over the past five years. Expenditure on basic education increased 8 percent on average over the period and represents more than half of expenditure on education at current values. An international comparison of fiscal policies on education shows that the resources spent by Chad on education are markedly lower than the average for other countries with comparable incomes, as shown in the chart below: Over the past two years, work on improving this sector was affected by extremely low execution rates, especially in 2004. This difficulty is essentially linked to the slowness of procurement procedures and delays in establishing the budget. Implementation of the new government procurement code should make for clear improvements in the execution of the budget. 5.1.3 Educational policy assessment At a time when the entire international community has pledged to ensure that all children are given enough education to enable them to escape poverty, the Chadian educational system needs to tackle several challenges before it can seize the opportunities afforded at this juncture, and on which the hopes for future generations hinge:
The challenge of building a national consensus around Chadian education as it relates to
the Millennium Development Goals; The challenge of gathering national momentum in mobilizing national resources to make
the educational system more credible; The challenge of effective and efficient management of the system to streamline the use
of resources;

45
The challenge of having an effective and reliable data system to facilitate the generation of relevant political analyses and improve the monitoring of the policies and programs implemented;
The challenge of decentralizing educational objectives and resources through performance contracts linking decentralized units to performance obligations; and lastly,
The challenge of the reporting requirement (accountability).
The main actions to be undertaken are as follows:
Adopt the framework law for the Chadian educational system;
Harmonize the different educational development strategies;
Strengthen the statistical information system and the school map and lay the groundwork for the statistical data production system;
Develop and implement a plan to build planning and management capacity in the decentralized units of the MEN;
Strengthen computerized monitoring of teaching staff;
Set up a computerized system to manage materials and supplies;
Revise the education component of the National Poverty Reduction Strategy;
Organize a positioning conference of technical and financial partners;
Launch the Chadian education advocacy process;
Organize an education forum to build a national consensus on Chadian education.
5.2. Establish an effective healthcare system
5.2.1. The National Health Policy The National Health Policy adopted by the government is based on 12 strategic pillars:
1. Complete health coverage by ensuring gradually that all districts are operational and functioning;
2. Strengthen implementation of the minimum and complementary packages of measures (PMA and PCA), especially in the areas of maternal and child mortality;
3. Build institutional capacities at the central level; 4. Ensure that qualified human resources are available; 5. Continue to implement the measures undertaken with regard to access to medication,
within the framework of the national pharmaceutical policy; 6. Strengthen the deconcentration/decentralization process, in coordination with the
relevant ministries; 7. Organize the participation of the population in financing health services; 8. Develop a contract-based approach as a tool for implementing the national health
policy; 9. Safeguard and consolidate the progress made in preventing chronic diseases; 10. Strengthen epidemic surveillance, particularly of cholera and meningitis; 11. Continue to combat STIs/AIDS using a multisector approach; 12. Strengthen information, education, and communication (IEC) activities to assist in the
implementation of the national health policy.

46
This policy is implemented through sectoral health projects, the most recent of which was the Health Sector Support Project supported by the World Bank. 5.2.2. The Health Sector in the NPRS With a view to establishing an effective healthcare system, the NPRS defined the following objectives:
i) Provide access to high quality health services throughout the entire country; ii) Improve health sector indicators; iii) Improve the use of resources allocated to health; iv) Combat HIV/AIDS; v) Combat malaria; vi) Combat malnutrition.
In order to achieve these objectives, the following actions were to have been executed during the first phase of the NPRS from 2003 to 2006: • Build/and or rehabilitate 50 health centers, 5 district hospitals, and 15 district offices; provide
them with the necessary equipment for their operation; • Train health officers as well as the members of the Health and Health Unit Management
Committees to improve community participation and enlist committees as partners in managing health services;
• Give more autonomy to 10 district or departmental hospitals; • Encourage the creation of health mutual associations among less advantaged population
groups; • Strengthen the protection of children and pregnant women, combat preventable diseases (by
immunization) and malnutrition; • Strengthen the surveillance and early-warning system for endemic diseases (polio, neonatal
tetanus, measles) and potentially endemic diseases (cholera, meningitis, tuberculosis); • Provide 600 health centers with equipment for monitoring pregnancies and childbirth; • Offer postnatal consultation in all health centers and all maternity clinics; • Equip 25 district hospitals or prefectural hospitals for obstetric emergencies; • Assign one surgeon, one anesthetist, and one midwife per district or prefectural hospital; • Introduce programs for spacing births at 600 health centers and 25 hospitals; • Build the capacities of management bodies in 43 health districts; • Prepare a three-year action plan to develop the health districts; • Provide supervision and monitoring of 43 health districts; • Continue and broaden programs for early detection, (particularly among those aged 15 to 49,
pregnant women, and seropositive women), and treatment; • Continue and broaden prevention and treatment programs; • Continue and expand programs to provide micronutrient supplements, encourage breast-
feeding, and promote healthy foods.

47
5.2.3. Implementation status The main results obtained within the framework of the NPRS as of end-2005 are as follows:
52 health centers, 6 district hospitals, and 4 district offices were built in 2005; 569 health centers received training in community participation; 6 mutual associations were created as of end-2005; The DTC 3 rate was 47.5 percent in 2005; 900 public awareness meetings were held in the 18 regions of the country; 3,000 posters on the immunization schedule were made; 433 health centers were equipped with pregnancy monitoring equipment; Postnatal consultation is offered in 98 percent of health centers and districts; 32 of 45 hospitals are equipped to handle obstetric emergencies; 42 of 45 district hospitals are staffed by qualified personnel; The contraceptive prevalence rate was 2.5 percent in 2005; 37 of 43 management bodies have been formed; An action plan was prepared and is now available; 42 of 43 districts are regularly monitored; 14 of 18 hospitals are now dispensing ARVs and 52 voluntary testing centers are now in
operation; 3,125,000 condoms were sold in 2005; 168 public awareness campaigns were conducted; Mosquito net use in 2005 was 7 percent; All operational health units offer malaria treatment; Iodized salt use is 77 percent; 16 breastfeeding outreach campaigns were conducted.
It also bears noting that the share of health in total public expenditure rose from 4.8 percent of the total in 2001-2002, to 8.6 percent in 2003 and 9.7 percent in 2004. Nevertheless, this percentage is expected to be reduced in the 2005 budget (only 7.8 percent of appropriations).
5.2.4 Results obtained The results of the implementation of the sectoral health strategy are satisfactory, despite the difficulties encountered by the technical staff of the Ministry of Health. The indicators below indicate the results obtained in achieving the objectives of the NPRS.

48
Trends in health indicators 2000
2001 2002
2003 2004
Infant/child mortality ratio (per 1,000) 214 91 Infant mortality (per 1,000) 129 102 Maternal mortality per 100,000 live births 827 1,099 Number of AIDS orphans 96,000 Children under 5 years who are underweight 39% 37 % Proportion of professionally assisted childbirths 18.3 % 19.6 % 21% Syphilis prevalence rate in pregnant women 5.69% 3.83% 8.31% 5.8% Malaria prevalence rate 27 % Tuberculosis incidence rate (per 100,000 population) 45 50 56 56 Health coverage 66 72 72 73.4 Ratio of inhabitants to one doctor 26,000 29,000 27,000 Ratio of inhabitants to one state-certified nurse 6,741 49,000 Ratio of women of child-bearing age to one midwife 10,000 42,000 9,000 Vaccination coverage -BCG -DTC -Polio -Measles -Yellow fever -Tetanus
55.3 31
31.6 37.4 38.7 ---
48.9 27.3 27.2 35.3 35.3 11
54.4 37
31.8 47.2 44.2 11.4
72
46.6 46.8 61.2 40.4 10.3
38 .3 49.9 47.4 55.8 49.1 13.7
5.2.5. Problems encountered Implementation of the NPRS in the health sector has been complicated by two sorts of problems:
The first problem is the lack of qualified staff (healthcare personnel and managers). This is shown in the chart below. As shown in the results of the macro participation of October-December 2001, the population is aware of the problem, which is considered one of the determinants of poverty. Progress in this area is slow, despite measures taken in budget laws to establish a recruitment quota for health personnel in the civil service. This understaffing is particularly acute in the outlying centers; one of the factors is the delay in the payment of the salaries of personnel on assignment in the provinces, compared with their colleagues in the capital.
Chart: Population per healthcare provider and human development index (HDI) per region
0
100000
200000
300000
400000
500000
SALLA
CGUE
KANBAT BIL
LOR
MKBBET
OUATAN
MCHLO
CCHR
NDJ
0.30.320.340.360.380.40.420.44
Hbts/médecin
Hbts/sage-femmeHbts/infirmier
IDH
■ Population/doctor □ Population/midwife ■ Population/nurse -◊- HDI Source : RDP Santé

49
VI. IMPLEMENTATION OF THE NPRS – IMPROVING THE LIVING CONDITIONS OF VULNERABLE GROUPS
The government launched a study on social protection, which will be used as the basis for defining a strategy and operational programs to benefit vulnerable groups. This is a two-dimensional issue:
The first task is to ensure that sectoral strategies and programs are better targeted to meet the needs of the poorest segments of the population.
The second task is to organize more specific actions to benefit the disabled, orphans, and
the urban unemployed, as well as women, who play a critical role not only in the economy, but also in family health and childhood education.
Regarding the first initiative, additional efforts should be made to improve economic performance and social services to benefit the poorest. Recent GDP growth barely affected the rural sector, in which a large part of the poorest segments of the population live and work. Poor families shoulder a relatively heavy burden in terms of the cost of primary education, and the most vulnerable regions are those where the lack of qualified personnel seriously compromises the availability and quality of health services. In terms of initiatives to benefit the disabled, orphans, and the urban unemployed, it is primarily NGOs, particularly those that are well-established at the local level, that are best able to manage programs targeting the specific problems experienced by these segments of society. Nevertheless, a public sector-NGO partnership could make it easier to define and implement coherent strategies that would serve as frameworks for NGO action. Regarding women’s issues, huge steps have been taken to better integrate women into national economic and social activities. In particular, school enrollment for girls has increased and efforts have been made to improve maternal and child health. The measures planned to develop microfinance could have a significant impact on the economic activity and lives of women. The adoption of the new Family and Individual Persons Code could also play a key role in improving the lives of women.

50
VII. IMPLEMENTATION OF THE NPRS – ENVIRONMENTAL PROTECTION
Poverty reduction also involves protecting ecosystems and the environment. In a country such as Chad, protecting natural resources—forests, grasslands, water resources, and arable land—is essential for the continuance of core economic activities and for meeting the priority needs of families. Long-standing legal and regulatory provisions protect the forests and biodiversity, but these laws are little respected. The population places enormous pressure on forested areas (firewood and encroaching farmland) and it is very difficult to prevent poaching, overlogging, and uncontrolled brush fires. The energy problem is central to environmental protection policies. Wood fuels (wood and charcoal) provide 90 percent of the energy consumed in Chad. Gas consumption is on the rise, growing from 69 metric tons in 1999 to 367 metric tons in 2004, but only a small percentage of the population uses this type of energy. Fewer than 11,000 households are equipped with gas heaters, and 90 percent of those households are located in N’Djamena. The measures taken to better organize migratory herds should have positive environmental effects, in terms of both protecting crops and better organizing the movement of livestock during the dry season. Restoring and safeguarding the ecosystem Natural resources in general and forestry resources in particular remain fragile and have suffered severe degradation under the combined effects of major cyclical droughts and the direct or indirect harmful actions of man (large-scale clearing of land, late and repeated brush fires, overgrazing, overlogging, and so on). Protected forests, game reserves, national parks, no-logging areas, and forest plantations have undergone considerable destruction because of itinerant farmers, intensive poaching, overlogging, brush fires, village settlements, roads, and the like. It is still not clear how much area is covered by natural forests or has been replanted in Chad, for lack of a complete forest inventory. The overall area of natural forests is estimated at 23.5 million hectares and is distributed as follows: - Closed forests, gallery forests 21,000 ha- Open forests, wooded savannahs 3,626,000 ha- Tree communities 9,421,000 ha- Shrub communities 10,192,000 ha
In addition to these natural forests, there are 15,000 hectares of reforested land spread across the country; there are also 41,400 hectares of national parks and 11,080,000 hectares of game reserves.

51
There are significant ground and underground water resources spread throughout the entire country in the form of rivers, lakes, ponds, and flood plains. However, these resources are constantly being degraded. As for plants, the plant inventories are now outdated. Vegetation maps have been drawn up, with an emphasis on grazing potential. There are about 84 million hectares of natural pastureland, most of which are not subject to rationalized exploitation. Given the severe degradation of natural resources, Chad is now obliged to take legal and regulatory measures to restore and protect its ecosystems and environment. Specifically, it will implement Law 14/PR/98, the aim of which is to hold individuals responsible, individually or as part of traditional institutions or associations. This law defines the general principles of environmental protection.
• Environmental education; • Protection of human settlements; • Protection of the country’s natural heritage and environment; • Pollutants and environmental nuisances; • Environmental assessment and emergency plans; and • Environmental management instruments.
Restoring and safeguarding ecosystems also requires implementation of the programs, agreements, and treaties signed and ratified by Chad. The government needs to allocate the resources necessary for these purposes, notably the project for water transfer from the Ubangui River into Lake Chad. An environmental impact study must be required for each project, whether public or private, that is likely to have an impact on the natural, socioeconomic, or human environment.

52
VIII. OUTLOOK AND RECOMMENDATIONS
8.1 Provisional Assessment of Economic Policies and Implementation of the NPRS
Overall, the assessment is positive, but much remains to be done to win the battle of poverty reduction and effect a radical change in the lives of the poor through rapid expansion of the primary sector and other economic activities of interest to the poor, as well as through developing high quality social services. The greatest success, obviously, is the development of the oil industry and its impact on growth. In order to achieve this, Chad—with the support of its partners—had to create conditions conducive to this project, which, ten years before, seemed highly unlikely, given the huge cost of the infrastructure necessary for this investment. Chad now has good reason to hope that this initial investment will be followed by many more, inasmuch as the exploration underway confirms the existence of substantial reserves and the government has been keeping its commitments and is pursuing efforts to improve the business climate. Admittedly, recent cash flow crises show that the expansion in oil production is not a panacea. Today, as before, prudent revenue forecasts, careful management of public expenditure, and the financial support of the international community are still critical to a sustainable improvement in the fiscal situation. The fact remains, nevertheless, that even within the framework of careful financial management, Chad will have additional resources that it will be able to allocate on a priority basis to the economic and social development of the country and to poverty reduction. Oil has enabled Chad to experience two-digit growth, which is unprecedented. Even though a significant share of this growth finances the payment of dividends on foreign capital, a large share remains in the country and stimulates non-petroleum activities that benefit the players in Chad’s economy. The biggest disappointment has been that this growth has not yet succeeded in stimulating production and incomes among farmers, stockbreeders, and families living in rural areas, who account for 80 percent of the Chadian population and certainly an even larger share of the poorest segments of the population. Unavoidable external shocks –insufficient rainfall and locust plagues—are the main factors explaining the recent stagnation of the rural economy. Nonetheless, expansion, diversification, consolidation, and modernization of the rural economy are the main challenges facing Chad. The development of this sector will for a long time be one of the highest poverty reduction priorities. The report showed how the development of the primary sector and sustainable growth of the economy also required a massive and constant effort on the part of the government and its partners to open up the country, reduce transport costs, implement an infrastructure program (access to water, energy, and telecommunications) focused on the economic and social development priorities for the country as a whole and on poverty reduction. Significant efforts have been made in this area. However, the effectiveness of the infrastructure program also depends on the quality of the maintenance work, elimination of bottlenecks in the free circulation of goods and persons, and, in a more general way, effective economic and financial management of the sectors in question. The social sectors—especially education and health—are also critical to the sustainable development of Chad’s economy. Unlike the situation in several other very poor countries, demand for education is heavy and the government has made human resource development a major priority. Spectacular results were obtained in this area, which reflect the progress made in improving the main sectoral indicators (mainly very high enrollment rates for boys as well as a

53
clear improvement in the enrollment of girls). Progress made in these areas is even more important because they are also a condition for the success of many other priority activities, notably health, family planning, and nutrition. Nonetheless, even in this sector, the results obtained will remain partial and unreliable as long as the development of basic education is not further geared toward an improvement in quality. Significant efforts have also been made to improve healthcare access indicators. However, the construction of hospitals and health centers will not yield tangible results unless there is an improvement in infrastructure management, unless there is an increase in utilization, and unless cost recovery methods are mindful first and foremost of the poorest of the poor. As in most countries of the region, effective economic and social management of health services is a formidable task, which will require the government and its partners to redouble their efforts. Consultations with the public conducted as part of the preparation of the NPRS pointed to the importance that Chadians—especially the poor—attach to governance. Even in this area, considerable progress has been made. Deficits have been reduced and public expenditure was restructured to help the priority sectors. In this area, some of the quantitative objectives of the NPRS (share of public expenditure allocated to individual sectors) were not all met. Yet, the most important thing is not the mechanical implementation of sometimes unrealistic objectives, but the fact that the policies and outcomes are moving in the right direction and prompt hopes of lasting improvement in the economic and social situation within the framework of a very long term view of development. Nevertheless, governance is not only about restructuring public expenditure, it is also about transparency in financial management, the effectiveness of government agencies, judicial reform, the security of people and property, and the redefinition of the role and resources of the military. In all these areas, constructive debates have been organized and worthwhile strategies have been defined. The challenge for the future is to implement them effectively.
8.2 Recommendations
Preparation of the second follow-up report to the NPRS comes slightly ahead of a more ambitious exercise, that of a revision of the Strategy. This revision will be based on a participatory process that will make it possible to better appreciate how development stakeholders, civil society, and concerned communities perceive the efforts already made to reduce poverty and establish effective and high quality public services. Already, some of the new approaches that will have to be adopted in the second NPRS to meet the challenges of economic and social development and poverty reduction are becoming clear. The main shortcomings of the first NPRS can be summarized as follows:
a) Despite the intensity of the initial consultations, the messages of the NPRS have not yet been fully integrated into the daily management of national institutions. The NPRS presents an integrated, crosscutting vision of economic, social, and financial policies. However, regardless of how effective the monitoring systems may be, the objectives of the NPRS will never be truly operational until the sectoral ministries and development stakeholders fully incorporate the objectives of the strategy into their sectoral and institutional priorities and their budgets.

54
b) The twofold problem is that not only must the sectors and institutions internalize the objectives of the NPRS, the NPRS must also be enriched and made operational and the overall objectives of the strategy must be parlayed into specific institutional and sectoral programs based on the national policies approved by all the departments involved and on realistic performance indicators.
c) Lastly, it is essential that the international community continue to play an active part in
implementing the sectoral strategies underpinning the NPRS and recognize that although Chad may be an oil-rich country, it is still a poor country with limited resources that needs major external assistance to finance its development.
d) Specific activities, such as protecting vulnerable groups, are unlikely to be accomplished
by the public sector. In this area, nongovernmental organizations—firmly established at the grassroots level—are often better placed than the official administrations to deliver services on an ad-hoc basis, considering the actual circumstances of the individuals in the direst need. Social protection strategies defined with the assistance of civil society would facilitate establishment of a partnership between official departments, local government authorities, and nongovernmental organizations.
Considerable progress has been made in several of these areas.
a) The report notes the efforts made by most sectoral ministries to define and update increasingly specific sectoral strategies and gradually build poverty reduction into their priorities. Nevertheless, this critical task has not yet been completed.
b) In fact, operationalization of the NPRS will not be fully completed until sectoral
strategies that build in poverty reduction objectives become the main tools for fiscal decisions. Most ministries have been preparing program budgets, but the budgets that are approved and adopted are but a poor reflection of the priorities in the program budgets. In this regard, the identification and classification of poverty-reducing expenditures may prove to be an important tool for ensuring that the strategy and the budget are consistent.
c) Lastly, it is important to continue and intensify the dialogue between the government and
the international community to better coordinate national programs and development aid. The first follow-up report recommended holding a roundtable meeting of donors and creditors around the themes of the NPRS. This recommendation remains valid and is worth retaining.
Throughout the validation workshop, which took place December 19-20, 2005, the following recommendations were voiced by the participants:
a) Establish a strategy for monitoring the standards of imported seeds and food of suspect quality, given the widespread existence of genetically modified foods and crops (GM);
b) Boost production of gum arabic, which accounts for a large share of national production; c) Allow certain ministries such as mines and geology, tourism, and housing to play a
leading role in the PRSP2; d) Ensure that good governance measures are effectively applied; e) Combat widespread impunity, especially corruption, and strengthen the judiciary; f) Establish a Ministry in Charge of Government Oversight and Ethics as a State Ministry
and provide it with the appropriate resources to discharge its mandate;

55
g) Combat desertification and protect the environment by effectively implementing the provisions governing the protection of plants and wildlife;
h) Make domestic gas available at a reduced cost, so as to curb the use of wood charcoal by urban households.
8.3 Timing of the revision of the NPRS
It is therefore important to undertake the preparatory work for the revision of the NPRS under the best possible conditions. Granted, it is not a question of modifying fundamentally the orientations of the strategies but to fine-tune certain objectives and operationalize them. An agreement must therefore be struck between the government and its partners on the timing of this revision. The schedule must therefore be realistic. For these reasons:
a) It is important that for purposes of the revision of the strategy, the analysis of the final results of ECOSIT 2 on poverty profiles, data on household situations, and the incidence of poverty by region be available. These data are essential to better target the actions proposed.
b) It will be necessary to undertake a systematic re-reading of the sectoral strategies and assess both their effectiveness and their consistency with the objectives of the national strategy. It is the integration of these strategies that will enable us to provide a more accurate operational content in the second version of the NPRS.
c) It will be necessary to undertake a study on the sources of growth and their impact on poverty.
Revision of the NPRS will therefore be a relatively intensive activity, which is likely to last all of 2006.

56
ANNEXES

57
Ann
ex 1
: T
able
of p
ro-p
oor
expe
nditu
re in
Cha
d

58
2005
Bud
get
Act
ual
Bud
get
Act
ual
Bud
get
Act
ual
Bud
get
Act
ual
Bud
get
Bud
get
Act
ual
Bud
get
Act
ual
15,0
10
14
,675
16,0
19
15
,653
25,5
30
19
,321
20,2
28
19
,702
26,1
51
19
%11
%20
,588
17,3
38
9,60
2
8,37
8
9,53
7
9,
411
10,9
69
8,
805
16,5
23
8,
736
11,5
94
9%
2%11
,645
8,83
3
24,6
12
23
,053
25,5
56
25
,064
36,4
99
28
,126
36,7
51
28
,438
37,7
45
13
%7%
32,2
33
26
,170
6,
764
7,
062
13
,468
1,12
4
21
,330
19,1
23
30
,848
19,1
62
32
,211
52%
506%
20,9
24
11
,618
68
6
68
6
1,
124
1,12
4
3,
692
1,99
9
6,
809
2,46
2
95
2
0.
1%0.
1%0.
1%0.
1%0.
0%0.
0%0.
3%0.
2%31
,376
30,1
15
39
,024
26,1
88
57
,829
47,2
49
67
,599
47,6
00
69
,956
23%
23%
53,1
57
37
,788
3.
2%3.
0%3.
2%2.
1%4.
7%3.
8%5.
5%3.
9%9.
8%13
.3%
11.0
%7.
8%16
.9%
13.9
%15
.2%
14.5
%14
.9%
7,26
8
7,64
5
8,26
3
8,
072
9,90
2
9,
308
10,0
75
11
,284
11,1
22
11
%14
%9,
326
9,07
7
2,08
2
1,87
0
1,63
7
1,
012
1,22
2
98
1
2,63
3
27
1
3,16
5
22
%-4
0%2,
148
1,03
4
9,35
0
9,51
5
9,90
0
9,
084
11,1
24
10
,289
12,7
08
11
,555
14,2
87
11
%7%
11,4
74
10
,111
6,
122
5,
411
7,
151
2,46
7
10
,585
9,49
5
19
,745
3,49
5
19
,858
38%
56%
12,6
92
5,
217
3,
692
1,99
9
5,
447
1,82
8
50
0
0.
0%0.
0%0.
0%0.
0%0.
0%0.
0%0.
3%0.
2%15
,472
14,9
26
17
,051
11,5
51
21
,709
19,7
84
32
,453
15,0
50
34
,145
23%
8%24
,166
15,3
28
1.6%
1.5%
1.4%
0.9%
1.8%
1.6%
2.6%
1.2%
4.8%
6.6%
4.8%
3.4%
6.4%
5.8%
7.3%
4.6%
7.3%
3,39
1
2,92
4
3,66
6
3,
666
5,29
5
4,
111
6,13
3
5,
560
5,48
3
14
%24
%4,
794
4,06
5
6,19
2
5,42
5
7,87
7
6,
516
9,01
1
7,
760
9,34
3
7,
424
6,91
7
5%
12%
7,86
8
6,
781
9,
583
8,
349
11
,543
10,1
82
14
,306
11,8
71
15
,476
12,9
84
12
,400
8%16
%12
,662
10,8
47
10,8
62
7,
594
15
,529
1,10
2
19
,102
17,1
58
24
,512
18,7
36
24
,224
23%
460%
18,8
46
11
,148
1,
102
1,10
2
1,
458
1,45
8
6,
227
1,75
7
64
0
0.
0%0.
0%0.
1%0.
1%0.
0%0.
0%0.
1%0.
1%20
,445
15,9
43
27
,072
11,2
84
33
,408
29,0
29
39
,988
31,7
20
36
,624
17%
46%
31,5
07
21
,994
2.
1%1.
6%2.
2%0.
9%2.
7%2.
4%3.
2%2.
6%6.
4%7.
1%7.
6%3.
3%9.
8%8.
6%9.
0%9.
7%7.
8%
846
705
1,12
2
1,
122
1,28
4
97
1
1,52
0
1,
245
1,37
7
14
%25
%1,
230
1,01
1
1,38
4
951
1,70
1
1,
677
1,43
9
1,
243
1,53
9
1,
245
1,49
4
3%
17%
1,51
1
1,
279
2,
230
1,
656
2,
823
2,79
9
2,
723
2,21
4
3,
059
2,49
0
2,
871
7%20
%2,
741
2,29
0
1,45
4
904
5,48
5
25
5
1,81
5
1,
175
2,08
2
1,
009
6,06
5
10
4%92
%3,
380
836
255
25
5
1,50
1
1,
009
1,54
0
65
9
316
0.0%
0.0%
0.0%
0.0%
0.0%
0.0%
0.1%
0.1%
3,68
4
2,56
0
8,30
8
3,
054
4,53
8
3,
389
5,14
1
3,
499
8,93
6
42
%11
%6,
121
3,12
6
0.4%
0.3%
0.7%
0.2%
0.4%
0.3%
0.4%
0.3%
1.2%
1.1%
2.3%
0.9%
1.3%
1.0%
1.2%
1.1%
1.9%
Tota
lA
s a %
of G
DP
As a
% o
f tot
al e
xpen
ditu
re
Cur
rent
exp
endi
ture
Cap
ital e
xpen
ditu
reO
f whi
ch o
wn
finan
cing
As a
% o
f GD
P
As a
% o
f tot
al e
xpen
ditu
reSo
cial
Act
ion
Wag
es a
nd sa
larie
sO
ther
ope
ratin
g ex
pens
es
Of w
hich
ow
n fin
anci
ngA
s a %
of G
DP
Tota
lA
s a %
of G
DP
Wag
es a
nd sa
larie
sO
ther
ope
ratin
g ex
pens
esC
urre
nt e
xpen
ditu
reC
apita
l exp
endi
ture
Tota
lAs
a p
erce
ntag
e of
GD
PAs
a %
of t
otal
exp
endi
ture
Hea
lthCur
rent
exp
endi
ture
Cap
ital e
xpen
ditu
reO
f whi
ch o
wn
finan
cing
As a
% o
f GD
P
As a
% o
f tot
al e
xpen
ditu
reO
f whi
ch b
asic
edu
catio
nW
ages
and
sala
ries
Oth
er o
pera
ting
expe
nses
Of w
hich
ow
n fin
anci
ngA
s a %
of G
DP
Tota
lA
s a %
of G
DP
Wag
es a
nd sa
larie
sO
ther
ope
ratin
g ex
pens
esC
urre
nt e
xpen
ditu
reC
apita
l exp
endi
ture
Edu
catio
n
2001
2002
2003
2004
TA
AM
Ave
rage
200
3-20
04In
mill
ions
of C
FAF
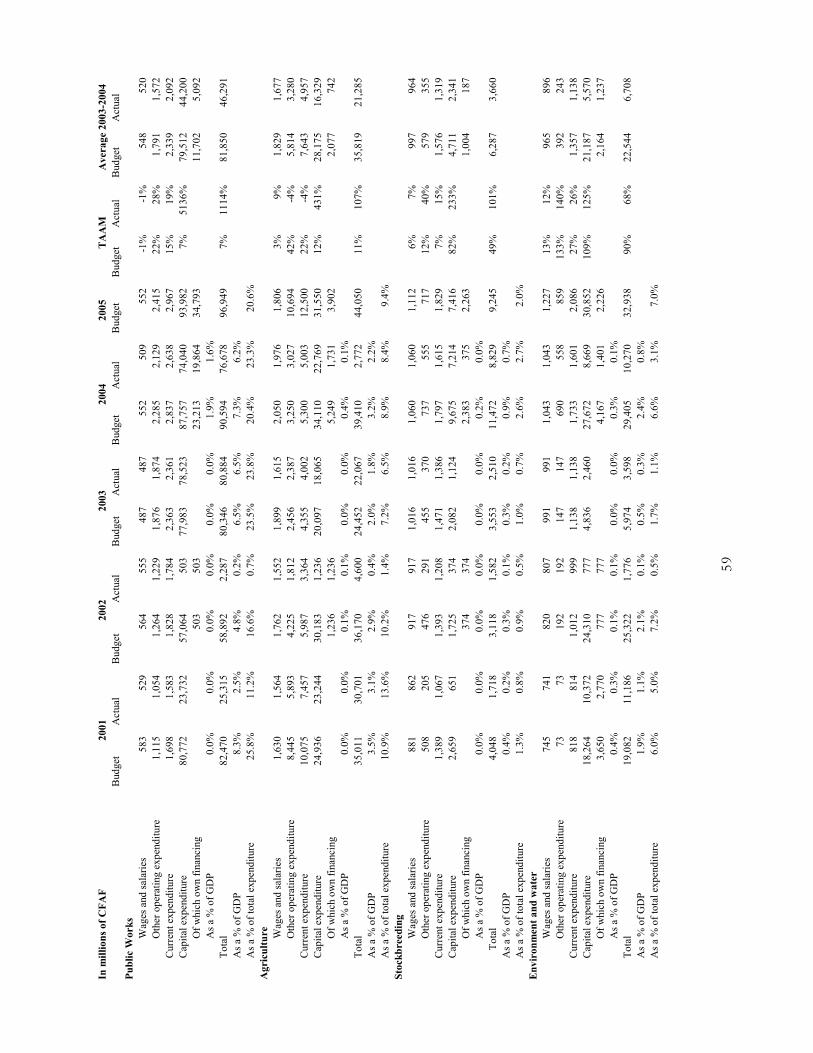
59
2005
Bud
get
Act
ual
Bud
get
Act
ual
Bud
get
Act
ual
Bud
get
Act
ual
Bud
get
Bud
get
Act
ual
Bud
get
Act
ual
583
52
9
564
55
5
48
7
48
7
55
2
50
9
55
2
-1
%-1
%54
8
52
0
1,
115
1,05
4
1,
264
1,22
9
1,87
6
1,87
4
2,28
5
2,12
9
2,41
5
22%
28%
1,79
1
1,57
2
1,69
8
1,
583
1,82
8
1,
784
2,
363
2,
361
2,
837
2,
638
2,
967
15
%19
%2,
339
2,
092
80
,772
23
,732
57
,064
50
3
77
,983
78,5
23
87
,757
74
,040
93
,982
7%
5136
%79
,512
44
,200
503
50
3
23
,213
19
,864
34
,793
11
,702
5,
092
0.
0%0.
0%0.
0%0.
0%0.
0%0.
0%1.
9%1.
6%82
,470
25
,315
58
,892
2,
287
80
,346
80,8
84
90
,594
76
,678
96
,949
7%
1114
%81
,850
46
,291
8.3%
2.5%
4.8%
0.2%
6.5%
6.5%
7.3%
6.2%
25.8
%11
.2%
16.6
%0.
7%23
.5%
23.8
%20
.4%
23.3
%20
.6%
1,63
0
1,
564
1,76
2
1,
552
1,
899
1,
615
2,
050
1,
976
1,
806
3%
9%1,
829
1,
677
8,
445
5,89
3
4,
225
1,81
2
2,45
6
2,38
7
3,25
0
3,02
7
10,6
94
42%
-4%
5,81
4
3,28
0
10,0
75
7,45
7
5,
987
3,36
4
4,35
5
4,00
2
5,30
0
5,00
3
12,5
00
22%
-4%
7,64
3
4,95
7
24,9
36
23,2
44
30,1
83
1,23
6
20,0
97
18
,065
34,1
10
22,7
69
31,5
50
12%
431%
28,1
75
16,3
29
1,
236
1,23
6
5,24
9
1,73
1
3,90
2
2,07
7
742
0.0%
0.0%
0.1%
0.1%
0.0%
0.0%
0.4%
0.1%
35,0
11
30,7
01
36,1
70
4,60
0
24,4
52
22
,067
39,4
10
2,77
2
44,0
50
11%
107%
35,8
19
21,2
85
3.
5%3.
1%2.
9%0.
4%2.
0%1.
8%3.
2%2.
2%10
.9%
13.6
%10
.2%
1.4%
7.2%
6.5%
8.9%
8.4%
9.4%
881
86
2
917
91
7
1,
016
1,
016
1,
060
1,
060
1,
112
6%
7%99
7
96
4
50
8
205
47
6
291
455
370
737
555
717
12%
40%
579
355
1,38
9
1,
067
1,39
3
1,
208
1,
471
1,
386
1,
797
1,
615
1,
829
7%
15%
1,57
6
1,31
9
2,65
9
65
1
1,72
5
37
4
2,
082
1,
124
9,
675
7,
214
7,
416
82
%23
3%4,
711
2,
341
37
4
374
2,38
3
375
2,26
3
1,00
4
187
0.0%
0.0%
0.0%
0.0%
0.0%
0.0%
0.2%
0.0%
4,04
8
1,
718
3,11
8
1,
582
3,
553
2,
510
11
,472
8,
829
9,
245
49
%10
1%6,
287
3,
660
0.
4%0.
2%0.
3%0.
1%0.
3%0.
2%0.
9%0.
7%1.
3%0.
8%0.
9%0.
5%1.
0%0.
7%2.
6%2.
7%2.
0%
745
74
1
820
80
7
99
1
99
1
1,
043
1,
043
1,
227
13
%12
%96
5
89
6
73
73
19
2
192
147
147
690
558
859
133%
140%
392
243
818
81
4
1,01
2
99
9
1,
138
1,
138
1,
733
1,
601
2,
086
27
%26
%1,
357
1,
138
18
,264
10
,372
24
,310
77
7
4,
836
2,
460
27
,672
8,
669
30
,852
10
9%12
5%21
,187
5,
570
3,
650
2,77
0
77
7
777
4,16
7
1,40
1
2,22
6
2,16
4
1,23
7
0.4%
0.3%
0.1%
0.1%
0.0%
0.0%
0.3%
0.1%
19,0
82
11,1
86
25,3
22
1,77
6
5,97
4
3,59
8
29,4
05
10,2
70
32,9
38
90%
68%
22,5
44
6,70
8
1.9%
1.1%
2.1%
0.1%
0.5%
0.3%
2.4%
0.8%
6.0%
5.0%
7.2%
0.5%
1.7%
1.1%
6.6%
3.1%
7.0%
As a
% o
f GD
PA
s a %
of t
otal
exp
endi
ture
Cur
rent
exp
endi
ture
Cap
ital e
xpen
ditu
reO
f whi
ch o
wn
finan
cing
As a
% o
f GD
P
Env
iron
men
t and
wat
erW
ages
and
sala
ries
Oth
er o
pera
ting
expe
nditu
re
Tota
lAs a
% o
f GD
PTo
tal
As a
% o
f GD
PA
s a %
of t
otal
exp
endi
ture
Wag
es a
nd sa
larie
s
Cur
rent
exp
endi
ture
Cap
ital e
xpen
ditu
reO
f whi
ch o
wn
finan
cing
Cur
rent
exp
endi
ture
Cap
ital e
xpen
ditu
re
As a
% o
f tot
al e
xpen
ditu
reSt
ockb
reed
ing
Of w
hich
ow
n fin
anci
ngA
s a %
of G
DP
Tota
lA
s a %
of G
DP
As a
% o
f tot
al e
xpen
ditu
reA
gric
ultu
re Wag
es a
nd sa
larie
sO
ther
ope
ratin
g ex
pend
iture
Of w
hich
ow
n fin
anci
ngA
s a %
of G
DP
Tota
lA
s a %
of G
DP
Wag
es a
nd sa
larie
sO
ther
ope
ratin
g ex
pend
iture
Cur
rent
exp
endi
ture
Cap
ital e
xpen
ditu
re
2004
TA
AM
Ave
rage
200
3-20
04
Oth
er o
pera
ting
expe
nditu
re
In m
illio
ns o
f CFA
F20
0120
0220
03
Publ
ic W
orks

60
2005
Bud
get
Act
ual
Bud
get
Act
ual
Bud
get
Act
ual
Bud
get
Act
ual
Bud
get
Bud
get
Act
ual
Bud
get
Act
ual
29
29
31
31
180
129
185
185
218
127%
122%
129
94
7
7
32
32
341
299
507
446
839
359%
414%
345
19
6
36
36
63
63
521
428
692
631
1,05
7
222%
234%
474
29
0
--
19,2
60
2,
889
2,
416
2,
358
11
,840
8,19
4
7,83
4
8,27
0
3,
360
--
--
3,42
2
2,36
5
3,60
4
1,40
5
59
1
0.0%
0.0%
0.0%
0.0%
0.0%
0.0%
0.3%
0.2%
36
36
19,3
23
2,
952
2,
937
2,
786
12
,532
8,82
5
8,89
1
1344
7%27
70%
8,74
4
3,
650
0.0%
0.0%
1.6%
0.2%
0.2%
0.2%
1.0%
0.7%
0.0%
0.0%
5.5%
0.9%
0.9%
0.8%
2.8%
2.7%
1.9%
1,07
3
720
1,16
9
1,12
7
1,28
7
1,15
9
1,33
3
1,33
3
1,52
7
9%25
%1,
278
1,08
5
85
2
2,
700
86
1
82
2
88
2
88
2
91
3
75
2
88
8
1%
-26%
879
1,
289
1,92
5
3,42
0
2,03
0
1,94
9
2,16
9
2,04
1
2,24
6
2,08
5
2,41
5
6%-1
2%2,
157
2,37
4
88
1
32
2
1,
290
89
4
1,
286
55
3
82
6
51
7
89
8
5%
44%
1,03
6
57
2
894
894
826
517
898
524
35
3
0.0%
0.0%
0.1%
0.1%
0.0%
0.0%
0.1%
0.0%
2,80
6
3,74
2
3,32
0
2,84
3
3,45
5
2,59
4
3,07
2
2,60
2
3,31
3
5%-1
1%3,
193
2,94
5
0.
3%0.
4%0.
3%0.
2%0.
3%0.
2%0.
2%0.
2%0.
9%1.
7%0.
9%0.
8%1.
0%0.
8%0.
7%0.
8%0.
7%31
9,74
7
225,
581
35
4,05
7
337,
796
34
1,73
7
339,
146
44
3,56
0
328,
664
47
0,61
2
11%
16%
385,
943
30
7,79
7
GD
P
Wag
es a
nd sa
larie
s24
,188
22,7
49
26
,070
25,4
30
37
,969
29,8
00
34
,104
32,6
13
39
,453
15%
13%
32,3
57
27,6
48
Oth
er o
pera
ting
expe
nditu
re28
,178
24,6
86
26
,165
21,9
82
27
,576
23,7
67
35
,787
24,8
72
36
,417
7%1%
30,8
25
23,8
27
52,3
66
47
,435
52,2
35
47
,412
65,5
45
53
,567
69,8
91
57
,485
75,8
70
10
%7%
63,1
81
51,4
75
146,
592
73
,881
168,
314
9,
154
15
0,94
7
140,
539
22
9,32
2
160,
310
23
5,03
2
15%
454%
186,
041
95
,971
4,
336
3,
456
6,
265
6,
265
-
-45
,991
30,7
19
62
,262
23,7
55
10,1
10
As a
% o
f GD
P0.
4%0.
3%0.
5%0.
5%0.
0%0.
0%3.
7%2.
5%19
8,95
8
121,
316
22
0,54
9
56,5
66
21
6,49
2
194,
106
29
9,21
3
217,
795
31
0,90
2
13%
67%
249,
223
14
7,44
6
20.0
%12
.2%
17.9
%4.
6%17
.5%
15.7
%24
.2%
17.6
%62
.2%
53.8
%62
.3%
16.7
%63
.4%
57.2
%67
.5%
66.3
%66
.1%
1,23
5,00
0
Tota
l prio
rity
pove
rty se
ctor
s99
5,00
0
1,
235,
000
1,
235,
000
Cap
ital e
xpen
ditu
re
As a
% o
f tot
al e
xpen
ditu
re
Tota
lA
s a %
of G
DP
Cur
rent
exp
endi
ture
Of w
hich
ow
n fin
anci
ng
As a
% o
f tot
al e
xpen
ditu
reT
otal
Pub
lic e
xpen
ditu
re (e
xclu
ding
…)
Of w
hich
ow
n fin
anci
ngA
s a %
of G
DP
Tota
lA
s a %
of G
DP
Wag
es a
nd sa
larie
sO
ther
ope
ratin
g ex
pend
iture
Cur
rent
exp
endi
ture
Cap
ital e
xpen
ditu
re
Tota
lA
s a %
of G
DP
As a
% o
f tot
al e
xpen
ditu
reJu
stic
eCur
rent
exp
endi
ture
Cap
ital e
xpen
ditu
reO
f whi
ch o
wn
finan
cing
As a
% o
f GD
P
Lan
d de
velo
pmen
tW
ages
and
sala
ries
Oth
er o
pera
ting
expe
nditu
re
In m
illio
ns o
f CFA
FT
AA
MA
vera
ge 2
003-
2004
2001
2002
2003
2004

61
Ann
ex 2
: Pro
duct
ion
of m
ajor
cro
ps
Y
ears
C
rops
( M
etric
tons
) 19
99 -
2000
20
00 -
2001
20
01 -
2002
20
02 -
2003
20
03 -
2004
20
04 -
2005
Pear
l mill
et
361,
095
258,
828
397,
608
357,
425
516,
341
297,
529
Sorg
hum
45
5,63
439
1,71
449
7,22
748
0,68
656
4,71
744
9,42
7 B
ereb
ere
174,
781
119,
284
205,
025
48,7
0028
7,41
926
5,94
9 Pa
ddy
rice
15
8,28
296
3,12
011
2,16
713
4,88
012
6,02
491
,083
W
heat
3,
585
2,68
83,
562
4,00
02,
890
- M
aize
94
,151
64,0
1410
5,29
584
,349
117,
978
107,
422
Foni
o 2,
270
363
1,17
235
02,
770
1,97
9 T
otal
cer
eals
1,
229,
813
929,
515
1,32
2,05
61,
217,
140
1,61
8,13
9 1
,212
,904
G
roun
dnut
s 21
,218
33,0
1444
8,08
937
9,96
841
4,86
838
5,10
3 Se
sam
e se
eds
371,
852
358,
791
448,
089
24,4
9321
,062
17,5
48
Oils
eeds
(Tot
al)
393,
070
391,
805
491,
479
444,
560
436,
028
402,
651
Sou
rce
DSA

62
Ann
ex 3
: Com
plet
ed m
atri
x of
NPR
S pe
rfor
man
ce in
dica
tors
Are
a In
dica
tor
So
urce
s Pr
oduc
ers
Val
ues
20
03
2004
Yi
eld
per c
rop
EPA
SS
A/D
PA
See
atta
ched
st
atem
ent
See
atta
ched
st
atem
ent
Agr
icul
ture
Farm
mec
hani
zatio
n ra
te
EPA
O
ND
R
24%
24
%
Stoc
k fa
rmin
g N
umbe
r of w
ater
ing
poin
ts d
evel
oped
for l
ives
tock
A
dm. r
epor
ts
DES
/D.H
ydra
ul
25 st
34
p 34
To
tal d
evel
oped
/ref
ores
ted
area
A
dm. r
epor
ts
MEE
24
%
24%
Ar
ea c
over
ed b
y pr
otec
ted
natu
ral g
row
th
Adm
. rep
orts
M
EE
Na9
Na
E
nvir
onm
ent
Prop
ortio
n of
fore
sted
are
as
Adm
. rep
orts
M
EE
Na
Na
Dri
nkin
g w
ater
Ac
cess
to d
rink
ing
wat
er
Perio
d an
alys
is
MEE
/SD
EA
32%
36
%
Prop
ortio
n of
hou
seho
lds w
ith a
cces
s to
elec
tric
ity
ECO
SIT/
RG
PHT
INSE
ED
Na
Na
Prop
ortio
n of
hou
seho
lds w
ith g
as c
ooki
ng st
ove
Surv
ey
Dir/
ener
gy,
INSE
ED
9.5%
° N
a E
nerg
y
Prop
ortio
n of
hou
seho
lds u
sing
woo
d ch
arco
al fo
r co
okin
g
Surv
ey
Dir.
/fore
stry
, IN
SEED
N
a N
a
Adul
t lite
racy
rate
Su
rvey
D
APR
O/M
EN
Na
Na
Gro
ss e
nrol
lmen
t rat
e Sc
hool
stat
istic
s D
APR
O/M
EN
82.5
%
87.5
8%
Rate
of a
dmis
sion
to C
P1
Scho
ol st
atis
tics
DA
PRO
/MEN
90
.8%
10
7%
Prim
ary
scho
ol d
rop-
out r
ate
Scho
ol st
atis
tics
DA
PRO
/MEN
11
.5%
13
.0%
Pr
imar
y sc
hool
com
plet
ion
rate
Sc
hool
stat
istic
s D
APR
O/M
EN
Na
42.6
%
Gir
l/Boy
ratio
(par
ity in
dex)
Sc
hool
stat
istic
s D
APR
O/M
EN
0.65
0.
67
Num
ber o
f new
ly c
reat
ed sc
hool
s Sc
hool
stat
istic
s D
APR
O/M
EN
Edu
catio
n/T
rain
ing/
L
itera
cy
Pr
opor
tion
of tr
aine
d co
mm
unity
teac
hers
Sc
hool
stat
istic
s D
APR
O/M
EN
9 N
ot a
vaila
ble

63
Prim
ary/
seco
ndar
y te
ache
r/st
uden
t rat
io
Scho
ol st
atis
tics
DA
PRO
/MEN
Ra
tio o
f stu
dent
s to
seat
s with
des
ks
Scho
ol st
atis
tics
DA
PRO
/MEN
Ra
tio o
f stu
dent
s/te
xtbo
ok p
er su
bjec
t Sc
hool
stat
istic
s D
APR
O/M
EN
Aver
age
dist
ance
trav
eled
to re
ach
the
mos
t dis
tant
sc
hool
Sc
hool
stat
istic
s D
APR
O/M
EN
5.
5 km
Shar
e of
cur
rent
edu
catio
n ex
pend
iture
allo
cate
d to
pr
imar
y ed
ucat
ion
Sc
hool
stat
istic
s D
APR
O/M
EN
Imm
uniz
atio
n co
vera
ge a
gain
st d
isea
ses t
arge
ted
by
the
PEV
M
onth
ly a
ctiv
ity
repo
rts
Hea
lth d
istri
cts,
Hea
lth c
ente
rs
BC
G
72%
D
TC3
46.
6%
Polio
3
46.8
%
Mea
sles
61
.2%
Y
ello
w fe
ver
40.4
%
VA
T 2+
10
.3%
BC
G
38.3
%
DTC
3
49.9
%
Polio
3
47.4
%
Mea
sles
55
.8%
Y
ello
w
feve
r 49
.1%
V
AT
2+
13.7
%
Prop
ortio
n of
pro
fess
iona
lly a
ssis
ted
child
birt
hs
SIS
DSI
S/M
SP
19.6
%
In
crea
se in
trea
tmen
t of g
enita
l ulc
ers
SIS
DSI
S/M
SP
Na
Na
Incr
ease
in tr
eatm
ent o
f pur
ulen
t ure
thri
tis
SIS
DSI
S/M
SP
Na
Na
Syph
ilis p
reva
lenc
e ra
te in
pre
gnan
t wom
en
SIS
DSI
S/M
SP
5.8%
N
a M
alar
ia p
reva
lenc
e ra
te
Surv
ey
DSI
S/M
SP
27%
N
a Tu
berc
ulos
is in
cide
nce
rate
Su
rvey
PN
L tu
berc
ulos
is
56 p
100,
000
56p1
00,0
00
Hea
lth c
over
age
rate
SI
S D
SIS/
MSP
73
.4%
N
a Ra
tio o
f inh
abita
nts t
o 1
doct
or
SIS
DSI
S/M
SP
27,0
00
Na
Ratio
of i
nhab
itant
s to
1 st
ate-
cert
ified
nur
se
SIS
DSI
S/M
SP
4,90
0 N
a
Hea
lth
Ratio
of w
omen
of c
hild
bear
ing
age
to 1
mid
wife
SI
S D
SIS/
MSP
9,
000
Na
Em
ploy
men
t Em
ploy
men
t Suc
cess
rate
St
at. y
earb
ook
ON
APE
/MFP
T N
a 9.
99%
M
acro
econ
omic
Ra
te o
f inf
latio
n Ec
on.d
iges
ts
INSE
ED
-1.8
%
-5.3
%

64
GD
P gr
owth
rate
Ec
on. d
iges
ts
INSE
ED
15.4
%
33.4
%
GD
P pe
r cap
ita
Econ
. dig
ests
IN
SEED
11
2,40
8 14
1,99
9 In
dust
rial
pro
duct
ion
inde
x Ec
on. d
iges
ts
INSE
ED
100.
6%
91.8
%
Inve
stm
ent r
ate
Econ
. dig
ests
IN
SEED
0.
42%
0.
26%
D
ebt s
ervi
ce/e
xpor
ts
Bal
ance
of
paym
ents
B
EAC
3.
7 1.
3
Leng
th o
f pav
ed n
atio
nal r
oads
(in
km)
Adm
. rep
orts
D
GR
/MI
557
650
Tra
nspo
rt
Leng
th o
f reh
abili
tate
d an
d m
aint
aine
d ru
ral t
rack
s an
d ro
ads
Adm
. rep
orts
D
GR
/MI
2,75
0 km
N
a
Tel
ecom
mun
icat
ions
Pr
opor
tion
of h
ouse
hold
s with
a te
leph
one
Pe
riod
anal
ysis
O
TRT/
MPN
TC
8.6%
° 15
%°
Prop
ortio
n of
une
xecu
ted
cour
t dec
isio
ns
Adm
. rep
orts
M
in. J
ustic
e
Ju
stic
e N
umbe
r of i
nhab
itant
s to
1 ju
stic
e of
the
peac
e A
dm. r
epor
ts
Min
. jus
tice
Num
ber o
f bill
s ini
tiate
d by
par
liam
ent/t
otal
num
ber o
f la
ws p
asse
d
Adm
. rep
orts
N
at. A
ssem
bly
Po
litic
al g
over
nanc
e
Prop
ortio
n of
wom
en in
gov
ernm
ent a
nd p
arlia
men
t A
dm. r
epor
ts
DA
DJO
/SG
G
Nat
. Ass
embl
y
Eco
nom
ic g
over
nanc
e Ra
te o
f suc
cess
ful
arri
val o
f sup
plie
s and
equ
ipm
ent
SSD
D
MIN
/ED
UC
M
IN/S
AN
TE
Cha
nge
in d
omes
tic a
rrea
rs
Cur
rent
stat
istic
s D
ir. D
ebt/M
F
C
hang
e in
ext
erna
l arr
ears
C
urre
nt st
atis
tics
Dir.
Deb
t/MF
Shar
e of
cen
tral
gov
ernm
ent b
udge
t allo
cate
d to
the
sect
ors (
% G
DP)
G
over
nmen
t fin
ance
stat
istic
s D
G/B
UD
GET
IN
SEED
N
a 0.
24%
Fisc
al m
anag
emen
t
Cen
tral
gov
ernm
ent b
udge
t exe
cutio
n ra
te c
ompa
red
with
pay
men
ts
Gov
ernm
ent
finan
ce st
atis
tics
DG
/BU
DG
ET/
Min
. fin
ance
N
a 58
%

65
Ann
ex 4
: Mat
rix
for
mon
itori
ng N
PRS
prio
rity
act
ions
Pilla
rs/O
bjec
tives
A
ctio
ns
Tim
etab
le
Pers
ons i
n ch
arge
Pe
rfor
man
ce in
dica
tors
St
atus
I. Pr
omot
e go
od g
over
nanc
e
A. M
ake
gove
rnm
ent a
genc
ies e
ffec
tive
and
effic
ient
Con
tinue
civ
il se
rvic
e re
form
Pe
rfor
m o
rgan
izat
iona
l and
staf
fing
audi
ts o
f the
prio
rity
min
istri
es
2003
C
ESR
AP
Num
ber o
f prio
rity
min
istri
es a
udite
d
9 m
inis
tries
aud
ited
A
udit
othe
r min
istri
es
2004
C
ESR
AP
Num
ber o
f oth
er m
inis
tries
aud
ited
Not
com
plet
ed
A
pply
aud
it re
sults
20
03-2
004
CES
RA
P N
umbe
r of m
easu
res t
aken
and
ap
plie
d N
ot c
ompl
eted
In
trodu
ce a
n em
ploy
men
t reg
ime
com
patib
le w
ith th
e N
PRS
2003
-200
5 C
ESR
AP
Law
inst
itutin
g em
ploy
men
t fr
amew
ork
ente
rs in
to fo
rce
Not
com
plet
ed
A
pply
the
prin
cipl
e of
mer
it-ba
sed
prom
otio
n
2003
C
ESR
AP
Law
inst
itutin
g m
erit-
base
d pr
omot
ion
ente
rs in
to fo
rce
Not
com
plet
ed
A
pply
the
syst
em fo
r mot
ivat
ing
gove
rnm
ent e
mpl
oyee
s, in
par
ticul
ar in
prio
rity
sect
ors
2003
-200
5 C
ESR
AP
Rev
isio
n of
wag
e sc
ale
for e
duca
tion,
he
alth
, and
oth
er se
ctor
s N
ot c
ompl
eted
Bui
ld c
apac
ity o
f st
akeh
olde
rs in
pub
lic
sect
or, p
rivat
e se
ctor
, and
ci
vil s
ocie
ty
Stre
ngth
en th
e in
stitu
tiona
l cap
aciti
es o
f the
min
istri
es
invo
lved
in im
plem
entin
g re
form
s as w
ell a
s oth
er
min
istri
es
2003
-200
5 SE
NA
REC
and
m
inis
tries
N
umbe
r of m
inis
tries
who
se n
ew
orga
niza
tion
char
ts h
ave
been
ado
pted
an
d im
plem
ente
d
Ong
oing
En
hanc
e th
e pr
ofes
sion
al q
ualif
icat
ions
of c
ivil
serv
ice,
pr
ivat
e se
ctor
, and
civ
il so
ciet
y em
ploy
ees
2003
-200
5 SE
NA
REC
and
m
inis
tries
In
itial
and
in-s
ervi
ce tr
aini
ng
prog
ram
s for
gov
ernm
ent e
mpl
oyee
s de
fined
and
impl
emen
ted
Plan
ning
of D
AA
FM tr
aini
ng o
ngoi
ng
In
trodu
ce a
man
ual o
f pro
cedu
res f
or p
ublic
exp
endi
ture
ex
ecut
ion
2003
M
EF
Man
ual p
repa
red
and
diss
emin
ated
in
min
istri
es
In d
rafti
ng s
tage
B
uild
cap
acity
at t
he G
ener
al F
inan
ce In
spec
tora
te a
nd
the
Aud
it O
ffic
e
2003
-200
5 O
ffic
e of
the
PM,
MEF
, SE
NA
REC
Num
ber o
f per
sonn
el tr
aine
d an
d pr
ovid
ed w
ith a
dequ
ate
wor
king
tool
s O
ngoi
ng
Figh
t cor
rupt
ion
Cre
ate
and
mak
e op
erat
iona
l a st
ruct
ure
for i
nves
tigat
ing
corr
uptio
n ca
ses
2003
-200
5 O
ffic
e of
the
PM,
MJ
Num
ber o
f cor
rupt
ion
case
s in
vest
igat
ed
Ong
oing
B
uild
cap
acity
at t
he G
ener
al F
inan
ce In
spec
tora
te a
nd
the
Aud
it O
ffic
e 20
03-2
005
Off
ice
of th
e PM
, M
EF,
SEN
AR
EC
Ann
ual p
ublic
atio
n of
an
IGF
repo
rt an
d a
repo
rt fr
om th
e A
udit
Off
ice

66
Pi
llars
/Obj
ectiv
es
Act
ions
Ti
met
able
Pe
rson
s in
char
ge
Perf
orm
ance
indi
cato
rs
Stat
us
B. I
mpr
ove
the
lega
l env
iron
men
t C
redi
bilit
y of
the
lega
l sy
stem
C
ondu
ct a
n ex
pend
iture
revi
ew o
f the
just
ice
sect
or
2003
M
inis
try o
f Jus
tice
Rep
ort o
n th
e re
view
of j
ustic
e se
ctor
exp
endi
ture
ava
ilabl
e O
ngoi
ng
In
a p
artic
ipat
ory
man
ner,
prep
are
a ju
stic
e se
ctor
pr
ogra
m (a
fter t
he F
orum
s)
2003
-200
4 M
inis
try o
f Jus
tice
Sect
oral
pro
gram
ado
pted
O
ngoi
ng
In
itiat
e th
e im
plem
enta
tion
of th
e ju
stic
e se
ctor
pro
gram
20
03-2
005
Min
istry
of J
ustic
e In
augu
ral s
emin
ar
G
uara
ntee
the
secu
rity
of
peop
le a
nd p
rope
rty
secu
rity
Out
reac
h to
the
peop
le a
nd to
the
secu
rity
forc
es o
n th
e fu
ndam
enta
l prin
cipl
es o
f hum
an ri
ghts
20
03
Min
istry
of d
efen
se
and
secu
rity
HC
ND
; A
DH
Freq
uenc
y of
and
supp
ort p
rovi
ded
for o
utre
ach
cam
paig
ns
Com
plet
ed
C
arry
out
the
prog
ram
to d
isar
m th
e ci
vilia
n po
pula
tion
2003
M
inis
try o
f def
ense
an
d se
curit
y N
umbe
r of d
isar
mam
ent c
ampa
igns
or
gani
zed
and
of c
ities
dis
arm
ed
Ong
oing
Im
plem
ent t
he N
atio
nal S
trate
gic
Plan
for C
omba
ting
Min
es a
nd U
nexp
lode
d O
rdna
nce.
20
03-2
005
MPD
C, H
CN
D
Land
are
as (k
m) d
emin
ed a
nd
clea
red
of o
rdna
nce
Ong
oing
St
rictly
enf
orce
the
regu
latio
ns o
n be
arin
g ar
ms
2003
-200
5 M
inis
try o
f Pub
lic
Secu
rity
Am
ount
of i
llega
lly b
orne
arm
s re
cove
red
O
ngoi
ng
In
trodu
ce a
cod
e of
con
duct
for m
edia
ting
conf
licts
be
twee
n fa
rmer
s and
live
stoc
k br
eede
rs
2003
-200
5 M
edia
tion
Off
ice,
hu
man
righ
ts
asso
ciat
ions
Cod
e de
velo
ped
and
diss
emin
ated
am
ong
tradi
tiona
l chi
efs
Com
plet
ed
Mak
e th
e na
tiona
l arm
y m
ore
prof
essi
onal
and
tra
nsfo
rm it
into
a
deve
lopm
ent a
rmy
Con
tinue
impl
emen
ting
the
dem
obili
zatio
n an
d re
inte
grat
ion
polic
y 20
03-2
005
Min
istry
of D
efen
se,
MPD
C
Num
ber o
f sol
dier
s dem
obili
zed
and
num
ber o
f sol
dier
s rei
nteg
rate
d Th
e m
ilita
ry fo
rum
s wer
e he
ld in
Apr
il 20
05.
A c
omm
ittee
was
est
ablis
hed
to m
onito
r im
plem
enta
tion
of th
e re
com
men
datio
ns.
Com
plet
e de
cent
raliz
atio
n an
d de
conc
entra
tion
Bui
ld th
e hu
man
and
inst
itutio
nal c
apac
ities
of t
he u
nits
re
spon
sibl
e fo
r dec
entra
lizat
ion
and
deco
ncen
tratio
n 20
04-2
006
Off
ice
of th
e Pr
ime
Min
iste
r/Min
istry
of
Dec
entra
lizat
ion
(MD
)
Te
chni
cal d
epar
tmen
ts o
f the
Min
istry
re
spon
sibl
e fo
r dec
entra
lizat
ion
are
oper
atio
nal.
Pr
epar
e a
mas
ter p
lan
for d
ecen
traliz
atio
n 20
04-2
006
Off
ice
of th
e Pr
ime
Min
iste
r/MD
Plan
pre
pare
d an
d in
pro
cess
of
impl
emen
tatio
n
D
raw
up
and
adop
t the
regu
latio
ns n
eede
d to
impl
emen
t th
e al
read
y va
lidat
ed d
raft
law
. 20
04-2
006
Off
ice
of th
e Pr
ime
Min
iste
r/MD
Com
plet
ed
D
raft
and
final
ize
the
vario
us le
gisl
ativ
e an
d re
gula
tory
pr
ovis
ions
giv
ing
finan
cial
aut
onom
y to
loca
l go
vern
men
ts.
2004
-200
6 O
ffic
e of
the
Prim
e M
inis
ter/M
D
C
ompl
eted
Pr
ovid
e pe
rson
nel t
rain
ing
and
in-s
ervi
ce tr
aini
ng fo
r el
ecte
d of
ficia
ls
2004
-200
6 O
ffic
e of
the
Prim
e M
inis
ter
Min
istry
of
Dec
entra
lizat
ion
M
unic
ipal
per
sonn
el h
ave
not y
et b
een
elec
ted
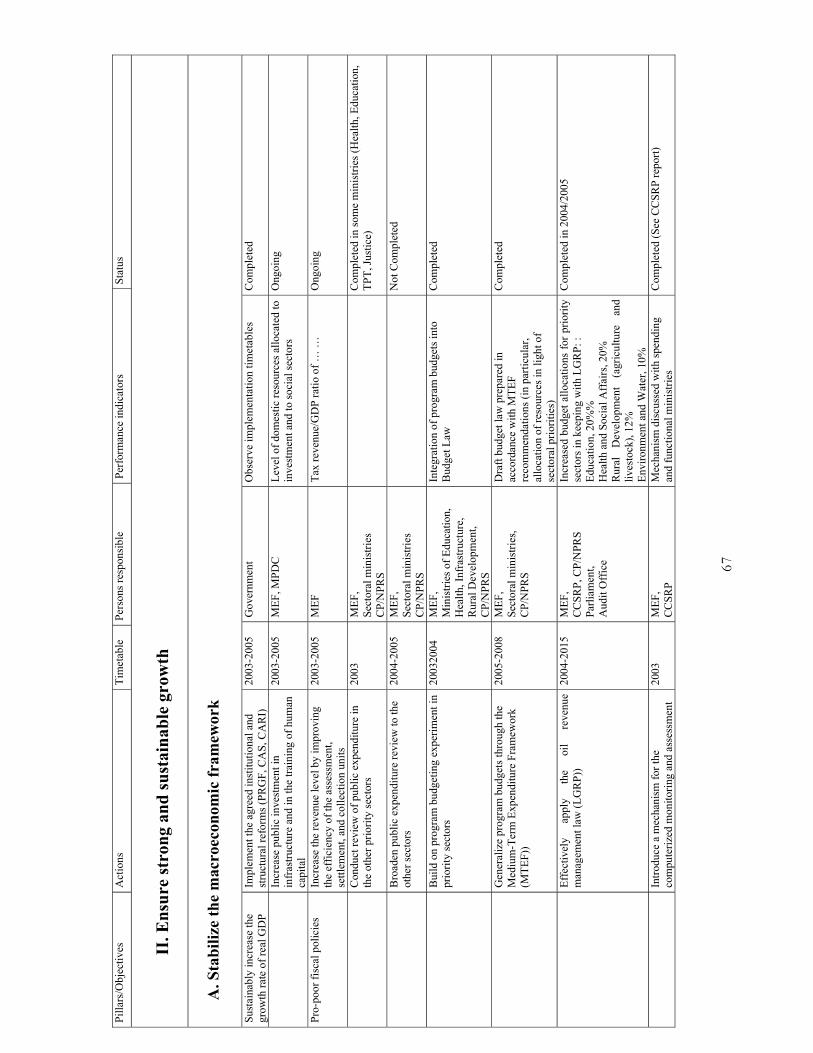
67
Pi
llars
/Obj
ectiv
es
Act
ions
Ti
met
able
Pe
rson
s res
pons
ible
Pe
rfor
man
ce in
dica
tors
St
atus
II. E
nsur
e st
rong
and
sust
aina
ble
grow
th
A. S
tabi
lize
the
mac
roec
onom
ic fr
amew
ork
Su
stai
nabl
y in
crea
se th
e gr
owth
rate
of r
eal G
DP
Impl
emen
t the
agr
eed
inst
itutio
nal a
nd
stru
ctur
al re
form
s (PR
GF,
CA
S, C
AR
I)
2003
-200
5 G
over
nmen
t O
bser
ve im
plem
enta
tion
timet
able
s C
ompl
eted
In
crea
se p
ublic
inve
stm
ent i
n in
fras
truct
ure
and
in th
e tra
inin
g of
hum
an
capi
tal
2003
-200
5 M
EF, M
PDC
Leve
l of d
omes
tic re
sour
ces a
lloca
ted
to
inve
stm
ent a
nd to
soci
al se
ctor
s O
ngoi
ng
Pro-
poor
fisc
al p
olic
ies
Incr
ease
the
reve
nue
leve
l by
impr
ovin
g th
e ef
ficie
ncy
of th
e as
sess
men
t, se
ttlem
ent,
and
colle
ctio
n un
its
2003
-200
5 M
EF
Tax
reve
nue/
GD
P ra
tio o
f … …
O
ngoi
ng
C
ondu
ct re
view
of p
ublic
exp
endi
ture
in
the
othe
r prio
rity
sect
ors
2003
M
EF,
Sect
oral
min
istri
es
CP/
NPR
S
C
ompl
eted
in so
me
min
istri
es (H
ealth
, Edu
catio
n,
TPT,
Just
ice)
B
road
en p
ublic
exp
endi
ture
revi
ew to
the
othe
r sec
tors
20
04-2
005
MEF
, Se
ctor
al m
inis
tries
C
P/N
PRS
N
ot C
ompl
eted
B
uild
on
prog
ram
bud
getin
g ex
perim
ent i
n pr
iorit
y se
ctor
s 20
0320
04
MEF
, M
inis
tries
of E
duca
tion,
H
ealth
, Inf
rast
ruct
ure,
R
ural
Dev
elop
men
t, C
P/N
PRS
Inte
grat
ion
of p
rogr
am b
udge
ts in
to
Bud
get L
aw
Com
plet
ed
G
ener
aliz
e pr
ogra
m b
udge
ts th
roug
h th
e M
ediu
m-T
erm
Exp
endi
ture
Fra
mew
ork
(MTE
F))
2005
-200
8 M
EF,
Sect
oral
min
istri
es,
CP/
NPR
S
Dra
ft bu
dget
law
pre
pare
d in
ac
cord
ance
with
MTE
F re
com
men
datio
ns (i
n pa
rticu
lar,
allo
catio
n of
reso
urce
s in
light
of
sect
oral
prio
ritie
s)
Com
plet
ed
Ef
fect
ivel
y ap
ply
the
oil
reve
nue
man
agem
ent l
aw (L
GR
P))
2004
-201
5 M
EF,
CC
SRP,
CP/
NPR
S Pa
rliam
ent,
Aud
it O
ffic
e
Incr
ease
d bu
dget
allo
catio
ns fo
r prio
rity
sect
ors i
n ke
epin
g w
ith L
GR
P: :
Educ
atio
n, 2
0%%
H
ealth
and
Soc
ial A
ffai
rs, 2
0%
Rur
al
Dev
elop
men
t (a
gric
ultu
re
and
lives
tock
), 12
%
Envi
ronm
ent a
nd W
ater
, 10%
Com
plet
ed in
200
4/20
05
In
trodu
ce a
mec
hani
sm fo
r the
co
mpu
teriz
ed m
onito
ring
and
asse
ssm
ent
2003
M
EF,
CC
SRP
Mec
hani
sm d
iscu
ssed
with
spen
ding
an
d fu
nctio
nal m
inis
tries
C
ompl
eted
(See
CC
SRP
repo
rt)

68
Pilla
rs/O
bjec
tives
A
ctio
ns
Tim
etab
le
Pers
ons r
espo
nsib
le
Perf
orm
ance
indi
cato
rs
Stat
us
of th
e us
e of
oil
reve
nues
In
trodu
ce a
mec
hani
sm fo
r the
co
mpu
teriz
ed m
onito
ring
and
asse
ssm
ent
of th
e us
e of
HIP
C re
sour
ces
2003
M
EF,
CC
SRP,
CP/
NPR
S M
echa
nism
dis
cuss
ed w
ith sp
endi
ng
and
func
tiona
l min
istri
es
The
CID
is fu
nctio
nal b
ut e
xper
ienc
ing
prob
lem
s
El
imin
ate
dom
estic
deb
t arr
ears
20
03-2
005
MEF
, C
NR
T Pe
nsio
ns re
gula
rly p
aid
to re
tiree
s,,
Deb
ts to
supp
liers
pai
d in
thei
r ent
irety
N
ot c
ompl
eted
Afr
ican
eco
nom
ic
inte
grat
ion
and
inte
grat
ion
into
wor
ld e
cono
my
Parti
cipa
te in
dee
peni
ng A
fric
an e
cono
mic
in
tegr
atio
n, n
otab
ly w
ithin
the
fram
ewor
k of
CEM
AC
and
NEP
AD
2003
-200
5 O
ffic
e of
the
Prim
e M
inis
ter,
MEF
M
inis
try o
f For
eign
Aff
airs
an
d A
fric
an In
tegr
atio
n
App
licat
ion
at th
e na
tiona
l lev
el o
f the
di
rect
ives
neg
otia
ted
with
in th
e ec
onom
ic in
tegr
atio
n st
ruct
ures
Not
com
plet
ed
C
ondu
ct a
bal
ance
of p
aym
ents
pol
icy
com
patib
le w
ith p
rese
rvin
g th
e ec
onom
y's
com
petit
iven
ess
2003
-200
5 M
EF, M
PDC
, Se
ctor
al m
inis
tries
In
crea
se in
non
-oil
expo
rts
Impr
ovem
ent i
n th
e ba
lanc
e of
pa
ymen
ts
Gum
ara
bic,
live
stoc
k
B. P
rom
ote
the
Priv
ate
Sect
or
Prom
ote
and
supp
ort
entre
pren
eurs
hip
Cre
ate
a on
e-st
op sh
op a
nd lo
cate
it a
t the
C
CIA
MA
20
03-2
005
CC
IAM
, MEF
, M
ICA
O
ne-s
top
shop
cre
ated
, in
oper
atio
n, a
nd
loca
ted
at th
e C
CIA
MA
C
ompl
eted
C
reat
e a
guar
ante
e fu
nd
2003
-200
5 C
CIA
MA
, B
anks
G
uara
ntee
fund
cre
ated
and
ope
ratio
nal
Com
plet
ed
Impr
ove
rela
tions
bet
wee
n en
terp
rises
and
the
gove
rnm
ent
Cre
ate
com
mer
cial
trib
unal
s 20
03-2
005
Min
istry
of
Just
ice
Num
ber o
f com
mer
cial
trib
unal
s cre
ated
an
d in
ope
ratio
n
18 c
omm
erci
al tr
ibun
als c
reat
ed, o
f whi
ch 5
are
in
oper
atio
n in
N
’dja
men
a,
Mou
ndou
, A
béch
é,
Bon
gor,
and
Sarh
. D
evel
op th
e fin
anci
al
sect
or a
nd m
icro
finan
ce
Exte
nd b
anki
ng a
nd in
sura
nce
netw
ork
thro
ugho
ut th
e na
tiona
l ter
ritor
y
2003
-200
5 M
EF, B
EAC
B
anks
and
fina
ncia
l in
stitu
tions
, Ass
ocia
tion
of
Ban
king
Pro
fess
iona
ls
Num
ber o
f bra
nche
s of c
omm
erci
al
bank
s and
insu
ranc
e co
mpa
nies
es
tabl
ishe
d
Ong
oing
Impr
ove
acce
ss to
m
icro
finan
ce
Incr
ease
num
ber o
f mic
rofin
ance
uni
ts
2003
-200
5 M
EF, M
ICA
, CEL
IAF
REP
AFE
M
Num
ber o
f mic
rofin
ance
uni
ts c
reat
ed
55 C
OO
PEC
D
iver
sify
ban
king
and
insu
ranc
e pr
oduc
ts
and
serv
ices
20
03-2
005
MEF
, BEA
C
Ban
ks a
nd fi
nanc
ial
inst
itutio
ns, A
ssoc
iatio
n of
B
anki
ng P
rofe
ssio
nals
Num
ber o
f new
pro
duct
s cre
ated
U
ncle
ar
Prom
ote
expo
rts
Prep
are
and
impl
emen
t the
inte
grat
ed
trade
fram
ewor
k pa
per
2003
-200
5 M
ICA
, MEF
, CC
IAM
A,
Econ
omic
pro
mot
ers
Fram
ewor
k pa
per a
dopt
ed a
nd
impl
emen
ted
C
ompl
eted
; doc
umen
t ado
pted
in O
ctob
er 2
005

69
Pi
llars
/Obj
ectiv
es
Act
ions
Ti
met
able
Pe
rson
s re
spon
sibl
e Pe
rfor
man
ce in
dica
tors
St
atus
C. D
evel
op b
asic
infr
astr
uctu
re
Stre
ngth
en in
stitu
tiona
l, te
chni
cal,
and
hum
an c
apac
ities
R
eass
ign
and
train
an
adeq
uate
num
ber o
f su
perv
isor
s, en
gine
ers,
and
othe
r tec
hnic
ians
in
volv
ed in
bas
ic in
fras
truct
ure
plan
ning
and
m
anag
emen
t
2003
-200
5 M
inis
try
of
Infr
astr
uctu
re
MA
TU
H
Min
istr
y of
M
ines
M
inis
try
of
Post
s
Num
ber o
f sup
ervi
sors
, en
gine
ers,
and
othe
r te
chni
cian
s rea
ssig
ned
or
train
ed
M. I
nf –
Pre
para
tion
and
impl
emen
tatio
n of
a th
ree-
year
(200
3-20
05)
train
ing
plan
, ess
entia
lly to
bui
ld in
stitu
tiona
l cap
acity
thro
ugh
cont
inui
ng
train
ing
of su
perv
isor
s and
eng
inee
rs a
nd b
y re
assi
gnin
g an
d tra
inin
g en
ough
of t
hem
. M
AT
UH
– P
repa
ratio
n an
d im
plem
enta
tion
of a
thre
e-ye
ar (2
005-
2007
) tra
inin
g pl
an, t
he a
im o
f whi
ch is
to b
uild
the
man
agem
ent c
apac
ities
of
MA
TUH
and
impr
ove
capa
city
to im
plem
ent c
urre
nt a
nd fu
ture
pro
gram
s. M
inis
try
of M
ines
and
Ene
rgy:
ther
e is
no
train
ing
tool
. The
re is
ther
efor
e a
huge
nee
d fo
r tra
inin
g. T
he b
uild
ing
hous
ing
the
Dire
ctor
ate
Gen
eral
is
clos
e to
col
laps
e.
The
Min
istr
y of
Pos
ts a
nd N
ew C
omm
unic
atio
n T
echn
olog
ies:
this
m
inis
try ju
st c
hang
ed it
s nam
e, it
s new
role
s and
resp
onsib
ilitie
s req
uire
su
bsta
ntia
l sup
port
at a
ll le
vels
.
Esta
blis
h a
basi
c gr
id o
f roa
ds
for d
omes
tic a
nd e
xter
nal a
cces
s to
isol
ated
are
as th
at a
re u
sabl
e in
all
seas
ons
Com
plet
e th
e on
goin
g re
habi
litat
ion
and
cons
truct
ion
of th
e ro
ads f
or d
omes
tic a
nd
exte
rnal
acc
ess t
o is
olat
ed a
reas
: Kél
o-M
ound
ou, M
ound
ou-B
olar
obou
(Cha
d-C
amer
oon
bord
er),
Mas
sagu
et-N
gour
a
2004
-200
6 M
inis
try
of
Infr
astr
uctu
re
Gen
eral
D
irect
orat
e of
R
oads
Leng
th o
f roa
ds
refu
rbis
hed
Leng
th o
f roa
ds p
aved
fo
r acc
essi
ng re
mot
e ar
eas
Wor
k cu
rren
tly in
pro
gres
s Th
e pa
ving
of r
oads
alre
ady
unde
rway
may
cov
er th
e 73
7 km
pla
nned
in
2005
Pa
ving
of t
he M
ound
ou-K
élo
segm
ent (
100
km) c
ompl
eted
sinc
e 20
04.
The
layi
ng o
f the
Mou
ndou
thro
ugh
road
and
the
Mou
ndou
Cam
eroo
n B
orde
r pro
ject
(118
km) s
houl
d be
com
plet
ed in
200
5.
Con
tinua
tion
of th
e up
grad
ing
of 2
87 k
m o
f pav
ed ro
ads a
nd th
e pa
ving
un
derw
ay o
f the
follo
win
g ro
ads:
Mas
sagu
et –
Bis
ney
(87
km),
Bin
ey –
N’G
oura
(38
km)e
t N’G
oura
– B
okor
o (1
04 k
m) o
n th
e N
’Dja
mén
a –
Abé
ché
trunk
road
. Es
tabl
ish
a ba
sic
grid
of r
oads
fo
r dom
estic
and
ext
erna
l acc
ess
to is
olat
ed a
reas
that
are
usa
ble
in a
ll se
ason
s
Com
plet
e th
e on
goin
g re
habi
litat
ion
and
cons
truct
ion
of th
e ro
ads f
or d
omes
tic a
nd
exte
rnal
acc
ess t
o is
olat
ed a
reas
: Kél
o-M
ound
ou, M
ound
ou-B
olar
obou
(Cha
d-C
amer
oon
bord
er),
Mas
sagu
et-N
gour
a
2004
-200
6 M
inis
try
of
Infr
astr
uctu
re
Gen
eral
D
irect
orat
e O
f Roa
ds
Leng
th o
f roa
ds
refu
rbis
hed
Leng
th o
f roa
ds p
aved
fo
r acc
essi
ng re
mot
e ar
eas
Star
t-up
of n
ew p
roje
cts:
•
Pavi
ng o
f Bok
oro
–Arb
outc
hata
and
Oum
Had
jer –
Abé
ché
road
s;
• Pa
ving
of t
he M
assa
guet
–M
assa
kory
segm
ent o
n th
e N
’Dja
mén
a-M
assa
kory
and
Mas
sako
ry –
Bol
trun
k ro
ads;
•
Pavi
ng o
f the
N’D
jam
éna
–Dou
rbal
i se
gmen
t of t
he N
’Dja
mén
a –
Dou
rbal
i-Mas
seny
a tru
nk ro
ad, a
tota
l len
gth
of 1
82 k
m o
n th
e na
tiona
l se
ason
al g
rid is
pla
nned
; •
Two
brid
ges m
ight
be
built
on
the
Logo
ne a
t Laï
and
ano
ther
on
the

70
Pilla
rs/O
bjec
tives
A
ctio
ns
Tim
etab
le
Pers
ons
resp
onsi
ble
Perf
orm
ance
indi
cato
rs
Stat
us Ta
ndjil
é at
Tch
oua.
Fi
naliz
e st
udie
s and
by
2005
beg
in p
avin
g of
N
gour
a-B
okor
o, B
okor
o-M
ongo
, Mon
go-
Abé
ché,
Abé
ché-
Adr
é-Su
dan
bord
er,
Mou
ndou
-Dob
a, D
oba-
Sarh
, and
Mas
sagu
et-
Mas
sako
ry ro
ads.
2003
-200
5 M
in.
Infr
astru
ctur
e Ef
fect
ive
star
tup
of
cons
truct
ion
on ro
ads
men
tione
d
Fina
lizat
ion
of p
avin
g st
udie
s B
okor
o- M
ongo
(201
km
) com
plet
ed
Mon
go –
Abé
ché
(387
km
) com
plet
ed
Mou
ndou
–D
oba
(100
km
) ong
oing
D
oba
–Sar
h (2
00km
) ong
oing
M
asss
ague
t–M
assa
koty
(67
km) o
ngoi
ng
Out
look
, dir
t roa
d re
habi
litat
ion
stud
ies:
Fo
r the
N’D
jam
éna
–Dou
bali
segm
ent (
100
km)
Prep
arat
ion
of a
pro
gram
to se
rvic
e th
e 17
regi
ons a
nd d
efin
e a
prio
rity
inve
stm
ent p
rogr
am
C
ontin
ued
reha
bilit
atio
n of
dirt
road
s in
perm
anen
t nat
iona
l net
wor
k 20
04- -
2006
D
GR
/DER
FE
R
20
4 km
of r
efur
bish
ed ru
ral r
oads
in M
ayo–
Keb
bi in
200
4.
Prep
arat
ion
of a
five
-yea
r (20
06-2
010)
inve
stm
ent p
lan
for r
ural
road
s to
talin
g C
FAF
4 bi
llion
ann
ually
ove
r fiv
e ye
ars (
betw
een
3,00
0 an
d 4,
000
km o
f rur
al ro
ads f
inan
ced
by o
il re
venu
es).
Som
e m
ajor
pro
ject
s hav
e se
t up
an
inte
rnal
“ru
ral r
oads
” co
mpo
nent
that
incl
udes
con
stru
ctio
n,
refu
rbis
hing
and
mai
nten
ance
of r
ural
road
s
Esta
blis
h a
prio
rity
inve
stm
ent p
rogr
am fo
r ru
ral r
oads
20
03-2
005
Min
istry
of
Infr
astru
ctur
e de
cent
raliz
ed
terr
itoria
l go
vern
men
ts
Prio
rity
inve
stm
ent
prog
ram
to b
uild
rura
l ro
ads a
dopt
ed
Ong
oing
Mai
nten
ance
of t
rans
port
infr
astru
ctur
e C
onso
lidat
e fin
anci
al re
sour
ces o
f the
Roa
d M
aint
enan
ce F
und
(FER
) and
bui
ld it
s ca
paci
ties f
or p
rogr
amm
ing
mai
nten
ance
w
ork
2003
-200
5 M
TP, M
EF, F
ER
Line
ar le
ngth
of n
atio
nal
road
s in
good
con
ditio
n,
Res
ourc
es d
evot
ed to
ro
ad m
aint
enan
ce
The
FER
has
not
bee
n al
loca
ted
enou
gh fi
nanc
ial r
esou
rces
mob
ilize
d si
nce
2001
for s
uppo
rt m
aint
enan
ce w
ork.
The
FER
was
pro
vide
d w
ith C
FAF
200
mill
ion
in fi
nanc
ing
for t
he p
erio
d 20
04-2
005,
but
this
will
sign
ifica
ntly
in
crea
se o
ver t
he n
ext t
hree
yea
rs, t
hat i
s to
say:
200
6, 2
007,
and
200
8.
The
FER
is e
xper
ienc
ing
huge
diff
icul
ties i
n fin
anci
ng th
e co
ntra
cts p
lann
ed
for t
he p
erio
d 20
01-2
004.
Thu
s the
con
tract
s for
200
5 an
d 20
06 w
ill fu
rther
co
mpl
icat
e th
ings
. C
apac
ity to
pla
n an
d m
onito
r mai
nten
ance
wor
k ha
s im
prov
ed. T
here
are
pl
ans t
o m
aint
ain
2,60
0 km
ann
ually
. Th
e in
itial
obj
ectiv
e is
to m
aint
ain
100%
of t
he ro
ads s
elec
ted,
but
the
rain
s lim
it th
e ac
hiev
emen
t of t
hat o
bjec
tive.
Thu
s com
plet
ion
was
as f
ollo
ws:
•
In 2
004:
2,3
00 k
m (8
.4%
) •
in 2
005
2,00
0 km
(76.
9%) p
erfo
rman
ce w
ill im
prov
e du
ring
the
next
cro
p ye
ars (
Sept
embe
r 1 –
Aug
ust 3
1), w
ith th
e al
loca
tion
rais
ed fr
om C
FAF
4
billi
on to
CFA
F 6
billi
on, o
r an
incr
ease
of 3
3.3
%

71
Pilla
rs/O
bjec
tives
A
ctio
ns
Tim
etab
le
Pers
ons
resp
onsi
ble
Perf
orm
ance
indi
cato
rs
Stat
us
Roa
d m
aint
enan
ce p
roje
ct b
ased
on
a pe
rfor
man
ce-b
ased
rem
uner
atio
n sy
stem
. Thi
s mad
e it
poss
ible
to m
aint
ain
441
km o
f roa
ds a
llow
ing
spee
ds
of u
p to
60k
m/h
with
out b
reak
dow
ns. C
ompl
etio
n is
sche
dule
d fo
r Jun
e 5,
20
05, b
ut o
n Ju
ne 6
, 200
5 a
rider
(03)
was
sign
ed b
y th
e tw
o pa
rties
, Cha
d an
d th
e W
orld
Ban
k. T
hus,
the
final
com
plet
ion
of th
e pr
ojec
t is p
lann
ed fo
r D
ecem
ber 3
1, 2
005.
Esta
blis
h a
Roa
d M
aint
enan
ce A
genc
y
2005
M
TPT
Age
ncy
esta
blis
hed
and
in o
pera
tion
Esta
blis
hmen
t of a
n A
uton
omou
s Roa
d M
aint
enan
ce A
genc
y
Ong
oing
Impr
oved
road
safe
ty
Prep
are
and
impl
emen
t a p
asse
nger
and
go
ods t
rans
port
code
20
02-2
004
Min
.Infr
/ D
irect
orat
e of
O
verla
nd
Tran
spor
t
Roa
d sa
fety
has
im
prov
ed
Ther
e ar
e le
gal p
rovi
sion
s reg
ulat
ing
road
tran
spor
t, na
mel
y:
1.
Dec
isio
n N
°042
/MTP
HTU
/SG
/DTS
/200
1 of
July
9, 2
001,
pro
hibi
ting
the
trans
port
of p
asse
nger
s ban
ning
the
trans
porta
tion
of p
asse
nger
s on
artic
ulat
ed se
mi-t
raile
rs.
2.
Dec
isio
n N
°061
/MTP
HTU
/SG
/01o
f Nov
embe
r 5, 2
001
esta
blis
hing
th
e am
ount
of t
he fi
nes f
or th
e ov
erlo
adin
g of
veh
icle
s 3.
D
ecis
ion
N°0
26/M
TPT/
DG
/DTS
/02
of D
ecem
ber 4
, 200
2 es
tabl
ishi
ng
the
cond
ition
s for
the
oper
atio
n of
veh
icle
s as m
otor
bike
- 4.
ta
xis D
ecis
ion
N°0
32/P
M/0
3 of
Oct
ober
10,
200
3 es
tabl
ishi
ng th
e N
atio
nal R
oad
Safe
ty C
omm
issi
on
Im
prov
ed ro
ad sa
fety
Pr
epar
e an
d im
plem
ent a
pas
seng
er a
nd
good
s tra
nspo
rt co
de
2002
-200
4 M
.Infr
/ D
irect
orat
e of
O
verla
nd
Tran
spor
t
Roa
d sa
fety
has
im
prov
ed
Leg
al p
rovi
sion
s reg
ulat
ing
road
tran
spor
t (co
nt’d
) :
5.
Dec
isio
n 03
9/M
TPT/
SG/D
TS/0
4 of
Sep
tem
ber 2
4, 2
004
embo
dyin
g th
e re
gula
tions
for p
ublic
inte
rurb
an tr
ansp
ort o
f per
sons
6.
D
ecis
ion
040/
MIP
I/SG
/DTS
/04
of S
epte
mbe
r 27,
200
4, m
akin
g th
e w
earin
g of
safe
ty h
elm
ets m
anda
tory
7.
D
ecis
ion
019/
MTP
T/SG
/DTS
/04
Febr
uary
23,
200
4 de
finin
g th
e co
nditi
ons f
or tr
ansp
ort o
f bul
k go
ods
The
prob
lem
stem
s fro
m th
e lim
ited
diss
emin
atio
n an
d la
ck o
f com
plia
nce
with
the
prov
isio
ns b
y us
ers
Rev
isio
n of
the
Cha
dian
road
cod
e Pr
ojec
t for
the
com
pute
rizat
ion
of g
rey
card
s and
driv
er li
cens
es.
O
utre
ach
to th
e pe
ople
(IEC
on
prev
entio
n)
rega
rdin
g ro
ad sa
fety
20
05
M.In
f, M
inis
try
of th
e In
terio
r M
ore
road
-saf
ety
awar
enes
s Pr
epar
atio
n of
a n
atio
nal r
oad
safe
ty st
rate
gy in
Cha
d, in
whi
ch th
ere
is a
an
IEC
val
idat
ion
com
pone
nt)
R
evis
e th
e N
atio
nal T
rans
port
Stra
tegy
re
sulti
ng fr
om th
e 19
99 se
ctor
al m
eetin
g, in
lin
e w
ith th
e ne
w c
onte
xt in
Cha
d.
2005
M
inis
try o
f .In
fras
truct
ure
Rev
ised
nat
iona
l tra
nspo
rt st
rate
gy
Nat
iona
l tra
nspo
rt st
rate
gy re
vise
d an
d ad
opte
d
Exp
ande
d ac
cess
to w
ater
in
rura
l are
as
Bui
ld o
r reh
abili
tate
800
tube
wel
ls a
nd 5
0 la
rge
diam
eter
wel
ls p
er y
ear
2003
-200
4 M
inis
try o
f the
En
viro
nmen
t and
W
ater
(MEE
)
Num
ber o
f tub
e w
ells
bu
ilt o
r reh
abili
tate
d - C
ompl
etio
n of
415
pro
ject
s, in
clud
ing
15 w
ater
tow
ers i
n ru
ral a
reas
(2
003/
2004
), th
ereb
y in
crea
sing
acc
ess t
o dr
inki
ng w
ater
from
29
to 3
6 in
20
04.
Mak
e th
e po
pula
tion
resp
onsi
ble
for
2003
-201
5 M
EE
Perc
enta
ge o
f vill
ages
O
nce
the
proj
ects
wer
e ha
nded
ove
r, th
e be
nefic
iarie
s wer
e gi
ven
the
task
of

72
Pilla
rs/O
bjec
tives
A
ctio
ns
Tim
etab
le
Pers
ons
resp
onsi
ble
Perf
orm
ance
indi
cato
rs
Stat
us
man
agin
g w
ater
acc
ess p
oint
s w
ith a
wat
er a
cces
s poi
nt
man
agem
ent c
omm
ittee
m
anag
ing
them
Impr
ovem
ent i
n th
e qu
ality
of
hous
ing
Im
prov
e th
e liv
ing
cond
ition
s of t
he u
rban
an
d ru
ral p
opul
atio
n by
impl
emen
ting
the
prog
ram
s und
er th
e N
atio
nal H
ousi
ng
Stra
tegy
(SN
L)
2005
-200
6 M
ATU
H/
Dec
entra
lized
te
rrito
rial
gove
rnm
ents
Impr
ovem
ent i
n ho
usin
g U
rban
Dev
elop
men
t and
Hou
sing
Impr
ovem
ent P
ilot P
roje
ct. A
ctiv
ities
pl
anne
d to
star
t in
2005
. •
Cle
ar 1
,000
lots
in N
’Dja
mén
a an
d
• B
uild
100
hou
ses
• R
estru
ctur
ing
of th
e ol
d qu
arte
r in
Abé
ché
In th
is su
bsec
tor t
he e
mph
asis
nee
ds to
be
on fi
nanc
ing
hous
ing
and
prom
otin
g re
sear
ch o
n w
ays o
n ta
king
full
adva
ntag
e of
loca
l mat
eria
ls so
as
to m
inim
ize
the
cost
of i
mpo
rted
mat
eria
ls.
Supp
ort u
rban
dev
elop
men
t and
la
nd-u
se p
lann
ing
Im
plem
ent p
riorit
y pr
ojec
ts in
the
urba
n se
ctor
and
dra
ft pl
ans f
or st
rate
gic
deve
lopm
ent a
ppro
ache
s to
bene
fit u
rban
and
ru
ral d
wel
lers
.
2005
-200
6 M
TUH
, de
velo
pmen
t pa
rtner
s
Fina
lize
and
adop
t the
re
gula
tory
and
legi
slat
ive
fram
ewor
k
13 d
rafts
pre
pare
d an
d re
vise
d, c
urre
ntly
bef
ore
the
Cab
inet
Dra
ft an
d ad
opt t
he
docu
men
ts e
mbo
dyin
g th
e st
rate
gic
appr
oach
es
Prep
arat
ion
of la
nd-u
se p
lann
ing
and
spac
e m
anag
emen
t too
ls: S
NA
T,
SDA
R, L
and-
Use
and
Urb
an P
lann
ing
blue
prin
ts fo
r 4 m
ajor
citi
es a
nd 1
0 se
cond
ary
citie
s, an
d th
e St
rate
gic
Dev
elop
men
t Pla
n.
Sani
tatio
n of
maj
or u
rban
ce
nter
s Pr
ovid
e th
e ur
ban
cent
ers (
N’D
jam
éna,
Sar
h,
Abé
ché,
Mou
ndou
, Kél
o, K
oum
ra, P
ala,
M
ao) w
ith in
tegr
ated
drin
king
wat
er a
nd
sani
tatio
n sy
stem
s.
2003
-200
5 M
ATU
H/ M
EE,
Mun
icip
al
gove
rnm
ents
, Sa
nita
tion
Com
mitt
ee,
NG
Os
B
road
-bas
ed u
rban
sani
tatio
n pr
ogra
m in
N’D
jam
éna,
Mou
ndou
, and
Sar
h w
as im
plem
ente
d be
twee
n 20
02 a
nd 2
004
by M
ATU
H w
ith F
renc
h D
evel
opm
ent A
genc
y (A
FD) f
inan
cing
. Thi
s act
ion
was
alre
ady
impl
emen
ted
as p
rogr
amm
ed.
As o
f 200
5, th
e ne
xt p
riorit
y pr
ojec
ts to
be
impl
emen
ted
in th
e se
ctor
are
in
N’D
jam
éna,
Sar
h, A
béch
é et
Mou
ndou
. St
art-u
p of
the
“N’D
jam
éna
Bas
ic S
ervi
ces a
nd U
rban
Env
ironm
ent”
pr
ojec
t for
whi
ch th
e ag
reem
ent w
as si
gned
in Ju
ne 2
005.
Cre
ate
sew
er a
nd d
rain
age
syst
ems (
VR
D)
Dis
pose
of h
ouse
hold
tras
h, in
dust
rial a
nd
com
mer
cial
was
te, a
nd e
xcre
men
t
2003
-200
5 M
ATU
H ,
M
EE,
Min
istry
of
Dec
entra
lizat
ion
MA
T
VR
Ds c
reat
ed in
mai
n to
wns
- ho
useh
old
was
te,
indu
stria
l and
co
mm
erci
al w
aste
, was
te
wat
er a
nd e
xcre
men
t ev
acua
ted
and
recy
cled
Con
stru
ctio
n of
sew
er d
rain
hea
ders
in th
e ea
ster
n di
stric
ts o
f N’D
jam
ena
and
clea
ring
of 1
00 lo
ts o
n 55
Ha
of se
rvic
ed la
nd.
The
follo
win
g ac
tions
are
pla
nned
for 2
005:
•
Pavi
ng o
f N’D
jari
cana
l bed
(N’D
jam
éna)
(AFD
fina
ncin
g,
gove
rnm
ent c
ount
erpa
rt)
• co
nstru
ctio
n of
dra
in h
eade
rs in
Mou
ndou
(gov
t. fin
anci
ng)
• co
nstru
ctio
n of
dra
in h
eade
rs a
nd se
ptic
tank
s in
Sarh
,(gov
t. fin
anci
ng)
• co
nstru
ctio
n an
d re
habi
litat
ion
of g
utte
rs/w
aste
dis
posa
l in
N’D
jam
éna
(AFD
fina
ncin
g)
• co
nstru
ctio
n an
d re
habi
litat
ion
of w
ater
supp
ly in
fras
truct
ure
(gov
t. fin
anci
ng)
Ene
rgy
Prep
are
a st
atus
repo
rt on
the
regi
onal
sola
r en
ergy
pro
gram
so a
s to
optim
ize
its
cont
ribut
ion
to a
nat
iona
l new
and
rene
wab
le
ener
gies
pro
gram
2003
-200
5 M
inis
try o
f M
ines
and
En
ergy
(MM
E),
STEE
Stat
us re
port
on th
e so
lar
ener
gy p
rogr
am
avai
labl
e;
Nat
iona
l new
and
re
new
able
ene
rgie
s
This
sect
or is
und
erde
velo
ped.
It is
cha
ract
eriz
ed b
y he
avy
cons
umpt
ion
of
woo
d fu
els (
woo
d ch
arco
al),
whi
ch a
ccou
nts f
or 9
0% o
f Cha
d’s t
otal
ene
rgy
cons
umpt
ion.
How
ever
, con
sum
ptio
n of
ene
rgy
from
con
vent
iona
l sou
rces
(p
etro
leum
pro
duct
s and
ele
ctric
ity) a
ccou
nt fo
r a m
ere
10%
of t
he
coun
try’s
ene
rgy
cons
umpt
ion.

73
Pilla
rs/O
bjec
tives
A
ctio
ns
Tim
etab
le
Pers
ons
resp
onsi
ble
Perf
orm
ance
indi
cato
rs
Stat
us
prog
ram
ado
pted
Th
e ob
ject
ive
of re
duci
ng th
e co
st p
er K
wh
and
mak
ing
elec
trici
ty m
ore
acce
ssib
le to
a m
ajor
par
t of t
he p
opul
atio
n ca
n be
reac
hed
only
thro
ugh
the
follo
win
g in
itiat
ives
: B
uild
ing
a ne
w p
ower
pla
nt in
Far
cha;
R
esum
ing
nego
tiatio
ns o
n el
ectri
c in
terc
onne
ctio
ns b
etw
een
Cha
d an
d C
amer
oon;
Th
e ef
fect
ive
impl
emen
tatio
n of
the
proj
ect t
o de
velo
p th
e Sé
digu
i oilf
ield
; E
nerg
y
C
onst
ruct
ion
of th
e Fa
rcha
min
i-ref
iner
y;
Con
clus
ive
com
plet
ion
of th
e re
sear
ch in
to p
ossi
bilit
ies f
or u
sing
cru
de o
il fr
om D
oba
or S
édig
ui o
r gas
-oil
from
the
dist
illat
ion
colu
mn
(topp
ing
unit)
. Th
e el
ectri
cal e
nerg
y pr
oble
m is
par
ticul
arly
influ
ence
d by
the
expl
oita
tion
cost
rela
ted
to th
e co
st o
f gas
-oil,
whi
ch re
pres
ents
75%
to 8
0% o
f the
cos
t of
pro
duct
ion.
Th
e N
atio
nal G
as P
rogr
am la
unch
ed in
N’D
jam
éna
was
abl
e to
hel
p br
ing
dow
n co
nsum
ptio
n of
woo
d fu
els.
It sh
ould
hav
e be
en e
xpan
ded
to o
ther
ar
eas o
f the
cou
ntry
and
hea
vily
subs
idiz
ed to
faci
litat
e ac
cess
for t
he m
ost
disa
dvan
tage
d gr
oups
.
Pr
epar
e a
natio
nal e
nerg
y st
rate
gy a
nd a
rura
l el
ectri
ficat
ion
plan
20
05 -2
006
MM
E an
d pa
rtner
s N
atio
nal E
nerg
y St
rate
gy
and
Dec
entra
lized
Rur
al
Elec
trific
atio
n Pl
an
prep
ared
.
Thes
e pl
anni
ng to
ols a
re e
ssen
tial f
or a
cou
ntry
whe
re e
nerg
y is
a li
miti
ng
fact
or.
Im
plem
ent t
he e
mer
genc
y pr
ogra
m a
t the
ST
EE
Im
plem
enta
tion
of th
e ST
EE e
mer
genc
y pr
ogra
m is
ong
oing
.
Post
s and
New
C
omm
unic
atio
n T
echn
olog
ies
Con
tinue
der
egul
atin
g th
e va
lue-
adde
d se
rvic
es su
bsec
tor (
mob
ile te
leph
ony,
dat
a tra
nsm
issi
on, i
nter
net a
cces
s),
2003
-200
5 M
PNTC
D
ereg
ulat
ed a
cces
s to
valu
e-ad
ded
serv
ices
C
elte
l is c
urre
ntly
dom
icile
d, a
noth
er p
rovi
der (
Mill
icom
–Ti
go) w
as
esta
blis
hed
on O
ctob
er 1
5, 2
005.
D
evel
op a
nd im
plem
ent a
pilo
t rur
al
tele
phon
y pr
ojec
t
SOTE
L C
had,
m
obile
tele
phon
y co
mpa
nies
Proj
ect d
esig
ned
and
impl
emen
ted
Of t
he 2
4 V
SATs
pla
nned
for t
he se
cond
ary
citie
s, 15
hav
e be
en in
stal
led,
w
hich
is a
n im
plem
enta
tion
rate
of 6
3%. C
elte
l mob
ile te
leph
ony
expa
nded
its
net
wor
k to
oth
er se
cond
ary
citie
s.
M
ake
post
al a
nd fi
nanc
ial s
ervi
ces
auto
nom
ous
2003
-200
5 M
PNTC
A
uton
omou
s pos
tal a
nd
finan
cial
serv
ices
Po
stal
and
fina
ncia
l ser
vice
s ref
orm
ong
oing
. R
evis
ion
of la
w 0
08/P
R/9
8 or
gani
zing
the
publ
ic p
osta
l ser
vice
Sele
ct a
stra
tegi
c pa
rtner
for t
he d
evel
opm
ent
of e
ach
basi
c in
fras
truct
ure
subs
ecto
r (C
had
airp
orts
man
agem
ent,
ener
gy, p
osts
, te
leco
mm
unic
atio
ns)
2003
-200
4 R
elev
ant
min
istri
es, u
nits
re
spon
sibl
e fo
r pr
ivat
izat
ion
Stra
tegi
c pa
rtner
s se
lect
ed fo
r eac
h su
bsec
tor
- A p
rivat
e co
ntra
ct fo
r the
gra
ntin
g of
a c
once
ssio
n fo
r the
com
mer
cial
m
anag
emen
t and
for t
he in
fras
truct
ure
of th
e ai
rpor
ts w
as si
gned
on
May
28,
200
1 be
twee
n C
had
and
ASE
CN
A. T
he a
irpor
ts in
volv
ed a
re
N’D
jam
éna,
Sar
h, M
ound
ou, A
béch
é, F
aya
Larg
eau,
Bon
gor,
Bol
, Pal
a,
Mao
, Ati,
and
Am
–tim
an.
Ther
e ar
e al
so 5
0 ae
rodr
omes
with
runw
ays t
hat
are
not a
ll op
erat
iona
l. Pr
ivat
izat
ion
of th
ese
airp
orts
will
not
be
poss
ible
un
less
they
are
to b
e us
ed b
y fo
reig
n ai
rcra
ft.
Pl
ace
the
deve
lopm
ent o
f eac
h ba
sic
infr
astru
ctur
e su
bsec
tor u
nder
the
2003
-200
4 O
ffic
e of
the
Prim
e M
inis
ter,
Reg
ulat
ory
inst
itutio
n in
pl
ace
- the
law
est
ablis
hing
the
Cha
d C
ivil
Avi
atio
n A
utho
rity
was
ado
pted
by
the
Ass
embl
y

74
Pilla
rs/O
bjec
tives
A
ctio
ns
Tim
etab
le
Pers
ons
resp
onsi
ble
Perf
orm
ance
indi
cato
rs
Stat
us
supe
rvis
ion
of a
n au
tono
mou
s reg
ulat
ory
inst
itutio
n
rele
vant
m
inis
tries
D. S
usta
inab
ly in
crea
se r
ural
out
put
C
arry
out
the
agric
ultu
ral w
ater
supp
ly
and
past
oral
wat
er su
pply
com
pone
nts
of th
e m
aste
r pla
n fo
r wat
er
2004
-200
6 G
R/O
ND
R/
SOD
ELA
C
Agr
icul
tura
l wat
er
supp
ly im
prov
emen
ts
avai
labl
e
Bon
gor,
Kol
obo,
Ham
atié
, Cha
dra,
Am
béda
m, Z
afay
a, D
arda
, A
béda
ya
Incr
ease
inve
stmen
t in
agric
ultu
ral a
nd p
asto
ral
wat
er su
pply
impr
ovem
ents
2004
- 200
6 G
R/O
ND
R/
SOD
ELA
C
Land
are
as im
prov
ed
Bon
gor (
2,00
0 ha
), K
olob
o (2
,000
ha)
, Ham
atié
(100
ha)
, Cha
dra
(50
ha),
Am
bada
m (3
0 ha
), Za
faya
(30
ha)
Dar
da (1
5 ha
) 45
0 ha
(Nya
Dob
a)
585
ha u
nder
PV
ERS
(wat
er a
nd su
rfac
e ru
noff
) dev
elop
men
t 75
ha
unde
r PSS
A (f
ood
secu
rity
prog
ram
) dev
elop
men
t Ex
pand
acc
ess t
o hi
gh
qual
ity a
gric
ultu
ral
equi
pmen
t and
inpu
ts
20
03-2
005
ON
DR
Pr
ogra
ms d
efin
ed a
nd
diss
emin
ated
, com
post
av
aila
ble
Org
anic
ferti
lizin
g te
chni
ques
use
d o
n 15
4.5
ha,
Lo
cally
pro
duce
agr
icul
tura
l equ
ipm
ent
and
inpu
ts
2003
-200
4 O
ND
R
Qua
ntity
of e
quip
men
t an
d in
puts
pro
duce
d
Agr
icul
tura
l equ
ipm
ent i
mpo
rted
usin
g H
IPC
fund
s Pl
ows (
1.35
00)
Ox-
draw
n ca
rts (1
070)
H
orse
-dra
wn
carts
( 60
0)
Hou
e oc
cide
ntal
e [ a
kin
d of
hoe
] ( 3
000)
Tr
aile
rs (8
00)
Supe
r eco
seed
ers (
150)
R
idin
g ho
e (c
orps
but
teur
) (15
00)
Gro
undn
ut sh
elle
r (15
0)
Expa
nd a
cces
s to
high
-qu
ality
supp
ort s
ervi
ces f
or
farm
ers a
nd li
vest
ock
bree
ders
Dec
once
ntra
te th
e su
ppor
t stru
ctur
es
tow
ard
agric
ultu
ral a
nd p
asto
ral a
reas
20
04-2
005
ON
DR
/DEP
P N
umbe
r of
deco
ncen
trate
d su
ppor
t stru
ctur
es in
ag
ricul
tura
l and
pa
stor
al a
reas
7 ru
ral d
evel
opm
ent r
egio
ns, 4
5 ru
ral d
evel
opm
ent
dist
ricts
, 191
ru
ral d
evel
opm
ent z
ones
27
vet
erin
ary
dist
ricts
, 15
5 ve
terin
ary
stat
ions
.
C
reat
e st
orag
e st
ruct
ures
20
03-2
005
SOD
ELA
C/
DEP
P/O
ND
R
Com
mun
ity si
los,
war
ehou
ses,
gran
arie
s,
10 w
areh
ouse
s with
cap
acity
for 2
00 T
; an
d 4
with
cap
acity
for
2500
T (O
NSA
), 3
5 w
areh
ouse
s (PD
RD
L) a
nd 2
war
ehou
ses
(Dou
m D
oum
Pro
ject
)
In
trodu
ce a
rura
l com
mun
icat
ions
20
03-2
005
MC
R
ural
radi
o, sm
all
Aud
io-v
isua
l stu
dio

75
Pilla
rs/O
bjec
tives
A
ctio
ns
Tim
etab
le
Pers
ons
resp
onsi
ble
Perf
orm
ance
indi
cato
rs
Stat
us
syst
em
farm
er n
ewsl
ette
rs
Wee
kly
broa
dcas
t of r
ural
radi
o ev
ery
Thur
sday
Ex
pand
acc
ess t
o cr
edit
and
appr
opria
te fi
nanc
ial
serv
ices
Cre
ate
and
inst
all c
redi
t and
fina
ncia
l se
rvic
es st
ruct
ures
20
03-2
005
ON
DR
N
umbe
r of s
truct
ures
cr
eate
d an
d in
stal
led
in u
rban
and
rura
l ar
eas
55 C
OO
PEC
1
CD
CR
Div
ersi
fy a
gric
ultu
ral
prod
uctio
n In
trodu
ctio
n of
new
pla
nt a
nd a
nim
al
spec
ies
2003
-200
5 M
A
Num
ber o
f new
su
bsec
tors
In
trodu
ctio
n of
suga
r-can
e an
d se
sam
e se
ed c
ultiv
atio
n in
Gué
ra
Impr
ove
the
func
tioni
ng o
f di
strib
utio
n ch
anne
ls a
nd
mar
kets
for m
ajor
pro
duct
s
Bui
ld c
apac
ities
of r
ural
pro
duce
rs
2003
-200
5 M
A
Supp
ort p
rovi
ded
to
rura
l pro
duce
rs
Org
aniz
atio
nal s
uppo
rt, s
uppo
rt in
gai
ning
lega
l rec
ogni
tion,
te
chni
cal s
uppo
rt (tr
aini
ng)
St
reng
then
supp
ort s
ervi
ces f
or th
e ag
ricul
tura
l sec
tor
2003
-200
5 M
A
Supp
ort p
rovi
ded
for
agric
ultu
ral s
ervi
ces
Cap
acity
-bui
ldin
g co
mpo
nent
of t
he P
SAO
P
Dev
elop
new
subs
ecto
rs
Com
plet
e th
e re
form
of t
he c
otto
n su
bsec
tor
2003
M
CIA
/ C
oton
tcha
d R
efor
m o
ngoi
ng
Roa
dmap
pre
pare
d an
d pr
ivat
izat
ion
plan
ned
for 2
007
In
itiat
e st
udie
s with
a v
iew
to
iden
tifyi
ng p
rom
isin
g su
bsec
tors
20
03-2
005
MA
; MEE
; M
ICA
N
umbe
r of s
tudi
es
cond
ucte
d Su
bsec
tors
iden
tifie
d: p
oultr
y; p
eri-u
rban
live
stoc
k br
eedi
ng,
spiru
line,
bee
f cat
tle
C
ontin
ue su
ppor
t to
the
gum
ara
bic
subs
ecto
r 20
03-2
005
MEE
A
nnua
l pro
duct
ion
Prod
uctio
n : 1
8,00
0 m
etric
tons
in 2
005
D
evel
op sh
ort-c
ycle
live
stoc
k re
arin
g 20
03-2
005
ME
Proj
ect o
n sh
ort-c
ycle
liv
esto
ck re
arin
g un
der w
ay
Stud
y co
nduc
ted
but n
o pr
ojec
t und
er w
ay
Prot
ect p
lant
hea
lth
Com
bat m
ajor
pes
ts (d
eser
t loc
usts
) 20
04 -
2006
MA
Su
rfac
e ar
eas s
pray
ed
Bat
ha 6
,735
ha;
BET
: 4,
820
ha
WA
DI F
IRA
: 5,
669
ha
Tota
l: 17
,224
ha
C
omba
t end
emic
pes
ts (r
oden
ts a
nd
gras
shop
pers
) 20
04 -
2006
MA
N
atur
e of
con
trol
effo
rts
Info
rmat
ion-
train
ing;
A
dvis
ory
supp
ort;
com
preh
ensi
ve a
nd tr
aditi
onal
cam
paig
n

76
Pi
llars
/Obj
ectiv
es
Act
ions
Ti
met
able
Pe
rson
s re
spon
sibl
e Pe
rfor
man
ce in
dica
tors
St
atus
III.
Hum
an C
apita
l Dev
elop
men
t
A. E
stab
lish
an e
ffec
tive
heal
thca
re sy
stem
Im
prov
e ac
cess
to h
igh-
qual
ity h
ealth
se
rvic
es th
roug
hout
the
terr
itory
B
uild
or r
ehab
ilita
te a
nd e
quip
50
heal
th c
ente
rs, 5
di
stric
t hos
pita
ls o
r pre
fect
ural
hos
pita
ls, a
nd 1
5 di
stric
t of
fices
,
2003
-200
5 M
SP
Goo
d qu
ality
hea
lth se
rvic
es
avai
labl
e 52
hea
lth c
ente
rs, 6
dis
trict
hos
pita
ls, a
nd
4 di
stric
t off
ices
wer
e bu
ilt in
200
5
Tr
ain
the
600
CO
SAN
s/C
OG
ES fo
r 600
hea
lth c
ente
rs in
co
mm
unity
par
ticip
atio
n an
d th
e m
anag
emen
t of h
ealth
se
rvic
es
2003
-200
5 M
SP
Num
ber o
f hea
lth c
ente
rs h
avin
g re
ceiv
ed c
omm
unity
par
ticip
atio
n tra
inin
g
569
heal
th c
ente
rs h
ave
been
pro
vide
d w
ith tr
aini
ng in
com
mun
ity p
artic
ipat
ion
M
ake
10 d
istri
ct h
ospi
tals
or p
refe
ctur
al h
ospi
tals
au
tono
mou
s 20
03-2
005
MSP
N
umbe
r of a
uton
omou
s hos
pita
ls
with
the
tech
nica
l sup
port
and
reso
urce
s
No
pref
ectu
re o
r dis
trict
hos
pita
l bec
ame
auto
nom
ous i
n 20
05
Impr
ove
heal
th se
ctor
indi
cato
rs
Enco
urag
e th
e cr
eatio
n of
hea
lth m
utua
l ass
ocia
tions
am
ong
less
adv
anta
ged
popu
latio
n gr
oups
20
02-2
005
MSP
N
umbe
r of h
ealth
mut
ual
asso
ciat
ions
cre
ated
6
heal
th m
utua
l ass
ocia
tions
cre
ated
by
end-
2005
Stre
ngth
en th
e pr
otec
tion
of c
hild
ren
and
preg
nant
w
omen
aga
inst
dis
ease
s pre
vent
able
by
vacc
inat
ion
and
agai
nst m
alnu
tritio
n
2003
-200
5 M
SP
Incr
ease
of 2
0 pe
rcen
tage
poi
nts
in ra
te o
f ant
i-ant
igen
vac
cina
tion
cove
rage
DTC
3 ra
te is
47%
in 2
005
St
reng
then
surv
eilla
nce
and
early
war
ning
syst
ems w
ith
resp
ect t
o en
dem
ic d
isea
ses (
polio
, neo
nata
l tet
anus
, and
m
easl
es) o
r pot
entia
lly e
pide
mic
dis
ease
s (ch
oler
a,
men
ingi
tis, t
uber
culo
sis)
.
2002
-200
5 M
SP
Num
ber o
f out
reac
h ca
mpa
igns
ca
rrie
d ou
t in
high
-ris
k zo
nes
900
outre
ach
mee
tings
wer
e he
ld
thro
ugho
ut th
e 18
regi
ons o
f the
cou
ntry
- 3
,000
pos
ters
on
the
vacc
inat
ion
sche
dule
wer
e di
spla
yed
Eq
uip
600
heal
th c
ente
rs w
ith e
quip
men
t for
mon
itorin
g pr
egna
ncie
s and
chi
ldbi
rth
2003
-200
5 M
SP
Num
ber o
f hea
lth c
ente
rs
equi
pped
, pre
gnan
cies
mon
itore
d,
and
child
birth
s ass
iste
d
433
heal
th c
ente
rs w
ere
equi
pped
with
pr
egna
ncy
mon
itorin
g eq
uipm
ent
Pr
ovid
e po
stna
tal c
onsu
ltatio
n in
all
heal
th c
ente
rs a
nd a
ll m
ater
nity
clin
ics
2003
-200
5 M
SP
Num
ber o
f pos
tnat
al c
onsu
ltatio
ns
by h
ealth
stru
ctur
es
Pos
tnat
al c
onsu
ltatio
n of
fere
d in
98%
of
heal
th c
ente
rs a
nd d
istri
cts
Eq
uip
25 d
istri
ct h
ospi
tals
or p
refe
ctur
al h
ospi
tals
for
obst
etric
em
erge
ncie
s 20
03-2
005
MSP
N
umbe
r of d
istri
ct o
r pre
fect
ural
ho
spita
ls e
quip
ped
32 o
f 45
hosp
itals
are
equ
ippe
d fo
r ob
stet
ric e
mer
genc
ies
A
ssig
n on
e su
rgeo
n, o
ne a
nest
hetis
t, an
d on
e m
idw
ife p
er
dist
rict o
r pre
fect
ural
hos
pita
l 20
03-2
005
MSP
N
umbe
r of d
istri
ct o
r pre
fect
ural
ho
spita
ls su
itabl
y st
affe
d by
qu
alifi
ed p
erso
nnel
42 o
f 45
dist
rict h
ospi
tals
are
suita
bly
staf
fed
by q
ualif
ied
pers
onne
l
In
trodu
ce p
rogr
ams f
or sp
acin
g bi
rths a
t 600
hea
lth
cent
ers a
nd 2
5 ho
spita
ls
2003
-200
5 M
SP
Con
trace
ptiv
e pr
eval
ence
rate
T
he 2
005
cont
race
ptiv
e pr
eval
ence
rate
w
as 2
.5%
Im
prov
emen
t in
the
use
of re
sour
ces
allo
cate
d to
the
heal
th se
ctor
B
uild
the
capa
citie
s of m
anag
emen
t bod
ies i
n 43
dis
trict
s 20
03-2
005
MSP
, MFE
, C
CSR
P N
umbe
r of m
anag
emen
t bod
ies
rece
ivin
g tra
inin
g
37 o
f 43
man
agem
ent b
odie
s tra
ined

77
Pilla
rs/O
bjec
tives
A
ctio
ns
Tim
etab
le
Pers
ons
resp
onsi
ble
Perf
orm
ance
indi
cato
rs
Stat
us
D
evel
op a
thre
e-ye
ar a
ctio
n pl
an fo
r the
dev
elop
men
t of
heal
th d
istri
cts
2003
-200
5 M
SP
Act
ion
plan
ava
ilabl
e A
ctio
n pl
an p
repa
red
and
avai
labl
e
Pr
ovid
e su
perv
isio
n an
d m
onito
ring
of 4
3 he
alth
dis
trict
s 20
03-2
005
MSP
N
umbe
r of d
istri
cts r
egul
arly
m
onito
red
42 o
f 43
dist
ricts
are
regu
larly
mon
itore
d
Com
bat H
IV/A
IDS
Con
tinue
and
bro
aden
pro
gram
s for
ear
ly d
etec
tion,
pr
even
tion
(par
ticul
arly
am
ong
thos
e ag
ed 1
5 to
49,
pr
egna
nt w
omen
, or s
erop
ositi
ve w
omen
), an
d tre
atm
ent
2003
-200
5 M
S.P
./ M
ASF
PN
LS, P
PLS,
C
ELIA
F A
DH
Rat
e of
intro
duct
ion
of A
IDS
units
in
hea
lth fa
cilit
ies,
Ann
ual
num
ber
of
cond
oms
dist
ribut
ed a
nd a
nnua
l nu
mbe
r of
ou
treac
h ca
mpa
igns
- 14
out o
f 18
hosp
itals
dis
pens
ing
Arts
an
d 52
Vol
unta
ry te
stin
g ce
nter
s fu
nctio
nal
- 3,1
25,0
00 c
ondo
ms s
old
in 2
005
-168
out
reac
h ca
mpa
igns
con
duct
ed
-Con
dom
use
: •
Men
: 6%
•
Wom
en: 0
.4%
Fi
ght a
gain
st m
alar
ia
Con
tinue
and
bro
aden
pre
vent
ion
and
treat
men
t pro
gram
s20
05-2
005
MSP
U
se o
f tre
ated
mos
quito
net
ting
Num
ber o
f hea
lth st
ruct
ures
with
m
alar
ia u
nits
The
2005
usa
ge ra
te fo
r mos
quito
net
ting
w
as 7
%
All
func
tiona
l hea
lth st
ruct
ures
hav
e m
alar
ia u
nits
, i.e
. 100
%
Figh
t aga
inst
mal
nutri
tion
C
ontin
ue a
nd e
xten
d pr
ogra
ms t
o pr
ovid
e m
icro
nutri
ent
supp
lem
ents
, pro
mot
e br
east
-fee
ding
, and
pro
mot
e he
alth
y fo
ods
2003
-200
5 M
SP
Iodi
zed
salt
use
Num
ber o
f bre
ast-f
eedi
ng
outre
ach
cam
paig
ns
Iodi
zed
salt
use
is 6
5%
16 b
reas
t-fee
ding
out
reac
h ca
mpa
igns
co
nduc
ted
B. E
nsur
e ap
prop
riat
e de
velo
pmen
t of t
he e
duca
tion
sect
or
Prom
otio
n of
eq
uita
ble
acce
ss
to
educ
atio
n an
d el
emen
tary
sc
hool
at
tend
ance
Bui
ld 3
,772
cla
ssro
oms,
reha
bilit
ate
3,00
0, a
nd e
quip
all
of
them
in
th
e ta
rget
zo
nes,
in
parti
cula
r in
th
e di
sadv
anta
ged
rura
l are
as
2002
/3-2
005/
6 M
EN
APE
N
umbe
r of s
tude
nts p
er c
lass
, Pr
opor
tion
of q
ualif
ied
teac
hers
Pr
opor
tion
of c
omm
unity
teac
hers
1,80
6 cl
assr
oom
s bui
lt
Tr
ain
at
leas
t 7,
000
com
mun
ity
teac
hers
on
th
e in
stru
ctio
nal s
taff
20
02/3
-200
5/6
MEN
A
PE
Num
ber
of
com
mun
ity
teac
hers
tra
ined
4,
000
leve
l-1
com
mun
ity
teac
hers
tra
ined
Red
uce
by 1
5 pe
rcen
tage
poi
nts
the
gap
in s
choo
l acc
ess
betw
een
girls
and
boy
s 20
02/3
-200
5/6
MEN
A
PE
Gap
in
perc
enta
ge p
oint
s be
twee
n TB
SG (b
oy e
nrol
lmen
t) an
d TB
SF
(girl
enr
ollm
ent),
whi
ch w
as 3
3.7
in
1999
/200
0 an
d 36
.4
in
2003
/200
4
The
boy/
girl
parit
y in
dex
poin
t fel
l fro
m
1.5
to 1
.35
over
the
perio
d (T
AM
: 11%
)
Impr
ovem
ent
in
the
effe
ctiv
enes
s an
d qu
ality
of t
he e
duca
tiona
l sys
tem
C
reat
e a
Nat
iona
l C
urric
ulum
Cen
ter
resp
onsi
ble
for
deve
lopi
ng
educ
atio
n pr
ogra
ms
that
ar
e sp
ecifi
cally
C
hadi
an a
nd b
iling
ual,
as w
ell
as s
peci
al c
urric
ula
for
expe
rimen
tal p
rogr
ams
2002
/3-2
005/
6 M
EN
APE
N
atio
nal
Cur
ricul
um
Cen
ter
func
tiona
l in
2002
/200
3,
Expe
rimen
tatio
n w
ith
new
pr
ogra
ms b
egin
ning
in 2
0052
006
Nat
iona
l Cur
ricul
um C
ente
r fun
ctio
nal i
n 20
04
Prep
arat
ion
of
the
new
cu
rric
ula
ongo
ing,
and
CP
text
book
s in
Ara
bic
and
Fren
ch
expe
cted
to
be
te
sted
in
20
06-2
007.
Mak
e ne
w
text
book
s fo
r re
adin
g,
mat
hem
atic
s, an
d sc
ienc
e av
aila
ble
in th
e pr
imar
y an
d se
cond
ary
scho
ols.
2002
/3-2
005/
6 M
EN
APE
O
ne re
adin
g te
xt, o
ne m
athe
mat
ics
text
, an
d on
e sc
ienc
e te
xt
per
stud
ent i
n pr
imar
y sc
hool
The
orde
r fo
r ab
out
3 m
illio
n bo
oks
is
bein
g fil
led.

78
Pilla
rs/O
bjec
tives
A
ctio
ns
Tim
etab
le
Pers
ons
resp
onsi
ble
Perf
orm
ance
indi
cato
rs
Stat
us
One
boo
k in
eac
h su
bjec
t for
eve
ry
thre
e st
uden
ts in
seco
ndar
y sc
hool
Prov
ide
initi
al t
rain
ing
for
2,00
0 co
mm
unity
tea
cher
s in
no
rmal
sc
hool
s (E
nnis
), 6,
400
teac
hers
, 48
0 te
ache
r tra
iner
s, an
d su
perv
isor
y pe
rson
nel
2002
/3-2
005/
6 M
EN
APE
N
umbe
r of
te
ache
rs,
train
ers,
com
mun
ity
teac
hers
, an
d su
perv
isor
y pe
rson
nel t
rain
ed
850
Leve
l II
com
mun
ity t
each
ers
train
ed, a
nd 3
,400
teac
hers
trai
ned
in
the
Enni
s 20
2 EN
I tea
cher
trai
ners
trai
ned.
St
reng
then
ed
capa
citie
s fo
r pl
anni
ng,
man
agin
g, a
nd s
teer
ing
the
deve
lopm
ent
of th
e ed
ucat
iona
l sys
tem
Dev
elop
and
impl
emen
t pro
cedu
res
man
uals
on
plan
ning
, m
anag
emen
t, as
sess
men
t, an
d m
onito
ring
the
perf
orm
ance
of t
he e
duca
tiona
l sys
tem
2002
/3-2
005/
6 M
EN
APE
Pr
oced
ures
man
ual a
pplie
d N
ot c
ompl
eted
Trai
n at
leas
t 2,0
00 m
anag
ers
at th
e N
atio
nal
Educ
atio
n M
inis
try (
MEN
) an
d pr
ovid
e 30
hig
h-le
vel
supe
rvis
ors
with
long
-term
trai
ning
2002
/3-2
005/
6 M
EN
APE
N
umbe
r of m
anag
ers t
rain
ed
Num
ber
of h
igh
leve
l su
perv
isor
s tra
ined
Not
com
plet
ed
Mak
e 29
dep
artm
enta
l del
egat
ions
in n
atio
nal e
duca
tion
(Den
s)
oper
atio
nal
in
the
area
s of
m
anag
emen
t, ad
min
istra
tion,
and
pla
nnin
g
Num
ber
of D
DEN
S op
erat
iona
l in
the
area
s of
m
anag
emen
t, ad
min
istra
tion,
and
pla
nnin
g
Ado
ptio
n of
a n
ew o
rgan
izat
iona
l ch
art
for t
he D
ens i
n 20
04
In
trodu
ce a
per
man
ent m
echa
nism
for
the
annu
al r
evie
w
of e
xpen
ditu
re a
nd t
he p
repa
ratio
n of
a m
ediu
m-te
rm
prog
ram
bud
get
Mec
hani
sm o
pera
tiona
l R
econ
stitu
tion
of t
he P
ER a
nd P
rogr
am
Bud
get t
eam
in 2
005
C. P
rom
ote
the
labo
r m
arke
t Pi
llars
/Obj
ectiv
es
Act
ions
Ti
met
able
Pe
rson
s re
spon
sibl
e Pe
rfor
man
ce in
dica
tors
St
atus
Spec
ial
actio
ns
to
adap
t th
e qu
alifi
catio
ns
of
grad
uate
s to
th
e ne
eds o
f the
labo
r mar
ket
Incr
ease
te
chni
cal
educ
atio
n an
d vo
catio
nal
train
ing
(ETF
P)
inta
ke
capa
citie
s in
th
e ar
eas
of
grea
test
re
leva
nce,
us
ing
train
ed
and
prop
erly
eq
uipp
ed
inst
ruct
ors
2005
-200
6 M
EN,
APE
N
umbe
r of
stu
dent
s ab
le to
enr
oll
in
ETFP
N
ot a
vaila
ble
In
crea
se th
e ba
sic
know
ledg
e of
15,
000
yout
hs a
ged
8 to
14
by
mea
ns o
f EB
NF
(non
form
al b
asic
edu
catio
n)
2005
-200
6 M
EN,
APE
N
umbe
r of
yo
uths
ag
ed
8 to
14
en
rolle
d in
EB
NF
Not
ava
ilabl
e
Pr
ovid
e lit
erac
y tra
inin
g to
at l
east
50,
000
pers
ons
age
15
to 5
0, o
f who
m 6
0 pe
rcen
t are
wom
en
2002
/3-
2005
/6
MEN
? A
PE
Num
ber o
f lite
racy
trai
ning
reci
pien
ts
Num
ber
of f
emal
e lit
erac
y tra
inin
g re
cipi
ents
126,
913,
in
clud
ing
70.9
70
wom
en
(56%
)
Te
st b
iling
ual c
urric
ula
in C
P cl
asse
s 20
05/6
M
EN, A
PE
Bili
ngua
l cur
ricul
a te
sted
O
ngoi
ng
St
udy
supp
ly o
f and
dem
and
for t
rade
s and
labo
r 20
03-2
005
Min
istry
of
C
ivil
Serv
ice
Stud
y re
port
Ong
oing
Pr
epar
e an
d im
plem
ent a
voc
atio
nal t
rain
ing
stra
tegy
20
03-2
005
M.F
.P.T
M
EN, p
rivat
e se
ctor
Stra
tegy
ado
pted
N
earin
g co
mpl
etio
n

79
Pi
llars
/Obj
ectiv
es
Act
ions
Ti
met
able
Pe
rson
s re
spon
sibl
e Pe
rfor
man
ce in
dica
tor
Stat
us
IV
. Im
prov
e th
e liv
ing
cond
ition
s of v
ulne
rabl
e gr
oups
Inte
grat
ed u
rban
dev
elop
men
t
Dev
elop
urb
an in
fras
truct
ure
and
serv
ices
20
03-2
005
MA
TUH
, M
TPT
U
rban
dev
elop
men
t pro
gram
ong
oing
Pr
epar
e an
d im
plem
ent
land
man
agem
ent
and
urba
n de
velo
pmen
t pla
ns
2003
-200
5 M
AT,
UH
Pl
ans d
evel
oped
and
impl
emen
ted
Not
com
plet
ed
Supp
ort
for
mic
roen
terp
rises
, SM
Es, a
nd e
mpl
oym
ent
Supp
ort t
he m
anag
emen
t and
em
erge
nce
of
prof
essi
onal
serv
ice
prov
ider
s 20
03-2
005
MEF
, MC
IA
Num
ber o
f pro
fess
iona
ls
Not
com
plet
ed
R
esum
e A
TETI
P ac
tiviti
es
2003
-200
5 M
PDC
A
TETI
P ac
tiviti
es re
sum
ed
Not
com
plet
ed
R
ehab
ilita
te
tech
nica
l tra
inin
g an
d ap
pren
tices
hip
cent
ers
2003
-200
5 M
EN,
MFP
TME
Num
ber o
f cen
ters
reha
bilit
ated
3
reha
bilit
ated
and
10
bein
g bu
ilt
C
reat
e an
eco
nom
ic a
nd te
chno
logi
cal
docu
men
tatio
n an
d in
form
atio
n ce
nter
20
04-2
005
MEF
, MC
IA
Cen
ter i
n op
erat
ion
Ong
oing
D
isse
min
ate
educ
atio
nal p
rogr
ams t
o pr
omot
e a
cultu
re o
f ent
repr
eneu
rshi
p 20
03-
2005
M
CIA
, C
CIA
MA
D
isse
min
atio
n of
edu
catio
nal p
rogr
amC
ompl
eted
Im
prov
e co
nsen
sus-
build
ing
arou
nd a
nd
coor
dina
tion
of a
ctio
ns in
supp
ort o
f Mis
s 20
03
MEF
, MC
IA
Coo
pera
tion
and
coor
dina
tion
impr
oved
O
ngoi
ng
Soci
al p
rote
ctio
n Le
ad IE
C c
ampa
igns
on
key
risk-
prev
entio
n m
easu
res
2003
-20
05
MC
, MA
SF
Num
ber o
f cam
paig
ns c
ondu
cted
N
ot c
ompl
eted
R
evis
e fa
mily
law
and
land
law
20
03-
2005
M
ASF
,MJ
Law
s rev
ised
N
ot c
ompl
eted
A
dapt
the
soci
al se
curit
y an
d pe
nsio
n sy
stem
s 20
03-
2005
M
FPTM
,M
EF
Soci
al s
ecur
ity a
nd p
ensi
ons
syst
ems
adap
ted
Ong
oing
Su
ppor
t exi
stin
g in
form
al c
risis
-res
pons
e sy
stem
s 20
03-
2005
N
ot c
ompl
eted
G
uara
ntee
gov
ernm
ent a
ssis
tanc
e in
cas
e of
m
ajor
dis
aste
rs
2003
-200
5 M
EF
War
ning
mec
hani
sms a
vaila
ble
War
ning
mec
hani
sms o
pera
tiona
l

80
Fo
cus/
Obj
ectiv
es
Act
ions
Ti
met
able
Pe
rson
s re
spon
sibl
e Pe
rfor
man
ce in
dica
tors
St
atus
V. R
esto
re a
nd sa
fegu
ard
ecos
yste
ms
St
reng
then
the
regu
lato
ry
fram
ewor
k an
d ca
paci
ty fo
r m
anag
ing
natu
ral r
esou
rces
Pass
law
s tra
nsfe
rrin
g ce
rtain
cho
ices
for
natu
ral r
esou
rce
man
agem
ent t
o us
ers
2003
-05
MEE
Le
gal a
nd re
gula
tory
pro
visi
ons
adop
ted
and
ente
red
in fo
rce
La
w 3
6/PR
/94
Dec
ree
107
Es
tabl
ish
loca
l nat
ural
reso
urce
man
agem
ent
com
mitt
ees
2003
-05
MEE
N
umbe
r of c
omm
ittee
s, gr
oups
, and
as
soci
atio
ns e
stab
lishe
d
52 C
ads e
stab
lishe
d by
the
PSA
OP
B
uild
the
capa
city
of i
nstit
utio
ns in
cha
rge
of
natu
ral r
esou
rce
man
agem
ent
2003
-05
MEE
N
umbe
r of s
uper
viso
rs a
nd
empl
oyee
s tra
ined
, res
ourc
es
allo
cate
d, n
umbe
r of g
roup
s and
as
soci
atio
ns tr
aine
d
300
fore
st ra
nger
s rec
ruite
d an
d tra
ined
in
2005
, 32
5 fo
rest
rang
ers r
ecru
ited
and
train
ed in
200
5
In
trodu
ce a
n en
viro
nmen
tal i
nfor
mat
ion
syst
em
2003
-05
MEE
Envi
ronm
enta
l dat
abas
e av
aila
ble
The
follo
win
g da
taba
ses a
re a
vaila
ble:
G
roun
dwat
er;
Surf
ace
wat
er;
Clim
atol
ogy;
Tr
eatie
s;
Proj
ects
; G
um a
rabi
c;
Pers
iste
nt O
rgan
ic P
ollu
tant
s;
Mon
itor l
izar
ds [V
arna
’s];
Fish
ery
reso
urce
s
Dra
ft a
natio
nal p
rogr
am to
mob
ilize
the
popu
latio
n in
supp
ort o
f the
env
ironm
ent
2003
-05
MEE
Ex
iste
nce
of n
atio
nal p
rogr
ams
Prog
ram
to c
omba
t des
ertif
icat
ion
W
ildlif
e pr
otec
tion
and
cons
erva
tion
prog
ram
Fi
sher
ies p
rom
otio
n pr
ogra
m
Wat
er re
sour
ces p
rogr
am
Clim
atol
ogy
and
met
eoro
logi
cal p
rogr
am
Impr
ove
dom
estic
ene
rgy
man
agem
ent
Prom
ote
sust
aina
ble
firew
ood
prod
uctio
n
2003
-05
MEE
/MA
La
nd a
rea
devo
ted
to fi
rew
ood
prod
uctio
n
700,
000
hect
ares
in th
e 10
0 vi
llage
s sup
ervi
sed
D
evel
op fo
rest
reso
urce
s as a
sour
ce o
f re
venu
e fo
r rur
al c
omm
uniti
es
2003
-05
MEE
/MA
Pr
opor
tion
of re
venu
e al
loca
ted
to
rura
l com
mun
ities
La
w 3
6 al
loca
tes 5
0% o
f rev
enue
to ru
ral
com
mun
ities
Incr
ease
the
invo
lvem
ent o
f rur
al p
opul
atio
ns
in n
atur
al re
sour
ce m
anag
emen
t 20
03-0
5 M
EE/M
A
Lega
l pro
visio
ns o
n m
onito
ring
fore
sted
are
as d
rafte
d fo
r loc
al la
nd.
The
prov
isio
ns tr
ansf
errin
g th
e po
wer
s to
the
com
mun
ities
, the
dem
arca
tion
of v
illag
e la
nds,
the
villa
ge d
evel
opm
ent p
lans
, the
nat
ural
re
sour
ces m
anag
emen
t agr
eem
ents
wer
e dr
afte
d an
d ar
e av
aila
ble

81
Focu
s/ O
bjec
tives
A
ctio
ns
Tim
etab
le
Pers
ons
resp
onsi
ble
Perf
orm
ance
indi
cato
rs
Stat
us
En
sure
that
the
tax
syst
em a
pplic
able
to w
ood
and
woo
d by
prod
ucts
has
a re
gula
tory
role
20
03-0
5 M
EE
Taxa
tion
of w
ood
and
woo
d by
prod
ucts
La
w 3
6 es
tabl
ishe
s tax
atio
n

82
V
I. E
nsur
e m
onito
ring
and
per
iodi
c as
sess
men
t of N
PRS
impl
emen
tatio
n
A
. Mon
itori
ng a
nd a
sses
smen
t rol
e A
sses
s the
ext
ent t
o w
hich
NPR
S ob
ject
ives
are
ach
ieve
d C
ondu
ct q
uant
itativ
e an
d qu
alita
tive
surv
eys
2003
-200
5 IN
SEED
, nat
iona
l st
atis
tical
syst
em,
Stee
ring
Com
mitt
ee
Surv
ey a
nd a
sses
smen
t rep
orts
O
ngoi
ng (
ECO
SIT
2)
U
pdat
e th
e N
PRS
2005
St
eerin
g C
omm
ittee
N
PRS
upda
ted
Not
com
plet
ed
B. I
nstit
utio
nal m
onito
ring
and
ass
essm
ent f
ram
ewor
k R
ole
of n
on-s
tate
org
aniz
atio
ns
Parti
cipa
te in
NPR
S im
plem
enta
tion
mon
itorin
g an
d as
sess
men
t mec
hani
sms
2003
-200
5 C
ivil
soci
ety
Num
ber o
f pov
erty
redu
ctio
n ac
tiviti
es
appr
oved
by
civi
l soc
iety
N
ot c
ompl
eted
Rol
e of
dec
entra
lizat
ion
Mak
e de
cent
raliz
ed lo
cal g
over
nmen
ts a
ccou
ntab
le b
y gr
antin
g th
em fi
nanc
ial a
uton
omy
and
the
dem
ocra
tic
elec
tion
of th
eir l
eade
rs
2003
-200
4 M
AT
and
Off
ice
of th
e Pr
ime
Min
iste
r N
umbe
r of d
ecen
traliz
ed te
rrito
rial
gove
rnm
ents
with
aut
onom
ous b
udge
ts
and
dem
ocra
tical
ly e
lect
ed le
ader
s
Not
com
plet
ed
St
reng
then
the
role
of l
ocal
ass
embl
ies f
or th
e se
lf-pr
omot
ion
of d
ecen
traliz
ed te
rrito
rial g
over
nmen
ts a
nd
peop
les.
O
ffic
e of
the
Prim
e M
inis
ter
MA
T
Loca
l ass
embl
ies w
ith d
ecis
ion-
mak
ing
auth
ority
N
ot c
ompl
eted
R
eint
rodu
ce sp
ecifi
catio
ns fo
r mun
icip
al a
ctiv
ities
(in
fras
truct
ure
cons
truct
ion
and
publ
ic u
tility
pro
ject
s)
2003
-200
5 O
ffic
e of
the
Prim
e M
inis
ter
MA
T
Mun
icip
al sp
ecifi
catio
ns a
vaila
ble
Com
plet
ed
Pe
rmit
dece
ntra
lized
coo
pera
tion
betw
een
loca
l m
unic
ipal
ities
and
fore
ign
mun
icip
aliti
es (t
win
citi
es
prog
ram
s) )
2003
-200
5 O
ffic
e of
the
Prim
e M
inis
ter
MA
T
Num
ber o
f agr
eem
ents
sign
ed fo
r co
oper
atio
n be
twee
n lo
cal m
unic
ipal
ities
an
d fo
reig
n m
unic
ipal
ities
5
Prot
ectio
n of
HIP
C re
sour
ces a
nd
oil r
even
ues a
gain
st c
orru
ptio
n R
evise
Law
001
/PR
on
the
man
agem
ent o
f oil
reve
nues
by
inco
rpor
atin
g H
IPC
reso
urce
s C
ontro
l and
mon
itor t
he u
se o
f HIP
C re
sour
ces a
nd o
il re
venu
es
2003
-200
5 M
FE, C
CSR
P, A
udit
Cha
mbe
r, Su
prem
e C
ourt,
Par
liam
ent
Law
revi
sed
Aud
it m
issi
ons a
nd se
ssio
ns c
arrie
d ou
t
Com
plet
ed
Res
ourc
e al
loca
tion
mec
hani
sms
Prep
are
reso
urce
allo
catio
n ce
iling
s ann
ually
20
03-2
005
Off
ice
of th
e Pr
ime
Min
iste
r, M
FE
Res
ourc
e ce
iling
s ava
ilabl
e an
nual
ly
Com
plet
ed
C. D
isse
min
atio
n of
mon
itori
ng a
nd a
sses
smen
t rep
orts
D
isse
min
ate
mon
itorin
g an
d as
sess
men
t rep
orts
U
se th
e m
edia
20
03-2
005
SC/N
PRS
MC
Pr
ivat
e se
ctor
pre
ss
Freq
uenc
y of
radi
o an
d te
levi
sion
br
oadc
asts
N
umbe
r of a
rticl
es p
ublis
hed
in th
e pr
ess
Not
com
plet
ed