sedp ii - planipolis
TRANSCRIPT

THE UNITED REPUBLIC OF TANZANIA
MINISTRY OF EDUCATION AND VOCATIONAL TRAINING
Education Sector Development Programme
Secondary Education Development Programme II(July 2010 – June 2015)
FINAL DRAFT
Dar es Salaam
June 2010

SEDP II – FINAL DRAFT – MAY 2010
ii

SEDP II – FINAL DRAFT – MAY 2010
i
FOREWORD [By Minister of Education and Vocational Training]

SEDP II – FINAL DRAFT – MAY 2010
ii
Table of Contents
FOREWORD [By Minister of Education and Vocational Training]........................... iTable of Contents .......................................................................................................... iiAcronyms ..................................................................................................................... ivEXECUTIVE SUMMARY.......................................................................................... vi1.0 INTRODUCTION................................................................................................... 1
1.1 Background........................................................................................................... 11.2 Policy Context....................................................................................................... 1
1.2.1 Tanzania’s Development Vision 2025 ...................................................... 21.2.2 The Education and Training Policy (ETP 1995) ....................................... 21.2.3 The Technical Education and Training Policy (1996) ............................... 31.2.4 National Higher Education Policy (1997) ................................................. 31.2.5 Education Sector Development Programme (ESDP 2008 – 2017) ........... 31.2.6 National Strategy for Growth and Reduction of Poverty
(NSGRP/MKUKUTA (2005) .................................................................. 41.2.7 Education For All (EFA).......................................................................... 51.2.8 Millennium Development Goals (MDGs)................................................. 5
1.3 The Strategic Importance of Secondary Education ............................................ 51.4 The Secondary Education Development Programme Phase One (SEDP I) ....... 61.5 Justification for SEDP II ................................................................................. 14
2.0 The Secondary Education Development Programme Phase Two (2010/11– 2014/15)......................................................................................................... 16
2.1 The Highlights of the Secondary Education Development Programme (SEDPII). 162.2 Goals, Objectives and Strategies.......................................................................... 17
2.2.1 Improvement of the Quality and Relevance ............................................ 172.2.2 Enhancement of Access and Equity........................................................ 252.2.3 Improvement of the Teaching Force and Teaching ProcessesError! Bookmark not defined.2.2.4 Improving Management Efficiency and Good Governance..................... 382.2.5 Cross-Cutting Issues .............................................................................. 42
3.0 Programme Implementation Strategies.......................................................... 463.1 The Decentralization of the Management of Secondary Schools ..................... 463.2 Delineation of Roles of Different Levels and Actors ....................................... 46
3.2.1 Ministry of Education and Vocational Training (MOEVT) ........................... 463.2.2 Prime Minister’s Office-Regional Administration and Local
Government (PMO-RALG) ................................................................... 473.2.3 Ministry of Finance and Economic Affairs (MOFEA)............................ 483.2.4 Regional Sub-Treasury........................................................................... 483.2.5 Secretariat .............................................................................................. 483.2.6 Local Government Authority.................................................................. 483.2.7 Ward Administration.............................................................................. 493.2.8 School Boards........................................................................................ 493.2.9 The School Management Team .............................................................. 503.2.10 Development Partners in Education........................................................ 503.2.11 Non State Actors (NSAs) ....................................................................... 51
3.3 Management of the Programme ...................................................................... 513.3.1 Management Structure ........................................................................... 513.3.2 Management of Construction Activities ................................................. 54
3.4 Monitoring and Evaluation of the Programme................................................. 54

SEDP II – FINAL DRAFT – MAY 2010
iii
3.4.1 Semi-Annual Reports ............................................................................. 553.4.2 Annual Evaluation ................................................................................. 553.4.3 End of Programme Evaluation................................................................ 55
3.5 Budget Summary ............................................................................................ 54
Annexes
Annex 1: Secondary School Enrolment Projections, 2010 – 2015 ............................... 71Annex 2: Secondary School Teacher Requirement and Availability Projections,
2010-2015 ................................................................................................... 72Annex 3: SEDP II Work Plan, 2010/11 – 2014/15 ...................................................... 73Annex 4: SEDP II Results Framework ........................................................................ 76Annex 5: SEDP II Results Monitoring Framework ..................................................... 79Annex 6: SEDP II Performance Indicators – Baseline Data, 2009 ............................... 80Annex 7: Selected Unit Costs and Specifications by Program Area............................. 81Annex 8: SEDP II – Budget and financing scenarios................................................... 83

SEDP II – FINAL DRAFT – MAY 2010
iv
Acronyms
AIDS - Acquired Immunodeficiency Syndrome
A-Level - Advanced Level
BEST - Basic Education Statistics for Tanzania
B.Sc. - Bachelor of Science
CBOs - Community Based Organizations
CIS - Chief Inspector of Schools
CD - Council Director
CSEE - Certificate of secondary Education Examination
CSS - Community Secondary Schools
D by D - Decentralization by Devolution
DC - District Commissioner
DEO - District Education Officer
DSEO - District Secondary Education Officer
DPS (RALG) - Deputy Permanent Secretary (Regional Administration and
Local Government)
DPS (E) - Deputy Permanent Secretary (Education)
EMAC - Education Materials Approval Committee
EMIS - Education Management Information System
ESMIS - Education Sector Management Information System
ESDC - Education Sector Development Committee
ESDP - Education Sector Development Programme
GDP - Gross Domestic Product
GER - Gross Enrolment Ratio
Govt - Government
HIV - Human Immunodeficiency Virus
ICT - Information Communication Technology
IEC -
IN-SET - In-Service Training
LGAs - Local Government Authorities
M & E - Monitoring and Evaluation

SEDP II – FINAL DRAFT – MAY 2010
v
MKUKUTA - Mpango wa Kukuza Uchumi na Kupunguza Umaskini
Tanzania (National Strategy for Growth and Reduction of
Poverty)
MIS - Management Information System
MoEVT - Ministry of Education and Vocational Training
MOFEA - Ministry of Finance and Economic Affairs
MTEF - Medium-Term Expenditure Framework
NA - Not Available
NSA - Non-State Actors
NER - Net Enrolment Ratio
NGOs - Non-Governmental Organizations
ODL - Open Distance Learning
O-Level - Ordinary Level
OPRAS - Open Performance Review and Appraisal System
PEDP - Primary Education Development Programme
PETS - Public Expenditure Tracking Survey
PMO - RALG - Prime Minister’s Office, Regional Administration and Local
Government
RAS - Regional Administrative Secretary
REO - Regional Education Officer
SEDP I - Secondary Education Development Programme I
SEDP II - Secondary Education Development Programme II
STDs - Sexually Transmitted Diseases
TCs - Teachers’ Colleges
TDMS - Teachers Development and Management Strategy
TIE - Tanzania Institute of Education
T/LM - Teaching and Learning Materials
TRCs - Teachers Resource Centers
TSD - Teachers Service Department
‘TUSEME’ - “Let Us Speak Out”
WB - The World Bank
WEC - Ward Education Coordinator

SEDP II – FINAL DRAFT – MAY 2010
vi
EXECUTIVE SUMMARY
The Secondary Education Development Programme II (SEDP II) is a continuation of
SEDP I, which was implemented between 2004 and 2009, building on the national
goals of secondary education provision. It also builds on national and international
reforms regarding the education sector which have taken place in the last 15 years.
Some of these reforms are based on key policy documents such as the Tanzania
Development Vision 2025, the National Strategy for Growth and Reduction of
Poverty (NSGRP – commonly referred to by its Kiswahili acronym: MKUKUTA),
the Education and Training Policy of 1995, the Education Sector Development
Programme (ESDP, 2001) and the Millennium Development Goals (MDGs).
Overall the objectives of SEDP I were to improve access with equity, quality,
management and delivery of secondary education in Tanzania. Review of SEDP I
implementation has shown that the Programme was most successful in improving
access and equity. The number of secondary schools has more than tripled between
2004 and 2009 to serve different underserved communities and so has the number of
enrollees. Despite these successes, there have been a number of challenges, including
the following:
Poor performance in secondary education examinations, with most students
getting marginal pass of Division IV or failing completely.
Acute shortages of teachers, especially in the sciences and mathematics, with
many students not able to do these subjects at all.
Asymmetrical deployment of teachers of required, whereby urban areas have
an advantage in recruiting more and better teachers compared to rural
community secondary schools, most of which have an acute shortages of
teachers.
Inequalities in learning environments among different schools resulting in
inequalities of learning outcomes, with girls doing poorly in both participation
rates and pass rates, especially in science and mathematics subjects, and
community secondary schools doing consistently poorly.
Insufficient infrastructure, including many construction projects that started
under SEDP I, but were not completed.

SEDP II – FINAL DRAFT – MAY 2010
vii
Lack of, or non-use of, laboratories in most schools resulting in students doing
the science theoretically, and most of them doing poorly. This poor
performance in science subjects has, in turn, resulted in an avoidance
syndrome, with most students choosing to enrol in social science/arts subjects,
rather than natural sciences.
Poor teaching approaches in the classroom, as it is teacher-centered, with
students relying heavily on the teacher and old notes, and classroom time often
not being used efficiently and effectively for mental engagement of the
students.
Low transition rates (hardly 30%) from Ordinary to Advanced Level
secondary education due to limited availability of Form 5 places.
Limited school management skills of some Heads of Schools affecting daily
running, academic performance and financial management of schools.
Increasing number of students from poor households in relation to available
resource for provision of scholarship grants.
Limited access to secondary education for nomads, marginalized groups and
disabled learners.
To address these issues, the SEDP II will focus more on the following five areas:
(a) Improvement of quality and relevance: This will focus on the development
and promotion of independent learning, critical thinking and analytical skills,
through: the restoration of textbook culture and wide reading of different
materials; improving the learning and teaching environment; and time-on-task
management for effective learning; improving science teaching at all levels;
and, introducing Information Communication Technology (ICT) as a tool for
teaching and learning.
(b) Enhancement of access and equity: In addition to consolidating the
expansion achieved through SEDP I, SEDP II will focus on: increasing A-
Level participation rates, especially in the sciences; improving girls’
participation and performance at all levels; improving access to secondary
education for nomads, marginalized groups and disabled learners; completing
tasks such as expansion of Form 5 and Open and Distance Learning; and,
SEDP II – FINAL DRAFT – MAY 2010
viii
completing construction, including sanitation facilities, started during SEDP I;
as well as construction of new structures, where required.
(c) Improvement of the teaching force and teaching process: This key area
will focus on attracting, training, and retaining adequate numbers of high
quality teachers through incentive systems and rationalization of ratios
between natural science and social sciences/arts subjects, diploma and degree
holders. The focus on the teaching process will be on improving pupil/teacher
interaction in classrooms, improving the continuous assessment process of
students so that the learning is not solely based on one final examination
result, and ensuring that student-centered methodologies/pedagogy are
reinforced in the classroom.
(d) Improving management efficiency and good governance: This area will
focus on: improved accountability of all actors in accordance with the public
service framework; implementation of Open Performance Review and
Appraisal System (OPRAS) at all levels; and, the institutionalization and use
of EMIS. Concomitantly, key human resources within the sector will be
regularly reviewed for improvement.
(e) Institutionalization of cross-cutting issues: This will focus on further
deepening and integration of topics such as gender, improved sanitation and
greening of the environment, patriotism, and human rights in mainstream
curriculum and school management. In addition, sensitization and awareness
campaigns on HIV/AIDS, child abuse and gender-based violence will be
intensified, and guidance and counseling will be provided.
Objectives for each of the key areas are detailed in Section 2 of the main document,
together with corresponding specific objectives, strategies and targets.
SEDP II will be implemented by several stakeholders, including: the Ministry of
Education and Vocational Training (MoEVT); the Prime Minister’s Office – Regional
Administration and Local Government ( PMO – RALG); Regional Secretariats; Local
Government Authorities (LGAs); Ward Level officers; School Boards and School
Management Teams; Non-State Actors; and, Development Partners. With the
decentralization of the management and administration of secondary schools, the roles
SEDP II – FINAL DRAFT – MAY 2010
ix
of these actors have been revisited, clarified and delineated at all levels. These roles
are elaborated in Section 3 of the main document.
SEDP II will be closely monitored and regularly reviewed to make sure it is on track.
A clear work plan and results-based monitoring framework are included in Annexes 3
and 4 of the main document respectively. Follow up and supervision activities will
continue within the Government structure to unblock any bottlenecks that may arise in
the course of the implementation of the Programme.
Full implementation of SEDP II is expected to cost Tshs 3,022,601 Millions over five
years, from 2010 to 2014. Approximately Tshs 1,586,103 (52.5%) of this budget is
required for teachers’ salaries alone.
Funding for SEDP II is expected to come from the Central Government, the LGAs,
and DPs. Local communities will also contribute financially and through physical
involvement in the implementation of the Programme. Budget scenarios included in
the main document provide an overview of how activities can be reduced or increased
in keeping with actual funds available.

SEDP II – FINAL DRAFT – MAY 2010
1
1.0 INTRODUCTION
1.1 Background
The Secondary Education Development Programme II (SEDP II) is a continuation of
SEDP I, which was implemented between 2004 and 2009, building on the national
goals of secondary education provision. The programme vision, as reflected in the
Education Sector Development Programme (ESDP) 2008 - 2017 document, is to
continue to have upgraded and coherently planned, managed and monitored education
sector, secondary education sub-sector inclusive, that will develop human capital in
order to boost economic growth and eliminate poverty. As in SEDP I, the changes,
reforms and interventions reflected in the SEDP II will continue to improve learning
outputs and outcomes through teacher capability improvements and promotion of
teaching and learning environments. These improvements will lead to increased
achievement and competencies of learners and teachers, which in turn will also reflect
efficient and effective output/outcome of secondary education.
The SEDP II is expected to sustain and consolidate gains attained through
implementing the educational goals in areas of quality, management, and conducive
teaching and learning environment, as expressed in the performance evaluations in
SEDP I. The Programme also builds on national and international reforms. These
include: the Tanzania Development Vision 2025: the National Strategy for Growth
and Reduction of Poverty (NSGRP - commonly known by its Kiswahili acronym:
MKUKUTA); the Education and Training Policy of 1995;, the Education Sector
Development Programme (ESDP, 2001); and, the Millennium Development Goals
(MDGs).
1.2 Policy Context
The country has benefited from many policy directives and reforms which have been
put in place during the last 15 years. These have shaped thinking and guided design
and implementation of educational activities and programmes. These key reforms and
directives are highlighted below.

SEDP II – FINAL DRAFT – MAY 2010
2
1.2.1 Tanzania Development Vision 2025
(a) Development Vision
Tanzania Development Vision 2025 accords high priority to the education sector,
which is considered to be pivotal in bringing social and economic transformation, as
described in the following statement:
Education should be treated as a strategic agent for mind-set transformation
and for the creation of a well-educated nation, sufficiently equipped with the
knowledge needed to competently and competitively solve the development
challenges which face the Nation. In this light, the education system should be
restructured and transformed qualitatively with a focus on promoting creativity
and problems solving (URT 2000:19).
Thus, the Education system in Tanzania, including secondary education, plays a
critical role in the development of the nation through continuous production of
knowledgeable, creative, and problem-solving graduates.
(b) Education Vision
The Tanzania Development Vision 2025 states Tanzania’s education vision as: “a
well-educated, knowledgeable and skilled Tanzanian able to competently and
competitively cope with political, social, cultural, economic and technological
development challenges at national and international levels.”
In response, the Government seeks to provide equitable quality education and
vocational skills to all. This requires adequate numbers of quality teachers, a
conducive environment for stakeholders willing to participate in providing education
delivery, and conducive learning/teaching environments for students and teachers at
all levels.
1.2.2 The Education and Training Policy (ETP 1995)
The major objectives of the ETP are: improving the quality of the education process;
increasing and improving access and equity for all children; devolving authority to
local levels; and, broadening the financial base for supporting education.
This Policy established three main purposes for secondary education, namely to:

SEDP II – FINAL DRAFT – MAY 2010
3
(a) consolidate and broaden the scope of ideas, knowledge, skills and concepts
already acquired at primary education level;
(b) prepare students for tertiary, higher, vocational, technical and professional
education and training; and,
(c) prepare students for the world of work.
1.2.3 The Technical Education and Training Policy (1996)
This Policy established three main purposes for Technical Secondary Schools,
namely, to ensure that:
(a) an appropriate and cost effective vocational education is introduced to replace
the diversified course package;
(b) teaching of science and technology is strengthened in technical secondary
schools; and,
(c) training standards are prepared for different fields of vocational education to
be taught in the current technical secondary school.
1.2.4 National Higher Education Policy (1997)
The Higher Education Policy aims to expand enrolment in science subjects, which
will encourage increased annual pupil intake into science subjects at secondary school
level. In this respect, the policy indicates the need to expand physical and
pedagogical facilities for natural science subjects (e.g. laboratories, scientific
equipment, chemicals) within secondary schools.
1.2.5 Education Sector Development Programme (ESDP, 2008–2017)
Following the ETP (1995), the Education Sector Development Programme (ESDP)
was initiated in 1997, as a strategy towards a Sector-Wide Approach (SWAP) to
education development. The main goal of SWAP was to achieve the long-term
human development and poverty reduction targets and to redress the problems of
fragmented interventions through projects, so as to promote collaboration and
partnership among all stakeholders, using pooled human, financial and material
resources. This collaboration is hinged on planning, implementing, monitoring and
evaluation of education delivery.
SEDP II – FINAL DRAFT – MAY 2010
4
ESDP objectives for the secondary education sub-sector are derived from the major
objectives of ETP (1995). In 2008, the ESDP was reviewed to align with MKUKUTA
and the Joint Assistance Strategy for Tanzania (JAST), as well as to incorporate key
education programmes, such as PEDP and SEDP.
Some of the strategies and activities highlighted in ESDP 2008-2017, which will be
addressed through SEDP II include:
(a) enable practical science to be delivered through well-stocked science
laboratories;
(b) recruit and retain, the available trained secondary school teachers, including
teachers for special needs students;
(c) provide scholarship grants to students from low income households;
(d) strengthen in-service courses for up-grading and professional development of
secondary school teachers;
(e) ensure that trainee teachers are effectively mentored during teaching practice
and when posted to schools as probationer teachers;
(f) increase funding for the preparation and provision of teaching and learning
materials;
(g) improve provision of water and sanitary facilities to secondary schools;
(h) strengthen Examinations Council in setting standards and quality assurance;
(i) strengthen Inspectorate bodies to monitor and maintain standards for quality
improvement at school and other levels ;
(j) improve/expand use of ICT for teaching and learning; and,
(k) improve facilities and systems of care for teachers, non teaching staff, and
students affected by HIV and AIDS.
1.2.6 The National Strategy for Growth and Reduction of Poverty
(NSGRP/MKUKUTA, 2005)
In 2005, the Government launched the National Strategy for Growth and Reduction of
Poverty (NSGRP - commonly referred to by its Kiswahili acronym, MKUKUTA) to
address issues of economic growth and poverty reduction. It was expected that the
steady GDP growth should, in the long run, succeed in reducing the severity and

SEDP II – FINAL DRAFT – MAY 2010
5
extent of poverty in the country. This will require better management of the
economy, equitable distribution of economic gain, greater strategic investments, and
improved technological and labour productivity. The strategy recognizes the vital
importance of the expansion and qualitative improvement of the whole education
system, and especially secondary education system. This is essential for any
acceleration in economic growth and productivity. All this is hinged on having a high
quality labour force, which in turn is dependent on the quality of education and skills
imparted in the training system. There is no doubt today that, all things being equal,
education is the greatest equalizer of income disparities in all countries.
1.2.7 Education For All (EFA)
Tanzania is among the countries which signed the commitment to implement
Education for All (EFA) goals. The purpose of EFA is defined as meeting the basic
learning needs by 2015 for every person (Child, youth and adults) to benefit from
educational opportunities. EFA Goal 2 on access and Goal 5 on Gender remains a
strong agenda in education implementation in Tanzania and for that reason part and
parcel of development of secondary education plans.
1.2.8 Millennium Development Goals (MDGs)
The Millennium Development Goals (MDGs) are to be achieved by 2015. The Goals
respond to the world's main development challenges. The MDGs are drawn from the
actions and targets contained in the Millennium Declaration that was adopted during
the UN Millennium Summit in September 2000. Goal 2, 3, 6 and 7 on universal
primary education, promotion of gender equality, combating HIV/AIDS, malaria and
other diseases and ensuring environment sustainability respectively remain part and
parcel of national development plans.
1.3 The Strategic Importance of Secondary Education
Secondary education occupies a pivotal role in the functioning of the economy and the
education system itself. Experience shows that, the majority of the people in both the
private and public sectors are expected to be secondary education leavers. The whole
primary education system relies on teachers who are a product of the secondary
education system. Candidates of higher and tertiary education and training are
products of the secondary education system. This is the essence of being pivotal, or
the lynch pin.
SEDP II – FINAL DRAFT – MAY 2010
6
Important externalities of secondary education are increasingly being recognized in
family planning, education of the off-springs, political participation and health. Good
quality secondary education is a prerequisite for good quality human life, labour skills
and economic productivity. Secondary education is thus a necessary, though not
sufficient, condition for poverty reduction in the entire population. In effect, a robust
secondary education will create the necessary foundation for a vibrant and viable
middle class essential for the contemplated economic boost placing the country
among middle income countries.
1.4 The Secondary Education Development Programme, Phase One (SEDP I)
The Secondary Education Development Programme launched by the Government in
July 2004 was intended to be implemented in three phases of five years each. The
Programme which was developed within the context of the broad Education Sector
Development Programme (1997) and the Secondary Education Master Plan (2000)
had five key objectives, namely: improvement of access; improvement of equity;
improvement of quality; management reforms and improvement of education
management systems (monitoring and evaluation including improvement of data
collection system).
(a) Improvement of Access
The goal was to reach 50% of cohort participation and transition rate from primary to
secondary education by 2010 through:
(i) optimum utilization of teachers, tutors and physical facilities;(ii) expansion of school facilities especially in underserved areas;
(iii) support to the non-government sector;
(iv) expansion of Form Five and Six;
(v) expansion of Open and Distance learning;
(vi) reduction of dropout, repetition and failure rates at all levels; and
(vii) Improving affordability and reduction of household education costs.
A formative review of SEDP I done in June 2009 shows key achievements under
access as follows:

SEDP II – FINAL DRAFT – MAY 2010
7
Increase in enrolment of Form 1 to 4 from 432,599 in 2004 to 1, 466,402 in
2009 (249% increase) and enrolment of Form 5 and 6 from 31,001 in 2004 to
64,843 in 2009 (109% increase).
Gross Enrolment Ratio for Forms 1-6 increased from 9.4% in 2004 to 31.3%
in 2009; Net Enrolment Ratio increased from 5.9% in 2004 to 27.8% in 2009;
The Net and Gross Enrolment Ratios at Form 1 – 4 increased substantially
though they did not reach the targeted 50%. NER increased from 8.4% of
2004 to 29.1in 2009, while GER increased from 12.9% of 2004 to 43.6 in
2009. These ratios are expected to rise further in the coming years;
Transition rate from primary to secondary education improved from 36.1% in
2004 to 51.6% in 2009. This is above the target set at 50% by 2010. The
success in improvement of access is largely due to the increase in the number
of schools.
The number of secondary schools increased from 1,291 (government 828 and
463 non-government including seminaries) in 2004 to 4,102 in 2009: (3,283
Government and 819 non-governments) which is an increase of 296%. Most
of these Schools have been built through community support in their wards.
A good number of learners enrolled with the Open and Distance Learning
(ODL) under the Institute of Adult Education. Reports at June 2009 showed
an increase from 16,801 learners in 2004 to 35,804 learners in 2009. This is
below the targeted number of 50,000 by 2010. However these numbers do not
include learners who do their Secondary education privately (not through
IAE). Table 1 shows the numbers of those sitting for CSEE as private
candidates in the years 2005 – 2009.
Table 1: Number of Candidates Registered for CSEE 2005 – 2009
Type of Candidate 2005 2006 2007 2008 2009School Candidates 85,292 87,930 127,993 166,443 254,206Private Candidates 39,592 59,679 71,290 75,029 95,534
Total 124,884 147,609 199,283 214,742 349,740

SEDP II – FINAL DRAFT – MAY 2010
8
On the other hand, there has been a big drop out in certain areas of the country
mainly due to truancy. Reasons for truancy are many including those caused
by economic hardships, loss of parents, etc.
(b) Improvement of Equity
The goal was to ensure equity in access to, and participation particularly in
underserved areas by geographical locations, gender and income inequalities through:
(i) allocating more resources in education to underserved areas;
(ii) providing scholarships to students from poor families;
(iii) improving retention and performance of girls;
(iv) improving facilities in schools of children with disabilities;
(v) improving education provision for the marginalized social groups; and,
(vi) reducing school fees for day students.
The situation regarding equity is as follows:
Secondary education places are still offered at 1:1 ratio for boys and girls. All
the community-built schools are supposed to admit equal numbers of boys and
girls. However there has been a big difference between boys and girls joining
Form 1 in government schools especially in the years 2008 and 2009 (BEST
2009). This is mostly because of poor performance of girls at PSLE. (See Table
2 for trend in performance of girls at PSLE in 2005 – 2009). As a result of this
(and other factors leading to dropouts for girls) the percentage of female
enrolments at Forms 1 – 4 has dropped from 47.3 in 2005 to 44.7 in 2009.
However the percentage has risen from 37.8 in 2005 to 41.5 in 2009 at Form 5
level because of deliberate efforts to avail more places for girls at this level. The
number of schools admitting girls at this level has been increased from 53 in
2006 to 86 in 2010.

SEDP II – FINAL DRAFT – MAY 2010
9
Table 2: Performance at PSLE, 2005-2009
Candidates Sat Candidates Passed % of Candidates Passed
YEAR Male Female Total Male Female Total Male Female Total
2005 253,361 240,585 493,946 173,645 131,291 304,936 68.54 54.57 61.76
2006 337,271 326,992 664,263 257,334 210,945 468,279 76.30 64.51 70.50
2007 396,944 376,609 773,553 248,215 170,921 419,136 62.53 45.38 54.18
2008 514,106 503,759 1,017,865 307,196 229,476 536,672 59.75 45.55 52.72
2009 496,446 502,624 999,070 276,083 217,250 493,333 55.65 43.25 49.41
Great successes have been scored in availing secondary education places in the
underserved areas. Some districts in 2004 had less than 3 schools (example
Ngorongoro and Kiteto). In 2009 almost all wards have a Secondary School.
Regions which had less than 50 Secondary Schools in 2005, have more than
100 Schools in 2009. Some of those regions are: Lindi 42 schools to 117
schools , Singida from 44 to 150, Tabora from 46 to 164, Rukwa from 46 to
103, Manyara from 46 to 123 and Mtwara from 50 to 136 schools.
Despite these successes, there are still some challenges to be addressed,
including:
(i) Many “schools” still have incomplete infrastructures;
(ii) The quality of the infrastructures and school (site) plans is poor,
(iii)Some parents do not take their children to school;
(iv)Insufficient qualified teaching staff especially in the hard–to-reach
areas; and
(v) Insufficient teaching and learning materials.
From January 2005 the School fees for Day students was reduced from Tsh.
40,000/= to 20,000/= (about USD 15) so that many parents would be able to
afford taking their children to School. This is still the fee in 2009. The
government is expected to provide the topping up.
In the same year (2005) through SEDP the Government was to sponsor 12,000
students joining Secondary Schools each year and sustain that sponsorship for
all the years of their Secondary education. The scholarship programme has
helped more than 48, 953 students from 2005 to 2009. The scholarship money
however thinned out after the World Bank support to SEDP Phase I was fully

SEDP II – FINAL DRAFT – MAY 2010
10
disbursed in 2007. From 2008 only Tsh 4,241,991,300 was made available for
scholarship by the Government. Sustainability of the scholarship program is
still a challenge.
The Government revenues collected through schools fees is still on the lower
side because not all students are paying the due fees. Only about 75% of the
expected fees are actually collected. Also the topping up through
compensation grants from the Government for day schools given the reduction
of school fees from 40,000 Tshs to 20,000 Tshs is yet to be fully achieved. .
Therefore, schools have been forced to seek further contributions from parents
or go without certain school necessities.
Successes have been registered in assisting students who have disabilities
(physical or mental). Facilities like Braille machines for the blind were given
to schools. Albino students were given special considerations on
accommodation given current issues on their security. Several Schools have
started building infrastructures which are friendly to those with physical
disabilities. However, this work needs to be spread throughout all schools. As
many students with disabilities show up, more schools for them (inclusive or
otherwise) have to be built and be placed more strategically across the country.
(c) Improvement of Quality
The overall aim was to raise the pass rate of Div. I-III from 36% (2004) to 70%
(2009) through:
(i) in-service courses for up-grading and continuous professional
development of teachers;
(ii) curriculum review;
(iii) improvement of school libraries;
(iv) providing capitation grant for teaching and learning materials and other
charges;
(v) improvement of examination structure, type and quality;
(vi) expansion of production of Diploma and Degree teachers; and
(vii) sensitization and education on HIV/AIDS, gender and environment.

SEDP II – FINAL DRAFT – MAY 2010
11
During the years of SEDP I (2004-2009) the following were observed:
Schools have been using improved syllabus for O-level since 2005 and, those
for A-levels started being used in the 2009/10 school year.
Regular in service training for science and mathematics teachers have been
conducted. However many teachers have not had this opportunity yet.
Pass rate at Certificate for Secondary Education Examination of Division I –
III is still under 40% after 5 years of SEDP-1 (The plan was to increase pass
rate from 36% in 2004 to 70% in 2009). The performance of girls is still
lower than that of boys as shown in Table 3.
Table 3: Performance of Girls vs Boys at CSEE
Candidates Sat Candidates Passed(Division I – III)
% of Candidates PassedYear
Male Female Total Male Female Total Male Female Total
2005 47,639 37,653 85,292 18,860 9,703 28,563 39.59 25.77 33.49
2006 49,684 36,181 85,865 20,110 10,515 30,625 40.48 29.06 35.67
2007 69,457 55,831 125,288 27,735 15,648 43,383 39.93 28.03 34.63
2008 90,918 71,937 162,855 26,896 13,539 40,435 29.58 18.82 24.83
Capitation grant of Tshs 20,223,591,000 was sent to all Government schools
for teaching and learning materials. This amount gave an average of Tshs
7,634 per student per year. However, this amount did not match with the
Tsh.25,000 planned in SEDP I.
In the area of Teaching and Learning materials, 465,830 books were donated
by USAID and sent to a variety of schools. Some Partners have also donated
books for libraries either straight to schools or through the Tanzania Libraries
Service Board (TLSB). However, many schools do not have libraries not even
a reading or resource room. Only 57 libraries have been built by 2009 out of
the 2,406 libraries planned through SEDP – I.
A total of 28,100 teachers have been recruited and posted to government
schools between 2005 and 2008. Also places for teacher trainees have

SEDP II – FINAL DRAFT – MAY 2010
12
increased, both at degree and diploma level. Whereas there were 6,282
diploma teacher trainees in 2005, there were 14,088 such trainees in 2009.
Similarly, there was only one university training teachers in 2005 (The
University of Dar es Salaam) the number increased to more than 10 public and
private universities and colleges offering education courses by 2009. This year
alone, 11,000 have been registered for education degrees in both public and
private universities. However, teacher production from these universities on
year basis is still lower than the requirement. Another challenge is that many
teacher-graduates do not report to rural schools when they are posted there.
As a result there is still a big shortage of teachers and the TPR in public
schools has risen from 1:26 in 2005 to 1:49 in 2009.
Data on current staffing situation, as obtained from BEST, 2009, is as
summarized in Table 4.
Table 4: Teacher Situation in Government and Private Secondary Schools (2009)
Type of School Graduates Diploma Licensed/Other TotalGovernment 3357 16725 6350 26432Private 2479 3307 1736 7522Total 5836 20032 8086 33954
Source: BEST (2009)
These figures give a ratio of 23:77 between degree and diploma holders or
17:83 between degree and the rest. This ratio is a variance with the
requirement of the Education and Training Policy which called for diploma
teachers to teach Form 1 and Form 2, and degree holders to teach Forms 3, 4,
5 and 6. Some countries today require that only graduates should teach in
secondary schools, especially in key and technical subjects such as the
sciences, mathematics, geography and foreign languages. It is for these
reasons that SEDP II is focusing on plans to reverse this situation.
(d) Management Reforms
The overall goal of SEDP I was to increase efficiency and responsiveness in the
delivery of secondary education. This has been achieved through devolving the
management and supervision of secondary schools from the Central Government to
the Local Government Authorities (LGAs) in 2008.

SEDP II – FINAL DRAFT – MAY 2010
13
In this respect, the following progress has been made:
Strengthening secondary education coordination between the MOEVT and the
LGAs by appointing District Secondary Education Coordinators in 2007.
In May 2009, District/Council Secondary Education Officers, (DSEO), were
appointed to replace the Coordinators. The office was further strengthened by
appointing one Senior Officer, the Academic Officer to work with the DSEO
on all issues regarding the operation of Secondary Schools in each LGA.
A number of operational activities are done by the LGAs. These include:
employment of teachers and their transfers, transfer of students, running of
schools, etc. However capacity needs to be strengthened at LGAs. MoEVT
and PMO-RALG also needs to strengthen their supervisory role directly from
the centre.
The school management has been improved by training Heads of Schools and their
assistants on the basics of running schools through capacity building offered from
time to time by the Agency for Development of Education Management (ADEM).
The School Boards will be strengthened by both appointment and orientation of their
responsibilities.
(e) Improvement of Education Management System
The principal goal was to make sure that the MOEVT becomes more efficient in
executing its core functions of policy formulation, monitoring and evaluation,
providing regulatory framework, coordination and optimization of resource use. This
was to be achieved through:
(i) strengthening the inspectorate and support mechanisms;
(ii) improving access to and use of Education Management Information
System (EMIS);
(iii) management capacity building at all levels;
(iv) communication and publicity of the plan; and
(v) strengthening monitoring and evaluation.
The opening of many new schools has created pressure on school inspection. The
number of secondary schools inspected per year increased from 539 in 2005 to 1880
in 2008. However, this is only 49.5% of the total number of schools which implies
SEDP II – FINAL DRAFT – MAY 2010
14
an average of one visit to school for every two years. The regulation is that a school
should be inspected at least once in every two years.
Secondary education statistics are necessary for development at this level of
education. There has been great improvement in the collection of data. However,
most data are obtained with some difficulty, hence the need to strengthen the
Management and Information System (MIS) of the MoEVT and PMO-RALG. This
will require more capacity building for the District/Council Education Officers.
MOEVT and PMO-RALG will continue to budget for this in the coming financial
years.
Overall, the Government recognizes that if these challenges are not addressed, they
will hinder the delivery of equitable and quality secondary education and the
attainment of the NSGRP targets, MDGs and other national, regional and
international commitments.
1.5 Justification for SEDP II
SEDP II is a natural continuation of SEDP I as part of the on-going education reform
process and as foreseen since the inception of SEDP I in July 2004. Furthermore,
SEDP II aims to accommodate the ESDP (2008–2017), which is the base of all sub-
sector programmes, including PEDP II (2007-2011) and HEDP (2010-2014). The
linkages among these programmes are vital.
It is important to realize that the SEDP is a long-term strategy. SEDP II is the second
phase of implementation of the strategy. The demand for quality secondary education
among Tanzanians is still high. As noted already some milestones have been achieved
through SEDP I. However, a number of activities were not fully implemented and are
still necessary to continue implementing within the context of SEDP I objectives.
There is thus need to move forward to consolidate the gains of the first phase of SEDP
and move ahead implementing the program in SEDP II guided by the long term SEDP
objectives already stipulated in SEDP I. This underlines the fact that SEDP II
objectives are similar to those in SEDP I and only modalities of implementation may
in some cases vary especially given the increased decentralization in the recent years.

SEDP II – FINAL DRAFT – MAY 2010
15
The review of SEDP I and an analysis of the current challenges lead to emphasizing
that the following issues should be addressed in SEDP II.
Poor performance in secondary education examinations, with most students
getting marginal pass of Division IV or failing completely.
Acute shortages of teachers, especially in the sciences and mathematics, with
many students not able to do these subjects at all.
Asymmetrical deployment of teachers of required qualifications have been
varying from place to place whereby urban areas having an advantage in
recruiting more and better teachers compared to rural community secondary
schools most of which have acute shortages of teachers.
Inequalities in learning environments among different schools resulting in
inequalities of learning outcomes, with girls doing poorly in both participation
rates and pass rates, especially in science and mathematics subjects, and
community secondary schools doing consistently poorly.
Insufficient infrastructure, including many construction projects that started
under SEDP I but were not completed.
Lack of or non use of laboratories in most schools resulting in students doing
the science theoretically, and most of them doing badly, which in turn has
resulted in an avoidance syndrome, with most students enrolling in social
science/arts subjects, rather than natural sciences.
Poor teaching approaches in the classroom, as it is teacher-centered, with
students relying heavily on the teacher and old notes, and classroom time not
being used efficiently and effectively for mental engagement of the students.
Low transition rates (hardly 30%) from Ordinary to Advanced Level
Secondary Education due to limited Form 5 places.
Limited school management skills of some Heads of Schools affecting daily
running, academic performance and financial management of schools.
Increasing number of students from poor households in relation to available
resource for provision of scholarship grants.
Limited access to secondary education of nomads, marginalized groups and
disabled learners.

SEDP II – FINAL DRAFT – MAY 2010
16
2.0 The Secondary Education Development Program, Phase Two (2010/11-2014/15)
2.1 Highlights of the Secondary Education Development Programme
The Secondary Education Development Programme Phase II (SEDP II) is a logical
and necessary sequel to SEDP I. It covers both levels of secondary education: the
four year O-level cycle and the two year A-level cycle. It captures strengths,
weaknesses, challenges, and opportunities created by SEDP I. It builds from ESDP
2008-2017, annual sector reviews, ongoing Local Government Reforms, and
consultative dialogues. It focuses on the following five key areas:
a) Improvement of quality and relevance. This will focus on the development
and promotion of independent learning, critical thinking and analytical skills,
through the restoration of textbook culture and wide reading of different
materials, improving the learning and teaching environment, and time on task
management for effective learning as well as improving science teaching in all
levels, and introducing Information Communication Technology (ICT) as a tool
for teaching and learning
b) Enhancement of access and equity. In addition to consolidating expansion
achieved through SEDP I, SEDP II will focus on: increasing A-Level
participation rates, especially in the sciences; improving girls’ participation and
performance levels; improving access to secondary education of nomads,
marginalized groups and disabled learners; completing tasks such as expansion
of Form V, Open and Distance Learning; completing construction, including
sanitation facilities, started during SEDP I; and construction of new structures
where required.
c) Improvement of the teaching force and teaching process. This key area will
focus on attracting, training, and retaining adequate numbers of high quality
teachers through incentive systems and rationalization of ratios between natural
science and social sciences/arts subjects, diploma and degree holders. The focus
on the teaching process will be on improving pupil/teacher interaction in
classrooms, improving the continuous assessment process of students so that the
learning is not solely based on one final examination result and ensuring that
child centered methodologies/pedagogy are reinforced in the classroom.

SEDP II – FINAL DRAFT – MAY 2010
17
d) Improving management efficiency and good governance. This area will focus
on: improved accountability of all actors in accordance with the public service
framework; implementation of Open Performance Review and Appraisal System
(OPRAS) at all levels; and the institutionalization and use of EMIS.
Concomitantly, key human resources within the sector will be regularly
reviewed for improvement.
e) Institutionalization of cross-cutting issues. This will focus on further
deepening and integration of topics such as gender, improved sanitation and
greening of the environment, patriotism, human rights, in mainstream
curriculum and school management. In addition, sensitization and awareness
campaigns on HIV/AIDS, child abuse and gender based violence will be
intensified, and guidance and counseling will be provided.
As in SEDP I, the long term Development Objective of SEDP II is to build a high
quality, productive and adaptive labor force for the economy and the whole education
system in general that will contribute to the realization of the MKUKUTA goals and
the Education Vision.
2.2 Goals, Objectives and Strategies
The overall goal of SEDP II is to increase the proportion of Tanzania youths
completing secondary education with acceptable learning outcomes.
The Programme has five priority areas as follows:
Improvement of quality and relevance;
Enhancement of access and equity;
Improvement of the teaching force and teaching process;
Improving management efficiency and good governance; and
Institutionalization of cross-cutting issues.
2.2.1 Improvement of the Quality and Relevance
The demand for secondary education in Tanzania is high due to rapid improvement of
primary education. The secondary education has been able to triple enrolments in a
span of four years, from 432,599 in 2004 to 1,466,402 in 2009. During the same
period enrolment in the open and distance learning has increased from 16,801 to

SEDP II – FINAL DRAFT – MAY 2010
18
35,804. The number of secondary schools (both Government and Non Government)
has also increased from 1,291 in 2004 to 4,102 in 2009.
However, it is becoming increasingly evident that demand for secondary education
which led to increase in the construction of schools and consequent increase in the
number of students has created a bigger constraint on the provision of quality
secondary education. While in practice access precedes quality and we should be
proud of what has been achieved in this area, it is crucial that the two should be
tackled together if one is to get value for money invested in education. Therefore, a
priority is given to the improvement of the quality and relevance of education
provided.
The objectives, strategies and targets for the Improvement of Quality and Relevance
of Secondary Education are summarized hereafter.

SEDP II – FINAL DRAFT – MAY 2010
19
KEY AREA 1: IMPROVEMENT OF THE QUALITY AND RELEVANCE
MAIN OBJECTIVE SPECIFICOBJECTIVES
STRATEGIES TARGETS
a) Mobilize resources forprovision of adequateteaching and learningmaterials.
1.1.1 90% of expected annual fees fromstudents paid by 2012
1.1.2 Capitation Grant of Tshs 25,000 perstudent in government schools forteaching/learning materials providedannually from 2011.*
b) Strengthen capacity of therelevant institutions toproduce curriculumsupport materials.
1.1.3 Capacity of TIE to produce curriculumsupport materials enhanced by 2011
1.1.4 Office of Commissioner of Educationstrengthened to provide quality controlof educational materials
c) Establish laboratories withadequate and appropriatefurniture, apparatus andchemicals in each school.
1.1.5 Schools having functioning laboratoriesincreased from 150 in 2009 to 2500 in2014.
1. To intensify efforts toprovide adequate andappropriate teachingand learning materialsin all subjects and at alllevels by 2013.
d) Schools to have wellstocked libraries orreading rooms includingtext books, referencebooks, class readers andother reading materials.
1.1.6 Well stocked libraries/ reading roomspresent in 2500 schools by 2013. †
Quality and relevanceof SecondaryEducation improved
2. To ensure that active a) Ensure that every 1.2.1 All secondary schools and teachers
* This amount of Tsh.25,000/= per student planned for in SEDP I, but was not achieved due to prevailing economic conditions.† A well stocked library/ reading room is the one that will have at least ten books of each level for each of the subject being taught in the school

SEDP II – FINAL DRAFT – MAY 2010
20
secondary school andteachers’ college areinspected at least once ayear.
colleges inspected, including selfevaluation, once per year by 2015.
1.2.2 Annual reports of inspection work beinga regular agenda of MoEVT and PMO-RALG meeting as from 2011.
b) Ensure Heads of Schools,WECs and CouncilsEducation personnel areoriented on school sitesupervision.
1.2.3 All heads of secondary schools, WECsand Council personnel oriented onschool site supervision by 2013.
c) Optimize time-on-task ofstudents in schools.
1.2.5 Reading culture enhanced in each schoolthrough reading of story books and othersupplementary materials for leisure by2011.
1.2.6 90% of the allocated time for teaching isused effectively by 2011.‡
1.2.7 Daily classroom attendance of teachersand students monitored effectively by2011.
learning takes placein schools and ODLcentres by 2011.
d) Ensure availability andappropriateness offacilities, teaching andlearning materials.
1.2.8 Attain a Book pupil Ratio of 1:3 in allsubjects by 2013§
1.2.9 Textbook based teaching and learningrestored in the classroom by 2011.
1.2.10 50% of capitation grant spent on
‡ Effective use of teaching time will be measured by presence of the teacher in the classroom, coverage of the syllabi and performance of students in the given tasks.§ The long Term plan is a book pupil ratio of 1:1 however a realistic goal in the medium term cannot exceed 1:3.

SEDP II – FINAL DRAFT – MAY 2010
21
purchase of textbook for each schoolby 2011
e) Promote independentlearning, analytical andcritical thinking skillsamong students.
1.2.11 Performance in O-level improved to50% in Division I - III by 2013.
1.2.12 Each school to promote out ofclassroom activities encouraginganalytical thinking by 2011
1.2.13 Students to read at least one novel permonth by 2012.
1.2.14 Students to write a project work eachterm by 2012
f) Improve performance insciences, mathematics andlanguages
1.2.15 Each school with deficit of S/M teachersto have at least 2 more S/M teachersrecruited each year from 2011,
1.2.16 Each S/M teacher to attend in serviceTraining at least once in two yearsfrom 2012
1.2.17 Performance in each of the subjects toincrease by 10% by 2013.
1.2.18 Number of Teacher Trainees in Science,mathematics and languages doubled by2013
g) Ensure availability ofcompetent teachers inclassrooms for all subjects
1.2.19 In-service Training of Teachersinstitutionalized by 2012
h) Ensure teaching of allsubjects in the classroomsis effectively done
1.2.20 Teachers in all subjects be inclassrooms during the teaching sessionby 2011.

SEDP II – FINAL DRAFT – MAY 2010
22
1.2.21 Daily monitoring of classroom teachingdone by the School Management Teamby 2011.
a) Recruit more schoolinspectors.
1.3.1 A total of 550 Inspectors recruited andposted to zonal and district offices by2014.
b) Equip inspectorate officeswith enough furniture andother working tools
1.3.2 A total of 143 Zonal and Districtinspectorate offices equipped and re-tooled by 2013.
3. To enhance andstrengthen schoolinspection toadequately monitor thedelivery of qualityeducation
c) Enhance technicalcompetencies of schoolinspectors.
1.3.3 800 inspectors given professionaldevelopment training by 2014
4. To recruit libraryassistants andlaboratory techniciansfor schools by 2014
a) Liaise with TechnicalInstitutions like Dar salaamInstitute of Technology,Arusha Technical College,Mbeya Institute of Scienceand Technology andSLADS to conduct specialtraining programme forLaboratory Techniciansand Library Assistants
1.4.1 At least 3 institutions have facilities totrain laboratory technicians by 2012
1.4.2 The capacity of SLADS increased totrain 20% more library assistants thanthey are currently producing by 2013
1.4.3 A total of 150 library assistant and 150laboratory technicians recruited andposted to schools and colleges by 2013.
a) Review current status andimpact of examinationpractices.
1.5.1 Review report produced by 2011.5. To improve the nationalexamination assessmentframework by 2013.
b) Establish an appropriateassessment and
1.5.2 Provision of necessary facilities forefficient execution of NECTA

SEDP II – FINAL DRAFT – MAY 2010
23
examination systemtaking into accountpossible links withrelevant systems withinEAC and SADC.
activities in place by 2011.1.5.3 Assessment and examinations policies
and practices reviewed by 2012.1.5.4 NECTA personnel trained on appropriate
assessment system by 2013.6. To promote and
incorporate e-learningin secondary education.
a) Increase access and use ofICT in secondary schoolsand teacher Trainingcolleges and ODL centres.
1.6.1 ICT facilities and Equipment-Maintenance-Plan in place andoperational by 2011.
1.6.2 Appropriate ICT facilities, equipmentand teaching/learning materials availedto 1,500 schools and 21 IAE Regionalcentres by 2014.
1.6.3 A total of 5,000 teachers trained in e-learning teaching by 2013.
1.6.4 Information and Computer Studies (ICS)subject taught in 1000 secondaryschools by 2013.
7. To continue providingCapitation Grantannually to eligibleNon-Governmentschools for teachingand learning materialsat the rate of 50% ofamount provided toGovernment schoolsare getting by 2014.
a) Provide financial supportto non-profit making Non-Government schools.
1.7.1 Conduct fee structure survey for Non-Government secondary schoolsannually.
1.7.2 Eligible schools for Capitation Grantsidentified by November of each year.
1.7.3 Capitation Grants (Tshs 12,500) to50,000 students from eligible non-government schools disbursed bySeptember of each year.
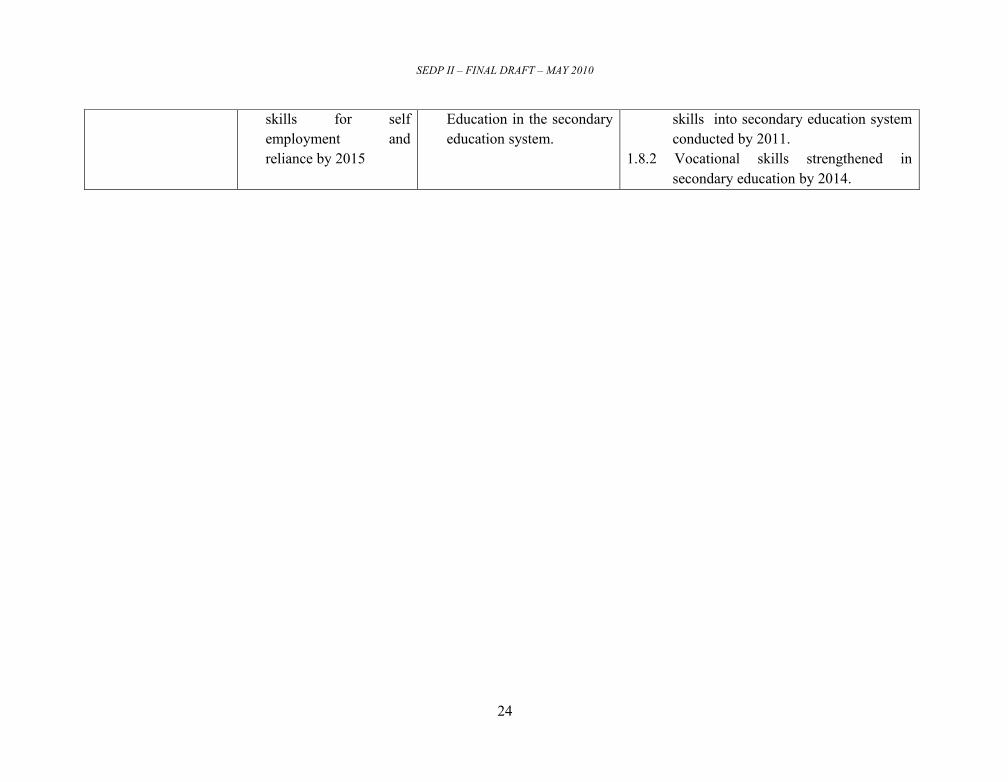
8. To promote vocational a) Strengthen Vocational 1.8.1 A study on strengthening vocational
SEDP II – FINAL DRAFT – MAY 2010
24
skills for selfemployment andreliance by 2015
Education in the secondaryeducation system.
skills into secondary education systemconducted by 2011.
1.8.2 Vocational skills strengthened insecondary education by 2014.

SEDP II – FINAL DRAFT – MAY 2010
25
2.2.2 Enhancement of Access and Equity
The most robust measures of access in education are the Gross Enrolment Ratio (GER) and
Net Enrolment Ratio (NER), basically assessing the proportion of those who want secondary
education that can get it irrespective of age, and then that of those of appropriate age who can
get secondary education. Tanzania has been able to improve participation rates from GER of
9.4% and NER of 5.9% in 2004 to 31.3% and 27.8% in 2009 respectively. While these are
still below regional and sub Saharan figures, the progress has been quite significant.
This trend of increasing enrolment in secondary education is expected to continue during the
period of SEDP II as illustrated in the Secondary School Enrolment Projections included in
Annex 1. In an effort to provide sufficient infrastructure for increasing number of students,
SEDP II will develop strategies to complete the many infrastructures meant to provide more
place for secondary education during SEDP I.
Although the increases in overall enrolment ratios have been very positive under SEDP I,
girls are lagging behind in both GER and NER. In fact, the gender parity ratio has been
declining from about 48% girls and 52% boys in 2004 to about 45% and 55% in 2009
respectively. In addition, the general performance of girls in almost all subjects has not
matched with that of their brothers though there are cases where girls have out-performed
boys. SEDP II will strive for harmonious and equitable development between genders and
across geographical lines, economic disparities and cultural groups.
The objectives, strategies and targets for the enhancement of access and equity are
summarized hereafter.
SEDP II – FINAL DRAFT – MAY 2010
26
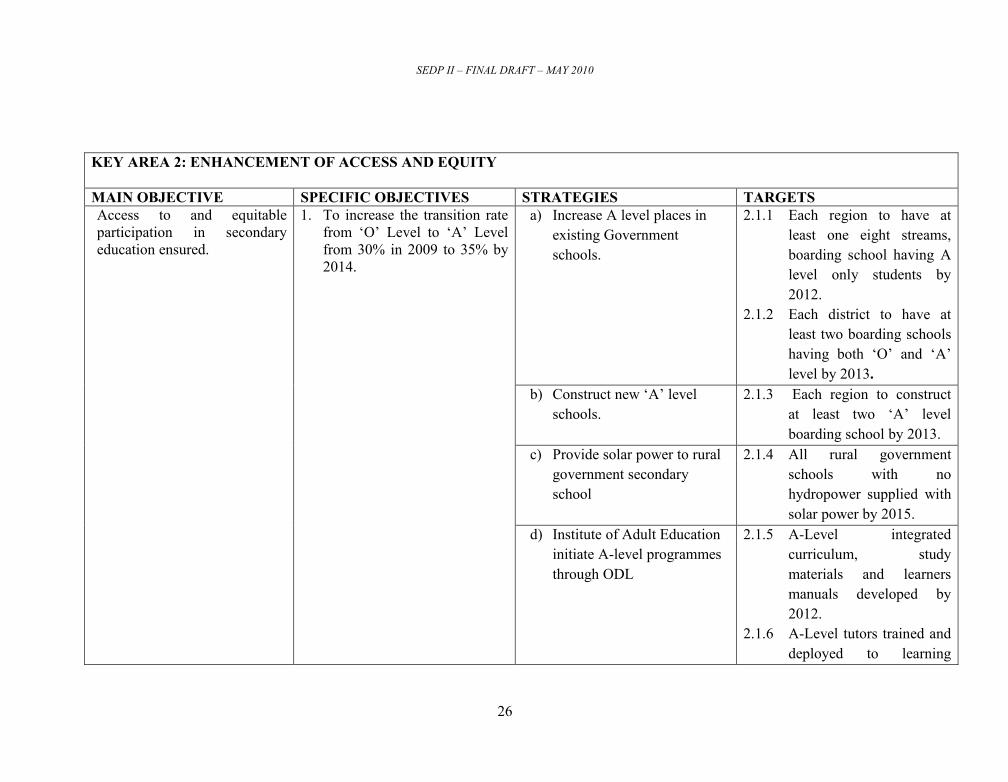
KEY AREA 2: ENHANCEMENT OF ACCESS AND EQUITY
MAIN OBJECTIVE SPECIFIC OBJECTIVES STRATEGIES TARGETSa) Increase A level places in
existing Governmentschools.
2.1.1 Each region to have atleast one eight streams,boarding school having Alevel only students by2012.
2.1.2 Each district to have atleast two boarding schoolshaving both ‘O’ and ‘A’level by 2013.
b) Construct new ‘A’ levelschools.
2.1.3 Each region to constructat least two ‘A’ levelboarding school by 2013.
c) Provide solar power to ruralgovernment secondaryschool
2.1.4 All rural governmentschools with nohydropower supplied withsolar power by 2015.
Access to and equitableparticipation in secondaryeducation ensured.
1. To increase the transition ratefrom ‘O’ Level to ‘A’ Levelfrom 30% in 2009 to 35% by2014.
d) Institute of Adult Educationinitiate A-level programmesthrough ODL
2.1.5 A-Level integratedcurriculum, studymaterials and learnersmanuals developed by2012.
2.1.6 A-Level tutors trained anddeployed to learning

SEDP II – FINAL DRAFT – MAY 2010
27
centres by 2012.2.1.7 800,000 copies of modules
and learners manualsreprinted and distributedby 2011
a) Provide guidance andcounseling to students andparents and conductadvocacy.
2.2.1 4000 teachers/ matrons/patrons trained onguidance and counselingby 2014.
2.2.2 Peer guidance andcounseling strenthened inall schools by 2012
b) Provide meals to dayscholars by means ofcommunity contributions.
2.2.3 Communities sensitised andorganized to contribute fortheir children’s meals by2013
2.2.4 50% of all day schoolsprovide at least one mealper day to their students by2014
2. To reduce dropout rate at ‘O’level from 4% in 2009 to 3%by 2014.
c) Enhance extra-curricularactivities including self-reliance activities, sportsand games in schools.
2.2.5 Facilities for extra-curricular activitiesincluding sports and gamesprovided to 50% of allschools by 2013.
2.2.6 Support annual sportsevents.
3. To consolidate the strategic a) Complete unfinished 2.3.1 Report on number and

SEDP II – FINAL DRAFT – MAY 2010
28
structures started throughSEDP I
status of unfinishedstructures to be in place byJuly, 2010.
2.3.2 A plan for completing thestructures to be in place byAugust, 2010.
2.3.3 70% of the incompletestructures to be completedby 2014.
b) Complete the requiredschool buildings in a schoolto make the school fullyfunctional.
expansion of SecondaryEducation places
c) Provide development grants– to schools
2.3.4 1200 schools withoutadministration blocks tohave these constructed andfurnished by 2014
2.3.5 900 schools especially inthe rural areas to have atleast 2 staff houses by2014.
2.3.6 All schools to haveadequate sanitationfacilities, especially forgirls, by 2013.
4. To increase enrolment toSecondary Education throughODL programmes.
a) Support IAE to successfullyrun ODL programmes.
2.4.1 To have 60,000 (from40,000 in 2008) youthsand adults enrolled in theODL programme by 2014.

SEDP II – FINAL DRAFT – MAY 2010
29
b) IAE to provide improvedlearners support services toODL learners
2.4.2 Four ODL study centrescoordinators from eachregion receive training oncounseling skills by 2014.
c) Strengthen the use of ODLcentres throughout the country
2.4.3 One ODL centre in eachregion equipped withlearning facilities of thestandard given by theInstitute of AdultEducation by 2014
5. To provide scholarships to80,000 (from the present43,000) secondary schoolstudents annually fromeconomically poor families by2014.
a) Review and improve existingscheme so as to improve thelevel of support and number ofbeneficiaries and sponsors.
2.5.1 Scheme reviewed by 2010.2.5.2 Eligible students identified
by Mid-January each year.2.5.3 Increase from 43,000 to
80,000 scholarshipsprovided to eligiblesecondary school studentsannually by 2014.
2.5.4 Funds to eligible studentsdisbursed by February ofeach year.
2.5.5 Scholarship schememonitored annually.

SEDP II – FINAL DRAFT – MAY 2010
30
6. To enhance equitable accessfor students from underservedareas by 2014.
a) Increase and improve hostelfacilities for schools inunderserved areas.
2.6.1 Needs assessment andreview of currentconditions done by 2010.
2.6.2 A total of 20 hostelsaccommodating at least 48students each constructedannually.
2.6.3 Communities encouragedand organized to build andrun hostels for at least 5 oftheir schools per Councilby 2013.
7. To improve facilities inexisting 18 Governmentschools accommodatingstudents with physical ormental disabilities by 2013.
a) Enhance school facilities forstudents with special learningneeds.
2.7.1 Needs assessment surveycarried out at the end ofeach year.
2.7.2 Additional CapitationGrant to the tune of Tsh.25,000.00 per student withspecial needs disbursedeach year
2.7.3 50% of all governmentsecondary schools to bemodified/rehabilitated tomake schools’infrastructure friendly tostudents/people withdisabilities by 2014

SEDP II – FINAL DRAFT – MAY 2010
31
a) Provide girl child friendlyenvironment to schools.
2.8.1 A total of 50 Ablution andlatrine blocks for girls inschools constructedannually.
2.8.2 A total of 100 girls’Hostels constructed by2015 including adequatesecurity, food andprovisions.
b) Empower girls throughTUSEME activities.
2.8.3 TUSEME activities extendto all regions by 2015
2.8.4 Review of TUSEMEactivities carried out by2011
2.8.5 Guidance and counselingservices to empower girlsprovided in every schoolfrom 2012
c) Recast school rules andregulations to clearly depictgender consideration.
2.8.6 School rules andregulations reviewed by2011, including the re-entry policy for pregnantgirls
8. To promote retention of girlsto reach 90 % by 2014
d) Use media to sensitize allstakeholders to take theirresponsibilities on this issue
2.8.7 Special feature articlesappearing on papers everyweek from 2012.

SEDP II – FINAL DRAFT – MAY 2010
32
a) Provide effective and freeremedial tuition andmentorship tounderperforming studentsparticularly girls.
2.9.1 All schools with girls to haveeffective remedial andmentorship programmes by2014.
b) Provide user friendly learningmaterials in science andmathematics.
2.9.2 Girl-child friendly learningmaterials provided toschools by 2014.
9. To improve the pass rate at‘O’ level for girls in sciencesubjects from 46% in 2009 to60% in 2015 and formathematics from 16% in2009 to 25% by 2015 inmathematics.
c) Scaling-up andoperationalizing science andmath’s camps for girls
2.9.3 Science and math camps forgirls scaled-up to includemore regions and classes by2014.

SEDP II – FINAL DRAFT – MAY 2010
33
2.2.3 Improvement of the Teaching Force and Teaching Processes
Teachers and teaching holds key importance in any education system. Schools need teachers
who have relevant knowledge and skills to pass on effectively to the students what they
know. Teachers need to inspire students and be a role model to them in terms of what they
know, commitment to work and relationships. These teachers should not only be available at
school but be in the classrooms where the students are.
One of the major challenges facing Tanzania today is the shortage of qualified teachers.
There are not enough teachers available in schools to be able to provide quality education to
the increasing number of students that are currently enrolled making the challenge even more
acute. SEDP II will therefore focus on the expansion of teacher training and the recruitment
of new graduates on an annual basis, in order to increase the number of teachers available in
secondary schools across the country. Annex 2 shows the projections regarding the number
of teachers required for the increasing number of students enrolled in secondary schools, as
well as the number of teachers available each year, based on the existing work force, plus
new graduates, less attrition. These projections show that if SEDP II is successful in
increasing the output of teachers with degrees by 50 %, and all new degree and diploma
holders are hired and report to their school each year, it will be possible for Tanzania to
achieve a teacher/pupil ratio of 1:20 for secondary school (Form 1-6) by 2015.
The overall shortage of teachers is further complicated by the fact that those teachers who are
available tend to shy away from rural schools. Also there are cases where teachers are in
schools but, their classroom work (delivery, sharing and relationship with learners) is not
effective and efficient enough. SEDP II aims at having competent teachers in good numbers
in the classrooms of all schools, including those in rural areas.
The objectives, strategies and targets for the improvement of the teaching force and teaching
processes are summarized hereafter.

SEDP II – FINAL DRAFT – MAY 2010
34
KEY AREA 3: IMPROVEMENT OF THE TEACHING FORCE AND TEACHING PROCESSES
MAIN OBJECTIVE SPECIFIC OBJECTIVES STRATEGIES TARGETSa) Increase the enrolment of
Diploma Teacher Traineesin TCs.
3.1.1 Existing 16 DiplomaTeachers Collegesrehabilitated and expandedto accommodate not lessthan 1000 students each by2014.
3.1.2 A total of 35,000 diplomateachers trained between2010 and 2014 (Annex 8:Scenario 1 , Table B)
3.1.3 Online teacher trainingcourses initiated by 2012.
1. To accelerate training ofdiploma teachers for ‘O’level according to subjectneeds by 2014.
b) Reintroduce theConcurrent A-Level andDiploma science andlanguages teacher trainingmodel.
3.1.4 A total of 3 TCs introducingthe concurrent A-Level andDiploma teacher training by2013.
a) Implement scholarshipprogram for excellingstudents especially inscience subjects.
3.2.1 Tied bursaries for sciencestudent teachers introducedby June 20105.
To have an adequate number ofhighly competent teachers whowill inspire and correctly handlestudents for better performance.
2. To collaborate with otherstakeholders in acceleratingthe supply of degreegraduate teachers forsecondary schools by 2014.
b) Establish quotas for the 3.2.2 At least 7,000 teachers with
5 These bursaries are provided through The Higher Education Students’ Loan Board.

SEDP II – FINAL DRAFT – MAY 2010
35
training of teachers at allinstitutions producingdiploma and graduateteachers.
degree graduate annuallyfrom 2010.
c) Adopt and implementrecommendations onquantities and quality ofteachers given in theTeachers Development andManagement Strategy(TDMS).
3.2.3 Adequate quality A-Level andO- Level teachers and schoolmanagers developed by 2014
3. To enhance professionalcompetence of teachers andtutors by 2014.
a) Institute regular and needbased in-service trainingfor all teachers.
3.3.1 Training needs assessmentconducted by 2010.
3.3.2 In-service Training (INSET)programmes designed by2010.
3.3.3 6,000 teachers receive shortterm training annually.
3.3.4 In service training ofteachers institutionalized by2012
3.3.5 A total of 8 TRCsinstitutionalized,expanded/increased andequipped with appropriatefacilities by 2012.
3.3.6 Continuous professionaldevelopment of teachers

SEDP II – FINAL DRAFT – MAY 2010
36
through school basedtraining in place
3.3.7 Every school to conduct inhouse training to cover allits teachers every year
b) Assist Non-Governmentschools to haveprofessionally competentteachers.
3.3.4 Integrate teachers from thetargeted Non-Governmentschools into the overalltraining of teachers as from2011.
c) Introduce and enforcetextbook- based teacherinstruction
3.3.5 Textbook-based teacherinstruction introduced andenforced by 2012.
d) Enforce attainment ofstandard in language forteachers trainees
3.3.6 Improve English languagecompetency to teachertrainees by making thelanguage a compulsorysubject at all TeachersCollege by 2012
3.3.7 English oral exams carriedout at all TC by 2012
e) Enforce use of classroomattendance register forteachers for all lessons
3.3.8 Accountability mechanismdesigned by 2010
3.3.9 Attendance Registers usedin all schools by 2011

SEDP II – FINAL DRAFT – MAY 2010
37
a) Provide settling in allowancefor new teachers taking postsin difficult and hard- to-reach areas
3.4.1 3500 new graduatesannually taking posts indifficult and hard- to-reachareas receive Tsh 500,000each as settling in allowance
4. To provide incentives forgreater retention of teachers.
b) Provide housing units incommunity built secondaryschools.
3.4.2 2,000 housing units builtevery year throughout theprogramme time.
3.4.3 Every new school to have atleast 2 staff houses beforebeing registered starting2010
a) Encourage exchange ofteachers in clusters.
3.5.1 Programme for exchange ofteachers at cluster level to bein place by December 2010.
5. To ensure equitabledistribution and full utilizationof teachers for quality deliveryof instruction. b) Strengthen Monitoring and
evaluation (M & E) anddeploy accordingly
3.5.2 Deployment of teacherscurrently in the field carriedout and sustained by 2012.
3.5.3 M&E carried out by PMO-RALG in collaboration withMOEVT officials regularlyfrom 2010
3.5.4 M&E report discussed,worked upon andassessment made each year.

SEDP II – FINAL DRAFT – MAY 2010
38
2.2.4 Improving Management Efficiency and Good Governance
A well-managed organization should give better outputs to its clients. The quality of an
education system can be reflected in the kind of graduates coming out of the system and in
the long run, it will show it’s multiplying effect in the country’s development (socio-
economically). Good governance is the cornerstone for effective utilisation of human
capacities towards enhancing efficiency and effectiveness in the provision of secondary
education. This level of education still has many managerial challenges including the
institutional arrangements, some of the philosophies/policies and operational structures
present today, and ‘managerial-competencies’ of the education managers. Hence there is
need to strengthen management at all levels and so address the challenges mentioned.
The objectives, strategies and targets for improving management efficiency and good
governance are summarized hereafter.

SEDP II – FINAL DRAFT – MAY 2010
39
KEY AREA 4: IMPROVING MANAGEMENT EFFICIENCY AND GOOD GOVERNANCEMAIN OBJECTIVE SPECIFIC OBJECTIVES STRATEGIES TARGETS
a) Build capacity of Heads ofSchools, School BoardMembers, SchoolManagement Teams,Managers of Non-Government Schools, WardEducation Coordiantors(WECs), DSEOs, REOs andMOEVT & PMO-RALGstaff in Governance andManagement of secondaryeducation.
4.1.1 Human Resourcessituational analysiscompleted and thencapacity buildingstrategy finalized andoperationalized by endof 2011.
4.1.2 Use results of the HRsituational analysis toensure appropriatecapacity is built for eachministry according totheir different needs andlevels
Good governance andManagement practices at alllevels of education enhanced by2014.
1. To enhance the capacity ofkey actors at all levels by2011.
b) Strengthen monitoring andevaluation for SEDPimplementation from centreto school level incollaborationwith MOEVTand PMO-RALG.
4.1.3 Monitoring andEvaluation Plandeveloped andoperationalized by 2010.
4.1.4 Monitoring exercisesconducted and reportsprepared semi-annually.
4.1.5 Diagnostic evaluationconducted and reportsprepared as required.
4.1.6 Financial resources for

SEDP II – FINAL DRAFT – MAY 2010
40
M &E increased by atleast 20% each year from2010
c) Implement financial trackingrecommendations fromPublic Expenditure TrackingSurvey (PETS) Report.
4.1.7 PETS Reportrecommendationsimplemented by 2012.
d) Strengthen MOEVT – PMORALG partnership onSecondary Educationoperations.
4.1.8 Guidelines on SecondarySchools operations beingfully used by 2010.
4.1.9 Inter-Ministerialmeetings conductedtwice yearly from 2010.
4.1.10 Study on success of D byD carried out by 2012
2. To improve access to anduse of EducationManagement InformationSystem (EMIS) at alllevels under the umbrellaof ESMIS for use indecision making by 2015.
a) Strengthen theimplementation of MOEVTEMIS Plan and integratewith ESMIS.
4.2.1 Procurement andinstallation of EMISequipment up to Councillevel completed by 2011.
4.2.2 Training on how tooperate the equipment upto Council levelscompleted by 2011.
4.2.3 Capacity building onData Base Managementprovided at all levels by2012.
4.2.4 Integrate and harmonize

SEDP II – FINAL DRAFT – MAY 2010
41
Education SectorDatabase at all levels.
b) Strengthen IEC to ensureeffective communication ofinformation andtransparency on educationwith the public
4.2.5 IEC offices retooled by2010.
4.2.6 IEC personnel given/having basic training by2010.
4.2.7 SEDP activitiespublicized quarterlyevery year from 2011.
3.To institutionalize the use ofschool plans as basis forgiving School Heads thenecessary inputs for theirperformance by 2010.
Inculcate a culture of usingSchool Plans as basis forbudgeting and funding.
4.3.1 The use of School Plansinstitutionalized by2010.

SEDP II – FINAL DRAFT – MAY 2010
42
2.2.5 Cross-Cutting Issues
Cross cutting issues that warrant a place in the national curriculum normally include Gender;
Human Rights as enshrined in the constitution and other international conventions;
Patriotism, Rights of Children; the Environment; care and support services for the orphans
and other vulnerable children, fight against malaria, HIV and AIDS. While these are
recurrent and dynamic issues that need continuous follow up, they cannot be addressed
independently and separately from school subjects. These issues are important in order to be
abreast with current national and global concerns as well as future demands.
The objectives, strategies and targets for cross cutting issues are summarized hereafter.

SEDP II – FINAL DRAFT – MAY 2010
43
KEY AREA 5: CROSS-CUTTING ISSUESMAIN OBJECTIVE SPECIFIC OBJECTIVES STRATEGIES TARGETS
a) Continue with reviews andadoption of cross cuttingissues in secondary, teachereducation and ODLcurricula, teaching – learningmaterials, assessment andexamination and schoolinspection.
5.1.1 Curricula reviewed andshared with stakeholders by2011.
5.1.2 Capacity for handlingHIV/AIDS and life skillseducation of 16,000 teachersstrengthened up by 2014.
To provide effective HIV andAIDS education including careand support programmes to theaffected and infected; aneffective education onenvironment, human rights,gender and life skills in allsecondary schools, teacherscolleges and work places by2012.
To continue with review andimprovement of the curriculumto incorporate Cross CuttingIssues including HIV and AIDS,Gender, Inclusive Education,Human rights and EnvironmentEducation by 2010.
b) Establish care and supportprogrammes for students andpersonnel affected andinfected with HIV and AIDS.
5.1.3 Needs assessment conductedby 2010.
5.1.4 Networking with Ministries,Departments and Agencies(MDAs) and other relevantCBOs and NGOs completedby 2010.
5.1.5 Special feeding programmefor affected and infectedstudents in place by 2010.
5.1.6 Workplace interventionprogrammes (VCT and Skillbased education) in place by2010.
5.1.7 Health programmes foraffected and infected studentsin place by 2014.

SEDP II – FINAL DRAFT – MAY 2010
44
c) Provide school personneland students with care andsupport annually
5.1.8 Voluntary counseling andtesting services at schoolsand colleges strengthened by2011.
5.1.9 Home based care institutedand strengthened by 2011.
5.1.10 Psychological services inplace by 2011.
a) Review school rules andregulations to incorporateenvironmental issues andcare.
5.2.1 Strategic plan completed andthe portion related tosecondary educationimplemented by 2011
5.2.2 Guidelines for integration ofenvironmental issues inteaching in all subjectsdeveloped and disseminatedby 2010.
b) Institute forums andopportunities for opendebates and discussion onenvironmental issues.
5.2.3 Issues on environmentincluding rules andregulations incorporated intoschool time tables by 2011.
2. To inculcate within the schoolcommunity the appropriateappreciation and skills forconservation of theenvironment by 2011.
c) Carry out pertinentpractical activitiesincluding solutions tochallenges posed by theimmediate environment.
5.2.4 Out-of-class activities relatedto environmental appreciationand conservation includinggreening of schoolenvironment, water, sanitationand cleanness incorporated

SEDP II – FINAL DRAFT – MAY 2010
45
into school time-tables by2011.
d) Provide water andsanitation to requiredstandards in all schools
5.2.5 70% of all schools havingwater and sanitationrequirements by 2013
a) Involve students andschool community in out-of-class activities thatstrengthen change inattitude and behavior.
5.3.1 Time set aside for counselingand other gender relatedactivities clearly indicated inschool/college timetables andoperationalised by 2011.
3. To promote efforts on genderequality among school andcollege communities by 2010.
b) Intensify counseling andguidance sessions.
5.3.2 Counseling and Guidancesessions strengthened at alllevels by 2012.

SEDP II – FINAL DRAFT – MAY 2010
46
3.0 Programme Implementation Strategies
3.1 The Decentralization of the Management of Secondary Schools
The main purpose of the decentralization of the management, administration, and
supervision of secondary schools is to increase efficiency and responsiveness in the
operation of secondary education through Decentralisation by Devolution (D by D) of
authority and responsibilities to lower levels of management: This move entails
(i) decongesting activities in MoEVT Headquarters
(ii) increasing delegation of authority to regions, districts, councils, and schools
(iii)giving ownership mandates to Local Government Authorities;
(iv)ensuring close and prompt supervision of service delivery; and
(v) facilitate smooth and efficient management of resources
3.2 Delineation of Roles of Different Levels and Actors
The roles, functions, lines of communication, and responsibilities are as follows:
3.2.1 Ministry of Education and Vocational Training (MOEVT)
The responsibility of MoEVT will continue to focus on policy development, quality
assurance, setting national standards, and monitoring and evaluation of ESDP and
related sub-sector programmes including SEDP II. Specific responsibilities include:
a) preparation, review and approval of curriculum;
b) approval of teaching and learning materials for schools;
c) provision and coordination of pre-service and in-service training for teachers;
d) deployment and equitable distribution of teachers;
e) establishment of National Minimum Standards for schools and colleges;
f) issuing guidelines on the provision of education to students with special needs
and management of schools for students with special needs;
g) registration of new secondary schools and teachers’ colleges;
h) inspection of schools, including follow up of recommendations from previous
inspection reports;
i) preparation and management of national examinations;
j) monitoring selection of Form 1 students and conducting selection of Form 5
students;

SEDP II – FINAL DRAFT – MAY 2010
47
k) mobilization and allocation of resources;
l) coordinate research; and
m) conduct monitoring and evaluation of SEDP II, in collaboration with PMO-
RALG; and
n) preparation of Education Sector Performance Report (physical and financial)
including SEDP II, in collaboration with PMO-RALG.
3.2.2 Prime Minister’s Office-Regional Administration and Local
Government
The responsibilities of PMO-RALG in SEDP II will focus on coordination of the
implementation of the Programme in the LGAs:
a) monitor the employment of new teachers and non-teaching staff in Regions
and LGAs;
b) initiating and monitoring transfers of teachers and non-teaching staff from one
region to another;
c) monitor the appointments of Heads of Secondary Schools;
d) monitor the appointment of School Boards Members and their training on
school management;
e) monitor in-service training for teachers and capacity building for non-teaching
staff;
f) coordination of provision of Government scholarship for children from poor
families;
g) coordination of sports and games in the LGAs;
h) participation in coordination of Form 1 and 5 selection in collaboration with
MOEVT;
i) coordination and mobilization of local resources for implementation of SEDP
II;
j) conduct monitoring and evaluation of SEDP II, in collaboration with MOEVT;
and
k) preparation of Education Sector Performance Report (physical and financial)
including SEDP II, in collaboration with MOEVT.

SEDP II – FINAL DRAFT – MAY 2010
48
3.2.3 Ministry of Finance and Economic Affairs (MOFEA)
The responsibilities of MOFEA in SEDP II will be:
a) solicitation and mobilization of financial resources from different sources;
b) development and provision of guidelines and regulations on financial
management and procurement for the implementation of SEDP II;
c) transfer of funds to MOEVT and PMO-RALG, and to Regional Sub-
Treasuries for transfer to secondary schools; and,
d) to take the lead, in collaboration with MOEVT, PMO-RALG and CAG, to
ensure timely auditing of education funds including SEDP II.
3.2.4 Regional Sub-Treasury
The responsibility of the Regional Sub-Treasury is to receive funds from the MOFEA
and transfer them to the secondary schools’ accounts.
3.2.5 Regional Secretariat
The responsibilities of the Regional Secretariat in SEDP II will be to supervise
secondary education developments in the region, including:
a) coordination of Council Education Development Plans, including SEDP II;
b) coordination of the employment of new teachers and non-teaching staff within
councils in their regions;
c) initiation and monitoring of transfers of teachers and non-teaching staff from
one council to another within their regions;
d) appointment of Heads of Schools, in consultation with LGAs;
e) conducting selection of Form 1 students;
f) dealing with student appeals, repetitions and transfers within the region; and,
g) coordinate and supervise National Standard VII, Form 4 and 6 examinations.
3.2.6 Local Government Authority
The responsibilities of LGAs in SEDP II will focus on implementation of the
Programme and delivery of secondary education services, including:
a) preparation of a Council Education Development Plan, including SEDP II;
b) coordination and advice on the establishment of new schools;
c) supervision of construction and maintenance of school buildings;
d) oversight of employment and transfer of teachers within the district;

SEDP II – FINAL DRAFT – MAY 2010
49
e) hiring and firing non-teaching staff in schools;
f) identifying candidates for Heads of Schools and submitting proposals to the
Regional Secretariat;
g) appointing School Board members and training them on management of
schools;
h) coordinating ward-level requests for students to be supported under the
government scholarship scheme;
i) coordinating and mobilizing local resources for implementation of SEDP II;
and
j) reporting to PMO-RALG and MOEVT on implementation of SEDP II
activities.
3.2.7 Ward Administration
The Ward Administration is responsible for:
a) identification of areas for the construction of schools;
b) mobilization of communities resources (financial and physical) for
construction of schools;
c) monitoring of school construction and providing feedback to the Council;
d) receiving school development plans, budget and implementation reports;
e) mobilization of communities to ensure enrolment, attendance and retention of
students; and,
f) reviewing and consolidating requests from Village/Mtaa Governments for
students to be supported under government scholarship scheme, and
submitting them to LGAs for consideration.
3.2.8 School Boards
The School Board is responsible for:
a) approving School Development Plans and Budgets, and overseeing their
implementation;
b) advising District Secondary Education Officer on schools management;
c) advising District Secondary Education Officer and TSD on disciplinary cases
of teachers;
d) demanding, on a regular basis, accountability for students’ performance;

SEDP II – FINAL DRAFT – MAY 2010
50
e) dealing with disciplinary cases of students; and,
f) deliberating on quarterly school performance reports (both financial and
physical).
3.2.9 The School Management Team
Each school has a Management Team comprised of: the Head of School; Deputy
Head; School Accountant; Academic Master; and Discipline Master. The School
Management Team is responsible for ensuring proper implementation of the
Education and Training Policy by:
a) preparing school development plans and budgets;
b) managing the day to day affairs of the school;
c) ensuring high quality for new constructions and school maintenance;
d) ensuring a conducive teaching and learning environment, including integrating
of sports and games in the school timetable;
e) supervising and ensuring high quality teaching and learning, including
effective use of time on tasks for the entire school day;
f) receiving school inspection reports and implementing inspection
recommendations;
g) supporting Village/Mtaa Government in identifying students eligible for
Government scholarships;
h) ensuring proper record keeping and management of funds collected and grants
received from the Government; and,
i) preparing on quarterly school performance reports (both financial and
physical).
3.2.10 Development Partners in Education
The Government recognizes the need for dialogue, collaboration and consultative
approaches in the implementation of SEDP II. In this context, the responsibilities of
Development Partners will include:
a) aligning their support with the Government’s Programme;
b) contributing funds in support of the Programme; and
c) participating as stakeholders in SEDP II review processes and education sector
dialogue.

SEDP II – FINAL DRAFT – MAY 2010
51
3.2.11 Non State Actors (NSAs)
With respect to SEDP II, NSAs are expected to:
a) continue to expand access and improve quality and equity in secondary
education line with national policies and programmes;
b) collaborate with MoEVT, PMO-RALG, LGAs and other stakeholders to
achieve national targets for SEDP II; and
c) participate as stakeholders in SEDP II review processes and education sector
dialogue.
3.3 Management of the Programme
3.3.1 Management Structure
The implementation of SEDP II will follow the existing management structures of
MOEVT and PMO-RALG as indicated in Figure 1. SEDP II management and
coordination is integrated in the Department of Secondary Education (MOEVT),
Education Coordination Unit under Sector Coordination Department (PMO-RALG)
and the District Secondary Education Department in each LGA. The lines of
accountability and responsibility as well as roles for each level have been delineated
in Section 3.2. The flow of information for SEDP II management is indicated in
Figure 2.
At Regional Level, the Regional Administrative Secretary (RAS) through the
Regional Education Officer (REO) coordinates the implementation of the Programme
by monitoring the District Secondary Education Officer (DSEO), Ward Education
Coordinators (WECs,) and School Heads who oversee the implementation of the
Programme in their areas of jurisdiction.

SEDP II – FINAL DRAFT – MAY 2010
52
Figure 1: Programme Management and Monitoring Framework
MINISTER[PMO-RALG]
MINISTER[MoEVT]
Permanent Secretary [MOEVT]
Commissionerof Education
Permanent Secretary[PMO-RALG]
DirectorSector
Coordination
DirectorAdministration
Regional Secretariat Regional Education Officer
District Secondary Education Officer
Secondary School Boards
District Council
Village/Mtaa Government
Ward Executive Officer
ChiefAccountant
DirectorPolicy & Planning
Sub-Treasury
Ward Education Officer
Education SectorDevelopment
Committee (ESDC)
Directors ofInstitutions
DirectorSecondaryEducation
DirectorHigher
Education
DirectorTeacher
Education
DirectorInspectorate
DirectorPrimary
Education
DirectorTechnical &VocationalEducation
DirectorAdult/ Non
Formal Education
Secondary School AccountsHead of School /
School Management Team
MINISTER[MOFEA]
Treasury
Permanent Secretary [MOFEA]

SEDP II – FINAL DRAFT – MAY 2010
53
Figure 2: The flow of information for SEDP II management
Education Funds
MOEVT and other Institutions
GENERALMANAGEMENT
ASSESSMENTOF NEEDS AND
PLANNING
MOEVT and PMO-RALGmonitor the operation mode ofthe school account
Regional Secretariatcoordinates council EducationDevelopment Plans
Regional Secretariatconsolidate council data
Regional Secretariat appraisescouncil EducationDevelopment Plans
Councils give supportto school EducationDevelopment plans
Wards/schoolsformulate schoolEducationDevelopment Plans& budgets
FINANCIALMANAGEMENT
Treasury /PMORALG transfersthe funds quarterly to theschool revenue account
Councils appraiseschool EducationDevelopment Plans
New schools areinformed to start
New schools openrevenue account
TECHNICALMANAGEMENT
MOEVT/PMORALGprovides technical support toRegions and councils
MONITORINGMOEVT and PMO-RALGMonitors and Prepares Halfyear reports
School accounts aresupplied quarterly
Schools pay thecontractor/suppliers
Schools agree withTechnical staff onplan
Contractorsprovideservices toschool
School implements theplan
Councils Prepare Plansfor establishment ofnew schools
MOFEA School Board SuppliersRegional Sub-Treasury
Councilsformulate CouncilEducationDevelopment Plans& budgets

SEDP II – FINAL DRAFT – MAY 2010
54
3.3.2 Management of Construction Activities
The Zonal Maintenance Engineers (MOEVT), in collaboration with Regional and District
Engineers and School Inspectors, will be facilitated to do the supervision of the
completion of unfinished structures and construction of new ones. They will also be
responsible to oversee the enforcement of standards of school layout plans, as well as
assuring that the specified standards of construction are upheld.
At Ward and Village levels, where a School Board does not yet exist, there shall be a
School Construction Committee; however, where School Boards have been established,
the School Construction Committee will report to the School Board. The School
Construction Committee shall be responsible for overseeing the day to day activities for
completion of unfinished structures in existing schools and construction of new schools.
At school level, the School Management Team will advise the Ward Committee and
report to the Headmaster/Headmistress and the School Board on the progress of
construction works.
The Ward Executive Officer will be responsible for community resources mobilization.
Records shall be kept by the Chairperson of the School Management Team for proper
management of funds as well as being able to determine levels of funding by community,
government and partners in education development.
3.4 Monitoring and Evaluation of the ProgrammeThere is evidence that regular monitoring and evaluation strengthens dialogue between all
concerned parties and enhances the quality of outcomes and speed of completing each
activity. SEDP II will, therefore, be closely monitored and regularly reviewed to make
sure it is on track. The workplan included in Annex 3 will be a key tool for monitoring
progress of the programme. Follow up and supervision activities will continue within the
Government structure to unblock any bottlenecks that may arise in the course of the
implementation of the Programme. In addition, the results framework and monitoring
framework included in Annexes 4 and 5 will be used to measure progress toward desired

SEDP II – FINAL DRAFT – MAY 2010
55
outcomes, using the baseline data in Annex 6 as a starting point. The following
monitoring and evaluation activities will contribute to this process.
3.4.1 Semi-Annual ReportsTailor- made evaluation instruments will be designed for self-evaluation and reports
availed on semi-annual basis and shared in the ESDC fora.
3.4.2 Annual EvaluationEach year a formative evaluation of the Programme activities will be performed and
results will be shared in the ESDC fora.
3.4.3 End of Programme EvaluationAt the end of the Programme period, a summative evaluation will be conducted to take
stock of achievements, missed opportunities, failures, and lessons learnt. This evaluation
will be shared in the ESDC fora and also presented in national workshops for all
stakeholders.
3.5 Budget SummaryThe Government, in collaboration with Development Partners, Non-State Actors and
communities, will continue to mobilize resources to address the key areas, strategies, and
targets outlined SEDP II. The Government reaffirms its commitment to continue focusing
resource allocation to secondary education sub sector, which is one of the national
priority areas in MKUKUTA. As would be expected, quality improvement and relevance
takes the lion’s share of the budget, followed by access and equity, and then the
improvement of the teaching force and teaching processes.
The proposed SEDP II cost projections are largely based on: secondary school enrolment
projections for the Programme period, as detailed in Annex 1; the calculated unit costs of
certain activities, as specified in Annex 7; as well as tuition fees, and personal
emoluments, other operating costs and development expenditure as outlined in the
MTEF. The cost projections have been made taking into consideration the following
basic assumptions:
Political will and stability will be maintained over the SEDP II period;

SEDP II – FINAL DRAFT – MAY 2010
56
The National Population growth rate of 2.9% (2002 census) is constant over the
plan period;
The current domestic revenue collection of 15.9% of the GDP is expected to
increase to 18.3 % in 2011/12 and continue in an upward trend over the SEDP II
period.
Though the GDP is expected to decline to 5.0% in 2009 due to Global Economic
Crisis, it is expected to grow up to 7.5% in 2012 and continue to grow over the
SEDP II period;
An inflation rate of 6.5% targeted in 2010 will be fluctuating but remain in the
single digit over the SEDP II period;
The real exchange rate is expected to follow the purchasing power parity in the
medium and long terms;
The Government commitment to allocate up to 22% of its overall recurrent
expenditure to Education Sector is met, and out of this total, up to 13% has to be
allocated to Basic Education;
Selected national basic education sub-sector priorities will be fully funded;
The enrolment in secondary education is expected to increase up to 70% out of
those passing PSLE by 2015;
For the sake of computing Teacher Needs for Secondary Schools; pupil/teacher
subject ratio has been used taking into consideration that a secondary school
teacher teaches two specialized subjects.
Exchange rate used is Tshs. 1,300 per USD.
Annex 8 presents two sets of budget scenarios (revenue and expenditure) for the
implementation of SEDP II. Scenario I shows that full implementation of SEDP II is
expected to cost Tshs. 3,022,601 Millions, including Tshs. 1,586,103 Millions (52.5%)
for teachers’ salaries. Scenario 2 provides an example of the ways in which
implementation costs could be strategically reduced if the full resource requirements of
Scenario 1 could not be met.

SEDP II – FINAL DRAFT – MAY 2010
57
ANNEXES

SEDP II – FINAL DRAFT – MAY 2010
58
Annex 1: Secondary School Enrolment Projections, 2010 – 2015
Year 2009 2010 2011 2012 2013 2014 2015
Standard VII Enrolment* 1,163,136 1,098,831 945,349 936,478 985,151 1,019,723 1,060,644Abscondment rate at Standard VII 3.4% 3.0% 3.0% 3.0% 3.0% 3.0% 3.0%Pass rate 60.0% 60.0% 65.0% 65.0% 65.0% 65.0% 60.0%Transition Rate (Std VII-Form 1)for Government Enrolment 60.0% 65.0% 65.0% 70.0% 70.0% 70.0% 70.0%
Transition Rate (Std VII-Form 1)for Non-government Enrolment 4.3% 6.8% 6.8% 6.8% 6.8% 6.8% 6.8%
Form 1 524,784 433,481 459,175 427,959 453,465 477,034 493,774Form 2 344,515 529,307 451,613 471,966 442,883 465,914 490,130Form 3 330,844 311,786 479,022 408,710 427,129 400,809 421,652Form 4 201,416 322,573 303,991 467,047 398,492 416,451 390,789
Secondary School Enrolment
Total 1,401,559 1,597,146 1,693,802 1,775,681 1,721,969 1,760,208 1,796,345Transition Rate (Form 4-Form 5)Government and Non-government 26.0% 28.0% 30.0% 30.0% 33.0% 34.0% 35.0%
Form 5 43,052 52,368 90,320 91,197 140,114 131,502 141,593Form 6 21,791 42,062 51,164 88,243 89,100 136,891 128,478Total 64,843 94,430 141,484 179,440 229,214 268,394 270,071
Total Secondary School Enrolment (Form 1-6) 1,466,402 1,691,576 1,835,286 1,955,121 1,951,183 2,028,602 2,066,417
Assumptions on Enrolment Projections
* Standard VII Enrolment Projections as per BEST, 2009 Table 2.15 page 36.
** Secondary Enrolment Projections have been developed taking into consideration dropout rate of 3.0%, Primary School Leaving ExaminationPass Rate of 65%, transition rate from STD VII to Form 1 of 70% for Government secondary schools and 6.8% for Non Government secondaryschools. The transitions rate from Form 4 to Form 5 is assumed to be 30% and above for Government and Non Government secondary schools.

SEDP II – FINAL DRAFT – MAY 2010
59
Annex 2: Secondary School Teacher Requirement and Availability Projections, 2010 – 2015
Year 2009 2010 2011 2012 2013 2014 2015
Projected Secondary School Enrolment 1,466,402 1,691,576 1,835,286 1,955,121 1,951,183 2,028,602 2,066,417PTR Form I - IV 20 20 20 20 20 20 20
Total Teacher Requirements 73,320 84,579 91,764 97,756 97,559 101,430 103,321Diplomates 75% 54,990 63,434 68,823 73,317 73,169 76,073 77,491Graduates 25% 18,330 15,859 17,206 18,329 18,292 19,018 19,373
Teachers on post:Diplomates 75% 20,032 33,553 41,534 49,466 57,299 64,889 72,334Graduates 25% 5,836 11,184 13,845 16,489 19,100 21,630 24,111Licensee and others 0% 8,086 0 0 0 0 0 0Total Teachers on post 33,954 44,738 55,379 65,954 76,399 86,519 96,446
Teachers graduating from Colleges:Diplomates 7,000 7,070 7,141 7,069 6,716 6,380 6,061Graduates 6,500 7,150 7,865 8,652 9,517 10,468 11,515Total Teachers Graduating 13,500 14,220 15,006 15,721 16,232 16,848 17,576
Aggregate Teacher Attrition 8% 2,716 3,579 4,430 5,276 6,112 6,922 7,716
Total Teacher Availability 44,738 55,379 65,955 76,399 86,519 96,445 106,306
Additional Teacher (Shortage)/Excess (28,582) (29,200) (25,809) (21,357) (11,040) (4,985) 2,985

SEDP II – FINAL DRAFT – MAY 2010
60
Annex 3: SEDP II Work Plan, 2010/11 – 2014/15
Programme Areas 2010/11 2011/12 2012/13 2013/14 2014/15Provide capitation grant of Tshs 10,000 forteaching and learning materials per pupil peryearProvide sufficient text books to attain a ratioof 1:3Reprint and distribute 800,000 copies ofmodules and learners manualEquip ERC with necessary tools
Build and equip Science Laboratories
Build and equip school librariesEquip one ODL Centre in each region withlearning facilitiesOrient Heads of school, WECs and CouncilPersonnel on school site visitProvide School Novels
Stock in libraries in 2500 schoolsEstablish school textbook fund for eachschoolRecruit 550 inspectorsEquip and re-tooled Zonal and DistrictofficesProvide professional development training to800 schools' inspectorsRecruit and post 150 Laboratory Techniciansto schools and collagesRecruit and post 150 Library assistants toschools and collagesConduct comprehensive study on impact ofcurrent examination practicesProvide necessary facilities for efficientexecution of NECTA activitiesTrain NECTA personnel on appropriateassessment systemTrain 5,000 teachers in e-learning
Prepare ICT Facilities and Equipment Plan

SEDP II – FINAL DRAFT – MAY 2010
61
Programme Areas 2010/11 2011/12 2012/13 2013/14 2014/15Avail appropriate ICT facilities, equipmentand teaching/learning materials to secondaryschools Provide capitation grants to students fromeligible schoolsConstruct at least one A’ Level school toeach regionConstruct one A’ Level boarding school toeach districtProvide solar power to all rural Governmentsecondary schoolsTrain teachers/matrons/patrons on guidanceand counselingProvide at least one meal per day to dayschools' studentsSchools in districts to have computerlaboratory for sharing with cluster of schoolsTo enroll 60,000 youths and adults in theODL ProgrammeProvide training to 4 ODL study canterscoordinator from each region on counselingskills.Provide scholarships for 100,000 secondaryschool students from economically poorfamiliesConduct needs assessment for students fromunderserved areasConstruct 10 hostels accommodating 60students annuallyConduct needs assessment for identifyingstudents with disabilitiesRehabilitate schools for disabled studentsProvide capitation grant to students withspecial learning needsConstruction of ablution blocks for girlsschools constructed annuallyConstruction of 100 girls' hostels
Support science camps for girlsRehabilitate 10 existing diploma teacherscolleges

SEDP II – FINAL DRAFT – MAY 2010
62
Programme Areas 2010/11 2011/12 2012/13 2013/14 2014/15
Provide scholarship for diploma teachers
Conduct needs assessment for competenceof teachers and tutorsDesign In Service (INSET) trainingprogrammesInstitutionalize, expand and equip 8 TRCswith appropriate facilitiesConstruction of 1,000 teachers houses incommunity secondary schoolsConduct short term teacher training annuallyFinalize and operationalize capacity buildingstrategyProvide training to Heads of schools, Schoolboard members, Mangers of Non-Government schools,WECS,DSEOs,REOs,Ministry staff in Governance andManagement of secondary educationDevelop and Operationalize Monitoring andEvaluation PlanConduct Monitoring and Evaluation halfyearlyProcure and Install EMIS equipment up tocouncil levelProvide training on how to operate theequipment up to council levelProvide capacity building to EMIS staff onDatabase ManagementRetool IEC offices
Provide training to IEC OfficersStrength capacity for teachers for handlingHIV/AIDS and life skill educationConduct needs assessment for students andpersonnel affected and infected withHIV/AIDSProvide special feeding programme forinfected studentsImplement Health programmes for affectedstudentsSupport environmental and sanitation

SEDP II – FINAL DRAFT – MAY 2010
63
Annex 4: SEDP II Results Framework
Program PurposeThe program purpose will be to increase the overallquality of the labour force by strengthening the qualityand mix of secondary education outputs
Program OutcomeIndicator
Use of OutcomeData
Development Objectives: To develop --- Outcome indicators. Use of outcomeinformation
Intermediate Results to position --- Result indicators foreach key area
Use of results inmonitoring
1 Key Area 1: Quality Improvement1.1 To intensify efforts to provide adequate andappropriate teaching and learning materials in allsubjects and at all levels including ODL by 2013.
1.2 To ensure that active learning is effectivelypracticed in schools and ODL centres by 2011.
1.3. To enhance and strengthen school inspection toadequately monitor the quality of education
1.4 To accelerate the recruitment of library assistantsand laboratory technicians in each district by 2014.1.5 To improve the national examination assessmentframework by 2013.1.6 To promote and incorporate e-learning insecondary education.
1.7 To continue providing Capitation Grant annuallyto eligible Non-Government schools for teaching andlearning materials at the rate of 50% of that ofGovernment schools up to 2014.
1.8 To promote vocational skills for self employmentand reliance by 2015.
2 Key Area 2: Access and Equity2.1. To increase the transition rate from ‘O’ Level to‘A’ Level from 26% in 2009 to 35% by 2014.
2.2. To reduce dropout rate at ‘O’ level from 4.1% in2009 to 3% by 2014.

SEDP II – FINAL DRAFT – MAY 2010
64
Program Purpose2.3.To increase enrolment to Secondary
Education through ODL programmes.
2.4 To provide scholarships to 100,000 from thepresent 43,000 secondary school students annuallyfrom economically poor families by 2014.2.5. To enhance equitable access for students fromunderserved areas by 2014.
2.6 To improve facilities in existing 18 Governmentschools accommodating students with physical ormental disabilities by 2014.2.7 To promote retention of girls to reach 90 % by2014.2.8 To improve the pass rate at ‘O’ level for girls inscience subjects from 46% in 2009 to 60% in 2015and from 16% in 2009 to 25% in 2015 in mathematics.
3 Key Area 3: Teaching Force3.1 To improve the pass rate at ‘O’ level for girls inscience subjects from 46% in 2009 to 60% in 2015and from 16% in 2009 to 25% in 2015 in mathematics.
3.2 To collaborate with other stakeholders inaccelerating the supply of degree graduate teachers forsecondary schools by 2014.
3.3 To enhance professional competence of teachersand tutors by 2014.
3.4 To provide incentives for greater retention ofteachers.
3.5 To ensure equitable distribution and full utilizationof teachers for quality delivery of instruction.
4 Key Area 4: Management5.1 To provide appropriate capacity building at alllevels by 2011.
5.2 To improve access to and use of EducationManagement Information System (EMIS) at all levelsunder the umbrella of ESMIS for use in decision

SEDP II – FINAL DRAFT – MAY 2010
65
Program Purposemaking by 2015.
5.3 To institutionalize the use of school plans as basisfor giving School Heads the necessary inputs for theirperformance by 2010.5.4 To improve cost efficiency of operating SchoolBoards by 2010.
5 Key Area 5: Cross-Cutting Issues6.1 To continue with review and improvement of thecurriculum in relation to HIV/AIDS by 2010.
6.2 To inculcate within the school community theappropriate appreciation and skills for conservation ofthe environment by 2011.
6.3 To promote the existing efforts on gender equalityamong school and college communities by 2010.

SEDP II – FINAL DRAFT – MAY 2010
66
Annex 5: SEDP II Results Monitoring Framework
BaselineData
Target Values Data Collection and ReportingOutcome Indicators
2009 2010 2011 2012 2013 2014 2015 Frequency Instrument
Responsibility
Quality Improvement
Access and Equity
Teaching Force
Management
Cross cutting Issues

SEDP II – FINAL DRAFT – MAY 2010
67
Annex 6: SEDP II Performance Indicators – Baseline Data, 2009
C/N AREAS RATIOS1 PTR Lower Secondary
Upper1.381.30
2 Student Tutor Ration (TTC diploma) N.A3 GER Lower Secondary
Upper Secondary43.64.4
4 NER Lower Secondary Upper Secondary
29.11.5
5 Completion Rates Lower Secondary Upper Secondary
NA
6 Transition Rates Std VII – Form IForm IV – V
51.62.6
7 Dropout Rate Lower SecondaryUpper
4.1NA
8 Repetition Rates NA9 Form I Enrolments: Government
Non Government524 784 (2009)G
10 Promotion Rate: Lower SecondaryUpper Secondary
NANA
11 Book Pupil Ratio: Lower SecondaryUpper Secondary
UNKNOWN
12 Classroom -Pupil Ratio: Lower Secondary, Upper secondary 1:40:1-3013 Classroom size: Lower Secondary, Upper Secondary 64.8M214 Teaching Load: Lower Secondary, Upper Secondary 6PD 30 PW15 Student Contact hours per
week secondary:Lower Secondary, Upper Secondary
16 Pass Rates Lower Secondary, Upper Secondary 83.394.4
17. Net Intake rate (NIR) Lower Secondary, Upper Secondary NA18 Apparent (Gross) intake rate Lower, Upper NA19 Shortage of Desks Lower, Upper NA20 Shortage of Staff Houses 30021 Shortage latrines Lower, upper NA22 Shortage of rapid water
supplyLowerUpper
NA
Primary 75.1Secondary 2008Teacher Education 2.7Higher Education 21.6Preschool 0Other 0
23 Budgetary Allocations bypercentages
Ed Sector 18.3

SEDP II – FINAL DRAFT – MAY 2010
68
Annex 7: Selected Unit Costs and Specifications by Program Area
S/N UNIT COSTS and SPECIFICATIONS
Improvement of Quality
Qty Unit Cost(Tshs
million)1. Capitation grant per student (Government Schools) 8,347,373 0.0252. Cost of construction of laboratories 2350 48.503. Cost of construction libraries/ reading rooms 2500 58.974. Inspectors recruited and posted to zonal and district offices by 2014. 550 1.25
5. Zonal and District inspectorate offices equipped and re-tooled by2013. 143 10.30
6. A total of 150 library assistant and 150 laboratory techniciansrecruited and posted to schools and colleges by 2013. 300 1.185
7. ICT facilities and Equipment-Maintenance-Plan in place andoperational by 2011 21 2.24
8.Appropriate ICT facilities, equipment and teaching/learningmaterials availed to 1,500 schools and 21 IAE Regional centres by2014.
1,521 6.9
9. Capitation Grants to 50,000 students from eligible schools disbursedby September of each year 50000 0.0125
Enhancement of Access and Equity
10. Each region to have at least one eight streams, boarding schoolhaving A level only students by 2013.
5 820.94
11. Each district to have at least two boarding schools having both ‘O’and ‘A’ level by 2013.
35 820.94
12. All rural government schools with no hydropower supplied withsolar power by 2015
3300 18.5
13. 50% of all day schools provide at least one meal per day to theirstudents by 2014 670000 0.2025
14. Facilities for extra-curricular activities including sports and gamesprovided to 50% of all schools by 2013. 1800 3.00
15. Support annual sports events. 3600 2.0016. 70% of the incomplete structures to be completed by 2013. 1200 170
17. 1200 schools without administration blocks to have these constructedand furnished by 2014 1200 71.4
18. 900 schools especially in the rural areas to have at least 2 staffhouses by 2014 1800 40.32
19. 500 schools to have adequate sanitation facilities especially for girlsby 2013 500 5.81

SEDP II – FINAL DRAFT – MAY 2010
69
20. To have 60,000 (from 40,000 of 2008) youths and adults enrolled inthe ODL programme by 2014 20000 0.050
21. One ODL centre in each region equipped with learning facilities ofthe standard given by the Institute of Adult Education by 2014 21 65
22. Increase from 43,000 to 80,000 scholarships provided to eligiblesecondary school students annually by 2014. 37000 0.250
23. A total of 20 hostels accommodating at least 48 students eachconstructed annually, 20 76.05
24. Additional Capitation Grant to the tune of Tsh. 25,000.00 per pupilper year disbursed each year 4744 0.050
25.50% of all government secondary schools to bemodified/rehabilitated to make schools’ infrastructure friendly tostudents/people with disabilities by 2014
13 90.0
26. Construction of ablution blocks for girls schools constructedannually 50 30.0
27. An additional 100 girls’ Hostels constructed by 2015 includingadequate security. 100 76.1
28. Science and math camps for girls scaled-up to include more regionsand classes by 2014 8 150
Improvement of the Teaching Force and Teaching Processes
29. Existing 16 Diploma Teachers Colleges rehabilitated and expandedto accommodate not less than 1000 students each by 2014. 16 450
30. A total of 35,000 diploma teachers trained between 2010 and 2014 7000 0.293
31. A total of 3 TCs introducing the concurrent A-Level and Diplomateacher training by 2013. 45 2.21
32. A total of 8 TRCs institutionalized, expanded/increased andequipped with appropriate facilities by 2012 8 125
33. 3500 new graduates annually taking posts in difficult and hard- to-reach areas receive Tsh 500,000 3500 0.50
34. 2,000 housing units built every year throughout the programmetime. 2000 40.3
35. 6,000 teachers receive short term training annually. 6000 0.54
36. Procurement and installation of EMIS equipment up to Council levelcompleted by 2011 133 6.3
37. Training on how to operate the equipment up to Council levelscompleted by 2011. 286 3.9
38. Capacity building on Data Base Management provided at all levelsby 2012. 18 22.92
39. 70% of all schools having water and sanitation requirements by 2013 1900 8

SEDP II – FINAL DRAFT – MAY 2010
70
Annex 8: SEDP II – Budget and financing scenarios
SCENARIO 1 – Table A: Budget Summary by Key Program Areas, 2010/11 – 2014/15
(Figures in Millions Tshs)
YEARProgramme Areas
2010/11 2011/12 2012/13 2013/14 2014/15
GRAND
TOTAL
I. Quality Improvement 102,569 120,852 126,013 100,637 71,385 521,455II. Access and Equity 134,915 144,706 134,729 130,891 122,700 667,940III. Teaching Forces and TeachingProcesses 29,869 31,692 32,210 29,243 29,013 152,027
IV. Management Efficiency and Goodgovernance 12,561 12,290 11,748 11,014 11,105 58,690
V. Cross Cutting Issues 7,855 7,270 6,993 7,138 7,291 36,385TOTAL 500,959 580,186 627,373 648,221 666,051 3,022,601
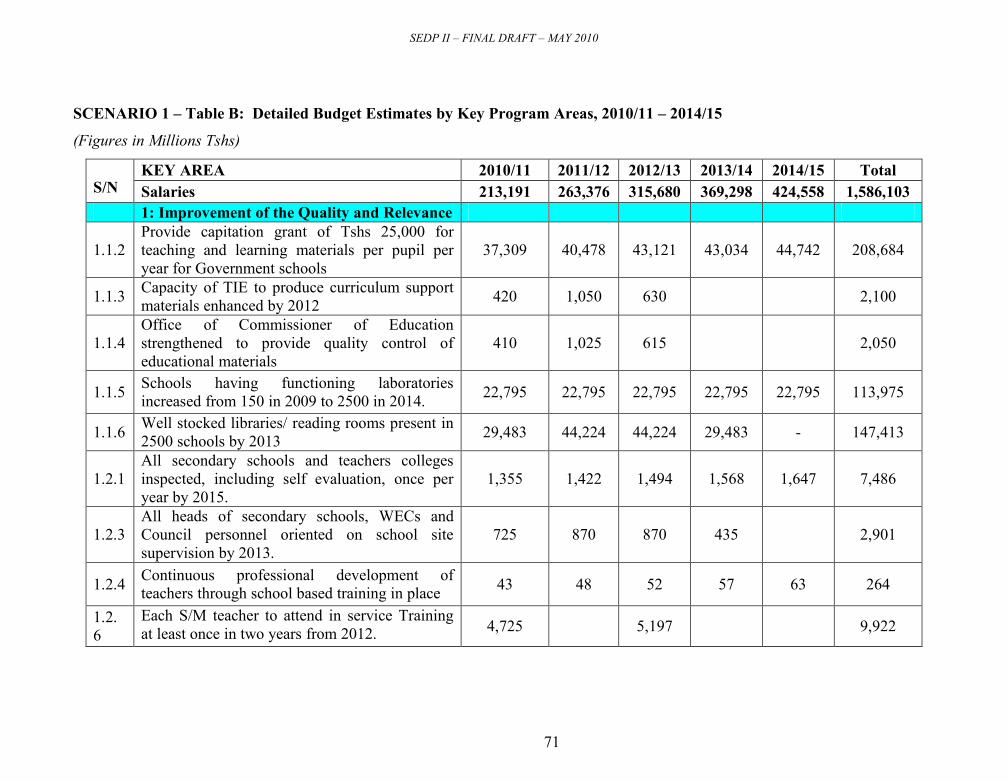
SEDP II – FINAL DRAFT – MAY 2010
71
SCENARIO 1 – Table B: Detailed Budget Estimates by Key Program Areas, 2010/11 – 2014/15
(Figures in Millions Tshs)
KEY AREA 2010/11 2011/12 2012/13 2013/14 2014/15 TotalS/N Salaries 213,191 263,376 315,680 369,298 424,558 1,586,103
1: Improvement of the Quality and Relevance
1.1.2Provide capitation grant of Tshs 25,000 forteaching and learning materials per pupil peryear for Government schools
37,309 40,478 43,121 43,034 44,742 208,684
1.1.3 Capacity of TIE to produce curriculum supportmaterials enhanced by 2012 420 1,050 630 2,100
1.1.4Office of Commissioner of Educationstrengthened to provide quality control ofeducational materials
410 1,025 615 2,050
1.1.5 Schools having functioning laboratoriesincreased from 150 in 2009 to 2500 in 2014. 22,795 22,795 22,795 22,795 22,795 113,975
1.1.6 Well stocked libraries/ reading rooms present in2500 schools by 2013 29,483 44,224 44,224 29,483 - 147,413
1.2.1All secondary schools and teachers collegesinspected, including self evaluation, once peryear by 2015.
1,355 1,422 1,494 1,568 1,647 7,486
1.2.3All heads of secondary schools, WECs andCouncil personnel oriented on school sitesupervision by 2013.
725 870 870 435 2,901
1.2.4 Continuous professional development ofteachers through school based training in place 43 48 52 57 63 264
1.2.6
Each S/M teacher to attend in service Trainingat least once in two years from 2012. 4,725 5,197 9,922

SEDP II – FINAL DRAFT – MAY 2010
72
1.3.1A total of 550 Inspectors recruited and posted tozonal and district offices by 2014. 137 205 205 68 68 685
1.3.2A total of 143 Zonal and District inspectorateoffices equipped and re-tooled by 2013. 295 442 442 295 1,473
1.3.3 800 inspectors given professional developmenttraining by 2014 192 576 576 384 192 1,920
1.4.1 At least 3 institutions have facilities to trainlaboratory technicians by 2012 81 108 81 270
1.4.2The capacity of SLADS increased to train 20%more library assistants than they are currentlyproducing by 2013
34 85 51 170
1.4.3A total of 150 library assistant and 150laboratory technicians recruited and posted toschools and colleges by 2013.
71 142 107 36 356
1.5.2Provision of necessary facilities for efficientexecution of NECTA activities in place by 2011. 580 870 1,450
1.5.3 Assessment and examinations policies andpractices reviewed by 2012. 78 78
1.5.4 NECTA personnel trained on appropriateassessment system by 2013 122 162 122 405
1.6.1ICT facilities and Equipment-Maintenance-Planin place and operational by 2011 0 47 0 0 0 47
1.6.2Appropriate ICT facilities, equipment andteaching/learning materials availed to 1,500schools and 21 IAE Regional centres by 2014.
2,099 3,148 3,148 1,049 1,049 10,495
1.6.3 A total of 5,000 teachers trained in e-learningteaching by 2013. 900 1,800 1,350 450 4,500

SEDP II – FINAL DRAFT – MAY 2010
73
1.6.4Information and Computer Studies (ICS) subjecttaught in 1000 secondary by 2013 170 179 187 197 733
1.7.1Conduct fee structure survey for Non-Government secondary schools annually. - 51 56 62 68 238
1.7.3Capitation Grants to 50,000 students fromeligible schools disbursed by September of eachyear
625 656 689 724 760 3,454
1.8.1A study on strengthening vocational skills intosecondary education system conducted by 2011. 389 389
Sub Total 102,569 120,852 126,013 100,637 71,385 521,4552. Enhancement of Access and Equity
2.1.1 Each region to have at least one eight streams,boarding school having A level only students by2013.
821 1,642 1,231 410 4,105
2.1.2 Each district to have at least two boardingschools having both ‘O’ and ‘A’ level by 2013.
5,747 11,493 5,747 5,747 28,733
2.1.4 All rural government schools with nohydropower supplied with solar power by 2015 12,210 12,210 12,210 12,210 12,210 61,050
2.1.5 A-Level integrated curriculum, study materialsand learners manuals developed by 2012 34 45 34 113
2.1.7 800,000 copies of modules and learners manualsreprinted and distributed by 2011 2,560 3,840 6,400
2.2.1 4000 teachers/ matrons/ patrons trained onguidance and counseling by 2014. 520 780 520 390 390 2,600
2.2.2 Peer guidance and counseling strengthened in allschools by 2012 410 431 452 1,293
2.2.3 Communities sensitised and organized tocontribute for their children’s meals by 2013 300 315 331 946

SEDP II – FINAL DRAFT – MAY 2010
74
2.2.4 50% of all day schools provide at least one mealper day to their students by 2014 27,135 27,135 27,135 27,135 27,135 135,675
2.2.5 Facilities for extra-curricular activitiesincluding sports and games provided to 50% ofall schools by 2013.
1,350 1,350 1,350 1,350 5,400
2.2.6 Support annual sports events. 1,440 1,440 1,440 1,440 1,440 7,200
2.3.1 Report on number and status of unfinishedstructures be in place by July, 2010 123 123
2.3.2 A plan for completing the structures to be inplace by August, 2010 72 72
2.3.3 70% of the incomplete structures to becompleted by 2013. 40,800 40,800 40,800 40,800 40,800 204,000
2.3.4 1200 schools without administration blocks tohave these constructed and furnished by 2014 17,146 17,146 17,146 17,146 17,146 85,728
2.3.5 900 schools especially in the rural areas to haveat least 2 staff houses by 2014 14,515 14,515 14,515 14,515 14,515 72,576
2.3.6 500 schools to have adequate sanitation facilitiesespecially for girls by 2013 581 871 871 581 2,904
2.4.1To have 60,000 (from 40,000 of 2008) youthsand adults enrolled in the ODL programme by2014
200 200 200 200 200 1,000
2.4.2Four ODL study centres coordinators from eachregion receive training on counseling skills by2014.
25 25 25 25 25 124
2.4.3One ODL centre in each region equipped withlearning facilities of the standard given by theInstitute of Adult Education by 2014
273 273 410 273 137 1,365

SEDP II – FINAL DRAFT – MAY 2010
75
2.5.1Scheme for identifying and sponsoringbeneficiaries of Government schoolarship fundreviewed by 2010
81 81
2.5.3 Increase from 43,000 to 80,000 scholarshipsprovided to eligible secondary school studentsannually by 2014.
1,850 1,850 1,850 1,850 1,850 9,250
2.5.5 Scholarship scheme monitored annually 88 92 97 102 107 4862.6.2 A total of 20 hostels accommodating at least 48
students each constructed annually, 1,521 1,597 1,677 1,761 1,849 8,404
2.7.2 Additional Capitation Grant to the tune of Tsh.25,000.00 per pupil per year disbursed each year 0 237 249 262 275 1,022
2.7.3
50% of all government secondary schools to bemodified/rehabilitated to make schools’infrastructure friendly to students/people withdisabilities by 2014
234 351 351 234 1,170
2.8.1 A total of 50 Ablution and latrine blocks forgirls in schools constructed annually 1,500 1,575 1,654 1,736 1,823 8,288
2.8.2 An additional 100 girls’ Hostels constructed by2015 including adequate security. 1,521 2,282 2,282 761 761 7,605
2.8.3 TUSEME activities extend to all regions by2015 259 389 389 130 130 1,297
2.8.4 Review of TUSEME activities carried out by2011 85 85
2.8.6 School rules and regulations reviewed by 2011,including the re-entry policy for pregnant girls. 77 77
2.8.7 Special feature articles appearing on papersevery week from 2012. 42 46 50 138

SEDP II – FINAL DRAFT – MAY 2010
76
2.9.1 All schools with girls to have effective remedialand mentorship programmes by 2014. 400 400 400 400 400 2000
2.9.3 Science and math camps for girls scaled-up toinclude more regions and classes by 2014 1,200 1,260 1,323 1,389 1,459 6,631
Sub Total 134,915 144,706 134,729 130,891 122,700 667,9403.Improvement of the Teaching Force andTeaching Processes
3.1.1Existing 16 Diploma Teachers Collegesrehabilitated and expanded to accommodate notless than 1000 students each by 2014.
720 2,160 2,160 1,440 720 7,200
3.1.2 A total of 35,000 diploma teachers trainedbetween 2010 and 2014 2,051 2256 2482 2730 3003 12,522
3.1.3 Online teacher training courses initiated by2012. 420 441 463 1,324
3.1.4 A total of 3 TCs introducing the concurrent A-Level and Diploma teacher training by 2013. 99 99
3.2.3 Adequate quality A-Level and O- Level teachersand school managers developed by 2014 2,856 2,856 2,856 2,856 2,856 14,282
3.3.1 Training needs assessment for teachers/tutorscompetence conducted by 2010. 173 - - - - 173
3.3.2 In-service Training (INSET) programmesdesigned by 2010. 115 - - - - 115
3.3.3A total of 8 TRCs institutionalized,expanded/increased and equipped withappropriate facilities by 2012
333 333 333 - - 1,000
3.4.13500 new graduates annually taking posts indifficult and hard- to-reach areas receive Tsh500,000
1,750 1,750 1,750 1,750 1,750 8,750

SEDP II – FINAL DRAFT – MAY 2010
77
3.4.2 2,000 housing units built every year throughoutthe programme time. 16,128 16,128 16,128 16,128 16,128 80,640
3.4.4 6,000 teachers receive short term trainingannually. 3,210 3,371 3,539 3,716 3,902 17,737
3.5.2 Deployment of teachers currently in the fieldcarried out and sustained by 2012 1,575 1,733 1,906 5,213
3.5.3 M&E carried out by PMO-RALG incollaboration with MOEVT officials regularlyfrom 2010
538 565 593 623 654 2,973
Sub Total 29,869 31,692 32,210 29,243 29,013 152,0274. Improving Management Efficiency andGood Governance
4.1.1Human Resources situational analysiscompleted and then capacity building strategyfinalized and operationalized by end of 2011.
293 0 0 0 0 293
4.1.2
Use results of the HR situational analysis toensure appropriate capacity is built to Heads ofschools, School board members, Mangers ofNon-Government schools,WECS,DSEOs,REOs,Ministry staff in Governance andManagement of secondary educationtheirdifferent needs and levels
8,724 8,724 8,724 8,724 8,724 43,622
4.1.3 Monitoring and Evaluation Plan developed andoperationalized by 2010 269 269
4.1.4 Monitoring exercises SEDP II conducted andreports prepared semi- annually 605 636 667 701 736 3,344
4.1.5 Diagnostic evaluation conducted and reportsprepared as required. 304 319 320 336 1,280
4.1.8 Inter-Ministerial meetings conducted twiceyearly from 2010, 383 402 422 443 465 2,114

SEDP II – FINAL DRAFT – MAY 2010
78
4.1.10 Study on success of D by D carried out by 2012 351 351
4.2.1Procurement and installation of EMISequipment up to Council level completed by2011
419 419 838
4.2.2 Training on how to operate the equipment up toCouncil levels completed by 2011. 551 578 1,101
4.2.3 Capacity building on Data Base Managementprovided at all levels by 2012. 413 433 455 1,301
4.2.4 Integrate and harmonize Education SectorDatabase at all levels 479 479 479 479 479 2,394
4.2.5 IEC offices retooled by 2010. 12 - - - - 12
4.2.6 IEC personnel given/ having basic training by2010. 115 115
4.2.7 SEDP activities publicized quarterly every yearfrom 2011 300 315 331 347 365 1,658
Sub Total 12,561 12,290 11,748 11,014 11,105 58,690E. Cross Cutting Issues
5.1.1 Curricula of Cross Cutting Issues in secondaryeducation reviewed and shared withstakeholders by 2011.
338 338 675
5.1.2 Capacity for handling HIV/AIDS and life skillseducation of 16,000 teachers strengthened up by2014
1,232 1,232 1,232 1,232 1,232 6,160
5.1.3 Needs assessment for pupils and personnelaffected and infected with HIV/AIDSconductedby 2010.
162 162
5.1.5 Special feeding programme for affected andinfected students in place by 2010. 940 987 1,036 1,088 1,143 5,194
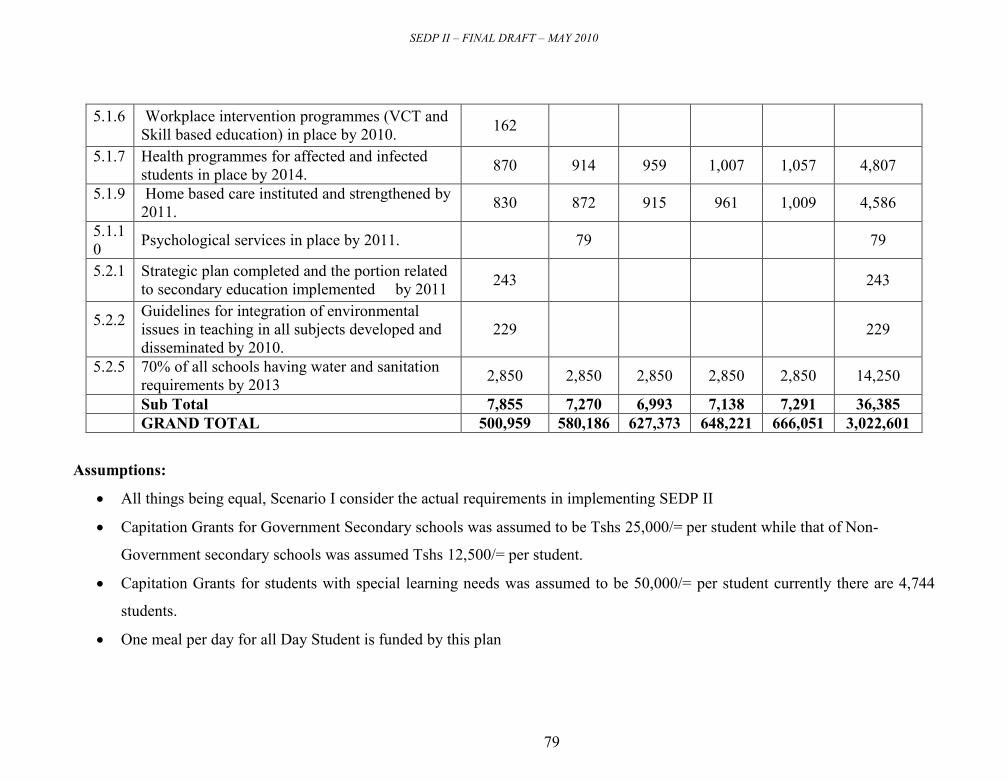
SEDP II – FINAL DRAFT – MAY 2010
79
5.1.6 Workplace intervention programmes (VCT andSkill based education) in place by 2010. 162
5.1.7 Health programmes for affected and infectedstudents in place by 2014. 870 914 959 1,007 1,057 4,807
5.1.9 Home based care instituted and strengthened by2011. 830 872 915 961 1,009 4,586
5.1.10 Psychological services in place by 2011. 79 79
5.2.1 Strategic plan completed and the portion relatedto secondary education implemented by 2011 243 243
5.2.2 Guidelines for integration of environmentalissues in teaching in all subjects developed anddisseminated by 2010.
229 229
5.2.5 70% of all schools having water and sanitationrequirements by 2013 2,850 2,850 2,850 2,850 2,850 14,250
Sub Total 7,855 7,270 6,993 7,138 7,291 36,385GRAND TOTAL 500,959 580,186 627,373 648,221 666,051 3,022,601
Assumptions:
All things being equal, Scenario I consider the actual requirements in implementing SEDP II
Capitation Grants for Government Secondary schools was assumed to be Tshs 25,000/= per student while that of Non-
Government secondary schools was assumed Tshs 12,500/= per student.
Capitation Grants for students with special learning needs was assumed to be 50,000/= per student currently there are 4,744
students.
One meal per day for all Day Student is funded by this plan

SEDP II – FINAL DRAFT – MAY 2010
80
SCENARIO 1 – Table C: Resources Projections and Financing Gap, 2010/11 – 2014/15
(Figures in Millions Tshs)
A: ResourcesResources 2009/10 2010/11 2011/12 2012/13 2013/14 2014/15
A1 Total Govt. Expenditure 9,513,685 10,476,112 11,132,723 12,001,678 12,961,812 13,998,757
A2Recurrent Expenditure &Salaries 6,688,254 7,256,155 7,536,475 8,118,070 8,767,516 9,468,917
A3 Development Expenditure 2,825,431 3,219,957 3,596,248 3,883,608 4,194,297 4,529,840Growth in total Govt.expenditure
A4 Total Education Expenditure 1,743,880 2,095,222 2,337,872 2,520,352 2,851,599 3,079,727
A5Recurrent Expenditure &Salaries 1,451,231 1,582,660 1,704,795 1,928,853 2,083,162
A6 Development Expenditure 643,991 755,212 815,558 922,745 996,565
A7Total educ.as % of totalGovt.expend 18.3% 20.0% 21.0% 21.0% 22.0% 22.0%
A8Total Secondary EducationExpenditure 226,583 356,844 403,163 455,493 514,616 581,413
A9Recurrent Expenditure &Salaries 178,672 283,158 319,911 361,436 408,350 461,354
A10 Development Expenditure 47,911 73,687 83,251 94,057 106,266 120,059
A11
Average percentage ofsecondary education budgetallocation 13.0% 13.0% 13.0% 13.0% 13.0%
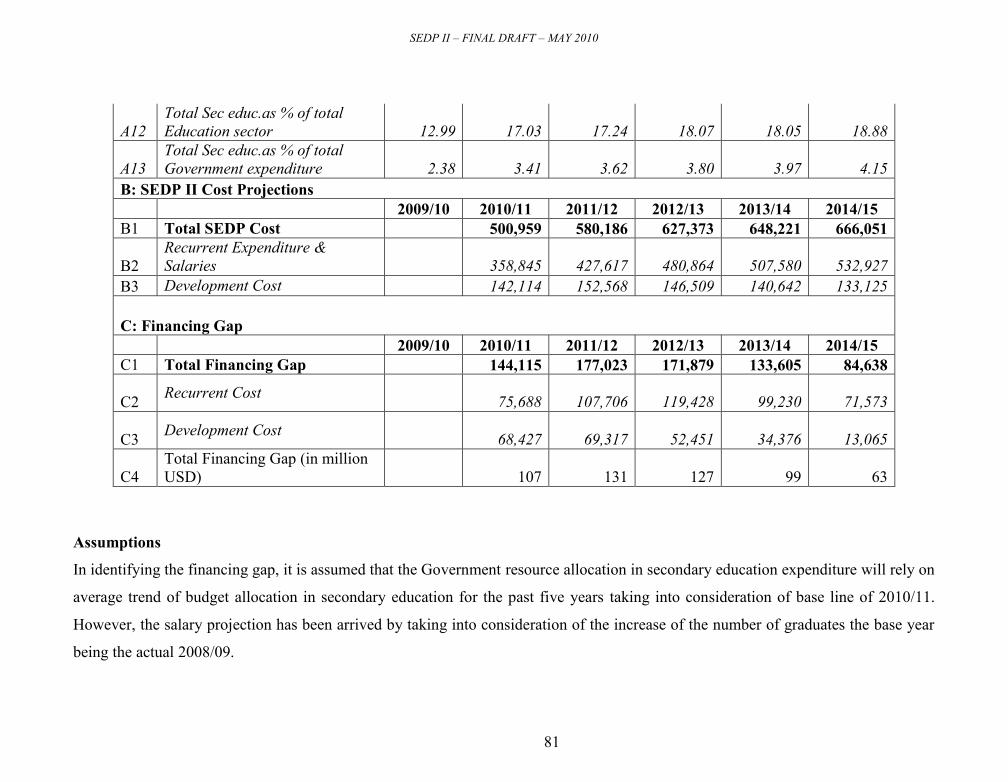
SEDP II – FINAL DRAFT – MAY 2010
81
A12Total Sec educ.as % of totalEducation sector 12.99 17.03 17.24 18.07 18.05 18.88
A13Total Sec educ.as % of totalGovernment expenditure 2.38 3.41 3.62 3.80 3.97 4.15
B: SEDP II Cost Projections2009/10 2010/11 2011/12 2012/13 2013/14 2014/15
B1 Total SEDP Cost 500,959 580,186 627,373 648,221 666,051
B2Recurrent Expenditure &Salaries 358,845 427,617 480,864 507,580 532,927
B3 Development Cost 142,114 152,568 146,509 140,642 133,125
C: Financing Gap2009/10 2010/11 2011/12 2012/13 2013/14 2014/15
C1 Total Financing Gap 144,115 177,023 171,879 133,605 84,638
C2 Recurrent Cost 75,688 107,706 119,428 99,230 71,573
C3 Development Cost 68,427 69,317 52,451 34,376 13,065
C4Total Financing Gap (in millionUSD) 107 131 127 99 63
Assumptions
In identifying the financing gap, it is assumed that the Government resource allocation in secondary education expenditure will rely on
average trend of budget allocation in secondary education for the past five years taking into consideration of base line of 2010/11.
However, the salary projection has been arrived by taking into consideration of the increase of the number of graduates the base year
being the actual 2008/09.

SEDP II – FINAL DRAFT – MAY 2010
82
SCENARIO 2 – Table A: Budget Summary by Key Program Areas, 2010/11 – 2014/15
(Figures in Millions Tshs)
YEARProgramme Areas
2010/11 2011/12 2012/13 2013/14 2014/15
GRAND
TOTAL
I. Quality Improvement 95,465 113,392 118,644 93,582 64,492 485,574II. Access and Equity 130,418 138,932 130,180 126,979 120,881 647,390III. Teaching Forces and TeachingProcesses 25,837 27,660 28,178 25,211 24,981 131,867
IV. Management Efficiency and Goodgovernance 12,561 12,290 11,748 11,014 11,105 58,690
V. Cross Cutting Issues 7,855 7,270 6,993 7,138 7,291 36,385TOTAL 485,327 562,920 611,423 633,222 653,308 2,946,011

SEDP II – FINAL DRAFT – MAY 2010
83
SCENARIO 2 – Table B: Detailed Budget Estimates by Key Program Areas, 2010/11 – 2014/15
(Figures in Millions Tshs)
KEY AREA 2010/11 2011/12 2012/13 2013/14 2014/15 TotalS/N Salaries 213,191 263,376 315,680 369,298 424,558 1,586,103
1: Improvement of the Quality andRelevance
1.1.2Provide capitation grant of Tshs 25,000for teaching and learning materials perpupil per year for Government schools
37,309 40,478 43,121 43,034 44,742 208,684
1.1.3 Capacity of TIE to produce curriculumsupport materials enhanced by 2012 420 1,050 630 2,100
1.1.4Office of Commissioner of Educationstrengthened to provide quality controlof educational materials
410 1,025 615 2,050
1.1.5Schools having functioning laboratoriesincreased from 150 in 2009 to 2500 in2014.
16,005 16,005 16,005 16,005 16,005 80,025
1.1.6 Well stocked libraries/ reading roomspresent in 2500 schools by 2013 29,483 44,224 44,224 29,483 - 147,413
1.2.1All secondary schools and teacherscolleges inspected, including selfevaluation, once per year by 2015.
1,355 1,422 1,494 1,568 1,647 7,486
1.2.3All heads of secondary schools, WECsand Council personnel oriented onschool site supervision by 2013.
725 870 870 435 2,901
1.2.4Continuous professional development ofteachers through school based training inplace
43 48 52 57 63 264

SEDP II – FINAL DRAFT – MAY 2010
84
1.2. 6Each S/M teacher to attend in serviceTraining at least once in two years from2012.
4,725 5,197 9,922
1.3.1A total of 550 Inspectors recruited andposted to zonal and district offices by2014.
75 112 112 37 37 374
1.3.2A total of 143 Zonal and Districtinspectorate offices equipped and re-tooled by 2013.
295 442 442 295 1,473
1.3.3 800 inspectors given professionaldevelopment training by 2014 120 360 360 240 120 1,200
1.4.1 At least 3 institutions have facilities totrain laboratory technicians by 2012 81 108 81 270
1.4.2The capacity of SLADS increased totrain 20% more library assistants thanthey are currently producing by 2013
34 85 51 170
1.4.3A total of 150 library assistant and 150laboratory technicians recruited andposted to schools and colleges by 2013.
71 142 107 36 356
1.5.2Provision of necessary facilities forefficient execution of NECTA activitiesin place by 2011.
580 870 1,450
1.5.3 Assessment and examinations policiesand practices reviewed by 2012. 78 78
1.5.4 NECTA personnel trained on appropriateassessment system by 2013 122 162 122 405
1.6.1ICT facilities and Equipment-Maintenance-Plan in place andoperational by 2011
0 47 0 0 0 47

SEDP II – FINAL DRAFT – MAY 2010
85
1.6.2
Appropriate ICT facilities, equipmentand teaching/learning materials availedto 1,500 schools and 21 IAE Regionalcentres by 2014.
2,099 3,148 3,148 1,049 1,049 10,495
1.6.3 A total of 5,000 teachers trained in e-learning teaching by 2013. 720 1,440 1,080 360 3,600
1.6.4Information and Computer Studies (ICS)subject taught in 1000 secondary by2013
170 179 187 197 733
1.7.1Conduct fee structure survey for Non-Government secondary schools annually. - 51 56 62 68 238
1.7.3Capitation Grants to 50,000 studentsfrom eligible schools disbursed bySeptember of each year
625 656 689 724 760 3,454
1.8.1A study on strengthening vocationalskills into secondary education systemconducted by 2011.
389 389
Sub Total 95,465 113,392 118,644 93,582 64,492 485,5742. Enhancement of Access and Equity
2.1.1Each region to have at least one eightstreams, boarding school having A levelonly students by 2013.
575 1,149 862 287 2,873
2.1.2Each district to have at least twoboarding schools having both ‘O’ and‘A’ level by 2013.
4,023 8,045 4,023 4,023 20,113
2.1.4All rural government schools with nohydropower supplied with solar powerby 2015
11,100 11,100 11,100 11,100 11,100 55,500
2.1.5 A-Level integrated curriculum, studymaterials and learners manuals 34 45 34 113

SEDP II – FINAL DRAFT – MAY 2010
86
developed by 2012
2.1.7800,000 copies of modules and learnersmanuals reprinted and distributed by2011
2,240 3,360 5,600
2.2.1 4000 teachers/ matrons/ patrons trainedon guidance and counseling by 2014. 520 780 520 390 390 2,600
2.2.2 Peer guidance and counselingstrengthened in all schools by 2012 410 431 452 1,293
2.2.3Communities sensitised and organized tocontribute for their children’s meals by2013
300 315 331 946
2.2.450% of all day schools provide at leastone meal per day to their students by2014
27,135 27,135 27,135 27,135 27,135 135,675
2.2.5 Facilities for extra-curricular activitiesincluding sports and games provided to50% of all schools by 2013.
1,080 2,160 1,080 1,080 5,400
2.2.6 Support annual sports events. 1,440 1,440 1,440 1,440 1,440 7,200
2.3.1Report on number and status ofunfinished structures be in place by July,2010
123 123
2.3.2 A plan for completing the structures tobe in place by August, 2010 72 72
2.3.3 70% of the incomplete structures to becompleted by 2013. 40,800 40,800 40,800 40,800 40,800 204,000
2.3.41200 schools without administrationblocks to have these constructed andfurnished by 2014
17,146 17,146 17,146 17,146 17,146 85,728

SEDP II – FINAL DRAFT – MAY 2010
87
2.3.5 900 schools especially in the rural areasto have at least 2 staff houses by 2014 14,515 14,515 14,515 14,515 14,515 72,576
2.3.6 500 schools to have adequate sanitationfacilities especially for girls by 2013 581 871 871 581 2,904
2.4.1To have 60,000 (from 40,000 of 2008)youths and adults enrolled in the ODLprogramme by 2014
200 200 200 200 200 1,000
2.4.2Four ODL study centres coordinatorsfrom each region receive training oncounseling skills by 2014.
25 25 25 25 25 124
2.4.3
One ODL centre in each region equippedwith learning facilities of the standardgiven by the Institute of Adult Educationby 2014
273 273 410 273 137 1,365
2.5.1Scheme for identifying and sponsoringbeneficiaries of Governmentschoolarship fund reviewed by 2010
81 81
2.5.3
Increase from 43,000 to 80,000scholarships provided to eligiblesecondary school students annually by2014.
1,850 1,850 1,850 1,850 1,850 9,250
2.5.5 Scholarship scheme monitored annually 88 92 97 102 107 486
2.6.2 A total of 20 hostels accommodating atleast 48 students each constructedannually,
1,108 1,163 1,221 1,283 1,347 6,122
2.7.2Additional Capitation Grant to the tuneof Tsh. 25,000.00 per pupil per yeardisbursed each year
0 237 249 262 275 1,022
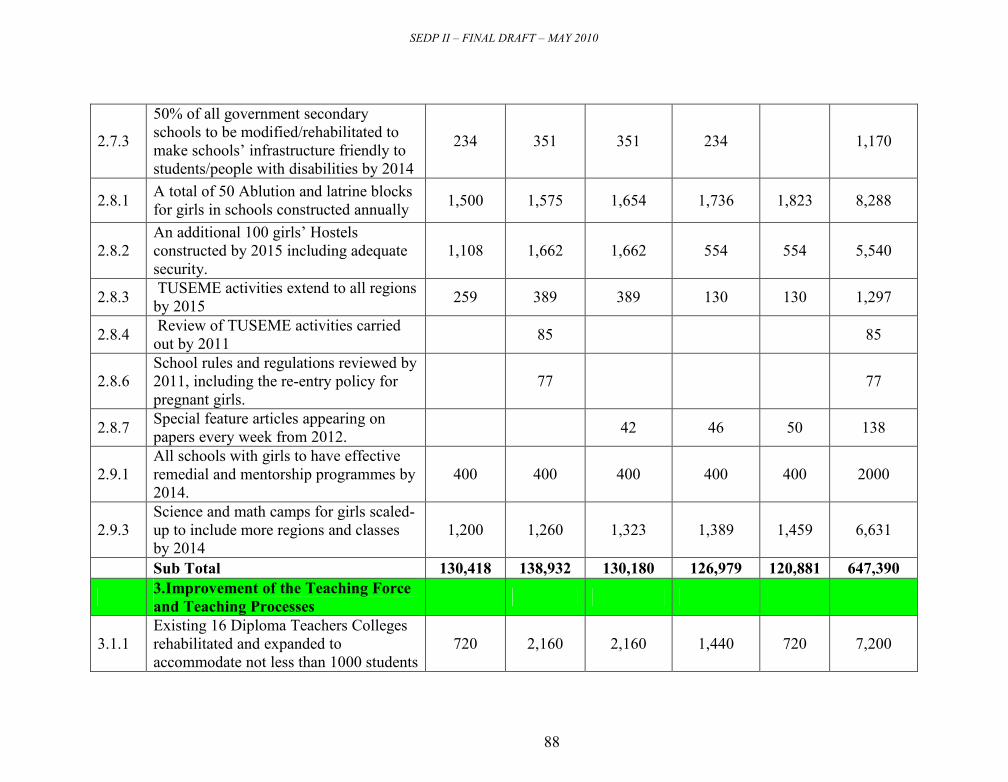
SEDP II – FINAL DRAFT – MAY 2010
88
2.7.3
50% of all government secondaryschools to be modified/rehabilitated tomake schools’ infrastructure friendly tostudents/people with disabilities by 2014
234 351 351 234 1,170
2.8.1 A total of 50 Ablution and latrine blocksfor girls in schools constructed annually 1,500 1,575 1,654 1,736 1,823 8,288
2.8.2An additional 100 girls’ Hostelsconstructed by 2015 including adequatesecurity.
1,108 1,662 1,662 554 554 5,540
2.8.3 TUSEME activities extend to all regionsby 2015 259 389 389 130 130 1,297
2.8.4 Review of TUSEME activities carriedout by 2011 85 85
2.8.6School rules and regulations reviewed by2011, including the re-entry policy forpregnant girls.
77 77
2.8.7 Special feature articles appearing onpapers every week from 2012. 42 46 50 138
2.9.1All schools with girls to have effectiveremedial and mentorship programmes by2014.
400 400 400 400 400 2000
2.9.3Science and math camps for girls scaled-up to include more regions and classesby 2014
1,200 1,260 1,323 1,389 1,459 6,631
Sub Total 130,418 138,932 130,180 126,979 120,881 647,3903.Improvement of the Teaching Forceand Teaching Processes
3.1.1Existing 16 Diploma Teachers Collegesrehabilitated and expanded toaccommodate not less than 1000 students
720 2,160 2,160 1,440 720 7,200

SEDP II – FINAL DRAFT – MAY 2010
89
each by 2014.
3.1.2 A total of 35,000 diploma teacherstrained between 2010 and 2014 2,051 2256 2482 2730 3003 12,522
3.1.3 Online teacher training courses initiatedby 2012. 420 441 463 1,324
3.1.4A total of 3 TCs introducing theconcurrent A-Level and Diploma teachertraining by 2013.
99 99
3.2.3Adequate quality A-Level and O- Levelteachers and school managers developedby 2014
2,856 2,856 2,856 2,856 2,856 14,282
3.3.1 Training needs assessment forteachers/tutors competence conducted by2010.
173 - - - - 173
3.3.2 In-service Training (INSET)programmes designed by 2010. 115 - - - - 115
3.3.3A total of 8 TRCs institutionalized,expanded/increased and equipped withappropriate facilities by 2012
333 333 333 - - 1,000
3.4.13500 new graduates annually takingposts in difficult and hard- to-reach areasreceive Tsh 500,000
1,750 1,750 1,750 1,750 1,750 8,750
3.4.2 2,000 housing units built every yearthroughout the programme time. 12,096 12,096 12,096 12,096 12,096 60,480
3.4.4 6,000 teachers receive short termtraining annually. 3,210 3,371 3,539 3,716 3,902 17,737
3.5.2 Deployment of teachers currently in thefield carried out and sustained by 2012 1,575 1,733 1,906 5,213

SEDP II – FINAL DRAFT – MAY 2010
90
3.5.3 M&E carried out by PMO-RALG incollaboration with MOEVT officialsregularly from 2010
538 565 593 623 654 2,973
Sub Total 25,837 27,660 28,178 25,211 24,981 131,8674. Improving Management Efficiencyand Good Governance
4.1.1
Human Resources situational analysiscompleted and then capacity buildingstrategy finalized and operationalized byend of 2011.
293 0 0 0 0 293
4.1.2
Use results of the HR situational analysisto ensure appropriate capacity is built toHeads of schools, School boardmembers, Mangers of Non-Governmentschools,WECS,DSEOs, REOs,Ministrystaff in Governance and Management ofsecondary educationtheir different needsand levels
8,724 8,724 8,724 8,724 8,724 43,622
4.1.3 Monitoring and Evaluation Plandeveloped and operationalized by 2010 269 269
4.1.4 Monitoring exercises SEDP IIconducted and reports prepared semi-annually
605 636 667 701 736 3,344
4.1.5 Diagnostic evaluation conducted andreports prepared as required. 304 319 320 336 1,280
4.1.8 Inter-Ministerial meetings conductedtwice yearly from 2010, 383 402 422 443 465 2,114
4.1.10 Study on success of D by D carried outby 2012 351 351

SEDP II – FINAL DRAFT – MAY 2010
91
4.2.1Procurement and installation of EMISequipment up to Council level completedby 2011
419 419 838
4.2.2Training on how to operate theequipment up to Council levelscompleted by 2011.
551 578 1,101
4.2.3Capacity building on Data BaseManagement provided at all levels by2012.
413 433 455 1,301
4.2.4 Integrate and harmonize EducationSector Database at all levels 479 479 479 479 479 2,394
4.2.5 IEC offices retooled by 2010. 12 - - - - 12
4.2.6 IEC personnel given/ having basictraining by 2010. 115 115
4.2.7 SEDP activities publicized quarterlyevery year from 2011 300 315 331 347 365 1,658
Sub Total 12,561 12,290 11,748 11,014 11,105 58,690E. Cross Cutting Issues
5.1.1 Curricula of Cross Cutting Issues insecondary education reviewed andshared with stakeholders by 2011.
338 338 675
5.1.2 Capacity for handling HIV/AIDS andlife skills education of 16,000 teachersstrengthened up by 2014
1,232 1,232 1,232 1,232 1,232 6,160
5.1.3 Needs assessment for pupils andpersonnel affected and infected withHIV/AIDSconducted by 2010.
162 162
5.1.5 Special feeding programme for affectedand infected students in place by 2010. 940 987 1,036 1,088 1,143 5,194

SEDP II – FINAL DRAFT – MAY 2010
92
5.1.6 Workplace intervention programmes(VCT and Skill based education) in placeby 2010.
162
5.1.7 Health programmes for affected andinfected students in place by 2014. 870 914 959 1,007 1,057 4,807
5.1.9 Home based care instituted andstrengthened by 2011. 830 872 915 961 1,009 4,586
5.1.10 Psychological services in place by 2011. 79 79
5.2.1Strategic plan completed and the portionrelated to secondary educationimplemented by 2011
243 243
5.2.2
Guidelines for integration ofenvironmental issues in teaching in allsubjects developed and disseminated by2010.
229 229
5.2.5 70% of all schools having water andsanitation requirements by 2013 2,850 2,850 2,850 2,850 2,850 14,250
Sub Total 7,855 7,270 6,993 7,138 7,291 36,385GRAND TOTAL 485,327 562,920 611,423 633,222 653,308 2,946,011
Assumptions: Scenario II is based on the following assumptions regarding to the actual requirements.
Community contribution for construction of Classrooms, Hostels, Laboratories, Libraries, Ablutions blocks and Teachers houses isassumed to be 30% of Total construction costs. Development Grants to be made available based on specific school plans
Capitation Grants for Government Secondary schools is assumed to be Tshs 10,000/= per student while that of Non- Governmentsecondary schools is assumed Tshs 5,000/= per student.
Capitation Grants for students with special learning needs was assumed to be 50,000/= per student currently there are 4,744students.
Meals to Day scholars are still provided by Government

SEDP II – FINAL DRAFT – MAY 2010
93
SCENARIO 2 – Table C: Resources Projections and Financing Gap, 2010/11 – 2014/15
(Figures in Millions Tshs)
A: ResourcesResources 2009/10 2010/11 2011/12 2012/13 2013/14 2014/15
A1 Total Govt. Expenditure 9,513,685 10,476,112 11,132,723 12,001,678 12,961,812 13,998,757
A2Recurrent Expenditure &Salaries 6,688,254 7,256,155 7,536,475 8,118,070 8,767,516 9,468,917
A3 Development Expenditure 2,825,431 3,219,957 3,596,248 3,883,608 4,194,297 4,529,840Growth in total Govt. expenditure
A4 Total Education Expenditure 1,743,880 2,095,222 2,337,872 2,520,352 2,851,599 3,079,727
A5Recurrent Expenditure &Salaries 1,451,231 1,582,660 1,704,795 1,928,853 2,083,162
A6 Development Expenditure 643,991 755,212 815,558 922,745 996,565
A7Total educ.as % of totalGovt.expend 18.3% 20.0% 21.0% 21.0% 22.0% 22.0%
A8Total Secondary EducationExpenditure 226,583 356,844 403,163 455,493 514,616 581,413
A9Recurrent Expenditure &Salaries 178,672 283,158 319,911 361,436 408,350 461,354
A10 Development Expenditure 47,911 73,687 83,251 94,057 106,266 120,059
A11Average percentage of secondaryeducation budget allocation 13.0% 13.0% 13.0% 13.0% 13.0%
A12Total Sec educ.as % of totalEducation sector 12.99 17.03 17.24 18.07 18.05 18.88

SEDP II – FINAL DRAFT – MAY 2010
94
A13Total Sec educ.as % of totalGovernment expenditure 2.38 3.41 3.62 3.80 3.97 4.15
B: SEDP II Cost Projections2009/10 2010/11 2011/12 2012/13 2013/14 2014/15
B1 Total SEDP Cost 485,327 562,920 611,423 633,222 653,308
B2Recurrent Expenditure &Salaries 357,941 427,278 480,015 507,045 532,824
B3 Development Cost 127,386 135,642 131,408 126,178 120,484
C: Financing Gap2009/10 2010/11 2011/12 2012/13 2013/14 2014/15
C1 Total Financing Gap 128,482 159,758 155,930 118,606 71,894
C2 Recurrent Cost 74,783 107,367 118,579 98,694 71,469
C3 Development Cost 53,699 52,391 37,351 19,912 425
C4Total Financing Gap (in millionUSD) 95 118 116 88 53
Assumptions
In identifying the financing gap, it is assumed that the Government resource allocation in secondary education expenditure will rely onaverage trend of budget allocation in secondary education for the past five years taking into consideration of base line of 2010/11.However, the salary projection has been arrived by taking into consideration of the increase of the number of graduates the base yearbeing the actual 2008/09.