challenges and opportunities in the new … · qrestructuring presents a range of unpreceden- ......
TRANSCRIPT
1© copyright George Gross, 2004
CHALLENGES AND
OPPORTUNITIES IN THE NEW
TRANSMISSION BUSINESS
at the AUPEC 2004
September 26, 2004St. Lucia, Brisbane
presentation by
George Gross
Department of Electrical and Computer Engineering
University of Illinois at Urbana Champaign
2© copyright George Gross, 2004 2© copyright George Gross, 2004
LIVING IN INTERESTING TIMES
q The business has never been more exciting
q Restructuring presents a range of unpreceden-
ted opportunities and set of daunting challenges
q Problems require interdisciplinary approaches
3© copyright George Gross, 2004 3© copyright George Gross, 2004
OUTLINE
q The growing importance of electricity
q Evolving role of transmission services
q The 2003 U.S. Blackout
q Some key challenges and opportunities
q Training needs
4© copyright George Gross, 2004 4© copyright George Gross, 2004
CRITICAL IMPORTANCE OFELECTRICITY
q Energy is the lifeblood of modern society
q The importance of electricity is on the rise
q Efficient and environmentally sensitive electricity
services are key requirements for each nation’s
global competitiveness
5© copyright George Gross, 2004 5© copyright George Gross, 2004
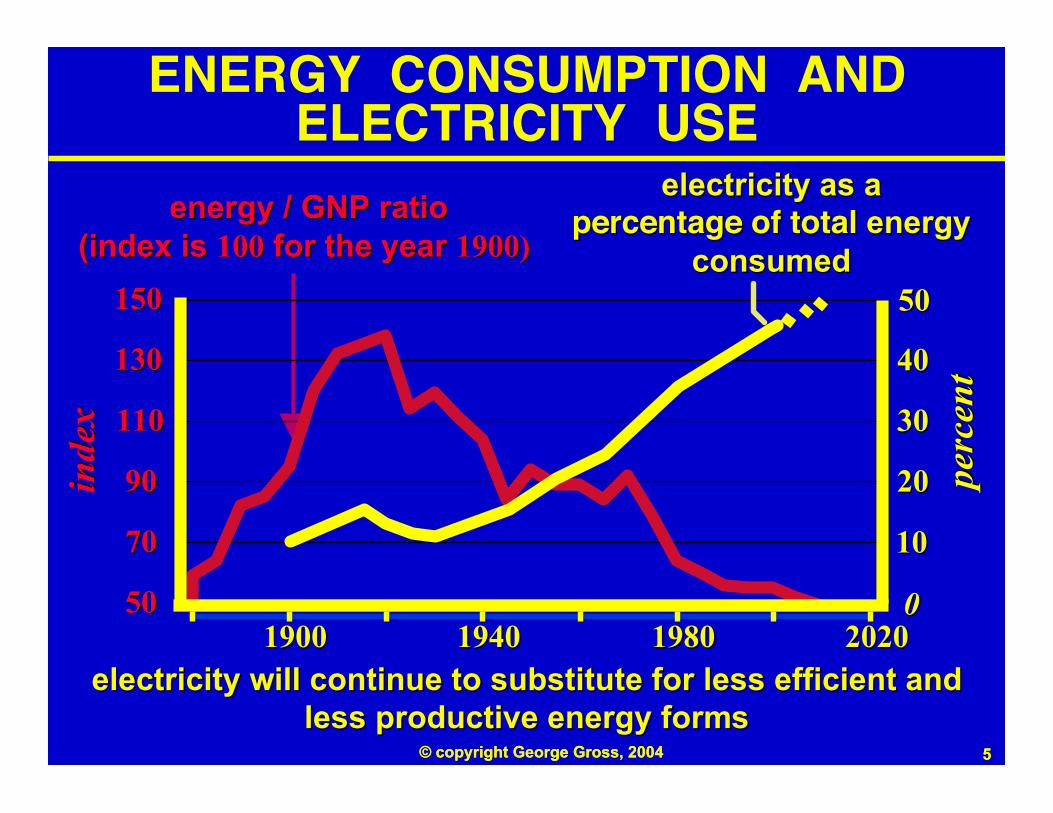
electricity will continue to substitute for less efficient andelectricity will continue to substitute for less efficient andless productive energy formsless productive energy forms
ENERGY CONSUMPTION ANDELECTRICITY USE
5050
7070
9090
110110
130130
150150
energy / GNP ratio energy / GNP ratio (index is (index is 100100 for the year for the year 1900)1900)
electricity as aelectricity as apercentage of total percentage of total energyenergy
consumedconsumed
19001900 19401940 19801980 20202020
5050
4040
3030
2020
1010
perc
ent
perc
ent
00
inde
xin
dex
6© copyright George Gross, 2004 6© copyright George Gross, 2004
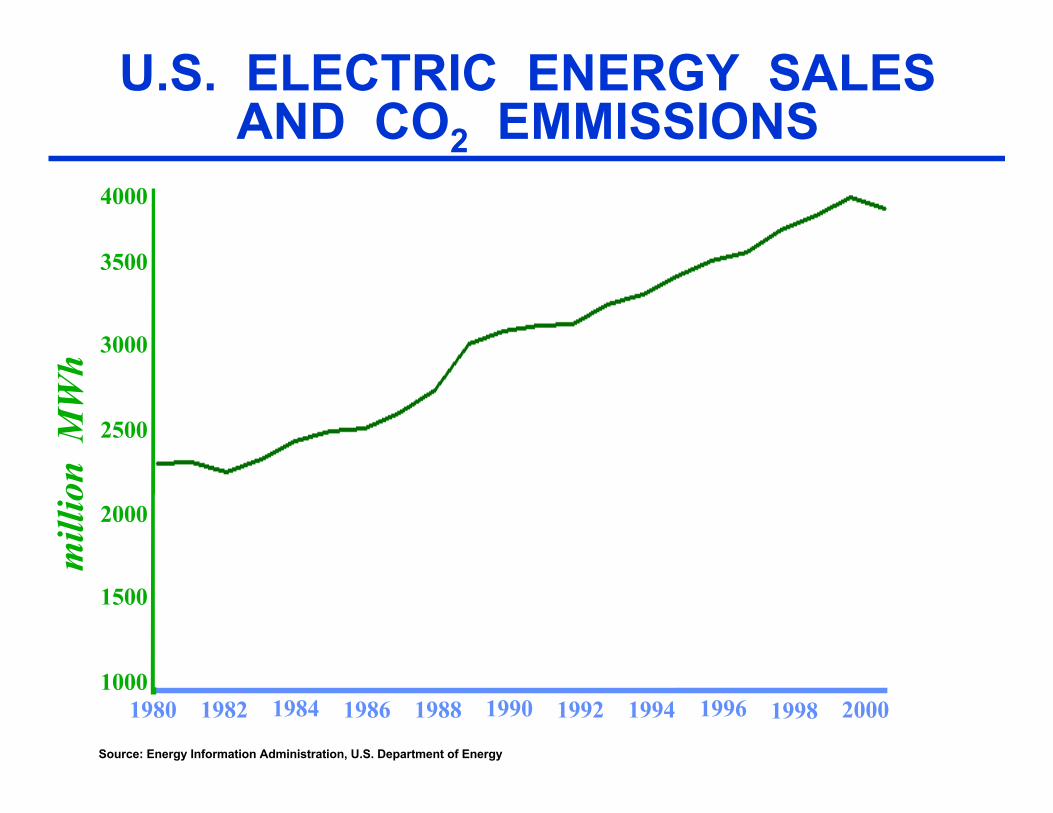
U.S. ELECTRIC ENERGY SALESAND CO2 EMMISSIONS
Source: Energy Information Administration, U.S. Department of Energy
1000
1500
2000
2500
3000
3500
4000
1980 1982 1984 1986 1988 1990 1992 1994 1996 1998 2000
mill
ion
MW
h
1000
1500
2000
2500
3000
3500
4000
mill
ion
met
ric
tons
of
CO
2
7© copyright George Gross, 2004 7© copyright George Gross, 2004
IMPACTS OF ELECTRICITY
q The National Academy of Engineering, the U.S.’s
most prestigious collection of outstanding engi-
neers, named electrification -- the development
of the vast networks of electricity that power the
world -- the most important of the twenty engi-
neering achievements that have had the greatest
impact on the quality of life in the 20th century
8© copyright George Gross, 2004 8© copyright George Gross, 2004
IMPACTS OF ELECTRICITY
q Electricity ranked ahead of the automobile, air-
plane, safe and abundant water, electronics,
computers and space exploration
q The widespread electrification implemented in
the 20th century gave us power for our cities,
factories, farms and homes, forever changing
the lives of people
9© copyright George Gross, 2004 9© copyright George Gross, 2004
THE UNIQUE CHARACTERISTICS
q Lack of large-scale storage
q Extreme perishability of electricity: just-in-time
manufacturing process
q Obligation to serve requirement : no analogue to
the busy signal in communications systems
10© copyright George Gross, 2004 10© copyright George Gross, 2004
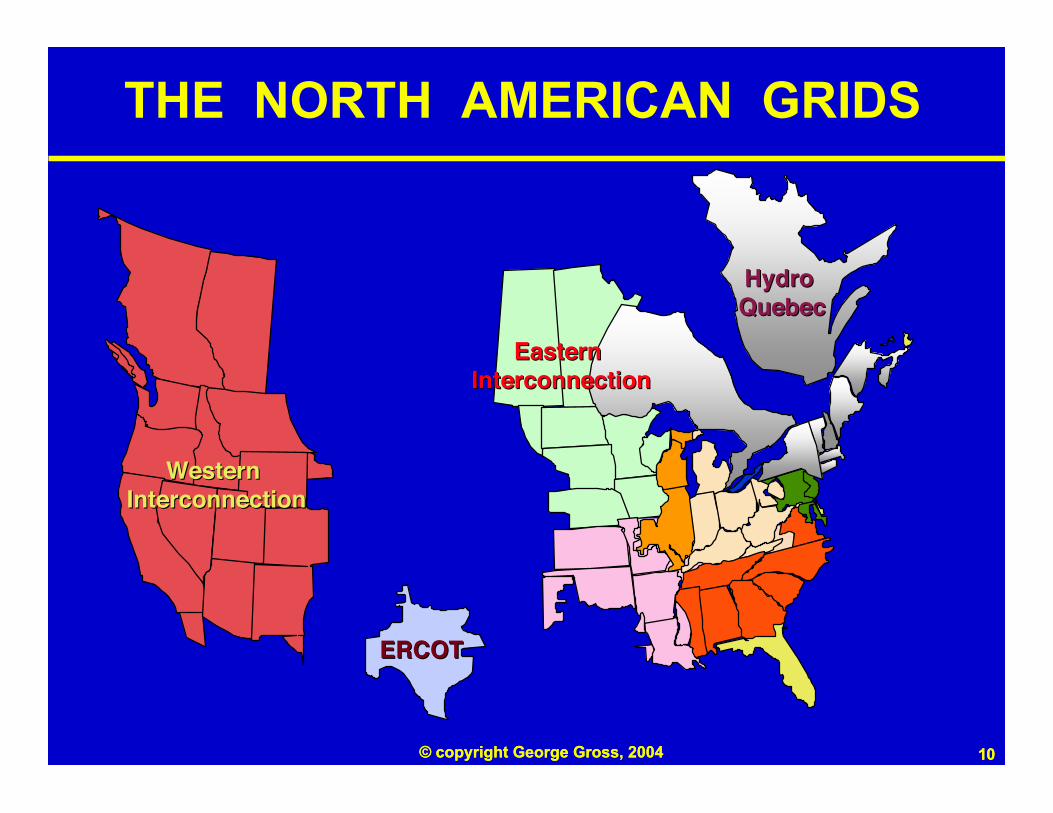
THE NORTH AMERICAN GRIDS
Western Western InterconnectionInterconnection
ERCOTERCOT
Hydro Hydro QuebecQuebec
Eastern Eastern InterconnectionInterconnection
11© copyright George Gross, 2004 11© copyright George Gross, 2004
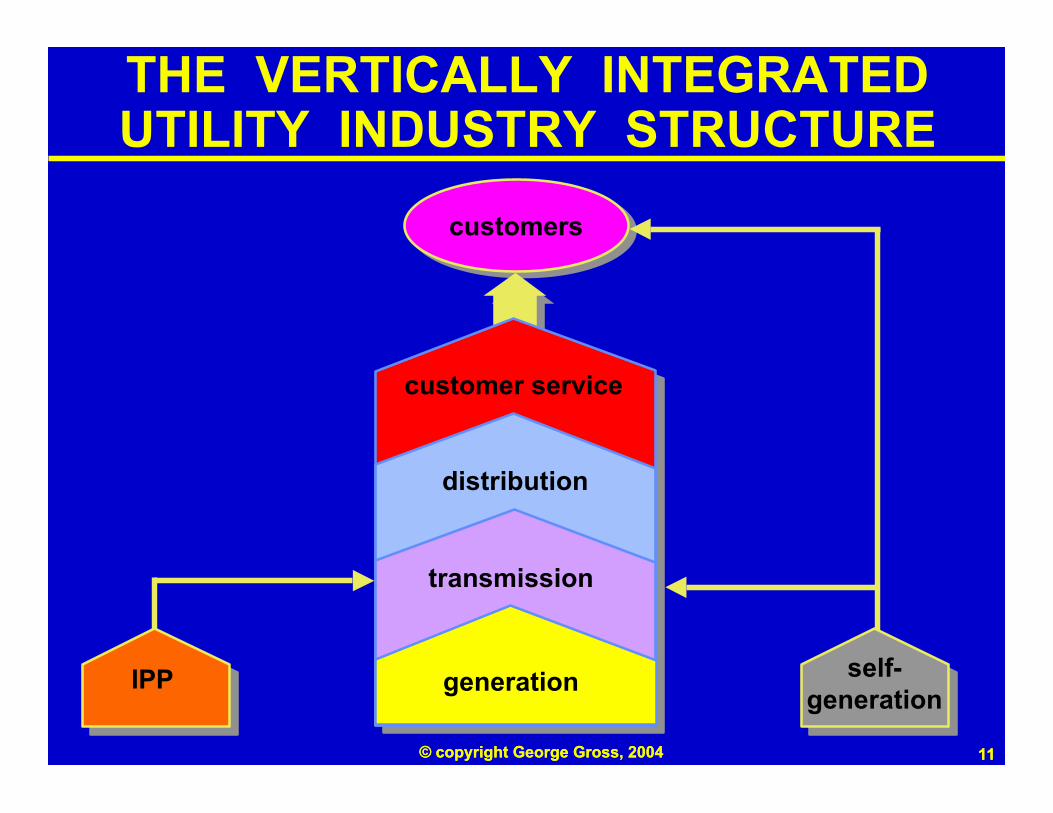
THE VERTICALLY INTEGRATEDUTILITY INDUSTRY STRUCTURE
customers
self-generation
IPP Generation
Transmission
Distribution
Customer Service customer service
distribution
transmission
generation
12© copyright George Gross, 2004 12© copyright George Gross, 2004
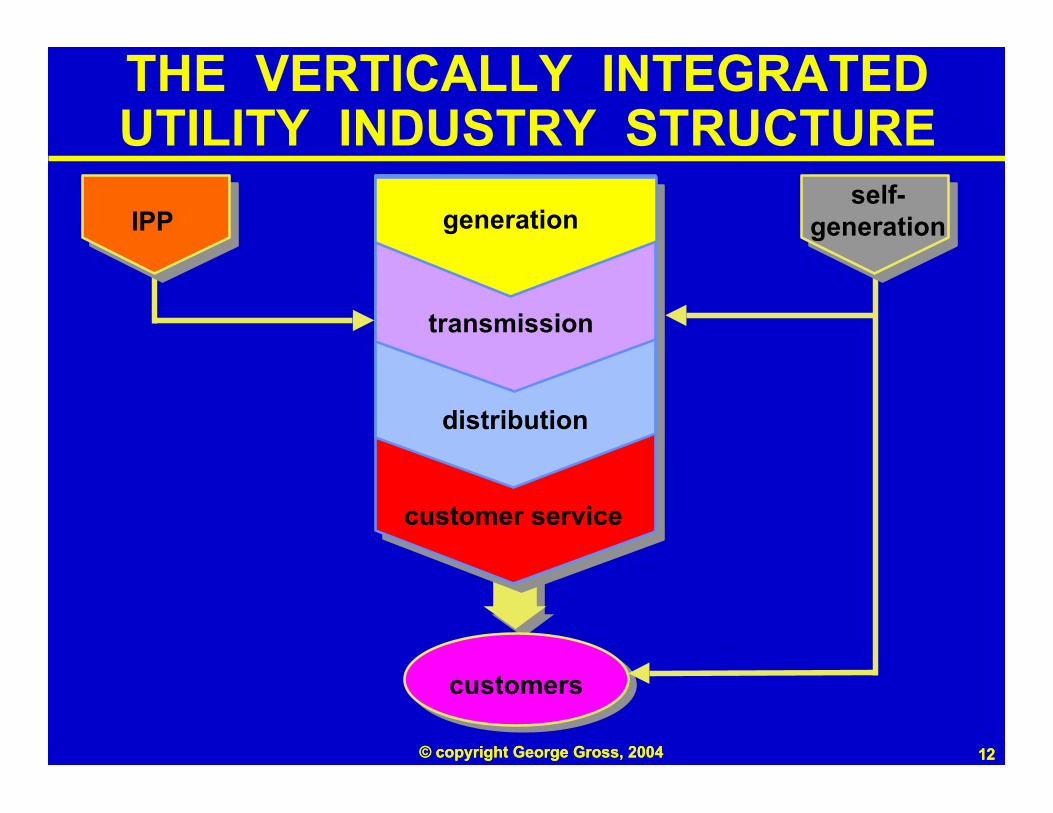
customers
self-generationIPP
Generation
Transmission
Distribution
Customer Service
customer service
distribution
transmission
generation
THE VERTICALLY INTEGRATEDUTILITY INDUSTRY STRUCTURE
13© copyright George Gross, 2004 13© copyright George Gross, 2004
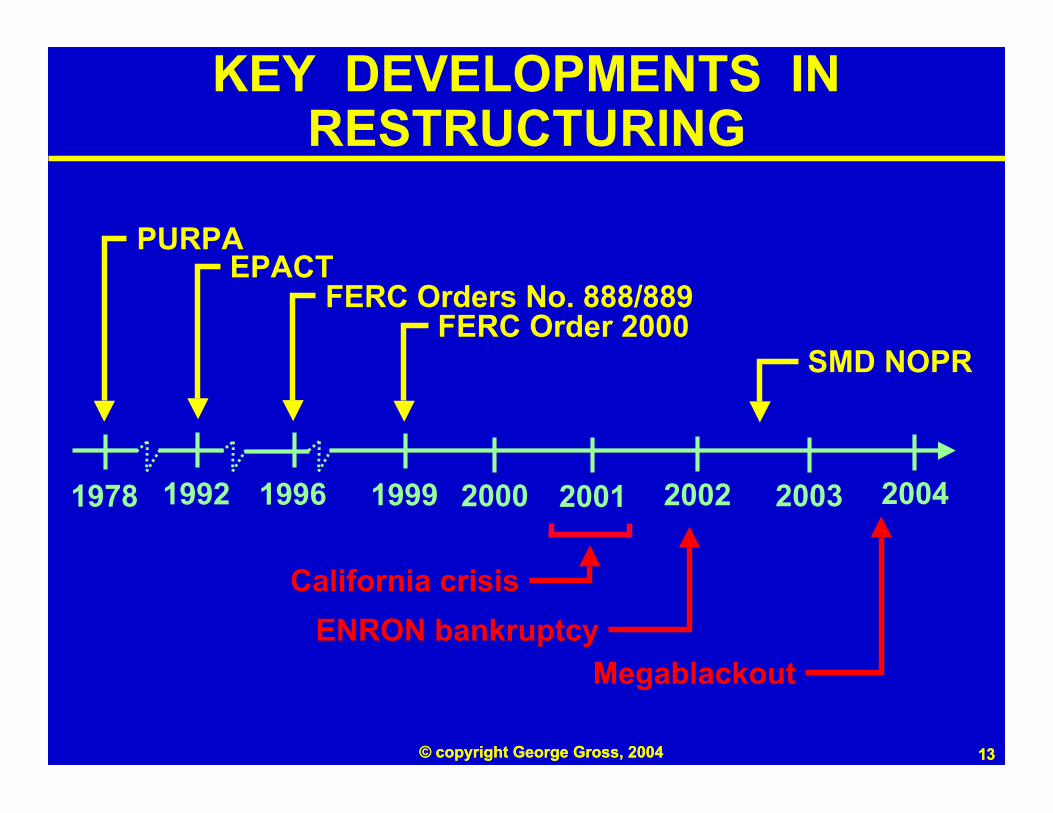
KEY DEVELOPMENTS INRESTRUCTURING
PURPAEPACT
FERC Orders No. 888/889FERC Order 2000
ENRON bankruptcy
Megablackout
1978 1992 1996 1999 2000 2001 2002 2003 2004
SMD NOPR
California crisis
14© copyright George Gross, 2004 14© copyright George Gross, 2004
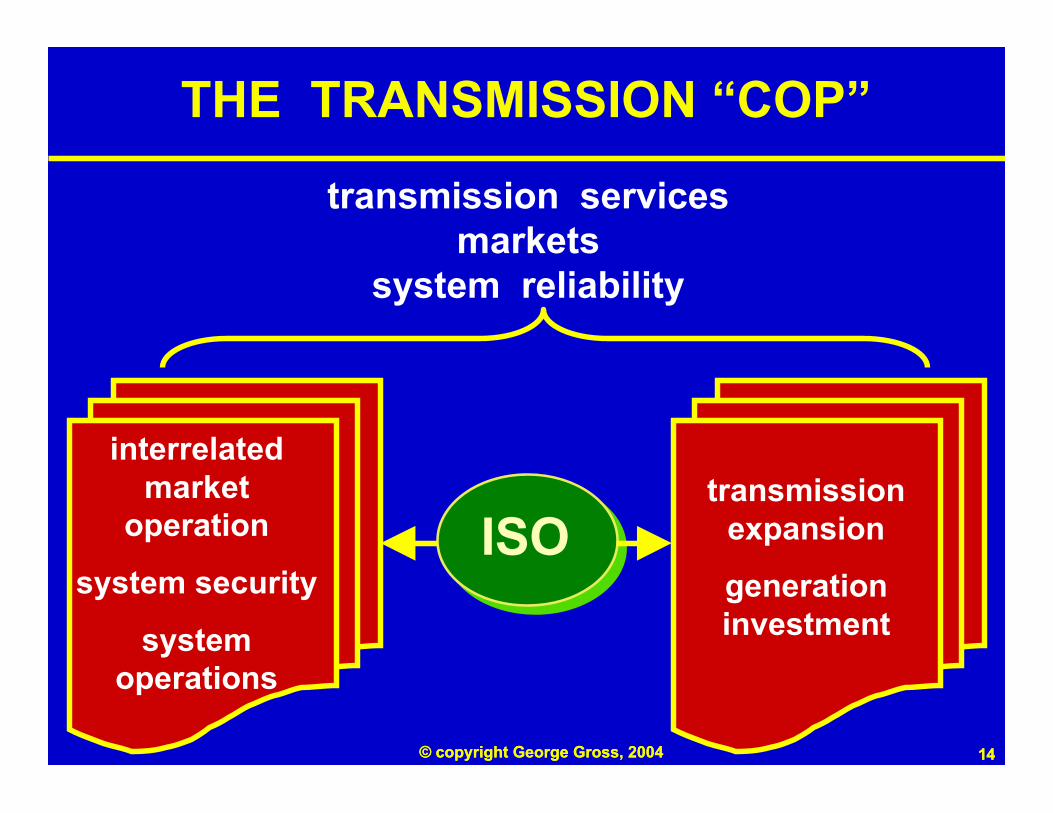
THE TRANSMISSION “COP”
ISO
transmission servicesmarkets
system reliability
interrelatedmarket
operation
system security
systemoperations
transmissionexpansion
generationinvestment
15© copyright George Gross, 2004 15© copyright George Gross, 2004
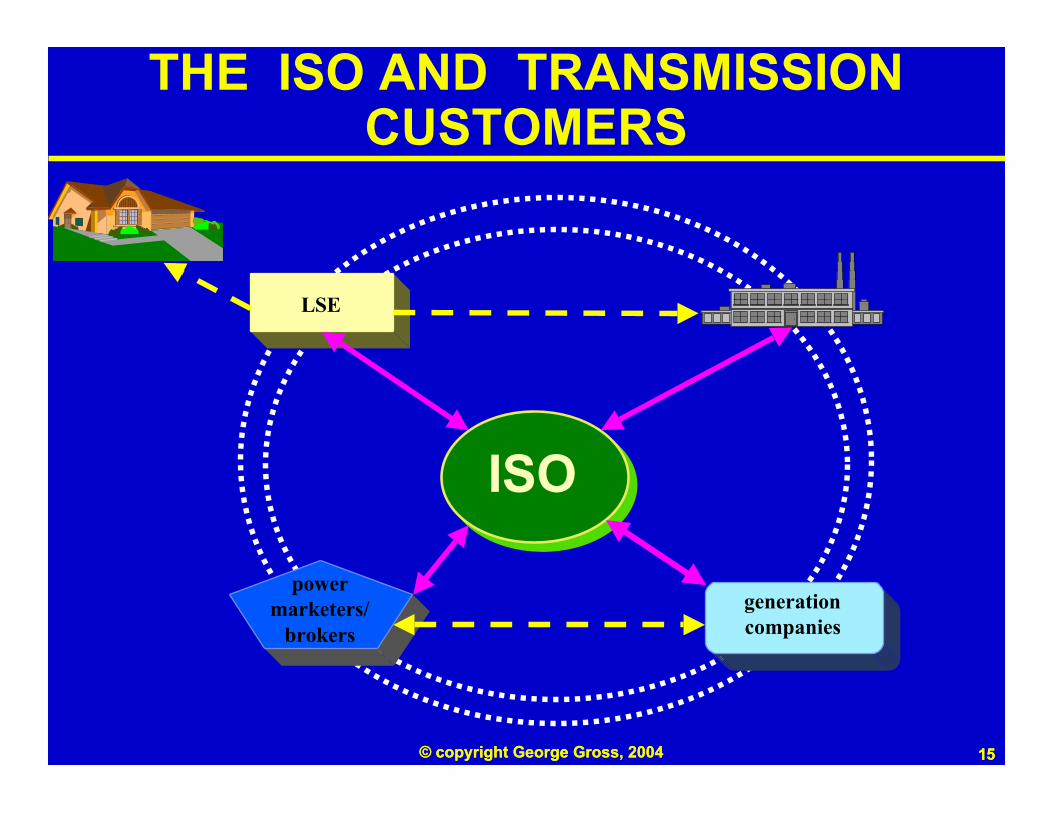
THE ISO AND TRANSMISSIONCUSTOMERS
ISO
powermarketers/
brokers
LSE
generationcompanies
16© copyright George Gross, 2004 16© copyright George Gross, 2004
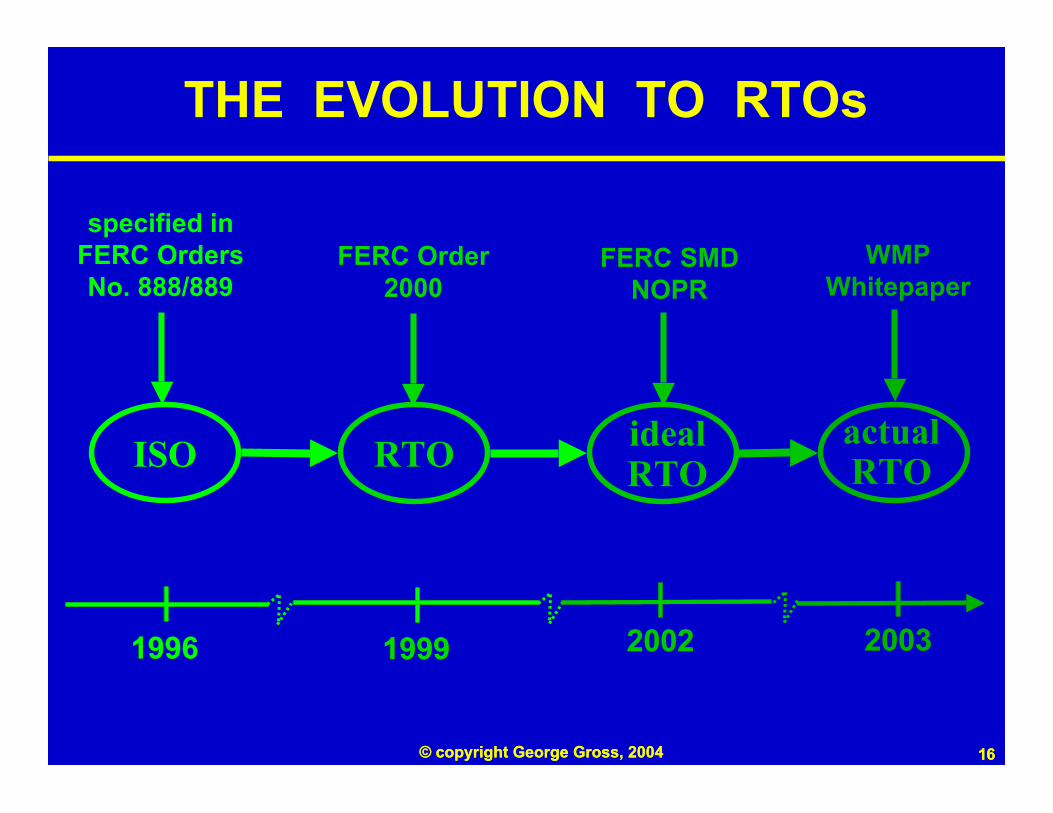
1996 1999 2002 2003
actualRTO
THE EVOLUTION TO RTOs
ISO RTO idealRTO
specified inFERC OrdersNo. 888/889
FERC Order2000
FERC SMDNOPR
WMPWhitepaper
1996 1999 2002 2003
17© copyright George Gross, 2004 17© copyright George Gross, 2004
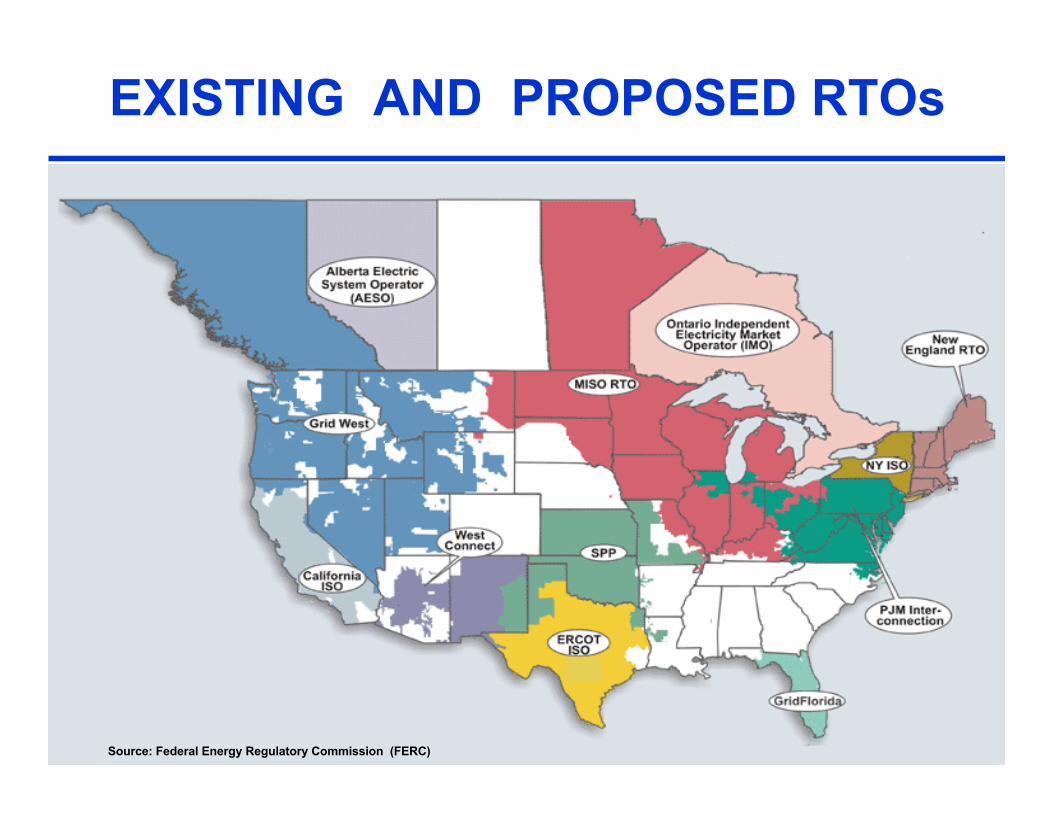
EXISTING AND PROPOSED RTOs
Source: Federal Energy Regulatory Commission (FERC)
18© copyright George Gross, 2004 18© copyright George Gross, 2004
EVOLVING ROLE OFTRANSMISSION SERVICES
q Transmission systems developed primarily to
meet the demands of each utility’s native load
customers
q Major stages of transmission development :
m connection of remote generating resources
to load centers
m interconnection of utilities for reliability
m construction of ties to support inter-utility
transactions
19© copyright George Gross, 2004 19© copyright George Gross, 2004
EVOLVING ROLE OFTRANSMISSION SERVICES
q Transmission owning utilities provided bundled
transmission and generation services through:
m full or partial requirements services
m integration agreements
q Limited amount of transmission only services
was provided to
m embedded transmission dependent utilities
m embedded qualifying facilities or QFs
q In the competitive wholesale electricity markets,
unbundled transmission service is taking on a
common carrier role
20© copyright George Gross, 2004 20© copyright George Gross, 2004
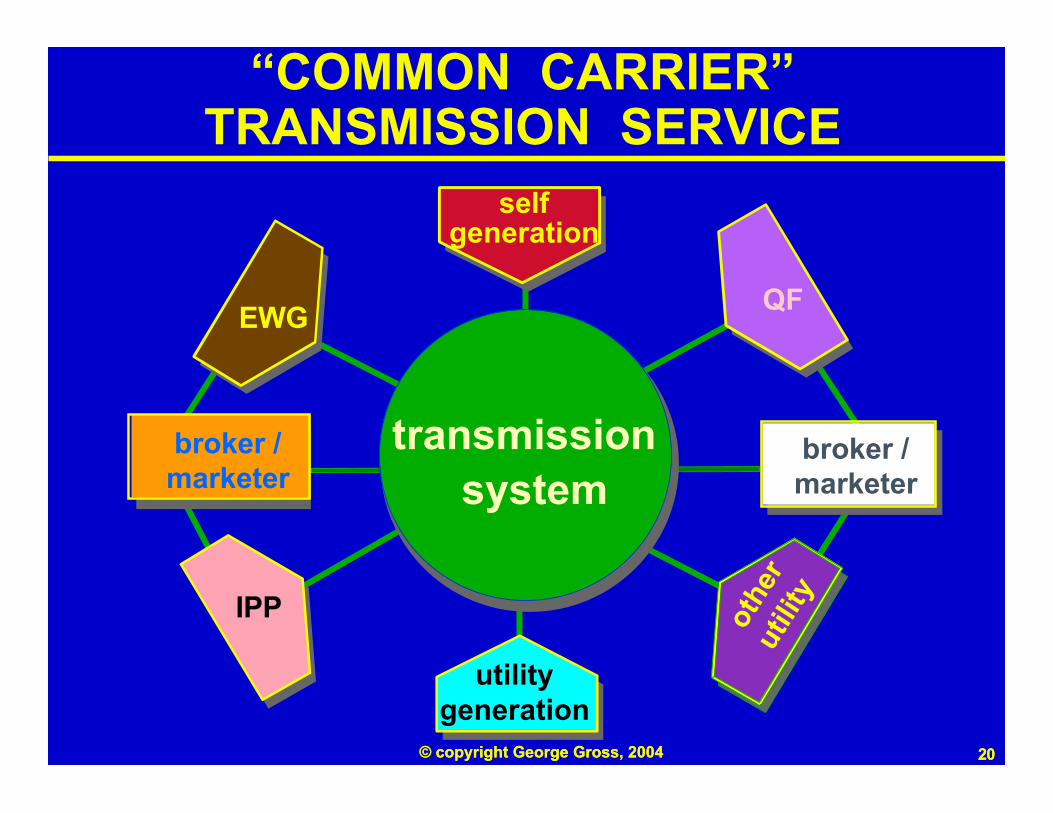
broker /marketer
broker /marketer
“COMMON CARRIER”TRANSMISSION SERVICE
utilitygeneration
selfgeneration
othe
rut
ility
QF
IPP
EWG
transmissionsystem
21© copyright George Gross, 2004 21© copyright George Gross, 2004
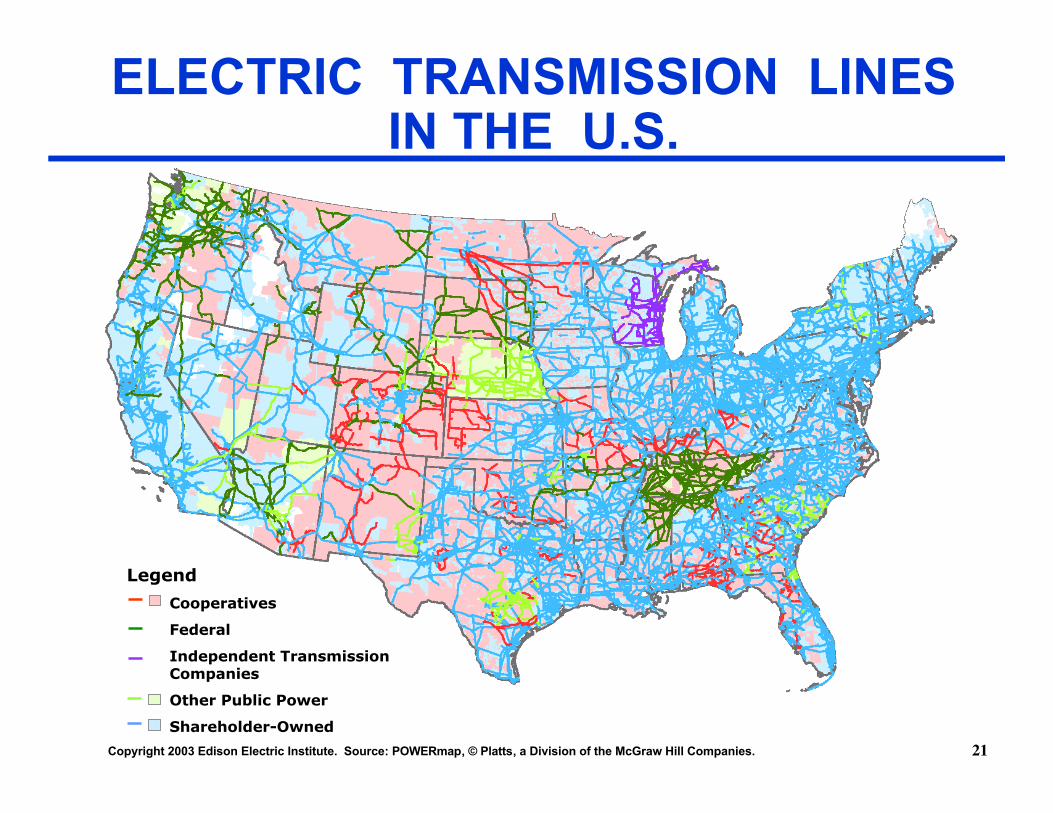
Legend
Cooperatives
Federal
Independent TransmissionCompanies
Other Public Power
Shareholder-Owned
ELECTRIC TRANSMISSION LINESIN THE U.S.
Copyright 2003 Edison Electric Institute. Source: POWERmap, © Platts, a Division of the McGraw Hill Companies. 21
22© copyright George Gross, 2004 22© copyright George Gross, 2004
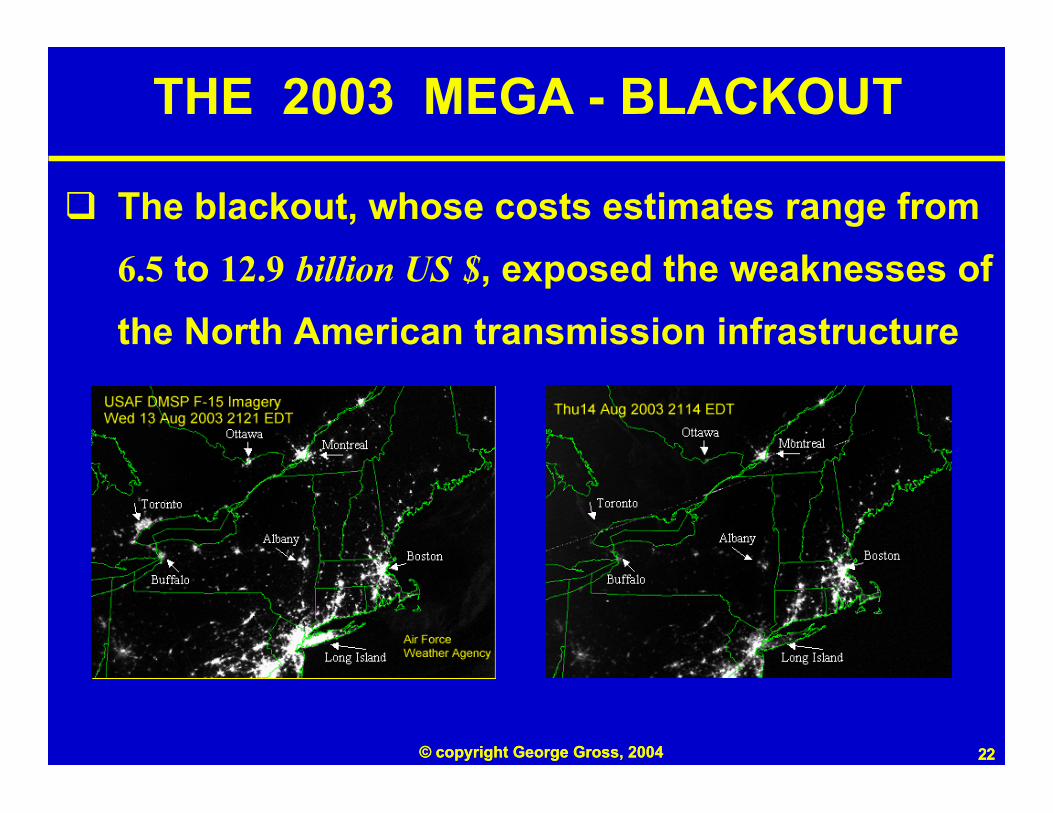
THE 2003 MEGA - BLACKOUT
q The blackout, whose costs estimates range from
6.5 to 12.9 billion US $, exposed the weaknesses of
the North American transmission infrastructure
23© copyright George Gross, 2004 23© copyright George Gross, 2004
THE 2003 MEGA - BLACKOUT
q Largest single blackout ever in North America
qArea covering 8 U.S. states and one Canadian
province impacted: total population 50 million
q 61,800 MW load lost
q 34,000 miles of transmission and 290 units affected
during the cascade of events
q Five major independent system operators’ terri-
tories involved
24© copyright George Gross, 2004 24© copyright George Gross, 2004
SPECIFIC FACTORS CAUSING THEBLACKOUT
q “Inadequate situational awareness”
q Failure of timely vegetation management
q Heavy congestion
q Cascading outages of lines
q Cascading outages of generators
q Unexpected loop flows
25© copyright George Gross, 2004 25© copyright George Gross, 2004
26© copyright George Gross, 2004 26© copyright George Gross, 2004
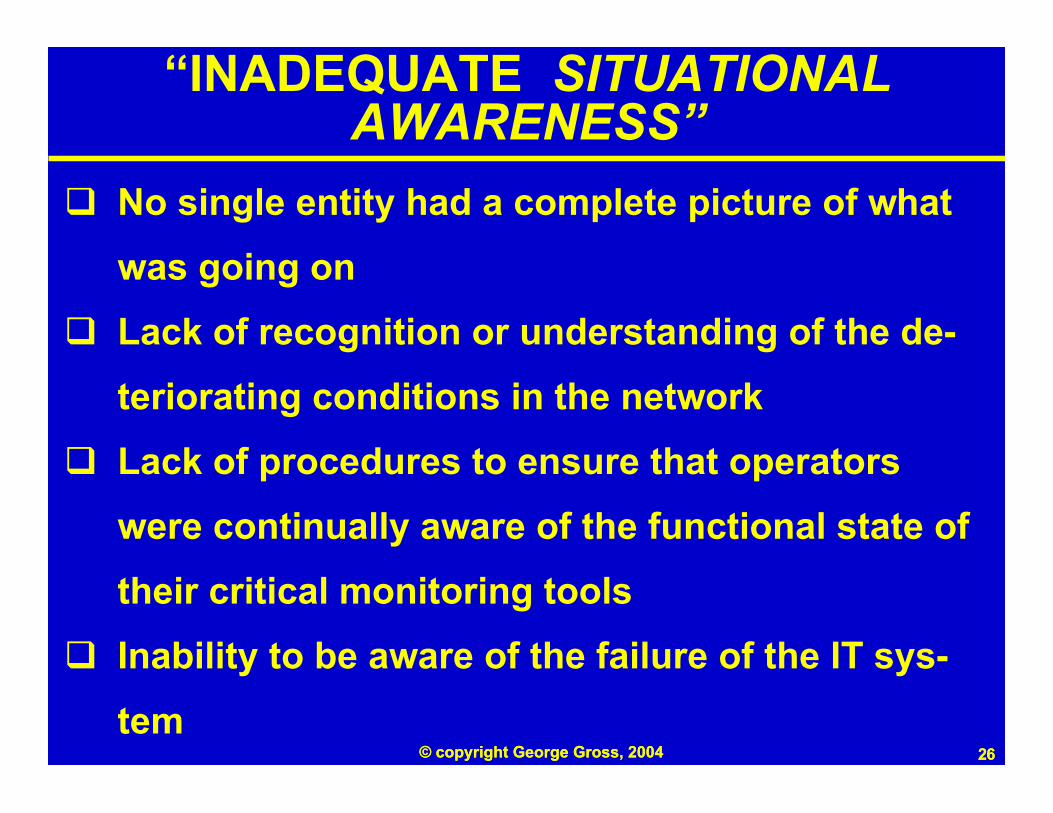
“INADEQUATE SITUATIONALAWARENESS”
q No single entity had a complete picture of what
was going on
q Lack of recognition or understanding of the de-
teriorating conditions in the network
q Lack of procedures to ensure that operators
were continually aware of the functional state of
their critical monitoring tools
q Inability to be aware of the failure of the IT sys-
tem
27© copyright George Gross, 2004 27© copyright George Gross, 2004
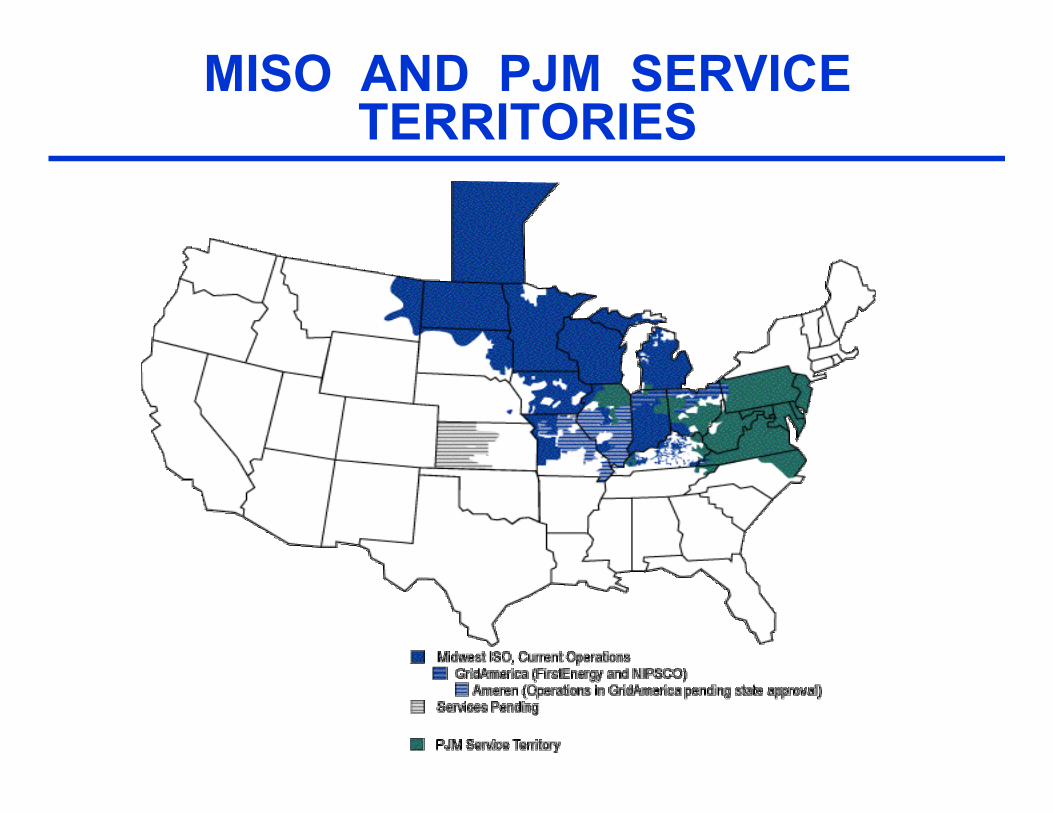
MISO AND PJM SERVICETERRITORIES
28© copyright George Gross, 2004 28© copyright George Gross, 2004
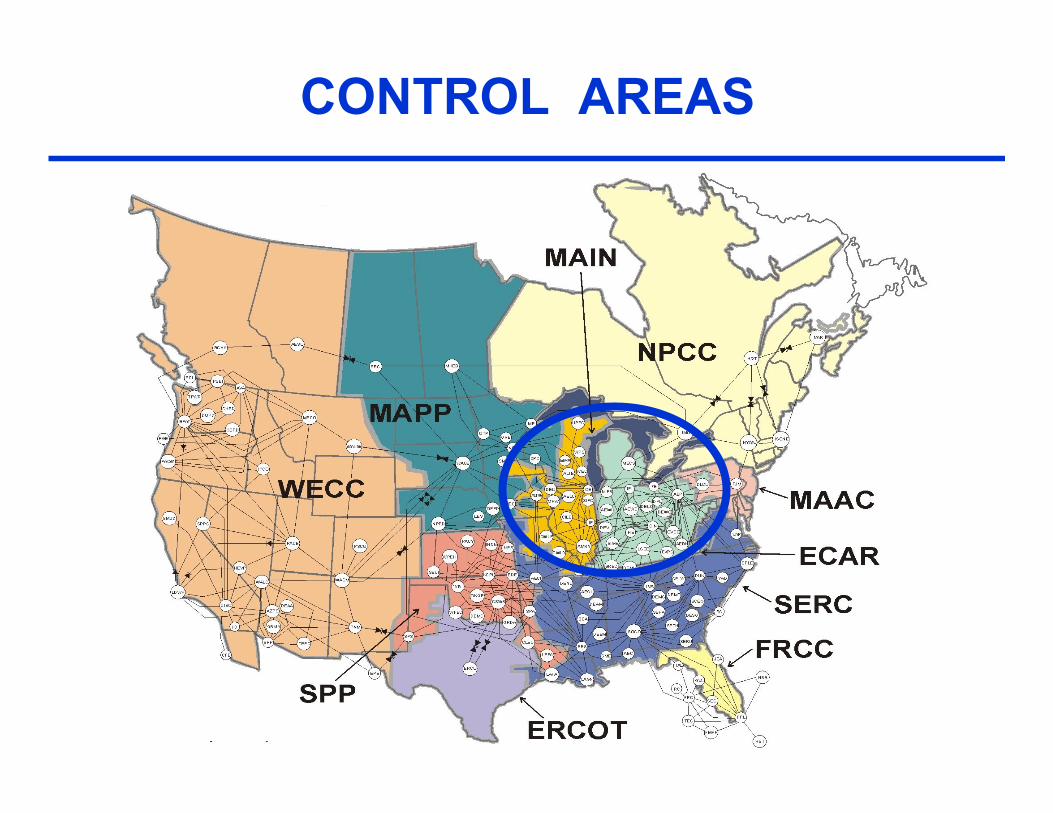
CONTROL AREAS
29© copyright George Gross, 2004 29© copyright George Gross, 2004
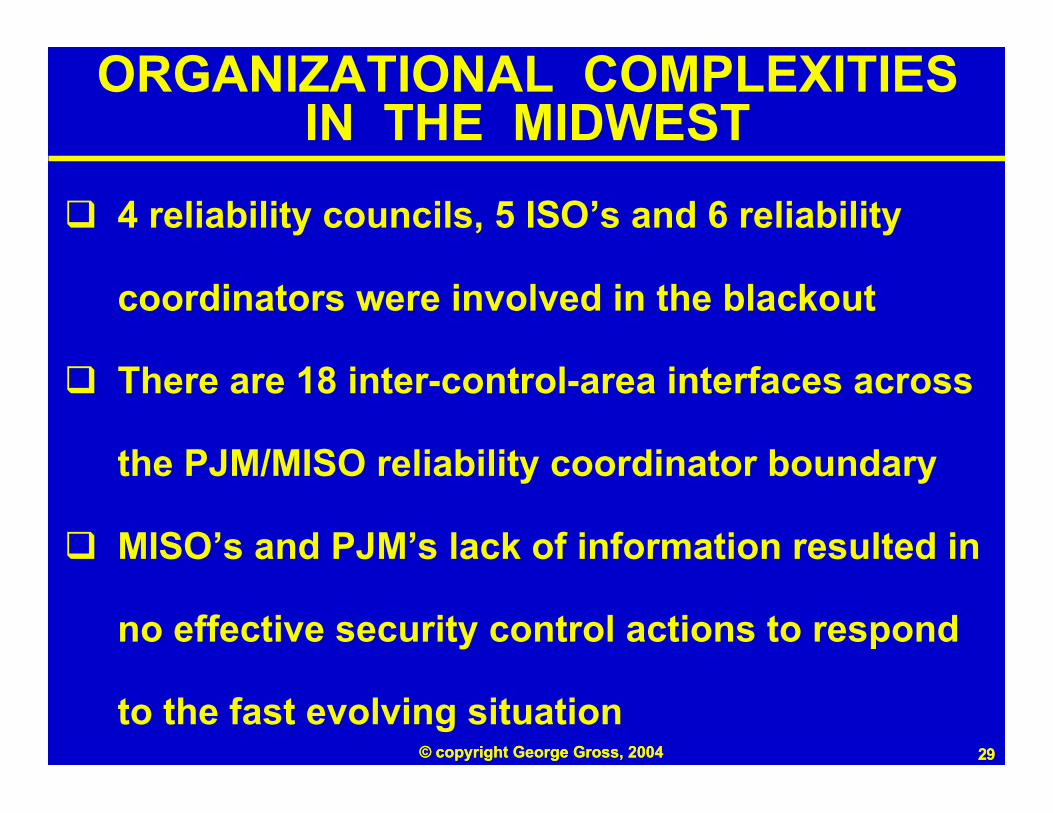
ORGANIZATIONAL COMPLEXITIESIN THE MIDWEST
q 4 reliability councils, 5 ISO’s and 6 reliability
coordinators were involved in the blackout
q There are 18 inter-control-area interfaces across
the PJM/MISO reliability coordinator boundary
q MISO’s and PJM’s lack of information resulted in
no effective security control actions to respond
to the fast evolving situation
30© copyright George Gross, 2004 30© copyright George Gross, 2004
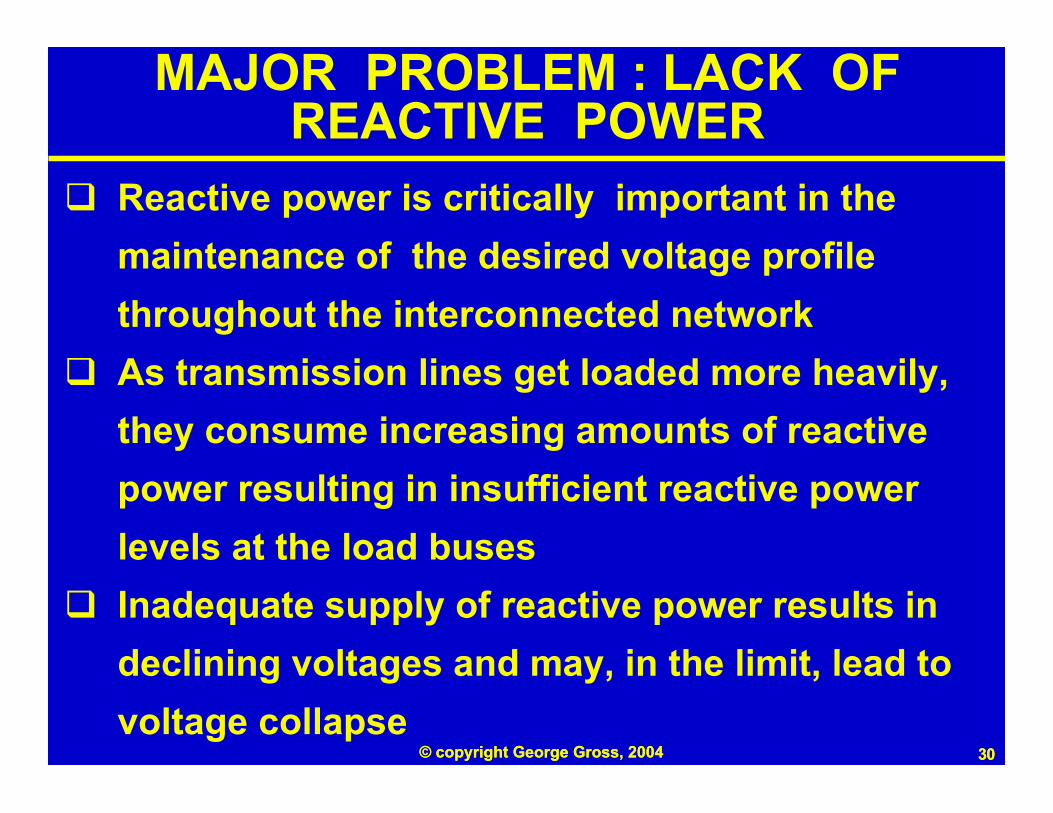
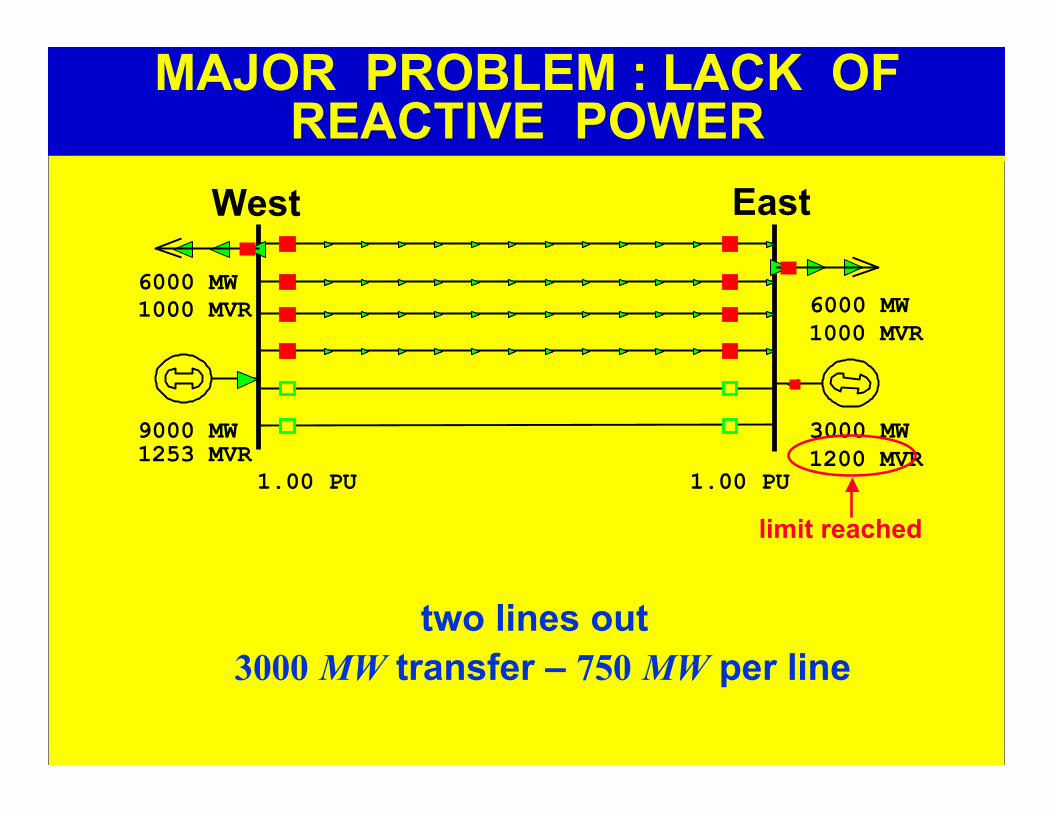
q Reactive power is critically important in the
maintenance of the desired voltage profile
throughout the interconnected network
q As transmission lines get loaded more heavily,
they consume increasing amounts of reactive
power resulting in insufficient reactive power
levels at the load buses
q Inadequate supply of reactive power results in
declining voltages and may, in the limit, lead to
voltage collapse
MAJOR PROBLEM : LACK OFREACTIVE POWER
31© copyright George Gross, 2004 31© copyright George Gross, 2004
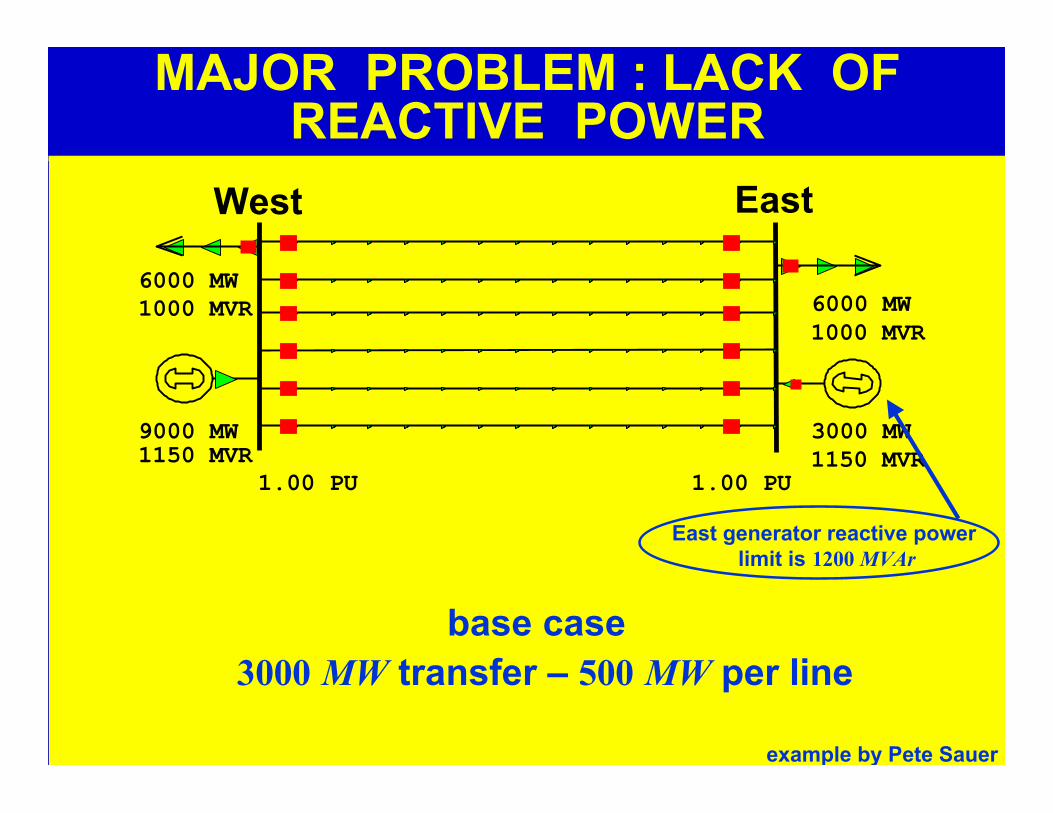
1.00 PU
6000 MW1000 MVR
1.00 PU1150 MVR9000 MW
1150 MVR3000 MW
6000 MW1000 MVR
base case
example by Pete Sauer
3000 MW transfer – 500 MW per line
East generator reactive power limit is 1200 MVAr
EastWest
MAJOR PROBLEM : LACK OFREACTIVE POWER
32© copyright George Gross, 2004 32© copyright George Gross, 2004
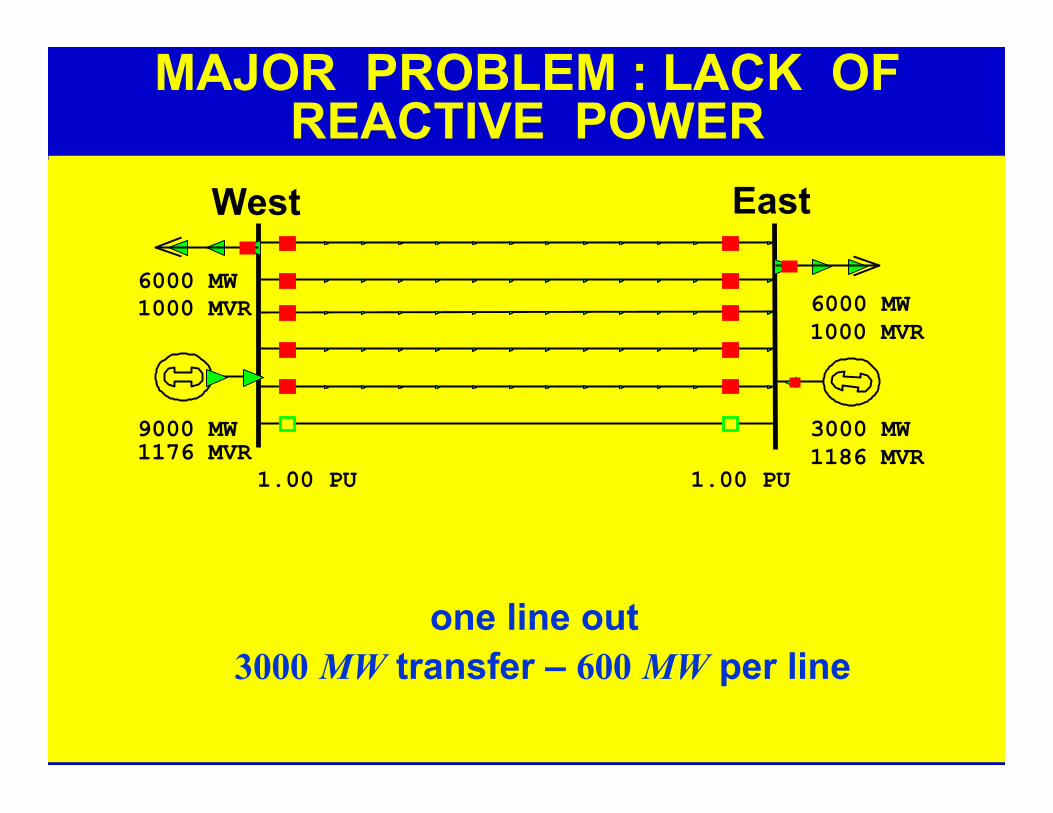
1.00 PU
6000 MW1000 MVR
1.00 PU1176 MVR9000 MW
1186 MVR3000 MW
6000 MW1000 MVR
one line out3000 MW transfer – 600 MW per line
West East
MAJOR PROBLEM : LACK OFREACTIVE POWER
33© copyright George Gross, 2004 33© copyright George Gross, 2004
1.00 PU
6000 MW1000 MVR
1.00 PU1253 MVR9000 MW
1200 MVR3000 MW
6000 MW1000 MVR
limit reached
two lines out3000 MW transfer – 750 MW per line
West East
MAJOR PROBLEM : LACK OFREACTIVE POWER
34© copyright George Gross, 2004 34© copyright George Gross, 2004
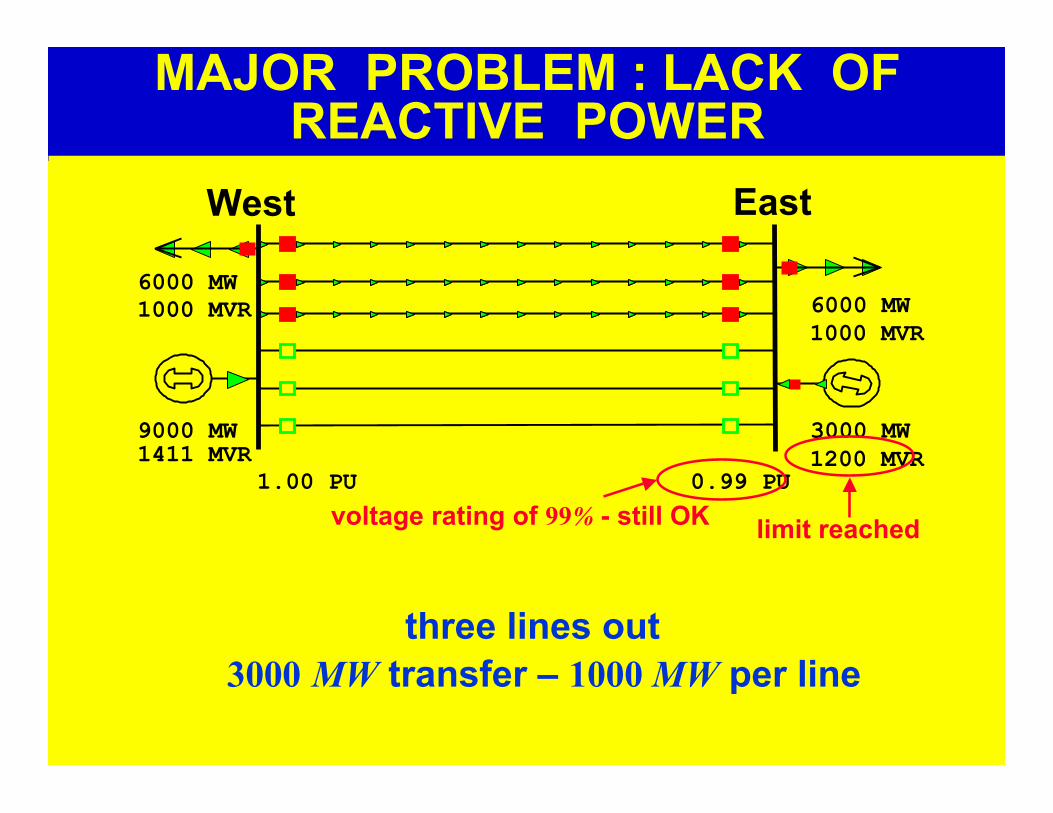
0.99 PU
6000 MW1000 MVR
1.00 PU1411 MVR9000 MW
1200 MVR3000 MW
6000 MW1000 MVR
3000 MW transfer – 1000 MW per linethree lines out
limit reachedvoltage rating of 99% - still OK
West East
MAJOR PROBLEM : LACK OFREACTIVE POWER
35© copyright George Gross, 2004 35© copyright George Gross, 2004
MAJOR PROBLEM : LACK OFREACTIVE POWER
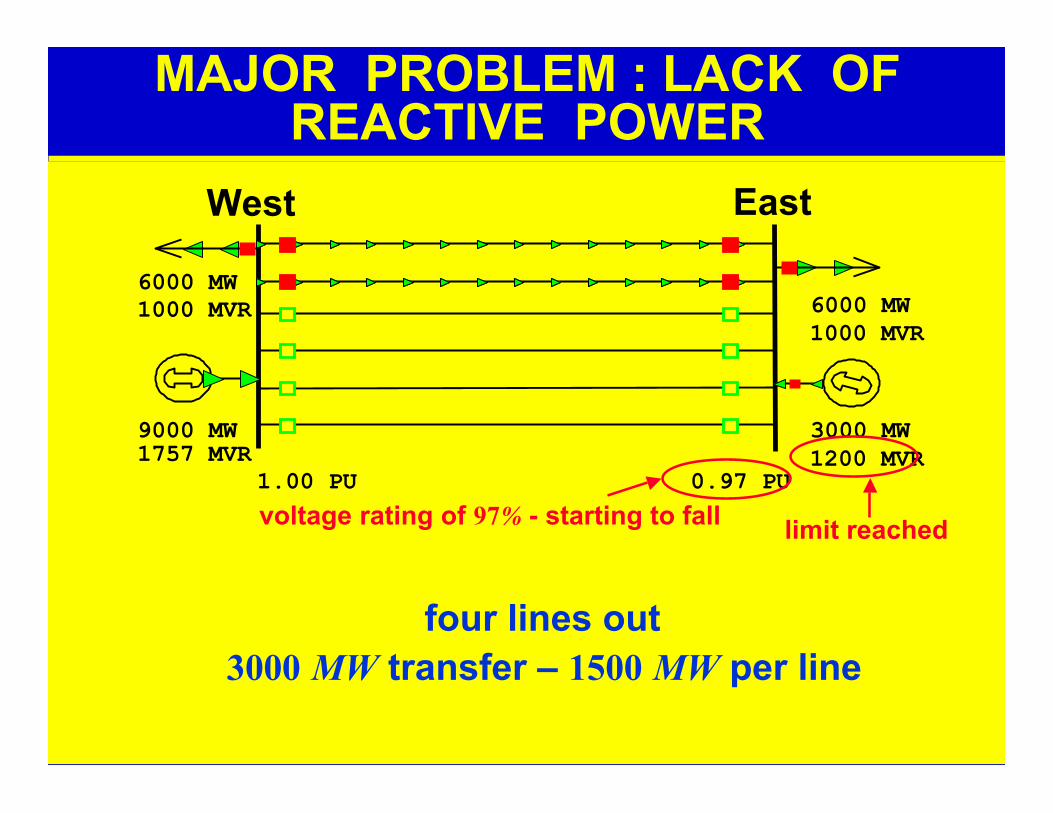
0.97 PU
6000 MW1000 MVR
1.00 PU1757 MVR9000 MW
1200 MVR3000 MW
6000 MW1000 MVR
3000 MW transfer – 1500 MW per line
limit reachedvoltage rating of 97% - starting to fall
four lines out
West East
36© copyright George Gross, 2004 36© copyright George Gross, 2004
MAJOR PROBLEM : LACK OFREACTIVE POWER
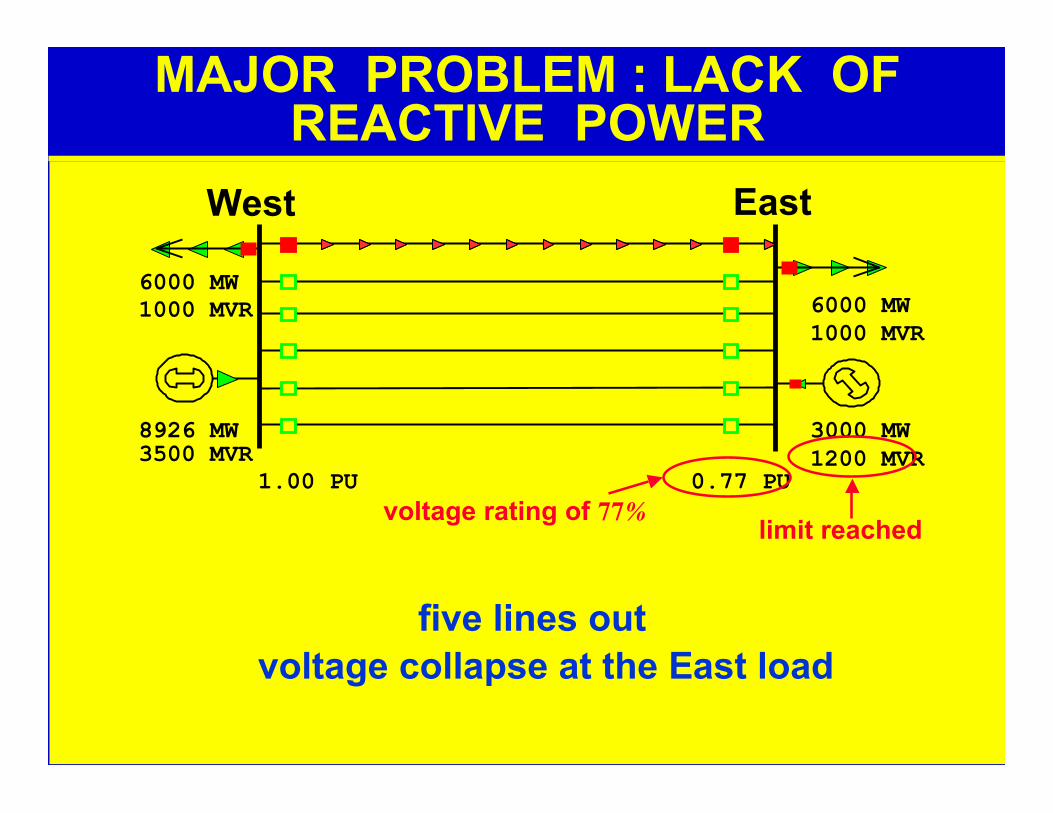
0.77 PU
6000 MW1000 MVR
1.00 PU3500 MVR8926 MW
1200 MVR3000 MW
6000 MW1000 MVR
voltage collapse at the East load
limit reachedvoltage rating of 77%
five lines out
West East
37© copyright George Gross, 2004 37© copyright George Gross, 2004
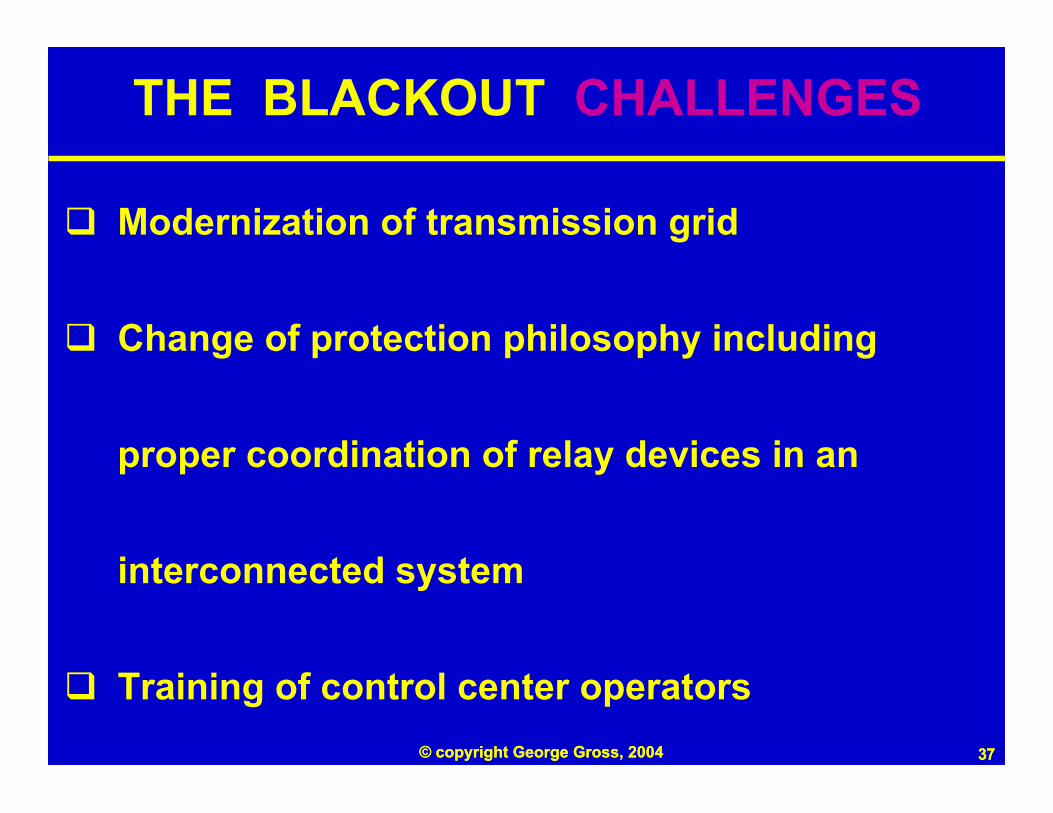
THE BLACKOUT CHALLENGES
q Modernization of transmission grid
q Change of protection philosophy including
proper coordination of relay devices in an
interconnected system
q Training of control center operators
38© copyright George Gross, 2004 38© copyright George Gross, 2004
`
39© copyright George Gross, 2004 39© copyright George Gross, 2004
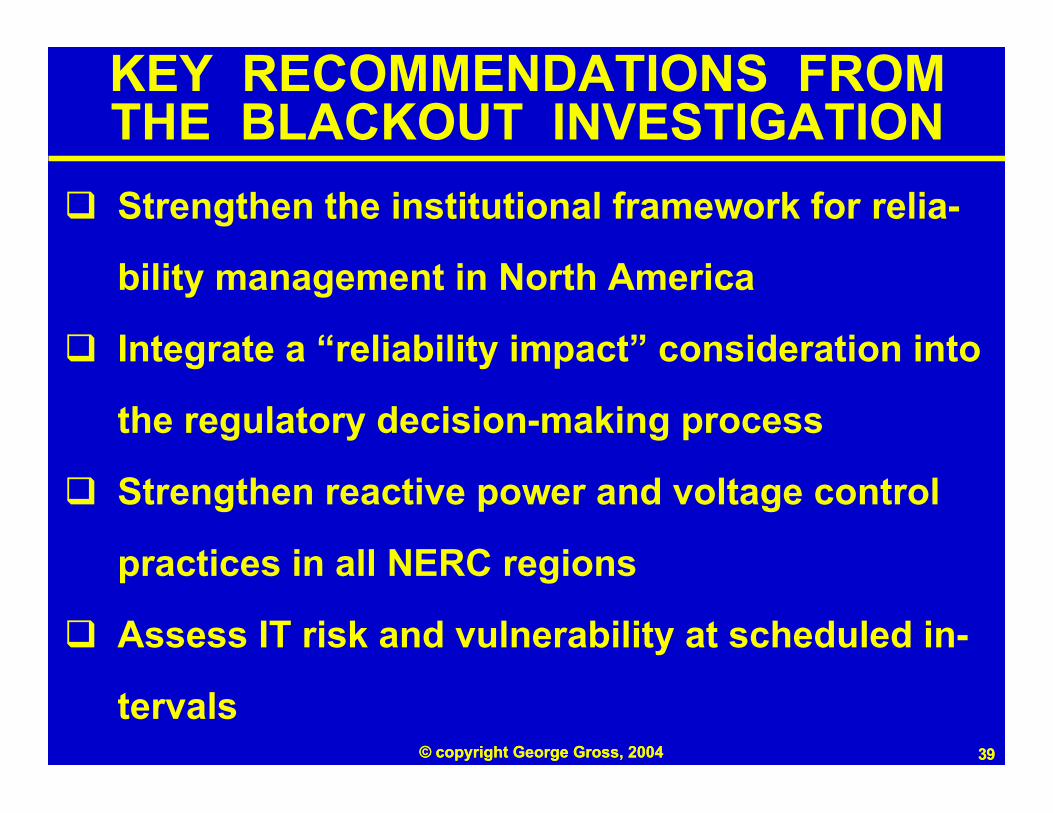
KEY RECOMMENDATIONS FROMTHE BLACKOUT INVESTIGATION
q Strengthen the institutional framework for relia-
bility management in North America
q Integrate a “reliability impact” consideration into
the regulatory decision-making process
q Strengthen reactive power and voltage control
practices in all NERC regions
q Assess IT risk and vulnerability at scheduled in-
tervals