challenges to the quality of the educational management
TRANSCRIPT
University of Massachusetts AmherstScholarWorks@UMass Amherst
Master's Capstone Projects Center for International Education
1995
Challenges to the Quality of the EducationalManagement Information System (EMIS) inNorth West Frontier Province (NWFP) of PakistanSaba Masud Rizavi
Follow this and additional works at: https://scholarworks.umass.edu/cie_capstones
Part of the Education Commons
This Open Access Capstone is brought to you for free and open access by the Center for International Education at ScholarWorks@UMass Amherst. Ithas been accepted for inclusion in Master's Capstone Projects by an authorized administrator of ScholarWorks@UMass Amherst. For moreinformation, please contact [email protected].
Rizavi, Saba Masud, "Challenges to the Quality of the Educational Management Information System (EMIS) in North West FrontierProvince (NWFP) of Pakistan" (1995). Master's Capstone Projects. 130.Retrieved from https://scholarworks.umass.edu/cie_capstones/130

SABA MASUD RIZAVI
TITLE: CHALLENGES TO THE QUALITY OF THE
EDUCATIONAL MANAGEMENT INFORMATION
SYSTEM (EMIS) IN NORTH WEST
FRONTIER PROVINCE (NWFP) OF P~~KISTAN
PROGRAM: CENTER FOR INTERNATIONAL
EDUCATION
DATED: MAY 16, 1995
ADVISOR: PROFESSOR DAVID R. EVANS

Challenges to the quality of the Educational Management Information System (EMIS} in North West Frontier Province (NWFP}
of Pakistan
Chapter 1
Introduction:
One of the greatest challenges facing education in the third
world is how to meet demands for higher quality education with
increasingly severe economic and fiscal constraints . Hence there
is a trend in the educational ministries of these deve!loping
countries that for better allocation and efficient use of the
available resources, detailed quantitative information about the
education system be provided. In short, "efficient information
management is a necessary condition for continued development"
(Chapman & Messec, 1989, p.l)
Introduction to the Project:
This paper is organized into four detailed chapters and a
series of Appendices. The paper highlights the importance of
information in the development of an education system as well as
the system for better management of the information. ~rhe focus of
the paper is on the Educational Management Information Cell that is
currently running under the Directorate of Primary Education in
North West Frontier Province (N.W.F.P.), that is one of the
provinces in the Islamic Republic of Pakistan. The purpose is to
describe the existing information system, point out the problems and
1

then present some feasible solutions and recommendations to help
improve it. It is absolutely necessary to understand the
constraints of not enough budgets and the lack of other resources
while trying to solve a problem, hence a revolutionary change of a
current system should not be the goal in mind. There may be some
minor alterations within the available resources that can be
extremely helpful in the long run instead of focussing on major
changes. And that is my focus being an Educational researcher.
Description of Chapters & methodo1ogy:
After presenting and emphasizing the concepts of Information
and Educational Management Information Systems (EMIS) in the first
chapter, the following chapters are basically constituted around the
different steps that are being performed in the EMIS. That is, the
second chapter then describes the EMIS currently running in NWFP and
outlines a summary of problems encountered in the data collection
process carrying the statement of various issues. A large section
is devoted to problems related with the data collection instrument,
it's construction and implementation. The third chapter takes the
issue of the uses of Information and the related topics for example,
the appropriate indicators of efficiency of an education system and
the problems encountered in providing data for those indicators.
The fourth chapter looks at the various technicalities involved
from the process of storage to presentation of data, a special
section discussing computer technology advancements needed and some
information on presentation of the available information.
Instead of devoting a whole section to case studies of EMIS
2

running in different countries, examples of these EMISs are
embedded in the chapters. Appendices present things like data
collection instruments and codes being used for certain data.
As said before, keeping in mind the slow and steady process of
budget approvals and problematic implementation process of a new
system in the Third World countries, the paper does not intend to
suggest major changes, but rather will propose changes and goals
that are easy to achieve and implement.
Definition of Information: After going through the literature
about the role of information in Education, I have arrived at the
following definition of Educationa1 Information. Information in
an Educational system describes the status of how best the
Educational System has been able to achieve the overall goal of
Economic and social development in a country or a specific region
and helps planners to decide how best to reach targets or plans for
the realistic growth of an Education system (Psacharopolos, 1980;
Chapman & Messec, 1989). Information can be categorized into
Qualitative and Quantitative information. Qua1itative Information
describes the current education situation in terms of non tangible
factors like the quality of instruction in Classrooms, and
appropriate learning experiences by pupils. On the other hand
Quantitative information describes the current education situation
in terms of "purpose, pupils, teachers, administrative and other
personnel, physical accommodation, material and equipm~:nt available
as well as the end product in terms of school leavers, repeaters,
graduates and research." (Fredrickson,1983, p.4).
3

The importance or Quantitative Information in Educationa1
p1anning:
(In the context of Pakistan)
The role of information in educational planning can be
considered as the foundation of the whole process of Policy
formulation by Educational planners and politicians. Psachaopulos
gives an interesting example of how the absence of proper
Information can mislead an Educational decision maker (The example
is regarding a University but can be generalized for my study) . He
states
When a politician is about to make a decision to construct a new University, he might not be basing it on full knowledge of available information somewhere else in the system. Perhaps information exists somewhere to the effect that a rise in the minimum school leaving age would have a probable effect on improving income distribution by 10 percent relative to its present state, whereas the effect of another university might be to worsen income distribution by 15 percent. We keep saying that Educational reforms are political acts. Yet I would like to maintain that if politicians were exposed to fuller information statements as in the hypothetical case presented above, they might arrive(or be obliged to arrive) at a different decision (Psachaopulos, 1980, p.43-44).
The provision of accurate, reliable and timely information can
act as an input to effective educational planning and management in
a number of ways. This example demonstrate that the provision of
correct information about the current status of an educational
system in a country or a part of country might influence many
decisions. Construction of a primary school in a rural area can be
of no help if we don't have the information about whether there will
be enough teaching staff available in that area or whether female
students will be able to travel to that school (especially in
4

countries where female literacy rate is low) . According to Chapman
& Mahlck , "Information can be used to improve educational quality
in four principal ways by:
(i) providing data that are used direct1y to secure o:z::· a11ocate
resources;
(ii) constraining 'bad' decisions;
(iii)detecting inefficient resource use; and
(iv) supporting mechanisms that offset the impact of re.source 1oss"
(Chapman & Mahlck, 1989, p. 4-5)
In the following section, I will discuss each one of these ways
in the context of Pakistan.
Rea1ization of the importance of Educationa1 infox:mation in
NWFP, Pakistan: Information generated by an information system can
play a pivotal role in the formulation of educational policies in
ways presented by Chapman and Mahlck. Following is a brief
discussion of this recognition of the importance of educational
information in the case of N.W.F.P., Pakistan
(i) Securing and a11ocating resources: The yearly statistical
reports generated by Ministry of Education (which was the only
Educational information system) in the province of NWFP in Pakistan
when reviewed gave rise to the disappointing fact that there had
been a continuous increase in the number of out of school children
and poorer turn out from primary schools (Ministry of Education,
NWFP , 1 9 8 9 ) . This resulted in attracting the interest of many
politicians and foreign donor agencies to improve this situation of
falling standard of education. Provision of educational information
5

proved to be an essential factor in analyzing the trends, resulting
in appropriate actions. Since then donor agencies have launched
projects worth billions of dollars not only to increase the
educational resources and improve educational quality in the
province of N.W.F.P. but also to improve the information system to
provide useful, upto date and accurate information about the
resources. This was needed for the fulfillment of their own
development projects and for providing a permanent resource to
manage yearly flow of information.
(ii) Constraining 'bad' decisions: Frequent use of data can
raise questions about the decisions that politicians make for their
own interests. An example of which is construction of a Primary
school by a member of provincial assembly near his own jurisdiction
while the school is inaccessible by majority of people living in
that region. Frequently used data means, frequent observation of
figures exposing the realities which can be criticized.
(iii) Detecting inefficient resource use: The allocation of
budget in both NWFP and Baluchistan provinces in Pakistan was always
imbalanced. Statistics showed that approximately 90% of the
recurrent education budget was being spent on salaries and
allowances (Adams, 1989). Hiring of new teachers in that situation
under the same budget was shifting funds from instructional
materials. In most of the primary schools, the teaching learning
aids were only chalk, black boards and text books while a large
number of teachers, being untrained, were not well conversant with
the methodology of teaching and use of these aids due to which they
6

were unable to impart quality education according to latest
techniques (Ministry of Education, Peshawar, 1989). This
information was valuable for decision makers to seriously think
about ways to overcome some of this wastage of resources.
(iv) Offsetting the impact of resource 1oss: One of the
reasons that female teachers in Pakistan don't want to go to Rural
areas is because of the lack of secure accommodations. The increase
of salaries as an incentive for those teachers have proved to be an
unrealistic step. Hence donor agencies, in reaction to this
important piece of information, have proposed the construction of
cluster hostels in rural areas for female teachers as more cost
effective step for future (Ministry of Education, 1989) .
All of the above examples lead to the conclusion of extreme
importance associated with the management of accurate, time1y,
re1evant and comp1ete quantitative educational
system that provides this kind of Information.
information and a
Definitions ox Educationai management Information System(EMIS)
An EMIS is a system that manages educational information from
the point of data collection through the transformation of data to
information to the ultimate use of information by policy makers and
planners.
A more comprehensive definition as given in the final report of
Primary Education Development program at NWFP, Pakistan is that "An
Education Management Information System (EMIS) is a data collection,
storage, retrieval processing, and dissemination System specifically
designed for use by decision makers to plan and administer education
7

systems more efficiently and effectively" (Leblanc, 1993,p.l).
Another interesting definition which is my own dei:inition
derived from the study of educational objectives described by
Psacharopoulos (1980) is that an Educational Management Information
System is a way to satisfy Education-centered objectives of an
Educational system, which by definition, "must aim at educational
equalization and therefore be served by information which will
discriminate data according to population groups and groupings by
age, ethnic group, religion, sex, socio-professional category or
origin and by sub-region within each country" (Psacharopoulos, 1980,
p. 35) .
History of EMIS in Deve1oping Countries: The who:Le process
that resulted in a high demand for an efficient Management
Information system has its roots in the years of 70s and 80s. The
following picture is a diagrammatic presentation of thE:! process of
historical evolution of EMIS that Chapman & Mahlck (1993) presented.
The diagram shows how many developing countries went through a major
educational dilemma between the years of 1970 and 1980 resulting in
a high demand of a structured and advance system of educational data
management.
(next page)
8

9

Rapid population growth
Increased population rate
Rapid recruitment of teachers
Large number of unqualified teachers
Budget spent on teacher salaries
Cut back on budgets for I
Text books I I Materials I I Construction I I Maintenance I
Realization of lack of basic information and
weak management
Education system started to fail
Drawing attention~f donor agencies and local ministries
Creation of information systems to monitor development projects and to upgrade information systems with new
technology (computers e.t.c.)

Stages of EMIS: As described in the definitions above, an EMIS
involves a series of processes. The data provided within the
schools and outside the schools mainly district education offices go
through a number of steps to reach to the education planners in the
form of useful information. Data is collected from the schools and
district education offices using an annually distributed data
collection instrument designed by the researchers in the central
statistical office. Data is then stored in the form of manual
registers or computerized data bases located in the statistical
center/s. The data is refined and then analyzed for the purpose of
presentation to the educational planners at different levels of
hierarchy. Following is a graphical presentation of these
processes taken from a UNESCO report(l989).
COLLECTION
STORAGE
PROCESSING
ANALYSIS
(cont.)
10

PRESENTATION
Description of the Processes: (from "Overview of EMIS .l.n NWFP" by Thomas D. Leblanc)
Collection: - Decide on the contents of the data collection
instrument
- Sample the schools for pilot testing
- Pilot test the data collection instrument
- Print copies of the instrument
- Distribute the copies to all schools
- Collect the copies from all schools
Processing: - Organize and sort the copies of data
collection instrument
Check accuracy of the data entered
Storage: - Enter data in Computerized databases (If not
computerized then entering data in the manual
registers) .
- Backup the databases
Analysis: - Perform calculations to convert data into
information
Presentation Print out reports
- Send copies to the people who need the
information
As we can see the whole purpose of the EMIS structure and
11

processes is to provide decision makers with information about the
current status of different aspects of the educational system. But
when data erroneously reflect the state of the educational system,
the implications for management and planning can be serious
(Leblanc, 1994). Hence it is extremely important for the
Information provided to have certain characteristics which mainly
include Accuracy, Timeliness, Relevance, Completeness, Validity and
Readability. The next chapter discusses the structure of EMIS in
NWFP, Pakistan and various administrative and structural problems
faced in the way of getting an acceptable set of information. At
the same, the chapter looks at examples from different developing
countries to emphasize the seriousness of the facts presented.
12

CHAPTER 2: AN OVERVIEW OF FACTORS EFFECTING THE DATA QUALITY
(With examples from Nepal, Botswana, Somalia,. Egypt)
In order to reach to the point of describing the problems that
the current EMIS in N.W.F.P, is experiencing in terms of data
quality, it is absolutely necessary to explain briefly the
situation of Primary Education in Pakistan and narrowing it down to
NWFP.
Geographicai Background: The Islamic Republic of Pakistan
emerged as an independent sovereign state on 14th August,1947.
Pakistan is basically an agricultural country with a total area of
nearly 796095 sq. kms and population of around 110 million The
country is divided into federal territories and four provinces, NWFP
is one of them. The population is growing at an alarming rate of
3.1%. Pakistan has nearly 30% literacy rate, where the female
literacy rate is only 16% ("Education for All", 1990)"
Educationai Situation in Pakistan & NWFP: Education in Pakistan is
constitutionally the responsibility of provinces. In practice, the
planning, administration and management of education are the shared
responsibilities of the federal and provincial governments. The
government of Pakistan and N.W.F.P. have been allocating sizeable
resources, approximately 20-25% of its annual developmental as well
as non-developmental budget, during the last decade to the Education
sector, yet serious deficiencies persist. Countries like Sri Lanka,
Philippines, Malaysia, Indonesia, India and many African countries
have surged ahead of Pakistan ("Social action plan'', 1991).
N.W.F.P. lags far behind in the field of education, especially in
13

primary education and female literacy. The following table below
shows the comparative literacy rates in N.W.F.P. and Pakistan.
Tab1e 1
Literacy rate in NWFP and Pakistan
LOCALITY PAKISTAN N.W.F.P
TOTAL MALE FEMALE TOTAL MALE FEMALE
URBAN 47.12 55.32 37.27 35.77 46.96 21.88
RURAL 17.33 26.24 7.33 13.18 21.73 3.82
TOTAL 26.17 35.05 15.99 16.70 25.85 6.48
Out of many reasons why the standard of the whole
Education system is deteriorating year by year, a major factor is
the lack of proper information available to the decision makers.
The information disseminated by the statistical bureau of education
is usually incomplete, and inaccurate and can be on time only with a
trade off for incompleteness. The current EMIS that was established
in 1989, is struggling through the same hale of corruption and
bureaucracies.
EMIS in NWFP and its objectives: It is important to present a
short overview of the Primary education system in NWFP and then the
1 Education Department of N.W.F.P. Pakistan (1991). Report on Social Action plan <1991-1994) for education sector, NWFP. Peshawar: Education Department Printing office.
14

situation of EMIS within that system will become clearer.
In NWFP, the responsibility for administration and management
of education rests with a Provincial Education Department(PED)
which is basically divided into a secretariat and various functional
directorates. The secretariat performs a staff function by advising
the secretary on policy choices. The minister appointed by the
provincial government is the titular head of the PED. The
Directorates are line agencies one of whose biggest responsibilities
is the provision of data and information to the secretariat. Due to
rapid quantitative expansion of Primary and Secondary education, the
directorate of Education (schools) is bifurcated into two separate
directorates, Primary and Secondary. Our focus is on the quality of
information provided by the Directorate of Primary Education
regarding the primary education system.
The educational management information system currently running
under the directorate of primary education was created as a part of
Primary Education Development program that started in 1990 and will
continue till 1999. The program is a joint venture between
Governments of Pakistan and United States of America with an
objective to improve Access, Equity, and Quality of Primary
Education in NWFP and Baluchistan.
Object:.ives: The objectives of EMIS as described by Theisen in his
working paper about PED program are as follows:
1. Reporting, in tabular, statistical, or graphic fashion, of facts that describe the current status of quantifiable elements of an education system. These elements include both Inputs (e.g. textbooks, teachers, classrooms, and fiscal resources) and outputs (e.g. initial enrollments, dropouts, and achievement test scores).
15

2. Docµmentation of historical trends regarding inputs and outputs, translation of past trends and current needs into projection of future needs, and system characteristics.
3. Ana1ysis of data to identify inefficiencies in resource allocation, resource utilization, performance optimization, and policy choice.
4. Simu1ation of outcomes associated with particular policy options and resource allocation.
5. Decision making based on data produced in an accurate, timely fashion to inform debate on policy choice and resource allocation. The objective is to base decision making on an empirical understanding of costs and benefits as well as on the political merits of particular policy alternatives (Theisen, 1989, p.1-2).
The EMIS was created with the aim of providing information
with all the attributes that were described in Chapter 1. But
unfortunately the EMIS has been unsuccessful in providing that kind
of Information. In the next section I will discuss why those
attributes could never be achieved successfully after observing the
system while I worked for the EMIS cell myself, reviewing different
reports, and analyzing the situation as a member of Pakistani
society. After observing the EMISs in U.S.A. I am now more able to
point out certain flaws in our Information System in N.W.F.P. which
need definite improvement and repair.
One of the biggest contributions of the development of EMIS in
NWFP is that it has revealed certain traits about the education
system which had heretofore remained undetected. Leblanc has
concluded from his observations as a Supervisor of EMIS, NWFP as "It
has revealed an organizational structure which may be characterized
as a "loosely coupled system" -- a system with little or no
16

communication among units (both horizontal and vertical), poor
supervision at all levels, slow or absent coordination between
units, failure to implement rules, and frequent and unpunished
violation of rules" (Leblanc, 1993, p.4). There are many problems
under this system which keep on creating hinderance in the
establishment of an efficient EMIS.
Data collection.
The whole process starts with
Data Co11ection: Data collection in the EMIS, NWFP involves a
series of steps involving a number of people from diffE~rent sectors
of the Education department. Based on the interviews conducted
across the province with educational administrators and head
teachers, a school census questionnaire is developed every year with
some modifications. The questionnaire includes all the questions
that the top level educational administrators and the EMIS technical
staff can think of. The questionnaire is then translated from
English to Urdu which is the National language and the medium of
instruction in the Government schools. To check the accuracy of the
translated version, it is also translated back from Urdu to English.
An important point to note is that the initial school census in 1990
included private schools as well but due to the lack of authority of
the Primary directorate over the private sector, the school census
has been limited to government or in other words, public schools
only. The questionnaires follow the following path of distribution
and collection:
17

Primary School
Directorate of Primary Education EMIS Cell
District Education Office
Subdivision Education Office
Pay-Center-InCharge
Primary School
18
Primary School

After the questionnaires have been printed for almost all of
the primary schools (around 17,000), they are sent to the District
Education Office, the District Education Officer(DEOs) then sends it
Subdivisional Education officers(SDEO), who in turn sends them to
the Pay-Center Incharge(PCis) and explains the questionnaire to
them. Pay-center incharges personally take each questionnaire to the
individual schools and explain the questionnaire to the head
teachers. The Head teachers then fill the questionnaires and send
them back through the PCis to the SDEOs who then check the data
accuracy and sign it when approved. The questionnaires are then
sent to the DEOs who also check, sign and stamp, declaring that the
data is accurate and ready to be entered into the computerized data
base. Big bundles of questionnaires are then sent to EMIS, NWFP,
where they are checked by the EMIS staff and entered into the
Computerized data bases by the Data entry operators.
Weaknesses in the Data co11ection process: The present
situation as regards Educational data collection in developing
countries may be illustrated with a quotation from a survey
conducted in 1975 by the UNESCO Regional Office for Education in
Asia and Oceania. The survey states that:
Despite two decades of Educational planning, the educational planners have still to contend with inadequacies in data gathering, storing and retrieving mechanisms. The adequacy, accuracy and quality of data are generally referred to ( by countries in Asian region) as major constraints. see Unesco Regional Office (l975), p.VI.
The lack of the most desirable attributes of Information i.e.
timeliness, relevancy, accuracy and reliability of the data actually
19

originates from the weak data collection process. There is a wide
range of problems that exist in this respect, including, for
example, an extremely low response rate, flaws in the design of data
collection instrument, misinterpretation of information asked for
in the data collection instrument, careless attitudes in the whole
societal structure and many others. Below is a detailed discussion
of each one of the factors that, in my perspective, are seriously
effecting the desired information quality in NWFP.
that similar types of factors have frequently been
Literature shows
observed by
researches performing such studies in other developing countries.
The discussion initiates with sampling procedure which is involved
at different steps of data collection process and it's deficiencies.
Importance of Samp.1..ing and deficiencies in samp.1..ing, during the
data co.1...1..ection process in NWFP: A sample is a procedure of
selecting a manageable group of subjects from a large population,
assuming that the group will have most, if not all of the population
characteristics. Selecting a sample, representative of its parent
population is a wide field of research in Statistics. The aim of
scientific methods of sampling is essentially the same,. but greater
precautions are taken to ensure that the sample is representative of
the population, adequate in size and unbiased. Education, is not
considered as a science, but informed discussion of educational
problems is extremely dependent on the kind of research that will
produce valid generalizations of the Education system (Butcher,
19 65) .
In case of EMIS under discussion, sampling is involved in
20

selecting a manageable group of schools which will participate in
- meetings to decide on the contents and design of data
collection instrument
- pilot testing the instrument
- data validation efforts
It is very important in the construction of a questionnaire
that it is agreed upon by the people who are eventually going to
work on it. In NWFP a big difference in the level of
understandability and the abilities to interpret, exists between the
people from the urban and rural areas. While selectin~r a group of
head teachers to discuss the questionnaire contents, only a few
districts were included mainly Peshawar and Kohat, which are the
most urbanized and advanced districts in terms of literacy and
resources. Also, there are Mosque schools that are supervised by
head teachers who are selected more for their religious backgrounds
than their academic degree. Mosque schools should have had adequate
representation in the group. The selection was partly political,
but more due to the unawareness of decision makers of the negative
effects that an unrepresentative group can have on the whole data
management process. Random selection of schools with majority of
the schools in urban localities is likely to provide more urban than
rural schools.
This biased sampling resulted in designing a data collection
instrument which carried many misunderstood responses from different
areas and levels. Also the timeliness (different time taken
travelling from different areas)and relevancy of responses was
21
effected. An example of misinterpretation of questions requesting
important data is available in the section called 'contents of the
questionnaire' and information on recommended sampling can be found
in chapter 5.
Deficiencies in the questionnaire design: Selection of a data
collection instrument is an important decision in the data
collection process. Data collection instrument plays an important
role in the data collection as they are the basis for data
collection time, effort as well as size of the computerized database
and data analysis. One of the most common and widely used methods of
obtaining statistics from schools is the questionnaires dispatched
once or more each year to the schools and analyzed in the EMIS
(Fredriksen, 1983). The only other method for data collection that
can be used in the context of school census is the Interviewing
which can be very expensive as well as time consuming. For school
census mailing questionnaires is the best method to get accurate
data in a cheaper way. Oppenheim states
Since mailing questionnaires does not require a trained staff of field workers, virtually all that it requires is the cost of planning and pilot work, printing or duplicating expenses, sampling, addressing, mailing, and providing stamped, self addressed envelopes for the returns. The processing and analysis are usually also simpler and cheaper than in the case of interviews ... Mail questionnaires are preferable if information has to be checked against documents or if other informants have to be consulted (Oppenheim, 1966,p.32-33)
Due to most of these reasons, the technique of mailing
questionnaires was employed for the data collection in EMIS, NWFP.
Though it was not strictly mailing in many cases, where PCis were
taking the questionnaires to schools personally, the idea was the
same. There were, however, a number of factors related with the
22

questionnaire design and the data collection strategy, that
influenced the effectiveness of the proposed implementation.
(i) Time wastage in questionnaire distribution: ~['he DEOs and
SDEOs are responsible to explain the questionnaires to the Pay
Center-Incharges who are then responsible for explaining the
questionnaires to the Headmasters of schools, so that they can help
headmasters fill in the questionnaires. This loses the benefits of
using mail questionnaires due to the time and energy spent on each
head teacher as well as the misconceptions that can occur when
information passes through a number of people.
Mail questionnaire should be self explanatory and much simpler
so that no additional explanation is needed. The school head
teachers are literate enough to read and understand simple
instructions. This raises another question of questionnaire format
and content which will be discussed later.
(ii) Lack of incentives: While I am focussing on the
importance of how, lack of incentives effect the information
quality, it is important to discuss a little bit about the concept
of low response rate at this point. Low response rate is one of the
greatest obstacles encountered by researchers using questionnaires
specially in developing countries, this is an extremely serious
problem (Berdie, Anderson & Niebuhr, 1986). Partially or
incorrectly filled questionnaires are also counted as low responses,
since they contribute adversely to the resulting information. A big
reason behind the dilemma of falling response rates in developing
countries, is lack of incentives provided to the administrators to
23

participate in the data collection process. It takes an effort to
fill a questionnaire accurately and send it on time. During a study
conducted in Nepal regarding inaccurate data provided by
headmasters, it was discovered that "there were no stimuli for
headmasters or district education officers to report accurate
data ... "(Leblanc, 1994; Chapman & Messec, 1989, p.6).
As a result of this lack of enthusiasm and realization of the
importance of questionnaires, either they are delayed or incorrectly
filled by the head teachers. For example, the questionnaire asked
for enrollment by age/class i.e. age by grade matrix and also by
gender/class i.e. gender by grade matrix which should total to the
same enrollment figure. On a large number of questionnaires, the
totals did not match because of the lack of interest on the part of
head teachers in filling out the questionnaires. One of the factors
behind this situation is that no attention is paid by the
educational administrators to provide any reward for the head
teachers for the effort requested. Also the Learning coordinators
lack incentives to go to all schools to collect and report data
(Leblanc, 1994). If the decision makers need accurate and timely
data for analysis, they need to focus on the ways to convey
appreciation.
Many studies have found that offering incentives to subjects
can increase response rates without leading to response distortion.
In mail surveys, the inclusion with the original questionnaire of a
pencil, or other token gift has somewhat increased response rates.
Some studies have used raffles. People have also made contributions
24

to charity in the name of people who respond to the survey e.g.
contribution to a mosque or a hospital can touch people's heart and
gain their attention (Berdie, Anderson & Niebuhr, 1986). A similar
kind of reward distribution structure can be extremely helpful to
improve efficiency, in the context of Pakistan. Introduction of
ceremonies with the participation of learning coordinators,
headteachers and other staff, can also be one way to thank for their
efforts in data collection.
(iii) Endorsement/Cover 1etter: The questionnaires are more
effective and apt to get attentive responses if they represent a
person who is authorized to hire and fire. The questionnaires used
in EMIS, NWFP, should be signed and stamped by the Director of
Primary Education or a higher Official in order to make the
concerned people realize the importance of the data, they are
providing. Fredricksen emphasizes the importance of a cover letter
by stating "When the forms (questionnaires) are dispatched to
schools, they should be accompanied by a cover letter e~xplaining the
importance of the information requested and indicating that the
statisticians are fully aware of the important role headmasters play
in supplying the information" (Fredriksen, 1983, p.49).
(iv) Format of Questionnaire: The quality of statistics
collected through questionnaires depends to a very large extent on
the quality of the forms used. Therefore a lot of attention must be
devoted to their design as well as to the wording of the questions,
explanations of the fill-out procedures and definitions of various
terms used in the questionnaire (Fredrickson, 1983). The problem
25

of content unclarity, is frequently observed in the research done in
developing countries. During the study conducted, on the Nepalese
EMIS in 1989, Chapman & Messec observed,
About half the headmasters experience difficulty filling out the school form; half do not understand what information is being requested. When they do not understand the directions, some seek clarification from the DEO or .ask someone else in the school who may have had previous experience with the forms, but about half complete the form by taking their best guess as to what is being requested (Chapman & Messec, 1989, p.25).
The questionnaire used in EMIS had some noticeablE~ flaws in its
design:
(1) The questionnaire included many unclear and hard to
interpret items, for example, filling out matrices likE~ age-grade,
number of classes-number of rooms, equipment type-need type e.t.c.
The totals were also included in the matrix which is a part of weak
form design. The totals should be computed by the computers, people
don't want to spend time in calculations. Besides that the
procedure of filling out the matrices was not clear. An example of
the results of biased sampling in this case was that the Age-grade
matrix in the questionnaire(see Appendix A) was misintE~rpreted by
the head teachers in the far flung rural areas and also the mosque
schools, who were not instructed well, and were not very familiar
with filling out these matrices. The following age grade matrix was
filled out by one of the head teachers in one of the mosque schools
("School Census Questionnaire, 1991-92", 1992).
26

Age/Gr Ka chi Pakki 2 3 4 5
3 3 4 1 2 5 2
4 2
5 2 3
......
21
Total 3 8 1 4 15 2
The total enrollment of the school as result of the
multiplication instead of addition was then presented to the
decision makers as much more (8 non existing students) than the
actual enrollment.
The age wise enrollment in a country like Pakistan is not of
much help, because having abnormal ages in different classes
involves many other factors encompassing the whole system. The
hands of educational decision makers are tied while dealing with
such problems due to the involvement of the corruption in other
departments. It is, therefore, a good strategy to reduce the age
wise distribution to two or three groupings of ages to get an idea
of number of primary and non-primary aged children enrolled while
obtaining the detailed age wise enrollment through sample surveys.
An example of an unclear and tedious question is given below:
Q. Details of furniture and other articles
S. No. Equipment Total Needed Surplus
27

1 Tables
2 Chairs
3 Fans
4 Desks ( 1)
5 Desks (2)
6 Desks (3)
7 Jute tate
8 Flag
9 Alrniras (S)
10 Almiras (W)
11 Blackboard (Walled)
12 Teaching Kits
13 Charts
14 Blackboard (Wooden)
15 Maps
16 Benches (2)
17 Benches (3)
18 Bucket
19 Water tubs
20 Sprinklers
21 Water Coolers
22 Wall Clocks
23 Other
As we can see from the above table, the information requested is
28

redundant. The whole column of Surplus can be calculated by
computers automatically, by including conditional check. All this
information should be a part of an inventory survey and can be
conveyed to the decision makers in the form of a summarized report.
(ii) The questionnaire lacked the 'Fi1tration process' which is
necessary to reduce the time and effort of people filling out the
questionnaire. Filtration process means skipping out a set of
questions when it doesn't apply e.g the questionnaire could be
simplified if the headmaster of the male school was asked to skip
some sections like female enrolment by grade instead of putting
zeroes (since there are no co-ed schools any more) .
(iii) Over crowdedness in the EMIS questionnaire, 1ack of grouping
simi1ar items and 1ack of attractiveness are small but important
factors that effect the response rate. If questions about the same
topic are included in different places in the questionnaire, a
respondent may become confused by perceived redundancy. He may also
become hostile because of the perceived carelessness and may treat
the data collection process with less seriousness ("Approaches to
developing questionnaires", 1983). The items about the same items
can therefore be grouped together and titled e.g.
IF THIS IS MALE SCHOOL PLEASE ANSWER THE FOLLOWING QUESTIONS
ENROLMENT:
Q.
TEACHERS
Q.
and so on.
29

In addition to providing incentives & assuring
accountability, there are non threatening and less costly ways to
raise the enthusiasm and moral of head masters to fill in the
questionnaires on time and correctly. Including a recitation from
'Holy Quran' (religion being an important motivating factor in
Pakistani society) regarding honesty or children's education might
help.
(iv) Questionnaire Length, content and simplicity: Length of a
questionnaire is directly related to the amount of information that
is needed and also to the cost and effort that is affordable. But
one of the factors that is often ignored, is the relationship
between the length of the questionnaire and the effect it is going
to have on the accuracy of data. Response rates are highly
dependent on the effort that a questionnaire will take to fill it
out. "Appropriate size of the questionnaire" (Casley & Lury, 1987,
p.74) may seem to be a minor consideration but is very important for
correct and relevant information. Whether in Social research or
annual data collection efforts in developing countries,
questionnaire length vs. content has been an important issue. Since
questionnaire respondent as compared to an interviewee doesn't get
much positive feedback of his efforts, he wants to spend less time
on a questionnaire (Evaluation Research Society, 1984). Past
studies done in Unites States of America have shown that long
questionnaires receive lower response rates compared to shorter ones
but more recent studies have shown that questionnaire length itself
doesn't matter that much, the important thing is content but surely
30

"it does not mean that a 60 page questionnaires will obtain response
rates as high as two or four page ones". (Berdie, Anderson &
Neibuhr, 1986, p.53). Many researchers still believe that level of
accuracy of the information provided declines with the length of a
questionnaire no matter what kind of research it is. (Casley &
Lurly, 1987, p.76). The Statistical policy working paper 10,
published by the American Statistical Policy Office emphasizes the
same fact by stating "If too many items are included in a list, the
amount of thought given to each response may decline towards the end
because of respondent fatigue" ("Developing questionnaires", 1983)
The reason for emphasizing the length of a questionnaire is
that this has had a major effect on the quality and timeliness of
data provided by EMIS, NWFP. The head teachers did not pay much
attention to all the questions that were asked, although the
questions were very important in content. Between the years of 1990
and 1993, the questionnaire was reduced in size from approximately
50 pages to 11 pages in 1992 and to one page questionnaire for 92-93
school census. Leblanc states
Since the questionnaire was only one page long, it could easily be filled out in a day and returned to the EMIS Cell of the Directorate of Primary education by the first of October (when sent in September, 1992) . Data processing ( that is entering data into a computer database and then creating reports based on that data) could be accomplished within three months. That meant that basic data on Primary education in NWFP were available to education decision makers and administrators as soon as 1st of December, 1992. (Leblanc, 1993, p.28)
The one page questionnaire proved to be very successful in
providing timely and reliable information to decision makers and
while school census 1991-92 was very incomplete even till mid of
31

1992, 1993-94 census was presented to the decision makE~rs in
January'94.
An important point here to note is that, the acceptance of only
very basic school data took place not only because, head teachers
could be provided with a simple and short questionnaire but also to
reduce the intensity of time and effort that was spent on data
cleaning for the first two school censuses. The question now is the
loss of a lot of supplementary data which are actually considered as
basic data in many developing counties. For example the omission of
age wise distribution from the questionnaire is major loss of data
that is required to calculate enrollment ratios as well as
participation rates. Also an idea about the number of primary
students who should not be included in a primary age range, is
important in formulating decisions. Omission of facilities data is
proposed to be compensated by the faci1ity management database in
1994-95. But data such distribution of teachers by their basic
qualification is an important question for decision making while
tongue wise admitted boys/girls doesn't effect major decisions and
can be considered redundant at this point (Leblanc(a), 1994). There
is a high need for a professional researcher who can decide to keep
a balance between the level of understanding of head teachers, time
and content involved. Suggestions like collecting detailed
information through short surveys can also be helpful.
OTHER FACTORS EFFECTING DATA QUALITY
Data Dup1ication & disorganization: Data about the educational
system is gathered by many different agencies in addition to the
32

regular school census by EMIS. The studies reveal as in the case of
India which has a similar educational structure and socio-economic
background as Pakistan, that there is little integration between the
various types of data gathered by different sources mainly because
different personal from these sources are involved in the data
gathering process (UNESCO, 1992) . As in 1992-1993 data was being
collected by Directorate of primary education as well as MUST which
was another project to carry out school census. The only purpose
MUST data was used was to compare results with EMIS data. It was a
complete waste of time and effort. There was no way that these data
could be close because of the unaccountability involved in MUST.
The same inaccurate data was collected by two organizations instead
of using data collected by MUST that could be collected with some
degree of accuracy and omitting it from EMIS data thus reducing the
effort on part of head teachers and DEOs. A similar situation has
been observed in Nepal where same data is being collected by
Ministry & Manpower as well as School Administration resulting in
additional work for administrators (Chapman & Messec, 1989) .
Socia1 imp1ications: Very interesting facts were revealed by
the PED project regarding missing and wrong data. After describing
the differences between religious Hijri (lunar) calendar and
official Gregorian calendar, Leblanc states " .. it is not unusual for
rural villagers in Muslim countries to be unaware of their birth
date based on the Gregorian calendar since their way of life is
usually more attuned to religious functions rather than the official
ones. In such instances, head teachers of primary schools may guess
33

their students' ages, basing their judgements on the height and
weight of the children" (Leblanc, 1994, p.3). This can seriously
effect the enrollment proportions and leave primary aged children
deprived of educational benefits that they deserve.
Poiiticai interests: Due to the loose law enforcement
structure in Pakistan, EMIS is forced to produce figures that make
no sense at all. Some members of parliament (MPAs) show more
enrollment and classrooms in the schools of their areas to get more
budget for these schools. Exactly the same situation was observed
during a study conducted on EMIS in Egypt where enrolment was
misreported to get more teachers and budget allocations (Toronto,
1990) . Similarly a very sad and interesting fact was exposed on
investigation that DEOs were maintaining some GHOST schools which
existed on paper but never existed in reality and budgets were
allocated for these schools because they were counted as regular
schools in the school census (personal experience) . Also DEOs and
SDEOs have strong political disincentives for reportin9 school
census data (Leblanc, 1994) . This intentional misreporting of data
has also been observed at the school level in many devE~loping
countries. During the study conducted by IEES in Nepal, an
interesting fact was disclosed. The national level educational
decision makers assigned the greatest blame for inaccurate data on
the headmasters. They believed that the headmasters were not
keeping accurate records and not reporting accurately the data they
did have. There were definitely some political reasons that forced
head teachers to misreport the data the had in their registers. The
34

headmasters on the other hand believed that their records were
accurate, inaccuracies were due to the absence of school records
related to those data. (Chapman & Messec, 1989). Finally the fact
remained unresolved regarding who was the actual cause of the
problem in reality.
Unaccountabiiity & Corruption: The school census carried out
in 1992 revealed that DEOs and SDEOs were not carrying the duties
efficiently and honestly that they were assigned. When the school
census questionnaires were distributed to them they were supposed to
teach the PCis (Learning coordinators after 1992) in detail how to
fill the questionnaires who were in turn responsible of explaining
it to head teachers but this process was not completed most of the
times. In addition to the field level negligence the DEOs were
supposed to check each questionnaire for accuracy and then sign and
stamp the questionnaire but it was observed that even the most
easily detectible and prominent errors were not indicated by the
DEOs which meant that the sign and stamp didn't mean anything. There
was no serious fine or punishment for continued negligence. Even
when some GHOST schools were discovered, people working on the case
were threatened by the people involved and in one of the extreme
cases even physically abused. No follow ups were done for a long
time due to the political contacts of the culprits (personal
observation) . Leblanc quotes a Pakistani News paper,The News
in the outline of his dissertation abstract by stating "Committee
Unearths Rs. 280m Bungling in NWFP Education department". The
article reported that a special committee in Provincial Assembly
35

discovered 1,200 "ghost teachers" i.e. teachers who existed on
papers only. Their salaries were being paid over a period of five
years and distributed among a network of people in various
departments including Education department (Leblanc, 1994)
Extreme negligence was observed during the checking of
questionnaires in the EMIS cell. The data analysts and system
analysts spent most of their time in data cleaning rather that
analyzing the data due to the mistakes in fill outs as well as
serious errors in data entry. There were logical and limit checks
for certain data but most of it really depended upon the conscience
and sense of responsibility of the staff.
Lack 0£ awareness: In many developing countries, the people
involved in data collection and data processing are not aware of the
importance attached to the accuracy of the numbers they are dealing
with. While conducting a survey on Somalian EMIS, the headmasters
were asked by the IEES researchers to state the purposE~ of the
yearly questionnaire that they filled out for educational
statistics. The researchers stated, "It is clear from the vagueness
of their answers, and the lack of response, that Headmasters have no
real understanding of why the data are needed. This may help to
explain why there is so little concern by Headmasters about the
timeliness and accuracy of data" (Chapman & Messesc, 1989, appendix
2, p.28). During a study conducted by IEES in Nepal researchers
indicated the same problem, that the schools were not aware of the
importance of the data and thus did not hurry to return the
questionnaire. Staff disliked completing the questionnaire and
36

considered the process as a laborious task without any utility.
Similarly the same study revealed that data checking as done by DEO
in EMIS Peshawar, was responsibility of REO in Nepal and the REO did
nothing to the form except sign it. However, the reason for sending
these forms to the REO was to get verification of the data reported
by schools (Chapman & Messec, 1989). Lack of awareness was
considered as responsible not only for inaccurate but also delayed
data reporting. There have been workshops and discussions with DEOs
in NWFP about the use of data but there have been no focus on the
drastic effects that wrong data can have. Head teachers have never
been addressed of how important their participation is and what
negative results their negligence can produce.
Participation by administrators: The determination of what
information is to be generated by the information system is one of
the first steps in the development process and is the responsibility
of the administrator. Typically, the user is the administrator and
the developer is the system analyst. A successful information
system is dependent to a large extent on such mutual understanding
and interaction as well as on the active participation of the
administrator (Hussain, 1973) . In developing countries this factor
is often ignored while establishing and managing an Educational
information system. During a study conducted by IEES in Botswana in
1992 the same issue was aimed to be addressed by the researchers by
suggesting "Decisions regarding the content of the EMIS must be made
in consultation with parties from all departments expected to
provide data. Most department heads and data managers are regularly
37

bombarded with requests for information. If they do not consider
the data to be important, they will not be willing to take time away
from other tasks to collect it" (USAID, 1992, p.50).
In case of EMIS in NWFP, some administrators were invited and
pilot tested for the questionnaire but this did not represent the
characteristics of the population as a whole. The districts that
were selected for initial consultation are highly urbanized and do
not represent districts like Chitral where there isn't even supply
of electricity in some schools. Lack of participation on the part
of administrators has been an important factor in the imbalance of
Information as well as its accuracy, timeliness and consistency.
Lack of training: Lack of trained staff has been one of the
factors, that effect the quality of data produced in EMIS, N.W.F.P.
Almost all the staff was and is being given beginner's training in
data collection, management, analysis and presentation. Staff has
not been professionally trained either on job or prior to their jobs
in all these fields. A survey conducted by IEES in Somalia about
the seriousness of different problems encountered in educational
data showed that around seventy percent (70%) of the educational
administrators believed that inadequate training was one of the
major constraints that they experienced in data collection process
(Chapman & Messec, 1989) . Similarly lack of training in data
collection procedures was considered an important factor in EMIS in
Sudan. The study (Leblanc, 1994) suggested that short term training
courses be offered on an annual basis to improve the head teachers'
capacities to maintain data records and the supervisors' capacities
38

to collect and analyze data related to the activities of the
education sector. Fredrikson stated the same fact in his study of
data collection in developing countries as "It is highly desirable
to organize short-term information courses for school headmasters in
order to explain to them both how to complete the statistical
questionnaires and the importance of information thus supplied for
educational planning" (Fredrickson, 1973, p.18). There should be a
quarterly meeting with all the head teachers in which the Minister
of Education should state the importance of the workshops regarding
educational data followed by the workshops at different levels of
data management. The reason is that in this way head teachers may
feel accountable to the higher authorities, they will realize the
importance of data and the ways they can contribute to or hinder the
process of Educational decision making by not going to those
sessions.
Lack of timeiiness: The knowledge of an event is useless after
the event has already happened and effected the surroundings and
people. Like in many developing countries provision of information
before the planning cycle starts for a year, has always been a
crucial factor in the School census carried out every year. Since a
major portion of time was spent in data cleaning, time factor became
second priority to correctness and the confidence that users could
have in the data presented. The study conducted by IEES in 1989 of
the Somalian Educational Information system showed that the lack of
timeliness and accuracy were considered as most serious problems for
the users with the available data. Similar was the case in Nepal,
39

data was not available on time for decision making (USAID, 1989) .
The data in EMIS, NWFP could only be used for past references, not
for decisions regarding next year thus decision makers could have no
idea for the changes that happened during the last year at the time
when planning is in process. The main reasons for the delays were
(i) Questionnaires got back late from the schools due to the
irresponsible attitude of headmasters
(ii)
(iii)
(iv)
Questionnaires stayed in DEO's office for a long time
Time was spent in manual data cleaning and sending back
of many questionnaires for corrections
Time spent on data entry and data cleaning after entry
due to mistakes made by the data entry operators
Analysis and presentation didn't take much time i:E the data
analysts didn't spent much time in data cleaning.
Data 1oss: As in most of the developing countries to reduce the
time spent in data collection and data cleaning, the questionnaire
has lost some of the important data items. It is very important to
reproduce timely and useful information to the decision makers but
it's extremely hard to keep this balance. Reduction of a 11 page
questionnaire in 1992 to a 1 page questionnaire in 1994 was done to
produce only basic data needed for Educational planning which has
caused some important information to be unavailable for decision
makers. Distribution of teachers by professional qualification can
be highly helpful when studying the quality of instruction provided
to the pupils. The questionnaire has become purely quantitative
instead of being open to data useful to improve educational quality.
40

Basic critical data for the education system is provided on time but
detailed data highly desirable for educational planning is no longer
available. There is a need of highly skilled researchers to
facilitate an organized process of getting useful data on time. One
way may be to collect detailed data on a sample rather than the
whole population of schools. This may result in useful data that
represents the primary education system.
41

Chapter 3:
Information usage & ana1ysis:
Psacharopoulos has quoted Oskar Morgenstern for an important
fact about information in a very simple but capturing way. He says
"Information in itself is silent; it is the use to which it is put
that is important" (Psacharopoulos, 1980, p.11). As is the case in
many developing countries in which EMIS is just beginning to take
shape, the most serious limitation to the future sustainability of
EMIS in NWFP is a general lack of understanding among educational
administrators and decision makers of how data generated from a
computerized district-based EMIS may contribute to the improvement
of primary education in NWFP. Attention must now focus on how EMIS
data may be utilized by the educational Administrators, planners,
researchers, and the decision makers to improve educational quality
and efficiency in the schools and in the classrooms where the real
process of education occurs. "The next step in the development of
EMIS in NWFP must be concerned primarily with the link between
having better data about the education system and using these data
more effectively to inform educational practice at the school and
classroom level" (Leblanc, 1993, p.4). This serious problem faced
by many developing countries that was also discussed in the seminar
on data collection in education in Caribbean community, organized by
the Caribbean Community secretariat that " .. useful data are not
always available and available data are not always useful"
(Caribbean Community Secretariat, 1978, p.26). The purpose of
school census is to present a clear picture of an educational
42

system, a big question is then What Information is to be collected.
This depends on many factors including time, cost, effort and
importance of collecting certain data. This will be clear if I
mention the example of breakdowns of enrollment by gender, age,
level and language during the school census 1991 in NWFP. Or
collecting data on each and every item of equipment as a part of
school census. Collecting data on each item of equipment gives very
detailed and specific information about the physical condition of
schools but effects the efficiency of the system as a whole in terms
of the factors stated above. This is a very sensitive and highly
asked question because this makes the basis for questionnaire
length, printing costs, time and effort by head teachers to fill out
the questionnaires, error checking by DEOs & EMIS staff,
computerized database design, data storage, analysis, presentation
and most important that is decision making. Fredricksen states
Bearing in mind the highly diversified character of the educational system in most countries as well as the large variety of uses the statistics are put, it is obvious that any inventory of data needs will be rather extensive. There is no single answer to the question of which data are needed; it all depends on national conditions. Furthermore, the desirability for a comprehensive data base must be weighted against the cost of collecting the data and the capacity of the national administrators and planners to use them effectively for planning and monitoring purposes once they are collected. (Fredriksen, 1983, p.30)
Define planning: To have a clear understanding of what
information is useful in the context of NWFP, one of the
serious flaws in the establishment of an Information system
was that the goals and objectives were not defined clearly
for the purpose of school census. The importance of this
factor can be understood by the definition of planning and
43

decision making that Khateeb Hussain gives in his book
Development of Information systems in education. He
describes planning as:
(i) Setting of overall goals and objectives (ii) Developing substantial plans for pursuing the overall goals and
objectives (iii) Stating overall plans and objectives in terms of subparts and sub
objectives (iv) Assigning weights and priorities to objectives, plans and subplans (v) Stating constraints for the organization apart from the physical
constraints and others to be defined later (vi) Setting standards and levels of performance. These may be
objectives or constraints (vii) Reviewing in the context of changing internally generated
information about the organization, or of information received from external sources concerning the environment and then making necessary changes (Hussain, 1983, p.104)
Information redundancies:
Educational Management Information System in NWFP can be
considered as a big service organization whose goals were precisely
stated as a part of the goals of the Primary Education Development
Program. The goal was primarily to improve access, equity and
equality in Primary education specially for females. The seventeen
page questionnaire that was being distributed in 1991-1992, included
data that was not the first priority for Decision makers. This
resulted in data e.g. equipment by item, teacher distribution by
each and every category of qualification available for a primary
teacher in Education or distribution of pupils by language, which
should have really been the lower priority goals for data
collection. By lower priority data I mean not to exclude a
particular information completely but also to reduce the details
somehow, depending upon how important it is. For example the
distribution of teachers by qualification can be reduced to Primary
44

Teaching Certificate(PTC), Certificate for Teaching(CT) and Pesh-e-
Imam (the head teacher of the mosque) and all other 12-15 categories
can be combined as 'Other'. The above stated categories are the
basic as well as desirable qualifications for a Primary school
teacher. The following table makes it clearer:
Serial Educational Degree Male Female number
1 M.A.
2 M.Sc
3 M.Com.
4 B.A.
5 B.Sc.
6 B.Com.
7 Inter. Arts (F .A.)
8 Inter. Sc. (F.Sc.)
9 Inter C.Com.
10 Inter D.Com.
11 Matric/S.S.C.
12 Middle
13 Less than Middle
14 Fazil Wifaqul Madaris
Similar to this table there were two additional tables
corresponding a piece of information related to Teachers i.e
Teaching posts available broken by Sanctioned, filled (broken by
trained/untrained. And the other was distribution of teachers by
highest professional qualification. In terms of computerized
database for this questionnaire, every indicator meant a separate
45

file or table containing rows and columns of data. Hence considering
the storage, effort for data entry, salaries for staff and time
spent, one needs to be very careful about the cost and benefits of
collecting data for certain efficiency indicators.
The same situation is happening in many developing countries.
A study conducted by IEES on Nepalese EMIS in 1989 exposed some
interesting information. The study indicated that "Not only are
requests made on a personal basis, they are often made at the last
minute, with data being needed immediately. As a result data may
often not be available, and mistakes may be made in the haste to
produce results. There is no systematic process for reporting data
to higher authorities, in part because it is difficult to anticipate
what data will be needed and when it will be needed. As a
consequence, more data may be collected than is needed 'just to be
on the safe side'." (Chapman & Messec, 1989, appendix 1, p.22). I
observed the same circumstances in NWFP, Peshawar. There is a high
need to keep a balance between data that is needed just once and
data that will be needed frequently.
is extremely important.
Proper selection of indicators
Indicator mode11ing (Focussing on Nepal and Botswana) :
Skipping the discussion of various models that can be used in the
development of an Educational Management Information System, we will
derive and quote some of the definitions that came up during
establishment of an EMIS in Botswana and Nepal, as a part of IEES
project.
During the implementation of an EMIS in Botswana, four key
46

terms: indicator, educational efficiency, educational quality and
equity were defined. The project provided several definitions for
each key term but I am stating one for each term (USAID,1992)
INDICATOR
"An Indicator is a statistic about the educational system that reveals something about its performance or health." (Oakes, 1986)
EDUCATIONAL EFFICIENCY
In general terms, "efficiency refers to the state of being productive, capable, and competent. But in the technical sense, it refers academic the relationship between cost and effectiveness." (Hartwell, 1989)
EDUCATIONAL QUALITY
"On the one hand, quality is defined as the embodiment or approximation of characteristics that are socially accepted as proof of excellence. Thus if all teachers in an academic secondary school have Master's degrees, the group will be considered a high quality staff. On the other hand, quality is defined as the proven ability to produce results ... " (Easton, 1989)
EQUITY
"By equity in education, we mean fairness between disguinshible groups in terms of access to participation in, and achievement of the educational system." (Cobbe, 1990)
The choice of educational indicators to be included in an EMIS
47

depends upon the three factors stated above that is Efficiency,
Equity & Equality and then sub-factors e.g. emphasis on increasing
the female literacy rate in case of many developing countries as is
the case in NWFP, Pakistan.
EQUITY:
The most common indicators related to Equity can provide desirable
information like gender wise enrollment, schools but some additional
information e.g. the distribution of trained and untrained teachers
by gender is important to know the pupil/trained or untrained
teacher ratio and then studying it for females particularly. In
case of N.W.F.P. it is easier to get this information as there is
complete segregation in the schools and the female schools have
female teachers only. This can give a more clear picture for equity
reasons, keeping in mind the fact that the main equity issues for
NWFP are gender and locality (i.e. Urban or Rural).
Limitations: There are certain limitations in the current EMIS,
which hinder the collection of complete data to study equity
indicators. The information that current EMIS lacks is the
provision of information from population census regarding total
population of school going children and comparing it with the actual
school going population. Information on female pupils can only be
relevant when compared to the total female population on provincial
level. Similarly the private schools are excluded which causes the
information to be incomplete, not only concerning equity issues but
also the issues like quality and efficiency. Another major drawback
of the current system is the exclusion of Primary students in the
48

secondary schools and collecting information on primary students in
primary schools only. Discussing the results from 1990 school
census, Leblanc states "
had refused to cooperate.
.the headmasters of the secondary schools
This was due to the fact that although
they have primary classes, headmasters were also not accountable to
the Directorate of Primary Education" (Leblanc, 1993, p.9). The
secondary schools data is collected by secondary directorate and is
compiled at the Secretariat EMIS. This causes EMIS for Primary
Directorate to have limited on hand information about the complete
status of Primary Education. The queries made at different times in
a year or the data corrections made at different points in time take
time to be processed. There is not enough data present at Primary
Directorate, regarding primary education to address major equity
issues. The Primary Directorate can have access to this data only
when it's distributed finally by secretariat.
QUALITY:
Educational planners in most countries have generally focussed
their attention on matters concerned with forecasting numbers of
students, teachers, and support staff, and predicting the number and
location of the buildings and equipment like black boards, and
chairs required for education (UNESCO, 1990; Levin, 1988). The
quality of education in the classroom and indicators that best
describe quality has never been given enough thought.
The quality of education is best indicated by indicators that
show the trends in the student performance, classroom interaction,
attendance rates. This data doesn't always need to be collected on
49

a huge population but can be collected on a representative sample.
Preferably, these data can be collected as a part of school census
questionnaire by including questions like total present/absent
students by grade, test scores frequencies on final exams. In
other words assessing the educational quality through quantitative
data, available at the school level.
Limitations: The major limitation on collecting information
relating to quality is the bias in providing the correct information
e.g. reporting of wrong total of absent students by teachers to
cover their weaknesses or the biased attitudes of teachers while
scoring the exams. Similarly questions concerning psychological
constructs being an essential part of studying the quality of data,
are more likely to get biased responses due to the overall corrupt
administrative system in Pakistan. These misleading results are
hard to detect than the numbers involved in data like enrollment, or
number of teachers e.t.c. The data needed are hard to fill out in
terms of time and effort and more susceptible to error which effects
the data quality. In this situation there is a high desire for
accountability on part of headmasters to provide correct data. In
short it is one of the most complex task in the EMIS to collect
quantitative information regarding quality issues.
Efficiency:
During the study done by IEES many interesting definitions came
to the surface, one of them related with efficiency was "Educational
systems need to be efficient both in generating and in expending
resources, and these two objectives are not always perfectly
50
compatible. Educational management information systems specifically
designed to facilitate efficiency analysis is an important first
step toward meeting these needs" (USAID, 1992, p.).
By efficiency I mean here the issue of efficiency within the
information system as well the as the overall education system
itself.
Limitation: Efficiency indicators are usually ratios between
inputs and outputs to a system. They can be analyzed more by
imagination rather that quantitatively e.g. the contribution of
graduates to the per capita income of the country can be guessed
from the figures and is hard to be calculated. Efficiency
indicators are beyond the scope of our school census at this point.
Efficiency within the EMIS means what data can be useful enough
to be worth spending money on data collection. At this point we
should keep in mind the definition of planning that was given above
highlighting the importance of priorities given to various kinds of
data. The desirability for a comprehensive data base must be
weighted against the cost of collecting the data and the capacity of
the national administrators and planners to use them effectively for
planning and monitoring purposes once they are collected. Data can
be divided into two categories Basic & Supplementary data. The
former includes data which are essential for even the most
rudimentary types of educational planning while the latter includes
data which although important, have a somewhat lower priority
(Fredricksen, 1983) . As explained before in the section for
information redundancies the questionnaire for school census needs
51

many changes to avoid wastage of time, effort and money but this
doesn't mean that data related to important issues like equity be
ignored. Some breakdowns of data are important to highlight such
issues. For example excluding data by age completely can better be
replaced by increasing the age intervals to reduce the effort of
filling out the age wise enrollment. Age wise enrollment can expose
many facts about why children of particular age are deprived of
primary schooling or why thousands of 10 year olds are in first
grade while they should be in third grade.
Some Useful Information (problems/recommendations) The basic data
would normally constitute the major part of the information
collected through the annual school census (Fredrickson, 1983)
Some rates and ratios should be an essential part of the information
provided by an EMIS. Their importance has been no where emphasized
in the reports sent to the various administrative levels in NWFP
school system. A short description of their role in primary
education if displayed clearly for the administrators, they are more
likely to take interest in a true and honest data collection
process. As was discussed in the questionnaire design the head
masters and district education officers should be made aware of the
circumstances that can occur by misreporting of these rates and
ratios. This can be done by compiling an yearly manual associated
with the questionnaire and also discussing them in the meetings so
that every body goes through the manual at least once. Here are
some examples of few important indicators which need information
that is currently unavailable to the data analysts and decision
52

makers:
Enro11ment ratios: Enrollment ratios are the most commonly
used indicator for assessing a country's enrolment coverage at a
particular level of education. There are two types of enrolment
ratios 1) Leve1 enro1ment ratios which are in turn distinguished
into a: gross level enrolment ratio which relates total enrolment to
the population which should be enrolled at this level
GERP = Total enrolment in primary education Total number of primary aged children
and b: Net level enrolment ratio which relates total primary aged
enrolment to the population which should be enrolled at this level
NERP = Total primary aged enrolment in primary education Total number of primary aged children
In Pakistan where age policy is not strictly followed, these ratios
differ significantly from each other. The greater the differences,
the greater are the late entrants, repeaters and dropouts because
number of children outside primary age at a particular level is
larger. They are very good measures of pointing out the flaws. The
second type is 2) Age specific enro1ment ratios which relate the
enrolment of a given age or age group in a given year to the
population of the same age in that year
ASER = Number of pupils aged x years Total number of children aged x years
where x is the age or age group concerned. Due to the efforts
involved in the filling of age grade matrix, I would recommend the
distribution of ages into 3 groups i.e <=4, 5-10, and >=11.
Enroiment Projections: Enrolment projection is a technique to
53

predict the future enrolment and other factors related to it, in a
school system over several years. The EMIS in NWFP, Pakistan has
been involved in data cleaning and data management so deeply that we
did not pay enough attention to develop ways to better use the
information provided. Formal presentation of Enrolment projection
is one of those most important ways of Educational planning that
have been missing from the current EMIS. Since the time spent on
data cleaning has been considerably reduced, now it's time to employ
some new efforts to improve planning procedures. In case of
developed countries, it is appropriate to use grade-persistence
method (Jaffe,1969) which starts with the birth rates and studies
the net survival rate from one grade to another and pointing out the
effects of migration, dropouts, repeaters and pupils who skip the
grades. But in case of developing countries where births are not
even registered all the time, the appropriate way is to start from
the lowest grade i.e "kachi" and apply some kind of transition rate
to guess the future years' enrollments.
and useful model for this purpose.
54
Chapter 5 suggests a simple

Chapter 4
Statements and recommendations for database management
and presentation (technica1 issues inc1uded)
After the process of data collection, the processes of data
storage, analysis using computer software, data management and
presentation begin. This chapter also discusses various software
that can be used for data analysis and best suited for our
situation. Also the issues of data storage and security will be
discussed. The chapter then ends with some data presentation
examples and techniques.
What is a database: In order to explain the concept of
database, first we'll have to understand some basic concepts of data
management. Data can be stored in a Computer in two ways: F1at Fi1e
Management System or Database management System (Szymansky et al.,
1991). A file is composed of related records and a record is
composed of related fie1ds.
presented like this:
For example a student file can be
Fields
ID # I Lname I FName I Street I City I State
123453 Garnet John 312 T-Angle Jimfield MD
123454 Diamond Neil 54 Square Kimfield MD
where the associated data corresponding to each student # makes a
record
A F1at fi1e is a file that has no relationship with the data in the
other files. The software that manages the storage, access,
updation and retrieval of data in Flat files is called Fi1e-
55

Management system.
A Tabl.e is equivalent to a file but instead of Fields and Records, a
table has rows and columns of data.
An Object contains both data and methods that act on the data.
A Database is a collection of related and cross referenced data,
created to minimize repetition and data redundancy. The data stored
in a data base can be stored in three forms files, tables or
objects. The software that manages the storage, access, updation
and retrieval of data in a database is called Database Management
System. A Database Management System can access and link multiple
files, tables or objects easily when needed (Szymansky et al.,
1991) .
The Database Management System being used in EMIS, NWFP is a
software called R-Base which is a relational database i.e records
from different tables can be combined on a key or keys. The main
reason for using R-Base as a DBMS in EMIS, NWFP is its ease of
learning. Later in this chapter some facts related with DBMSs will
be discussed.
Data Management in EMIS, NWFP: The data in the questionnaires that
are being received from Primary schools are eventually entered by
Data Entry Operators in the Computerized database that has already
being created in R-Base. Each data entry Operator enters data from
a certain number of questionnaires which are combined by the end of
the day. After the introduction of Local Area network in 1993, this
task has become relatively easier. At the end of the day, several
data cleaning procedures are run on the data to limit the number of
56

errors. For example there is a program that limits responses to
school gender to be '1' for male and '2' for female. If any other
number is entered in this field (Schgndr), then the computer beeps.
Such checks are called Sequentia1 checks. It is better to run as
many checks as possible to ensure the validity of data.
Data F1ow: In the central EMIS, where all of the data entry used to
take place has become some what different since 1993. Instead to
data being entered in Central EMIS, data is being entered in the
District EMISs and forwarded to Directorate in the form of diskettes
where they are compiled and analyzed for the decision makers. The
main compilation, analysis and presentation is therefore still the
task of directorate EMIS. The only difference is that the
questionnaires after being checked by the DEOs are not returned to
the Directorate EMIS but entered directly at the district level.
The database structure and all the procedures at the district level
are the same as the Directorate EMIS. The different checks and
cleaning procedures are also the same.
Limitations in data entry: The general carelessness at their jobs
on part of the people in Pakistani Society, can be seen in the data
entry process that takes place in EMIS, NWFP. Their are lot of data
entry errors that easily corrupt the figures, thus reporting wrong
data to the decision makers. Leblanc emphasized the same point by
stating
For example, if EMIS data suggest that the student-teacher ratio in a school system is acceptable but that teacher qualifications are low, then an Education decision maker might choose to concentrate resources on improving the quality and duration of teacher training. On the other hand, if EMIS data suggest the opposite ( that the student-teacher ratio is unacceptably high and that teacher qualifications are adequate), then the policy maker may elect to shift resources to increase the number of
57

available classrooms. In such a situation, if the data are invalid or unreliable, then the policy maker's action could prove detrimental to the effective functioning of the education system. (Leblanc, 1994, p.2).
My personal experience tells me that the most serious errors
are usually not the ones that are made by the head teachers while
filling the questionnaires but the data entry errors. A single
wrong key stroke can make '32' to '132' or '0' to '10' These
errors are usually very difficult to find. Discussing the
possibility of various kinds of errors during his study, Kendall
stated ignorance of the point where error occurred to be a serious
problem, he says "An unavoidable error (for example, in obtaining
exact ages) may have small effect on the result, but if it is not
known where it is or what it is, the whole mass of statistics
concerned becomes suspect". (Kendall, 1968, p.39). Comparing each
questionnaire with the data entered to find any possible wrong entry
is a very tedious and time consuming task and needs close attention.
There is obviously a lack of appropriate measures that can be taken
to prevent this from happening, this is also discussed below.
Lack of checks: In order to preserve data accuracy, it is very
crucial to build procedures that cross check or limit data items.
There can be two types of such checks (i) Built-in checks in
computerized database and (ii) Built-in checks in the questionnaire
itself. They are discussed below:
(i) Built-in checks in computerized database: These are pre-
programmed logic checks that can be constructed, even in the most
basic Database Management Systems to monitor the data entry in "real
58

time". These checks may be as simple as to check for basic range of
certain items or complex as checking for the correct combination of
codes (UNESCO, 1990) This allows detection of wrong data as soon
as they are entered, thus warning the data entry operator of some
kind of ambiguity, that occurred, either due to their mistake or due
to the improper questionnaire fill outs. There are data cleaning
procedures that are run at the end of the day in the current EMIS
that detect certain errors like checking for range of codes entered
for school gender or school level or even building condition (while
the same errors can be detected at the time of the entry) . Thus
reducing the effort of running extra procedures. An example in
computer language of such checks is given as follows:
SELECT SCHOOL CODES WHERE RESPONSE TO BUILDING CONDITION IS NOT IN
THE RANGE OF 1 and 6
( where 1= Without building 2= No need for repairs 3= Minor repairs needed 4= Major repairs needed 5= Change of a part is needed 6= Complete change is needed
This check will give a list of schools where a wrong code was
entered which was not in the range of 1 and 6. The question is then
what happens if 5 is entered when it should have been 2 as the
correct response where both these numbers are in the right range.
There is no exact solution for this problem unless very careful
cross referencing is done inside the questionnaire itself which is
discussed below.
(ii) Built-in checks in the questionnaire itself: There is also
59

lack of checks in the current questionnaire design so that erroneous
data can be detected easily before being entered into the computer.
There is no way of checking currently whether the enrollment or
number of repeaters are entered correctly on the questionnaire or in
the computer by the data entry operator. This can also be
considered as a flaw in the questionnaire design itself. There is
obviously a serious deficiency of cross referencing when it comes to
filling the numbers in response to several questions. The only
cross reference is one in the various codes i.e
SCHOOL CODE DISTRICT CODE + SUBDISTRICT CODE + GENDER CODE +
LOCALITY CODE + SCHOOL LEVEL CODE + SCHOOL
ADMINISTRATION CODE + SCHOOL IDENTIFICATION NUMBER
The school code that is being entered by the SDEO is a
combination of all the codes listed above and can be cross
referenced easily at the time of data cleaning. But there is no
such cross referencing for questions which need numbers or questions
such as condition of buildings. Lack of validation or "double
punching" can easily be recognized due to the frequencies of errors
that occur in these figures without any warning signal to the data
entry operator of a wrong entry by him, or on the questionnaire
itself (UNESCO, 1990) .
Outdated techno1ogy, some recommendations: Signs of outdated
technology are starting to appear in various parts of the EMIS, NWFP
e.g.
Data Storage: Since the EMIS has been running for the last 4
years, there are large amounts of data that need to be stored. Data
60

from more tha~ 17,000 schools need a large storage space. Diskettes
of 1.44 Mb each can store data from only a small section of the
database which can become as large as 50 Mb or even more. There is
a high need for more modern ways of data storage for example CD-ROM
technology which has a very large disk space available for data
storage and can store even a number of such databases on one disk.
Operating System: The Disk Operating System (DOS) environment
is becoming outdated in most of the developed countries and is
rapidly growing in developing countries. Very soon, DOS environment
will be limited to organizations where old computers are in use or
are short of finances. Currently the EMIS, NWFP is running under
the funding provided by World Bank and they are in a position of
updating the software in use. The power of 386 computers that have
been installed in most of the sections of EMIS can best be utilized
with the introduction of Window based environment and introducing
the use of Mouse to control the commands. This will also require
installation of a window based version of the database software.
The installation of such software is a week's project and will need
one session of training to familiarize the administrators to the
window based environment. According to my personal experience
window based environment will be easier to learn for the current
staff of EMIS than was DOS based environment due to the visual
selection of commands offered in the menus and an interesting skill
to learn better than merely memorizing and typing the commands.
Microsoft Windows has introduced support for all kinds of software
related with word processing, spreadsheet modelling as well as
61

networking thus making the Local Area Networking that currently
exists in the central EMIS cell of NWFP, extremely simple.
Microsoft Windows for workgroups is an update in Window revolution
which supports peer to peer networking and it's easy to install as
well as gets high marks for memory usage (PCComputing-Special Awards
issue, December 1992) .
Database software: Currently the software used for the whole
database structure for EMIS, NWFP is a relational database called R-
base. The version currently running is RBase3.1 for DOS, which
needs to be updated with a more efficient software to manage a large
database like the one we have every year. As mentioned before, the
only reason we selected the software was its ease of learning, due
to it's simple data entry forms and also the ease of creating tables
instead of files as in the case of dbase and other database
packages. The emphasis was on the ease of learning since the staff
was not very familiar with computers and most of the training was
in-service. But currently as the staff hired for the data entry as
well as other tasks is either the people who already are used to the
system or the new people who are hired with such skills. It is the
time now to think about the advancements in the database software
that has some other important features e.g speedy transaction
processing or comprehensive reporting systems e.t.c. A.
comprehensive study was conducted in September 1992 by the
researchers employed by the world famous InfoWorld magazine for
Computer advancements titled "Database tria1s" which tested some
database software. The study produced some very interesting results
62

after testing the researchers' and vendors' code (Infoworld-
Reviews/Product Comparison, September 1992) A detailed discussion
of the results is out of the scope of this paper but below is a
summary table that was the most interesting and comprehensive piece
of information from a user's perspective. Though there are new
versions of the same software in market by now, there have been
fewer variations in their level of performance. (The Database
software in windows environment are following almost the same
pattern of success as they have been following while running under
DOS environment) .
Performance wts ~as.e~~ n1 f,qxP.r_cz_., n Parcis!S?X,i n 5!?Jl~~- ,j (\
- 7c:; ..., ___ ,... __ _, - .. --
7t:; ~ "-- ----' \/,,.... ....................... ..., ___
- - -')t:; r:::---' "-- ----' ,... __ _, ..., ___
, -Ann 1 ')t:; \/on ___ ,., - .. \/on ___ ,.i ,.._ __ _,
- . --.-.... -.&.:-- . "" '"'---' "-- -- ..J
,... __ _, "-- ___ _, . - -, __ ,_ 7t:; "--
___ _, - .. "-- ___ ... ,.. __ ... - - -- , __ ,_
7t:; "-- ----' "-- ___ _, "-- ___ _, "-- ___ _, - - . -
·--·- c:;n \! ........ ............... .....1 - - "'---,.! -C"--· ... : .... t:;(l - .. o--- - .. "-- ___ _,
. . -rl-·- :-'----: .... t:;(l - ,.._ __ _, "-- ___ _,
- . -n--· t:;(l "-- ___ _, - ,, __ ----' ,... __ _,
-c:~~o nf lo~--;-- c;n "'---"'
,.,_ __ ,., ,.,_ __ ,., "-- ___ _, - . -
"'--- -1 ·-- t:;(l ,.... __ _,
r:::---' ,..._ __ _, - ..
c:: ........ 1 C' ................... ,,.. t:;(l (:. c:; 7 ') 7 ') (:. 1
lnfoWorld reviews on~ finishedbor~ductior:i.1 versions of oroducts'r.neve.i:. beta test versionsb Prorlucts receive ratLn~s r-n~in trom. naccqrxta re o excellent in various catego 1es. ~cores are aenvea y multiplying tne
le1a1
11ina n
1cn enon its ra ina wnere;
xce em,- - ta 011 1 a11 r ar . . .. ervfag8o - . -~_.,eePs llffltesse2ftar crner.1a and offers s1anif1cant advantages oto' - - ·~ essen 1a1 en enaana inc1uaes some spec1a1 features a 1s ac y-
1 - eets essent1a pmena
oor=U. - a s rt e nua are s . . . naccep ab e or ~=d.ro- F1Tis ~o me~ minimum standards or lacks this feature
~gPJv.Jo~~ §Je~t~ffi~e9i~ig,e~9tgvz)~ 00, and rounded down to one decimal place to yield the final score
Statisticai Software:
Presentation Software:
Processing & Analysis of data: After the data has been entered for
63

all the questionnaires time comes to process the data. The data
analysis stage mainly consists of creating useful summaries of data
that have been cleaned and ready to use. As in many other
developing countries, the processing for the EMIS data in EMIS, NWFP
is suffering from the problem of 1ack of trained personne1 who can
carry out the analysis of the data available. In her review of the
quality of the overall Educational Management Information Systems in
India, Kiran Dhingra states " .. extremely limited use is made of the
available information. One very real problem is the unavailability
of raw data. Only the block office has the raw data, but it has
only one statistical assistant, and he is kept more than busy in
aggregating and compiling data, and in wondering where to stack his
fast-multiplying piles of returns, to spare any time for the
sophistication of data use" (Dhingra, 1991, p.13). During the
first two school census conducted by EMIS, NWFP, the data analyst
who was hired for the purpose of producing useful analysis of data
spent almost all of his time in data cleaning and there was no time
for the training of the analyst in different procedures of data
analysis using various indicators of efficiency and data models.
Very basic analysis was produced with an inaccurate set of data with
absolutely no level of confidence. Uptil now there has been s
serious lack of trained personal who are aware of the Educational
statistics and better ways of presenting them using statistical,
database and spreadsheet software.
One another problem that needs to be addressed at this point is
the dependence of EMIS staff too much on the Computer technology.
64

Since computer is a very new and advanced system of data maintenance
for the currently developing education system in NWFP where not
every body has access to the Computers, EMIS staff has a tendency of
believing Computers to be the solution of every problem. The
standardized reports that have been set to produce specific data
e.g. enrollment totals district wise, broken down by gender is a
standard report and can be run every time for a new data base. A
single misplacement of a breakpoint can cause the whole set of
results to be totally wrong.
The best way to deal with this problem can be to select some of
the data and do some calculations by hand to verify the results.
Presentation of information (prob1ems/reconunendations) :
One of the flaws in the current computerized database
management system in EMIS, NWFP, is the weak data retrieval
capabilities.
Data Access: The data is being stored in the database tables
and can be accessed by people working at EMIS at any time, they
want, meaning that there is absolutely no data security provided.
The table names not always correspond to the data stored in them, it
is up to different people's ability to guess which data is stored
where e.g. table name 'Mage' corresponds to enrollment by age, which
is not clear to people unless there is some documentation available.
There is a clear need of a system of menu screens which can lead to
different options regarding data who have authorization to access
the data. The data once entered should not be available to be
changed by every other individual who is working with the system.
65

One of the recommendations is to have an organized menu system that
can only be accessed by people having their own passwords for data
access. An example of this would be that an option of running
certain report only needs to be available to data analysts because
different reports take different lengths of time to run, and if
somebody approaches a computer and runs a report that rE~quires
calculation of enrollment broken down by district, tehsil and school
level, it will take more than three hours to run for 18,000 primary
schools. Also the final results of the reports must be available to
majority of administrators but no body should be able to change the
results. One of the available computers can be designated just for
the purpose of browsing and printing the desired results. For the
reports that can only be created in a spreadsheet with graphs
attached to them, can be invoked by the menu options. Since linking
of software needs extra processing time, thus the computer dedicated
for these purposes should ideally have a high memory as well as high
processing speed.
Wide Data Dissemination: Presentation of data should not be
limited to the top level decision makers but also Head teachers and
SDEOs should be involved in the process. During a study conducted
by IEES in 1994 of the EMIS in Botswana, the researchers found out
that providing statistical information to the school and district
level has resulted in higher cooperation and organization on part of
administrators at these levels (USAID, 1994) .
An important point to keep in mind at this point is the
hierarchy considerations involved in the data dissemination. The
66

district education offices should be more involved in providing
detailed data at school level while the central EMIS should focus on
district level data and less focus should be on providing school
wise data. Due to time considerations and the nature of their jobs
and decision making requirements, administrators at different levels
need varying amount of information. Khateeb Hussain describes this
fact in his book Development of information systems in education as
Top administrators are of course, interested in all levels of institutional operations, but because of human limitations they cannot control all levels of organization. They should, however, be informed, and receive selected information concerning 'exceptions' ... In addition to exceptional information, top administrators must be given summarized operational information as well as statistical aggregate information This information must be both current and longitudinal (Hussain, 1973, p.112-113).
Thus Central EMIS should spent much more time on producing
concentrated but detailed information about the current information
system.
67

Chapter 5
Recommendations
As discussed in the previous chapters, the Education Management
Information Stem has many steps that need improvement. As I
mentioned before in the earlier chapters, the mail questionnaire
currently used is one of those steps involved. The most crucial
point is to maintain a balance between the amount of data needed,
amount of data obtainable at a certain cost with a certain accuracy,
ease of data storage, entry and retrieval. Omission of certain
questionnaire elements should not result in missing information.
Keeping these issues and some format considerations in mind, I have
arrived at the following questionnaire design:
Dear Headteacher and District education officer,
This questionnaire will be used to assess the current situation of primary education in our province. Your response can make a lot of contribution to the status of education for our children. Please be very careful about the accuracy of your answer to a question. Each questionnaire will be checked by the DEO for the accuracy and a small contribution for every correctly answered questionnaire will be made to the Cancer hospital to help patients fight for their lives. (Continued negligence in the fill outs of the questionnaire can seriously effect the Annual Confidential Reports of the staff involved at every level of data collection process) .
Signature of head teacher (after filling the questionnaire out)
Signature of DEO (after checking the data)
68

1. SCHOOL CODE (To be entered by SDEO)
2. SCHOOL NAME
3. DISTRICT NAME
3a. DISTRICT CODE (Codes are at the end of the questionnaire)
CD 4. DISTRICT NAME
4a. TEHSIL CODE (Codes are at the end of the questionnaire)
D 5. What is the gender of your school, please check one
(1) Male (2) Female
6. What is the locality of your school, please check one
(1) Urban (2) Rural
7. What is the level of your school,please check one
(1) Government Girls Primary School
(2) Government Primary School
(3) Government Girls Middle School
(4) Government Middle School
(5) Government Girls High School
(6) Government High School
(7) Govt. Higher Secondary School
69

(8) Govt. Girls Higher Sec. School
(9) Govt. Masjid Primary School
(10) Govt. Maktab/Elementary School
(11) Muhalla School
8. Total number of teachers in your school
9. Total number of students in your school
10. Total number of classrooms in your school
11. Are there repairs needed, check the right response
( 1) Yes (2) No
(3) No building at all
(If you answer 'Yes' to 11. please answer lla otherwise skip lla)
lla. The repairs are requested by the head teacher, when did you request the repair, please enter the exact date
==========~ .DArA
12. Please enter the enrollment in the given age range
AGE NUMBER - - - - - - - - - - - - - - - - - - - - - - - - - - - - - - - - - - - - - - - - - - - ---------------------------------------------- - - - - - - - - - - - - - - - - - - - - - - - - - - - - - - - - - - - - - - - - - - -
a. Less than or equal to 4yrs (<=4)
b. 5 yrs to 10 yrs (5-10)
c. More than or equal to 11yrs (>=11)
13. Please enter the enrollment in a particular class
70

CLASS NUMBER
a. Kachi
b. Pakki
c. 2
d. 3
e. 4
f. 5
14. Please write down the number of teachers for each category
(1) Trained (2) Untrained
15. Please write down the number of teachers according to their academic qualifications
QUALIFICATION NUMBER
a. P.T.C.
b. C.T.
c. Mual.l.im
d. Other
16. Please state any additional comments, if any (e.g. if your school is male school and there is some female enrollment or vice versa, enter it as a comment)
71

17. Did you have any problem in filling out this questionnaire, please check on the right response
(1) Yes (2) No
(If you answer 'yes' to 16, please respond to 17a, otherwise skip 17a)
17a. Please indicate the nature of the problem, you can also check on more than one response
a. Data not available at that time b. The questions were unclear c. There was not enough time given d. Questions needed calculations e. The questionnaire was too long f. The questionnaire should have
more questions (i.e. more data)
As discussed in the previous chapter, the current EMIS, needs
an organized data access menu system. Following is a series of
recommended Menu screens, the idea for which is extracted from the
IEES report for the similar kind of presentation used in Botswana,
Education Management Information System (USAID, 1994) and can be
created in any Database Management System:
MAIN MENU: DIRECTORATE OF PRIMARY EDUCATION, NWFP
PLEASE CHOOSE ONE OPTION
1. Browse Raw data for Primary schools 2. Generate/run reports for Primary indicators 3. Browse/print report results for Primary indicators 4. Run data cleaning applications 5. Run Backup applications 6. Equal Opportunity 7. Exit
Option 1 is basically browsing of different database files/tables containing data as entered by the data entry operators. Below, I will present some sample menus related option 3, which will be
72

directly used by the decision makers.
MENU 3: PRIMARY INDICATORS
PLEASE CHOOSE ONE OPTION
1. Resource Management 2. Student Information 3. Teacher Information 4. Equal Opportunity 5. Transition Model 6. Exit
3.1 RESOURCE MANAGEMENT
PLEASE CHOOSE ONE OPTION
1. Provincial Information 2. District wise Information 3. Tehsil wise Information 4. Exit
This menu will be true for each option in menu 3 except 4. equal opportunity which will be district and tehsil aggregates. The district and tehsil wise information will be in the same format as the following provincial information samples.
73
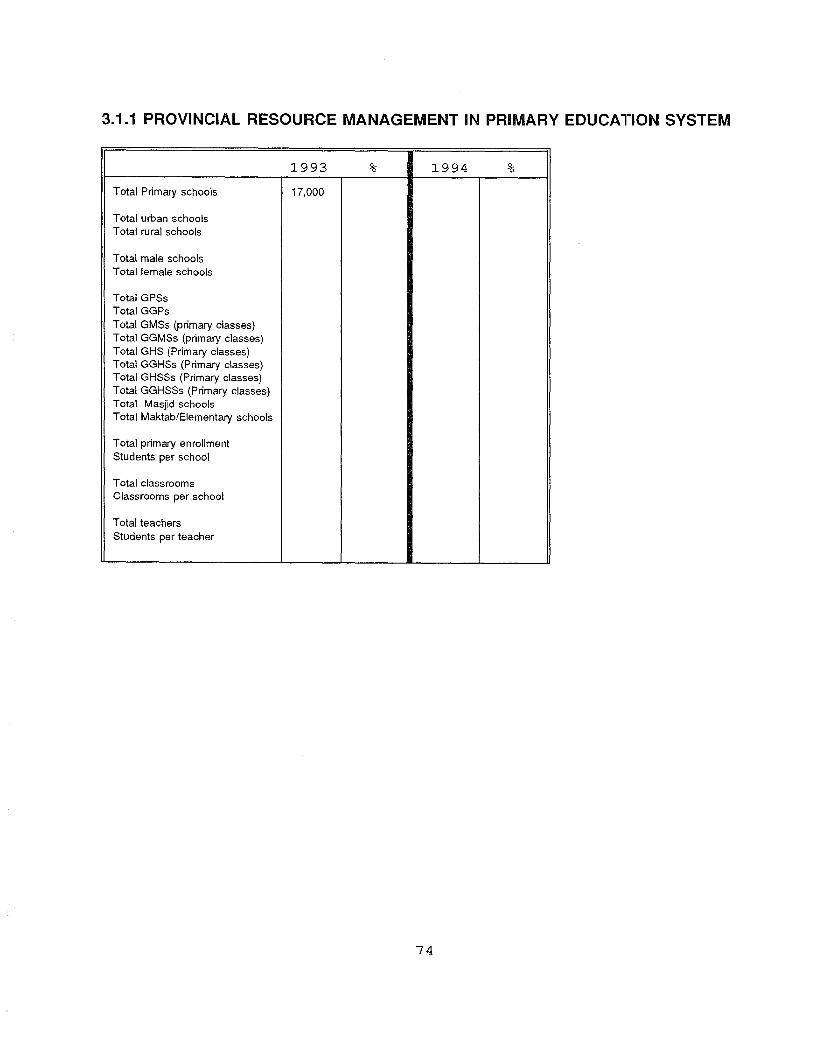
3.1.1 PROVINCIAL RESOURCE MANAGEMENT IN PRIMARY EDUCATION SYSTEM
1993 % 1994 %
Total Primary schools 17,000
Total urban schools Total rural schools
Total male schools Total female schools
Total GPSs Total GGPs Total GMSs (primary classes) Total GGMSs (primary classes) Total GHS (Primary classes) Total GGHSs (Primary classes) Total GHSSs (Primary classes) Total GGHSSs (Primary classes) Total Masjid schools Total Maktab/Elementary schools
Total primary enrollment Students per school
Total classrooms Classrooms per school
Total teachers Students per teacher
74

3.2.1. PROVINCIAL STUDENT INFORMATION IN PRIMARY SCHOOL SYSTEM
1993 % 1994 %
Total Primary enrollment 17,000
Total urban enrollment Total rural enrollment
Total male enrollment Total female enrollment
Total repeaters Total male repeaters Total female repeaters Total urban repeaters Total rural repeaters
Total dropouts Total male dropouts Total female dropouts Total urban dropouts Total rural dropouts
Net enrollment ratio Gross enrollment ratio
3.3.1. PROVINCIAL TEACHER INFORMATION IN PRIMARY SCHOOL SYSTEM
1993 % 1994 %
Total Primary teachers 17,000
Total urban teachers Total rural teachers
Total male teachers Total female teachers
Total PTC teachers Total CT teachers Total Muallims Total teachers with other qualifications
75

3.4.1. ENROLLMENT BROKEN BY LOCALITY, DISTRICT, TEHSIL AND GENDER
RURAL u R B A N
D T M % F O/o T O/o M O/o F O/o T O/o I E A E 0 A E 0 s H L M T L M T T s E A A E A A R I L L L L I L E E c s T s
3.6.1. TRANSITION MODEL
(to be included)
All the above mentioned outputs can be made more elaborate,
with attached graphics and charts. These can also be transferred
to Presentation software like PowerPoint and similar software for
structured presentations. The next section will discuss a
different but important issue i.e Sampling
Proposed Samp1ing: Sampling of schools for pilot testing of
the questionnaires as well as to participate in the preparation and
evaluation of questionnaires and also for the validation of
collected data, plays a crucial role in the data collection
process. Defective sampling can lead to ambiguous and false
conclusions, therefore the next paragraphs will suggest a way of
sampling that can result in a comparatively precise representation
of the population of schools in NWFP.
76

Since NWFP is composed of a variety of developed, moderately
developed and rural localities with schools divided into levels and
also gender within those levels thus complete random sampling can
be risky i.e deprivation of a particular class of schools can occur
extensively. In such a case a technique called Stratif.ied random
sampJ..ing can be helpful to reduce the initial differences among the
groups. Where Simple random sampling is purely a random selection
of sample elements, stratified random sample divides population
into separate categories or 'strata' and leads to an independent
selection of sub-samples from each of those strata (Butcher, 1966)
The stratified random sampling can be divided into two
categories, proportionate i.e proportion of elements pE~r stratum is
the same as proportion of that stratum in the population and
disproportionate i.e. over-representation of certain strata due to
particular needs. Disproportionate random sampling with one
variable is considered to be the safe and simple method employed in
the real world especially in the absence of experienced and well
trained researchers. In order to avoid multivariable
stratification, some assumptions have to be made before sampling,
An example is given below:
1) Each district is included regardless of weighting
2) Each district is divided into two localities, rural and
urban regardless of which Tehsil, they fall into. Even
though the number of urban schools is higher than rural schools,
due to the nature of differences that exist in educational
standards of rural and urban, enough thought should be given while
77

deciding on the assigned weights.
upon size is then selected.
A stratified sample of an agreed
Depending upon the resources involved, another stratified
random sample of smaller size can be selected where first
assumption remains the same and stratification is done on the basis
of another variable i.e the level of schools where Maktab and
Mosque schools get higher weighting.
Although the sampling can be made much more focussed and
sophisticated but it can lead to complicated calculations of sample
means and standard deviations for the purpose of assessing the
nature of sample selected and comparisons of the results obtained.
As mentioned before, a detailed discussion of sampling
procedures and statistical analyses is a vast field of Statistics
and is out of the scope of this purpose. The purpose was to
suggest some alternative ideas that can be thought of, for the
improvement of the quality of information produced.
78

APPENDIX 1:
EDUCATION MANAGEMENT INFORMATION SYSTEM UPDATE QUESTIONNAIRE FOR
PRIMARY SCHOOL ACADEMIC YEAR 1991 - 92
1. Name of the School (capital letters)
2. Code Number of the School
The information given in the questionnaires is correct to my Knowledge and it reflects all the record till the 15th October 1991.
3. Name of the Head Teacher (capital letters)
4. Signature
5. Signature of DEO/SDEO
6. Date of receipt
DIRECTORATE OF PRIMARY EDUCATION GOVERNMENT OF N.W.F.P.
Sector B 1/25 Phase 5 Hayatabad PESHAWAR (N.W.F.P.)
PHONE Nos. 812303/812072
CODE NUMBERS OF DISTRICTS AND TEHSILS HAVE BEEN GIVEN J:N THE TABLE
i

AT THE BEGINNING OF THE QUESTIONNAIRE
7. Code Number of the District
8. Name of the District
9. Code Number of the Tehsil
lO. Name of the Tehsil
11. Under whose jurisdiction does this institution lay? Please write the name.
S.No.
1 Union Council/Ward
2 Municipal Committee/Corporation
3 Town Committee
4 Cantonment Board
12. Has this school a branch? 0 No 1 = Yes
13. Is there any other school within the boundary of this school? 0 No 1 = Yes
14. School Gender 1 Male 2 Female 3 Coeducation
15. School Level 1 Primary 2 Maktab 3 Mosque 4 Middle 5 Secondary 6 High Secondary 7 Government Darul- uloom
ii
Name

Note: Masjid School (Mosque School) is an institution where the Pesh-Imam gets Rs 150/- as monthly honorarium. Moreover a PTC teacher works in this school. A Maktab/Elementary school is an institution where the Pesh-Imam/teacher works at BPS 5.
16. School Administration 1 Provincial government 2 Federal government 3 Cantonment Board 4 Semi-Official Independent Institutions
(University, WAPDA, T&T, Bank etc.) 5 Local government 6 Board of Governors 7 Other Please indicate
17. Ownership of Building 1 Provincial Government 2 Federal Government 3 private on rent 4 Private without rent 5 Muslim Auqaf on rent 6 Muslim Auqaf without rent 7 Local Government 8 Evacuee's property on rent 9 Evacuee's property without rent 10 Evacuee's Auqaf on rent 11 Evacuee's Auqaf without rent 12 Other -- please indicate
18. Building's Present Condition 1 Without Building 2 No need for repairs 3 Minor repairs needed 4 major repairs needed 5 Change of a part is needed 6 Complete Change is needed
19. Which language of the following is the official medium of instruction of the school? 1 Urdu 2 Pashto 3 English
20. Which other language among the following is used as medium of instruction in your institution? 1 Urdu 2 Pashto 3 Hindko 4 Saraiki 5 Khowar/Chitrali
iii

6 Kohistani 7 Persian 8 Other
21. Age-wise Total Number of Admitted Boys
Age Non-Admitted Ka chi Pakki 2 3
3
4
5
6
7
8
9
10
11
12
13
22. Age-wise Total Number of Admitted Girls
Age Non-Admitted Ka chi Pakki 2 3
3
4
5
6
7
8
9
10
11
12
13
iv
4 5
4 5

23. Total Strength/Number of Boys Admitted as well as Repeaters and Newly Admitted in the class
S.N Class Ka chi Pakki 2 3 4 5 o.
1
2
3
24. Total Strength/Number of Girls Admitted as well as Repeaters and Newly Admitted in the class
S.No. Class Ka chi Pakki 2 3 4 5
1
2
3
25. Class-wise Strength of Fresh (New) Boys Admitted
S.No Class Ka chi
I
Pakki
I
2
I
3 F4 I
5
Fresh admission
v
I

26. Class-wise Strength of Fresh (New) Boys Admitted
S.No Class Ka chi
I
Pakki
I
2
Fresh admission
27. Number of Sections in a class
S.No. No. of sections where
1 Teaching is done in the classroom
2 Teaching is done outside the c/room
3 Total Sections
28. Number of classes being taught in one classroom
29.
(For Primary classes), please indicate with "X" the classes being taught in ne classroom.
Total Number of rooms
Ka chi Pakki
Class Room Ka chi
Vl
I
3 E 2 3
Pakki 2
Ka cha
Pakka
I
5
I
4 5
3 4 5
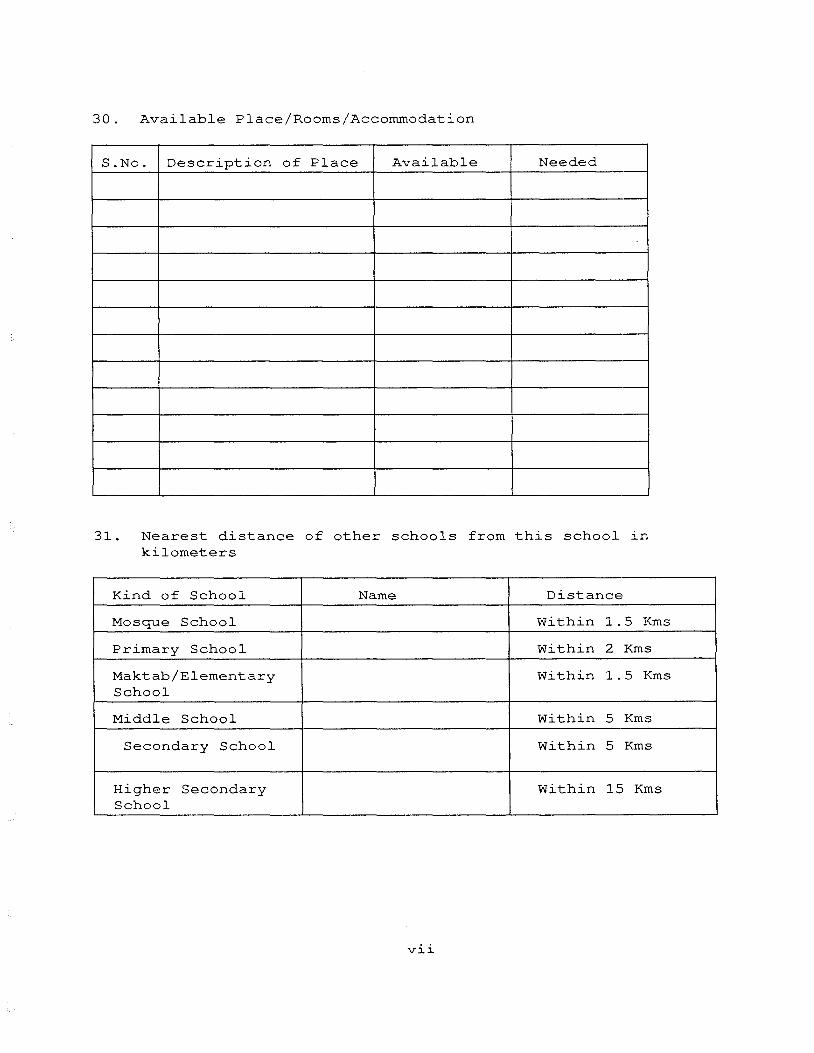
30. Available Place/Rooms/Accommodation
S.No. Description of Place Available Needed
31. Nearest distance of other schools from this school in kilometers
Kind of School Name Distance
Mosque School Within 1. 5 Kms
Primary School Within 2 Kms
Maktab/Elementary Within 1. 5 Kms School
Middle School Within 5 Kms
Secondary School Within 5 Kms
Higher Secondary Within 15 Kms School
vii
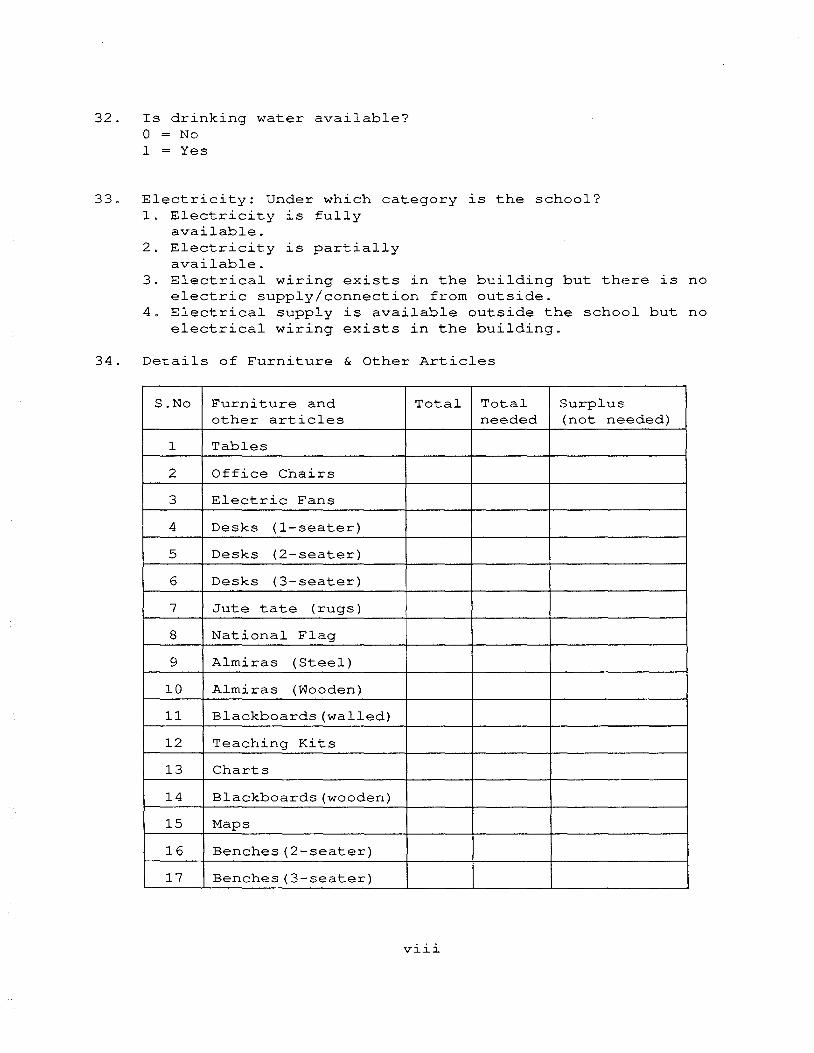
32. Is drinking water available? 0 No 1 = Yes
33. Electricity: Under which category is the school? 1. Electricity is fully
available. 2. Electricity is partially
available. 3. Electrical wiring exists in the building but there is no
electric supply/connection from outside. 4. Electrical supply is available outside the school but no
electrical wiring exists in the building.
34. Details of Furniture & Other Articles
S.No Furniture and Total Total Surplus other articles needed (not needed)
1 Tables
2 Office Chairs
3 Electric Fans
4 Desks ( 1-seater)
5 Desks (2-seater)
6 Desks (3-seater)
7 Jute tate (rugs)
8 National Flag
9 Almiras (Steel)
10 Almiras (Wooden)
11 Blackboards(walled)
12 Teaching Kits
13 Charts
14 Blackboards(wooden)
15 Maps
16 Benches(2-seater)
17 Benches(3-seater)
viii
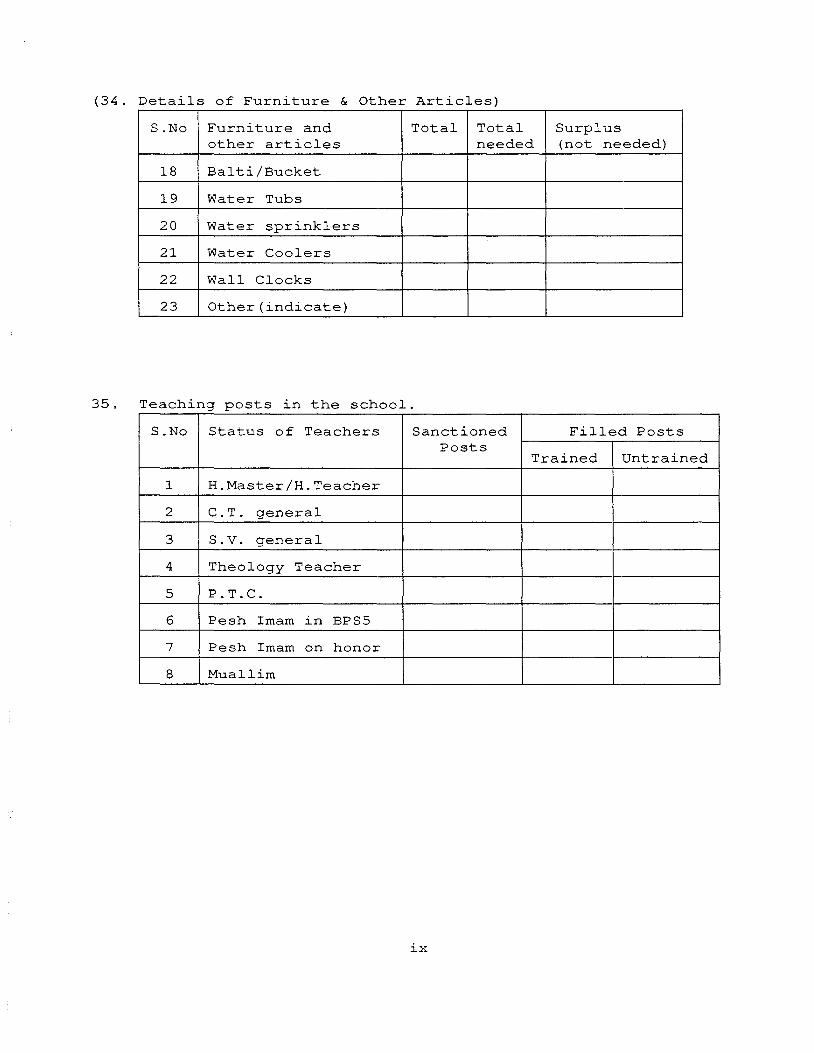
(34. Details of Furniture & Other Articles)
S.No Furniture and Total Total Surplus other articles needed (not needed)
18 Bal ti/Bucket
19 Water Tubs
20 Water sprinklers
21 Water Coolers
22 Wall Clocks
23 Other(indicate)
35. Teaching posts in the school.
S.No Status of Teachers Sanctioned Filled Posts Posts
Trained Untrained
1 H.Master/H.Teacher
2 C.T. general
3 s.v. general
4 Theology Teacher
5 P.T.C.
6 Pesh Imam in BPSS
7 Pesh Imam on honor
8 Muallim
ix

36. Highest Educational Qualification
S.No Educational Degree Male Female Certificate
1 M.A.
2 M.Sc.
3 M.Com.
4 B.A.
5 B.Sc.
6 B.Com.
7 Inter. Arts (F .A.)
8 Inter.Sc. (F. Sc.)
9 Inter C.Com.
10 Inter D.Com.
11 Matric/S.S.C.
12 Middle
13 Less than Middle
14 Fazil Wifaqul Madaris.
x
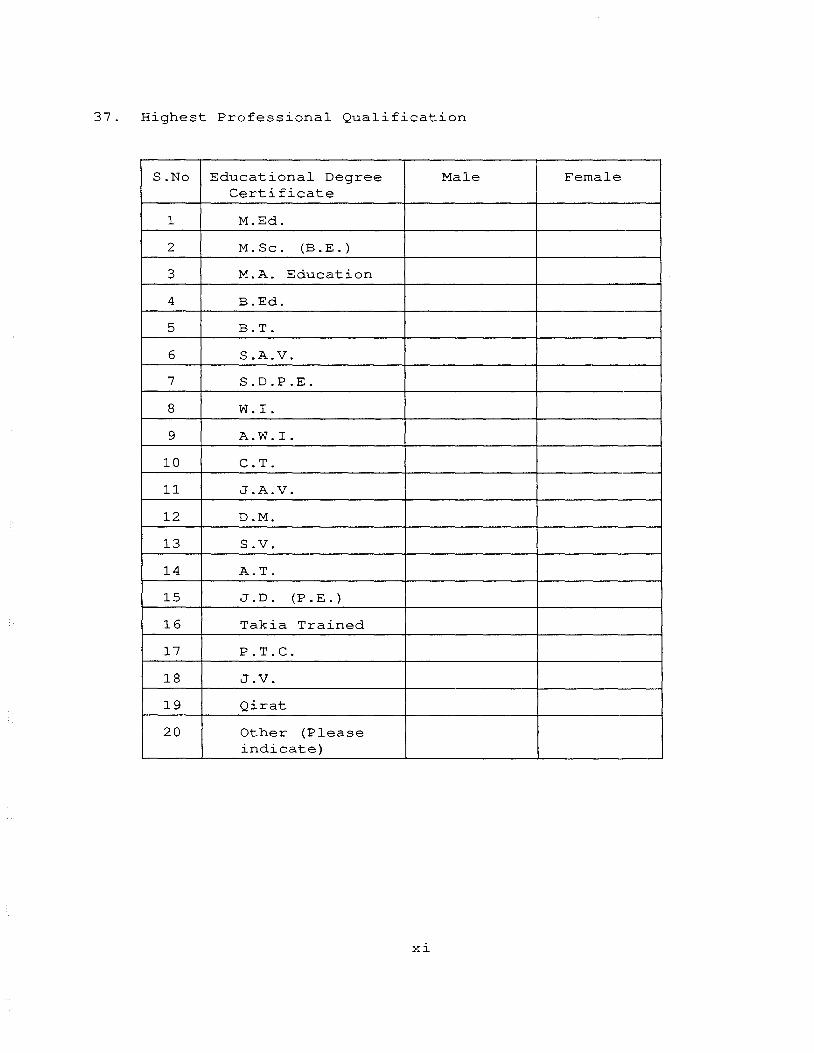
37. Highest Professional Qualification
S.No Educational Degree Male Female Certificate
1 M.Ed.
2 M.Sc. (B. E.)
3 M.A. Education
4 B.Ed.
5 B.T.
6 S.A.V.
7 S.D.P.E.
8 W.I.
9 A.W.I.
10 C.T.
11 J.A.V.
12 D.M.
13 S.V.
14 A.T.
15 J.D. (P. E.)
16 Takia Trained
17 P.T.C.
18 J.V.
19 Qirat
20 Other (Please indicate)
xi

38. Non-Teaching Regular Posts
S.No Posts Number
1 Peon (Naib Qasid)
2 Waterman
3 Chowkidar
4 Mali (Gardner)
5 Sweeper
6 Caller
39. Non-Teaching Posts Paid Out of Allowances
S.No Posts Number
1 Sweeper
2 Bahisti (Waterman)
3 Others
40. School Inspection of the Education Officers
S.No Education Officers Last year
1 D.E.O.
2 A.D.E.O.
3 A.S.D.E.O.
4 Learning Coordinators
3 S.D.E.O.
41. For how many days did the school remain open
last year?
xii

Appendix 2: 1992-93 School census Questionnaire 1. OFFICIAL NAME OF THE SCHOOL
(Block Letters)
2. SCHOOL CODE (This code will be written in by the SDEO from the given list)
3. DISTRICT NAME 4. DISTRICT CODE: ---(Use code on back page)
5. TEHSIL NAME 6. TEHSIL CODE:
7. Write down number of PRIMARY TEACHERS: TRAINED:
UNTRAINED: (Include Head Teacher but exclude Pesh-Imam of mosques school)
8. Write number of PRIMARY CLASSROOMS USED FOR TEACHING:
9. Write number of ADDITIONAL PRIMARY CLASSROOMS NEEDED: ---10. Write TOTAL PRIMARY ENROLLMENT (Boys/Girls) in the following
table:
CLASS 0 CLASS 1 CLASS CLASS CLASS CLASS
TOTAL Unadmitted Kachi Pakki 2 3 4 5
Boys
Girls
11. Write TOTAL PRIMARY REPEATERS (Boys/Girls) in the following table:
CLASS 1 CLASS TOTAL
CLASS 0 Unadmitted Kachi Pakki 2
Boys
Girls
12. SCHOOL GENDER
1 BOYS SCHOOL 2 GIRLS SCHOOL
13. SCHOOL LEVEL
i
CLASS 3
CLASS 4
CLASS 5

1 Govt. Primary School 2 Govt. Girls Primary School 3 Govt. Middle School 4 Govt. Girls Middle School 5 Govt. High School 6 Govt. Girls High School 7 Govt. Higher Scondry School 8 Govt. Girls Higher Secondary school 9 Govt. Masjid Primary School 10 Muhalla School 11 = Govt. Maktab/Elementary
14. SCHOOL LOCATION: Is this school located within a Union Council?
1 No (Urban) 2 Yes (Rural)
15. CONDITION OF BUILDING
1 Without Building 2 = No Need for repairs 3 Minor repairs needed 4 = Major repairs needed 5 Change of a part is needed 6 Complete change is needed
CODE NUMBERS FOR TEHSIL AND DISTRICT
DISTRICT CODE TEHSIL CODE
ABBOTTABAD 01 ABBOTT ABAD 1
BANNU 02 BANNU 1
CHITRAL 03 CHITRAL 1 MASTOOJ 2
CHARSADDA 04 CHARSADDA 1 TANGI 2
D. I. KHAN 05 D. I. KHAN 1 KULACHI 2
DIR 06 DIR 1 SAMAR BAGH 2 TIMARGARA 3 WARI 4
KARAK 07 KARAK 1 BANDA D. SHAH 2
KO HAT 08 KO HAT 1 HAN GU 2
ii

KOHISTAN 09 DASU 1 PATTAN 2
MANSEHRA 10 MANSEHRA 1 BATT AGRAM 2
MARDAN 11 MARDAN 1 TAKHT BHAI 2
MALAKAND 12 SWAT RANIZAI 1 SAMA RANIZAI 2
NOW SHERA 13 NOW SHERA 1
PESHAWAR 14 PESHAWAR 1
SWAT 15 SAIDU SHARIF 1 ALPURAI 2
SWAB I 16 SWAB I 1 LAHORE 2
BUNER 17 DAGGAR 1
HARIPUR 18 HARIPUR 1
LAKKI 19 LAKKI 1
TANK 20 TANK 1
iii

iv

Bibliography
Anderson, J. F. & Berdie, D. R. & Niebuhr, M.A. (1986) .. Questionnaires: Design and use. New Jersey: The Scarecrow Press, Inc.
Butcher, H. J. (1965). Sampling in Educational Research. Manchester: Manchester University Press.
Casley, D. J. & Lury, D. A. (1987). Data Collection in Developing Countries. Oxford: Clarendon Press.
Chapman, D. W. & Messec, J. L. (1989). "Policy Research Initiative: Nepal, Somalia, Education Management Information Systems". Final report for Improving the Efficiency of Educational Systems Project. Florida: Florida State University & United States Agency for International Development, Bureau for Science and technology, Office of Education.
Chapman, D. W., & Mahlck, L. 0. (1993). From Data to action: Information systems in Educational Planning Paris: UNESCO, International Institute for Educational Planning; London: Permagamon Press.
Dhingra, K. ( 1991) . "Improving the information system :for planning the quality of primary education: the case of India". Fifth Monograph of IIEP research and studies program for increasing and improving the quality of basic education. Paris: UNESCO, International Institute for Educational Planning.
Duncan, J. (1992). "Reviews/Product Comparison:Database trials". InforWorld, September 1992.
Evaluation Research Society, U.S.A. (1984). "Making effective use of Questionnaires: New Directions for Program evaluation". San Francisco: Jossey-Bass Inc.
Finnie, S. (1992). "Windows for Workgroups :Accessible Network Power". PC-Computing, December 1992.
Fredriksen, B. (1983). Statistics on Education in Developing
1

Countries, An Introduction to their Collection & Analysis. Paris: UNESCO Office of Statistics.
Hussain, K. M. Education.
(1973) . Development of Information Systems in New Jersey: Prentice-Hall, Inc.
Jaffe, A.J. (1969). Handbook of Statistical Procedures for longrange projections of public school enrolment. Washington: U.S. Government Printing Office.
Kendall, W.L. (1968). Statistics of education in developing countries, An introduction to their collection and presentation. Paris: UNESCO Office of Statistics.
Leblanc, T. D. (1993) . "The strengthening of EMIS in NWFP: A final report for the Primary Education Development Program(PED)". Working paper for Ministry of Education, Islamic Republic of Pakistan & Project PED, United States Agency for international Development. Peshawar: Ministry of Education Printing office.
Leblanc, T. D. (1994). in NWFP Pakistan". University.
"Measuring the quality of Educational Data Unpublished Doctoral Dissertation, Harvard
Leblanc, T. D. (1992). "Overview of EMIS in NWFP". Working paper for Ministry of Education, Islamic Republic of Pakistan & Project PED, United States Agency for International Development. Peshawar: Ministry of Education Printing Office.
Ministry of Education, NWFP. (1989) . Primary Education. Development program, North West Frontier Province, July 1989-June 1999. Peshawar: Education Department Printing office.
Ministry of Education, NWFP. (1991). Report on Social Action Plan(1991-1994) for Education Sector in NWFP. Peshawar: Education Department Printing office.
Ministry of Education, NWFP. (1991). School Census Questionnaire, 1991-1992 for Primary schools in NWFP. Peshawar: Education Department Printing office.
2

Ministry of Education, NWFP. (1992). 1992-1993 for Primary schools in Department Printing office.
School Census Questionnaire. NWFP. Peshawar: Education
Ministry of Education, Islamabad. (1990). Education For All 1990-2000. A Frame work for a National Plan of Action. Islamabad: Primary Education Wing of Federal Ministry of Education.
Oppenheim, A. N. (1966). Questionnaire design and attitude measurement. New York: Basic Books, Inc.
Psacharopoulos, G. (1980). Information: an essential factor in educational planning and policy. Paris: United Nations Educational, Scientific & Cultural organization.
Statistical Policy Office, U.S.A. ( 1983) . "Approaches to Developing Questionnaires: Statistical Policy, Working Paper 10". Washington: Office of Information and Regulatory Affaires & Office of Management and budget.
Theisen, G. (1989). " Development of a national EMIS: Working paper for the Primary Education Development Program". Pittsburgh: Institute for International Research.
Toronto, J .A. (1990). "An organizational analysis of the Ministry of Education, Arab republic of Egypt: The production, flow and use of information in the decision making process". Development discussion paper no. 346. Cambridge, MA: Harvard Institute for International Development, Harvard University.
UNESCO (1990) . "Planning the quality of Education, the collection and use of data for informed decision-making". Compiled from an International workshop on Issues and Practices in Pianning the Quaiity of Education, organized by the International Institute for Educational Planning in November 1989. Paris: Permagamon Press.
USAID (1992). "Developing Educational Information Systems and the Pursuit of Efficiency in Education: Eight years of IEES Project Experience". Florida: Florida State University & United States Agency for International Development, Bureau for Science and technology, Office of Education.
3

CHAPTER 1
) / ,- /TABLE
/ /
/ /
I I , ~,,.,.,,"
Introduction
OF CONTENTS
4