change-point trading - godot-finance trading: the snowy ... snowy (french: milou) is a fictional...
TRANSCRIPT

Change-Point Trading:The Snowy StrategyChrilly Donninger
Chief Scientist, Sibyl-ProjectSibyl-Working-Paper, August 2013
http://www.godotfinance.com/
Snowy (French: Milou) is a fictional character in The Adventures of Tintin. Snowy is a Wire FoxTerrier companion to the series' protagonist Tintin. Snowy is portrayed as brave and often is fearless
against much larger creatures when Tintin is threatened. He repeatedly is able to free Tintin fromcaptivity and save him from dangerous situations, and will sometimes identify a villain before Tintin.
(http://en.wikipedia.org/wiki/Snowy_%28character%29)
Abstract:Change-Point Detection is a venerable discipline with it's roots in process control. The classical CUSUM algorithm is the working horse of this field. CUSUM was published by E. S. Page in 1954 (see [1],[2],[3],[4],[5]). Detecting Change-Points is also a major problem in finance. But besides a (useless) monograph (see [4]), there are so far no systematic attempts to apply the CUSUM algorithm to trading problems. The starting point of this work was the Mojito Trading strategy ([6]). The Mojito uses the Implied-Volatility-Term-Structure (IVTS) as a signal for trading the VXX (S&P 500 VIX Short Term Futures ETN). The initial idea was to apply the CUSUM algorithm to the IVTS. This worksreasonable, but it can't be really called a full fledged CUSUM application. As a next step Absolute Snowy was developed. Absolute Snowy uses the absolute Returns of the VXX as the signal. This method is not only restricted to the VXX, but can be applied as well to the SPY and other time series. Snowy does a good job to detect change-points. He also does not overly bark on false alarms. Absolute Snowy is probably the first fully working CUSUM application in finance.
The CUSUM-Method: The CUSUM (CUmulative SUM) method is a sequential analysis technique in statistical quality control. It was developed by E.S. Page in 1954. The general setting is: One has a process (e.g. a chemical plant) with a given norm-process parameter. There is a second value of the process, which is an out of control situation. One measures the process-parameter constantly and wants to detect the out of control situation as early as possible. But one wants also as few false alarms as possible. If a control triggers too much false alarms the signal will be ignored after a while. The general CUSUM technique operates with log-likelihoods of probability distributions. Calculating these likelihoods can be quite challenging. But under the assumption of a normal distribution of the process-parameter the formula is quite simple (in 1954 one had not the means to do in real-time complicated calculations).
C(t+1) = max(0,C(t)+X(t)–K) (1)
C(t) is the Cumulative-Sum at time-t.X(t) is the parameter-value at time-tK is a constant which is given by the normal- and out of bound parameter values. If C(t) reaches a given threshold an alarm is given.
If the normal operational value of the process is 1.0, the out of bound situation is characterized by 2.0, one would typically set K to 1.5. (This is the mathematical optimal value if the variance of the process is for both regimes the same). C(t) tends to Zero, as long as X(t) is below 1.5. The alarm is triggered, if

there are several consecutive values above the threshold. The out-of-bound situation can hence be already detected before the full mess. If the normal process has a value of 1.0 and the out-of-bound condition a value of 0, one would set K to 0.5 and would use the minimum of 0 and C(t). The alarm is triggered, if C(t) falls below a given negative threshold (alternatively one can reverse the sign of X(t) and K and use the max-operator as before).
Before CUSUM, Stewart charts (invented in 1924) were used. Stewart charts detect only spikes but not a gradual degradation of a process. The CUSUM method resembles moving average techniques. The important difference is: Even a long stretch of low values does not move C(t) below Zero. The method stays like Snowy alert, even if nothing happened for a long time. CUSUM is under relative general mathematical assumptions the optimal combination of a low false alarm rate and a short response time (for details see [3] or [5]). CUSUM is a venerable, widely used and mathematically optimal method. Hence it should be the method of choice in technical trading. Unfortunately, things are more complicated. In trading there is not such a thing like a standard operation of a plant, where it suffices to detect rare out-of-control situations. The market is constantly changing regimes. There is not only the decision when to close a position. The right time for entering the market is in almost the same manner of critical importance. Although the authors of [4] call their monograph “Financial Surveillance”, they do not address these problems. They just rephrase their old Surveillance aka Change-Point papers and have obviously no interest or knowledge in trading.
Snowy sniffs the Mojito:Snowy is (in-)famous for his love of whiskey. I assume he would have liked the Mojito too. The Mojitostrategy ([6]) is a natural candidate for the CUSUM method, because one uses the IVTS as a trading signal. If the IVTS (or its variant, the Volatility-Term-Ratio) is below a given threshold (0.93) one goes the VXX short. Above 1.0 one goes long. In between the VXX is traded with a low negative weight. The in between phase is practically of minor importance. The VXX essentially wins by the normal contango situation of VIX Futures. This reverses in times of troubles. Hence the position is changed from short to long. For the short position the CUSUM is given by
Cs(t+1) = max(0,Cs(t)+IVTS(t)–Ks) (2)
For the long position one wants to detect the situation, when the IVTS falls below the high-threshold.
Cl(t+1) = min(0,Cl(t)+IVTS(t)–Kl) (3)
If one stays currently on the sideline (or starts trading), one has to define an entry point. One could define the sideline situation as another CUSUM calculation. But there is no obvious way to do so. What is the threshold of the sideline? The most simple rule is like in the Mojito. One enters the short position, if the IVTS falls below the threshold Ks. If the IVTS is above Kl, one goes long.The next question is: Are Cs(t) and Cl(t) calculated all the time? The clear answer is NO. If we are in a high-volatility phase (IVTS > 1), Cs(t) would grow at each time-step. When the market changes to a quiet state (with low IVTS), Cs(t) would still be for a long time above the critical threshold. One wouldstay for a long time on the sideline. Cs(t) is hence always set to Zero, if we are either on the sideline or trade a long position. The same holds for Cl(t). It is set to Zero, if one is on the sideline or in the short regime. We are only interested in watching the process once we enter the short or long position. It does not matter what happened before.

Graphic-1: Mojito Snowy (orange) and SPY (yellow) 2009-03-02 to 2013-08-27
Graphic-1 shows the performance of Mojito Snowy from 2009-03-02 to 2013-08-26. (The VXX was introduced at 2009-1-30). The index value starts with 100.000. Following the work in [6] the weight is set to -0.6 for short and 0.6 for long. One goes completely out of the market in the intermediate region (the Mojito reduces the weight). The low threshold in Graphic-1 is 0.94, the high threshold 1.01. One uses the VIX/VIX-Futures(30) implied volatility ratio (see [6]). The CUSUM threshold is 0.01. This threshold is rather low. If the volatility ratio moves – in one step – up to 0.95 or falls below 1.00, one closes already the position.But it makes a difference to having no threshold at all. It avoids the situation where one enters the position and closes immediately the next day, because the volatility ratio has moved slightly up or down. But a threshold of 0.01 is not really in the spirit of the CUSUM method.Graphic-2 shows the performance of the closest Mojito strategy. Here the low threshold is 0.92. One sets the weight – as in Snowy – to -0.6. From 0.92 to 0.94 to -0.16, from 0.94 to 1.0 to -0.03 and above 1.0 to 0.79. Snowy beats the standard Mojito with a final value of 1,426.653$ to 1,259.777$. The bottom chart shows the relative max. Drawdown. Snowy is also in this respect - especially on the right side of the chart in June 2013 – somewhat better.In essence one has found an improved parameter setting for the Mojito. The CUSUM threshold is a small enhancement to avoid flip-flops.Graphic-3 shows the distribution of the VXX returns for the implied volatility-ratio below 0.94, between 0.94 and 1.01 and above 1.01. The returns differ obviously in the different volatility regimes. It should be noted, that trading these regimes is not so easy. The implied volatility-ratio and the returns are from the same day. But in practice one knows only the implied volatility-ratio on the day before. If one calculates the distribution with the lagged ratio, the difference is less pronounced.

Graphic-2: Performance of Mojito-Aggressive from 2009-03-02 to 2013-08-27.
Graphic-3: VXX Return Distribution. Low-(red), Mid- (yellow), High-Implied-Volatility(green).

Absolute Snowy:
Graphic-4 shows the distribution of the VXX absolute-returns. There is for all regimes a long right tail. But this effect is much more pronounced for the high-implied-volatility regime. The mean value of the low-volatility regime (red-line) is 2.47, the median 1.96 and the standard-deviation 2.01. The values forthe high-volatility regime (green line) are 5.32 (mean), 4.54 (median) and 4.17 (standard deviation). As can be seen in Graphic-4 the distributions overlap considerable. There is a considerable portion of low-implied-volatility absolute returns, which are larger than the median of the high-volatility regime. The mode (peak) of the high-volatility distribution is below the median of the low-volatility-regime.If one places thresholds of 4 and 5 for the different regimes, the position would be constantly flipped between long and short. But the CUSUM algorithm was exactly developed for such a situation. It accepts a certain amount of violations. Only if they sum up an alarm is triggered. Absolute Returns are just another measure of volatility. They have a somewhat higher persistence (auto-correlation) than the usual volatility measure. This high auto-correlation is an essential ingredientbehind the application of the CUSUM algorithm. The idea behind Absolute Snowy is: One does not measure the regimes indirectly with the implied volatility-term structure. One uses instead the absolute Returns of VXX directly. Graphic-5 shows the performance if this idea with a low threshold of 4.05, a high threshold of 5.1 and aCUSUM threshold of 11.0. These values were found by looking at the distribution graph and by playing a little bit around with the overall performance. They are – on purpose – not the result of a systematic grid search.
Graphic-4: VXX Absolute-Return Distribution. Low-(red), Mid- (yellow), High-Volatility(green).

Graphic-5: Absolute Snowy (orange) and SPY (yellow) 2009-03-02 to 2013-08-27
Graphic-6: Absolute Snowy during the Flash-Crash May 2010.
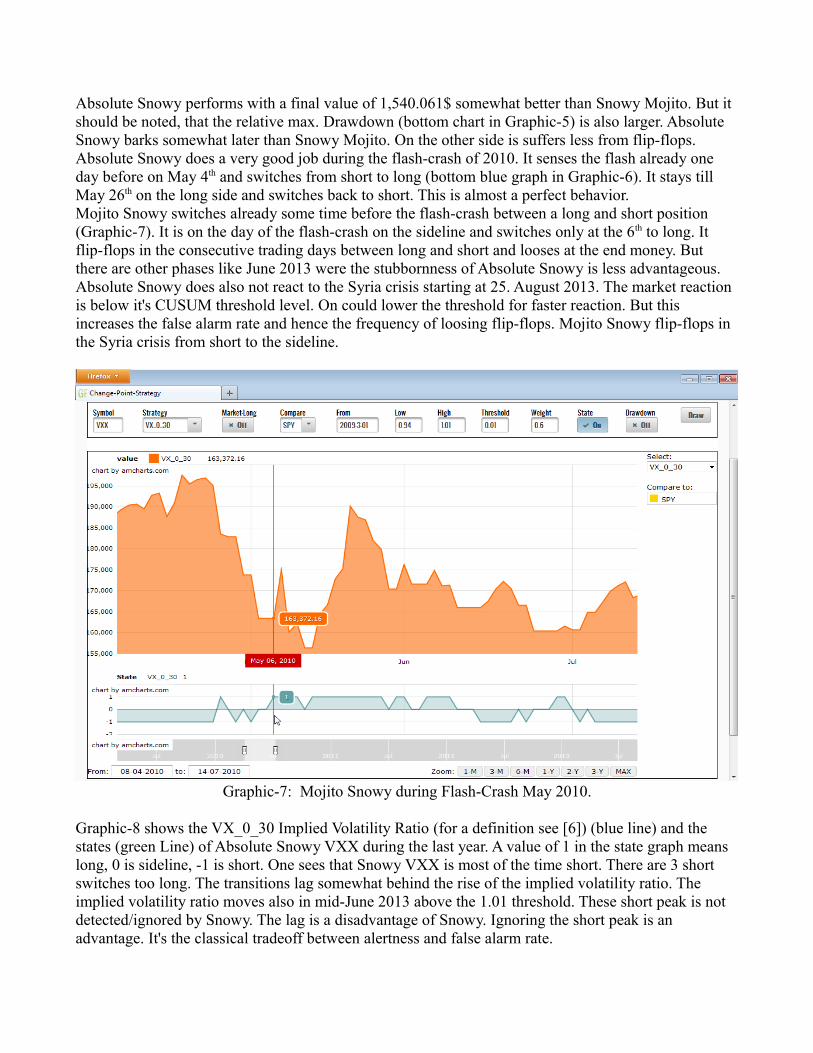
Absolute Snowy performs with a final value of 1,540.061$ somewhat better than Snowy Mojito. But it should be noted, that the relative max. Drawdown (bottom chart in Graphic-5) is also larger. Absolute Snowy barks somewhat later than Snowy Mojito. On the other side is suffers less from flip-flops. Absolute Snowy does a very good job during the flash-crash of 2010. It senses the flash already one day before on May 4th and switches from short to long (bottom blue graph in Graphic-6). It stays till May 26th on the long side and switches back to short. This is almost a perfect behavior.Mojito Snowy switches already some time before the flash-crash between a long and short position (Graphic-7). It is on the day of the flash-crash on the sideline and switches only at the 6th to long. It flip-flops in the consecutive trading days between long and short and looses at the end money. But there are other phases like June 2013 were the stubbornness of Absolute Snowy is less advantageous.Absolute Snowy does also not react to the Syria crisis starting at 25. August 2013. The market reaction is below it's CUSUM threshold level. On could lower the threshold for faster reaction. But this increases the false alarm rate and hence the frequency of loosing flip-flops. Mojito Snowy flip-flops in the Syria crisis from short to the sideline.
Graphic-7: Mojito Snowy during Flash-Crash May 2010.
Graphic-8 shows the VX_0_30 Implied Volatility Ratio (for a definition see [6]) (blue line) and the states (green Line) of Absolute Snowy VXX during the last year. A value of 1 in the state graph means long, 0 is sideline, -1 is short. One sees that Snowy VXX is most of the time short. There are 3 short switches too long. The transitions lag somewhat behind the rise of the implied volatility ratio. The implied volatility ratio moves also in mid-June 2013 above the 1.01 threshold. These short peak is not detected/ignored by Snowy. The lag is a disadvantage of Snowy. Ignoring the short peak is an advantage. It's the classical tradeoff between alertness and false alarm rate.

Graphic-8: States of Snowy VXX (green) and Implied Volatility-Ratio (blue) during last year.
Snowy and the S&P-500:The assumption behind the Snowy strategy is: There is a relation between volatility and returns. In caseof the VXX the returns tend to be positive during high volatility phases and negative in quiet times. Forthe S&P it is the other way round. But the general condition holds. It is just a matter of reversing the trading action. Absolute Snowy should hence work also for the SPY (S&P-500 ETF).
Graphic-9 shows the absolute Return Distribution for the SPY in the different implied volatility regimes. The low regime has a mean of 0.61, a median 0.41 and a standard deviation of 0.59. The high regime a mean of 2.28, a median of 1.67 and a standard deviation of 2.06. Graphic-10 shows the performance of Snowy SPY from 2008-3-01 to 2013-08-27. The lower threshold is 1.1, the upper 1.7 and the CUSUM threshold 3.5. Note that the upper threshold for the high-volatility regime is approx. the median of the distribution in Graphic-9. Half of the absolute Returns in the high volatility regime fall below this threshold. But the distribution has a long right tail. A few smaller returns do not trigger the CUSUM alarm and are compensated by a single larger absolute Return. Snowy SPY clearly outperforms with 139.8% to 42.3% the SPY in the long run.
Graphic-11 shows the performance of Snowy in the 2008 crash. Snowy smells the danger already on Sep. 9th and goes short. But it misses somewhat the recovery in spring 2009. Graphic-12 shows the state in the last year. Snowy just goes the SPY long. The CUSUM (orange) goes up in line with the Implied Volatility ratio. But the times of troubles are either too short or below it's alarm level. The CUSUM never reaches the critical threshold of 3.5. One can lower the high-volatility or the CUSUM threshold. But the price is a higher false alarm rate. Snowy differs in the current setting only in serious crashes from buy&hold.

Graphic-9: SPY Absolute-Return Distribution. Low-(red), Mid- (yellow), High-Volatility(green).
Graphic-10: Snowy SPY (orange) and SPY (yellow) 2008-03-01 to 2013-08-27

Graphic-11: Snowy SPY (orange) and states (blue) in the 2008 crash and the 2009 recovery
Graphic-12: Snowy SPY state (green), CUSUM (orange) and VX_0_30 (blue) during last year.

One can use the alertness of Snowy to leverage the trading. Instead of investing in the SPY one could trade the SSO (Ultra S&P-500 ETN). The performance of Snowy SSO improves from 139.8% to 360.2% (Graphic-13). The parameters are 2.2 for the low-, 3.3 for the high- and 7.1 for the CUSUM-threshold. This is not exactly the double of Snowy SPY. But a leveraged ETF is not just the double of the base. It has a different dynamic. Leveraged ETF's are generally not without problems. There is a systematic volatility-drag. This effect is used for profit in the Johnny-Walker strategy (see [7]). The effect of the drag is especially noticed in sideways markets. In rallies and crashes the compound effect is greater than the daily leverage factor of 2. Therefore the overall win for Snowy SSO is more than thedaily leverage factor.
Graphic-13: Snowy SSO 2008-03-01 to 2013-08-27
Snowy works in the same way also for the DIA and it's Ultra DDM. The optimal parameters for the DIA are 1.0, 1.5 and 3.1 with a final win of 136%. The parameters are smaller than for the SPY. The blue chips of the Dow have a lower volatility. The optimal parameters for the DDM are 2.0, 3.0 and 6.3with a final win of 364.5%. One can also trade the QQQ (Nasdaq-100). Snowy QQQ has the same parameters (1.1, 1.7, 3.5) than the SPY. The performance is 161.5%. But I have not found a good setting for the QLD (Ultra QQQ). This may be due the fact that the QLD does not leverage the QQQ very well. It's leverage is especially at the beginning considerable below the factor 2. The leverage of SSO is in October 2008 also below 2.0. But otherwise the daily-leverage is very close to 2.0. The deviation in October 2008 does not matter. The absolute Returns are far above the threshold and Snowyis anyway short.

Snowy and the Commodities:The DBC (PowerShares DB Commodity ETF) is a broad commodity ETF. The DBC is positively correlated with the SPY, but it's overall behavior is quite different. The IVTS is calculated from S&P-500 Futures options. It is hence not a very informative signal for the DBC. Graphic-14 shows the performance of Snowy DBC. The parameters are similar to the SPY: 1.1, 1.7 and 3.3. Snowy has some problems in summer 2008. It interprets the strong rally in June 2008 as a signal for trouble and goes short. Commodities have a different behavior than stocks. They have not only fat tails on the left, but
Graphic-14: Snowy DBC 2008-03-01 to 2013-08-27
also on the right. This is against the general logic of Snowy. But Snowy does a reasonable job indetecting the 2008 crash. It has – like Snowy SPY – some problems in the following recovery phase. Snowy DBC is – like Snowy SPY – during the last year only long. It differs from buy&hold only in sharp crashes. But Snowy DBC can create false alarms by barking in sharp rallies.
I tried also Snowy TLT (10+ years treasuries). The above problem is even more pronounced for treasuries. Snowy needs an asymmetric distribution with fat tails only on one side. It sees (smells) only the absolute value and can not know if the large values are from a rally or a crash. Using the returns itself does not work, because they have no persistence pattern and jump also up and down in crashes.
Conclusion:Snowy Mojito is an improvement over the original Mojito strategy. But this can be mainly attributed to the improved bounds for the IVTS. The small CUSUM threshold of 0.01 prevents some flip-flops whenentering a position. But one can not call it a full fledged application of the CUSUM technique to trading.

Absolute Snowy is – up to my knowledge – the first successful application of the CUSUM method to trading (at least I have reinvented the wheel). The essential idea is to use the absolute returns as the input value. Absolute Snowy can be applied to any asset class as long as there is a relation between volatility and returns. One does not need an indirect signal like the implied volatility term structure. ButSnowy can not detect minor ups and downs (this is not the intention behind the CUSUM method). It is most of the time a buy&hold strategy, which signals only significant change points. But it does in this respect a good job. The method is conceptually simple. One drawback is that the parameter settings have no direct intuitive interpretation. There is always the danger that the parameters reported above work reasonable for the past, but fail in the future. But the values are quite stable. The thresholds for SPY and DIA are consistent with the different volatility behavior. It is also remarkable, that the QQQ and the SPY have the same parameters. The thresholds were not automatically optimized by a grid search. They were found by first inspecting the distribution charts and then trying a few values by hand. This avoids to a certain degree the over fitting problem. The most interesting application of Absolute Snowy seems to be the Ultra SSO. One cashes in the higher return and Snowy puts some protection on the downside. But this works only, if there is – like inthe last time – a clear trend. Leveraged ETF's loose in sideways markets due the volatility drag (see [7]).
References:[1] E.S. Page: Continuous Inspection Scheme. Biometrika 41 (1/2): p100–115, June 1954. [2] P. Granjon: The CUSUM algorithm, a small review. 2012-6-22.This is a very readable introduction into CUSUM.[3] M. Basseville, I.V. Nikiforov: Detection of Abrupt Changes: Theory and Application. Prentice Hall.This is the classical monograph. It starts easy, but it is in the later chapters heavy on mathematics. [4] M. Frisen (ed.): Financial Surveillance, John Wiley&Sons. This book is mainly a collection of references about Surveillance aka CUSUM papers. Financial is just in the title. The authors have no interest and knowledge of trading. If one is serious on CUSUM [3] is much better.[5] H.V. Poor, O. Hadjiliadis: Quickest Detection. Cambridge University Press. If you like mathematical measure theory, this is the book for you. Otherwise read [2] or [3].[6] Ch. Donninger: Improving the S&P Dynamic VIX-Futures Strategy: The Mojito 2.0 Strategy. Sibyl-Working-Paper, Rev. 1, 2013-6-04[7] Ch. Donninger: Leveraged ETF-Trading: The Johnny-Walker Strategy. Sibyl-Working-Paper, Rev. 1. 2012-7-29