chapter 1 2021 technology & market report
TRANSCRIPT

FUEL CELLS AND HYDROGEN OBSERVATORY
Chapter 1
2021 Technology & Market Report July 2021
1
Disclaimer
This report is based on data gathered as part of the Fuel Cells and Hydrogen Observatory as at 31 December 2020. The authors believe that this information comes from reliable sources, but do not guarantee the accuracy or completion of this information. The Observatory and information gathered within it will continue to be revised. These revisions will take place annually and can also be done on a case by case basis. As a result, the information used as of writing of this report might differ from the changing data in the Observatory.
The information and views set out in this report are those of the author(s) and do not necessarily reflect the official opinion of the FCH 2 JU. Neither the FCH 2 JU, other European Union institutions and bodies, nor any person acting on their behalf may be held responsible for the use which may be made of the information contained therein.
This report was prepared for the Fuel Cells and Hydrogen 2 Joint Undertaking as part of the Fuel Cells and Hydrogen Observatory. Copies of this document can be downloaded from https://www.fchobservatory.eu/
The Fuel Cells and Hydrogen Observatory has been prepared for the FCH 2 JU under a public procurement contract.
©FCH 2 JU, 2021 Reproduction is authorised provided that the source is acknowledged. For any use or reproduction of material that is not under the FCH 2 JU copyright, permission must be sought directly from the copyright holders
2
TABLE OF CONTENTS Disclaimer ................................................................................................................................................ 1
Executive Summary ................................................................................................................................. 3
1. Introduction ..................................................................................................................................... 5
2. 2020 Snapshot ................................................................................................................................. 6
2.1. Data Collection Methodology .................................................................................................. 6
2.2. Fuel Cell Shipments ................................................................................................................. 6
2.2.1. Shipments by Region of Deployment .............................................................................. 7
2.2.2. Shipments by Application ................................................................................................ 8
2.2.3. Shipments by Region of System Integration .................................................................... 9 3. Hydrogen Refuelling Stations ........................................................................................................ 11
4. Fuel Cell Vehicles ........................................................................................................................... 14

3
Executive Summary
The Fuel Cells and Hydrogen Observatory is an ambitious project to collect available valuable sector information in a single go-to source and make it open to all interested stakeholders. The technology and market module of the FCHO presents a range of statistical data as an indicator of the health of the sector and the progress in market development over time.
This module currently focusses on global fuel cell system shipments and on European FCH actors, vehicle registrations, refuelling stations and the hydrogen market. The ambition over time is to broaden the scope of companies, technologies and markets and to widen the reach of geographies covered by the FCHO as the market itself evolves. This will enable the annual report to make year on year comparisons assessing market progress and identify strengths and trends. This is the second annual report on the FCHO and provides a snapshot of technology and market data in the period January 2020 – December 2020.
In 2020, the fuel cell and hydrogen industry, similar to all industries around the globe had experienced unprecedented supply chain challenges as a result of COVID-19. This has significantly slowed down the deployment of hydrogen fuel cells and the relevant applications compared with expected levels, but as a testimony to the continuing belief in the sector, modest growth was observed nevertheless. Global fuel cell system shipments saw a 10% increase in 2020, totalling at 1.3GW. Asia continues to lead in shipment volumes, accounting for almost 70% of the total MW shipped worldwide, whilst the US experienced yet again another decline, continuing the trend from 2019. Europe represents 10% of the total shipment in MW, growing from 113MW in 2019 to 149 MW in 2020.
Amongst fuel cell applications, the transport sector continues to lead with a growth of 25% on number of units shipped globally. This is driven by the deployment of more than 20,000 FCEVs of all types, of which 50% were in the material handling sector to support the demand of essential industries in 2020. Similarly, shipments of stationary applications surged despite a slowdown of deployment elsewhere with a growth of 10%, totalling at 57,800 units shipped.
HRS deployment in Europe was hard-hit by the pandemic in 2020. Supply chain challenges have caused significant delays in constructions versus announced deployments. A small growth prevailed bringing the total number of HRS operating or in construction to 162 at the end of 2020, with many more in the
Purpose: The technology and market module of the FCHO presents a range of statistical data as an indicator of the health of the sector and the progress in market development over time. https://www.fchobservatory.eu/observatory/technology-and-market
Scope: Fuel cell shipment data is presented on a global basis. Other sections of the
technology and market chapter (HRS data and FCEV data) are presented on a European basis. The report spans January 2020 – December 2020.
Key Findings: COVID-19 has without doubt impacted the deployment of fuel cells and hydrogen
in 2020 compared to industry expectations: Global Fuel Cell shipments > 1.3 GW Europe Fuel Cell shipments up to 148.6 MW Europe HRS in operation or under construction 162 FCEVs up 41% to 2,774
4
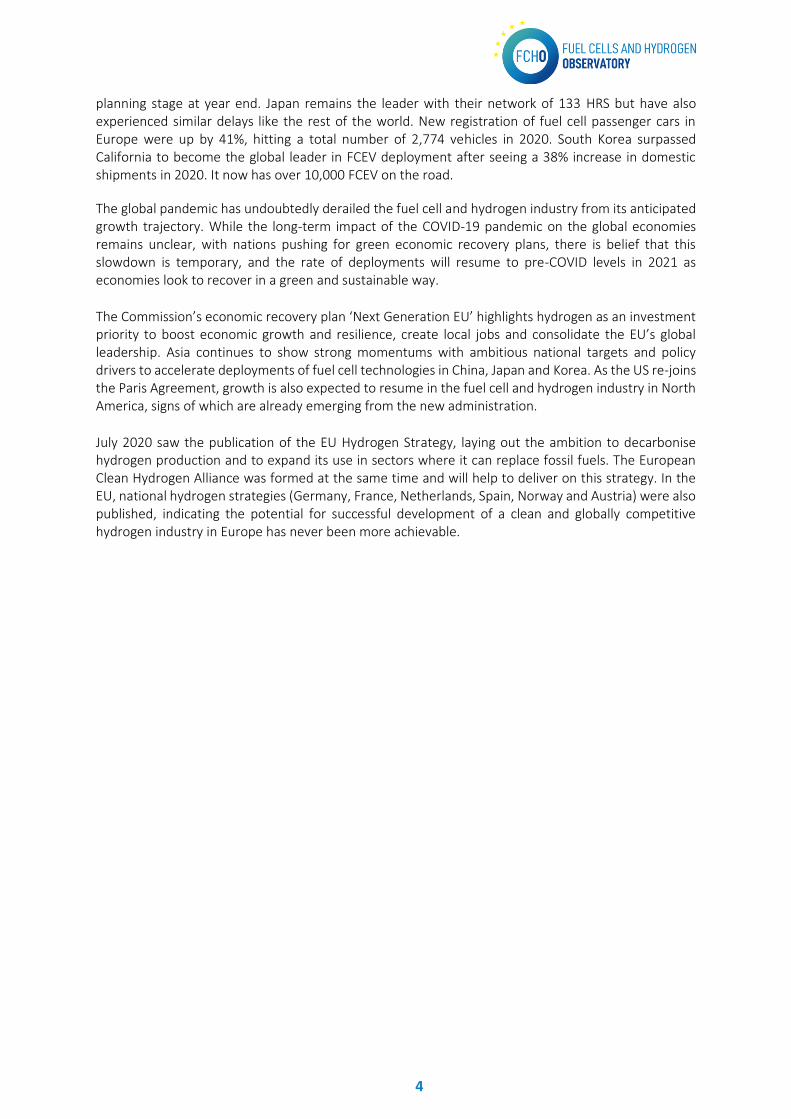
planning stage at year end. Japan remains the leader with their network of 133 HRS but have also experienced similar delays like the rest of the world. New registration of fuel cell passenger cars in Europe were up by 41%, hitting a total number of 2,774 vehicles in 2020. South Korea surpassed California to become the global leader in FCEV deployment after seeing a 38% increase in domestic shipments in 2020. It now has over 10,000 FCEV on the road.
The global pandemic has undoubtedly derailed the fuel cell and hydrogen industry from its anticipated growth trajectory. While the long-term impact of the COVID-19 pandemic on the global economies remains unclear, with nations pushing for green economic recovery plans, there is belief that this slowdown is temporary, and the rate of deployments will resume to pre-COVID levels in 2021 as economies look to recover in a green and sustainable way.
The Commission’s economic recovery plan ‘Next Generation EU’ highlights hydrogen as an investment priority to boost economic growth and resilience, create local jobs and consolidate the EU’s global leadership. Asia continues to show strong momentums with ambitious national targets and policy drivers to accelerate deployments of fuel cell technologies in China, Japan and Korea. As the US re-joins the Paris Agreement, growth is also expected to resume in the fuel cell and hydrogen industry in North America, signs of which are already emerging from the new administration.
July 2020 saw the publication of the EU Hydrogen Strategy, laying out the ambition to decarbonise hydrogen production and to expand its use in sectors where it can replace fossil fuels. The European Clean Hydrogen Alliance was formed at the same time and will help to deliver on this strategy. In the EU, national hydrogen strategies (Germany, France, Netherlands, Spain, Norway and Austria) were also published, indicating the potential for successful development of a clean and globally competitive hydrogen industry in Europe has never been more achievable.
5
1. Introduction
The information in this report covers the period January 2020 – December 2020. The technology and market module of the FCHO presents a range of statistical data as an indicator of the health of the sector and the progress in market development over time.
This includes statistical information on the size of the global fuel cell market including number and capacity of fuel cell systems shipped in a calendar year. For this first edition, data to the end of 2020 is presented where possible, alongside analysis of key sector developments. Fuel cell system shipments for each calendar year are presented both as numbers of units and total system megawatts. The data are further divided and subdivided by:
• Application: Total system shipments are divided into Transport, Stationary and Portable applications
• Fuel cell type: Numbers are provided for each of the different fuel cell chemistry types
• Region of integration: Region where the final manufacturer – usually the system integrator – integrates the fuel cell into the final product
• Region of deployment: Region where the final product was shipped to for deployment
The data is sourced directly from industry players as well as other relevant sources including press releases, associations, and other industry bodies. The aspiration is to include data related to other parts of the supply chain including electrolysers and component suppliers, as well as employment statistics for the sector when this information becomes available.
Information is presented on the number of hydrogen refuelling stations (HRS) deployed since 2014 with detailed information on HRS in operation including pressure, capacity etc. In parallel, the observatory provides data on the registered fuel cell electric vehicles (FCEVs) on European roads, providing an indication of the speed of adoption of hydrogen in the transport sector. This annual report is an enrichment analysis of the data available on the FCHO, providing global context and insights on trends observed year-over-year.
All sections in the Technology & Market module are updated following an annual data collection and validation cycle and the annual report is published the following Spring.

6
2. 2020 Snapshot
2.1. Data Collection Methodology
The fuel cell shipment data at the end of 2020 as presented in the Technology & Market module of the Observatory is derived from E4tech’s Fuel Cell Industry Review 20201. This data presents a snapshot of the size of the global fuel cell market and is a consolidated view of data collected by confidential survey with over 100 participants in the fuel cell and hydrogen supply chain. The survey was conducted through to the end of September 2020 and includes a forecast for the last quarter of the year, 2020f2.
The industry survey was again conducted this year by E4tech as part of its scope for the Observatory.
Hydrogen Refuelling Station (HRS) data is derived from the European HRS Availability System3. The data is extracted and analysed to derive the number of HRS deployed in European member states at the end of 2020. Additional information on non-EU countries is sourced through desk research.
Information on Fuel Cell vehicle deployments in Europe is sourced from the European Alternative Fuels Observatory (EAFO4) which monitors vehicle deployments across a broad range of alternative fuels including hydrogen. This data is supplemented with desk research for non-EU markets.
2.2. Fuel Cell Shipments
The FCHO provides detailed statistics on a number of indicators for the market development of the fuel cell space. Annual data is presented on system shipments and the total of those systems in megawatts, categorised by application, region and fuel cell type as described below. Shipment numbers are rounded to the nearest 100 units and megawatt data to the nearest 0.1 MW. Where power ratings are quoted, these refer to the electrical output unless stated otherwise. In general, the nominal, not peak, power of the system is used, with the exception of transport. Because continuous power depends heavily on system design and how it is used, peak power is reported for transport units.
The reported figures refer to shipments by the final manufacturer, usually the system integrator. In transport the vehicle is counted when shipped from the factory. This is because the shipments of stacks or modules in a given year can be significantly different from the shipment of final units (e.g. vehicles) in the same timeframe. We use stack and module shipment data to enable correlation of numbers between years. The regional split in the data is provided both in terms of where the systems have been integrated and where they are shipped to. Where possible, we do not include shipments for toys and educational kits.
The data is presented using the following definitions:
• Shipments by region of deployment, depicting where systems are shipped to for final
deployment,
• Shipments by region of system integration, depicting where stacks are integrated into final
system such as a vehicle or CHP system, and
1 E4tech Fuel Cell Industry Review, fuelcellindustryreview.com 2 2020f is the data at end of 2020 using the forecasted numbers for the last quarter 3 HRS Availability System, h2-map.eu 4 European Alternative Fuels Observatory, eafo.eu
7
• Shipments by application, depicting the number of systems by application area (transport,
stationary etc)
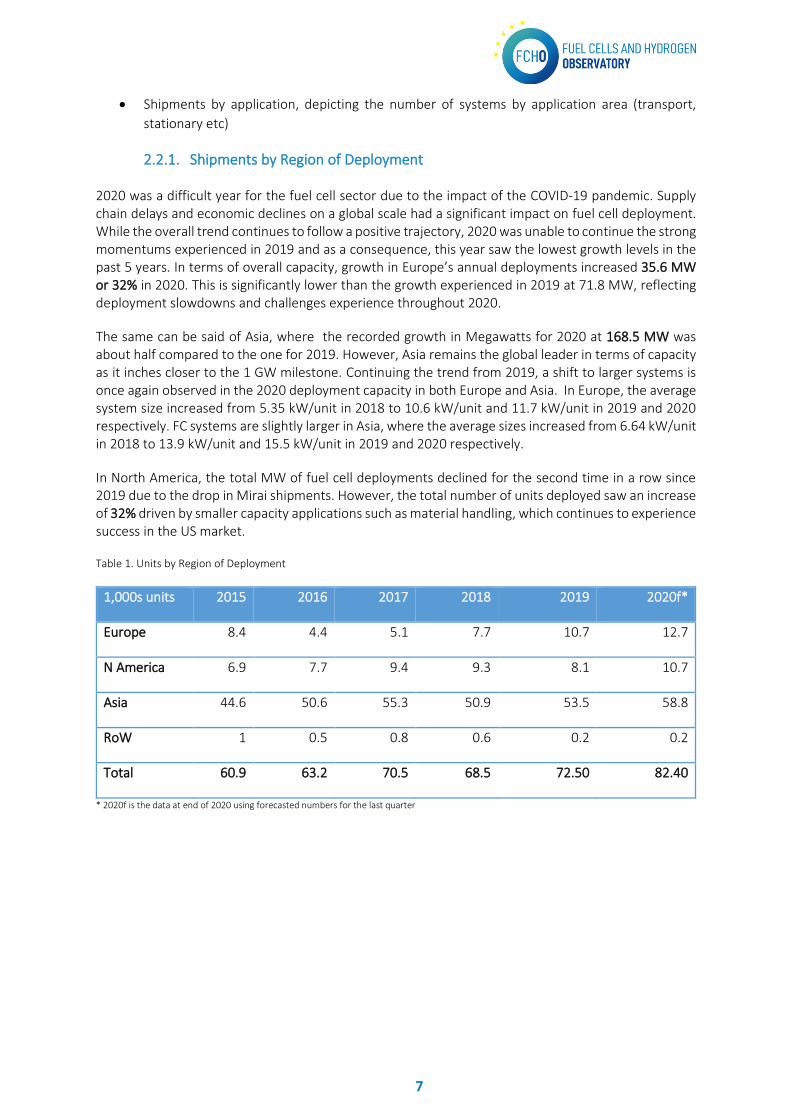
2.2.1. Shipments by Region of Deployment
2020 was a difficult year for the fuel cell sector due to the impact of the COVID-19 pandemic. Supply chain delays and economic declines on a global scale had a significant impact on fuel cell deployment. While the overall trend continues to follow a positive trajectory, 2020 was unable to continue the strong momentums experienced in 2019 and as a consequence, this year saw the lowest growth levels in the past 5 years. In terms of overall capacity, growth in Europe’s annual deployments increased 35.6 MW or 32% in 2020. This is significantly lower than the growth experienced in 2019 at 71.8 MW, reflecting deployment slowdowns and challenges experience throughout 2020.
The same can be said of Asia, where the recorded growth in Megawatts for 2020 at 168.5 MW was about half compared to the one for 2019. However, Asia remains the global leader in terms of capacity as it inches closer to the 1 GW milestone. Continuing the trend from 2019, a shift to larger systems is once again observed in the 2020 deployment capacity in both Europe and Asia. In Europe, the average system size increased from 5.35 kW/unit in 2018 to 10.6 kW/unit and 11.7 kW/unit in 2019 and 2020 respectively. FC systems are slightly larger in Asia, where the average sizes increased from 6.64 kW/unit in 2018 to 13.9 kW/unit and 15.5 kW/unit in 2019 and 2020 respectively.
In North America, the total MW of fuel cell deployments declined for the second time in a row since 2019 due to the drop in Mirai shipments. However, the total number of units deployed saw an increase of 32% driven by smaller capacity applications such as material handling, which continues to experience success in the US market.
Table 1. Units by Region of Deployment
1,000s units 2015 2016 2017 2018 2019 2020f*
Europe 8.4 4.4 5.1 7.7 10.7 12.7
N America 6.9 7.7 9.4 9.3 8.1 10.7
Asia 44.6 50.6 55.3 50.9 53.5 58.8
RoW 1 0.5 0.8 0.6 0.2 0.2
Total 60.9 63.2 70.5 68.5 72.50 82.40
* 2020f is the data at end of 2020 using forecasted numbers for the last quarter
8
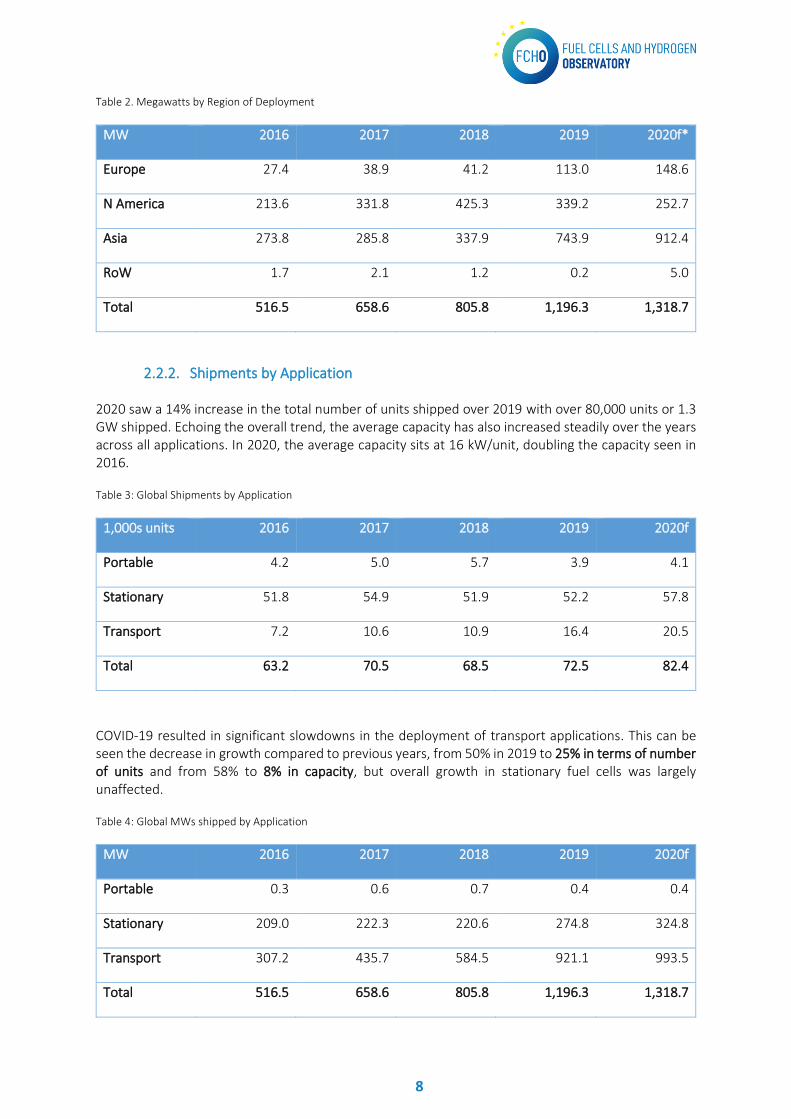
Table 2. Megawatts by Region of Deployment
MW 2016 2017 2018 2019 2020f*
Europe 27.4 38.9 41.2 113.0 148.6
N America 213.6 331.8 425.3 339.2 252.7
Asia 273.8 285.8 337.9 743.9 912.4
RoW 1.7 2.1 1.2 0.2 5.0
Total 516.5 658.6 805.8 1,196.3 1,318.7
2.2.2. Shipments by Application
2020 saw a 14% increase in the total number of units shipped over 2019 with over 80,000 units or 1.3 GW shipped. Echoing the overall trend, the average capacity has also increased steadily over the years across all applications. In 2020, the average capacity sits at 16 kW/unit, doubling the capacity seen in 2016.
Table 3: Global Shipments by Application
1,000s units 2016 2017 2018 2019 2020f
Portable 4.2 5.0 5.7 3.9 4.1
Stationary 51.8 54.9 51.9 52.2 57.8
Transport 7.2 10.6 10.9 16.4 20.5
Total 63.2 70.5 68.5 72.5 82.4
COVID-19 resulted in significant slowdowns in the deployment of transport applications. This can be seen the decrease in growth compared to previous years, from 50% in 2019 to 25% in terms of number of units and from 58% to 8% in capacity, but overall growth in stationary fuel cells was largely unaffected.
Table 4: Global MWs shipped by Application
MW 2016 2017 2018 2019 2020f
Portable 0.3 0.6 0.7 0.4 0.4
Stationary 209.0 222.3 220.6 274.8 324.8
Transport 307.2 435.7 584.5 921.1 993.5
Total 516.5 658.6 805.8 1,196.3 1,318.7

9
Despite this reduction in growth, fuel cell vehicles remain as the primary application in terms of capacity, with shipments of more than 20,000 vehicles of all types, making up approximately 75% of the total MW of expected shipments by year end. Among this, material handling applications account for 50% of total transport shipments, almost doubling the number of deployment from 2019 as the forecast approaches 10,000 units towards the end of 2020 to support the demand of essential industries amidst the pandemic. In the passenger car market, Hyundai and Toyota remain dominant and collectively account for two thirds of this supply. Other noticeable factors were the number of fuel cell trucks and buses in China, who continues to lead the deployment in this sector with an estimate of 1,400 units shipped in 2020, equivalent of 87 MW capacity.
Growth in stationary applications from 2019 continued into 2020 after being stagnant for many years with a total shipment of more than 57,000 units and a capacity of 320 MW. 85% of this comes from large CHP and prime power above 100 kW, but still only accounts for around 400 units globally. The Japanese En-farm and the KfW 433 initiative in German programme continue to have major impacts with a forecasted deployment of over 47,000 units and 5,000 units of micro-CHP respectively.
The number of shipped portable units remain unchanged with a slight increase in capacity, once again suggesting a shift to larger systems but the overall MW shipments remains low.
2.2.3. Shipments by Region of System Integration
Table 5: Global units shipped by region of system integration
1,000s units 2016 2017 2018 2019 2020f*
Europe 4.2 6.6 8.7 10.0 16.8
N America 6.3 8.4 6.6 6.7 11
Asia 52.5 55.3 53.1 55.7 54.6
RoW 0.2 0.0 0.0 0.0 0.0
Total 63.2 70.4 68.5 72.5 82.4
The numbers for shipments by region of system integration, depicting where stacks are integrated into final system, reveal that Asia is not only leading deployment of fuel cells (ca. 69% of total megawatts) but is also home to nearly 85% of fuel cell system megawatts manufactured in 2020. Again a large part this is due to Toyota‘s and Hyundai’s fuel cell passenger car manufacturing, where the deployment of NEXO represents close to 50% of the global fuel cell shipments by MW of all kinds. While the total MW of system integration grew by 11% from 2019, the overall units saw a slight decline of 2% in Asia. Once again, this could be another reflection of the trend that systems are growing in capacity.
Outside Asia, notable fuel cell manufacturing activity is found in the US with a focus on stationary fuel cells and material handling applications. As there is no fuel cell car model available from US OEMs, the US remains a net importer of fuel cell systems, despite strong players in stationary fuel cell systems and in PEMFC stacks and components.
10
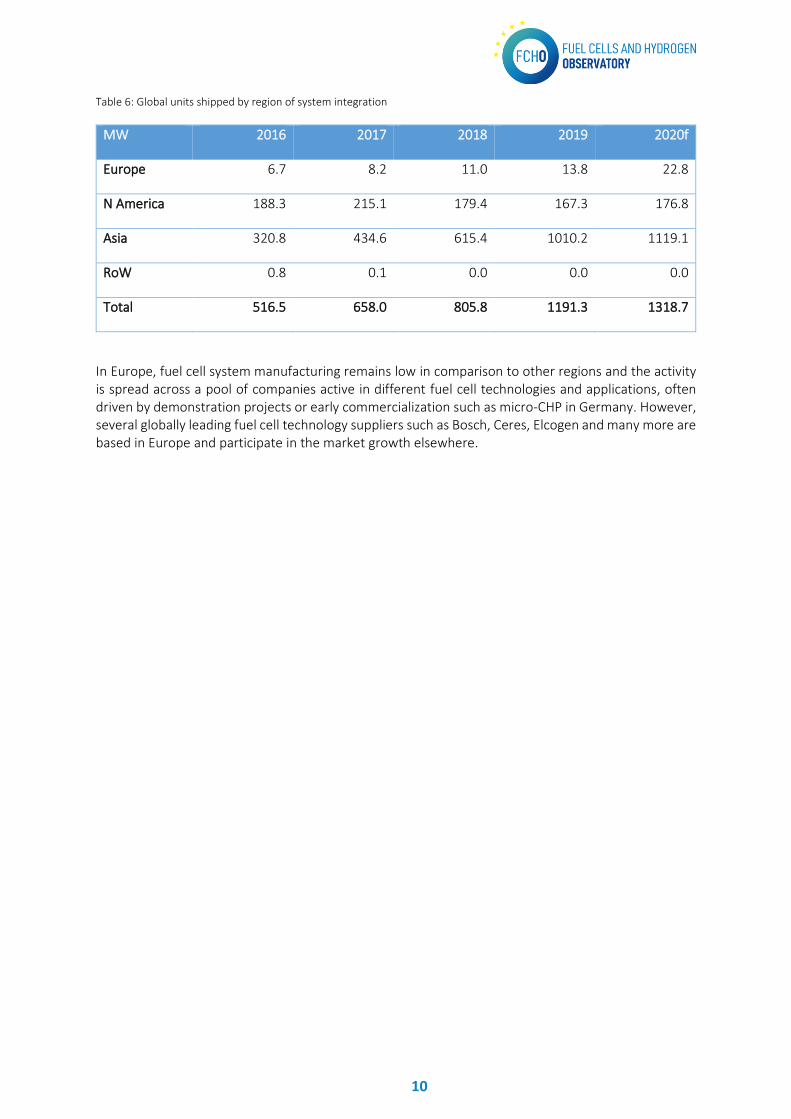
Table 6: Global units shipped by region of system integration
MW 2016 2017 2018 2019 2020f
Europe 6.7 8.2 11.0 13.8 22.8
N America 188.3 215.1 179.4 167.3 176.8
Asia 320.8 434.6 615.4 1010.2 1119.1
RoW 0.8 0.1 0.0 0.0 0.0
Total 516.5 658.0 805.8 1191.3 1318.7
In Europe, fuel cell system manufacturing remains low in comparison to other regions and the activity is spread across a pool of companies active in different fuel cell technologies and applications, often driven by demonstration projects or early commercialization such as micro-CHP in Germany. However, several globally leading fuel cell technology suppliers such as Bosch, Ceres, Elcogen and many more are based in Europe and participate in the market growth elsewhere.
11
3. Hydrogen Refuelling Stations
The HRS module within the FCHO provides a range of information on technical characteristics including for example, station opening times, station operator, refuelling options (pressure) available as well as a live station availability update. This information is displayed on the portal and is derived from the HRS Availability System (HRS-AS) in real time.
This analysis provided here draws upon the supporting database compiled for the HRS-AS, supplemented by additional desk research to provide a picture of hydrogen refuelling station deployments in Europe5. The HRS-AS database tracks the onstream availability of public HRS stations in Europe. It does not include private HRSs.
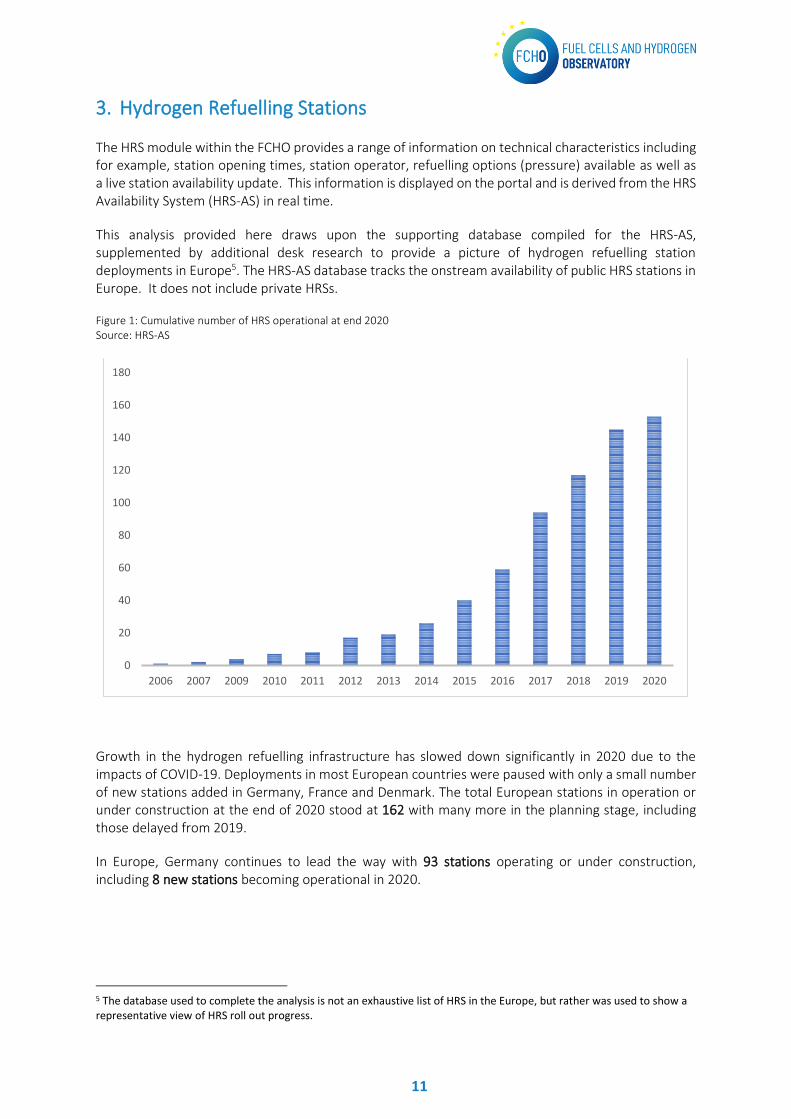
Figure 1: Cumulative number of HRS operational at end 2020 Source: HRS-AS
Growth in the hydrogen refuelling infrastructure has slowed down significantly in 2020 due to the impacts of COVID-19. Deployments in most European countries were paused with only a small number of new stations added in Germany, France and Denmark. The total European stations in operation or under construction at the end of 2020 stood at 162 with many more in the planning stage, including those delayed from 2019.
In Europe, Germany continues to lead the way with 93 stations operating or under construction, including 8 new stations becoming operational in 2020.
5 The database used to complete the analysis is not an exhaustive list of HRS in the Europe, but rather was used to show a representative view of HRS roll out progress.
0
20
40
60
80
100
120
140
160
180
2006 2007 2009 2010 2011 2012 2013 2014 2015 2016 2017 2018 2019 2020
12
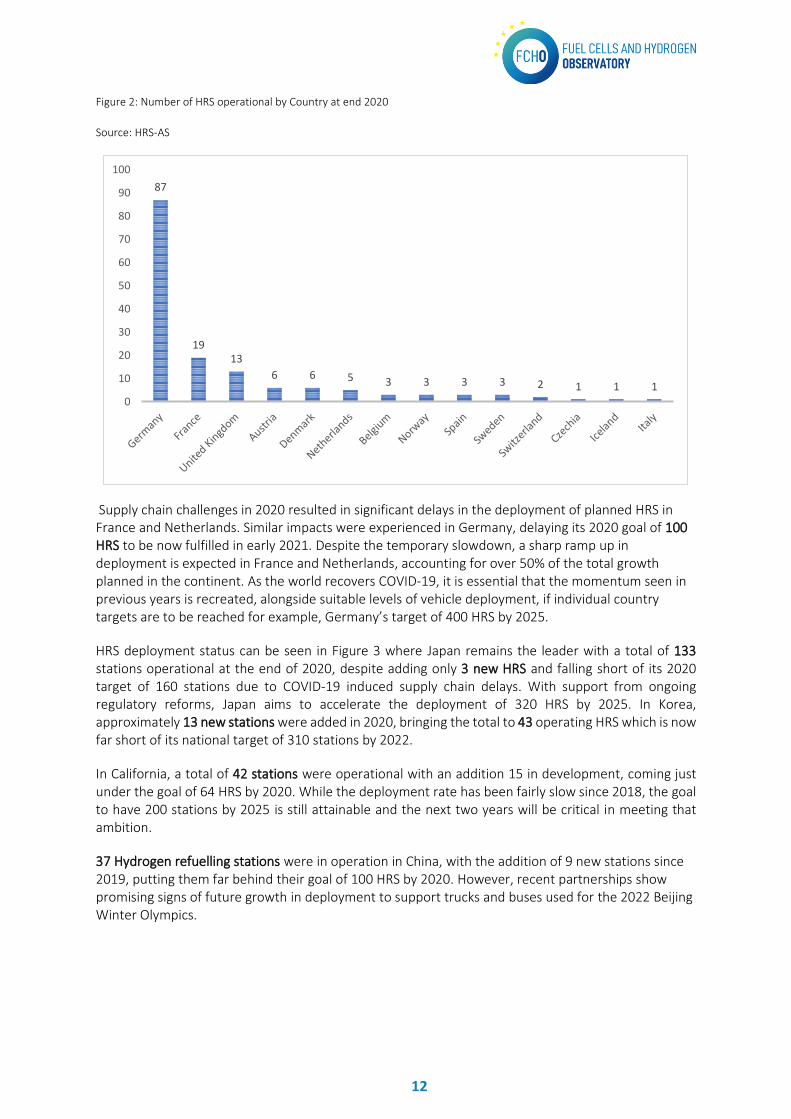
Figure 2: Number of HRS operational by Country at end 2020
Source: HRS-AS
Supply chain challenges in 2020 resulted in significant delays in the deployment of planned HRS in France and Netherlands. Similar impacts were experienced in Germany, delaying its 2020 goal of 100 HRS to be now fulfilled in early 2021. Despite the temporary slowdown, a sharp ramp up in deployment is expected in France and Netherlands, accounting for over 50% of the total growth planned in the continent. As the world recovers COVID-19, it is essential that the momentum seen in previous years is recreated, alongside suitable levels of vehicle deployment, if individual country targets are to be reached for example, Germany’s target of 400 HRS by 2025.
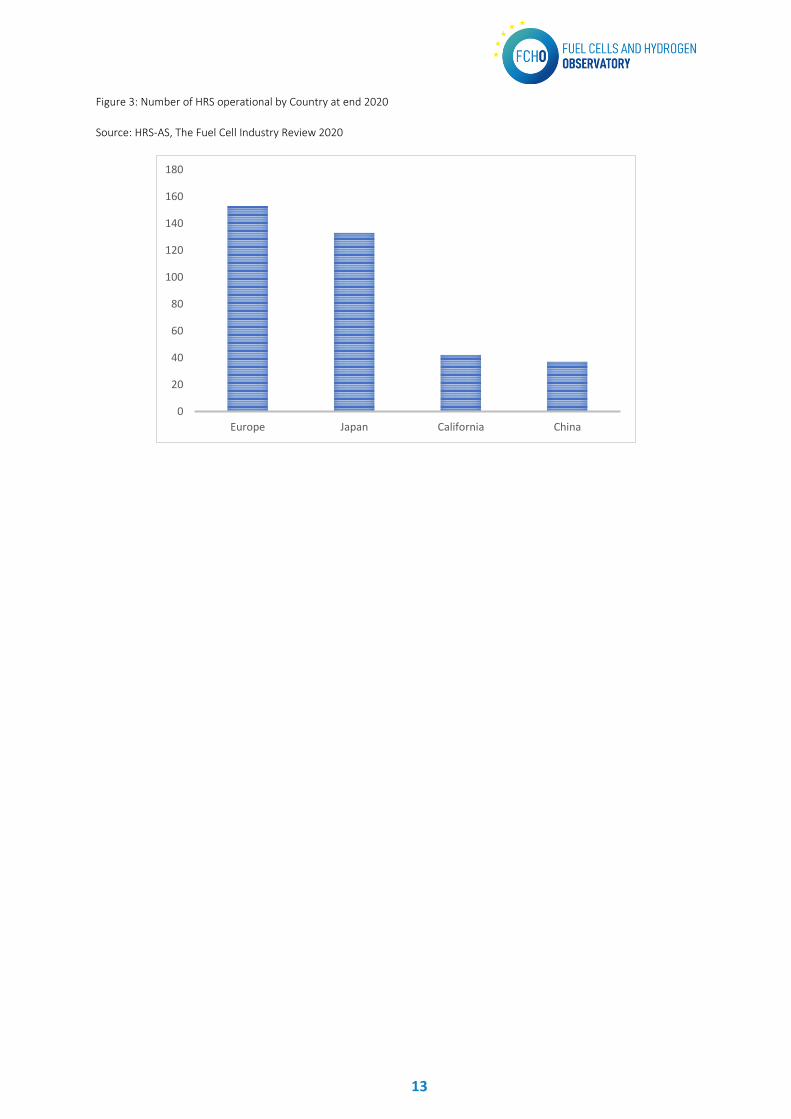
HRS deployment status can be seen in Figure 3 where Japan remains the leader with a total of 133 stations operational at the end of 2020, despite adding only 3 new HRS and falling short of its 2020 target of 160 stations due to COVID-19 induced supply chain delays. With support from ongoing regulatory reforms, Japan aims to accelerate the deployment of 320 HRS by 2025. In Korea, approximately 13 new stations were added in 2020, bringing the total to 43 operating HRS which is now far short of its national target of 310 stations by 2022.
In California, a total of 42 stations were operational with an addition 15 in development, coming just under the goal of 64 HRS by 2020. While the deployment rate has been fairly slow since 2018, the goal to have 200 stations by 2025 is still attainable and the next two years will be critical in meeting that ambition.
37 Hydrogen refuelling stations were in operation in China, with the addition of 9 new stations since 2019, putting them far behind their goal of 100 HRS by 2020. However, recent partnerships show promising signs of future growth in deployment to support trucks and buses used for the 2022 Beijing Winter Olympics.
87
1913
6 6 5 3 3 3 3 2 1 1 10
10
20
30
40
50
60
70
80
90
100
13
Figure 3: Number of HRS operational by Country at end 2020
Source: HRS-AS, The Fuel Cell Industry Review 2020
0
20
40
60
80
100
120
140
160
180
Europe Japan California China

14
4. Fuel Cell Vehicles
The fuel cell vehicle data is sourced from EAFO who use national (usually governmental) registration bodies, where they exist, to collate the data. Where no recognised national organisation exists to collect this data, desk research supplements the efforts. In this analysis ‘net new registrations’ excludes vehicles that have been exported or that have been decommissioned from service. The full list of relevant EAFO sources for country can be found at eafo.eu.
Despite COVID-19 challenges, Europe still saw a 41% growth in new registrations of fuel cell passenger cars in 2020 up to 2,750 vehicles, from a base of 1,959. German, France and the Netherlands experience the largest growth of 274, 211 and 148 vehicles respectively. Notably, the Netherlands has surpassed the UK in the number of total fuel cell vehicles due and took its place for having the third largest fuel cell fleet in Europe as seen in Figure 3.
Looking at trends within fuel cell vehicle manufactures, Hyundai and Toyota remain dominant, with the sales of NEXO, released by Hyundai at the end of 2018, outperforming the more established Mirai. The new model 2021 Mirai was released at the end of 2020, in line with Toyota’s announcements on increasing production capacity. New European registrations of Mercedes’ GLC F-Cell (Daimler’s fuel cell/electric hybrid) fell to 24 and though a long way behind the top two, Mercedes replaced Honda as the third largest FCEV OEM while Clarity’s sale fell to 0 in 2020. BMW confirmed that starting in 2022, it will be piloting a small series of ‘i Hydrogen Next’, developed in cooperation with Toyota, and this model is expected to become available to consumers after 2025. BMW has also announced their plans to release a consistent line up of FCEV by 2030. Light duty vehicles are combined with passenger vehicle in this analysis with new registration seen under both Mercedes’ Crafter and Volkswagen’s Transporter.
Figure 4: Net number of FCEVs registered by country at end 2020
Source: EAFO
The story is similar elsewhere, particularly in Asia. South Korea surpassed California to become the global leader in FCEV deployment after seeing a 38% increase in domestic shipments in 2020. This brings the total of Hyundai NEXOs on the road to 10,000. In Japan, domestic sales of Mirai grew from 2019 despite a decline in the international market. In California, however, FCEVs have been hard-hit by
0
50
100
150
200
250
300
350
L L6+L7 M1 N1 M2+M3 N2+N3
15
COVID, dropping to fewer than 1,000 passenger vehicles sold or leased in 2020 – the lowest number recorded since 2015.
A similar trend is observed with fuel cell bus registrations in Europe and countries with the most activities in 2020 includes Germany, United Kingdom and Latvia. Germany added 38 new buses in December of 2020, bringing the total number to 54 buses whilst 21 new buses were added to the UK fleet in 2020. Latvia witnessed the third largest growth in Europe with the addition of 10 fuel cell buses for the first time. Norway doubled the size of their fleet, adding another 5 new buses in 2020. Finally, Luxembourg also became fuel cell bus operators in 2020 with the first ever addition of 5 buses. While falling short of JIVE’s target to deploy 300 buses across Europe in 2020, these new registrations doubled the total number of fuel cell buses in Europe from 192 in 2019 to 390.
Fuel cell bus fleets are expanding at a much slower rate in the USA, with California leading the growth with 47 operating vehicles by 2020. The total number of buses in the country increase by 22 to a total of 64 buses.
In Asia, China leads with the largest fuel cell bus fleet with a total of 3,600 new vehicles by the end of 2020 and this level of growth is expected to continue in the coming years with ongoing support from the government. Elsewhere, South Korea expanded their fleet of 5 with 15 new buses and Japan is recorded to have a total of 91 fuel cell buses in service by the end of 2020.
Heavy goods vehicles have also started to growth with the delivery of the first 10 Hyundai Xicent fuel cell truck in Switzerland in July of 2020. A further 10 heavy-duty vehicles were registered by the end of 2020, making Switzerland the largest fuel cell truck fleet operator in Europe. Hyundai’s ambition is to put 1,600 hydrogen trucks on Swiss roads by 2025. Norway also added 5 of their first heavy-duty fuel cell trucks and the Netherlands added a further 2 new fuel cell trucks to their fleets. Heavy duty trucks are widely recognised as a ‘sweet spot’ for hydrogen and growth in this sector is expected to ramp in the coming years.
Outside of road transport, fuel cell technologies have also made progress in other transportation mediums in Europe, predominantly as demonstrator projects. September 2020, in the aviation industry, ZeroAvia flew a Piper M class six-seater plane for 20 mines powered by a 100kW Powercell stack. On water, Ballard’s Marine Centre at Hobro, Denmark launched the industry’s first module designed for primary propulsion power in ships. Back to the ground, two units of fuel cell powered Coradia iLint trains finished their 18-month passenger service trial, completing 180,000 km of service and 95% reliability on the Eisenbahnen Verkehrsbetrieb Elbe-Weser line in Lower Saxony in spring 2020. Their success paved the road for 14 Coradia iLints units that will begin commercial service in 2021/2022. In total, at least 41 train units were ordered to be produced in Salzgitter, Germany.