chapter 13 future population and water demand …
TRANSCRIPT
CHAPTER 13
FUTURE POPULATION
AND
WATER DEMAND PROJECTION

13 - 1
Chapter 13 FUTURE POPULATION AND WATER DEMAND PROJECTION
13.1 Future Population Projection
13.1.1 Procedures of Future Population Projection
Procedures of future population projection are summarized as shown on Figure 13.1.1. The projection starts from collection of past population records and evaluation of them. Based on obtained data, future population is calculated applying typical statistic equations. The calculations is conducted for each Kelurahan/Desa. Population density is also checked and results of the population projection are evaluated by comparing with the other available future population forecasts.
Population Census Data(1980, 1990, and 2000)
SUPAS Data(1985, 1995, and 2005)
Check PopulationDensity in Each
Kulurahan
Past Population Data forFuture Population Forecast
Calculation of FuturePopulation Using Statistic
Check PopulationIncrease Ratio
Equiations
Comparison with OtherPopulation Projection
by BPS
FuturePopulation
Check PopulationDensity in Future
Figure 13.1.1 Procedures or Future Population Projection
13.1.2 Past Population Record for Future Population Projection
GOI conducts population census every decades and the last census was conducted in year 2000. The census survey is conducted by door to door and the census data is the most reliable population data according to BPS (BADAN PUSAT STATISTIK, Board of Statistic Center), DIY.

13 - 2
In between the census year, after five years from the previous census, BPS conducts SUPAS to estimate population. SUPAS is a kind of sample survey conducted in the selected sampled area, therefore, accuracy of the results of SUPAS is lower than the census data. As past population data, past census data of 1980, 1990, and 2000 are provided by the BPS together with past SUPAS data of 1985, 1995, and 2005. Past population data in the Study Area is as shown below.
Table 13.1.1 Past Population Data, Yogyakarta Municipality Past Population Data / Year 1980 1985 1990 1995 2000 2005 Census Raw Data 398,192 na. 412,059 na. 396,711 na. Interpolated Census Data 398,192 405,126 412,059 407,564 396,711 389,037SUPAS Raw Data na. 405,126 na. 418,944 na. 435,236Interpolated Supas Data 398,192 405,126 412,059 418,944 396,711 435,236Average (Interpolated Census and SUPAS) 398,192 405,126 412,059 413,254 396,711 412,137
Source: BPS
0
50,000
100,000
150,000
200,000
250,000
300,000
350,000
400,000
450,000
500,000
1980 1985 1990 1995 2000 2005
Year
Popu
latio
n
Census Raw Data Interpolated Census DataSUPAS Raw Data Interpolated Supas DataAverage (Interpolated Census and SUPAS)
Source: BPS Figure 13.1.2 Past Population Data, Yogyakarta Municipality
Table 13.1.2 Past Population Data, Sleman Regency
Past Population Data / Year 1980 1985 1990 1995 2000 2005 Census Raw Data 677,323 na. 780,334 na. 901,377 na. Interpolated Census Data 677,323 728,829 780,334 852,615 901,377 961,899SUPAS Raw Data na. 728,829 na. 809,677 na. 990,130Interpolated Supas Data 677,323 728,829 780,334 809,677 901,377 990,130Average (Interpolated Census and SUPAS) 677,323 728,829 780,334 831,146 901,377 976,014
Source: BPS

13 - 3
0
200,000
400,000
600,000
800,000
1,000,000
1,200,000
1980 1985 1990 1995 2000 2005
Year
Popu
latio
n
Census Raw Data Interpolated Census DataSUPAS Raw Data Interpolated Supas DataAverage (Interpolated Census and SUPAS)
Source: BPS
Figure 13.1.3 Past Population Data, Sleman Regency
Table 13.1.3 Past Population Data, Bantul Regency Past Population Data / Year 1980 1985 1990 1995 2000 2005 Census Raw Data 634,442 696,905 781,013 Interpolated Census Data 634,442 665,674 696,905 738,959 781,013 823,067SUPAS Raw Data 665,674 707,028 862,961Interpolated Supas Data 634,442 665,674 696,905 707,028 781,013 862,961Average (Interpolated Census and SUPAS) 634,442 665,674 696,905 722,994 781,013 843,014
Source: BPS
0
100,000
200,000
300,000
400,000
500,000
600,000
700,000
800,000
900,000
1,000,000
1980 1985 1990 1995 2000 2005
Year
Popu
latio
n
Census Raw Data Interpolated Census DataSUPAS Raw Data Interpolated Supas DataAverage (Interpolated Census and SUPAS)
Source: BPS
Figure 13.1.4 Past Population Data, Bantul Regency
Since there is difference between interpolated Census data and SUPAS data, average population

13 - 4
data of these two data was employed as past population data for projection.
Census data and SUPAS data are available every 10 years, population in each year is calculated by interpolating.
For Yogyakarta Municipality, Sleman and Bantul Regencies, past population data for future population projection are as follows. Table 13.1.4 Yogyakarta Municipality, Past Population Data for Future Population
Projection Year 1980 1981 1982 1983 1984 1985 1986 1987 1988 1989 Pop. 398,192 399,579 400,965 402,352 403,739 405,126 406,512 407,899 409,286 410,672Year 1990 1991 1992 1993 1994 1995 1996 1997 1998 1999 Pop. 412,059 412,298 412,537 412,776 413,015 413,254 409,945 406,637 403,328 400,020Year 2000 2001 2002 2003 2004 2005 Pop. 396,711 399,796 402,881 405,966 409,051 412,137
Note: Pop. = Population
Yogyakarta
0
100,000
200,000
300,000
400,000
500,000
1980
1981
1982
1983
1984
1985
1986
1987
1988
1989
1990
1991
1992
1993
1994
1995
1996
1997
1998
1999
2000
2001
2002
2003
2004
2005
Year
Popu
latio
n
Figure 13.1.5 Yogyakarta Municipality, Past Population Data for Future Population
Projection Table 13.1.5 Sleman Regency, Past Population Data for Future Population Projection
Year 1980 1981 1982 1983 1984 1985 1986 1987 1988 1989 Pop. 677,323 687,624 697,925 708,226 718,527 728,829 739,130 749,431 759,732 770,033Year 1990 1991 1992 1993 1994 1995 1996 1997 1998 1999 Pop. 780,334 790,496 800,659 810,821 820,983 831,146 845,192 859,238 873,285 887,331Year 2000 2001 2002 2003 2004 2005 Pop. 901,377 916,304 931,232 946,159 961,087 976,014
Note: Pop. = Population

13 - 5
Sleman
0
200,000
400,000
600,000
800,000
1,000,000
1,200,000
1980
1981
1982
1983
1984
1985
1986
1987
1988
1989
1990
1991
1992
1993
1994
1995
1996
1997
1998
1999
2000
2001
2002
2003
2004
2005
Year
Popu
latio
n
Figure 13.1.6 Sleman Regency, Past Population Data for Future Population Projection Table 13.1.6 Bantul Regency, Past Population Data for Future Population Projection
Year 1980 1981 1982 1983 1984 1985 1986 1987 1988 1989 Pop. 634,442 640,688 646,935 653,181 659,427 665,674 671,920 678,166 684,412 690,659Year 1990 1991 1992 1993 1994 1995 1996 1997 1998 1999 Pop. 696,905 702,123 707,340 712,558 717,776 722,994 734,597 746,201 757,805 769,409Year 2000 2001 2002 2003 2004 2005 Pop. 781,013 793,413 805,813 818,214 830,614 843,014
Bantul
0100,000200,000300,000400,000
500,000600,000700,000800,000900,000
1980
1981
1982
1983
1984
1985
1986
1987
1988
1989
1990
1991
1992
1993
1994
1995
1996
1997
1998
1999
2000
2001
2002
2003
2004
2005
Year
Popu
latio
n
Figure 13.1.7 Bantul Regency, Past Population Data for Future Population Projection
Based on calculated past population data for future population projection for Yogyakarta Municipality, Sleman and Bantul Regencies, total Population of these three municipality and regencies are summarized as follows.

13 - 6
Table 13.1.7 Total Past Population Data for Future Population Projection
Year 1980 1981 1982 1983 1984 1985 1986 1987 1988 Yogyakarta 398,192 399,579 400,965 402,352 403,739 405,126 406,512 407,899 409,286Sleman 677,323 687,624 697,925 708,226 718,527 728,829 739,130 749,431 759,732Bantul 634,442 640,688 646,935 653,181 659,427 665,674 671,920 678,166 684,412Total Population 1,709,957 1,727,891 1,745,825 1,763,759 1,781,693 1,799,628 1,817,562 1,835,496 1,853,430Year 1989 1990 1991 1992 1993 1994 1995 1996 1997 Yogyakarta 410,672 412,059 412,298 412,537 412,776 413,015 413,254 409,945 406,637Sleman 770,033 780,334 790,496 800,659 810,821 820,983 831,146 845,192 859,238Bantul 690,659 696,905 702,123 707,340 712,558 717,776 722,994 734,597 746,201Total Population 1,871,364 1,889,298 1,904,917 1,920,536 1,936,155 1,951,774 1,967,393 1,989,735 2,012,076Year 1998 1999 2000 2001 2002 2003 2004 2005 Yogyakarta 403,328 400,020 396,711 399,796 402,881 405,966 409,051 412,137 Sleman 873,285 887,331 901,377 916,304 931,232 946,159 961,087 976,014 Bantul 757,805 769,409 781,013 793,413 805,813 818,214 830,614 843,014 Total Population 2,034,418 2,056,759 2,079,101 2,109,514 2,139,927 2,170,339 2,200,752 2,231,165
0
500,000
1,000,000
1,500,000
2,000,000
2,500,000
1980
1981
1982
1983
1984
1985
1986
1987
1988
1989
1990
1991
1992
1993
1994
1995
1996
1997
1998
1999
2000
2001
2002
2003
2004
2005
Year
Popu
latio
n
Yogyakarta Sleman Bantul
Figure 13.1.8 Total Past Population Data for Future Population Projection
Past population data for future population projection in each Kelurahan/Desa is shown in Appendix 13.
13.1.3 Past Population Increase Ratio
Based on the past population record, past population increase ratio was calculated. As shown on below, population increase ratio in Yogyakarta Municipality in past 25 years has been very low comparing to ratios of Sleman and Bantul. In last decade, population increase ratio in Yogyakarta has been minus and on the other hand, population in Sleman and Banturl Regencies are increasing by rather high increase ratio.

13 - 7
0.14%
1.47%
1.14%0.
00%
0.20
%
0.40
%
0.60
%
0.80
%
1.00
%
1.20
%
1.40
%
1.60
%
1.80
%
Yogyakarta
Sleman
Bantul
Average Annual Population Increase Ratio (1980 - 2005)
Figure 13.1.9 Average Annual Population Increase Ratio in Past 25 Years (1980 – 2005)
1.62%
1.55%
-0.03%
-0.2
0%
0.00
%
0.20
%
0.40
%
0.60
%
0.80
%
1.00
%
1.20
%
1.40
%
1.60
%
1.80
%
Yogyakarta
Sleman
Bantul
Average Annual Population Increase Ratio (1980 - 2005)
Figure 13.1.10 Average Annual Population Increase Ratio in Past 10 Years (1995 – 2005)
(1) Population Increase Ratio in Yogyakarta Municipality, Kecamatan Level Past trend of population increase in Yogyakarta Municipality by each Kecamatan is as shown below.
Yogyakarta
0
10,000
20,000
30,000
40,000
50,000
60,000
70,000
80,000
90,000
1980
1981
1982
1983
1984
1985
1986
1987
1988
1989
1990
1991
1992
1993
1994
1995
1996
1997
1998
1999
2000
2001
2002
2003
2004
2005
Year
Popu
latio
n
MANTRIJERONKRATONMERGANGSANUMBULHARJOKOTAGEDEGONDOKUSUMANDANUREJANPAKUALAMANGONDOMANANNGAMPILANWIROBRAJANGEDONGTENGENJETISTEGALREJO
Figure 13.1.11 Past Population Trend of Yogyakarta Municipality by Kecamatan Level
From the past population trend, population increase ratio in last 25 years and in last 10 years were obtained as shown below.

13 - 8
0.34%-1.26%
0.02%2.80%
2.62%-0.77%
-1.29%-1.28%
-1.82%-1.09%
0.41%-1.86%
-1.06%1.52%
-3.00% -2.00% -1.00% 0.00% 1.00% 2.00% 3.00% 4.00%
MANTRIJERONKRATON
MERGANGSANUMBULHARJO
KOTAGEDEGONDOKUSUMAN
DANUREJANPAKUALAMAN
GONDOMANANNGAMPILAN
WIROBRAJANGEDONGTENGEN
JETISTEGALREJO
Average Annual Population Increase Ratio by Kecamatan Level (1980 - 2005)
Figure 13.1.12 Average Annual Population Increase Ratio in Last 25 Years (1980 – 2005)
0.35%-1.09%
0.18%2.09%
0.93%-1.23%
-1.42%-1.06%
-2.28%-1.23%
0.31%-2.33%
-1.35%1.29%
-3.00% -2.00% -1.00% 0.00% 1.00% 2.00% 3.00% 4.00%
MANTRIJERONKRATON
MERGANGSANUMBULHARJO
KOTAGEDEGONDOKUSUMAN
DANUREJANPAKUALAMAN
GONDOMANANNGAMPILAN
WIROBRAJANGEDONGTENGEN
JETISTEGALREJO
Average Annual Population Increase Ratio by Kecamatan Level (1995 - 2005)
Figure 13.1.13 Average Annual Population Increase Ratio in Last 10 Years (1995 – 2005)
As shown on figures above, population is decreasing in many Kecamatans in Yogyakarta Municipality.
(2) Population Increase Ratio in Sleman Regency, Kecamatan Level Past trend of population increase in Sleman Regency by each Kecamatan is as shown below.
Sleman
0
20,000
40,000
60,000
80,000
100,000
120,000
140,000
160,000
180,000
200,000
1980
1981
1982
1983
1984
1985
1986
1987
1988
1989
1990
1991
1992
1993
1994
1995
1996
1997
1998
1999
2000
2001
2002
2003
2004
2005
Year
Popu
latio
n
MOYUDANMINGGIRSAYEGANGODEANGAMPINGMLATIDEPOKBERBAHPRAMBANANKALASANNGEMPLAKNGAGLIKSLEMANTEMPELTURIPAKEMCANGKRINGAN
Figure 13.1.14 Past Population Trend of Sleman Regency by Kecamatan Level
From the past population trend, population increase ratio in last 25 years and in last 10 years were obtained as shown below.
13 - 9
-0.16%-0.41%
0.44%1.04%
2.29%2.26%
3.06%0.88%
0.58%1.63%
1.48%2.81%
0.75%0.56%
0.69%0.33%0.32%
-1.00% -0.50% 0.00% 0.50% 1.00% 1.50% 2.00% 2.50% 3.00% 3.50% 4.00%
MOYUDANMINGGIR
SAYEGANGODEAN
GAMPINGMLATIDEPOK
BERBAHPRAMBANAN
KALASANNGEMPLAK
NGAGLIKSLEMANTEMPEL
TURIPAKEM
CANGKRINGAN
Average Annual Population Increase Ratio by Kecamatan Level (1980 - 2005)
Figure 13.1.15 Average Annual Population Increase Ratio in Last 25 Years (1980 – 2005)
0.25%0.04%
0.90%1.31%
0.92%2.31%2.32%
1.29%0.96%
2.28%2.25%
2.91%1.04%1.03%
1.33%0.82%
1.11%
-1.00% -0.50% 0.00% 0.50% 1.00% 1.50% 2.00% 2.50% 3.00% 3.50% 4.00%
MOYUDANMINGGIR
SAYEGANGODEAN
GAMPINGMLATIDEPOK
BERBAHPRAMBANAN
KALASANNGEMPLAK
NGAGLIKSLEMANTEMPEL
TURIPAKEM
CANGKRINGAN
Average Annual Population Increase Ratio by Kecamatan Level (1995 - 2005)
Figure 13.1.16 Average Annual Population Increase Ratio
in Last 10 Years (1995 – 2005)
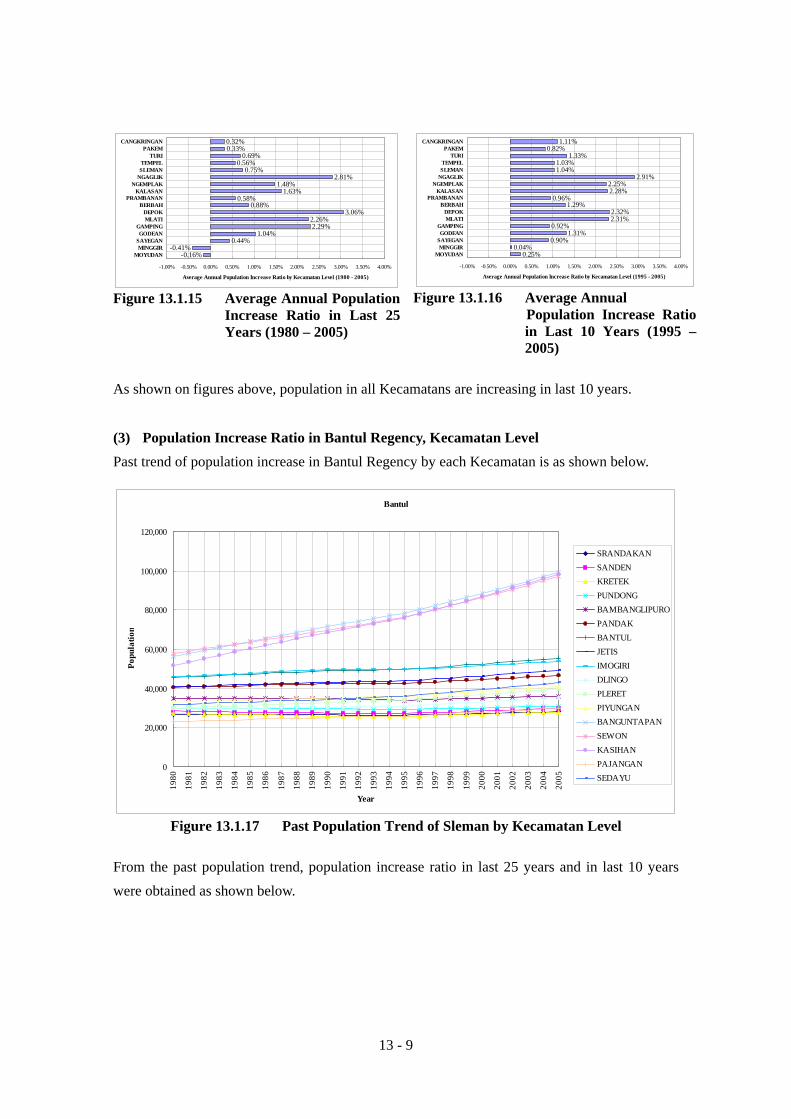
As shown on figures above, population in all Kecamatans are increasing in last 10 years.
(3) Population Increase Ratio in Bantul Regency, Kecamatan Level Past trend of population increase in Bantul Regency by each Kecamatan is as shown below.
Bantul
0
20,000
40,000
60,000
80,000
100,000
120,000
1980
1981
1982
1983
1984
1985
1986
1987
1988
1989
1990
1991
1992
1993
1994
1995
1996
1997
1998
1999
2000
2001
2002
2003
2004
2005
Year
Popu
latio
n
SRANDAKANSANDENKRETEKPUNDONGBAMBANGLIPUROPANDAKBANTULJETISIMOGIRIDLINGOPLERETPIYUNGANBANGUNTAPANSEWONKASIHANPAJANGANSEDAYU
Figure 13.1.17 Past Population Trend of Sleman by Kecamatan Level
From the past population trend, population increase ratio in last 25 years and in last 10 years were obtained as shown below.

13 - 10
0.23%0.18%
0.11%0.17%
0.13%0.57%
0.80%0.74%
0.64%0.67%
1.15%0.88%
2.29%2.09%
2.58%1.03%
1.23%
0.00% 0.50% 1.00% 1.50% 2.00% 2.50% 3.00%
SRANDAKANSANDENKRETEK
PUNDONGBAMBANGLIPURO
PANDAKBANTUL
JETISIMOGIRIDLINGOPLERET
PIYUNGANBANGUNTAPAN
SEWONKASIHAN
PAJANGANSEDAYU
Average Annual Population Increase Ratio by Kecamatan Level (1980 - 2005)
Figure 13.1.18 Average Annual Population Increase Ratio in Last 25 Years (1980 – 2005)
0.73%0.85%0.83%
0.59%0.59%
0.90%1.10%
1.16%0.85%
1.34%1.59%
1.36%2.38%2.43%
2.59%1.41%
1.76%
0.00% 0.50% 1.00% 1.50% 2.00% 2.50% 3.00%
SRANDAKANSANDENKRETEK
PUNDONGBAMBANGLIPURO
PANDAKBANTUL
JETISIMOGIRIDLINGOPLERET
PIYUNGANBANGUNTAPAN
SEWONKASIHAN
PAJANGANSEDAYU
Average Annual Population Increase Ratio by Kecamatan Level (1980 - 2005)
Figure 13.1.19 Average Annual Population Increase Ratio in Last 10 Years (1995 – 2005)
As shown on figures above, population in all Kecamatans are increasing in last 10 years.
(4) Area-wise Population Increase Ratio Area-wise population increase ratio by Kelurahan was also shown on figure below. This figure shows population increase ratio in last 10 years (1995 – 2005) in each Kelurahan. As shown on this figure, central part of Yogyakarta Municipality shows minus increase ratio (population is decreasing) and surrounding area of the central part shows very high population increase ratio.
30202
31005
31006
31004
31203
31202
20803
20905
20902
20901
20904
20903
20906
21002
20804
20802
20801
11703
11002 10802
11001
10201
10203
10202 10302
11902 10801
11901
10403
10401
31306
31201
31305
31104
31105
31002
31003
31103
31102
30908
30907
30905
30904
31001
30901
30902
30903
30802
30906
3070530804
30803
1 0 3 0 3
10404
1 0 5 0 1
1 0 5 0 3
31302
10405
10502
10406
10407
31303
31304
31101
3 1 3 0 1
10301
31403
10102
10103
31402
31404
30403
30801
30503
30704
30701
30702
30502
30402
30401
30303
30304
30305
30203
30204
30201
30102
30101
30601
30604
30501
30603
30602
31701
31602
31401
30703
31603
31702
31601
31501
31704
31703
20101
20204
20202
20104
20201
11602
11701
11702
11302
11202
11201
11301
31503
31502
10101
11101
11102
11403
11103
20502
20503
20501
20403
20103
2010220405
20402
20404
20401
20301
20302
20406
20407
11404
31504
20601
20504 11401
20505
1605
11603
11604
11601
10402
31307
31308
20701
11303
11402
20605
21201
20303
21202
20603
20602
21302
21305
20604
21304
21303
21301
20305
20304
20203
20205
21402
21401
21403
21405
21404
21406
21003
21004
21001
20702
20703
21206
2 1 2 0 5
21101
21104
2 1 1 0 3
2 1 1 0 2
21702
2140721501
21408
21502
21504
21702
21704
21503
21601
21204
2 1 6 0 2
21203
21701
21105
21603
21705
21605
21604
30301
30302
0 4 km
N
Figure 13.1.20 Population Increase Ratio in Last 10 Years in Each Kelurahan
(1995 – 2005)
Less than -1.0 %
-1.0 to 0.0 %
0.0 to +1.0 %
+1.0 to +2.0 %
More than +2.0 %
13 - 11
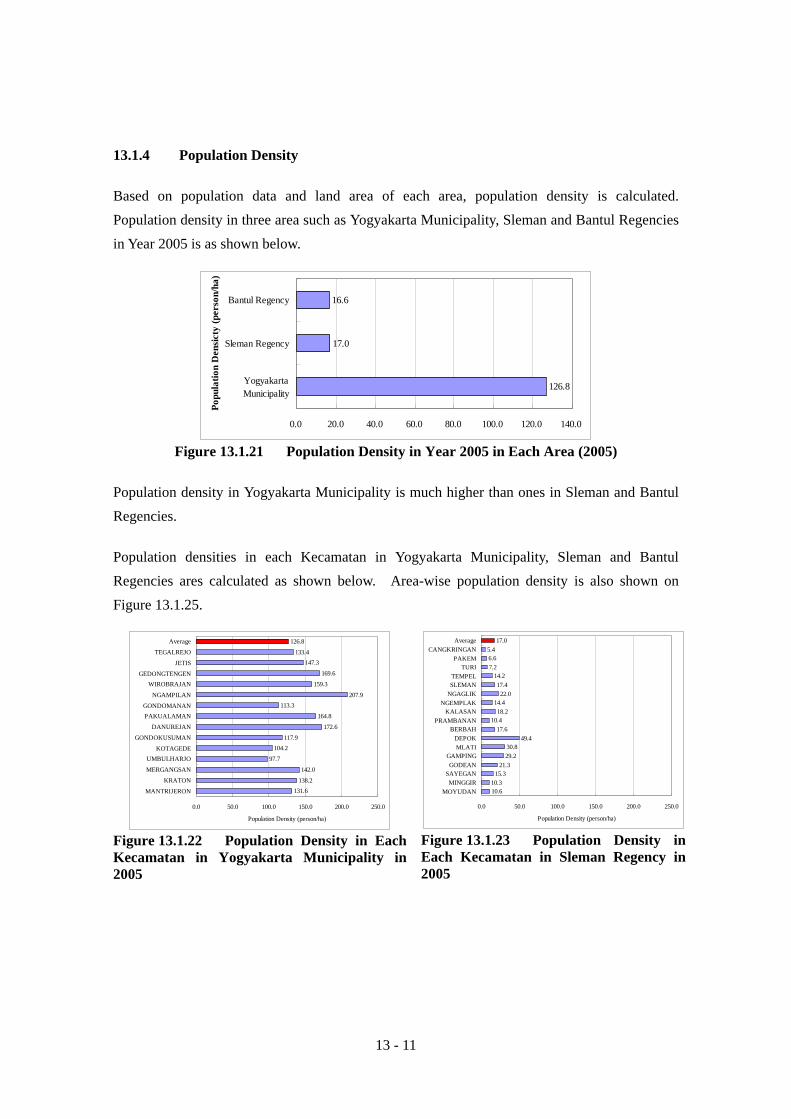
13.1.4 Population Density
Based on population data and land area of each area, population density is calculated. Population density in three area such as Yogyakarta Municipality, Sleman and Bantul Regencies in Year 2005 is as shown below.
126.8
17.0
16.6
0.0 20.0 40.0 60.0 80.0 100.0 120.0 140.0
YogyakartaMunicipality
Sleman Regency
Bantul Regency
Popu
latio
n D
ensi
cty
(per
son/
ha)
Figure 13.1.21 Population Density in Year 2005 in Each Area (2005)
Population density in Yogyakarta Municipality is much higher than ones in Sleman and Bantul Regencies.
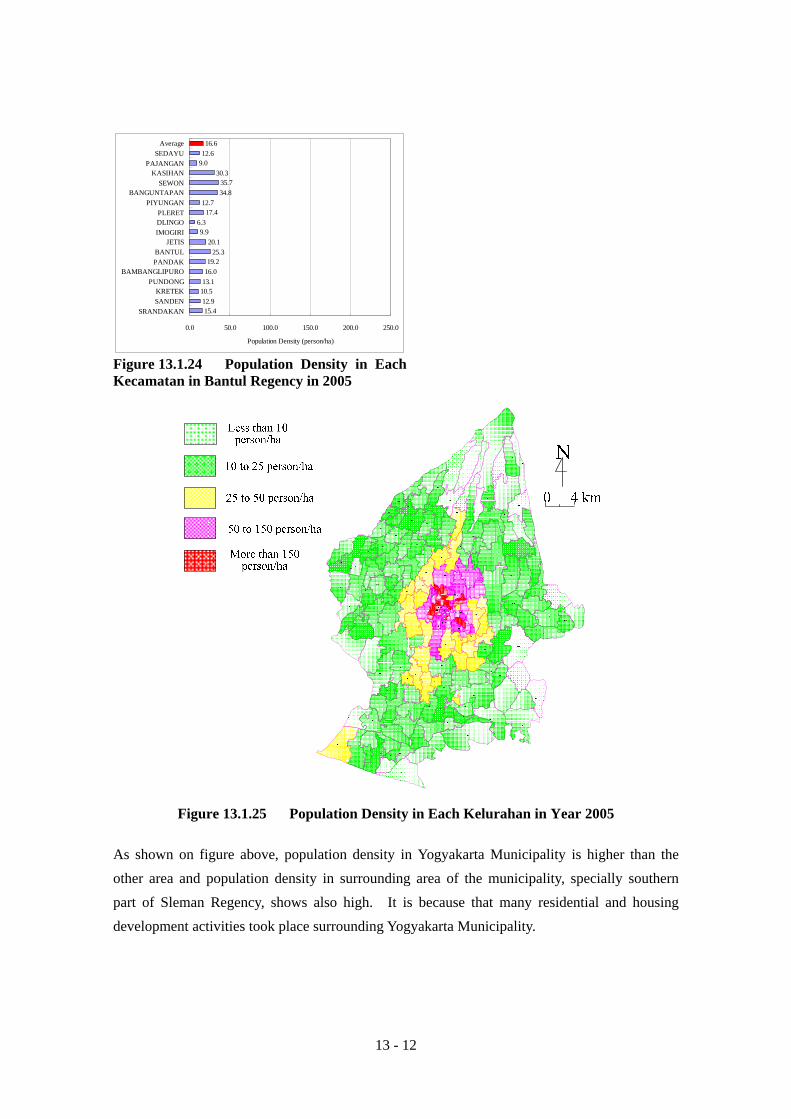
Population densities in each Kecamatan in Yogyakarta Municipality, Sleman and Bantul Regencies ares calculated as shown below. Area-wise population density is also shown on Figure 13.1.25.
131.6138.2
142.0
97.7
104.2117.9
172.6
164.8
113.3207.9
159.3
169.6
147.3133.4
126.8
0.0 50.0 100.0 150.0 200.0 250.0
MANTRIJERON
KRATON
MERGANGSAN
UMBULHARJOKOTAGEDE
GONDOKUSUMAN
DANUREJAN
PAKUALAMANGONDOMANAN
NGAMPILAN
WIROBRAJANGEDONGTENGEN
JETIS
TEGALREJO
Average
Population Density (person/ha)
Figure 13.1.22 Population Density in Each Kecamatan in Yogyakarta Municipality in 2005
10.610.3
15.321.3
29.230.8
49.417.6
10.418.2
14.422.0
17.414.2
7.26.65.4
17.0
0.0 50.0 100.0 150.0 200.0 250.0
MOYUDANMINGGIR
SAYEGANGODEAN
GAMPINGMLATI
DEPOKBERBAH
PRAMBANANKALASAN
NGEMPLAKNGAGLIKSLEMANTEMPEL
TURIPAKEM
CANGKRINGANAverage
Population Density (person/ha)
Figure 13.1.23 Population Density in Each Kecamatan in Sleman Regency in 2005
13 - 12
15.412.9
10.513.116.019.2
25.320.1
9.96.3
17.412.7
34.835.7
30.39.012.616.6
0.0 50.0 100.0 150.0 200.0 250.0
SRANDAKANSANDENKRETEK
PUNDONGBAMBANGLIPURO
PANDAKBANTUL
JETISIMOGIRIDLINGOPLERET
PIYUNGANBANGUNTAPAN
SEWONKASIHAN
PAJANGANSEDAYU
Average
Population Density (person/ha)
Figure 13.1.24 Population Density in Each Kecamatan in Bantul Regency in 2005
Figure 13.1.25 Population Density in Each Kelurahan in Year 2005
As shown on figure above, population density in Yogyakarta Municipality is higher than the other area and population density in surrounding area of the municipality, specially southern part of Sleman Regency, shows also high. It is because that many residential and housing development activities took place surrounding Yogyakarta Municipality.
13 - 13
13.1.5 Future Population Projection
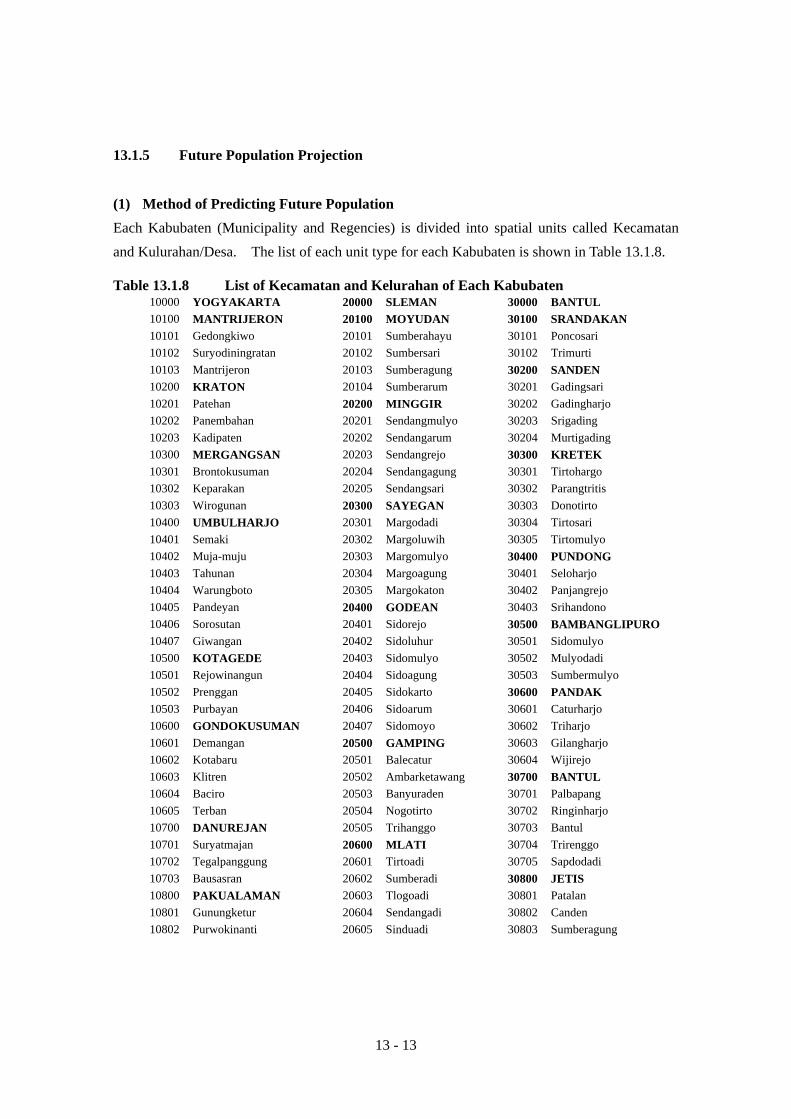
(1) Method of Predicting Future Population Each Kabubaten (Municipality and Regencies) is divided into spatial units called Kecamatan and Kulurahan/Desa. The list of each unit type for each Kabubaten is shown in Table 13.1.8. Table 13.1.8 List of Kecamatan and Kelurahan of Each Kabubaten
10000 YOGYAKARTA 20000 SLEMAN 30000 BANTUL 10100 MANTRIJERON 20100 MOYUDAN 30100 SRANDAKAN 10101 Gedongkiwo 20101 Sumberahayu 30101 Poncosari 10102 Suryodiningratan 20102 Sumbersari 30102 Trimurti 10103 Mantrijeron 20103 Sumberagung 30200 SANDEN 10200 KRATON 20104 Sumberarum 30201 Gadingsari 10201 Patehan 20200 MINGGIR 30202 Gadingharjo 10202 Panembahan 20201 Sendangmulyo 30203 Srigading 10203 Kadipaten 20202 Sendangarum 30204 Murtigading 10300 MERGANGSAN 20203 Sendangrejo 30300 KRETEK 10301 Brontokusuman 20204 Sendangagung 30301 Tirtohargo 10302 Keparakan 20205 Sendangsari 30302 Parangtritis 10303 Wirogunan 20300 SAYEGAN 30303 Donotirto 10400 UMBULHARJO 20301 Margodadi 30304 Tirtosari 10401 Semaki 20302 Margoluwih 30305 Tirtomulyo 10402 Muja-muju 20303 Margomulyo 30400 PUNDONG 10403 Tahunan 20304 Margoagung 30401 Seloharjo 10404 Warungboto 20305 Margokaton 30402 Panjangrejo 10405 Pandeyan 20400 GODEAN 30403 Srihandono 10406 Sorosutan 20401 Sidorejo 30500 BAMBANGLIPURO10407 Giwangan 20402 Sidoluhur 30501 Sidomulyo 10500 KOTAGEDE 20403 Sidomulyo 30502 Mulyodadi 10501 Rejowinangun 20404 Sidoagung 30503 Sumbermulyo 10502 Prenggan 20405 Sidokarto 30600 PANDAK 10503 Purbayan 20406 Sidoarum 30601 Caturharjo 10600 GONDOKUSUMAN 20407 Sidomoyo 30602 Triharjo 10601 Demangan 20500 GAMPING 30603 Gilangharjo 10602 Kotabaru 20501 Balecatur 30604 Wijirejo 10603 Klitren 20502 Ambarketawang 30700 BANTUL 10604 Baciro 20503 Banyuraden 30701 Palbapang 10605 Terban 20504 Nogotirto 30702 Ringinharjo 10700 DANUREJAN 20505 Trihanggo 30703 Bantul 10701 Suryatmajan 20600 MLATI 30704 Trirenggo 10702 Tegalpanggung 20601 Tirtoadi 30705 Sapdodadi 10703 Bausasran 20602 Sumberadi 30800 JETIS 10800 PAKUALAMAN 20603 Tlogoadi 30801 Patalan 10801 Gunungketur 20604 Sendangadi 30802 Canden 10802 Purwokinanti 20605 Sinduadi 30803 Sumberagung

13 - 14
10900 GONDOMANAN 20700 DEPOK 30804 Trimulyo 11404 Bener 21100 NGEMPLAK 31104 Bawuran 11403 Tegalrejo 21004 Selomartani 31103 Segoroyoso 11402 Karangwaru 21003 Tamanmartani 31102 Pleret 11401 Kricak 21002 Tirtomartani 31101 Wonokromo 11400 TEGALREJO 21001 Purwomartani 31100 PLERET 11303 Cokrodiningratan 21000 KALASAN 31006 Terong 11302 Gowongan 20906 Bokoharjo 31005 Jatimulyo 11301 Bumijo 20905 Madurojo 31004 Temuwuh 11300 JETIS 20904 Sambirojo 31003 Dlingo 11202 Sosromenduran 20903 Gayamharjo 31002 Muntuk 11201 Pringgokusuman 20902 Wukirharjo 31001 Mangunan 11200 GEDONGTENGEN 20901 Sumberharjo 31000 DLINGO 11103 Pakuncen 20900 PRAMBANAN 30908 Wukirsari 11102 Wirobrajan 20804 Kalitirto 30907 Imogiri 11101 Patangpuluhan 20803 Jogotirto 30906 Karangtalun 11100 WIROBRAJAN 20802 Tegaltirto 30905 Girirejo 11002 Ngampilan 20801 Sendangtirto 30904 Karangtengah 11001 Notoprajan 20800 BERBAH 30903 Kebonagung 11000 NGAMPILAN 20703 Condongcatur 30902 Sriharjo 10902 Prawirodirjan 20702 Maguwoharjo 30901 Selopamioro 10901 Ngupasan 20701 Caturtunggal 30900 IMOGIRI
21101 Wedomartani 31105 Wonolelo 21102 Widodomartani 31200 PIYUNGAN 21103 Bimomartani 31201 Sitimulyo 21104 Sindumartani 31202 Srimulyo 21105 Umbulmartani 31203 Srimartani 21200 NGAGLIK 31300 BANGUNTAPAN 21201 Sariharjo 31301 Tamanan 21202 Donoharjo 31302 Jagalan 21203 Sardonoharjo 31303 Singosaren 21204 Sukoharjo 31304 Wirokerten 21205 Sinduharjo 31305 Jambidan 21206 Minomartani 31306 Potorono 21300 SLEMAN 31307 Baturetno 21301 Caturharjo 31308 Banguntapan 21302 Triharjo 31400 SEWON 21303 Tridadi 31401 Pendowoharjo 21304 Pandowoharjo 31402 Timbulharjo 21305 Trimulyo 31403 Bangunharjo 21400 TEMPEL 31404 Panggungharjo 21401 Banyurejo 31500 KASIHAN 21402 Tambakrejo 31501 Bangunjiwo 21403 Sumberejo 31502 Tirtonimolo 21404 Pondokrejo 31503 Tamantirto 21405 Mororejo 31504 Ngestiharjo 21406 Margorejo 31600 PAJANGAN 21407 Lumbungrejo 31601 Triwidadi 21408 Merdikorejo 31602 Sendangsari 21500 TURI 31603 Guwosari

13 - 15
21501 Bangunkerto 31700 SEDAYU 21502 Donokerto 31701 Argodadi 21503 Girikerto 31702 Argorejo 21504 Wonokerto 31703 Argosari 21600 PAKEM 31704 Argomulyo 21601 Purwobinangun 21602 Candibinangun 21603 Harjobinangun 21604 Pakembinangun 21605 Hargobinangun 21700 CANGKRINGAN 21701 Wukirsari 21702 Argomulyo 21703 Glagaharjo 21704 Kepuharjo 21705 Umbulharjo
The future population is projected for each Kelurahan using the five equations listed below. The past population record discussed in the previous section is applied to estimate the population size for all years up until 2020 which is the master plan target year.
Equations used to estimate future population size are; 1. Arithmetic Line, 2. Geometric Curve, 3. Exponential Curve, 4. Power Curve, and 5. Logistic Curve.
Future population is calculated by these five equations and results derived from these equations are compared by conformity coefficient to the past population record. Future population which shows the highest coefficient is selected as future population for respective unit. Figures as shown below are the examples of future population projection using above five equations.

13 - 16
4,000
6,000
8,000
10,000
12,000
14,000
16,000
18,000
20,000
22,000
24,000
1980
1981
1982
1983
1984
1985
1986
1987
1988
1989
1990
1991
1992
1993
1994
1995
1996
1997
1998
1999
2000
2001
2002
2003
2004
2005
2006
2007
2008
2009
2010
2011
2012
2013
2014
2015
2016
2017
2018
2019
2020
2021
2022
Year
Popu
latio
n
Data Arithmetic Geometric Exponential Power Logistic
Figure 13.1.26 Example of Future Population Projection (Sleman, Sidoarum Kuluraha, Exponential Curve was selected)
6,000
8,000
10,000
12,000
14,000
16,000
18,000
1980
1981
1982
1983
1984
1985
1986
1987
1988
1989
1990
1991
1992
1993
1994
1995
1996
1997
1998
1999
2000
2001
2002
2003
2004
2005
2006
2007
2008
2009
2010
2011
2012
2013
2014
2015
2016
2017
2018
2019
2020
2021
2022
Year
Popu
latio
n
Data Arithmetic Geometric Exponential Power Logistic
Figure 13.1.27 Example of Future Population Projection (Bantul, Wonokromo Kuluraha, Geometric Curve was selected)
The total estimated future population for each Kecamatan and Kabubaten was determined by summing the estimated population for each of its units.
13 - 17
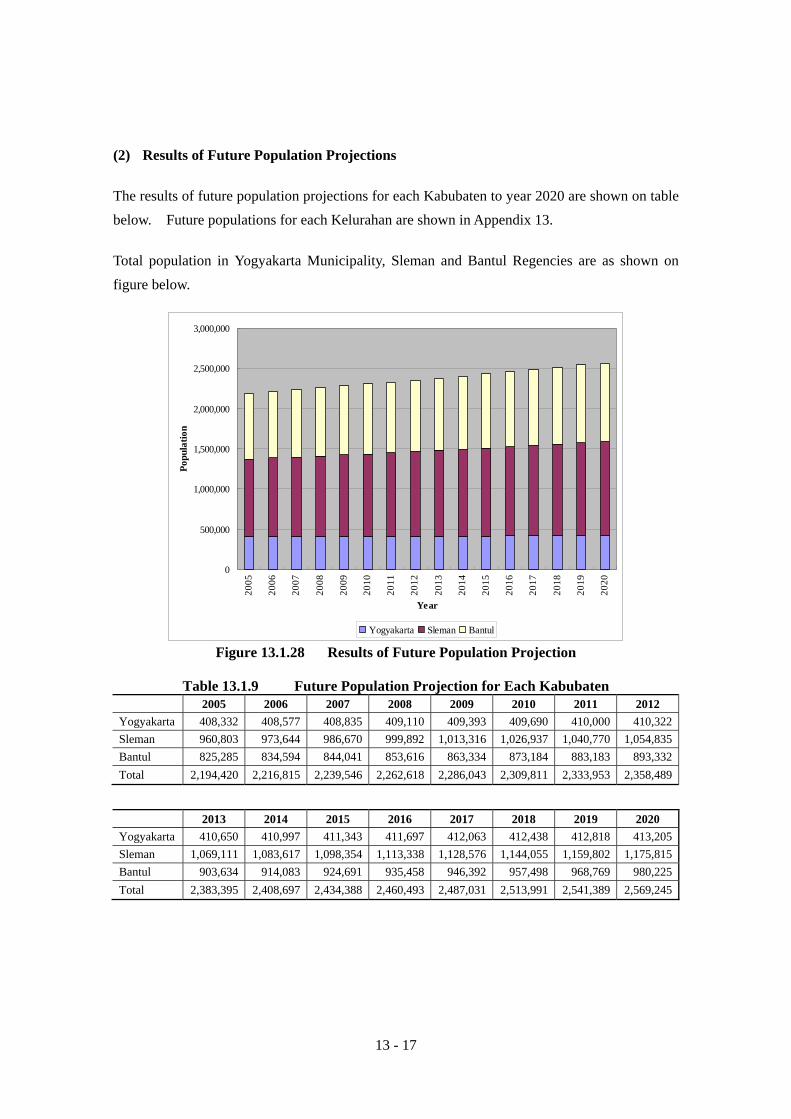
(2) Results of Future Population Projections
The results of future population projections for each Kabubaten to year 2020 are shown on table below. Future populations for each Kelurahan are shown in Appendix 13.
Total population in Yogyakarta Municipality, Sleman and Bantul Regencies are as shown on figure below.
0
500,000
1,000,000
1,500,000
2,000,000
2,500,000
3,000,000
2005
2006
2007
2008
2009
2010
2011
2012
2013
2014
2015
2016
2017
2018
2019
2020
Year
Popu
latio
n
Yogyakarta Sleman Bantul
Figure 13.1.28 Results of Future Population Projection
Table 13.1.9 Future Population Projection for Each Kabubaten 2005 2006 2007 2008 2009 2010 2011 2012
Yogyakarta 408,332 408,577 408,835 409,110 409,393 409,690 410,000 410,322Sleman 960,803 973,644 986,670 999,892 1,013,316 1,026,937 1,040,770 1,054,835Bantul 825,285 834,594 844,041 853,616 863,334 873,184 883,183 893,332Total 2,194,420 2,216,815 2,239,546 2,262,618 2,286,043 2,309,811 2,333,953 2,358,489
2013 2014 2015 2016 2017 2018 2019 2020
Yogyakarta 410,650 410,997 411,343 411,697 412,063 412,438 412,818 413,205Sleman 1,069,111 1,083,617 1,098,354 1,113,338 1,128,576 1,144,055 1,159,802 1,175,815Bantul 903,634 914,083 924,691 935,458 946,392 957,498 968,769 980,225Total 2,383,395 2,408,697 2,434,388 2,460,493 2,487,031 2,513,991 2,541,389 2,569,245

13 - 18
(3) Comparison with Other Population Projections
The BPS also projected future population until year 2009 by Kabubaten level. Following figures show comparison of results of population projection.
0100,000200,000
300,000400,000500,000600,000700,000
800,000900,000
1,000,000
2005
2006
2007
2008
2009
2010
2011
2012
2013
2014
2015
2016
2017
2018
2019
2020
Year
Popu
latio
n
JICA Study Projection BPS Population Projection
Figure 13.1.29 Yogyakarta Municipality Comparison of Population Projection (by JICA Study and BPS)
0
200,000
400,000
600,000
800,000
1,000,000
1,200,000
1,400,000
2005
2006
2007
2008
2009
2010
2011
2012
2013
2014
2015
2016
2017
2018
2019
2020
Year
Popu
latio
n
JICA Study Projection BPS Population Projection
Figure 13.1.30 Sleman Regency Comparison of Population Projection (by JICA Study and BPS)

13 - 19
0
200,000
400,000
600,000
800,000
1,000,000
1,200,000
2005
2006
2007
2008
2009
2010
2011
2012
2013
2014
2015
2016
2017
2018
2019
2020
Year
Popu
latio
n
JICA Study Projection BPS Population Projection
Figure 13.1.31 Bantul Regency Comparison of Population Projection (by JICA Study and BPS)
0
500,000
1,000,000
1,500,000
2,000,000
2,500,000
3,000,000
2005
2006
2007
2008
2009
2010
2011
2012
2013
2014
2015
2016
2017
2018
2019
2020
Year
Popu
latio
n
JICA Study Projection BPS Population Projection
Figure 13.1.32 Total Population Projection (Yogyakarta, Sleman, and Bantul) Comparison of Population Projection (by JICA Study and BPS)
As shown on above comparison, results of future population projection by JICA Study Team are very similar to the projection made by the BPS.
(4) Future Population Density
Population density in the Study Area in Year 2020 is calculated as shown below.

13 - 20
30202
31005
31006
31004
31203
31202
20803
20905
20902
20901
20904
20903
20906
21002
20804
20802
20801
11703
11002 10802
11001
10201
10203
10202
10302
11902
10801 11901
10403
10401
31306
31201
31305
31104
31105
31002
31003
31103
31102
30908
30907
30905
30904
31001
30901
30902
30903
30802
30906
30804
30803
10303 10404
10501
10503
31302
10405
10502
10406
10407
31303
31304
31101
31301
10301
31403
1010210103
31402
31404
30403
30801
30503
30704
30701
30702
30502
30402
30401
30303
30304
30305
30203
30204
30201
30102
30101
30601
30604
30501
30603
30602
31701
31602
31401
30703
31603
31702
31601
31501
31704
31703
20101
20204
20202
20104
20201
10602
11701
11702
11302
1120211201
11301
31503
31502
10101
11101
11102
11403
11103
20502
20503
20501
20403
20103
20102
20405
20402
20404
20401
20301
20302
20406
20407
11404
31504
20601
20504
11401
20505
10605
10603
10604
10601
10402
31307
31308
20701
11303
11402
20605
21201
20303
21202
20603
20602
21302
21305
20604
21304
21303
21301
20305
20304
20203
20205
21402
21401
21403
21405
21404
21406
21003
21004
21001
20702
20703
21206
21205
21101
21104 21103
21102
21702
21407
21501
21408
21502
21504
21702
21704
21503
21601
21204
21602
21203
21701
21105
21603
21705
21605
21604
30301
30302
30705
Figure 13.1.33 Population Density in the Study Area in Year 2020

13 - 21
13.2 Future Water Demand Projection
13.2.1 Review of Current Situation of Water Supply by Three PDAMs
Tables 13.2.1 to 13.2.3 show performance records of three PDAMs, Yogyakarta Municipality, Sleman and Bantul Regencies.
These records of respective PDAM performance is a basic information for future water demand projections.
13.2.2 Domestic per Capita Water Consumption
(1) Current Domestic Per Capita Water Demand As summarized tables below, current level of the domestic per capita water consumption for study area is as follows. Table 13.2.4 Current Level of Domestic Per Capita Water Consumption (2005) (lpcd)
PDAM Yogyakarta 163 PDAM Sleman 80 PDAM Bantul 99
Source: Respective PDAM
020406080
100
120140160180200
1996 1997 1998 1999 2000 2001 2002 2003 2004 2005
Year
Dom
estic
Per
Cap
ita W
ater
Con
sum
ptio
n (lp
cd)
Yogyakarta PDAM Sleman PDAM Bantul PDAM Figure 13.2.1 Domestic per Capita Water Consumption (l/sec)

13 - 22
Table 13.2.1 Summary of PDAM Yogyakarta Performance
1996 1997 1998 1999 2000 2001 2002 2003 2004 2005 Total Population person 406,735 406,856 406,995 407,142 407,306 407,484 407,673 407,881 408,096 408,332
Total Water Production l/sec 509.4 559.6 578.8 570.6 546.6 584.7 533.9 543.9 548.8 580.0 Total Water Consumption l/sec 343.4 357.6 354.0 356.3 373.4 375.9 370.1 351.6 347.3 341.0
Public Services l/sec 14.1 15.3 16.3 16.3 16.2 16.5 15.3 14.1 14.5 14.3 Domestic l/sec 294.4 310.7 309.2 309.4 319.0 326.4 323.1 309.6 310.0 305.7
Commercial l/sec 26.0 27.1 25.2 27.0 28.4 28.3 27.8 24.9 19.5 17.7 Industrial l/sec 0.7 0.4 0.2 0.2 0.5 0.5 0.5 0.4 0.3 0.2
Public Standpipe l/sec 4.7 1.8 0.4 0.6 6.3 0.5 0.5 0.4 0.6 0.7 Palace l/sec 3.3 2.3 2.7 2.8 3.0 3.7 3.0 2.2 2.4 2.3
Non Revenue Water (NRW) l/sec 166.0 202.0 224.7 214.3 173.3 208.8 163.7 192.4 201.4 239.0 UFW Ratio % 32.6% 36.1% 38.8% 37.6% 31.7% 35.7% 30.7% 35.4% 36.7% 41.2%
Number of Domestic Connection Nos 27,996 28,769 29,730 30,437 31,212 31,855 32,214 32,276 32,387 32,398 Served Population person 139,980 143,845 148,650 152,185 156,060 159,275 161,070 161,380 161,935 161,990
(1 connection for 5 family members) 5 5 5 5 5 5 5 5 5 5 Service Ratio % 34.4% 35.4% 36.5% 37.4% 38.3% 39.1% 39.5% 39.6% 39.7% 39.7%
Domestic Per Capita Water Consumpti
on lpcd 182 187 180 176 177 177 173 166 165 163

13 - 23
Table 13.2.2 Summary of PDAM Sleman Performance 2004 2005 Total Population person 948,146 960,803 Total Water Production l/sec 159.3 178.0 Total Water Consumption l/sec 96.1 95.4 Public Services l/sec 3.3 4.0 Domestic l/sec 88.9 87.7 Commercial l/sec 2.1 1.8 Industrial l/sec Public Standpipe l/sec 1.8 1.8 Palace l/sec Non Revenue Water (NRW) l/sec 63.2 82.6 UFW Ratio % 39.6% 46.4% Number of Domestic Connection Nos 18,788 18,994 Served Population person 93,940 94,970 (1 connection for 5 family members) 5 5 Service Ratio % 9.9% 9.9% Domestic Per Capita Water Consumption lpcd 82 80
Table 13.2.3 Summary of PDAM Bantul Performance 2004 2005 Total Population person 816,100 825,285Total Water Production l/sec 102.7 107.4Total Water Consumption l/sec 61.6 62.8 Public Services l/sec 1.4 2.7 Domestic l/sec 57.8 59.4 Commercial l/sec 0.3 0.5 Industrial l/sec 0.1 0.1 Public Standpipe l/sec 2.1 2.1 Palace l/sec Non Revenue Water (NRW) l/sec 41.0 44.6 NRW Ratio % 40.0% 41.5%Number of Domestic Connection Nos 10,333 10,333Served Population person 51,665 51,665(1 connection for 5 family members) 5 5Service Ratio % 6.3% 6.3%Domestic Per Capita Water Consumption lpcd 97 99

13 - 24
(2) Domestic per Capita Water Consumption in Urban and Rural Area The domestic per capita water consumption for respective PDAMs described in the previous section are obtained by dividing total domestic water consumption by total number of served population. Therefore, these domestic per capita water consumption represent average per capita water consumption for whole service area of respective PDAM.
Because of difference of living standard in urban and rural area, per capita water consumption in urban and rural area must be different. From this view point, domestic per capita water consumption in urban area and rural area are studied and compared.
Since there is no clear cut definition or boundary of the urban area in the Study area, the Study referred UAY (Urban Agglomeration of Yogyakarta) as urban area. The UAY is planned in Yogyakarta Urban Development Project (YUDP) and as shown on figure below.
Figure 13.2.2 Boundary of Urban Agglomeration of Yogyakarta (UAY) by YUDP
13 - 25
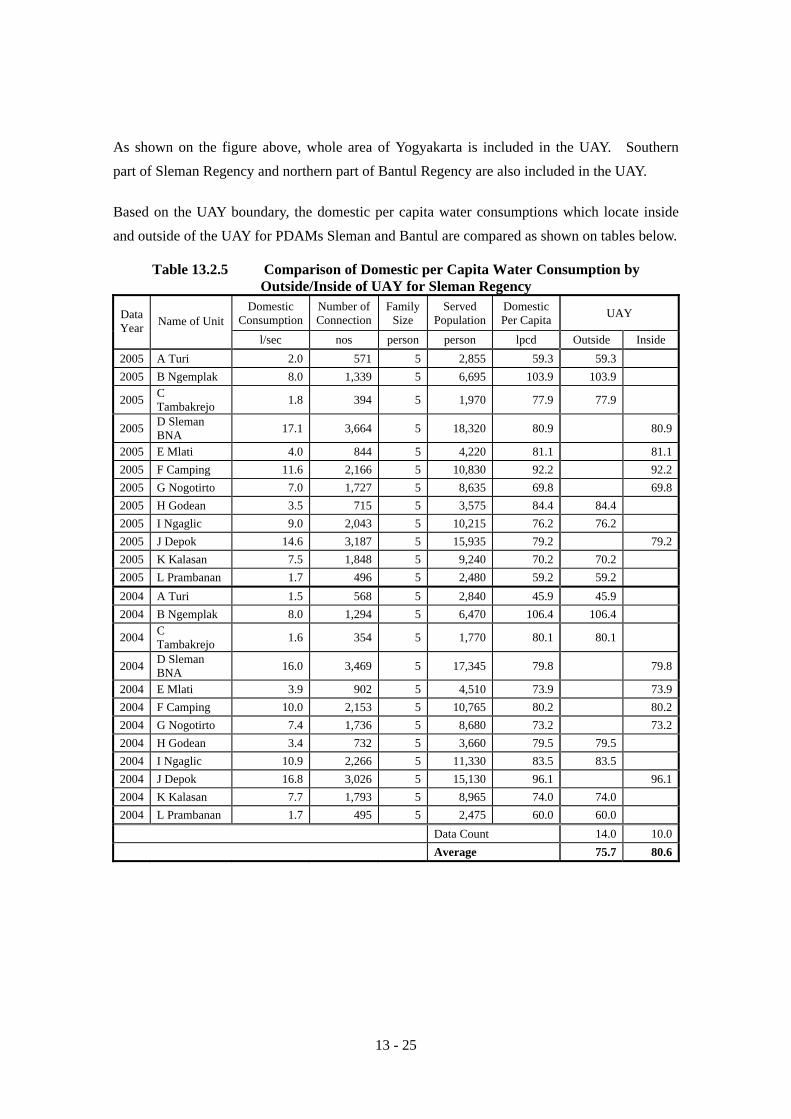
As shown on the figure above, whole area of Yogyakarta is included in the UAY. Southern part of Sleman Regency and northern part of Bantul Regency are also included in the UAY.
Based on the UAY boundary, the domestic per capita water consumptions which locate inside and outside of the UAY for PDAMs Sleman and Bantul are compared as shown on tables below.
Table 13.2.5 Comparison of Domestic per Capita Water Consumption by Outside/Inside of UAY for Sleman Regency
Domestic Consumption
Number of Connection
Family Size
Served Population
Domestic Per Capita UAY Data
Year Name of Unit l/sec nos person person lpcd Outside Inside
2005 A Turi 2.0 571 5 2,855 59.3 59.3 2005 B Ngemplak 8.0 1,339 5 6,695 103.9 103.9
2005 C Tambakrejo 1.8 394 5 1,970 77.9 77.9
2005 D Sleman BNA 17.1 3,664 5 18,320 80.9 80.9
2005 E Mlati 4.0 844 5 4,220 81.1 81.12005 F Camping 11.6 2,166 5 10,830 92.2 92.22005 G Nogotirto 7.0 1,727 5 8,635 69.8 69.82005 H Godean 3.5 715 5 3,575 84.4 84.4 2005 I Ngaglic 9.0 2,043 5 10,215 76.2 76.2 2005 J Depok 14.6 3,187 5 15,935 79.2 79.22005 K Kalasan 7.5 1,848 5 9,240 70.2 70.2 2005 L Prambanan 1.7 496 5 2,480 59.2 59.2 2004 A Turi 1.5 568 5 2,840 45.9 45.9 2004 B Ngemplak 8.0 1,294 5 6,470 106.4 106.4
2004 C Tambakrejo 1.6 354 5 1,770 80.1 80.1
2004 D Sleman BNA 16.0 3,469 5 17,345 79.8 79.8
2004 E Mlati 3.9 902 5 4,510 73.9 73.92004 F Camping 10.0 2,153 5 10,765 80.2 80.22004 G Nogotirto 7.4 1,736 5 8,680 73.2 73.22004 H Godean 3.4 732 5 3,660 79.5 79.5 2004 I Ngaglic 10.9 2,266 5 11,330 83.5 83.5 2004 J Depok 16.8 3,026 5 15,130 96.1 96.12004 K Kalasan 7.7 1,793 5 8,965 74.0 74.0 2004 L Prambanan 1.7 495 5 2,475 60.0 60.0 Data Count 14.0 10.0 Average 75.7 80.6

13 - 26
Table 13.2.6 Comparison of Domestic per Capita Water Consumption by
Outside/Inside of UAY for Bantul Regency Domestic
ConsumptionNumber of Connection
Family Size
Served Population
Domestic Per Capita UAY Data
Year Name of Unit l/sec nos person person lpcd Outside Inside
2005 1.Sedayu 7.036 1,512 5 7,561 80.4 80.4 2005 2.Kasihan 7.611 1,229 5 6,147 107.0 107.02005 3.Bangunjiwo 8.165 1,552 5 7,760 90.9 90.92005 4.Sewon 6.683 1,162 5 5,812 99.3 99.32005 5.Banguntapan 2.557 470 5 2,352 93.9 93.92005 6.Guosari 6.820 1,449 5 7,245 81.3 81.3 2005 7.Bantul 8.204 975 5 4,874 145.4 145.4 2005 8.Imogiri 1.479 297 5 1,487 85.9 85.9 2005 9.Trimulyo 1.856 538 5 2,692 59.6 59.6 2005 10.Srandakan 1.897 390 5 1,949 84.1 84.1 2005 11.Bambanglipuro 1.181 217 5 1,084 94.1 94.1 2005 12.Dlingo 5.952 540 5 2,702 190.3 190.3 2004 1.Sedayu 6.507 1,374 5 6,869 81.8 81.8 2004 2.Kasihan 7.155 1,113 5 5,567 111.0 111.02004 3.Bangunjiwo 8.319 1,470 5 7,349 97.8 97.82004 4.Sewon 6.109 1,046 5 5,229 100.9 100.92004 5.Banguntapan 2.305 410 5 2,049 97.2 97.22004 6.Guosari 5.995 1,334 5 6,670 77.7 77.7 2004 7.Bantul 7.735 922 5 4,611 144.9 144.9 2004 8.Imogiri 1.484 299 5 1,493 85.9 85.9 2004 9.Trimulyo 1.439 477 5 2,386 52.1 52.1 2004 10.Srandakan 2.040 394 5 1,968 89.6 89.6 2004 11.Bambanglipuro 1.042 203 5 1,013 88.9 88.9 2004 12.Dlingo 7.628 1,292 5 6,461 102.0 102.0 Data Count 16.0 8.0 Average 96.5 99.8
The domestic per capita water consumptions are summarized as shown below.
Table 13.2.7 Summary of Domestic Per Capita Water Consumption in Each Area Domestic Per Capita Water
Consumption (lpcd) PDAM Yogyakarta Urban 163.1 PDAM Sleman Urban (inside of UAY) 80.6 PDAM Sleman Rural (outside of UAY) 75.7 PDAM Bantul Urban (inside of UAY) 99.8 PDAM Bantul Rural (outside of UAY) 96.5

13 - 27
(3) Consideration on Selection of Urban Area for Master Planning Basis of selection of the urban area is Urban Agglomeration of Yogyakarta (UAY). In addition to the UAY, future population density in year 2020 is also taken into account. Since population density in fringe area of UAY will reach more than 25 person/ha according to the results of future population projection discussed above, other Kelurahan/Desa of which population density will be more than 25 person/ha even though outside of UAY, they are considered as urban area.
Based on consideration above, urban Kelurahan/Desa in Sleman and Bantul Regencies are selected as shown table below. Whole area of Yogyakarta Municipality is treated as urban area.

13 - 28
Table 13.2.8 Selection of Urban Area Area
ha20000 Sleman Regency20703 Condongcatur 82,802 950.0 87.2 Urban20701 Caturtunggal 94,906 1,104.0 86.0 Urban20605 Sinduadi 57,027 737.0 77.4 Urban20504 Nogotirto 20,024 349.0 57.4 Urban21202 Donoharjo 7,779 153.0 50.8 Urban20503 Banyuraden 20,211 400.0 50.5 Urban21201 Sariharjo 32,256 689.0 46.8 Urban20406 Sidoarum 17,294 373.0 46.4 Urban20702 Maguwoharjo 59,976 1,501.0 40.0 Urban21001 Purwomartani 46,839 1,205.0 38.9 Urban20502 Ambarketawang 23,290 628.0 37.1 Urban21203 Sardonoharjo 20,970 660.0 31.8 Urban20505 Trihanggo 17,373 562.0 30.9 Urban20604 Sendangadi 16,341 536.0 30.5 Urban20801 Sendangtirto 15,868 522.0 30.4 Urban21303 Tridadi 14,606 504.0 29.0 Urban21101 Wedomartani 35,788 1,244.0 28.8 Urban21206 Minomartani 17,373 609.0 28.5 Urban21105 Umbulmartani 12,065 444.0 27.2 Rural too far from UAY20603 Tlogoadi 12,827 482.0 26.6 Urban20405 Sidokarto 9,673 364.0 26.6 Urban21205 Sinduharjo 24,643 938.0 26.3 Urban20501 Balecatur 24,296 986.0 24.6 Urban part of Desa included in UAY20404 Sidoagung 8,159 332.0 24.6 Rural20602 Sumberadi 14,645 600.0 24.4 Urban part of Desa included in UAY20407 Sidomoyo 7,303 302.0 24.2 Urban part of Desa included in UAY21302 Triharjo 13,962 578.0 24.2 Rural20403 Sidomulyo 5,960 250.0 23.8 Rural20906 Bokoharjo 12,633 540.0 23.4 Rural21407 Lumbungrejo 7,437 333.0 22.3 Rural20303 Margomulyo 11,402 519.0 22.0 Rural21406 Margorejo 11,538 539.0 21.4 Rural21204 Sukoharjo 17,041 803.0 21.2 Rural20804 Kalitirto 12,516 621.0 20.2 Rural21003 Tamanmartani 14,378 730.0 19.7 Rural21002 Tirtomartani 14,726 753.0 19.6 Rural20402 Sidoluhur 9,407 519.0 18.1 Rural20601 Tirtoadi 8,899 497.0 17.9 Urban part of Desa included in UAY21404 Pondokrejo 5,501 327.0 16.8 Rural20304 Margoagung 8,614 518.0 16.6 Rural20802 Tegaltirto 9,315 572.0 16.3 Urban part of Desa included in UAY21301 Caturharjo 12,017 744.0 16.2 Rural20205 Sendangsari 9,976 656.0 15.2 Rural
Name ofKelurahan/Desa
Populationin 2020
PopulationDensity in
2020
Urban orRural Remarks

13 - 29
Area
ha
20302 Margoluwih 9006 611.0 14.7 Rural20301 Margodadi 7,165 500.0 14.3 Rural20905 Madurojo 10,034 709.0 14.2 Rural21401 Banyurejo 6,723 482.0 13.9 Rural21305 Trimulyo 8,062 579.0 13.9 Rural21405 Mororejo 4,677 337.0 13.9 Rural20901 Sumberharjo 12,437 917.0 13.6 Rural21604 Pakembinangun 5,647 418.0 13.5 Rural20803 Jogotirto 7,793 584.0 13.3 Rural21304 Pandowoharjo 9,643 727.0 13.3 Rural20102 Sumbersari 6,844 546.0 12.5 Rural21403 Sumberejo 3,657 292.0 12.5 Rural20103 Sumberagung 10,121 820.0 12.3 Rural20305 Margokaton 6,329 515.0 12.3 Rural21501 Bangunkerto 8,504 703.0 12.1 Rural21402 Tambakrejo 3,931 326.0 12.1 Rural20203 Sendangrejo 6,786 598.0 11.3 Rural21104 Sindumartani 6,625 602.0 11.0 Rural21004 Selomartani 9,786 896.0 10.9 Rural20401 Sidorejo 5,599 544.0 10.3 Rural21408 Merdikorejo 6,073 613.0 9.9 Rural21102 Widodomartani 6,431 666.0 9.7 Rural20201 Sendangmulyo 6,450 670.0 9.6 Rural21502 Donokerto 7,103 741.0 9.6 Rural20202 Sendangarum 3,184 345.0 9.2 Rural21103 Bimomartani 5,304 615.0 8.6 Rural20101 Sumberahayu 5,401 631.0 8.6 Rural21602 Candibinangun 5,349 636.0 8.4 Rural20104 Sumberarum 5,925 765.0 7.7 Rural21702 Argomulyo 6,366 847.0 7.5 Rural21603 Harjobinangun 3,945 552.0 7.1 Rural21504 Wonokerto 10,524 1,558.0 6.8 Rural20903 Gayamharjo 3,990 655.0 6.1 Rural21705 Umbulharjo 5,012 826.0 6.1 Rural21701 Wukirsari 8,376 1,456.0 5.8 Rural20904 Sambirojo 4,668 839.0 5.6 Rural21503 Girikerto 7,261 1,307.0 5.6 Rural21605 Hargobinangun 7,755 1,430.0 5.4 Rural21601 Purwobinangun 6,889 1,348.0 5.1 Rural20902 Wukirharjo 2,289 475.0 4.8 Rural20204 Sendangagung 1,970 458.0 4.3 Rural21703 Glagaharjo 3,383 795.0 4.3 Rural21704 Kepuharjo 3,142 875.0 3.6 Rural
PopulationDensity in
2020
Urban orRural Remarks
Name ofKelurahan/Desa
Populationin 2020

13 - 30
Area
ha30000 Bantul Regency31302 Jagalan 3,070 27.0 113.7 Urban31504 Ngestiharjo 45,966 510.0 90.1 Urban31404 Panggungharjo 45,543 561.0 81.2 Urban31303 Singosaren 4,360 67.0 65.1 Urban31308 Banguntapan 49,432 833.0 59.3 Urban31403 Bangunharjo 37,754 679.0 55.6 Urban31307 Baturetno 21,786 394.0 55.3 Urban31502 Tirtonimolo 27,409 513.0 53.4 Urban30907 Imogiri 3,671 83.0 44.2 Urban31503 Tamantirto 28,971 672.0 43.1 Urban31301 Tamanan 14,248 375.0 38.0 Urban31304 Wirokerten 14,533 386.0 37.7 Urban31401 Pendowoharjo 26,082 698.0 37.4 Urban31101 Wonokromo 15,934 434.0 36.7 Urban30703 Bantul 16,132 524.0 30.8 Urban31306 Potorono 11,841 390.0 30.4 Urban31102 Pleret 12,393 425.0 29.2 Urban30705 Sapdodadi 6,624 232.0 28.6 Urban30704 Trirenggo 17,317 610.0 28.4 Urban31402 Timbulharjo 22,041 778.0 28.3 Urban30702 Ringinharjo 7,607 277.0 27.5 Urban30102 Trimurti 17,403 646.0 26.9 Rural shall be considered separately30804 Trimulyo 18,008 711.0 25.3 Urban30701 Palbapang 13,323 552.0 24.1 Rural30604 Wijirejo 10,754 468.0 23.0 Rural31305 Jambidan 8,439 376.0 22.4 Urban part of Desa included in UAY31702 Argorejo 16,179 723.0 22.4 Rural30906 Karangtalun 2,663 121.0 22.0 Rural30803 Sumberagung 13,866 635.0 21.8 Urban continuation to Imogiri30602 Triharjo 13,460 643.0 20.9 Rural30801 Patalan 11,636 565.0 20.6 Rural30603 Gilangharjo 14,723 726.0 20.3 Rural31501 Bangunjiwo 30,156 1,543.0 19.5 Urban part of Desa included in UAY30802 Canden 10,123 536.0 18.9 Rural30904 Karangtengah 5,274 288.0 18.3 Rural30601 Caturharjo 10,567 593.0 17.8 Rural30503 Sumbermulyo 14,448 820.0 17.6 Rural30403 Srihandono 12,020 687.0 17.5 Rural31704 Argomulyo 16,696 955.0 17.5 Rural31201 Sitimulyo 16,418 940.0 17.5 Urban part of Desa included in UAY30204 Murtigading 7,653 439.0 17.4 Rural30903 Kebonagung 3,249 187.0 17.4 Rural31203 Srimartani 14,726 858.0 17.2 Rural31103 Segoroyoso 8,287 487.0 17.0 Urban part of Desa included in UAY30502 Mulyodadi 10,145 645.0 15.7 Rural30402 Panjangrejo 8,770 571.0 15.4 Rural30303 Donotirto 7,184 470.0 15.3 Rural
Urban orRural Remarks
Name ofKelurahan/Desa
Populationin 2020
PopulationDensity in
2020

13 - 31
Area
ha30305 Tirtomulyo 6,398 419.0 15.3 Rural30304 Tirtosari 3,611 239.0 15.1 Rural31603 Guwosari 12,256 878.0 14.0 Rural30501 Sidomulyo 11,116 805.0 13.8 Rural30203 Srigading 9,816 757.0 13.0 Rural30905 Girirejo 4,160 324.0 12.8 Rural31703 Argosari 7,864 637.0 12.3 Rural30902 Sriharjo 7,695 632.0 12.2 Rural30908 Wukirsari 17,450 1,539.0 11.3 Rural30202 Gadingharjo 3,430 308.0 11.1 Rural30201 Gadingsari 8,762 812.0 10.8 Rural31104 Bawuran 5,095 497.0 10.3 Rural31202 Srimulyo 14,587 1,456.0 10.0 Rural31602 Sendangsari 11,476 1,176.0 9.8 Rural31004 Temuwuh 7,409 767.0 9.7 Rural31701 Argodadi 10,452 1,121.0 9.3 Rural30101 Poncosari 11,038 1,186.0 9.3 Rural31105 Wonolelo 4,203 454.0 9.3 Rural30401 Seloharjo 10,012 1,110.0 9.0 Rural31601 Triwidadi 10,317 1,271.0 8.1 Rural31006 Terong 6,100 776.0 7.9 Rural30302 Parangtritis 8,422 1,187.0 7.1 Rural30301 Tirtohargo 2,506 362.0 6.9 Rural31005 Jatimulyo 6,043 891.0 6.8 Rural31002 Muntuk 8,496 1,285.0 6.6 Rural31003 Dlingo 5,485 916.0 6.0 Rural30901 Selopamioro 12,887 2,275.0 5.7 Rural31001 Mangunan 4,255 952.0 4.5 Rural
Name ofKelurahan/Desa
Populationin 2020
PopulationDensity in
2020
Urban orRural Remarks
Selected Kelurahan/Desa as urban area is as shown figure below.
30202
31005
31006
31004
31203
31202
20803
20905
20902
20901
20904
20903
20906
21002
20804
20802
20801
11703
11002 10802
11001
10201
10203
10202 10302
11902 10801
11901
10403
10401
31306
31201
31305
31104
31105
31002
31003
31103
31102
30908
30907
30905
30904
31001
30901
30902
30903
30802
30906
3070530804
30803
1 0 3 0 3
10404
1 0 5 0 1
1 0 5 0 3
31302
10405
10502
10406
10407
31303
31304
31101
3 1 3 0 1
10301
31403
10102
10103
31402
31404
30403
30801
30503
30704
30701
30702
30502
30402
30401
30303
30304
30305
30203
30204
30201
30102
30101
30601
30604
30501
30603
30602
31701
31602
31401
30703
31603
31702
31601
31501
31704
31703
20101
20204
20202
20104
20201
11602
11701
11702
11302
11202
11201
11301
31503
31502
10101
11101
11102
11403
11103
20502
20503
20501
20403
20103
2010220405
20402
20404
20401
20301
20302
20406
20407
11404
31504
20601
20504 11401
20505
1605
11603
11604
11601
10402
31307
31308
20701
11303
11402
20605
21201
20303
21202
20603
20602
21302
21305
20604
21304
21303
21301
20305
20304
20203
20205
21402
21401
21403
21405
21404
21406
21003
21004
21001
20702
20703
21206
2 1 2 0 5
21101
21104
2 1 1 0 3
2 1 1 0 2
21702
21407
21501
21408
21502
21504
21702
21704
21503
21601
21204
2 1 6 0 2
21203
21701
21105
21603
21705
21605
21604
30301
30302
0 4 km
N
Boundary ofKelurahan/Desa
Urban area in Yogyakarta
Urban Area in Sleman
Urban Area in Bantul
Boundary ofMunicipality/Regency
Boundary of UAY
Figure 13.2.3 Urban Area of Water Supply Planning

13 - 32
Table 13.2.9 Urban Kelurahan/Desa in the Study Area
Yogyakarta Municipality: Whole Area is categorized as urban area
Urban Area in Sleman Regency Urban Area in Bantul Regency 20400 GODEAN 30700 BANTUL 20405 Sidokarto 30703 Bantul 20406 Sidoarum 30704 Trirenggo 20407 Sidomoyo 30705 Sapdodadi 20500 GAMPING 30800 JETIS 20501 Balecatur 30803 Sumberagung 20502 Ambarketawang 30804 Trimulyo 20503 Banyuraden 30900 IMOGIRI 20504 Nogotirto 30907 Imogiri 20505 Trihanggo 31100 PLERET 20600 MLATI 31101 Wonokromo 20601 Tirtoadi 31102 Pleret 20602 Sumberadi 31103 Segoroyoso 20603 Tlogoadi 31200 PIYUNGAN 20604 Sendangadi 31201 Sitimulyo 20605 Sinduadi 31300 BANGUNTAPAN 20700 DEPOK 31301 Tamanan 20701 Caturtunggal 31302 Jagalan 20702 Maguwoharjo 31303 Singosaren 20703 Condongcatur 31304 Wirokerten 20800 BERBAH 31305 Jambidan 20801 Sendangtirto 31306 Potorono 20802 Tegaltirto 31307 Baturetno 21000 KALASAN 31308 Banguntapan 21001 Purwomartani 31400 SEWON 21100 NGEMPLAK 31401 Pendowoharjo 21101 Wedomartani 31402 Timbulharjo 21200 NGAGLIK 31403 Bangunharjo 21201 Sariharjo 31404 Panggungharjo 21202 Donoharjo 31500 KASIHAN 21203 Sardonoharjo 31501 Bangunjiwo 21205 Sinduharjo 31502 Tirtonimolo 21206 Minomartani 31503 Tamantirto 21300 SLEMAN 31504 Ngestiharjo 21303 Tridadi

13 - 33
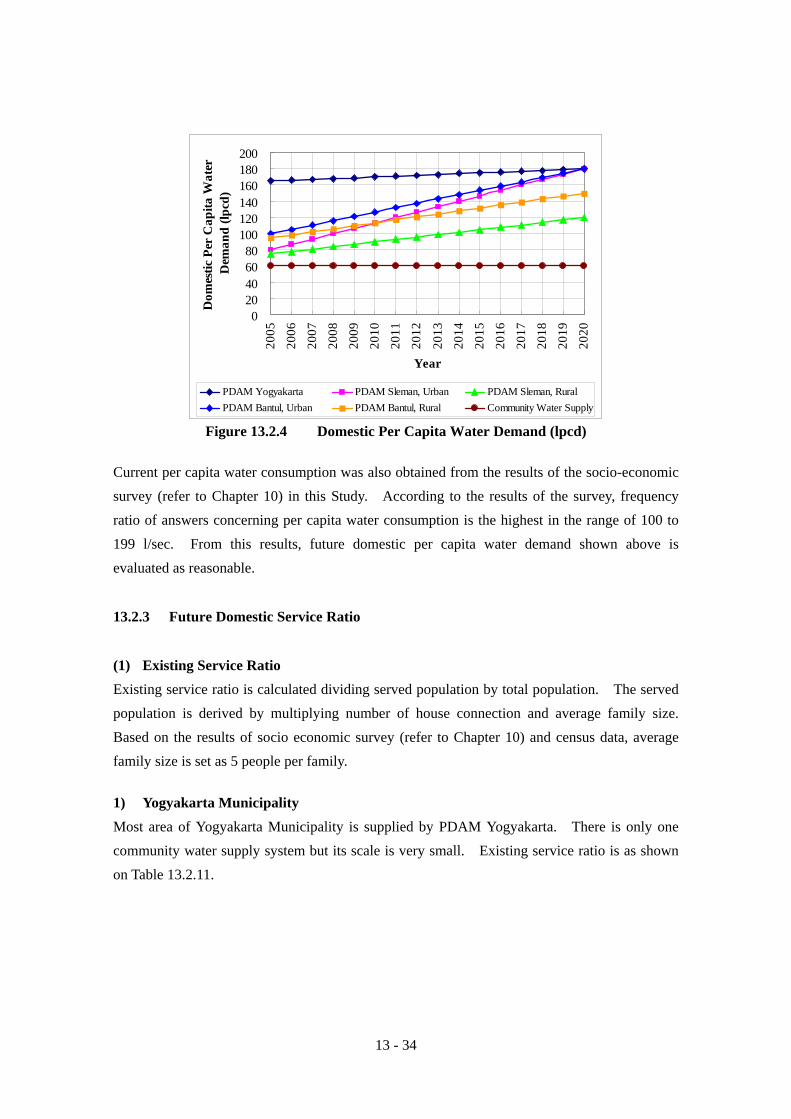
(4) Future Domestic Per Capita Water Demand Future domestic per capita water demands are estimated for respective PDAMs and community water supply system as follows.
1) For PDAM Yogyakarta Per capita domestic water demand will increase from existing level (165 lpcd) to 180 lpcd in year 2020. 180 lpcd is applied to future target per capita domestic water demand because when supply capacity was sufficient against water demand before year 2001, the per capita domestic water demand was reached around 180 lpcd.
For PDAM Sleman Urban and For PDAM Bantul Urban These two areas are just adjacent to Yogyakarta Municipality and there will be no difference with municipal conditions in future. Therefore, same target level in 2020 is applied as 180 lpcd. Future per capita domestic water demand will increase gradually from existing level (Sleman Urban, 80 lpcd, Bantul Urban 100 lpcd).
For PDAM Bantul Rural Future target per capita domestic water demand is set as 150 lpcd and this level is lower than exiting municipal per capita (163.1 lpcd). Future per capita will increase gradually from existing level of per capita (95 lpcd).
For PDAM Sleman Rural Same increase ratio of the “PDAM Bantul Rural” is applied for the PDAM Sleman Rural. Future per capita will increase gradually from existing level of per capita (75 lpcd).
For Community Water Supply System Per capita domestic water demand is set as 60 lpcd which conforms to national target level.
Table 13.2.10 Future Per Capita Domestic Water Demand (lpcd) LatestData 2005 2006 2007 2008 2009 2010 2011 2012 2013 2014 2015 2016 2017 2018 2019 2020
PDAM Yogyakarta 163.1 165.0 166.0 167.0 168.0 169.0 170.0 171.0 172.0 173.0 174.0 175.0 176.0 177.0 178.0 179.0 180.0PDAM Sleman, Urban 80.6 80.0 86.7 93.3 100.0 106.7 113.3 120.0 126.7 133.3 140.0 146.7 153.3 160.0 166.7 173.3 180.0PDAM Sleman, Rural 75.7 75.0 78.0 81.0 84.0 87.0 90.0 93.0 96.0 99.0 102.0 105.0 108.0 111.0 114.0 117.0 120.0PDAM Bantul, Urban 99.8 100.0 105.3 110.7 116.0 121.3 126.7 132.0 137.3 142.7 148.0 153.3 158.7 164.0 169.3 174.7 180.0PDAM Bantul, Rural 96.5 95.0 98.7 102.3 106.0 109.7 113.3 117.0 120.7 124.3 128.0 131.7 135.3 139.0 142.7 146.3 150.0
60.0 60.0 60.0 60.0 60.0 60.0 60.0 60.0 60.0 60.0 60.0 60.0 60.0 60.0 60.0 60.0Community Water Supply
13 - 34
020406080
100120140160180200
2005
2006
2007
2008
2009
2010
2011
2012
2013
2014
2015
2016
2017
2018
2019
2020
Year
Dom
estic
Per
Cap
ita W
ater
Dem
and
(lpcd
)
PDAM Yogyakarta PDAM Sleman, Urban PDAM Sleman, RuralPDAM Bantul, Urban PDAM Bantul, Rural Community Water Supply
Figure 13.2.4 Domestic Per Capita Water Demand (lpcd)
Current per capita water consumption was also obtained from the results of the socio-economic survey (refer to Chapter 10) in this Study. According to the results of the survey, frequency ratio of answers concerning per capita water consumption is the highest in the range of 100 to 199 l/sec. From this results, future domestic per capita water demand shown above is evaluated as reasonable.
13.2.3 Future Domestic Service Ratio
(1) Existing Service Ratio Existing service ratio is calculated dividing served population by total population. The served population is derived by multiplying number of house connection and average family size. Based on the results of socio economic survey (refer to Chapter 10) and census data, average family size is set as 5 people per family.
1) Yogyakarta Municipality Most area of Yogyakarta Municipality is supplied by PDAM Yogyakarta. There is only one community water supply system but its scale is very small. Existing service ratio is as shown on Table 13.2.11.

13 - 35
Table 13.2.11 Existing Service Ratio in Yogyakarta Municipality (2005)
Total Population
Number of House
Connections Served
Population Service Ratio
person nos. person % 408,332 - - -
PDAM Yogyakarta 32,398 161,990 39.7%
Community Water Supply System 115 575 0.1%
Total 32,513 162,565 39.8%
2) Sleman Regency Water in Sleman Regency is supplied by PDAM Sleman, PDAM Yogyakarta, and community water supply system. These three providers are supplying water without clear cut demarcation. Therefore, evaluation of existing service ratio is rather complicated.
There are 12 water supply units under jurisdiction of PDAM Sleman. Table 13.2.12 shows service area and served population of each unit of PDAM Sleman.
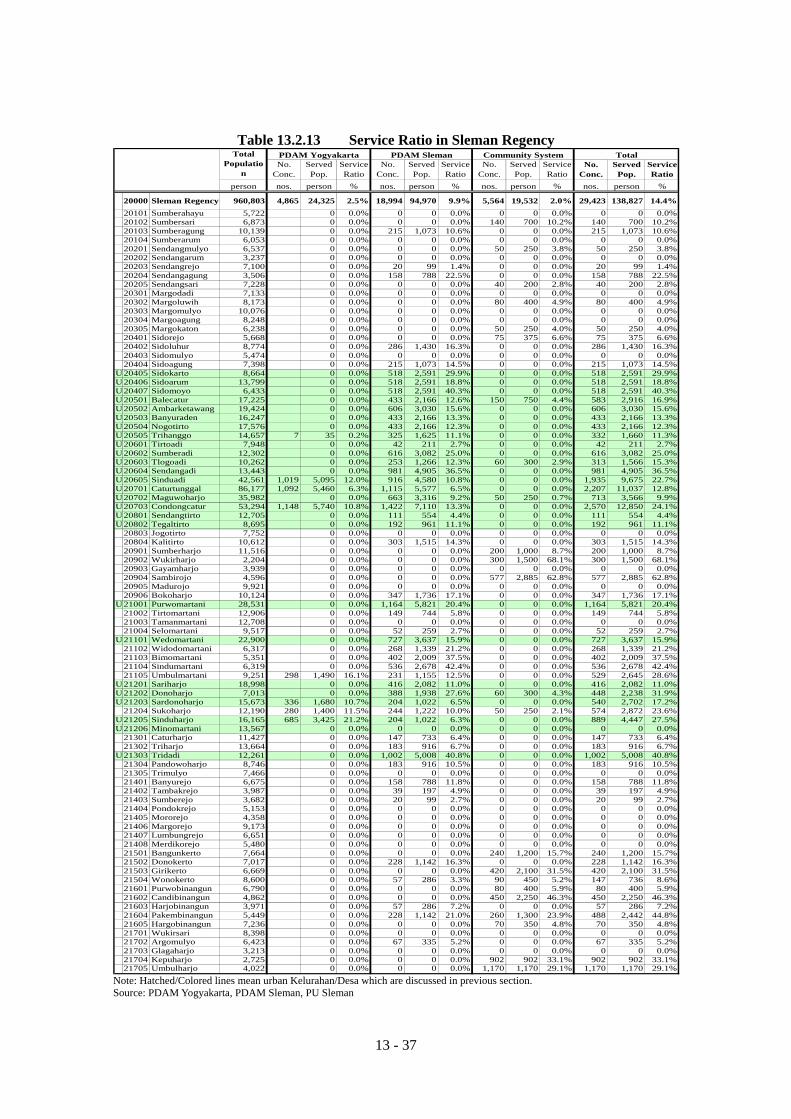
In addition to served population by PDAM Sleman, served population by PDAM Yogyakarta and community water supply system should also be considered. Service ratio which includes all served populations such as by PDAM Sleman, PDAM Yogyakarta, and Community water supply system is shown on Table 13.2.13.
3) Bantul Regency Water in Bantul Regency is supplied by PDAM Bantul, PDAM Yogyakarta, and community water supply system. These three providers are supplying water without clear cut demarcation. There are 12 water supply units under jurisdiction of PDAM Bantul. Table 13.2.14 shows service area and served population of each unit of PDAM Bantul.
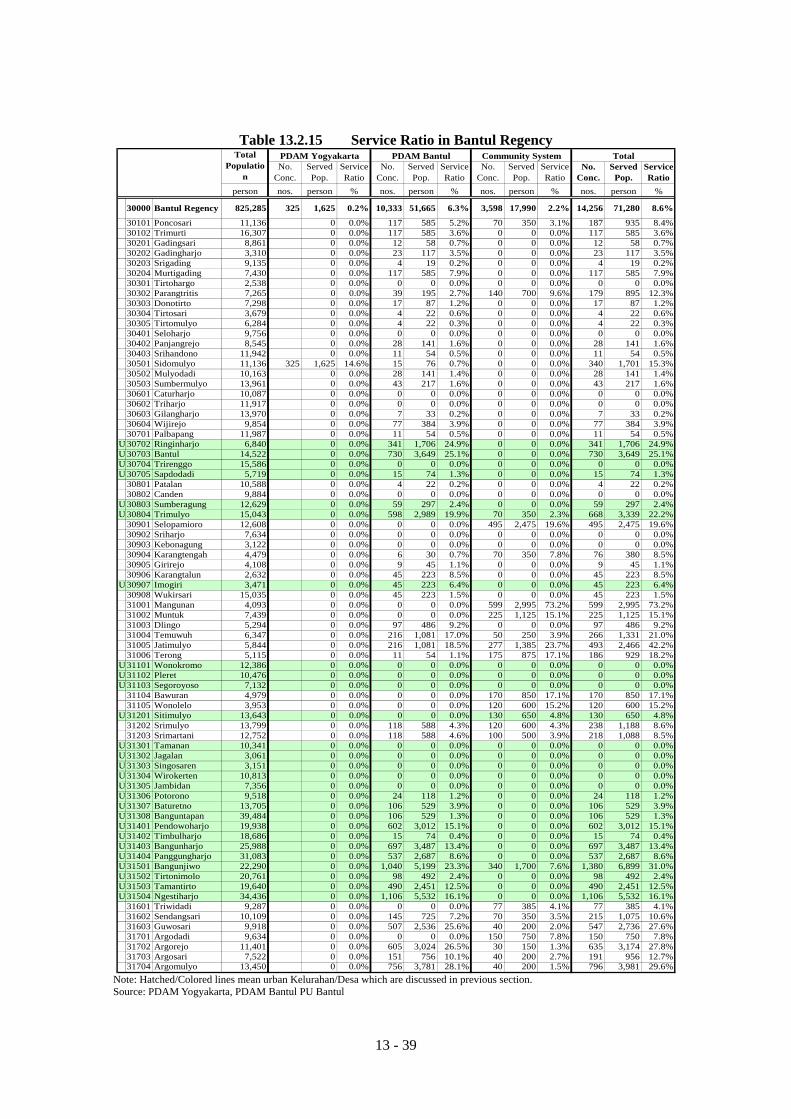
In addition to served population by PDAM Bantul, served population by PDAM Yogyakarta and community water supply system should also be considered. Service ratio which includes all served populations such as by PDAM Bantul, PDAM Yogyakarta, and Community water supply system is shown on Table 13.2.15.

13 - 36
Table 13.2.12 Served Population of Each Water Supply Unit of PDAM Sleman Group A Group B Group C Group D Group E Group F Group G Group H Group I Group J Group K Group L Total
Turi NgemplakTambakrejo Sleman Mlati Gamping Nogotirto Godean Ngaglik Depok Kalasan Prambanan20101 Sumberahayu 020102 Sumbersari 020103 Sumberagung 1,073 1,07320104 Sumberarum 020201 Sendangmulyo 020202 Sendangarum 020203 Sendangrejo 99 9920204 Sendangagung 788 78820205 Sendangsari 020301 Margodadi 020302 Margoluwih 020303 Margomulyo 020304 Margoagung 020305 Margokaton 020401 Sidorejo 020402 Sidoluhur 1,430 1,43020403 Sidomulyo 020404 Sidoagung 1,073 1,07320405 Sidokarto 2,591 2,59120406 Sidoarum 2,591 2,59120407 Sidomoyo 2,591 2,59120501 Balecatur 2,166 2,16620502 Ambarketawang 2,166 864 3,03020503 Banyuraden 2,166 2,16620504 Nogotirto 2,166 2,16620505 Trihanggo 1,625 1,62520601 Tirtoadi 211 21120602 Sumberadi 550 2,532 3,08220603 Tlogoadi 1,266 1,26620604 Sendangadi 4,580 325 4,90520605 Sinduadi 4,580 4,58020701 Caturtunggal 5,577 5,57720702 Maguwoharjo 3,187 129 3,31620703 Condongcatur 1,532 5,577 7,11020801 Sendangtirto 554 55420802 Tegaltirto 961 96120803 Jogotirto 020804 Kalitirto 1,515 1,51520901 Sumberharjo 020902 Wukirharjo 020903 Gayamharjo 020904 Sambirojo 020905 Madurojo 020906 Bokoharjo 1,736 1,73621001 Purwomartani 5,821 5,82121002 Tirtomartani 744 74421003 Tamanmartani 021004 Selomartani 259 25921101 Wedomartani 2,043 1,594 3,63721102 Widodomartani 1,339 1,33921103 Bimomartani 2,009 2,00921104 Sindumartani 2,678 2,67821105 Umbulmartani 134 1,022 1,15521201 Sariharjo 550 1,532 2,08221202 Donoharjo 916 1,022 1,93821203 Sardonoharjo 1,022 1,02221204 Sukoharjo 201 1,022 1,22221205 Sinduharjo 1,022 1,02221206 Minomartani 021301 Caturharjo 733 73321302 Triharjo 916 91621303 Tridadi 4,580 211 217 5,00821304 Pandowoharjo 916 91621305 Trimulyo 021401 Banyurejo 788 78821402 Tambakrejo 197 19721403 Sumberejo 99 9921404 Pondokrejo 021405 Mororejo 021406 Margorejo 021407 Lumbungrejo 021408 Merdikorejo 021501 Bangunkerto 021502 Donokerto 1,142 1,14221503 Girikerto 021504 Wonokerto 286 28621601 Purwobinangun 021602 Candibinangun 021603 Harjobinangun 286 28621604 Pakembinangun 1,142 1,14221605 Hargobinangun 021701 Wukirsari 021702 Argomulyo 335 33521703 Glagaharjo 021704 Kepuharjo 021705 Umbulharjo 0
2,855 6,695 1,970 18,320 4,220 10,830 8,635 3,575 10,215 15,935 9,240 2,480 94,970 Note: Hatched/Colored lines mean urban Kelurahan/Desa which are discussed in previous section. Source: PDAM Sleman
13 - 37
Table 13.2.13 Service Ratio in Sleman Regency No.
Conc.ServedPop.
ServiceRatio
No.Conc.
ServedPop.
ServiceRatio
No.Conc.
ServedPop.
ServiceRatio
No.Conc.
ServedPop.
ServiceRatio
person nos. person % nos. person % nos. person % nos. person %
20000 Sleman Regency 960,803 4,865 24,325 2.5% 18,994 94,970 9.9% 5,564 19,532 2.0% 29,423 138,827 14.4%20101 Sumberahayu 5,722 0 0.0% 0 0 0.0% 0 0 0.0% 0 0 0.0%20102 Sumbersari 6,873 0 0.0% 0 0 0.0% 140 700 10.2% 140 700 10.2%20103 Sumberagung 10,139 0 0.0% 215 1,073 10.6% 0 0 0.0% 215 1,073 10.6%20104 Sumberarum 6,053 0 0.0% 0 0 0.0% 0 0 0.0% 0 0 0.0%20201 Sendangmulyo 6,537 0 0.0% 0 0 0.0% 50 250 3.8% 50 250 3.8%20202 Sendangarum 3,237 0 0.0% 0 0 0.0% 0 0 0.0% 0 0 0.0%20203 Sendangrejo 7,100 0 0.0% 20 99 1.4% 0 0 0.0% 20 99 1.4%20204 Sendangagung 3,506 0 0.0% 158 788 22.5% 0 0 0.0% 158 788 22.5%20205 Sendangsari 7,228 0 0.0% 0 0 0.0% 40 200 2.8% 40 200 2.8%20301 Margodadi 7,133 0 0.0% 0 0 0.0% 0 0 0.0% 0 0 0.0%20302 Margoluwih 8,173 0 0.0% 0 0 0.0% 80 400 4.9% 80 400 4.9%20303 Margomulyo 10,076 0 0.0% 0 0 0.0% 0 0 0.0% 0 0 0.0%20304 Margoagung 8,248 0 0.0% 0 0 0.0% 0 0 0.0% 0 0 0.0%20305 Margokaton 6,238 0 0.0% 0 0 0.0% 50 250 4.0% 50 250 4.0%20401 Sidorejo 5,668 0 0.0% 0 0 0.0% 75 375 6.6% 75 375 6.6%20402 Sidoluhur 8,774 0 0.0% 286 1,430 16.3% 0 0 0.0% 286 1,430 16.3%20403 Sidomulyo 5,474 0 0.0% 0 0 0.0% 0 0 0.0% 0 0 0.0%20404 Sidoagung 7,398 0 0.0% 215 1,073 14.5% 0 0 0.0% 215 1,073 14.5%
U 20405 Sidokarto 8,664 0 0.0% 518 2,591 29.9% 0 0 0.0% 518 2,591 29.9%U 20406 Sidoarum 13,799 0 0.0% 518 2,591 18.8% 0 0 0.0% 518 2,591 18.8%U 20407 Sidomoyo 6,433 0 0.0% 518 2,591 40.3% 0 0 0.0% 518 2,591 40.3%U 20501 Balecatur 17,225 0 0.0% 433 2,166 12.6% 150 750 4.4% 583 2,916 16.9%U 20502 Ambarketawang 19,424 0 0.0% 606 3,030 15.6% 0 0 0.0% 606 3,030 15.6%U 20503 Banyuraden 16,247 0 0.0% 433 2,166 13.3% 0 0 0.0% 433 2,166 13.3%U 20504 Nogotirto 17,576 0 0.0% 433 2,166 12.3% 0 0 0.0% 433 2,166 12.3%U 20505 Trihanggo 14,657 7 35 0.2% 325 1,625 11.1% 0 0 0.0% 332 1,660 11.3%U 20601 Tirtoadi 7,948 0 0.0% 42 211 2.7% 0 0 0.0% 42 211 2.7%U 20602 Sumberadi 12,302 0 0.0% 616 3,082 25.0% 0 0 0.0% 616 3,082 25.0%U 20603 Tlogoadi 10,262 0 0.0% 253 1,266 12.3% 60 300 2.9% 313 1,566 15.3%U 20604 Sendangadi 13,443 0 0.0% 981 4,905 36.5% 0 0 0.0% 981 4,905 36.5%U 20605 Sinduadi 42,561 1,019 5,095 12.0% 916 4,580 10.8% 0 0 0.0% 1,935 9,675 22.7%U 20701 Caturtunggal 86,177 1,092 5,460 6.3% 1,115 5,577 6.5% 0 0 0.0% 2,207 11,037 12.8%U 20702 Maguwoharjo 35,982 0 0.0% 663 3,316 9.2% 50 250 0.7% 713 3,566 9.9%U 20703 Condongcatur 53,294 1,148 5,740 10.8% 1,422 7,110 13.3% 0 0 0.0% 2,570 12,850 24.1%U 20801 Sendangtirto 12,705 0 0.0% 111 554 4.4% 0 0 0.0% 111 554 4.4%U 20802 Tegaltirto 8,695 0 0.0% 192 961 11.1% 0 0 0.0% 192 961 11.1%
20803 Jogotirto 7,752 0 0.0% 0 0 0.0% 0 0 0.0% 0 0 0.0%20804 Kalitirto 10,612 0 0.0% 303 1,515 14.3% 0 0 0.0% 303 1,515 14.3%20901 Sumberharjo 11,516 0 0.0% 0 0 0.0% 200 1,000 8.7% 200 1,000 8.7%20902 Wukirharjo 2,204 0 0.0% 0 0 0.0% 300 1,500 68.1% 300 1,500 68.1%20903 Gayamharjo 3,939 0 0.0% 0 0 0.0% 0 0 0.0% 0 0 0.0%20904 Sambirojo 4,596 0 0.0% 0 0 0.0% 577 2,885 62.8% 577 2,885 62.8%20905 Madurojo 9,921 0 0.0% 0 0 0.0% 0 0 0.0% 0 0 0.0%20906 Bokoharjo 10,124 0 0.0% 347 1,736 17.1% 0 0 0.0% 347 1,736 17.1%
U 21001 Purwomartani 28,531 0 0.0% 1,164 5,821 20.4% 0 0 0.0% 1,164 5,821 20.4%21002 Tirtomartani 12,906 0 0.0% 149 744 5.8% 0 0 0.0% 149 744 5.8%21003 Tamanmartani 12,708 0 0.0% 0 0 0.0% 0 0 0.0% 0 0 0.0%21004 Selomartani 9,517 0 0.0% 52 259 2.7% 0 0 0.0% 52 259 2.7%
U 21101 Wedomartani 22,900 0 0.0% 727 3,637 15.9% 0 0 0.0% 727 3,637 15.9%21102 Widodomartani 6,317 0 0.0% 268 1,339 21.2% 0 0 0.0% 268 1,339 21.2%21103 Bimomartani 5,351 0 0.0% 402 2,009 37.5% 0 0 0.0% 402 2,009 37.5%21104 Sindumartani 6,319 0 0.0% 536 2,678 42.4% 0 0 0.0% 536 2,678 42.4%21105 Umbulmartani 9,251 298 1,490 16.1% 231 1,155 12.5% 0 0 0.0% 529 2,645 28.6%
U 21201 Sariharjo 18,998 0 0.0% 416 2,082 11.0% 0 0 0.0% 416 2,082 11.0%U 21202 Donoharjo 7,013 0 0.0% 388 1,938 27.6% 60 300 4.3% 448 2,238 31.9%U 21203 Sardonoharjo 15,673 336 1,680 10.7% 204 1,022 6.5% 0 0 0.0% 540 2,702 17.2%
21204 Sukoharjo 12,190 280 1,400 11.5% 244 1,222 10.0% 50 250 2.1% 574 2,872 23.6%U 21205 Sinduharjo 16,165 685 3,425 21.2% 204 1,022 6.3% 0 0 0.0% 889 4,447 27.5%U 21206 Minomartani 13,567 0 0.0% 0 0 0.0% 0 0 0.0% 0 0 0.0%
21301 Caturharjo 11,427 0 0.0% 147 733 6.4% 0 0 0.0% 147 733 6.4%21302 Triharjo 13,664 0 0.0% 183 916 6.7% 0 0 0.0% 183 916 6.7%
U 21303 Tridadi 12,261 0 0.0% 1,002 5,008 40.8% 0 0 0.0% 1,002 5,008 40.8%21304 Pandowoharjo 8,746 0 0.0% 183 916 10.5% 0 0 0.0% 183 916 10.5%21305 Trimulyo 7,466 0 0.0% 0 0 0.0% 0 0 0.0% 0 0 0.0%21401 Banyurejo 6,675 0 0.0% 158 788 11.8% 0 0 0.0% 158 788 11.8%21402 Tambakrejo 3,987 0 0.0% 39 197 4.9% 0 0 0.0% 39 197 4.9%21403 Sumberejo 3,682 0 0.0% 20 99 2.7% 0 0 0.0% 20 99 2.7%21404 Pondokrejo 5,153 0 0.0% 0 0 0.0% 0 0 0.0% 0 0 0.0%21405 Mororejo 4,358 0 0.0% 0 0 0.0% 0 0 0.0% 0 0 0.0%21406 Margorejo 9,173 0 0.0% 0 0 0.0% 0 0 0.0% 0 0 0.0%21407 Lumbungrejo 6,651 0 0.0% 0 0 0.0% 0 0 0.0% 0 0 0.0%21408 Merdikorejo 5,480 0 0.0% 0 0 0.0% 0 0 0.0% 0 0 0.0%21501 Bangunkerto 7,664 0 0.0% 0 0 0.0% 240 1,200 15.7% 240 1,200 15.7%21502 Donokerto 7,017 0 0.0% 228 1,142 16.3% 0 0 0.0% 228 1,142 16.3%21503 Girikerto 6,669 0 0.0% 0 0 0.0% 420 2,100 31.5% 420 2,100 31.5%21504 Wonokerto 8,600 0 0.0% 57 286 3.3% 90 450 5.2% 147 736 8.6%21601 Purwobinangun 6,790 0 0.0% 0 0 0.0% 80 400 5.9% 80 400 5.9%21602 Candibinangun 4,862 0 0.0% 0 0 0.0% 450 2,250 46.3% 450 2,250 46.3%21603 Harjobinangun 3,971 0 0.0% 57 286 7.2% 0 0 0.0% 57 286 7.2%21604 Pakembinangun 5,449 0 0.0% 228 1,142 21.0% 260 1,300 23.9% 488 2,442 44.8%21605 Hargobinangun 7,236 0 0.0% 0 0 0.0% 70 350 4.8% 70 350 4.8%21701 Wukirsari 8,398 0 0.0% 0 0 0.0% 0 0 0.0% 0 0 0.0%21702 Argomulyo 6,423 0 0.0% 67 335 5.2% 0 0 0.0% 67 335 5.2%21703 Glagaharjo 3,213 0 0.0% 0 0 0.0% 0 0 0.0% 0 0 0.0%21704 Kepuharjo 2,725 0 0.0% 0 0 0.0% 902 902 33.1% 902 902 33.1%21705 Umbulharjo 4,022 0 0.0% 0 0 0.0% 1,170 1,170 29.1% 1,170 1,170 29.1%
Community System TotalTotalPopulatio
n
PDAM Yogyakarta PDAM Sleman
Note: Hatched/Colored lines mean urban Kelurahan/Desa which are discussed in previous section. Source: PDAM Yogyakarta, PDAM Sleman, PU Sleman

13 - 38
Table 13.2.14 Served Population of Each Water Supply Unit of PDAM Bantul Unit Unit 1 Unit 2 Unit 3 Unit 4 Unit 5 Unit 6 Unit 7 Unit 8 Unit 9 Unit 10 Unit 11 Unit 12
Sedayu Kasihan Bangunji Sewon Bangunta Guosari Bantul Imogiri Trimulyo Srandaka Bambang Dlingo30101 Poncosari 585 58530102 Trimurti 585 58530201 Gadingsari 58 5830202 Gadingharjo 117 11730203 Srigading 19 1930204 Murtigading 585 58530301 Tirtohargo 030302 Parangtritis 195 19530303 Donotirto 87 8730304 Tirtosari 22 2230305 Tirtomulyo 22 2230401 Seloharjo 030402 Panjangrejo 141 14130403 Srihandono 54 5430501 Sidomulyo 76 7630502 Mulyodadi 141 14130503 Sumbermulyo 217 21730601 Caturharjo 030602 Triharjo 030603 Gilangharjo 33 3330604 Wijirejo 362 22 38430701 Palbapang 54 5430702 Ringinharjo 1,706 1,70630703 Bantul 725 2,924 3,64930704 Trirenggo 030705 Sapdodadi 74 7430801 Patalan 22 2230802 Canden 030803 Sumberagung 297 29730804 Trimulyo 297 2,692 2,98930901 Selopamioro 030902 Sriharjo 030903 Kebonagung 030904 Karangtengah 30 3030905 Girirejo 45 4530906 Karangtalun 223 22330907 Imogiri 223 22330908 Wukirsari 223 22331001 Mangunan 031002 Muntuk 031003 Dlingo 486 48631004 Temuwuh 1,081 1,08131005 Jatimulyo 1,081 1,08131006 Terong 54 5431101 Wonokromo 031102 Pleret 031103 Segoroyoso 031104 Bawuran 031105 Wonolelo 031201 Sitimulyo 031202 Srimulyo 588 58831203 Srimartani 588 58831301 Tamanan 031302 Jagalan 031303 Singosaren 031304 Wirokerten 031305 Jambidan 031306 Potorono 118 11831307 Baturetno 529 52931308 Banguntapan 529 52931401 Pendowoharjo 233 2,536 244 3,01231402 Timbulharjo 74 7431403 Bangunharjo 3,487 3,48731404 Panggungharjo 2,325 362 2,68731501 Bangunjiwo 5,199 5,19931502 Tirtonimolo 492 49231503 Tamantirto 123 2,328 2,45131504 Ngestiharjo 5,532 5,53231601 Triwidadi 031602 Sendangsari 725 72531603 Guwosari 2,536 2,53631701 Argodadi 031702 Argorejo 3,024 3,02431703 Argosari 756 75631704 Argomulyo 3,781 3,781
7,561 6,147 7,760 5,812 2,352 7,245 4,874 1,487 2,692 1,949 1,084 2,702 51,665
Kelurahan Total
Note: Hatched/Colored lines mean urban Kelurahan/Desa which are discussed in previous section. Source: PDAM Bantul
13 - 39
Table 13.2.15 Service Ratio in Bantul Regency
No.Conc.
ServedPop.
ServiceRatio
No.Conc.
ServedPop.
ServiceRatio
No.Conc.
ServedPop.
ServiceRatio
No.Conc.
ServedPop.
ServiceRatio
person nos. person % nos. person % nos. person % nos. person %
30000 Bantul Regency 825,285 325 1,625 0.2% 10,333 51,665 6.3% 3,598 17,990 2.2% 14,256 71,280 8.6%
30101 Poncosari 11,136 0 0.0% 117 585 5.2% 70 350 3.1% 187 935 8.4%30102 Trimurti 16,307 0 0.0% 117 585 3.6% 0 0 0.0% 117 585 3.6%30201 Gadingsari 8,861 0 0.0% 12 58 0.7% 0 0 0.0% 12 58 0.7%30202 Gadingharjo 3,310 0 0.0% 23 117 3.5% 0 0 0.0% 23 117 3.5%30203 Srigading 9,135 0 0.0% 4 19 0.2% 0 0 0.0% 4 19 0.2%30204 Murtigading 7,430 0 0.0% 117 585 7.9% 0 0 0.0% 117 585 7.9%30301 Tirtohargo 2,538 0 0.0% 0 0 0.0% 0 0 0.0% 0 0 0.0%30302 Parangtritis 7,265 0 0.0% 39 195 2.7% 140 700 9.6% 179 895 12.3%30303 Donotirto 7,298 0 0.0% 17 87 1.2% 0 0 0.0% 17 87 1.2%30304 Tirtosari 3,679 0 0.0% 4 22 0.6% 0 0 0.0% 4 22 0.6%30305 Tirtomulyo 6,284 0 0.0% 4 22 0.3% 0 0 0.0% 4 22 0.3%30401 Seloharjo 9,756 0 0.0% 0 0 0.0% 0 0 0.0% 0 0 0.0%30402 Panjangrejo 8,545 0 0.0% 28 141 1.6% 0 0 0.0% 28 141 1.6%30403 Srihandono 11,942 0 0.0% 11 54 0.5% 0 0 0.0% 11 54 0.5%30501 Sidomulyo 11,136 325 1,625 14.6% 15 76 0.7% 0 0 0.0% 340 1,701 15.3%30502 Mulyodadi 10,163 0 0.0% 28 141 1.4% 0 0 0.0% 28 141 1.4%30503 Sumbermulyo 13,961 0 0.0% 43 217 1.6% 0 0 0.0% 43 217 1.6%30601 Caturharjo 10,087 0 0.0% 0 0 0.0% 0 0 0.0% 0 0 0.0%30602 Triharjo 11,917 0 0.0% 0 0 0.0% 0 0 0.0% 0 0 0.0%30603 Gilangharjo 13,970 0 0.0% 7 33 0.2% 0 0 0.0% 7 33 0.2%30604 Wijirejo 9,854 0 0.0% 77 384 3.9% 0 0 0.0% 77 384 3.9%30701 Palbapang 11,987 0 0.0% 11 54 0.5% 0 0 0.0% 11 54 0.5%
U 30702 Ringinharjo 6,840 0 0.0% 341 1,706 24.9% 0 0 0.0% 341 1,706 24.9%U 30703 Bantul 14,522 0 0.0% 730 3,649 25.1% 0 0 0.0% 730 3,649 25.1%U 30704 Trirenggo 15,586 0 0.0% 0 0 0.0% 0 0 0.0% 0 0 0.0%U 30705 Sapdodadi 5,719 0 0.0% 15 74 1.3% 0 0 0.0% 15 74 1.3%
30801 Patalan 10,588 0 0.0% 4 22 0.2% 0 0 0.0% 4 22 0.2%30802 Canden 9,884 0 0.0% 0 0 0.0% 0 0 0.0% 0 0 0.0%
U 30803 Sumberagung 12,629 0 0.0% 59 297 2.4% 0 0 0.0% 59 297 2.4%U 30804 Trimulyo 15,043 0 0.0% 598 2,989 19.9% 70 350 2.3% 668 3,339 22.2%
30901 Selopamioro 12,608 0 0.0% 0 0 0.0% 495 2,475 19.6% 495 2,475 19.6%30902 Sriharjo 7,634 0 0.0% 0 0 0.0% 0 0 0.0% 0 0 0.0%30903 Kebonagung 3,122 0 0.0% 0 0 0.0% 0 0 0.0% 0 0 0.0%30904 Karangtengah 4,479 0 0.0% 6 30 0.7% 70 350 7.8% 76 380 8.5%30905 Girirejo 4,108 0 0.0% 9 45 1.1% 0 0 0.0% 9 45 1.1%30906 Karangtalun 2,632 0 0.0% 45 223 8.5% 0 0 0.0% 45 223 8.5%
U 30907 Imogiri 3,471 0 0.0% 45 223 6.4% 0 0 0.0% 45 223 6.4%30908 Wukirsari 15,035 0 0.0% 45 223 1.5% 0 0 0.0% 45 223 1.5%31001 Mangunan 4,093 0 0.0% 0 0 0.0% 599 2,995 73.2% 599 2,995 73.2%31002 Muntuk 7,439 0 0.0% 0 0 0.0% 225 1,125 15.1% 225 1,125 15.1%31003 Dlingo 5,294 0 0.0% 97 486 9.2% 0 0 0.0% 97 486 9.2%31004 Temuwuh 6,347 0 0.0% 216 1,081 17.0% 50 250 3.9% 266 1,331 21.0%31005 Jatimulyo 5,844 0 0.0% 216 1,081 18.5% 277 1,385 23.7% 493 2,466 42.2%31006 Terong 5,115 0 0.0% 11 54 1.1% 175 875 17.1% 186 929 18.2%
U 31101 Wonokromo 12,386 0 0.0% 0 0 0.0% 0 0 0.0% 0 0 0.0%U 31102 Pleret 10,476 0 0.0% 0 0 0.0% 0 0 0.0% 0 0 0.0%U 31103 Segoroyoso 7,132 0 0.0% 0 0 0.0% 0 0 0.0% 0 0 0.0%
31104 Bawuran 4,979 0 0.0% 0 0 0.0% 170 850 17.1% 170 850 17.1%31105 Wonolelo 3,953 0 0.0% 0 0 0.0% 120 600 15.2% 120 600 15.2%
U 31201 Sitimulyo 13,643 0 0.0% 0 0 0.0% 130 650 4.8% 130 650 4.8%31202 Srimulyo 13,799 0 0.0% 118 588 4.3% 120 600 4.3% 238 1,188 8.6%31203 Srimartani 12,752 0 0.0% 118 588 4.6% 100 500 3.9% 218 1,088 8.5%
U 31301 Tamanan 10,341 0 0.0% 0 0 0.0% 0 0 0.0% 0 0 0.0%U 31302 Jagalan 3,061 0 0.0% 0 0 0.0% 0 0 0.0% 0 0 0.0%U 31303 Singosaren 3,151 0 0.0% 0 0 0.0% 0 0 0.0% 0 0 0.0%U 31304 Wirokerten 10,813 0 0.0% 0 0 0.0% 0 0 0.0% 0 0 0.0%U 31305 Jambidan 7,356 0 0.0% 0 0 0.0% 0 0 0.0% 0 0 0.0%U 31306 Potorono 9,518 0 0.0% 24 118 1.2% 0 0 0.0% 24 118 1.2%U 31307 Baturetno 13,705 0 0.0% 106 529 3.9% 0 0 0.0% 106 529 3.9%U 31308 Banguntapan 39,484 0 0.0% 106 529 1.3% 0 0 0.0% 106 529 1.3%U 31401 Pendowoharjo 19,938 0 0.0% 602 3,012 15.1% 0 0 0.0% 602 3,012 15.1%U 31402 Timbulharjo 18,686 0 0.0% 15 74 0.4% 0 0 0.0% 15 74 0.4%U 31403 Bangunharjo 25,988 0 0.0% 697 3,487 13.4% 0 0 0.0% 697 3,487 13.4%U 31404 Panggungharjo 31,083 0 0.0% 537 2,687 8.6% 0 0 0.0% 537 2,687 8.6%U 31501 Bangunjiwo 22,290 0 0.0% 1,040 5,199 23.3% 340 1,700 7.6% 1,380 6,899 31.0%U 31502 Tirtonimolo 20,761 0 0.0% 98 492 2.4% 0 0 0.0% 98 492 2.4%U 31503 Tamantirto 19,640 0 0.0% 490 2,451 12.5% 0 0 0.0% 490 2,451 12.5%U 31504 Ngestiharjo 34,436 0 0.0% 1,106 5,532 16.1% 0 0 0.0% 1,106 5,532 16.1%
31601 Triwidadi 9,287 0 0.0% 0 0 0.0% 77 385 4.1% 77 385 4.1%31602 Sendangsari 10,109 0 0.0% 145 725 7.2% 70 350 3.5% 215 1,075 10.6%31603 Guwosari 9,918 0 0.0% 507 2,536 25.6% 40 200 2.0% 547 2,736 27.6%31701 Argodadi 9,634 0 0.0% 0 0 0.0% 150 750 7.8% 150 750 7.8%31702 Argorejo 11,401 0 0.0% 605 3,024 26.5% 30 150 1.3% 635 3,174 27.8%31703 Argosari 7,522 0 0.0% 151 756 10.1% 40 200 2.7% 191 956 12.7%31704 Argomulyo 13,450 0 0.0% 756 3,781 28.1% 40 200 1.5% 796 3,981 29.6%
Community System TotalTotalPopulatio
n
PDAM Yogyakarta PDAM Bantul
Note: Hatched/Colored lines mean urban Kelurahan/Desa which are discussed in previous section. Source: PDAM Yogyakarta, PDAM Bantul PU Bantul

13 - 40
(2) Basis of Future Water Demand Projection Since several water supply providers exist in the Study Area such as three PDAMs and Community Water Supply Systems, future water supply service type as a basis of future water demand projection is presumed depending on existing supply conditions.
Figure 13.2.5 shows the basis of future water demand projection for respective areas which have currently different type of water supply. It should be noted that classification of the basis of future water demand projection shown on Figure 13.2.5 is criteria for future service ratio and per capita water demand in respective area. Therefore, these classifications do not mean future demarcation of water supply system among PDAMs or Community Water Supply Systems.
Conforming to the basis of future water demand projection, domestic water demand for each Kelurahan/Desa is projected.

13 - 41
Figure 13.2.5 Existing Supply Conditions and Basis of Future Water Demand
Projection

13 - 42
Table 13.2.16 Basis of Future Water Demand Projection
PDAMYogyakarta
PDAMSleman PDAM Bantul Community Remarks
Basis of FutureWater Demand
Projection10000 Yogyakarta Municipali X X Urban PDAM20000 Sleman Regency X X X20101 Sumberahayu No Supply Community20102 Sumbersari X Community20103 Sumberagung X Rural PDAM20104 Sumberarum No Supply Community20201 Sendangmulyo X Community20202 Sendangarum No Supply Community20203 Sendangrejo X Rural PDAM20204 Sendangagung X Rural PDAM20205 Sendangsari X Community20301 Margodadi No Supply Community20302 Margoluwih X Community20303 Margomulyo No Supply Community20304 Margoagung No Supply Community20305 Margokaton X Community20401 Sidorejo X Community20402 Sidoluhur X Rural PDAM20403 Sidomulyo No Supply Community20404 Sidoagung X Rural PDAM20405 Sidokarto X Urban PDAM20406 Sidoarum X Urban PDAM20407 Sidomoyo X Urban PDAM20501 Balecatur X X Urban PDAM20502 Ambarketawang X Urban PDAM20503 Banyuraden X Urban PDAM20504 Nogotirto X Urban PDAM20505 Trihanggo X X Urban PDAM20601 Tirtoadi X Urban PDAM20602 Sumberadi X Urban PDAM20603 Tlogoadi X X Urban PDAM20604 Sendangadi X Urban PDAM20605 Sinduadi X X Urban PDAM20701 Caturtunggal X X Urban PDAM20702 Maguwoharjo X X Urban PDAM20703 Condongcatur X X Urban PDAM20801 Sendangtirto X Urban PDAM20802 Tegaltirto X Urban PDAM20803 Jogotirto No Supply Community20804 Kalitirto X Rural PDAM20901 Sumberharjo X Community20902 Wukirharjo X Community20903 Gayamharjo No Supply Community20904 Sambirojo X Community20905 Madurojo No Supply Community20906 Bokoharjo X Rural PDAM21001 Purwomartani X Urban PDAM21002 Tirtomartani X Rural PDAM21003 Tamanmartani No Supply Community21004 Selomartani X Rural PDAM21101 Wedomartani X Urban PDAM21102 Widodomartani X Rural PDAM21103 Bimomartani X Rural PDAM21104 Sindumartani X Rural PDAM21105 Umbulmartani X X Rural PDAM
Existing Water Supply Source
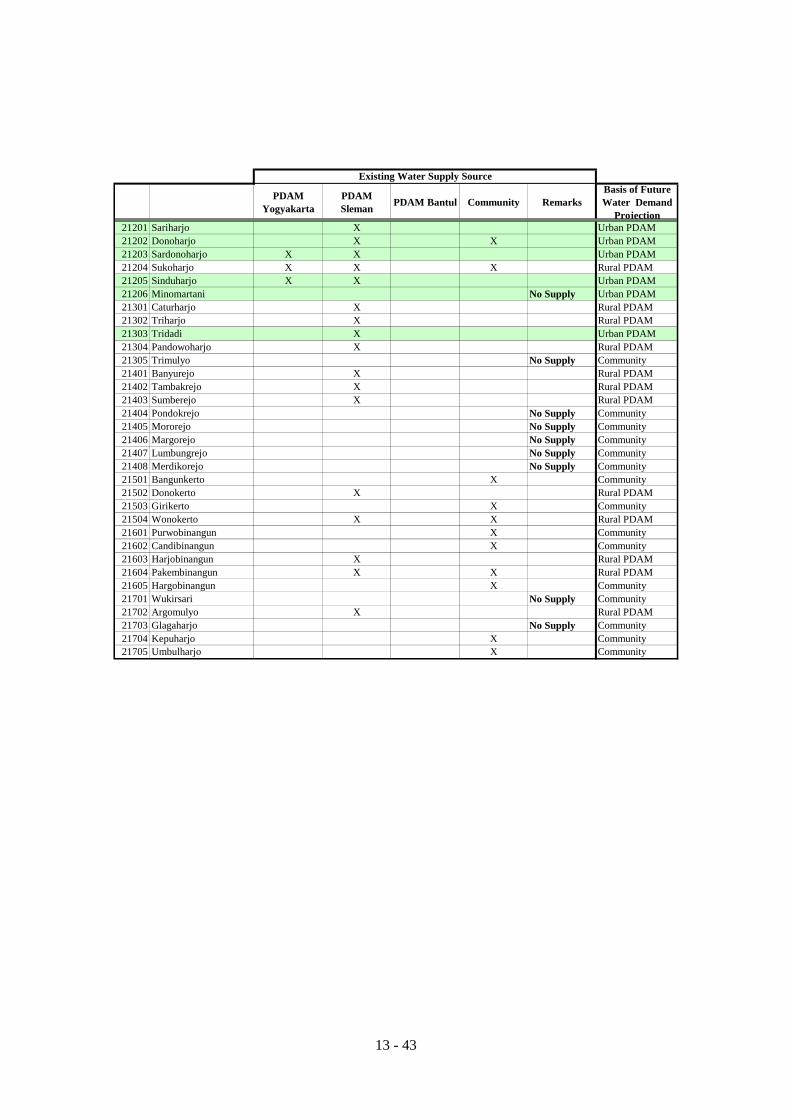
13 - 43
PDAMYogyakarta
PDAMSleman PDAM Bantul Community Remarks
Basis of FutureWater Demand
Projection21201 Sariharjo X Urban PDAM21202 Donoharjo X X Urban PDAM21203 Sardonoharjo X X Urban PDAM21204 Sukoharjo X X X Rural PDAM21205 Sinduharjo X X Urban PDAM21206 Minomartani No Supply Urban PDAM21301 Caturharjo X Rural PDAM21302 Triharjo X Rural PDAM21303 Tridadi X Urban PDAM21304 Pandowoharjo X Rural PDAM21305 Trimulyo No Supply Community21401 Banyurejo X Rural PDAM21402 Tambakrejo X Rural PDAM21403 Sumberejo X Rural PDAM21404 Pondokrejo No Supply Community21405 Mororejo No Supply Community21406 Margorejo No Supply Community21407 Lumbungrejo No Supply Community21408 Merdikorejo No Supply Community21501 Bangunkerto X Community21502 Donokerto X Rural PDAM21503 Girikerto X Community21504 Wonokerto X X Rural PDAM21601 Purwobinangun X Community21602 Candibinangun X Community21603 Harjobinangun X Rural PDAM21604 Pakembinangun X X Rural PDAM21605 Hargobinangun X Community21701 Wukirsari No Supply Community21702 Argomulyo X Rural PDAM21703 Glagaharjo No Supply Community21704 Kepuharjo X Community21705 Umbulharjo X Community
Existing Water Supply Source

13 - 44
PDAMYogyakarta
PDAMSleman PDAM Bantul Community Remarks
Basis of FutureWater Demand
Projection30000 Bantul Regency X X X30101 Poncosari X X Rural PDAM30102 Trimurti X Rural PDAM30201 Gadingsari X Rural PDAM30202 Gadingharjo X Rural PDAM30203 Srigading X Rural PDAM30204 Murtigading X Rural PDAM30301 Tirtohargo No Supply Community30302 Parangtritis X X Rural PDAM30303 Donotirto X Rural PDAM30304 Tirtosari X Rural PDAM30305 Tirtomulyo X Rural PDAM30401 Seloharjo No Supply Community30402 Panjangrejo X Rural PDAM30403 Srihandono X Rural PDAM30501 Sidomulyo X X Rural PDAM30502 Mulyodadi X Rural PDAM30503 Sumbermulyo X Rural PDAM30601 Caturharjo No Supply Community30602 Triharjo No Supply Community30603 Gilangharjo X Rural PDAM30604 Wijirejo X Rural PDAM30701 Palbapang X Rural PDAM30702 Ringinharjo X Urban PDAM30703 Bantul X Urban PDAM30704 Trirenggo No Supply Urban PDAM30705 Sapdodadi X Urban PDAM30801 Patalan X Rural PDAM30802 Canden No Supply Community30803 Sumberagung X Urban PDAM30804 Trimulyo X X Urban PDAM30901 Selopamioro X Community30902 Sriharjo No Supply Community30903 Kebonagung No Supply Community30904 Karangtengah X X Rural PDAM30905 Girirejo X Rural PDAM30906 Karangtalun X Rural PDAM30907 Imogiri X Urban PDAM30908 Wukirsari X Rural PDAM31001 Mangunan X Community31002 Muntuk X Community31003 Dlingo X Rural PDAM31004 Temuwuh X X Rural PDAM31005 Jatimulyo X X Rural PDAM31006 Terong X X Rural PDAM31101 Wonokromo No Supply Urban PDAM31102 Pleret No Supply Urban PDAM31103 Segoroyoso No Supply Urban PDAM31104 Bawuran X Community31105 Wonolelo X Community31201 Sitimulyo X Urban PDAM31202 Srimulyo X X Rural PDAM31203 Srimartani X X Rural PDAM
Existing Water Supply Source
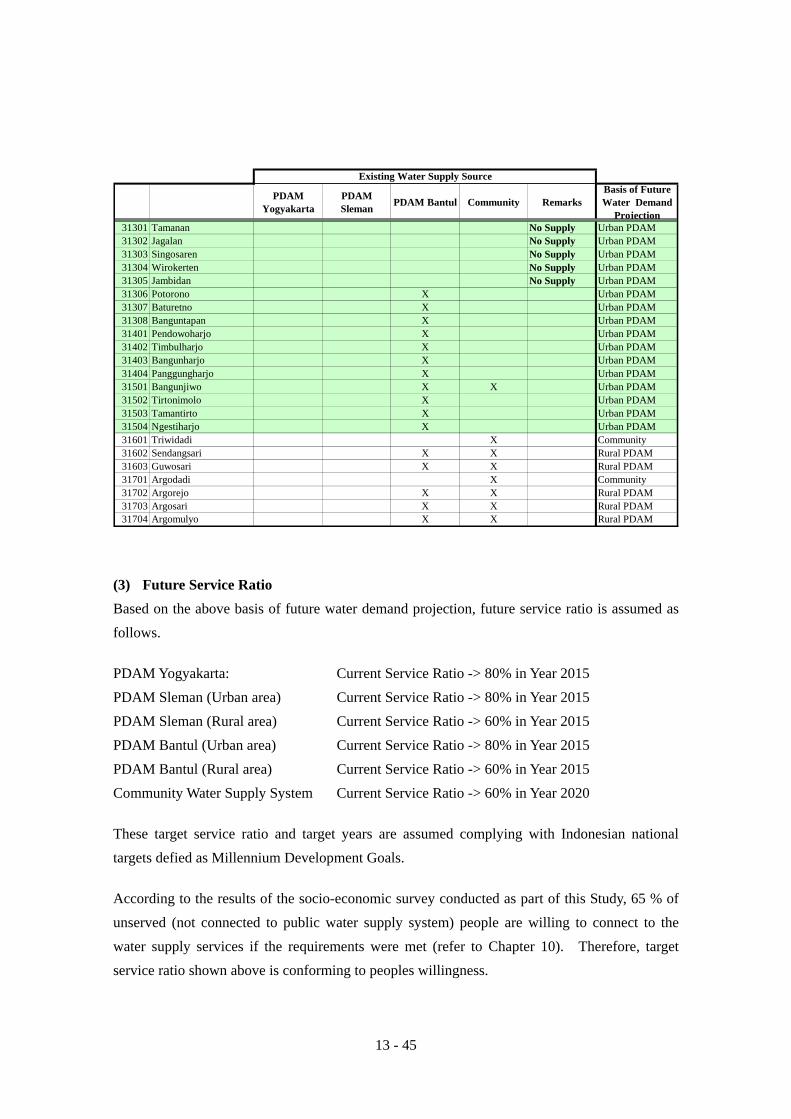
13 - 45
PDAMYogyakarta
PDAMSleman PDAM Bantul Community Remarks
Basis of FutureWater Demand
Projection31301 Tamanan No Supply Urban PDAM31302 Jagalan No Supply Urban PDAM31303 Singosaren No Supply Urban PDAM31304 Wirokerten No Supply Urban PDAM31305 Jambidan No Supply Urban PDAM31306 Potorono X Urban PDAM31307 Baturetno X Urban PDAM31308 Banguntapan X Urban PDAM31401 Pendowoharjo X Urban PDAM31402 Timbulharjo X Urban PDAM31403 Bangunharjo X Urban PDAM31404 Panggungharjo X Urban PDAM31501 Bangunjiwo X X Urban PDAM31502 Tirtonimolo X Urban PDAM31503 Tamantirto X Urban PDAM31504 Ngestiharjo X Urban PDAM31601 Triwidadi X Community31602 Sendangsari X X Rural PDAM31603 Guwosari X X Rural PDAM31701 Argodadi X Community31702 Argorejo X X Rural PDAM31703 Argosari X X Rural PDAM31704 Argomulyo X X Rural PDAM
Existing Water Supply Source
(3) Future Service Ratio Based on the above basis of future water demand projection, future service ratio is assumed as follows. PDAM Yogyakarta: Current Service Ratio -> 80% in Year 2015 PDAM Sleman (Urban area) Current Service Ratio -> 80% in Year 2015 PDAM Sleman (Rural area) Current Service Ratio -> 60% in Year 2015 PDAM Bantul (Urban area) Current Service Ratio -> 80% in Year 2015 PDAM Bantul (Rural area) Current Service Ratio -> 60% in Year 2015 Community Water Supply System Current Service Ratio -> 60% in Year 2020
These target service ratio and target years are assumed complying with Indonesian national targets defied as Millennium Development Goals.
According to the results of the socio-economic survey conducted as part of this Study, 65 % of unserved (not connected to public water supply system) people are willing to connect to the water supply services if the requirements were met (refer to Chapter 10). Therefore, target service ratio shown above is conforming to peoples willingness.

13 - 46
It should be noted that 80 % of PDAM customers have also own private well (PW) according to
the results of Socio Economic Survey (refer to Chapter 10). This ratio is estimated as decrease to 20% in Year 2015 according to improvement of PDAM water supply service quality.
1) Yogyakarta Municipality, Future Service Ratio Future service ratio is estimated based on conditions mentioned above as shown on Table 13.2.17 and Figure 13.2.6.
Table 13.2.17 Future Domestic Service Ratio in Yogyakarta Municipality Year 2005 2006 2007 2008 2009 2010 2011 2012 2013 2014 2015 2016 2017 2018 2019 2020
Service Ratio 39.7% 43.7% 47.7% 51.8% 55.8% 59.8% 63.9% 67.9% 71.9% 76.0% 80.0% 80.0% 80.0% 80.0% 80.0% 80.0% PDAM only 7.9% 11.4% 15.3% 19.7% 24.6% 29.9% 35.8% 42.1% 48.9% 56.2% 64.0% 64.0% 64.0% 64.0% 64.0% 64.0% PDAM + PW 31.7% 32.3% 32.5% 32.1% 31.2% 29.9% 28.1% 25.8% 23.0% 19.8% 16.0% 16.0% 16.0% 16.0% 16.0% 16.0% PW only 60.3% 56.3% 52.3% 48.2% 44.2% 40.2% 36.1% 32.1% 28.1% 24.0% 20.0% 20.0% 20.0% 20.0% 20.0% 20.0%
Ratio of PW dependency 80.0% 74.0% 68.0% 62.0% 56.0% 50.0% 44.0% 38.0% 32.0% 26.0% 20.0% 20.0% 20.0% 20.0% 20.0% 20.0% Note: “PW” is private well “PW only” means ratio of people who use private well only and do not connect to public water supply system.
0.0%
10.0%
20.0%
30.0%
40.0%
50.0%
60.0%
70.0%
80.0%
90.0%
100.0%
2005
2006
2007
2008
2009
2010
2011
2012
2013
2014
2015
2016
2017
2018
2019
2020
Year
Serv
ice
Rat
io (%
)
PDAM only PDAM + PW PW only
Figure 13.2.6 Future Domestic Service Ratio in Yogyakarta Municipality
2) Sleman and Bantul Regencies, Future Service Ratio Future service ratio is estimated based on conditions mentioned above as shown on tables below.
Table 13.2.18 Service Ratio of PDAM (Urban) Table 13.2.19 Service Ratio of PDAM (Rutal)

13 - 47
Table 13.2.18 Service Ratio of PDAM (Urban) 20000 Sleman Regency 2005 2006 2007 2008 2009 2010 2011 2012 2013 2014 2015 2016 2017 2018 2019 202020405 Sidokarto 29.9% 34.9% 39.9% 44.9% 49.9% 54.9% 60.0% 65.0% 70.0% 75.0% 80.0% 80.0% 80.0% 80.0% 80.0% 80.0%20406 Sidoarum 18.8% 24.9% 31.0% 37.1% 43.3% 49.4% 55.5% 61.6% 67.8% 73.9% 80.0% 80.0% 80.0% 80.0% 80.0% 80.0%20407 Sidomoyo 40.3% 44.2% 48.2% 52.2% 56.2% 60.1% 64.1% 68.1% 72.1% 76.0% 80.0% 80.0% 80.0% 80.0% 80.0% 80.0%20501 Balecatur 12.6% 19.3% 26.1% 32.8% 39.5% 46.3% 53.0% 59.8% 66.5% 73.3% 80.0% 80.0% 80.0% 80.0% 80.0% 80.0%20502 Ambarketawang 15.6% 22.0% 28.5% 34.9% 41.4% 47.8% 54.2% 60.7% 67.1% 73.6% 80.0% 80.0% 80.0% 80.0% 80.0% 80.0%20503 Banyuraden 13.3% 20.0% 26.7% 33.3% 40.0% 46.7% 53.3% 60.0% 66.7% 73.3% 80.0% 80.0% 80.0% 80.0% 80.0% 80.0%20504 Nogotirto 12.3% 19.1% 25.9% 32.6% 39.4% 46.2% 52.9% 59.7% 66.5% 73.2% 80.0% 80.0% 80.0% 80.0% 80.0% 80.0%20505 Trihanggo 11.3% 18.2% 25.1% 31.9% 38.8% 45.7% 52.5% 59.4% 66.3% 73.1% 80.0% 80.0% 80.0% 80.0% 80.0% 80.0%20601 Tirtoadi 2.7% 10.4% 18.1% 25.9% 33.6% 41.3% 49.1% 56.8% 64.5% 72.3% 80.0% 80.0% 80.0% 80.0% 80.0% 80.0%20602 Sumberadi 25.0% 30.5% 36.0% 41.5% 47.0% 52.5% 58.0% 63.5% 69.0% 74.5% 80.0% 80.0% 80.0% 80.0% 80.0% 80.0%20603 Tlogoadi 12.3% 19.1% 25.9% 32.6% 39.4% 46.2% 52.9% 59.7% 66.5% 73.2% 80.0% 80.0% 80.0% 80.0% 80.0% 80.0%20604 Sendangadi 36.5% 40.8% 45.2% 49.5% 53.9% 58.2% 62.6% 66.9% 71.3% 75.6% 80.0% 80.0% 80.0% 80.0% 80.0% 80.0%20605 Sinduadi 22.7% 28.5% 34.2% 39.9% 45.6% 51.4% 57.1% 62.8% 68.5% 74.3% 80.0% 80.0% 80.0% 80.0% 80.0% 80.0%20701 Caturtunggal 12.8% 19.5% 26.2% 33.0% 39.7% 46.4% 53.1% 59.8% 66.6% 73.3% 80.0% 80.0% 80.0% 80.0% 80.0% 80.0%20702 Maguwoharjo 9.2% 16.3% 23.4% 30.5% 37.5% 44.6% 51.7% 58.8% 65.8% 72.9% 80.0% 80.0% 80.0% 80.0% 80.0% 80.0%20703 Condongcatur 24.1% 29.7% 35.3% 40.9% 46.5% 52.1% 57.6% 63.2% 68.8% 74.4% 80.0% 80.0% 80.0% 80.0% 80.0% 80.0%20801 Sendangtirto 4.4% 11.9% 19.5% 27.1% 34.6% 42.2% 49.7% 57.3% 64.9% 72.4% 80.0% 80.0% 80.0% 80.0% 80.0% 80.0%20802 Tegaltirto 11.1% 17.9% 24.8% 31.7% 38.6% 45.5% 52.4% 59.3% 66.2% 73.1% 80.0% 80.0% 80.0% 80.0% 80.0% 80.0%21001 Purwomartani 20.4% 26.4% 32.3% 38.3% 44.2% 50.2% 56.2% 62.1% 68.1% 74.0% 80.0% 80.0% 80.0% 80.0% 80.0% 80.0%21101 Wedomartani 15.9% 22.3% 28.7% 35.1% 41.5% 47.9% 54.4% 60.8% 67.2% 73.6% 80.0% 80.0% 80.0% 80.0% 80.0% 80.0%21201 Sariharjo 11.0% 17.9% 24.8% 31.7% 38.6% 45.5% 52.4% 59.3% 66.2% 73.1% 80.0% 80.0% 80.0% 80.0% 80.0% 80.0%21202 Donoharjo 27.6% 32.9% 38.1% 43.3% 48.6% 53.8% 59.1% 64.3% 69.5% 74.8% 80.0% 80.0% 80.0% 80.0% 80.0% 80.0%21203 Sardonoharjo 17.2% 23.5% 29.8% 36.1% 42.3% 48.6% 54.9% 61.2% 67.4% 73.7% 80.0% 80.0% 80.0% 80.0% 80.0% 80.0%21205 Sinduharjo 27.5% 32.8% 38.0% 43.3% 48.5% 53.8% 59.0% 64.3% 69.5% 74.8% 80.0% 80.0% 80.0% 80.0% 80.0% 80.0%21206 Minomartani 0.0% 8.0% 16.0% 24.0% 32.0% 40.0% 48.0% 56.0% 64.0% 72.0% 80.0% 80.0% 80.0% 80.0% 80.0% 80.0%21303 Tridadi 40.8% 44.8% 48.7% 52.6% 56.5% 60.4% 64.3% 68.3% 72.2% 76.1% 80.0% 80.0% 80.0% 80.0% 80.0% 80.0%30000 Bantul Regency30702 Ringinharjo 24.9% 30.4% 36.0% 41.5% 47.0% 52.5% 58.0% 63.5% 69.0% 74.5% 80.0% 80.0% 80.0% 80.0% 80.0% 80.0%30703 Bantul 25.1% 30.6% 36.1% 41.6% 47.1% 52.6% 58.1% 63.5% 69.0% 74.5% 80.0% 80.0% 80.0% 80.0% 80.0% 80.0%30704 Trirenggo 0.0% 8.0% 16.0% 24.0% 32.0% 40.0% 48.0% 56.0% 64.0% 72.0% 80.0% 80.0% 80.0% 80.0% 80.0% 80.0%30705 Sapdodadi 1.3% 9.2% 17.0% 24.9% 32.8% 40.7% 48.5% 56.4% 64.3% 72.1% 80.0% 80.0% 80.0% 80.0% 80.0% 80.0%30803 Sumberagung 2.4% 10.1% 17.9% 25.6% 33.4% 41.2% 48.9% 56.7% 64.5% 72.2% 80.0% 80.0% 80.0% 80.0% 80.0% 80.0%30804 Trimulyo 19.9% 25.9% 31.9% 37.9% 43.9% 49.9% 55.9% 62.0% 68.0% 74.0% 80.0% 80.0% 80.0% 80.0% 80.0% 80.0%30907 Imogiri 6.4% 13.8% 21.1% 28.5% 35.9% 43.2% 50.6% 57.9% 65.3% 72.6% 80.0% 80.0% 80.0% 80.0% 80.0% 80.0%31101 Wonokromo 0.0% 8.0% 16.0% 24.0% 32.0% 40.0% 48.0% 56.0% 64.0% 72.0% 80.0% 80.0% 80.0% 80.0% 80.0% 80.0%31102 Pleret 0.0% 8.0% 16.0% 24.0% 32.0% 40.0% 48.0% 56.0% 64.0% 72.0% 80.0% 80.0% 80.0% 80.0% 80.0% 80.0%31103 Segoroyoso 0.0% 8.0% 16.0% 24.0% 32.0% 40.0% 48.0% 56.0% 64.0% 72.0% 80.0% 80.0% 80.0% 80.0% 80.0% 80.0%31201 Sitimulyo 0.0% 8.0% 16.0% 24.0% 32.0% 40.0% 48.0% 56.0% 64.0% 72.0% 80.0% 80.0% 80.0% 80.0% 80.0% 80.0%31301 Tamanan 0.0% 8.0% 16.0% 24.0% 32.0% 40.0% 48.0% 56.0% 64.0% 72.0% 80.0% 80.0% 80.0% 80.0% 80.0% 80.0%31302 Jagalan 0.0% 8.0% 16.0% 24.0% 32.0% 40.0% 48.0% 56.0% 64.0% 72.0% 80.0% 80.0% 80.0% 80.0% 80.0% 80.0%31303 Singosaren 0.0% 8.0% 16.0% 24.0% 32.0% 40.0% 48.0% 56.0% 64.0% 72.0% 80.0% 80.0% 80.0% 80.0% 80.0% 80.0%31304 Wirokerten 0.0% 8.0% 16.0% 24.0% 32.0% 40.0% 48.0% 56.0% 64.0% 72.0% 80.0% 80.0% 80.0% 80.0% 80.0% 80.0%31305 Jambidan 0.0% 8.0% 16.0% 24.0% 32.0% 40.0% 48.0% 56.0% 64.0% 72.0% 80.0% 80.0% 80.0% 80.0% 80.0% 80.0%31306 Potorono 1.2% 9.1% 17.0% 24.9% 32.7% 40.6% 48.5% 56.4% 64.2% 72.1% 80.0% 80.0% 80.0% 80.0% 80.0% 80.0%31307 Baturetno 3.9% 11.5% 19.1% 26.7% 34.3% 41.9% 49.5% 57.2% 64.8% 72.4% 80.0% 80.0% 80.0% 80.0% 80.0% 80.0%31308 Banguntapan 1.3% 9.2% 17.1% 24.9% 32.8% 40.7% 48.5% 56.4% 64.3% 72.1% 80.0% 80.0% 80.0% 80.0% 80.0% 80.0%31401 Pendowoharjo 15.1% 21.6% 28.1% 34.6% 41.1% 47.6% 54.0% 60.5% 67.0% 73.5% 80.0% 80.0% 80.0% 80.0% 80.0% 80.0%31402 Timbulharjo 0.4% 8.4% 16.3% 24.3% 32.2% 40.2% 48.2% 56.1% 64.1% 72.0% 80.0% 80.0% 80.0% 80.0% 80.0% 80.0%31403 Bangunharjo 13.4% 20.1% 26.7% 33.4% 40.1% 46.7% 53.4% 60.0% 66.7% 73.3% 80.0% 80.0% 80.0% 80.0% 80.0% 80.0%31404 Panggungharjo 8.6% 15.8% 22.9% 30.1% 37.2% 44.3% 51.5% 58.6% 65.7% 72.9% 80.0% 80.0% 80.0% 80.0% 80.0% 80.0%31501 Bangunjiwo 23.3% 29.0% 34.7% 40.3% 46.0% 51.7% 57.3% 63.0% 68.7% 74.3% 80.0% 80.0% 80.0% 80.0% 80.0% 80.0%31502 Tirtonimolo 2.4% 10.1% 17.9% 25.7% 33.4% 41.2% 48.9% 56.7% 64.5% 72.2% 80.0% 80.0% 80.0% 80.0% 80.0% 80.0%31503 Tamantirto 12.5% 19.2% 26.0% 32.7% 39.5% 46.2% 53.0% 59.7% 66.5% 73.2% 80.0% 80.0% 80.0% 80.0% 80.0% 80.0%31504 Ngestiharjo 16.1% 22.5% 28.9% 35.2% 41.6% 48.0% 54.4% 60.8% 67.2% 73.6% 80.0% 80.0% 80.0% 80.0% 80.0% 80.0%
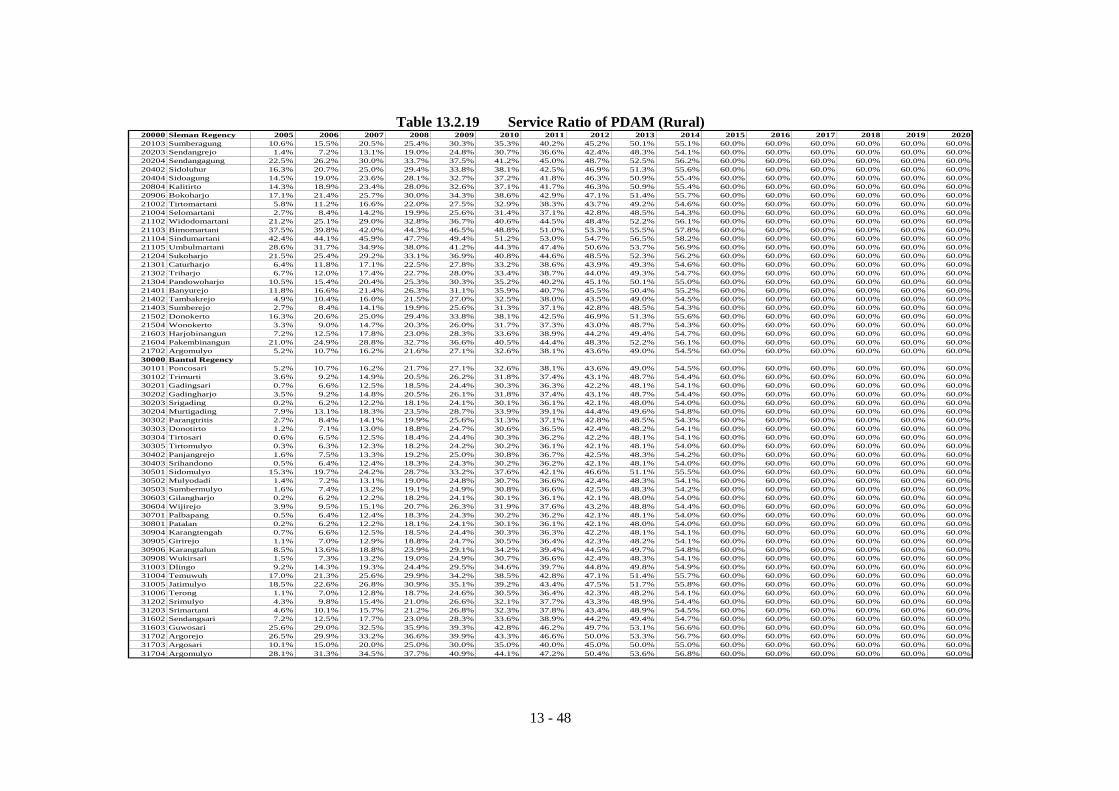
13 - 48
Table 13.2.19 Service Ratio of PDAM (Rural) 20000 Sleman Regency 2005 2006 2007 2008 2009 2010 2011 2012 2013 2014 2015 2016 2017 2018 2019 202020103 Sumberagung 10.6% 15.5% 20.5% 25.4% 30.3% 35.3% 40.2% 45.2% 50.1% 55.1% 60.0% 60.0% 60.0% 60.0% 60.0% 60.0%20203 Sendangrejo 1.4% 7.2% 13.1% 19.0% 24.8% 30.7% 36.6% 42.4% 48.3% 54.1% 60.0% 60.0% 60.0% 60.0% 60.0% 60.0%20204 Sendangagung 22.5% 26.2% 30.0% 33.7% 37.5% 41.2% 45.0% 48.7% 52.5% 56.2% 60.0% 60.0% 60.0% 60.0% 60.0% 60.0%20402 Sidoluhur 16.3% 20.7% 25.0% 29.4% 33.8% 38.1% 42.5% 46.9% 51.3% 55.6% 60.0% 60.0% 60.0% 60.0% 60.0% 60.0%20404 Sidoagung 14.5% 19.0% 23.6% 28.1% 32.7% 37.2% 41.8% 46.3% 50.9% 55.4% 60.0% 60.0% 60.0% 60.0% 60.0% 60.0%20804 Kalitirto 14.3% 18.9% 23.4% 28.0% 32.6% 37.1% 41.7% 46.3% 50.9% 55.4% 60.0% 60.0% 60.0% 60.0% 60.0% 60.0%20906 Bokoharjo 17.1% 21.4% 25.7% 30.0% 34.3% 38.6% 42.9% 47.1% 51.4% 55.7% 60.0% 60.0% 60.0% 60.0% 60.0% 60.0%21002 Tirtomartani 5.8% 11.2% 16.6% 22.0% 27.5% 32.9% 38.3% 43.7% 49.2% 54.6% 60.0% 60.0% 60.0% 60.0% 60.0% 60.0%21004 Selomartani 2.7% 8.4% 14.2% 19.9% 25.6% 31.4% 37.1% 42.8% 48.5% 54.3% 60.0% 60.0% 60.0% 60.0% 60.0% 60.0%21102 Widodomartani 21.2% 25.1% 29.0% 32.8% 36.7% 40.6% 44.5% 48.4% 52.2% 56.1% 60.0% 60.0% 60.0% 60.0% 60.0% 60.0%21103 Bimomartani 37.5% 39.8% 42.0% 44.3% 46.5% 48.8% 51.0% 53.3% 55.5% 57.8% 60.0% 60.0% 60.0% 60.0% 60.0% 60.0%21104 Sindumartani 42.4% 44.1% 45.9% 47.7% 49.4% 51.2% 53.0% 54.7% 56.5% 58.2% 60.0% 60.0% 60.0% 60.0% 60.0% 60.0%21105 Umbulmartani 28.6% 31.7% 34.9% 38.0% 41.2% 44.3% 47.4% 50.6% 53.7% 56.9% 60.0% 60.0% 60.0% 60.0% 60.0% 60.0%21204 Sukoharjo 21.5% 25.4% 29.2% 33.1% 36.9% 40.8% 44.6% 48.5% 52.3% 56.2% 60.0% 60.0% 60.0% 60.0% 60.0% 60.0%21301 Caturharjo 6.4% 11.8% 17.1% 22.5% 27.8% 33.2% 38.6% 43.9% 49.3% 54.6% 60.0% 60.0% 60.0% 60.0% 60.0% 60.0%21302 Triharjo 6.7% 12.0% 17.4% 22.7% 28.0% 33.4% 38.7% 44.0% 49.3% 54.7% 60.0% 60.0% 60.0% 60.0% 60.0% 60.0%21304 Pandowoharjo 10.5% 15.4% 20.4% 25.3% 30.3% 35.2% 40.2% 45.1% 50.1% 55.0% 60.0% 60.0% 60.0% 60.0% 60.0% 60.0%21401 Banyurejo 11.8% 16.6% 21.4% 26.3% 31.1% 35.9% 40.7% 45.5% 50.4% 55.2% 60.0% 60.0% 60.0% 60.0% 60.0% 60.0%21402 Tambakrejo 4.9% 10.4% 16.0% 21.5% 27.0% 32.5% 38.0% 43.5% 49.0% 54.5% 60.0% 60.0% 60.0% 60.0% 60.0% 60.0%21403 Sumberejo 2.7% 8.4% 14.1% 19.9% 25.6% 31.3% 37.1% 42.8% 48.5% 54.3% 60.0% 60.0% 60.0% 60.0% 60.0% 60.0%21502 Donokerto 16.3% 20.6% 25.0% 29.4% 33.8% 38.1% 42.5% 46.9% 51.3% 55.6% 60.0% 60.0% 60.0% 60.0% 60.0% 60.0%21504 Wonokerto 3.3% 9.0% 14.7% 20.3% 26.0% 31.7% 37.3% 43.0% 48.7% 54.3% 60.0% 60.0% 60.0% 60.0% 60.0% 60.0%21603 Harjobinangun 7.2% 12.5% 17.8% 23.0% 28.3% 33.6% 38.9% 44.2% 49.4% 54.7% 60.0% 60.0% 60.0% 60.0% 60.0% 60.0%21604 Pakembinangun 21.0% 24.9% 28.8% 32.7% 36.6% 40.5% 44.4% 48.3% 52.2% 56.1% 60.0% 60.0% 60.0% 60.0% 60.0% 60.0%21702 Argomulyo 5.2% 10.7% 16.2% 21.6% 27.1% 32.6% 38.1% 43.6% 49.0% 54.5% 60.0% 60.0% 60.0% 60.0% 60.0% 60.0%30000 Bantul Regency30101 Poncosari 5.2% 10.7% 16.2% 21.7% 27.1% 32.6% 38.1% 43.6% 49.0% 54.5% 60.0% 60.0% 60.0% 60.0% 60.0% 60.0%30102 Trimurti 3.6% 9.2% 14.9% 20.5% 26.2% 31.8% 37.4% 43.1% 48.7% 54.4% 60.0% 60.0% 60.0% 60.0% 60.0% 60.0%30201 Gadingsari 0.7% 6.6% 12.5% 18.5% 24.4% 30.3% 36.3% 42.2% 48.1% 54.1% 60.0% 60.0% 60.0% 60.0% 60.0% 60.0%30202 Gadingharjo 3.5% 9.2% 14.8% 20.5% 26.1% 31.8% 37.4% 43.1% 48.7% 54.4% 60.0% 60.0% 60.0% 60.0% 60.0% 60.0%30203 Srigading 0.2% 6.2% 12.2% 18.1% 24.1% 30.1% 36.1% 42.1% 48.0% 54.0% 60.0% 60.0% 60.0% 60.0% 60.0% 60.0%30204 Murtigading 7.9% 13.1% 18.3% 23.5% 28.7% 33.9% 39.1% 44.4% 49.6% 54.8% 60.0% 60.0% 60.0% 60.0% 60.0% 60.0%30302 Parangtritis 2.7% 8.4% 14.1% 19.9% 25.6% 31.3% 37.1% 42.8% 48.5% 54.3% 60.0% 60.0% 60.0% 60.0% 60.0% 60.0%30303 Donotirto 1.2% 7.1% 13.0% 18.8% 24.7% 30.6% 36.5% 42.4% 48.2% 54.1% 60.0% 60.0% 60.0% 60.0% 60.0% 60.0%30304 Tirtosari 0.6% 6.5% 12.5% 18.4% 24.4% 30.3% 36.2% 42.2% 48.1% 54.1% 60.0% 60.0% 60.0% 60.0% 60.0% 60.0%30305 Tirtomulyo 0.3% 6.3% 12.3% 18.2% 24.2% 30.2% 36.1% 42.1% 48.1% 54.0% 60.0% 60.0% 60.0% 60.0% 60.0% 60.0%30402 Panjangrejo 1.6% 7.5% 13.3% 19.2% 25.0% 30.8% 36.7% 42.5% 48.3% 54.2% 60.0% 60.0% 60.0% 60.0% 60.0% 60.0%30403 Srihandono 0.5% 6.4% 12.4% 18.3% 24.3% 30.2% 36.2% 42.1% 48.1% 54.0% 60.0% 60.0% 60.0% 60.0% 60.0% 60.0%30501 Sidomulyo 15.3% 19.7% 24.2% 28.7% 33.2% 37.6% 42.1% 46.6% 51.1% 55.5% 60.0% 60.0% 60.0% 60.0% 60.0% 60.0%30502 Mulyodadi 1.4% 7.2% 13.1% 19.0% 24.8% 30.7% 36.6% 42.4% 48.3% 54.1% 60.0% 60.0% 60.0% 60.0% 60.0% 60.0%30503 Sumbermulyo 1.6% 7.4% 13.2% 19.1% 24.9% 30.8% 36.6% 42.5% 48.3% 54.2% 60.0% 60.0% 60.0% 60.0% 60.0% 60.0%30603 Gilangharjo 0.2% 6.2% 12.2% 18.2% 24.1% 30.1% 36.1% 42.1% 48.0% 54.0% 60.0% 60.0% 60.0% 60.0% 60.0% 60.0%30604 Wijirejo 3.9% 9.5% 15.1% 20.7% 26.3% 31.9% 37.6% 43.2% 48.8% 54.4% 60.0% 60.0% 60.0% 60.0% 60.0% 60.0%30701 Palbapang 0.5% 6.4% 12.4% 18.3% 24.3% 30.2% 36.2% 42.1% 48.1% 54.0% 60.0% 60.0% 60.0% 60.0% 60.0% 60.0%30801 Patalan 0.2% 6.2% 12.2% 18.1% 24.1% 30.1% 36.1% 42.1% 48.0% 54.0% 60.0% 60.0% 60.0% 60.0% 60.0% 60.0%30904 Karangtengah 0.7% 6.6% 12.5% 18.5% 24.4% 30.3% 36.3% 42.2% 48.1% 54.1% 60.0% 60.0% 60.0% 60.0% 60.0% 60.0%30905 Girirejo 1.1% 7.0% 12.9% 18.8% 24.7% 30.5% 36.4% 42.3% 48.2% 54.1% 60.0% 60.0% 60.0% 60.0% 60.0% 60.0%30906 Karangtalun 8.5% 13.6% 18.8% 23.9% 29.1% 34.2% 39.4% 44.5% 49.7% 54.8% 60.0% 60.0% 60.0% 60.0% 60.0% 60.0%30908 Wukirsari 1.5% 7.3% 13.2% 19.0% 24.9% 30.7% 36.6% 42.4% 48.3% 54.1% 60.0% 60.0% 60.0% 60.0% 60.0% 60.0%31003 Dlingo 9.2% 14.3% 19.3% 24.4% 29.5% 34.6% 39.7% 44.8% 49.8% 54.9% 60.0% 60.0% 60.0% 60.0% 60.0% 60.0%31004 Temuwuh 17.0% 21.3% 25.6% 29.9% 34.2% 38.5% 42.8% 47.1% 51.4% 55.7% 60.0% 60.0% 60.0% 60.0% 60.0% 60.0%31005 Jatimulyo 18.5% 22.6% 26.8% 30.9% 35.1% 39.2% 43.4% 47.5% 51.7% 55.8% 60.0% 60.0% 60.0% 60.0% 60.0% 60.0%31006 Terong 1.1% 7.0% 12.8% 18.7% 24.6% 30.5% 36.4% 42.3% 48.2% 54.1% 60.0% 60.0% 60.0% 60.0% 60.0% 60.0%31202 Srimulyo 4.3% 9.8% 15.4% 21.0% 26.6% 32.1% 37.7% 43.3% 48.9% 54.4% 60.0% 60.0% 60.0% 60.0% 60.0% 60.0%31203 Srimartani 4.6% 10.1% 15.7% 21.2% 26.8% 32.3% 37.8% 43.4% 48.9% 54.5% 60.0% 60.0% 60.0% 60.0% 60.0% 60.0%31602 Sendangsari 7.2% 12.5% 17.7% 23.0% 28.3% 33.6% 38.9% 44.2% 49.4% 54.7% 60.0% 60.0% 60.0% 60.0% 60.0% 60.0%31603 Guwosari 25.6% 29.0% 32.5% 35.9% 39.3% 42.8% 46.2% 49.7% 53.1% 56.6% 60.0% 60.0% 60.0% 60.0% 60.0% 60.0%31702 Argorejo 26.5% 29.9% 33.2% 36.6% 39.9% 43.3% 46.6% 50.0% 53.3% 56.7% 60.0% 60.0% 60.0% 60.0% 60.0% 60.0%31703 Argosari 10.1% 15.0% 20.0% 25.0% 30.0% 35.0% 40.0% 45.0% 50.0% 55.0% 60.0% 60.0% 60.0% 60.0% 60.0% 60.0%31704 Argomulyo 28.1% 31.3% 34.5% 37.7% 40.9% 44.1% 47.2% 50.4% 53.6% 56.8% 60.0% 60.0% 60.0% 60.0% 60.0% 60.0%

13 - 49
13.2.4 Future Domestic Water Demand
From domestic service ratio in respective Kelurahan/Desa, future served population is calculated. From the calculated served population and per capita domestic water demand which are discussed in previous sections, future domestic water demand is calculated as explained below.
(1) Yogyakarta Municipality Future domestic water demand for Yogyakarta Municipality by respective Kelurahan is shown in Appendix 13. Figure 13.2.7 shows the future domestic water demand and groundwater requirement which will be used through private well.
0.0
100.0
200.0
300.0
400.0
500.0
600.0
700.0
800.0
900.0
2005
2006
2007
2008
2009
2010
2011
2012
2013
2014
2015
2016
2017
2018
2019
2020
Year
Dom
estic
Wat
er D
eman
d (l/
sec)
PDAM Domestic Water Demand GW Requirement for Domestic Private Well
Figure 13.2.7 Yogyakarta Municipality, Future Domestic Water Demand and Groundwater Requirement for Private Well
Since dependency rate on private well will be decrease from current 80% to 20 % in 2020, volume of groundwater usage will decrease gradually.
(2) Sleman and Bantul Regencies, Future Domestic Water Demand Future domestic water demands for Sleman and Bantul Regencies are shown in Appendix 13 in form of tables as shown below.
• Sleman and Bantul Regencies, Future Domestic Water Demand for PDAM (Urban)

13 - 50
(l/sec) • Sleman and Bantul Regencies, Future Domestic Water Demand for PDAM (Rural)
(l/sec) • Sleman and Bantul Regencies, Future Domestic Water Demand for Community Water
Supply System (l/sec) • Sleman and Bantul Regencies, Future Domestic Groundwater Requirement (l/sec)
For Yogyakarta Municipality, future domestic water demands are described by only two categories such as “PDAM (urban)” and “groundwater requirement through private wells”. On the other hand for Sleman and Bantul Regencies, there are four categories of domestic water demand. They are;
• PDAM (urban): water demand which will occur in urban area and which will be met by PDAM,
• PDAM (rural): water demand which will occur in rural area and which will be met by PDAM,
• Community System: water demand will occur in rural area and which will be met by community water supply system, and
• GW requirement for domestic private well: this is a total groundwater requirement of private well usage of PDAM customers and water usage of unserved population either by PDAM or community water supply system.
Figures 13.2.8 and 13.2.9 show summary of domestic water demands for Sleman and Bantul Regencies, respectively.
0
200
400
600
800
1,000
1,200
1,400
1,600
1,800
2,000
2005
2006
2007
2008
2009
2010
2011
2012
2013
2014
2015
2016
2017
2018
2019
2020
Year
Dom
estic
Wat
er D
eman
d (l/
sec)
PDAM (Urban) Domestic Water Demand PDAM (Rural) Domestic Water DemandCommunity System Domestic Water Demand GW Requirement for Domestic Private Well
Figure 13.2.8 Summary of Domestic Water Demand in Sleman Regency

13 - 51
0
200
400
600
800
1,000
1,200
1,400
1,600
1,800
2005
2006
2007
2008
2009
2010
2011
2012
2013
2014
2015
2016
2017
2018
2019
2020
Year
Dom
estic
Wat
er D
eman
d (l/
sec)
PDAM (Urban) Domestic Water Demand PDAM (Rural) Domestic Water DemandCommunity System Domestic Water Demand GW Requirement for Domestic Private Well
Figure 13.2.9 Summary of Domestic Water Demand in Bantul Regency
(3) Summary of Domestic Water Demand Summary of the domestic water demands for Yogyakarta Municipality, Sleman and Bantul Regencies are shown on Figures 13.2 10 to 13.2.13.
0
500
1,000
1,500
2,000
2,500
3,000
3,500
4,000
4,500
2005
2006
2007
2008
2009
2010
2011
2012
2013
2014
2015
2016
2017
2018
2019
2020
Year
Dom
estic
Wat
er D
eman
d (l/
sec)
Yogyakarta PDAM Yogyakarta Private Well Sleman PDAM (Urban) Sleman PDAM (Rural)Sleman Community System Sleman Private Well Bantul PDAM (Urban) Bantul PDAM (Rural)Bantul Community System Bantul Private Well
Figure 13.2.10 Summary of Domestic Water Demand
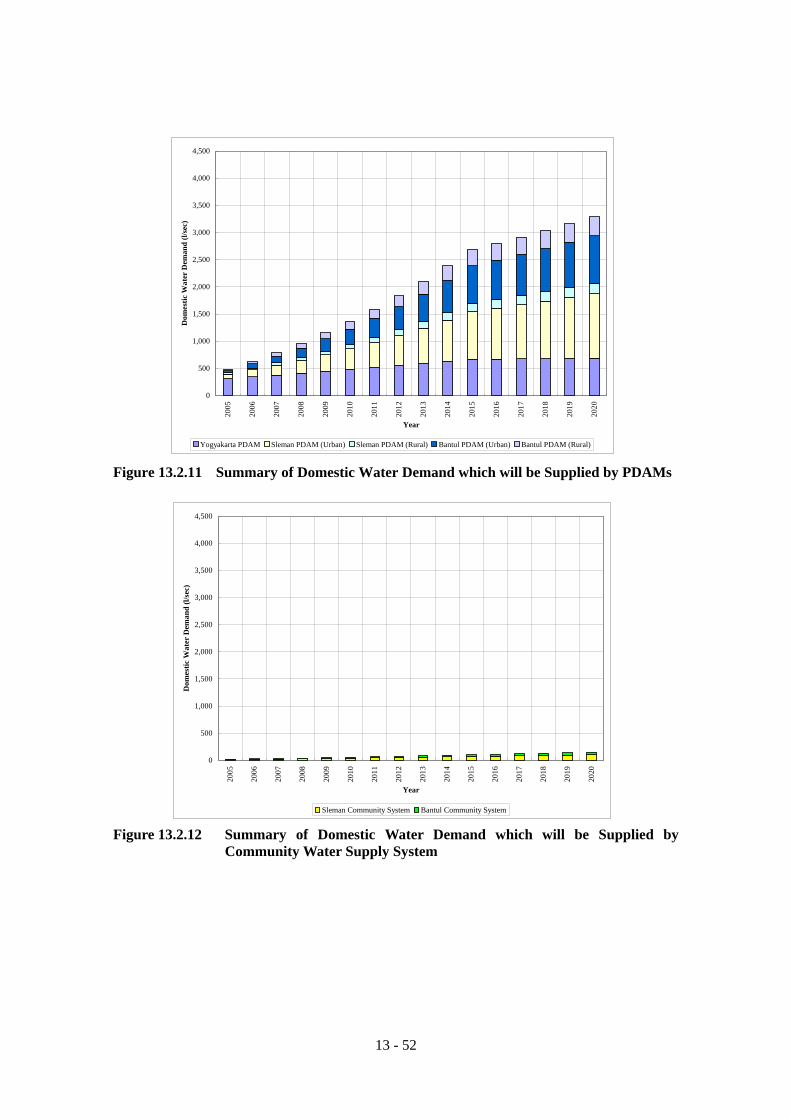
13 - 52
0
500
1,000
1,500
2,000
2,500
3,000
3,500
4,000
4,500
2005
2006
2007
2008
2009
2010
2011
2012
2013
2014
2015
2016
2017
2018
2019
2020
Year
Dom
estic
Wat
er D
eman
d (l/
sec)
Yogyakarta PDAM Sleman PDAM (Urban) Sleman PDAM (Rural) Bantul PDAM (Urban) Bantul PDAM (Rural)
Figure 13.2.11 Summary of Domestic Water Demand which will be Supplied by PDAMs
0
500
1,000
1,500
2,000
2,500
3,000
3,500
4,000
4,500
2005
2006
2007
2008
2009
2010
2011
2012
2013
2014
2015
2016
2017
2018
2019
2020
Year
Dom
estic
Wat
er D
eman
d (l/
sec)
Sleman Community System Bantul Community System
Figure 13.2.12 Summary of Domestic Water Demand which will be Supplied by
Community Water Supply System

13 - 53
0
500
1,000
1,500
2,000
2,500
3,000
3,500
4,000
4,500
2005
2006
2007
2008
2009
2010
2011
2012
2013
2014
2015
2016
2017
2018
2019
2020
Year
Dom
estic
Wat
er D
eman
d (l/
sec)
Yogyakarta Private Well Sleman Private Well Bantul Private Well
Figure 13.2.13 Groundwater Requirement through Private Wells
13.2.5 Non-Domestic Water Demand
(1) Future Public Service Water Demand Future public service water demand is projected to increase from current water consumption as public service applying increase ratio as same as total population increase ratio.
(2) Future Commercial Water Demand
1) General Commercial Water Demand Future general commercial water demand is projected by assuming the increase ratio shall be 4.7 %, with a contant ratio up to the year of 2020. This ratio is regarded as same as the past 5 year average increase ratio of GDRP (Gross Domestic Regional Products).
2) Tourism Related Commercial Water Demand Future tourism related commercial water demand is projected based on number of tourist arrival to DIY.
Future Number of Tourist Arrival Future number of tourist arrival is projected as shown on Figures 13.2.14 and 13.2.15 for foreign and domestic tourists, respectively. To project future number of tourists, five statistical equations which were applied to population forecasts were also applied.

13 - 54
0
50,000
100,000
150,000
200,000
250,000
300,000
350,000
400,000
1990 1995 2000 2005 2010 2015 2020
Year
Num
ber
of A
nnua
l For
eign
Tou
rist
Arr
ival
Past Record Arithmatic GiometricExponential Power Logistic
Source:Badan Parwisata Daerah Propinsi DIY
Figure 13.2.14 Projection of Annual Foreign Tourist Arrival
As shown on figure above, number of foreign tourists was drastically decreased from 1997 when financial crisis occurred in Asia. Therefore, data after year 1999 were utilized for the projection, data before 1998 were neglected. In above figure, Geometric Curve is applied for future tourist population since it has the highest conformity to the past record.
0
1,000,000
2,000,000
3,000,000
4,000,000
5,000,000
6,000,000
7,000,000
8,000,000
1990 1995 2000 2005 2010 2015 2020
Year
Num
ber
of A
nnua
l Dom
estic
Tou
rist
Arr
ival
Past Record Adjusted Data Arithmatic GiometricExponential Power Logistic
Source:Badan Parwisata Daerah Propinsi DIY
Figure 13.2.15 Projection of Annual Domestic Tourist Arrival Regarding domestic tourists, number of tourist arrivals also decreased from 1997, however, number of tourists was recovered from year 2004 as shown on figure above. Future number of domestic tourists are calculated applying Exponential Curve since it has the highest conformity to the past record of tourist numbers.

13 - 55
From future number of foreign and domestic tourist population, total tourist population in future is projected as shown on Figure 13.2.16.
0
500,000
1,000,000
1,500,000
2,000,000
2,500,000
3,000,000
3,500,000
4,000,000
2005
2006
2007
2008
2009
2010
2011
2012
2013
2014
2015
2016
2017
2018
2019
2020
Year
Tot
al A
nnua
l Tou
rist
Arr
ival
Foreign Domestic
Figure 13.2.16 Total Annual Tourist Arrival to DIY According to the data obtained from tourism department, average length of stay of tourists is summarized as shown on Table 13.2.20.
Table 13.2.20 Average Length of Stay Foreign Tourists Domestic Tourists Year Star Hotels Economy Hotels Star Hotels Economy Hotels
2001 2.03 2.05 1.65 1.10 2002 1.83 1.91 1.84 1.25 2003 1.95 1.80 1.78 1.20 2004 1.84 2.20 1.65 1.46 2005 2.41 2.22 2.30 1.65
Average 2.01 2.04 1.84 1.33 Source:Badan Parwisata Daerah Propinsi DIY
From total number of tourists and average length of stay, daily number of tourists is calculated as follows.

13 - 56
Table 13.2.21 Daily Number of Tourist Stay in DIY
StarHotels
EconomyHotels Total Star
HotelsEconomy
Hotels Total StarHotels
EconomyHotels Total
2005 454 140 595 3,244 4,120 7,363 3,698 4,260 7,9582006 481 148 630 3,414 4,336 7,751 3,896 4,485 8,3802007 510 157 667 3,583 4,551 8,135 4,093 4,709 8,8022008 540 167 707 3,751 4,765 8,516 4,292 4,931 9,2232009 572 177 749 3,918 4,977 8,895 4,490 5,153 9,6432010 606 187 793 4,084 5,187 9,270 4,690 5,374 10,0632011 642 198 840 4,248 5,395 9,643 4,890 5,593 10,4832012 680 210 890 4,411 5,602 10,013 5,091 5,812 10,9032013 721 222 943 4,572 5,807 10,380 5,293 6,030 11,3232014 763 235 999 4,733 6,011 10,744 5,496 6,247 11,7432015 809 249 1,058 4,892 6,214 11,106 5,701 6,463 12,1642016 857 264 1,121 5,050 6,414 11,464 5,907 6,678 12,5852017 908 280 1,187 5,207 6,613 11,820 6,114 6,893 13,0082018 961 297 1,258 5,362 6,811 12,174 6,324 7,108 13,4312019 1,018 314 1,333 5,517 7,007 12,524 6,535 7,321 13,8572020 1,079 333 1,412 5,670 7,202 12,872 6,749 7,535 14,284
YearForeign Tourists Domestic Tourists Total Tourists
Per Capita Water Demand of Tourist Per capita water demand of tourist per day is estimated as follows considering other resort’s water consumption.
Table 13.2.22 Per Tourist Water Demand per Day Stay at Per Capita Water Demand per Day (lpcd) Star Hotels 420 Economy Hotels 260
From daily number of tourists and per tourist water demand, future tourism water demand is calculated as shown on Table 13.2.23. Proportion of water demand for Yogyakarta, Sleman and Bantul is calculated based on number of hotel rooms in each municipality/regency.

13 - 57
Table 13.2.23 Future Tourism Water Demand (l/sec)
Star Hotel Econ. Hotel Total Star Hotel Econ. Hotel Total Star Hotel Econ. Hotel Total2005 8.3 5.1 13.5 9.5 5.1 14.6 4.4 2.1 6.42006 8.8 5.4 14.2 10.0 5.4 15.4 4.6 2.2 6.82007 9.2 5.7 14.9 10.5 5.7 16.1 4.9 2.3 7.12008 9.7 5.9 15.6 11.0 5.9 16.9 5.1 2.4 7.52009 10.1 6.2 16.3 11.5 6.2 17.7 5.3 2.5 7.82010 10.6 6.5 17.0 12.0 6.5 18.5 5.6 2.6 8.22011 11.0 6.7 17.8 12.5 6.7 19.2 5.8 2.7 8.52012 11.5 7.0 18.5 13.0 7.0 20.0 6.0 2.8 8.82013 11.9 7.3 19.2 13.5 7.3 20.8 6.3 2.9 9.22014 12.4 7.5 19.9 14.1 7.5 21.6 6.5 3.0 9.52015 12.9 7.8 20.6 14.6 7.8 22.4 6.8 3.1 9.92016 13.3 8.0 21.4 15.1 8.0 23.1 7.0 3.2 10.22017 13.8 8.3 22.1 15.6 8.3 23.9 7.3 3.3 10.62018 14.3 8.6 22.8 16.2 8.6 24.7 7.5 3.4 10.92019 14.7 8.8 23.5 16.7 8.8 25.5 7.8 3.5 11.32020 15.2 9.1 24.3 17.3 9.1 26.3 8.0 3.6 11.6
Yogyakarta Sleman Bantul
(3) Future Industrial Water Demand Future industrial water demand is projected by increase ratio of 4.7 % of which past 5 year average increase ratio of GDRP (Gross Domestic Regional Products). For Sleman Regency, since there is no data of industrial water demand, same figure of Yogyakarta Municipality is applied.
13.2.6 Total Future Water Demand From discussions made in previous sections, total future water demand is calculated as described in proceeding sections. To calculate total future water demand, following conditions are applied.
Net Water Demand: This demand is summation of domestic and non-domestic water demands and is net water demand which does not include any peak factors and UFW.
UFW Ratio: Target UFW ratio is set as 25 % in year 2020. The UFW
ratio will be reduced from current level to the target UFW ratio.
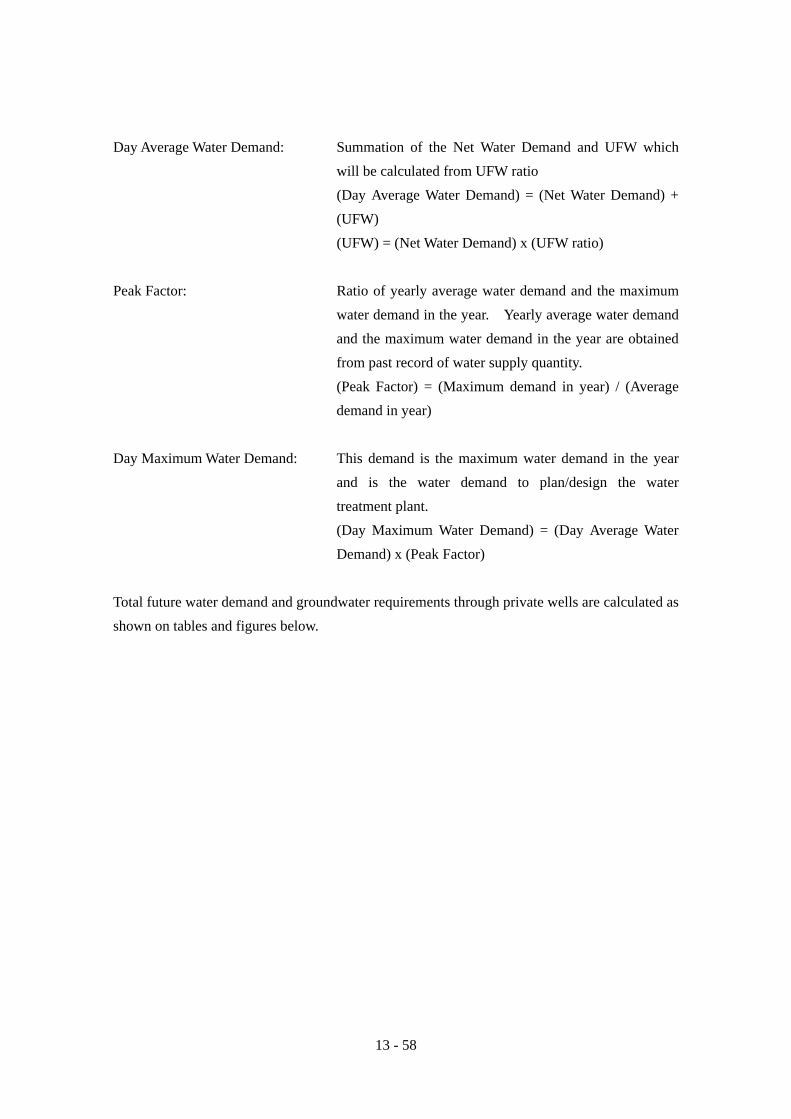
13 - 58
Day Average Water Demand: Summation of the Net Water Demand and UFW which will be calculated from UFW ratio
(Day Average Water Demand) = (Net Water Demand) + (UFW)
(UFW) = (Net Water Demand) x (UFW ratio) Peak Factor: Ratio of yearly average water demand and the maximum
water demand in the year. Yearly average water demand and the maximum water demand in the year are obtained from past record of water supply quantity.
(Peak Factor) = (Maximum demand in year) / (Average demand in year)
Day Maximum Water Demand: This demand is the maximum water demand in the year
and is the water demand to plan/design the water treatment plant.
(Day Maximum Water Demand) = (Day Average Water Demand) x (Peak Factor)
Total future water demand and groundwater requirements through private wells are calculated as shown on tables and figures below.

13 - 59
Table 13.2.24 Yogyakarta Municipality, Total Future Water Demand 2005 2006 2007 2008 2009 2010 2011 2012 2013 2014 2015 2016 2017 2018 2019 2020
Total Population person 408,332 408,577 408,835 409,110 409,393 409,690 410,000 410,322 410,650 410,997 411,343 411,697 412,063 412,438 412,818 413,205Served Population person 161,990 178,565 195,165 211,795 228,452 245,140 261,861 278,614 295,398 312,223 329,074 329,358 329,650 329,950 330,254 330,564Service Ratio % 39.7% 43.7% 47.7% 51.8% 55.8% 59.8% 63.9% 67.9% 71.9% 76.0% 80.0% 80.0% 80.0% 80.0% 80.0% 80.0%Domestic Per Capita Water Demand lpcd 165.0 166.0 167.0 168.0 169.0 170.0 171.0 172.0 173.0 174.0 175.0 176.0 177.0 178.0 179.0 180.0Net Water Demand l/sec 344.5 381.4 419.0 457.3 496.3 536.0 576.5 617.8 659.8 702.6 746.3 756.9 768.0 779.5 791.5 803.9 Public Services l/sec 14.3 14.4 14.6 14.7 14.9 15.1 15.2 15.4 15.5 15.7 15.9 16.0 16.2 16.4 16.6 16.7 Domestic l/sec 309.4 343.1 377.2 411.8 446.9 482.3 518.3 554.6 591.5 628.8 666.5 670.9 675.3 679.8 684.2 688.7 Commercial l/sec 17.7 20.7 24.0 27.5 31.3 35.4 39.8 44.5 49.5 54.9 60.6 66.7 73.2 80.0 87.4 95.1 Industrial l/sec 0.2 0.2 0.2 0.2 0.2 0.3 0.3 0.3 0.3 0.3 0.3 0.3 0.3 0.4 0.4 0.4 Public Standpipe l/sec 0.7 0.7 0.7 0.7 0.7 0.7 0.7 0.7 0.7 0.7 0.7 0.7 0.7 0.7 0.7 0.7 Palace l/sec 2.3 2.3 2.3 2.3 2.3 2.3 2.3 2.3 2.3 2.3 2.3 2.3 2.3 2.3 2.3 2.3UFW Ratio % 41.2% 40.1% 39.1% 38.0% 36.9% 35.8% 34.7% 33.6% 32.6% 31.5% 30.4% 29.3% 28.2% 27.2% 26.1% 25%UFW l/sec 142.0 153.1 163.6 173.6 183.1 192.0 200.2 207.9 214.9 221.2 226.9 222.0 216.9 211.7 206.4 201.0Day Average Water Demand l/sec 486.5 534.5 582.6 630.9 679.4 728.0 776.7 825.6 874.7 923.9 973.2 978.9 984.9 991.3 997.9 1,004.9Peak Factor - 1.2 1.2 1.2 1.2 1.2 1.2 1.2 1.2 1.2 1.2 1.2 1.2 1.2 1.2 1.2 1.2Day Maximum Water Demand l/sec 583.8 641.4 699.2 757.1 815.3 873.6 932.1 990.8 1,049.6 1,108.6 1,167.8 1,174.7 1,181.9 1,189.5 1,197.5 1,205.9
Table 13.2.25 Yogyakarta Municipality, Future Groundwater Requirement through Private Wells 2005 2006 2007 2008 2009 2010 2011 2012 2013 2014 2015 2016 2017 2018 2019 2020
Domestic l/sec 261.1 251.5 240.5 228.2 214.5 199.4 182.9 165.0 145.7 125.0 102.8 102.9 103.0 103.1 103.2 103.3GW for Commercial l/sec 31.2 30.5 29.7 28.8 27.6 26.2 24.7 22.9 20.9 18.7 16.2 13.5 10.6 7.3 3.8 0.0Total GW Requirement l/sec 292.2 282.0 270.3 257.0 242.1 225.6 207.6 187.9 166.6 143.7 119.1 116.5 113.6 110.5 107.0 103.3

13 - 60
Yogyakarta Municipality
0100200300400500600700800900
2005
2006
2007
2008
2009
2010
2011
2012
2013
2014
2015
2016
2017
2018
2019
2020
Year
Net
Wat
er D
eman
d (l/
sec)
Domestic Public Services Commercial Industrial Public Standpipe Palace
0%5%
10%15%20%25%30%35%40%45%
2005
2006
2007
2008
2009
2010
2011
2012
2013
2014
2015
2016
2017
2018
2019
2020
Year
Una
ccou
nted
-for
Wat
er R
atio
(%)
Figure 13.2.17 Net Water Demand for PDAM Figure 13.2.18 Future UFW Ratio
0
200
400
600
800
1,000
1,200
1,400
2005
2006
2007
2008
2009
2010
2011
2012
2013
2014
2015
2016
2017
2018
2019
2020
Year
Wat
er D
eman
d (l/
sec)
Net Water Demand NRWDay Average Water Demand Day Maximum Water Demand
0
200
400
600
800
1,000
1,200
1,400
2005
2006
2007
2008
2009
2010
2011
2012
2013
2014
2015
2016
2017
2018
2019
2020
YearW
ater
Dem
and
incl
udin
g Pr
ivat
e W
ell (
l/sec
)
Water Demand of PDAM Groundwater Requirement for PW Figure 13.2.19 Total Future Water Demand Figure 13.2.20 Total Future Water Demand and
Groundwater Requirement for Private Wells

13 - 61
Table 13.2.26 Sleman Regency, Total Future Water Demand 2005 2006 2007 2008 2009 2010 2011 2012 2013 2014 2015 2016 2017 2018 2019 2020
Total Population person 960,803 973,644 986,670 999,892 1,013,316 1,026,937 1,040,770 1,054,835 1,069,111 1,083,617 1,098,354 1,113,338 1,128,576 1,144,055 1,159,802 1,175,815Served Population person 135,227 188,837 244,008 300,774 359,171 419,235 481,008 544,535 609,849 677,000 746,029 765,855 785,958 806,332 826,997 847,954Served Population by PDAM (Urban) person 92,448 128,360 165,657 204,372 244,537 286,185 329,349 374,073 420,389 468,341 517,965 527,994 538,194 548,567 559,119 569,859Served Population by PDAM (Rural) person 26,847 36,323 45,897 55,572 65,351 75,234 85,228 95,334 105,551 115,885 126,337 127,093 127,865 128,646 129,443 130,253Served Population by Community Wa person 15,932 24,155 32,454 40,829 49,283 57,816 66,430 75,128 83,908 92,774 101,727 110,768 119,898 129,119 138,434 147,842Service Ratio % 14.1% 19.4% 24.7% 30.1% 35.4% 40.8% 46.2% 51.6% 57.0% 62.5% 67.9% 68.8% 69.6% 70.5% 71.3% 72.1% Service Ratio by PDAM (Urban) % 9.6% 13.2% 16.8% 20.4% 24.1% 27.9% 31.6% 35.5% 39.3% 43.2% 47.2% 47.4% 47.7% 47.9% 48.2% 48.5% Service Ratio by PDAM (Rural) % 2.8% 3.7% 4.7% 5.6% 6.4% 7.3% 8.2% 9.0% 9.9% 10.7% 11.5% 11.4% 11.3% 11.2% 11.2% 11.1% Service Ratio by Community Wate % 1.7% 2.5% 3.3% 4.1% 4.9% 5.6% 6.4% 7.1% 7.8% 8.6% 9.3% 9.9% 10.6% 11.3% 11.9% 12.6%Domestic Per Capita Water Demand by PDAM (Urban) lpcd 80.0 86.7 93.3 100.0 106.7 113.3 120.0 126.7 133.3 140.0 146.7 153.3 160.0 166.7 173.3 180.0 by PDAM (Rural) lpcd 75.0 78.0 81.0 84.0 87.0 90.0 93.0 96.0 99.0 102.0 105.0 108.0 111.0 114.0 117.0 120.0 by Community Water Supply Syste lpcd 60.0 60.0 60.0 60.0 60.0 60.0 60.0 60.0 60.0 60.0 60.0 60.0 60.0 60.0 60.0 60.0Net Water Demand l/sec 127.8 187.4 255.1 331.0 415.7 509.5 612.7 726.0 849.6 984.1 1,129.8 1,201.8 1,275.9 1,352.1 1,430.6 1,511.4 Public Services l/sec 4.0 4.1 4.1 4.2 4.2 4.3 4.3 4.4 4.5 4.5 4.6 4.6 4.7 4.8 4.8 4.9 Domestic l/sec 120.0 178.3 244.5 318.9 401.9 493.9 595.3 706.5 828.0 960.1 1,103.4 1,172.8 1,244.2 1,317.6 1,393.1 1,470.8 PDAM (Urban) l/sec 85.6 128.8 179.0 236.5 301.9 375.4 457.4 548.4 648.7 758.9 879.3 937.0 996.7 1,058.2 1,121.7 1,187.2 PDAM (Rural) l/sec 23.3 32.8 43.0 54.0 65.8 78.4 91.7 105.9 120.9 136.8 153.5 158.9 164.3 169.7 175.3 180.9 Community l/sec 11.1 16.8 22.5 28.4 34.2 40.2 46.1 52.2 58.3 64.4 70.6 76.9 83.3 89.7 96.1 102.7 Commercial l/sec 1.8 3.0 4.4 5.9 7.5 9.2 11.0 13.0 15.1 17.3 19.7 22.2 24.8 27.6 30.5 33.5 Industrial l/sec 0.2 0.2 0.2 0.2 0.2 0.3 0.3 0.3 0.3 0.3 0.3 0.3 0.3 0.4 0.4 0.4 Public Standpipe l/sec 1.8 1.8 1.8 1.8 1.8 1.8 1.8 1.8 1.8 1.8 1.8 1.8 1.8 1.8 1.8 1.8UFW Ratio % 46.4% 45.0% 43.5% 42.1% 40.7% 39.3% 37.8% 36.4% 35.0% 33.6% 32.1% 30.7% 29.3% 27.9% 26.4% 25%UFW l/sec 59.3 84.3 111.1 139.4 169.2 200.1 231.9 264.4 297.3 330.3 363.1 369.0 373.6 376.6 378.1 377.9Day Average Water Demand l/sec 187.1 271.8 366.1 470.4 584.8 709.5 844.6 990.4 1,146.9 1,314.3 1,492.9 1,570.8 1,649.4 1,728.7 1,808.7 1,889.3Peak Factor - 1.2 1.2 1.2 1.2 1.2 1.2 1.2 1.2 1.2 1.2 1.2 1.2 1.2 1.2 1.2 1.2Day Maximum Water Demand l/sec 224.5 326.1 439.4 564.5 701.8 851.4 1,013.5 1,188.4 1,376.3 1,577.2 1,791.5 1,885.0 1,979.3 2,074.5 2,170.4 2,267.2
Table 13.2.27 Sleman Regency, Future Groundwater Requirement through Private Wells 2005 2006 2007 2008 2009 2010 2011 2012 2013 2014 2015 2016 2017 2018 2019 2020
Domestic l/sec 639.6 629.6 615.6 597.4 574.8 547.5 515.4 478.2 435.8 387.9 334.2 332.3 330.4 328.6 326.7 324.9GW for Commercial l/sec 16.4 16.1 15.7 15.2 14.6 13.8 13.0 12.0 10.9 9.7 8.4 7.0 5.4 3.7 1.9 0.0Total GW Requirement l/sec 656.0 645.7 631.3 612.6 589.3 561.3 528.4 490.3 446.7 397.6 342.6 339.3 335.9 332.3 328.7 324.9

13 - 62
Sleman Regency
0
200
400
600
800
1,000
1,200
1,400
1,600
2005
2006
2007
2008
2009
2010
2011
2012
2013
2014
2015
2016
2017
2018
2019
2020
Year
Net
Wat
er D
eman
d (l/
sec)
Domestic Public Services Commercial Industrial Public Standpipe
0%5%
10%15%20%25%30%35%40%45%50%
2005
2006
2007
2008
2009
2010
2011
2012
2013
2014
2015
2016
2017
2018
2019
2020
Year
Una
ccou
nted
-for
Wat
er R
atio
(%)
Figure 13.2.21 Net Water Demand for PDAM and Community Water Supply System
Figure 13.2.22 Future UFW Ratio
0
500
1,000
1,500
2,000
2,500
2005
2006
2007
2008
2009
2010
2011
2012
2013
2014
2015
2016
2017
2018
2019
2020
Year
Wat
er D
eman
d (l/
sec)
Net Water Demand NRWDay Average Water Demand Day Maximum Water Demand
0
500
1,000
1,500
2,000
2,500
3,000
2005
2006
2007
2008
2009
2010
2011
2012
2013
2014
2015
2016
2017
2018
2019
2020
YearW
ater
Dem
and
incl
udin
g Pr
ivat
e W
ell (
l/sec
)Water Demand of PDAM/Community Groundwater Requirement for PW
Figure 13.2.23 Total Future Water Demand Figure 13.2.24 Total Future Water Demand and Groundwater Requirement for Private Wells

13 - 63
Table 13.2.28 Bantul Regency, Total Future Water Demand
2005 2006 2007 2008 2009 2010 2011 2012 2013 2014 2015 2016 2017 2018 2019 2020Total Population person 825,285 834,594 844,041 853,616 863,334 873,184 883,183 893,332 903,634 914,083 924,691 935,458 946,392 957,498 968,769 980,225Served Population person 62,470 113,529 165,837 219,421 274,308 330,525 388,105 447,079 507,476 569,327 632,667 644,556 656,602 668,810 681,174 693,713Served Population by PDAM (Urban) person 33,051 63,493 94,982 127,542 161,199 195,977 231,901 269,005 307,309 346,845 387,643 394,350 401,166 408,098 415,141 422,310Served Population by PDAM (Rural) person 20,239 37,144 54,222 71,474 88,905 106,516 124,313 142,294 160,469 178,836 197,398 198,569 199,759 200,961 202,180 203,412Served Population by Community Wa person 9,180 12,892 16,634 20,404 24,204 28,033 31,891 35,780 39,699 43,647 47,627 51,637 55,677 59,750 63,854 67,990Service Ratio % 7.6% 13.6% 19.6% 25.7% 31.8% 37.9% 43.9% 50.0% 56.2% 62.3% 68.4% 68.9% 69.4% 69.8% 70.3% 70.8% Service Ratio by PDAM (Urban) % 4.0% 7.6% 11.3% 14.9% 18.7% 22.4% 26.3% 30.1% 34.0% 37.9% 41.9% 42.2% 42.4% 42.6% 42.9% 43.1% Service Ratio by PDAM (Rural) % 2.5% 4.5% 6.4% 8.4% 10.3% 12.2% 14.1% 15.9% 17.8% 19.6% 21.3% 21.2% 21.1% 21.0% 20.9% 20.8% Service Ratio by Community Wate % 1.1% 1.5% 2.0% 2.4% 2.8% 3.2% 3.6% 4.0% 4.4% 4.8% 5.2% 5.5% 5.9% 6.2% 6.6% 6.9%Domestic Per Capita Water Demand by PDAM (Urban) lpcd 100.0 105.3 110.7 116.0 121.3 126.7 132.0 137.3 142.7 148.0 153.3 158.7 164.0 169.3 174.7 180.0 by PDAM (Rural) lpcd 95.0 98.7 102.3 106.0 109.7 113.3 117.0 120.7 124.3 128.0 131.7 135.3 139.0 142.7 146.3 150.0 by Community Water Supply Syste lpcd 60.0 60.0 60.0 60.0 60.0 60.0 60.0 60.0 60.0 60.0 60.0 60.0 60.0 60.0 60.0 60.0Net Water Demand l/sec 72.3 134.7 204.0 280.3 363.9 455.1 554.2 661.4 777.1 901.5 1,035.0 1,085.3 1,136.9 1,189.7 1,243.8 1,299.3 Public Services l/sec 2.7 2.7 2.8 2.8 2.8 2.9 2.9 2.9 3.0 3.0 3.0 3.1 3.1 3.1 3.2 3.2 Domestic l/sec 66.9 128.8 197.4 273.1 356.0 446.5 544.8 651.2 765.9 889.4 1,021.8 1,071.1 1,121.5 1,173.1 1,226.0 1,280.2 PDAM (Urban) l/sec 38.3 77.4 121.7 171.2 226.4 287.3 354.3 427.6 507.4 594.1 687.9 724.2 761.5 799.8 839.3 879.8 PDAM (Rural) l/sec 22.3 42.4 64.2 87.7 112.8 139.7 168.3 198.7 230.9 264.9 300.8 311.0 321.4 331.8 342.4 353.1 Community l/sec 6.4 9.0 11.6 14.2 16.8 19.5 22.1 24.8 27.6 30.3 33.1 35.9 38.7 41.5 44.3 47.2 Commercial l/sec 0.5 1.0 1.6 2.2 2.8 3.6 4.3 5.1 6.0 6.9 7.9 8.9 10.0 11.2 12.4 13.6 Industrial l/sec 0.1 0.1 0.1 0.1 0.1 0.1 0.1 0.1 0.1 0.2 0.2 0.2 0.2 0.2 0.2 0.2 Public Standpipe l/sec 2.1 2.1 2.1 2.1 2.1 2.1 2.1 2.1 2.1 2.1 2.1 2.1 2.1 2.1 2.1 2.1UFW Ratio % 41.5% 40.4% 39.3% 38.2% 37.1% 36.0% 34.9% 33.8% 32.7% 31.6% 30.5% 29.4% 28.3% 27.2% 26.1% 25%UFW l/sec 30.0 54.4 80.2 107.1 135.0 163.9 193.4 223.6 254.1 284.9 315.7 319.1 321.7 323.6 324.6 324.8Day Average Water Demand l/sec 102.3 189.1 284.1 387.3 498.9 619.0 747.6 885.0 1,031.2 1,186.4 1,350.7 1,404.4 1,458.6 1,513.3 1,568.5 1,624.1Peak Factor - 1.2 1.2 1.2 1.2 1.2 1.2 1.2 1.2 1.2 1.2 1.2 1.2 1.2 1.2 1.2 1.2Day Maximum Water Demand l/sec 122.7 227.0 340.9 464.8 598.7 742.8 897.2 1,062.0 1,237.5 1,423.7 1,620.8 1,685.3 1,750.4 1,816.0 1,882.2 1,948.9
Table 13.2.29 Bantul Regency, Future Groundwater Requirement through Private Wells 2005 2006 2007 2008 2009 2010 2011 2012 2013 2014 2015 2016 2017 2018 2019 2020
Domestic l/sec 559.3 552.5 541.4 526.1 506.3 481.9 452.6 418.4 379.1 334.3 284.0 284.4 284.7 285.1 285.5 285.9GW for Commercial l/sec 6.9 6.8 6.6 6.4 6.2 5.9 5.5 5.1 4.6 4.1 3.6 2.9 2.3 1.6 0.8 0.0Total GW Requirement l/sec 566.3 559.3 548.1 532.5 512.5 487.7 458.1 423.5 383.7 338.4 287.6 287.3 287.0 286.6 286.3 285.9

13 - 64
Bantul Regency
0
200
400
600
800
1,000
1,200
1,400
2005
2006
2007
2008
2009
2010
2011
2012
2013
2014
2015
2016
2017
2018
2019
2020
Year
Net
Wat
er D
eman
d (l/
sec)
Domestic Public Services Commercial Industrial Public Standpipe
0%5%
10%15%20%25%30%35%40%45%
2005
2006
2007
2008
2009
2010
2011
2012
2013
2014
2015
2016
2017
2018
2019
2020
Year
Una
ccou
nted
-for
Wat
er R
atio
(%)
Figure 13.2.25 Net Water Demand for PDAM and Community Water Supply System
Figure 13.2.26 Future UFW Ratio
0
500
1,000
1,500
2,000
2,500
2005
2006
2007
2008
2009
2010
2011
2012
2013
2014
2015
2016
2017
2018
2019
2020
Year
Wat
er D
eman
d (l/
sec)
Net Water Demand NRWDay Average Water Demand Day Maximum Water Demand
0
500
1,000
1,500
2,000
2,500
2005
2006
2007
2008
2009
2010
2011
2012
2013
2014
2015
2016
2017
2018
2019
2020
Year
Wat
er D
eman
d in
clud
ing
Priv
ate
Wel
l (l/s
ec)
Water Demand of PDAM Groundwater Requirement for PW Figure 13.2.27 Total Future Water Demand Figure 13.2.28 Total Future Water Demand and Groundwater
Requirement for Private Wells

13 - 65
Table 13.2.30 Summary of Future Water Demand (l/sec) 2005 2006 2007 2008 2009 2010 2011 2012 2013 2014 2015 2016 2017 2018 2019 2020
Day Max WaterDemand,Yogyakarta
584 641 699 757 815 874 932 991 1,050 1,109 1,168 1,175 1,182 1,190 1,197 1,206
Day Max WaterDemand, Sleman 225 326 439 565 702 851 1,014 1,188 1,376 1,577 1,791 1,885 1,979 2,074 2,170 2,267
Day Max WaterDemand, Bantul 123 227 341 465 599 743 897 1,062 1,237 1,424 1,621 1,685 1,750 1,816 1,882 1,949
Groundwater forPrivate Well,Yogyakarta
292 282 270 257 242 226 208 188 167 144 119 116 114 110 107 103
Groundwater forPrivate Well,Sleman
656 646 631 613 589 561 528 490 447 398 343 339 336 332 329 325
Groundwater forPrivate Well, Bantul 566 559 548 533 512 488 458 424 384 338 288 287 287 287 286 286
Total 2,446 2,681 2,929 3,189 3,460 3,742 4,037 4,343 4,660 4,989 5,329 5,488 5,648 5,809 5,972 6,136 Note: “Day Max Water Demand” includes day max water demand of PDAM system and community water supply system. “Groundwater for Private Well” includes groundwater demand through private wells by PDAM customers, by commercial, and by unserved population.
0
1,000
2,000
3,000
4,000
5,000
6,000
7,000
2005
2006
2007
2008
2009
2010
2011
2012
2013
2014
2015
2016
2017
2018
2019
2020
Year
Tot
al W
ater
Dem
and
(l/se
c)
Day Max Water Demand Yogyakarta Day Max Water Demand SlemanDay Max Water Demand Bantul Groundwater for Private Wll YogyakartaGroundwater for Private Wll Sleman Groundwater for Private Wll Bantul
Note: “Day Max Water Demand” includes day max water demand of PDAM system and community water supply system. “Groundwater for Private Well” includes groundwater demand through private wells by PDAM customers, by commercial, and by unserved population.
Figure 13.2.29 Summary of Future Water Demand (l/sec)

13 - 66
13.2.7 Case Study on Future Water Demand Projection
(1) Cases of Future Water Demand Projection Basic data, methodologies, and results of future water demand projection are described in previous sections. According to the results of water demand projection, water demand which will be supplied by PDAM is 932 l/sec in 2005 (daily maximum basis, total of Yogyakarta, Sleman, and Bantul) and the demand will increase to 5,422 l/sec in 2020. This result means that the total capacity of three PDAMs should be expanded as 5.8 times from current capacity during next fifteen years.
Feasibility, adequacy, or practicability of this drastic expansion of water supply system within rather short period, 15 years, should be examined by forthcoming study from various aspects such as technical, financial, and capability of respective PDAMs. Although it will be examined in future, considering significant magnitude or rate of expansion, several cases of future water demand which represents lower future water demand are studied. In the case study, four cases are considered and compared as follows.
Case 1: Future water demand projection which is discussed in previous sections. Future domestic per capita water demand is gradually increased from current level. Concerning service ratio, national target ratio is adopted. Case 2: Modified from Case 1 projection. Future domestic per capita water demand is set 125 lpcd for urban area and 80 lpcd for rural area. Service ratio in rural area is decreased from Case 1 to 40 %.
Case 3: Modified from Case 2 projection. Service ratio in urban area is decreased from Case 2 to 55 % and target year is postponed to 2020 except Yogyakarta Municipality.
Case 4: Modified from Case 3 projection. Service ratio is further decreased for all area. Service ratio is 50 % in urban area and 35 % in rural area.
These conditions/parameters of future water demand projection for each case are summarized in Table 13.2.31.

13 - 67
Table 13.2.31 Conditions and Parameters of Case Study (Cases 1 to 4) Conditions/ Parameters
Case 1 Case 2 Case 3 Case 4
Domestic Per Capita Water Demand (lpcd)
Domestic Per Capita Water Consumption (lpcd) in the target year 2020. The per capita water demand will be increased gradually from current level to the target level in year 2020. Yogyakarta PDAM: 180 lpcd Sleman PDAM, Urban Area: 180 lpcd Sleman PDAM, Rural Area: 120 lpcd Bantul PDAM, Urban Area: 180 lpcd Bantul PDAM, Rural Area: 150 lpcd Community Water Supply: 60 lpcd
020406080
100120140160180200
2005
2006
2007
2008
2009
2010
2011
2012
2013
2014
2015
2016
2017
2018
2019
2020
Year
Dom
estic
Per
Cap
ita W
ater
Dem
and
(lpcd
)
PDAM Yogyakarta PDAM Sleman, Urban PDAM Sleman, RuralPDAM Bantul, Urban PDAM Bantul, Rural Community Water Supply
Domestic Per Capita Water Consumption (lpcd) in the target year 2020. The per capita water demand will be increased or decreased gradually from current level to the target level in year 2020. Yogyakarta PDAM: 125 lpcd Sleman PDAM, Urban Area: 125 lpcd Sleman PDAM, Rural Area: 80 lpcd Bantul PDAM, Urban Area: 125 lpcd Bantul PDAM, Rural Area: 80 lpcd Community Water Supply: 80 lpcd
020406080
100120140160180
2005
2006
2007
2008
2009
2010
2011
2012
2013
2014
2015
2016
2017
2018
2019
2020
Year
Dom
estic
Per
Cap
ita W
ater
Dem
and
(lpcd
)
PDAM Yogyakarta PDAM Sleman, Urban PDAM Sleman, RuralPDAM Bantul, Urban PDAM Bantul, Rural Community Water Supply
Same as “Case 2” Same as “Case 2”
Target Service Ratio (%)
Service ratio will be increased gradually from current service ratio to target level in year mentioned below. PDAM Yogyakarta:
Current Service Ratio -> 80% in Year 2015 PDAM Sleman, Urban area:
Current Service Ratio -> 80% in Year 2015 PDAM Sleman, Rural area:
Current Service Ratio -> 60% in Year 2015 PDAM Bantul, Urban area:
Current Service Ratio -> 80% in Year 2015 PDAM Bantul, Rural area
Current Service Ratio -> 60% in Year 2015 Community Water Supply System:
Current Service Ratio -> 60% in Year 2020
Service ratio will be increased gradually from current service ratio to target level in year mentioned below. PDAM Yogyakarta:
Current Service Ratio -> 80% in Year 2015 PDAM Sleman, Urban area:
Current Service Ratio -> 80% in Year 2015 PDAM Sleman, Rural area:
Current Service Ratio -> 40% in Year 2015 PDAM Bantul, Urban area:
Current Service Ratio -> 80% in Year 2015 PDAM Bantul, Rural area
Current Service Ratio -> 40% in Year 2015 Community Water Supply System:
Current Service Ratio -> 40% in Year 2020
Service ratio will be increased gradually from current service ratio to target level in year mentioned below. PDAM Yogyakarta:
Current Service Ratio -> 80% in Year 2015 PDAM Sleman, Urban area:
Current Service Ratio -> 55% in Year 2020 PDAM Sleman, Rural area:
Current Service Ratio -> 40% in Year 2020 PDAM Bantul, Urban area:
Current Service Ratio -> 55% in Year 2020 PDAM Bantul, Rural area
Current Service Ratio -> 40% in Year 2020 Community Water Supply System:
Current Service Ratio -> 40% in Year 2020
Service ratio will be increased gradually from current service ratio to target level in year mentioned below. PDAM Yogyakarta:
Current Service Ratio -> 50% in Year 2020 PDAM Sleman, Urban area:
Current Service Ratio -> 50% in Year 2020 PDAM Sleman, Rural area:
Current Service Ratio -> 35% in Year 2020 PDAM Bantul, Urban area:
Current Service Ratio -> 50% in Year 2020 PDAM Bantul, Rural area
Current Service Ratio -> 35% in Year 2020 Community Water Supply System:
Current Service Ratio -> 35% in Year 2020
Peak Factor (Day Max Water Demand/Day Average Water Demand)
1.2 1.1 Same as “Case 2” Same as “Case 2”

13 - 68
(2) Results of Case Study and Comparison of Cases Based on conditions/parameters of case study, future water demand is calculated for each case. Tables 13.2.32 to 34 show the results of case study and comparison of respective cases of Yogyakarta Municipality and Sleman and Bantul Regencies. Table 13.2.35 shows future total water demand of each case.
(3) Shortage of PDAM Water Supply Capacities against Future Water Demand Figure 13.2.30 shows difference (gap) between existing capacity of three PDAMs and future water demand which will be supplied by these PDAMs of each case.
In other words, the figure shows required PDAM capacity expansion to meet future water demand by 2020. Required total capacity expansion of PDAM for each case is as shown below.
Cases Required PDAM capacity expansion to meet future water demand by 2020
Case 1 4,330 l/sec Case 2 2,300 l/sec Case 3 1,690 l/sec Case 4 1,280 l/sec
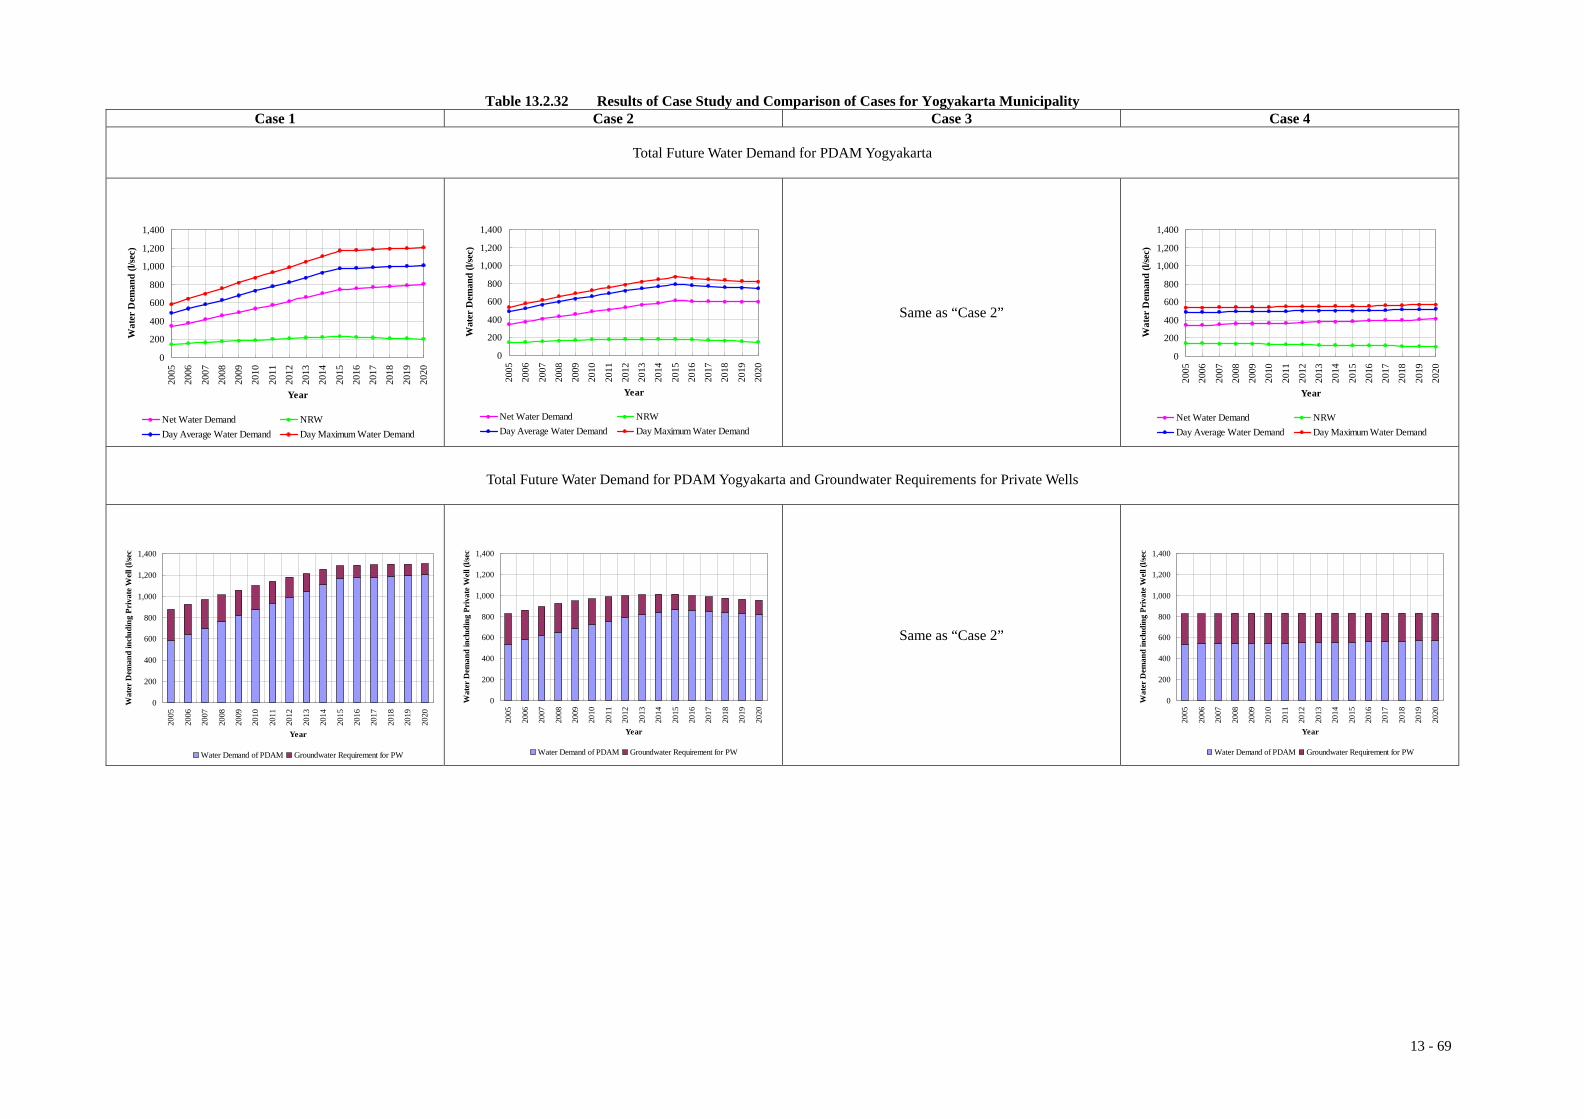
13 - 69
Table 13.2.32 Results of Case Study and Comparison of Cases for Yogyakarta Municipality
Case 1 Case 2 Case 3 Case 4
Total Future Water Demand for PDAM Yogyakarta
0
200
400
600
800
1,000
1,200
1,400
2005
2006
2007
2008
2009
2010
2011
2012
2013
2014
2015
2016
2017
2018
2019
2020
Year
Wat
er D
eman
d (l/
sec)
Net Water Demand NRWDay Average Water Demand Day Maximum Water Demand
0
200
400
600
800
1,000
1,200
1,400
2005
2006
2007
2008
2009
2010
2011
2012
2013
2014
2015
2016
2017
2018
2019
2020
Year
Wat
er D
eman
d (l/
sec)
Net Water Demand NRWDay Average Water Demand Day Maximum Water Demand
Same as “Case 2”
0
200
400
600
800
1,000
1,200
1,400
2005
2006
2007
2008
2009
2010
2011
2012
2013
2014
2015
2016
2017
2018
2019
2020
Year
Wat
er D
eman
d (l/
sec)
Net Water Demand NRWDay Average Water Demand Day Maximum Water Demand
Total Future Water Demand for PDAM Yogyakarta and Groundwater Requirements for Private Wells
0
200
400
600
800
1,000
1,200
1,400
2005
2006
2007
2008
2009
2010
2011
2012
2013
2014
2015
2016
2017
2018
2019
2020
Year
Wat
er D
eman
d in
clud
ing
Priv
ate
Wel
l (l/s
ec)
Water Demand of PDAM Groundwater Requirement for PW
0
200
400
600
800
1,000
1,200
1,400
2005
2006
2007
2008
2009
2010
2011
2012
2013
2014
2015
2016
2017
2018
2019
2020
Year
Wat
er D
eman
d in
clud
ing
Priv
ate
Wel
l (l/s
ec)
Water Demand of PDAM Groundwater Requirement for PW
Same as “Case 2”
0
200
400
600
800
1,000
1,200
1,400
2005
2006
2007
2008
2009
2010
2011
2012
2013
2014
2015
2016
2017
2018
2019
2020
Year
Wat
er D
eman
d in
clud
ing
Priv
ate
Wel
l (l/s
ec)
Water Demand of PDAM Groundwater Requirement for PW

13 - 70
Table 13.2.33 Results of Case Study and Comparison of Cases for Sleman Regency
Case 1 Case 2 Case 3 Case 4
Total Future Water Demand for PDAM Sleman (Urban + Rural) and Community Water Supply System
0
500
1,000
1,500
2,000
2,500
2005
2006
2007
2008
2009
2010
2011
2012
2013
2014
2015
2016
2017
2018
2019
2020
Year
Wat
er D
eman
d (l/
sec)
Net Water Demand NRWDay Average Water Demand Day Maximum Water Demand
0
500
1,000
1,500
2,000
2,500
2005
2006
2007
2008
2009
2010
2011
2012
2013
2014
2015
2016
2017
2018
2019
2020
Year
Wat
er D
eman
d (l/
sec)
Net Water Demand NRWDay Average Water Demand Day Maximum Water Demand
0
500
1,000
1,500
2,000
2,500
2005
2006
2007
2008
2009
2010
2011
2012
2013
2014
2015
2016
2017
2018
2019
2020
Year
Wat
er D
eman
d (l/
sec)
Net Water Demand NRWDay Average Water Demand Day Maximum Water Demand
0
500
1,000
1,500
2,000
2,500
2005
2006
2007
2008
2009
2010
2011
2012
2013
2014
2015
2016
2017
2018
2019
2020
Year
Wat
er D
eman
d (l/
sec)
Net Water Demand NRWDay Average Water Demand Day Maximum Water Demand
Total Future Water Demand for PDAM Sleman (Urban + Rural) and Community Water Supply System
and Groundwater Requirements for Private Wells
0
500
1,000
1,500
2,000
2,500
3,000
2005
2006
2007
2008
2009
2010
2011
2012
2013
2014
2015
2016
2017
2018
2019
2020
Year
Wat
er D
eman
d in
clud
ing
Priv
ate
Wel
l (l/s
ec)
Water Demand of PDAM/Community Groundwater Requirement for PW
0
500
1,000
1,500
2,000
2,500
3,000
2005
2006
2007
2008
2009
2010
2011
2012
2013
2014
2015
2016
2017
2018
2019
2020
Year
Wat
er D
eman
d in
clud
ing
Priv
ate
Wel
l (l/s
ec)
Water Demand of PDAM/Community Groundwater Requirement for PW
0
500
1,000
1,500
2,000
2,500
3,000
2005
2006
2007
2008
2009
2010
2011
2012
2013
2014
2015
2016
2017
2018
2019
2020
Year
Wat
er D
eman
d in
clud
ing
Priv
ate
Wel
l (l/s
ec)
Water Demand of PDAM/Community Groundwater Requirement for PW
0
500
1,000
1,500
2,000
2,500
3,000
2005
2006
2007
2008
2009
2010
2011
2012
2013
2014
2015
2016
2017
2018
2019
2020
Year
Wat
er D
eman
d in
clud
ing
Priv
ate
Wel
l (l/s
ec)
Water Demand of PDAM/Community Groundwater Requirement for PW

13 - 71
Table 13.2.34 Results of Case Study and Comparison of Cases for Bantul Regency
Case 1 Case 2 Case 3 Case 4
Total Future Water Demand for PDAM Bantul (Urban + Rural) and Community Water Supply System
0
500
1,000
1,500
2,000
2,500
2005
2006
2007
2008
2009
2010
2011
2012
2013
2014
2015
2016
2017
2018
2019
2020
Year
Wat
er D
eman
d (l/
sec)
Net Water Demand NRWDay Average Water Demand Day Maximum Water Demand
0
500
1,000
1,500
2,000
2,500
2005
2006
2007
2008
2009
2010
2011
2012
2013
2014
2015
2016
2017
2018
2019
2020
Year
Wat
er D
eman
d (l/
sec)
Net Water Demand NRWDay Average Water Demand Day Maximum Water Demand
0
500
1,000
1,500
2,000
2,500
2005
2006
2007
2008
2009
2010
2011
2012
2013
2014
2015
2016
2017
2018
2019
2020
Year
Wat
er D
eman
d (l/
sec)
Net Water Demand NRWDay Average Water Demand Day Maximum Water Demand
0
500
1,000
1,500
2,000
2,500
2005
2006
2007
2008
2009
2010
2011
2012
2013
2014
2015
2016
2017
2018
2019
2020
Year
Wat
er D
eman
d (l/
sec)
Net Water Demand NRWDay Average Water Demand Day Maximum Water Demand
Total Future Water Demand for PDAM Bantul (Urban + Rural) and Community Water Supply System
and Groundwater Requirements for Private Wells
0
500
1,000
1,500
2,000
2,500
2005
2006
2007
2008
2009
2010
2011
2012
2013
2014
2015
2016
2017
2018
2019
2020
Year
Wat
er D
eman
d in
clud
ing
Priv
ate
Wel
l (l/s
ec)
Water Demand of PDAM Groundwater Requirement for PW
0
500
1,000
1,500
2,000
2,500
2005
2006
2007
2008
2009
2010
2011
2012
2013
2014
2015
2016
2017
2018
2019
2020
Year
Wat
er D
eman
d in
clud
ing
Priv
ate
Wel
l (l/s
ec)
Water Demand of PDAM Groundwater Requirement for PW
0
500
1,000
1,500
2,000
2,500
2005
2006
2007
2008
2009
2010
2011
2012
2013
2014
2015
2016
2017
2018
2019
2020
Year
Wat
er D
eman
d in
clud
ing
Priv
ate
Wel
l (l/s
ec)
Water Demand of PDAM Groundwater Requirement for PW
0
500
1,000
1,500
2,000
2,500
2005
2006
2007
2008
2009
2010
2011
2012
2013
2014
2015
2016
2017
2018
2019
2020
Year
Wat
er D
eman
d in
clud
ing
Priv
ate
Wel
l (l/s
ec)
Water Demand of PDAM Groundwater Requirement for PW

13 - 72
Table 13.2.35 Summary of Future Total Water Demand of Each Case
Case 1 Case 2
0
1,000
2,000
3,000
4,000
5,000
6,000
7,000
2005
2006
2007
2008
2009
2010
2011
2012
2013
2014
2015
2016
2017
2018
2019
2020
Year
Tot
al W
ater
Dem
and
(l/se
c)
Day Max Water Demand, Yogyakarta Day Max Water Demand, SlemanDay Max Water Demand, Bantul Groundwater for Private Well, YogyakartaGroundwater for Private Well, Sleman Groundwater for Private Well, Bantul
0
1,000
2,000
3,000
4,000
5,000
6,000
7,000
2005
2006
2007
2008
2009
2010
2011
2012
2013
2014
2015
2016
2017
2018
2019
2020
Year
Tot
al W
ater
Dem
and
(l/se
c)
Day Max Water Demand Yogyakarta Day Max Water Demand SlemanDay Max Water Demand Bantul Groundwater for Private Well YogyakartaGroundwater for Private Well Sleman Groundwater for Private Well Bantul
Case 3 Case 4
0
1,000
2,000
3,000
4,000
5,000
6,000
7,000
2005
2006
2007
2008
2009
2010
2011
2012
2013
2014
2015
2016
2017
2018
2019
2020
Year
Tot
al W
ater
Dem
and
(l/se
c)
Day Max Water Demand Yogyakarta Day Max Water Demand SlemanDay Max Water Demand Bantul Groundwater for Private Well YogyakartaGroundwater for Private Well Sleman Groundwater for Private Well Bantul

13 - 73
Case 1 Case 2
0
1,000
2,000
3,000
4,000
5,000
6,000
2005
2006
2007
2008
2009
2010
2011
2012
2013
2014
2015
2016
2017
2018
2019
2020
Year
Wat
er D
eman
d (lp
cd)
Yogyakarta Sleman Bantul Total
Yogyakarta PDAM: 560 l/secSleman PDAM: 180 l/secBantul PDAM: 110 l/sec
Gap
: 4,3
30 l/
sec
Total Existing Capacity: 850 l/sec
0
1,000
2,000
3,000
4,000
5,000
6,000
2005
2006
2007
2008
2009
2010
2011
2012
2013
2014
2015
2016
2017
2018
2019
2020
Year
Wat
er D
eman
d (lp
cd)
Yogyakarta Sleman Bantul Total
Case 3 Case 4
0
1,000
2,000
3,000
4,000
5,000
6,000
2005
2006
2007
2008
2009
2010
2011
2012
2013
2014
2015
2016
2017
2018
2019
2020
Year
Wat
er D
eman
d (lp
cd)
Yogyakarta Sleman Bantul Total
Gap
1,69
0 l/s
ec
0
1,000
2,000
3,000
4,000
5,000
6,000
2005
2006
2007
2008
2009
2010
2011
2012
2013
2014
2015
2016
2017
2018
2019
2020
Year
Wat
er D
eman
d (lp
cd)
Yogyakarta Sleman Bantul Total
Yogyakarta PDAM: 560 l/secSleman PDAM: 180 l/secBantul PDAM: 110 l/sec
Gap
Total Existing Capacity: 850 l/sec
1,28
0 l/s
ec
Figure 13.2.30 Shortage of PDAM Water Supply Capacity against Future Water
Demand
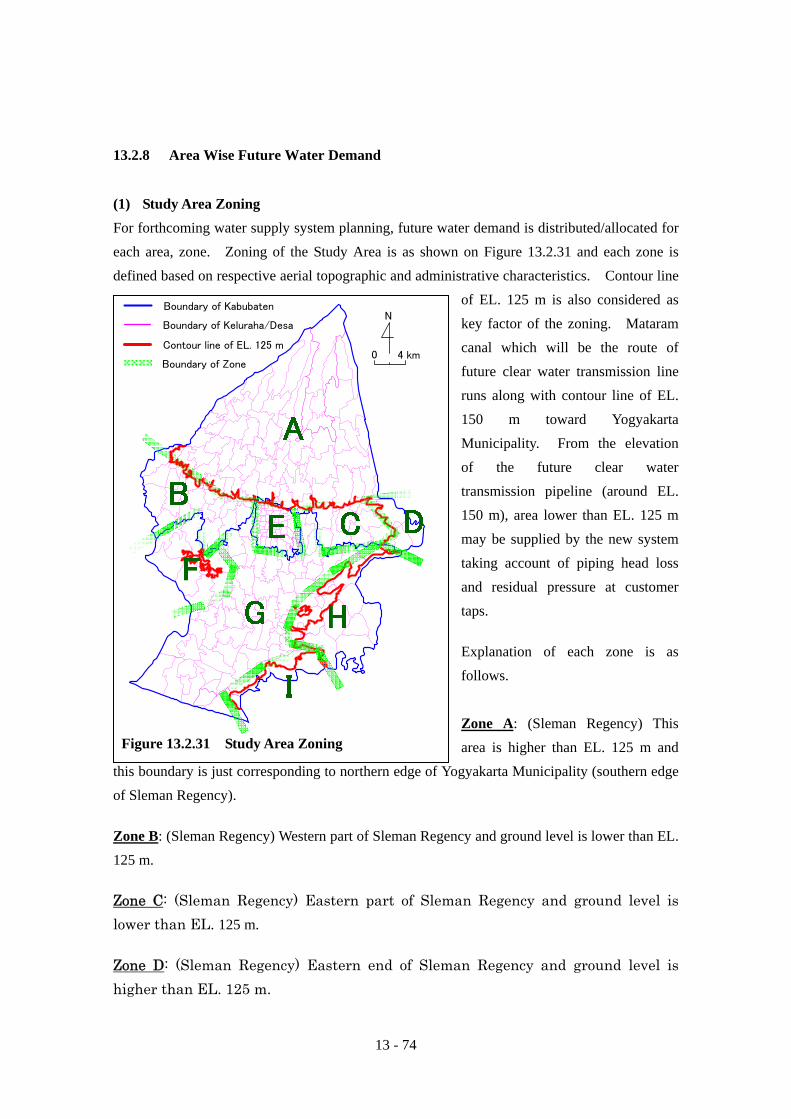
13 - 74
0 4 km
NBoundary of Kabubaten
Boundary of Keluraha/Desa
Contour line of EL. 125 m
Boundary of Zone
Figure 13.2.31 Study Area Zoning
13.2.8 Area Wise Future Water Demand
(1) Study Area Zoning For forthcoming water supply system planning, future water demand is distributed/allocated for each area, zone. Zoning of the Study Area is as shown on Figure 13.2.31 and each zone is defined based on respective aerial topographic and administrative characteristics. Contour line
of EL. 125 m is also considered as key factor of the zoning. Mataram canal which will be the route of future clear water transmission line runs along with contour line of EL. 150 m toward Yogyakarta Municipality. From the elevation of the future clear water transmission pipeline (around EL. 150 m), area lower than EL. 125 m may be supplied by the new system taking account of piping head loss and residual pressure at customer taps.
Explanation of each zone is as follows. Zone A: (Sleman Regency) This area is higher than EL. 125 m and
this boundary is just corresponding to northern edge of Yogyakarta Municipality (southern edge of Sleman Regency).
Zone B: (Sleman Regency) Western part of Sleman Regency and ground level is lower than EL. 125 m.
Zone C: (Sleman Regency) Eastern part of Sleman Regency and ground level is lower than EL. 125 m.
Zone D: (Sleman Regency) Eastern end of Sleman Regency and ground level is higher than EL. 125 m.

13 - 75
Zone E: (Yogyakarta Municipality) Whole area of Yogyakarta Municipality is included in this zone. The ground level is lower than EL. 125 m.
Zone F: (Bantul Regency) Western part of Bantul Regency and ground level is higher than central part of Bantul Regency and hilly area, some part is higher than EL. 125 m.
Zone G: (Bantul Regency) Central part of Bantul Regency. The ground level is lower than EL. 125 m and gently slope down to the sea.
Zone H: (Bantul Regency) Mountainous area of western Bantul Regency and located north of Oyo river. Zone I: (Bantul Regency) Mountainous area of western Bantul Regency and located south of Oyo river.
(2) Zonal Future Water Demand
Kelurahan and Desa in respective zone are identified and future water demand of Case 4 which is discussed in previous section is allocated to each zone based on Kulurahan/Desa future water demand.
Zonal future water demand is shown on Figures 13.2.32 to 13.2.33.

13 - 76
Figure 13.2.32 Zonal Future Water Demand (Case 4)
0
500
1,000
1,500
2,000
2,500
3,000
3,500
4,00020
05
2006
2007
2008
2009
2010
2011
2012
2013
2014
2015
2016
2017
2018
2019
2020
Year
Day
Max
. Wat
er D
eman
d (l/
sec)
Zone A Zone B Zone C Zone D Zone E Zone F Zone G Zone H Zone I
0
500
1,000
1,500
2,000
2,500
3,000
3,500
4,000
2005
2006
2007
2008
2009
2010
2011
2012
2013
2014
2015
2016
2017
2018
2019
2020
Year
Gro
undw
ater
Req
uire
men
t (l/
sec)
Zone A Zone B Zone C Zone D Zone E Zone F Zone G Zone H Zone I
Zonal Future Day Max. Water Demand (for PDAM and Community Water Supply System)
Zonal Future Groundwater Requirement (for private wells)
0
500
1,000
1,500
2,000
2,500
3,000
3,500
4,000
2005
2006
2007
2008
2009
2010
2011
2012
2013
2014
2015
2016
2017
2018
2019
2020
Year
Day
Max
. Wat
er D
eman
d +
Gro
undw
ater
Req
uire
men
t (l/s
ec)
Zone A Zone B Zone C Zone D Zone E Zone F Zone G Zone H Zone I
Zonal Future Day Max. Water Demand and Groundwater Requirement

13 - 77
Figure 13.2.33 Zonal Future Water Demand
Zone A
0
200
400
600
800
1,000
1,200
1,400
2005
2006
2007
2008
2009
2010
2011
2012
2013
2014
2015
2016
2017
2018
2019
2020
Year
Wat
er R
equi
rem
ent
(l/se
c)
PDAM+Community GroundwaterZone B
0
200
400
600
800
1,000
1,200
1,400
2005
2006
2007
2008
2009
2010
2011
2012
2013
2014
2015
2016
2017
2018
2019
2020
Year
Wat
er R
equi
rem
ent
(l/se
c)PDAM+Community Groundwater
Zone C
0
200
400
600
800
1,000
1,200
1,400
2005
2006
2007
2008
2009
2010
2011
2012
2013
2014
2015
2016
2017
2018
2019
2020
Year
Wat
er R
equi
rem
ent
(l/se
c)
PDAM+Community Groundwater
Zone D
0
200
400
600
800
1,000
1,200
1,400
2005
2006
2007
2008
2009
2010
2011
2012
2013
2014
2015
2016
2017
2018
2019
2020
Year
Wat
er R
equi
rem
ent
(l/se
c)
PDAM+Community Groundwater
Zone E
0
200
400
600
800
1,000
1,200
1,400
2005
2006
2007
2008
2009
2010
2011
2012
2013
2014
2015
2016
2017
2018
2019
2020
Year
Wat
er R
equi
rem
ent
(l/se
c)
PDAM+Community Groundwater
Zone F
0
200
400
600
800
1,000
1,200
1,400
2005
2006
2007
2008
2009
2010
2011
2012
2013
2014
2015
2016
2017
2018
2019
2020
Year
Wat
er R
equi
rem
ent
(l/se
c)
PDAM+Community Groundwater
Zone G
0
200
400
600
800
1,000
1,200
1,400
2005
2006
2007
2008
2009
2010
2011
2012
2013
2014
2015
2016
2017
2018
2019
2020
Year
Wat
er R
equi
rem
ent
(l/se
c)
PDAM+Community Groundwater
Zone H
0
200
400
600
800
1,000
1,200
1,400
2005
2006
2007
2008
2009
2010
2011
2012
2013
2014
2015
2016
2017
2018
2019
2020
Year
Wat
er R
equi
rem
ent
(l/se
c)
PDAM+Community Groundwater
Zone I
0
200
400
600
800
1,000
1,200
1,400
2005
2006
2007
2008
2009
2010
2011
2012
2013
2014
2015
2016
2017
2018
2019
2020
Year
Wat
er R
equi
rem
ent
(l/se
c)
PDAM+Community Groundwater