chapter 155 error-bar charts - ncss-wpengine.netdna … · an error-bar chart is constructed from a...
TRANSCRIPT

NCSS Statistical Software NCSS.com
155-1 © NCSS, LLC. All Rights Reserved.
Chapter 155
Error-Bar Charts Introduction Error-Bar Charts graphically display tables of means (or medians) and variability. Following are examples of the types of charts produced by this procedure. The error bars may represent the standard deviation (SD) of the data, the standard error of the mean (SE), a confidence interval, the data range, or percentiles.
NCSS Statistical Software NCSS.com Error-Bar Charts
155-2 © NCSS, LLC. All Rights Reserved.
Data Structure An error-bar chart is constructed from a numeric variable. A second variable may be used to divide the first variable into groups (e.g., age group or gender). In the two-factor procedure, a third variable may be used to divide the groups into subgroups.
Procedure Options This section describes the options available in this procedure.
Variables Tab This panel specifies which columns are used to create the error-bar chart.
Variables – Simple Error-Bar Charts
Data Variable(s) This option lets you designate which variables are plotted. If more than one Data Variable is designated and no Horizontal (Group) Variable is selected, a set of error-bar charts will be displayed on a single chart, one error-bar plot for each variable. If more than one variable is designated and a Horizontal (Group) Variable is selected, a separate error-bar chart will be drawn for each variable.
Horizontal (Group) Variable Designates an optional variable used to separate the observations into groups. The groups defined by this variable will all appear on the same plot.
Frequency Variable Specify an optional frequency (count) variable. This variable contains integers that represent the number of observations (frequency) associated with each observation. If left blank, each observation has a frequency of one.
Break Variables Select optional break (categorical) variables. A separate plot will be generated for each unique value of this variable. If you specify more than one break variable, a separate plot will be generated for each unique combination of the values of the variables specified.
Variables – Two-Factor Error-Bar Charts
Data Variable(s) This option lets you designate which variables are plotted. If more than one Data Variable is designated and no Legend (Subgroup) Variable is selected, the variables will become the legend (subgroup) levels. If more than one variable is designated and a Legend (Subgroup) Variable is selected, a separate plot will be drawn for each variable.
Horizontal (Group) Variable Designates an optional variable used to separate the observations into groups. An individual error-bar will be displayed for each unique combination of this variable with the Legend (Subgroup) Variable.
Legend (Subgroup) Variable Designates an optional variable used to separate the observations into subgroups. An individual error-bar will be displayed for each combination of this variable with the Horizontal (Group) Variable. The levels of this variable will be shown in the legend.
NCSS Statistical Software NCSS.com Error-Bar Charts
155-3 © NCSS, LLC. All Rights Reserved.
Frequency Variable Specify an optional frequency (count) variable. This variable contains integers that represent the number of observations (frequency) associated with each observation. If left blank, each observation has a frequency of one.
Break Variables Select optional break (categorical) variables. A separate plot will be generated for each unique value of this variable. If you specify more than one break variable, a separate plot will be generated for each unique combination of the values of the variables specified.
Format Options
Variable Names This option specifies whether the column names or column labels are used on the chart.
Value Labels This option specifies whether the actual values or the value labels are used to label the group level labels of the plot.
Error-Bar Chart Format
Format Click the format button to change the plot settings (see Error-Bar Chart Window Options below).
Edit During Run Checking this option will cause the plot format window to appear when the procedure is run. This allows you to modify the format of the graph with the actual data.

NCSS Statistical Software NCSS.com Error-Bar Charts
155-4 © NCSS, LLC. All Rights Reserved.
Error-Bar Chart Window Options This section describes the specific options available on the Error-Bar Chart window, which is displayed when the Error-Bar Chart button is clicked. Common options, such as axes, labels, legends, and titles are documented in the Graphics Components chapter.
Error-Bar Chart Tab
Estimation of Center Section You can choose whether to plot means or medians.
Bars and Symbols Section You can modify the color of bars, border, and/or symbols using the options in this section.
One Factor

NCSS Statistical Software NCSS.com Error-Bar Charts
155-5 © NCSS, LLC. All Rights Reserved.
Two Factors
Variation (Error Bars) Section You modify the variation line that extends from the mean using the options in this section.

NCSS Statistical Software NCSS.com Error-Bar Charts
155-6 © NCSS, LLC. All Rights Reserved.
Layout Tab
Orientation Section You can orient the bars horizontally or vertically.
Object Spacing and Size Section You can change the size of the gap between individual bars.
Connecting Lines Tab
Connect Between Groups Section You can add reference lines at group means and percentiles.
NCSS Statistical Software NCSS.com Error-Bar Charts
155-7 © NCSS, LLC. All Rights Reserved.
Titles, Legend, Numeric Axis, Group Axis, Grid Lines, and Background Tabs Details on setting the options in these tabs are given in the Graphics Components chapter.
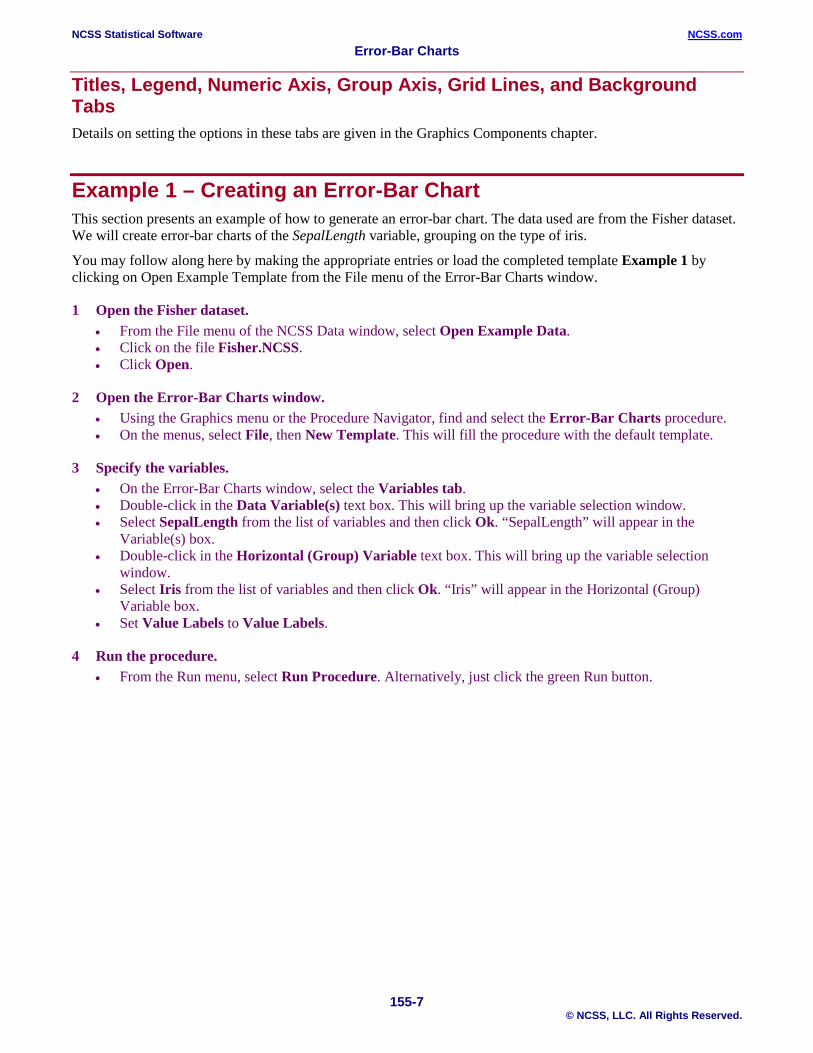
Example 1 – Creating an Error-Bar Chart This section presents an example of how to generate an error-bar chart. The data used are from the Fisher dataset. We will create error-bar charts of the SepalLength variable, grouping on the type of iris.
You may follow along here by making the appropriate entries or load the completed template Example 1 by clicking on Open Example Template from the File menu of the Error-Bar Charts window.
1 Open the Fisher dataset. • From the File menu of the NCSS Data window, select Open Example Data. • Click on the file Fisher.NCSS. • Click Open.
2 Open the Error-Bar Charts window. • Using the Graphics menu or the Procedure Navigator, find and select the Error-Bar Charts procedure. • On the menus, select File, then New Template. This will fill the procedure with the default template.
3 Specify the variables. • On the Error-Bar Charts window, select the Variables tab. • Double-click in the Data Variable(s) text box. This will bring up the variable selection window. • Select SepalLength from the list of variables and then click Ok. “SepalLength” will appear in the
Variable(s) box. • Double-click in the Horizontal (Group) Variable text box. This will bring up the variable selection
window. • Select Iris from the list of variables and then click Ok. “Iris” will appear in the Horizontal (Group)
Variable box. • Set Value Labels to Value Labels.
4 Run the procedure. • From the Run menu, select Run Procedure. Alternatively, just click the green Run button.

NCSS Statistical Software NCSS.com Error-Bar Charts
155-8 © NCSS, LLC. All Rights Reserved.
Error-Bar Chart Output
The second plot is the same data with the bar fill and bar border removed and symbols and connecting lines added (see Example 1b settings template).

NCSS Statistical Software NCSS.com Error-Bar Charts
155-9 © NCSS, LLC. All Rights Reserved.
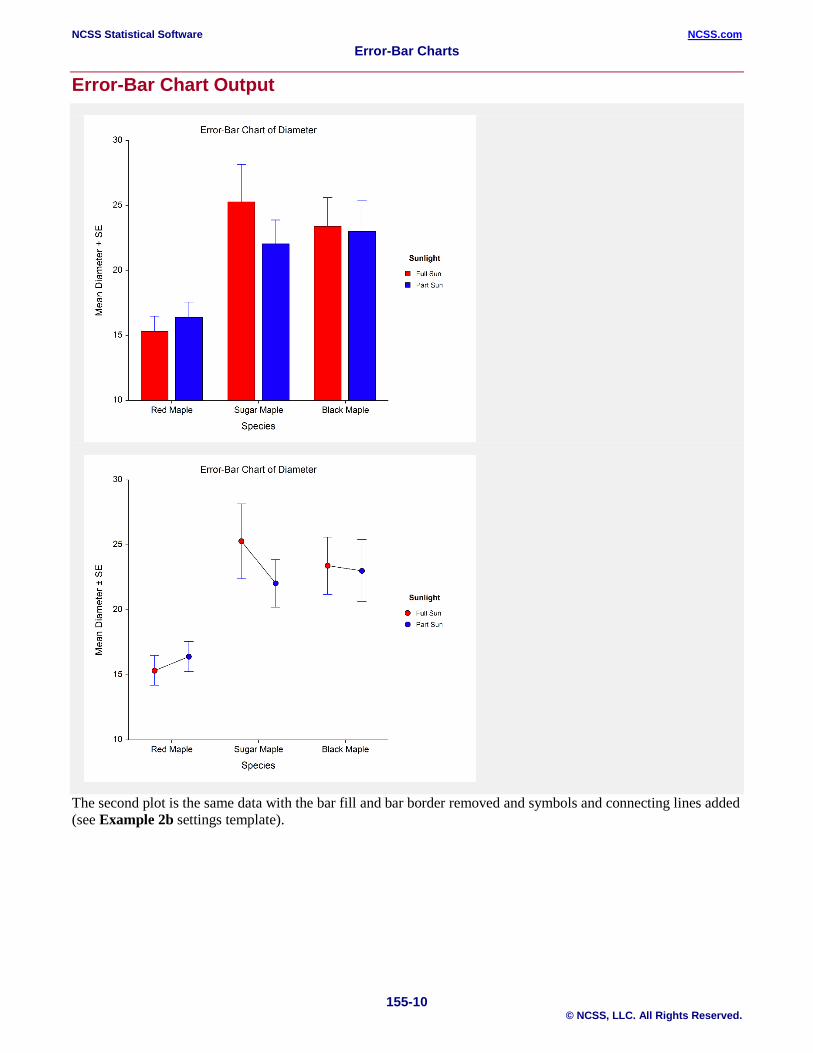
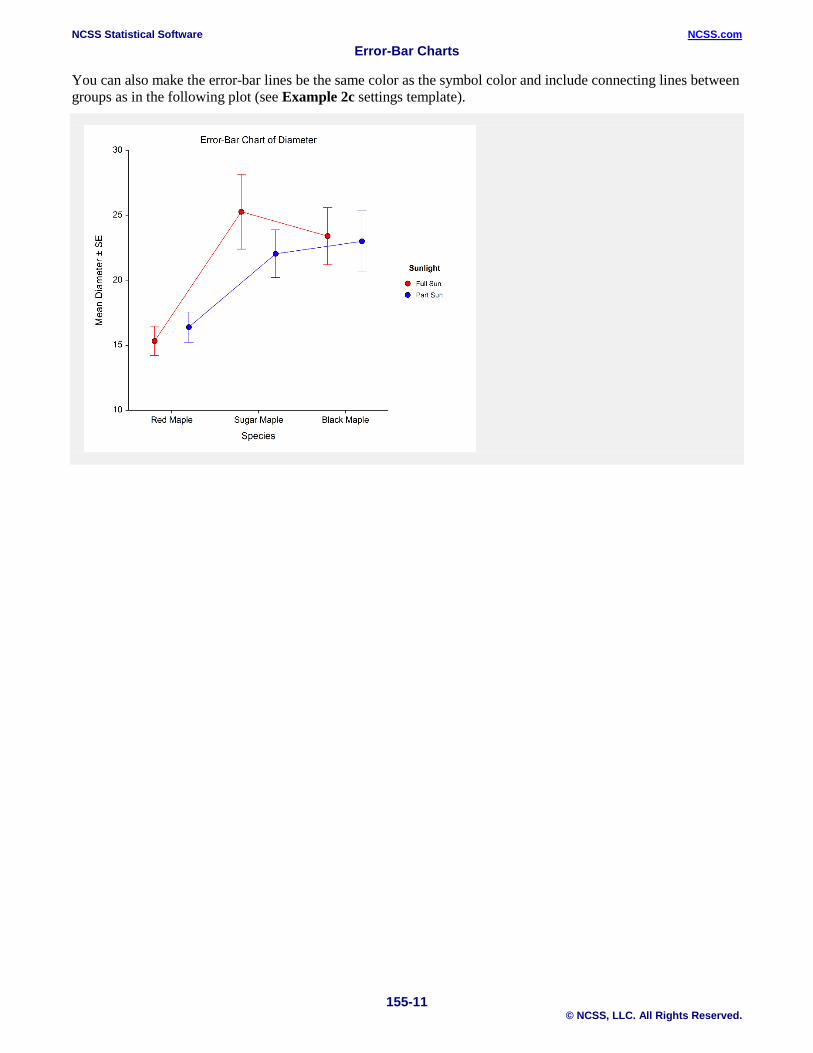
Example 2 – Creating an Error-Bar Chart with Subgroups This section presents an example of how to generate an error-bar chart with subgroups. The data used are from the fictitious Tree dataset. We will create error-bar charts of the Diameter variable, grouping on Species, with subgroups according to Sunlight.
You may follow along here by making the appropriate entries or load the completed template Example 2 by clicking on Open Example Template from the File menu of the Error-Bar Charts (2 Factors) window.
1 Open the Tree dataset. • From the File menu of the NCSS Data window, select Open Example Data. • Click on the file Tree.NCSS. • Click Open.
2 Open the Error-Bar Charts (2 Factors) window. • Using the Graphics menu or the Procedure Navigator, find and select the Error-Bar Charts (2 Factors)
procedure. • On the menus, select File, then New Template. This will fill the procedure with the default template.
3 Specify the variables. • On the Error-Bar Charts (2 Factors) window, select the Variables tab. • Double-click in the Data Variable(s) text box. This will bring up the variable selection window. • Select Diameter from the list of variables and then click Ok. “Diameter” will appear in the Variable(s)
box. • Double-click in the Horizontal (Group) Variable text box. This will bring up the variable selection
window. • Select Species from the list of variables and then click Ok. “Species” will appear in the Horizontal
(Group) Variable box. • Double-click in the Legend (Subgroup) Variable text box. This will bring up the variable selection
window. • Select Sunlight from the list of variables and then click Ok. “Sunlight” will appear in the Legend
(Subgroup) Variable box. • Set Value Labels to Value Labels.
4 Run the procedure. • From the Run menu, select Run Procedure. Alternatively, just click the green Run button.
NCSS Statistical Software NCSS.com Error-Bar Charts
155-10 © NCSS, LLC. All Rights Reserved.
Error-Bar Chart Output
The second plot is the same data with the bar fill and bar border removed and symbols and connecting lines added (see Example 2b settings template).
NCSS Statistical Software NCSS.com Error-Bar Charts
155-11 © NCSS, LLC. All Rights Reserved.
You can also make the error-bar lines be the same color as the symbol color and include connecting lines between groups as in the following plot (see Example 2c settings template).

NCSS Statistical Software NCSS.com Error-Bar Charts
155-12 © NCSS, LLC. All Rights Reserved.
Example 3 – Creating an Error-Bar Chart with 95% Confidence Interval Limits and Raw Data This section presents an example of how to generate an error-bar chart with 95% confidence interval limits. The data used are from the Fisher dataset. We will create error-bar charts of the SepalLength variable, grouping on the type of iris.
You may follow along here by making the appropriate entries or load the completed template Example 3 by clicking on Open Example Template from the File menu of the Error-Bar Charts window.
1 Open the Fisher dataset. • From the File menu of the NCSS Data window, select Open Example Data. • Click on the file Fisher.NCSS. • Click Open.
2 Open the Error-Bar Charts window. • Using the Graphics menu or the Procedure Navigator, find and select the Error-Bar Charts procedure. • On the menus, select File, then New Template. This will fill the procedure with the default template.
3 Specify the variables. • On the Error-Bar Charts window, select the Variables tab. • Double-click in the Data Variable(s) text box. This will bring up the variable selection window. • Select SepalLength from the list of variables and then click Ok. “SepalLength” will appear in the
Variable(s) box. • Double-click in the Horizontal (Group) Variable text box. This will bring up the variable selection
window. • Select Iris from the list of variables and then click Ok. “Iris” will appear in the Horizontal (Group)
Variable box. • Set Value Labels to Value Labels.
4 Edit the Plot. • Click on the Plot Format button. • On the Error-Bar Chart tab, uncheck Bar Fill and Bar Border under Bars & Symbols. • On the Error-Bar Chart tab, put a checkmark next to Symbols under Bars & Symbols. • On the Error-Bar Chart tab, put a checkmark next to Raw Data under Bars & Symbols. • On the Error-Bar Chart tab, change the Error Bar Variation Line Type to Confidence Interval. • Click OK to save the plot settings.
5 Run the procedure. • From the Run menu, select Run Procedure. Alternatively, just click the green Run button.

NCSS Statistical Software NCSS.com Error-Bar Charts
155-13 © NCSS, LLC. All Rights Reserved.
Error-Bar Chart Output

NCSS Statistical Software NCSS.com Error-Bar Charts
155-14 © NCSS, LLC. All Rights Reserved.
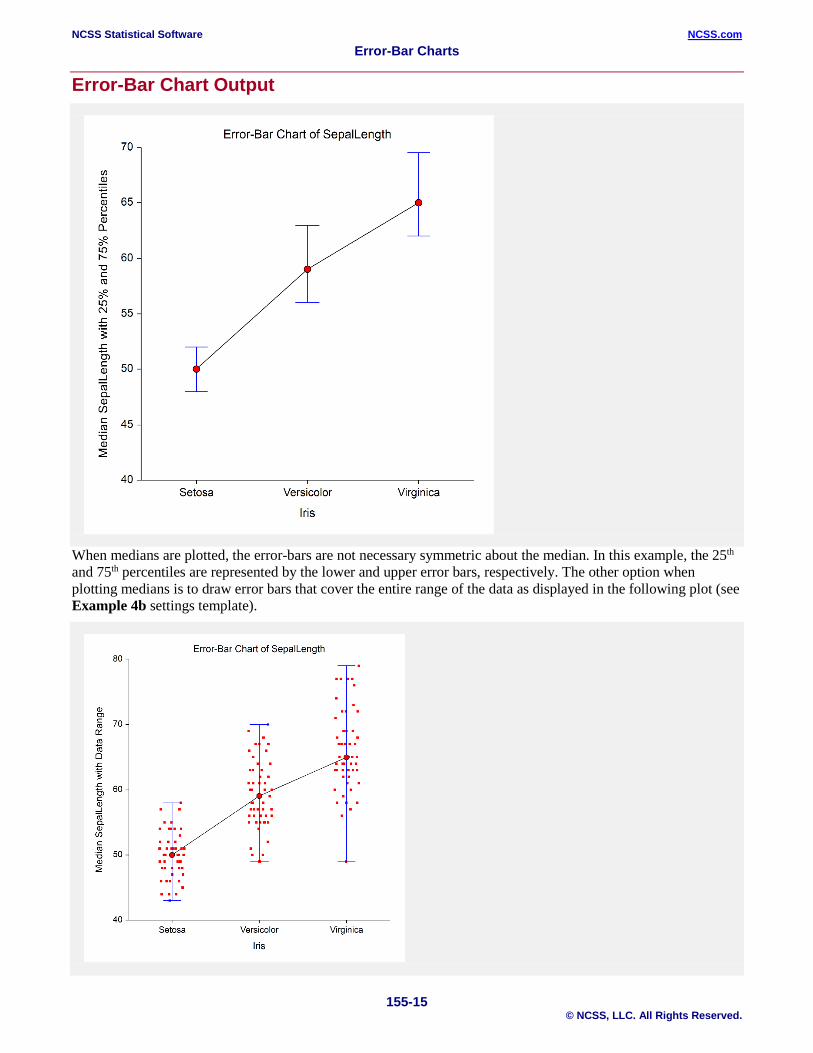
Example 4 – Creating an Error-Bar Chart with Medians This section presents an example of how to generate an error-bar chart with medians instead of means. The data used are from the Fisher dataset. We will create error-bar charts of the SepalLength variable, grouping on the type of iris.
You may follow along here by making the appropriate entries or load the completed template Example 4 by clicking on Open Example Template from the File menu of the Error-Bar Charts window.
1 Open the Fisher dataset. • From the File menu of the NCSS Data window, select Open Example Data. • Click on the file Fisher.NCSS. • Click Open.
2 Open the Error-Bar Charts window. • Using the Graphics menu or the Procedure Navigator, find and select the Error-Bar Charts procedure. • On the menus, select File, then New Template. This will fill the procedure with the default template.
3 Specify the variables. • On the Error-Bar Charts window, select the Variables tab. • Double-click in the Data Variable(s) text box. This will bring up the variable selection window. • Select SepalLength from the list of variables and then click Ok. “SepalLength” will appear in the
Variable(s) box. • Double-click in the Horizontal (Group) Variable text box. This will bring up the variable selection
window. • Select Iris from the list of variables and then click Ok. “Iris” will appear in the Horizontal (Group)
Variable box. • Set Value Labels to Value Labels.
4 Edit the Plot. • Click on the Plot Format button. • On the Error-Bar Chart tab, change Center Estimation Type to “Median”. • On the Error-Bar Chart tab, uncheck Bar Fill and Bar Border under Bars & Symbols. • On the Error-Bar Chart tab, put a checkmark next to Symbols under Bars & Symbols. • On the Connecting Lines tab, put a checkmark next to Medians under Connect Between Groups. • On the Painting Order tab, move Connecting Lines before Error-Bar Chart. • Click OK to save the plot settings.
5 Run the procedure. • From the Run menu, select Run Procedure. Alternatively, just click the green Run button.
NCSS Statistical Software NCSS.com Error-Bar Charts
155-15 © NCSS, LLC. All Rights Reserved.
Error-Bar Chart Output
When medians are plotted, the error-bars are not necessary symmetric about the median. In this example, the 25th and 75th percentiles are represented by the lower and upper error bars, respectively. The other option when plotting medians is to draw error bars that cover the entire range of the data as displayed in the following plot (see Example 4b settings template).