chapter 2. fdi spillovers in costa rica: boosting local
TRANSCRIPT
2. FDI SPILLOVERS IN COSTA RICA: BOOSTING LOCAL PRODUCTIVITY THROUGH BACKWARD LINKAGES │ 41
OECD ECONOMIC SURVEY OF COSTA RICA: RESEARCH FINDINGS ON PRODUCTIVITY © OECD 2018
Chapter 2. FDI spillovers in Costa Rica: boosting local productivity through
backward linkages6
Catalina Sandoval, Francisco Monge, Alonso Alfaro Ureña and Tatiana Vargas
This chapter analyses productivity spillovers from FDI to local firms in Costa Rica, by
building up on two different approaches, as done in Ruane and Uǧur (2005[1]) and Haller
(2014[2]). We use panel data with fixed effects and propensity score matching to exploit
information at the firm level, comprised in a dataset covering the universe of formal firms
in Costa Rica between 2008 and 2015. The analysis found robust evidence that the
presence of foreign firms is positively correlated with the productivity of local Costa
Rican firms in both the manufacturing and the services sectors. In the manufacturing
sector, the local supplying firms have, on average, 8% higher labour productivity than
those that do not have business relations with foreign-owned firms. In the services sector,
local firms that are suppliers of foreign-owned firms have, on average, 6.4% higher
labour productivity than those that do not have business relations with foreign-owned
firms. These findings highlight the importance of FDI attraction for the Costa Rican
economy as a whole and the need to deepen public policy aimed at boosting the creation
of linkages between foreign-owned and local firms.
Introduction
Over the past three decades, Costa Rica has followed a consistent outward-oriented
development strategy. One of its pillars has been the attraction of foreign direct
investment (FDI), which, together with the process of trade liberalisation, has facilitated a
relatively rapid and substantial structural transformation of the economy. Sophisticated
manufacturing and high value-added services now account for a significant share of the
Costa Rican economy and trade flows, having achieved higher levels of growth than
activities oriented mostly to the domestic markets. A crucial question is whether
deepening the channels for spillovers from FDI to the rest of the economy may contribute
to a more inclusive development pathway for the country. Thus, it is of great interest to
analyse productivity spillovers that could be taking place as a result of the presence of
multinational companies (MNCs) in the Costa Rican economy.
6 This study reflects only the opinions of the authors and not those of the institutions they work
for, nor the OECD. The authors bear full responsibility for any mistakes or errors found in this
document.
42 │ 2. FDI SPILLOVERS IN COSTA RICA: BOOSTING LOCAL PRODUCTIVITY THROUGH BACKWARD LINKAGES
This study aims to analyse whether there is robust evidence of productivity spillovers
from FDI to local firms in Costa Rica. It investigates this question by applying two
different approaches to a novel firm-level database covering the universe of formal firms
in Costa Rica from 2005-2015. First, an empirical model widely used in the international
literature is applied, by which the productivity of local firms is regressed on a group of
explanatory variables (Gorg and Greenaway, 2004[3]; Lesher and Miroudot, 2008[4])
including one that accounts for the existence of spillovers from FDI. Our specification is
based on Ruane and Uǧur (2005[1]) and Haller (2014[2]), which evaluate whether the
presence of foreign-owned firms in Ireland raises the productivity of local firms.
However, this analysis relies on industry-level measures of the presence of foreign firms.
Therefore, the main contribution of this study is to analyse the existence of spillovers
through firm-level information on backward linkages with foreign-owned firms, and by
using Propensity Score Matching (PSM) techniques to generate a counterfactual situation
to control for possible self-selection bias.
Exploiting firm-level information comprised in a dataset recently developed by the
Central Bank of Costa Rica (Banco Central de Costa Rica, BCCR), is clearly one of the
most attractive and robust features of our work. The dataset compiles firm-level data from
2005 to 2015 for revenues, costs, location, assets, exports, imports, number of employees,
industrial classification (4-digit ISIC) and foreign direct investment, for all the firms that
paid income taxes in the referred period. We also use labour data from the Social Security
Fund (Caja Costarricense de Seguro Social, CCSS) for the same period and data on
transactions between firms over 2008-2015.
We find a positive correlation between the presence of foreign firms and the productivity
of local firms in both the manufacturing and services sectors using the approach of Ruane
and Uǧur (2005[1]) and Haller (2014[2]). This means that the greater the presence of
foreign firms in an industry, the higher the productivity of domestic firms. However,
given the limitations of measuring spillovers by an industry-level measure of foreign
presence, we also use a firm-level backward linkages variable in the estimation and apply
propensity score matching (PSM) techniques to account for possible selection bias. We
find that local manufacturing and services firms that supply foreign-owned firms have
higher labour productivity than those that do not have any business relationships with
foreign-owned firms. In addition, the results suggest that the productivity benefits stem
from the business relationship with FDI firms, regardless of the size of transactions and
the number of years they last.
Currently, local Costa Rican firms are characterised by two different levels of
performance, as some of them are fully integrated into international markets and others
do not have the capabilities needed for such integration (Beverinotti et al., 2014[5];
Monge-González and Torres-Carballo, 2014[6]). This “duality” confirms that increasing
the number of firms that can be linked to foreign trade and foreign-owned firms remains a
major challenge. Nevertheless, the present study uses firm-level data to show that the
number of local firms that have commercial relationships with foreign-owned ones is not
negligible – about one third do so. Even though the figure is growing and sizeable, it
should not undermine the country's efforts to continue strengthening the linkages between
local and FDI firms.
The remainder of this chapter is organised into four sections. Section 2 provides an
overview of the main facts relating to FDI and productivity in Costa Rica over the last
three decades and of the international literature on spillovers. Section 3 describes the
dataset used and the methodological approach followed, while Section 4 describes the
2. FDI SPILLOVERS IN COSTA RICA: BOOSTING LOCAL PRODUCTIVITY THROUGH BACKWARD LINKAGES │ 43
OECD ECONOMIC SURVEY OF COSTA RICA: RESEARCH FINDINGS ON PRODUCTIVITY © OECD 2018
main findings from the analysis. The last section summarises the main conclusions and
discusses policy implications.
Trade liberalisation, FDI and labour productivity
Starting in the mid-1980s, Costa Rica has pursued an outward-oriented development
strategy, under which trade liberalisation and FDI attraction became key elements. For
instance, the adhesion to the General Agreement on Tariffs and Trade (GATT) in 1991,
and accession to the World Trade Organization in 1995, involved significant
commitments by the country to reduce tariffs on imports. Furthermore, the negotiation of
bilateral and regional foreign trade agreements (FTAs) has complemented multilateral
efforts and deepened trade liberalisation. Since 1995, when Costa Rica signed a bilateral
FTA with Mexico, 13 FTAs have been negotiated and implemented, providing for
preferential access, certainty and predictability for nearly 90% of the country’s trade in
goods.
The FDI attraction strategy also began in the 1980s. The main actions that marked the
first steps of this initiative involved the creation of the Costa Rican Coalition of
Development Initiatives (CINDE), which is the agency responsible for the promotion and
attraction of foreign direct investment. Also, the Free Trade Zones Regime (FTZ) was
created in the early 1980s – which grants tax exemptions to companies that make new
investments in the country and comply with a series of requirements – with the main
objective of promoting exports of non-traditional goods and developing strong linkages
with international markets. In turn, and as highlighted by international literature, it was
also anticipated that encouraging FDI would bring new technologies and management
knowledge that, if adopted to some extent by domestic firms, would generate positive
productivity spillovers (Markusen, 1995[7]). Recognising this potential, some programmes
to promote productive linkages between MNCs and local firms have been established in
Costa Rica, such as CR Provee. However, while more evidence is needed of its
effectiveness, some positive impacts on wages, labour demand, and chances of exporting
of local supplier firms have been found (Monge-González and Rodríguez-Álvarez,
2013[8]).
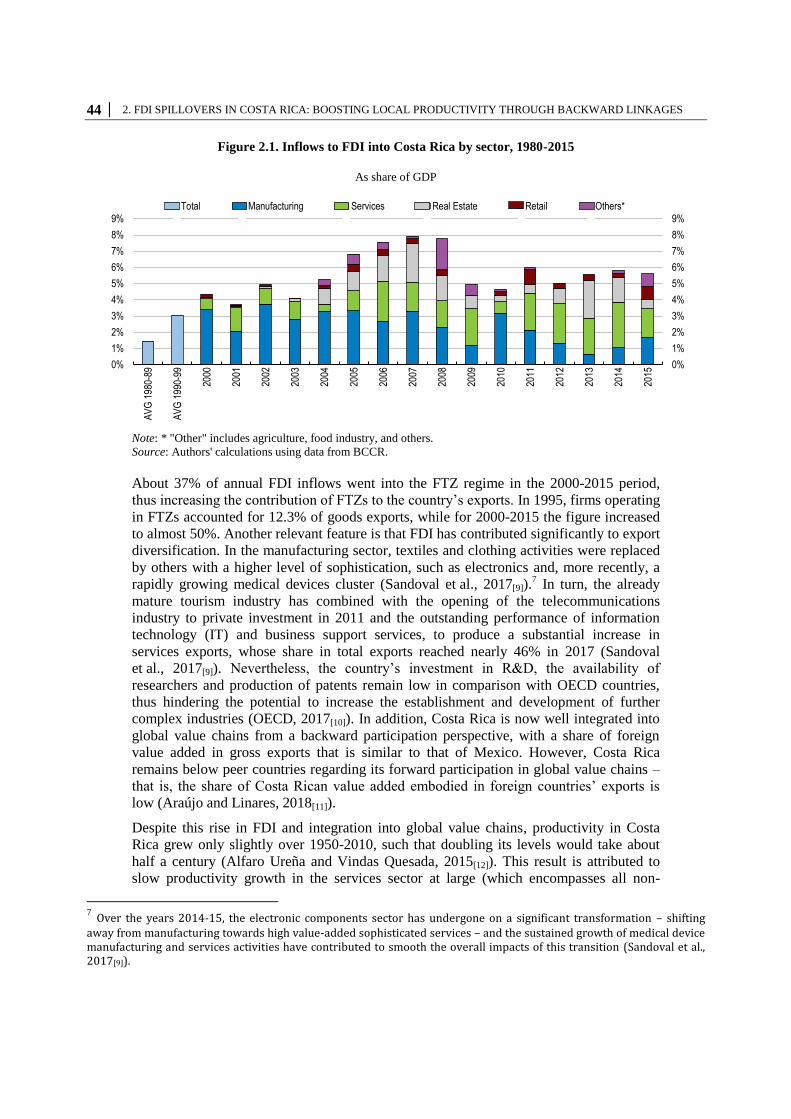
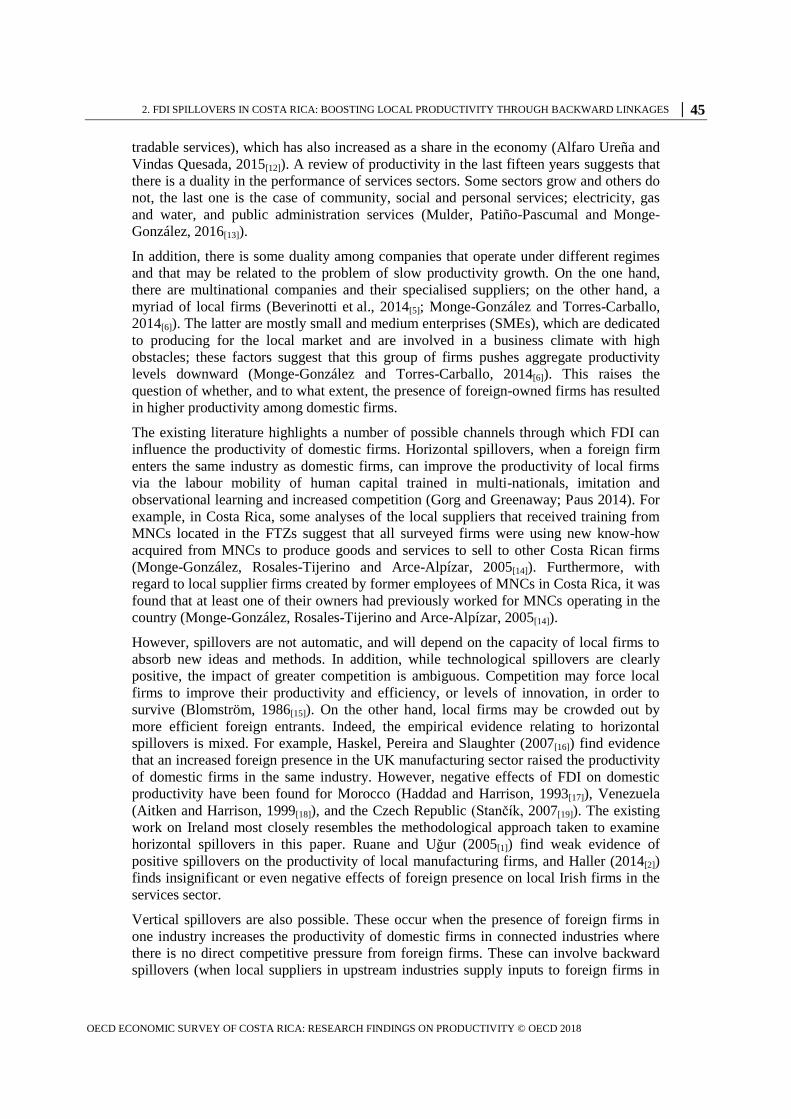
Reflecting these outward-oriented strategies, FDI has increased significantly over time. In
the period 1980-89, FDI amounted to, on average, 1.5% of GDP a year, a figure that
doubled for the next ten years and then reached 5.6% of GDP between 2000 and 2015. In
the beginning, a substantial share of the investments took place in manufacturing, but in
the last five years, they have shifted towards the services sector, thus producing a
noticeable change in the sectoral composition (see Figure 2.1).
44 │ 2. FDI SPILLOVERS IN COSTA RICA: BOOSTING LOCAL PRODUCTIVITY THROUGH BACKWARD LINKAGES
Figure 2.1. Inflows to FDI into Costa Rica by sector, 1980-2015
As share of GDP
Note: * "Other" includes agriculture, food industry, and others.
Source: Authors' calculations using data from BCCR.
About 37% of annual FDI inflows went into the FTZ regime in the 2000-2015 period,
thus increasing the contribution of FTZs to the country’s exports. In 1995, firms operating
in FTZs accounted for 12.3% of goods exports, while for 2000-2015 the figure increased
to almost 50%. Another relevant feature is that FDI has contributed significantly to export
diversification. In the manufacturing sector, textiles and clothing activities were replaced
by others with a higher level of sophistication, such as electronics and, more recently, a
rapidly growing medical devices cluster (Sandoval et al., 2017[9]).7 In turn, the already
mature tourism industry has combined with the opening of the telecommunications
industry to private investment in 2011 and the outstanding performance of information
technology (IT) and business support services, to produce a substantial increase in
services exports, whose share in total exports reached nearly 46% in 2017 (Sandoval
et al., 2017[9]). Nevertheless, the country’s investment in R&D, the availability of
researchers and production of patents remain low in comparison with OECD countries,
thus hindering the potential to increase the establishment and development of further
complex industries (OECD, 2017[10]). In addition, Costa Rica is now well integrated into
global value chains from a backward participation perspective, with a share of foreign
value added in gross exports that is similar to that of Mexico. However, Costa Rica
remains below peer countries regarding its forward participation in global value chains –
that is, the share of Costa Rican value added embodied in foreign countries’ exports is
low (Araújo and Linares, 2018[11]).
Despite this rise in FDI and integration into global value chains, productivity in Costa
Rica grew only slightly over 1950-2010, such that doubling its levels would take about
half a century (Alfaro Ureña and Vindas Quesada, 2015[12]). This result is attributed to
slow productivity growth in the services sector at large (which encompasses all non-
7 Over the years 2014-15, the electronic components sector has undergone on a significant transformation – shifting
away from manufacturing towards high value-added sophisticated services – and the sustained growth of medical device manufacturing and services activities have contributed to smooth the overall impacts of this transition (Sandoval et al., 2017[9]).
0%
1%
2%
3%
4%
5%
6%
7%
8%
9%
0%
1%
2%
3%
4%
5%
6%
7%
8%
9%
AV
G 1
980-
89
AV
G 1
990-
99
2000
2001
2002
2003
2004
2005
2006
2007
2008
2009
2010
2011
2012
2013
2014
2015
Total Manufacturing Services Real Estate Retail Others*
2. FDI SPILLOVERS IN COSTA RICA: BOOSTING LOCAL PRODUCTIVITY THROUGH BACKWARD LINKAGES │ 45
OECD ECONOMIC SURVEY OF COSTA RICA: RESEARCH FINDINGS ON PRODUCTIVITY © OECD 2018
tradable services), which has also increased as a share in the economy (Alfaro Ureña and
Vindas Quesada, 2015[12]). A review of productivity in the last fifteen years suggests that
there is a duality in the performance of services sectors. Some sectors grow and others do
not, the last one is the case of community, social and personal services; electricity, gas
and water, and public administration services (Mulder, Patiño-Pascumal and Monge-
González, 2016[13]).
In addition, there is some duality among companies that operate under different regimes
and that may be related to the problem of slow productivity growth. On the one hand,
there are multinational companies and their specialised suppliers; on the other hand, a
myriad of local firms (Beverinotti et al., 2014[5]; Monge-González and Torres-Carballo,
2014[6]). The latter are mostly small and medium enterprises (SMEs), which are dedicated
to producing for the local market and are involved in a business climate with high
obstacles; these factors suggest that this group of firms pushes aggregate productivity
levels downward (Monge-González and Torres-Carballo, 2014[6]). This raises the
question of whether, and to what extent, the presence of foreign-owned firms has resulted
in higher productivity among domestic firms.
The existing literature highlights a number of possible channels through which FDI can
influence the productivity of domestic firms. Horizontal spillovers, when a foreign firm
enters the same industry as domestic firms, can improve the productivity of local firms
via the labour mobility of human capital trained in multi-nationals, imitation and
observational learning and increased competition (Gorg and Greenaway; Paus 2014). For
example, in Costa Rica, some analyses of the local suppliers that received training from
MNCs located in the FTZs suggest that all surveyed firms were using new know-how
acquired from MNCs to produce goods and services to sell to other Costa Rican firms
(Monge-González, Rosales-Tijerino and Arce-Alpízar, 2005[14]). Furthermore, with
regard to local supplier firms created by former employees of MNCs in Costa Rica, it was
found that at least one of their owners had previously worked for MNCs operating in the
country (Monge-González, Rosales-Tijerino and Arce-Alpízar, 2005[14]).
However, spillovers are not automatic, and will depend on the capacity of local firms to
absorb new ideas and methods. In addition, while technological spillovers are clearly
positive, the impact of greater competition is ambiguous. Competition may force local
firms to improve their productivity and efficiency, or levels of innovation, in order to
survive (Blomström, 1986[15]). On the other hand, local firms may be crowded out by
more efficient foreign entrants. Indeed, the empirical evidence relating to horizontal
spillovers is mixed. For example, Haskel, Pereira and Slaughter (2007[16]) find evidence
that an increased foreign presence in the UK manufacturing sector raised the productivity
of domestic firms in the same industry. However, negative effects of FDI on domestic
productivity have been found for Morocco (Haddad and Harrison, 1993[17]), Venezuela
(Aitken and Harrison, 1999[18]), and the Czech Republic (Stančík, 2007[19]). The existing
work on Ireland most closely resembles the methodological approach taken to examine
horizontal spillovers in this paper. Ruane and Uǧur (2005[1]) find weak evidence of
positive spillovers on the productivity of local manufacturing firms, and Haller (2014[2])
finds insignificant or even negative effects of foreign presence on local Irish firms in the
services sector.
Vertical spillovers are also possible. These occur when the presence of foreign firms in
one industry increases the productivity of domestic firms in connected industries where
there is no direct competitive pressure from foreign firms. These can involve backward
spillovers (when local suppliers in upstream industries supply inputs to foreign firms in
46 │ 2. FDI SPILLOVERS IN COSTA RICA: BOOSTING LOCAL PRODUCTIVITY THROUGH BACKWARD LINKAGES
downstream industries), or forward spillovers (when foreign firms in upstream industries
sell their outputs to domestic firms in downstream industries). Unlike horizontal
spillovers, competition issues do not apply, so foreign firms do not have incentives to
prevent technology diffusion to upstream or downstream industries, suggesting that
spillovers may occur more readily. This can involve, for example, foreign firms directly
transferring technology or providing technical assistance and training to local suppliers,
or requiring higher quality standards and thereby incentivising local firms to upgrade
their production, management and technology (Aitken and Harrison, 1999[18]; Javorcik,
2004[33]). On the other hand, backward spillovers may be constrained by several factors.
Foreign firms may choose to import intermediate goods instead of sourcing them locally
(Rodriguez-Clare, 1996[20]). Or even when a foreign firm sources intermediates locally,
the suppliers may fail to learn and absorb new technology and processes if they lag too
far behind their foreign partners and therefore lack the absorptive capacity to benefit
(Javorcik, 2004[21]; Lin and Saggi, 2007[22]).
Costa Rica is a small economy and, thus, most of the foreign investment that is attracted
does not seek to supply the local market. Instead, the strategy followed by FDI firms has
been to find efficiency through cost reduction (Martínez and Hernández, 2012[23]).
Therefore, the benefits from the establishment of MNCs are most likely to occur through
backward linkages. However, the empirical evidence on backward linkages is also mixed.
Positive backward spillovers have been found for 17 emerging economies
(Gorodnichenko, Svejnar and Terrell, 2007[24]), Indonesia (Javorcik, 2004[21]), Lithuania
(Schoors and van der Tol, 2002[25]) and Canada (Wang and Gu, 2006[26]). However,
Stancik (2007[19]) finds that the presence of foreign firms has a negative impact on
upstream local firms in the Czech Republic. In a study of 25 developed and emerging
economies in the EU, the effect was found to be very small, particularly for emerging
markets (Fons-Rosen et al., 2013[27]).
Moreover, the country faces a skills mismatch with various adverse effects in the
relations with MNC, such as: i) the attraction of the best-qualified personnel by MNC
offering higher wages, leaving the domestic enterprises short of this type of human
capital; ii) limiting MNC to engage to higher-value added activities; and iii) a shortage of
highly qualified researchers in both the private and the public sectors. This evidences a
paradox: while more high-skilled workers are demanded, most of those who work for
MNC are overqualified for the jobs they are performing (OECD, 2017[10]).
Despite some evidence of the positive results of the CR Provee programme to provide
linkages between domestic and foreign firms and subjective surveys on the interactions
between these firms, the existing literature has not been able to provide systematic
evidence on FDI spillovers to domestic firms. Further policy interventions have been
undertaken to increase the absorptive and innovative capacities of domestic firms.
However, the size and scope of these programmes are too small to have a sufficient
impact and trigger a change in Costa Rica’s innovation capabilities and to boost
productive linkages between MNC and domestic firms (OECD, 2017[10]). In addition, the
international evidence highlights that the benefits from spillovers are influenced by
several factors, and therefore can vary from country-to-country. Moreover, many existing
studies rely on input-output tables to estimate backward spillovers. We exploit a novel
dataset that provides information on transactions between individual firms, providing a
more direct way to measure business relationships between local and foreign firms.
Therefore, it is of great interest to analyse productivity spillovers that could be stemming
from the presence of MNCs) in Costa Rica.
2. FDI SPILLOVERS IN COSTA RICA: BOOSTING LOCAL PRODUCTIVITY THROUGH BACKWARD LINKAGES │ 47
OECD ECONOMIC SURVEY OF COSTA RICA: RESEARCH FINDINGS ON PRODUCTIVITY © OECD 2018
Data and methodology
Data
The quantitative analysis of this study uses a dataset compiled and administered by the
BCCR, which comprises firm-level data for the universe of formal firms operating in the
country during the period 2005-2015. This dataset includes information from several
sources that the BCCR has merged into a complete set of consistent data. The variables
available in the database include: employment (which comes from the CCSS); exports
and imports of goods8 (which come from Costa Rica’s export promotion agency,
PROCOMER, and BCCR, respectively); profits, revenues, costs, and assets (which are
reported by firms to the Ministry of Finance by means of the mandatory income
declaration form D101); transactions between firms (which come from the work by
Alfaro Ureña, Manelici and Vasquez, 2018[28])9; geographic location and main economic
activity of each firm; and whether each firm is locally or foreign owned.
The definition of foreign ownership lies on the share of equity owned by foreign
investors. The threshold used in several empirical studies is 10% (Javorcik, 2004[21];
Ruane and Uǧur, 2005[1]). However, for the period analysed, all the firms with foreign
capital in Costa Rica are 100% foreign owned, while domestic firms are 100% locally
owned.
This work focuses on firms in manufacturing (10-33) and services (41-63 & 69-96)
industries, corresponding to the two-digit International Standard Industrial Classification
(ISIC). Firms in activities of agriculture, forestry, and fishing (01-03); mining and
quarrying (05-09); financial activities (64-66); public institutions (84) and NGOs, were
ruled out. Firms that hire less than three employees for the whole period were excluded in
order to prevent possible unusual behavior in the productivity of very small firms. Firms
in the tails of the distribution of the dependent variable (the top and bottom 1%) were also
excluded as outliers. Three-digit ISIC industries with five or fewer firms and two-digit
ISIC industries with ten or fewer firms were excluded as well, to safeguard the
confidentiality of firms’ data.
Only industries at the three-digit ISIC level with the presence of local firms that sell to
foreign-owned firms in the year were considered, in order to keep fully comparable
industries in terms of linkages to foreign-owned firms. Data cleaning was also carried out
to exclude observations with missing values. The final sample contains 30,464 unique
firms that vary between 13,294 and 21,779 per year, and 145,921 observations.
The labour productivity of a firm is measured as the ratio of revenues (Y), in millions of
local currency10
, to total employment (L). Revenue data is deflated using the Consumer
Price Index (CPI) from the BCCR (September 2013=100). There are four independent
variables used to measure FDI participation or linkages of domestic firms to foreign
firms. The first one is the foreign presence (FP) in the industry, which is an aggregated
variable that measures the share of employment accounted by all foreign-owned firms in
the relevant industry. The second one is Sales, a firm-level variable that represents the
8 Data available in the BCCR’s database does not include services trade flows.
9 They built variables over transaction data from the declaration of suppliers, D-151, (“Declaración
anual resumen de clientes, proveedores y gastos específicos”) for the period 2008-2015
10 Costa Rican “colón”.
48 │ 2. FDI SPILLOVERS IN COSTA RICA: BOOSTING LOCAL PRODUCTIVITY THROUGH BACKWARD LINKAGES
share of sales to foreign-owned firms. This variable, developed by Alfaro Ureña,
Manelicci, and Vasquez (2018[28]), is built upon the supplier declaration form data D-151,
which considers all sales of domestic to foreign firms over a minimum value of
approximately $5,000 per year (or $100 in the case of professional services). Then, sales
information is used to compute a dummy variable that takes the value of one if the local
firm sells to foreign-owned firms in the specific year, or zero otherwise. In addition, a
“dosage” variable is measured as the cumulative number of years that a local firm sold to
foreign-owned firms.
Other variables are also estimated at the firm level. Capital intensity (𝐾
𝐿) is computed as
the log of the ratio of total net assets (𝐾), deflated by CPI, to total employment (𝐿).
Labour quality (𝐿𝑠
𝐿) is represented by the firm’s share of skilled workers (𝐿𝑠) in total
labour. As no precise information on skilled workers is available at the firm level, a proxy
was used by measuring the count of employees in each firm with a monthly wage that is
greater or equal than the minimum wage11
paid to workers that have upper secondary
education with technical qualifications (known as “técnico medio en educación
diversificada”)12
. Firm size is measured by four separate dummy variables that take each
the value of one if the firm satisfies the criteria corresponding to each size category
(micro, small, medium and large), following the algorithm set out by the Ministry of
Economy, Industry and Commerce of Costa Rica (MEIC) that encompasses three
elements: the number of workers, revenues and total net assets. In addition, an export
status dummy was built with information of goods exports, thus taking a value of one if
the firm exported goods that year, and zero otherwise.
At the industry level, the following variables proposed in Haller (2014[2]) are estimated: a
lagged variable of import competition, measured as the share of apparent domestic
consumption sourced through imports at the two-digit ISIC level; a Herfindahl-
Hirschman index (𝐻𝐻𝐼) measuring market concentration by industry at three-digit level
ISIC code; and a variable on industry dynamism, that is measured as the lagged growth
rate of revenues by industry at the three-digit ISIC level.
Methodology
In order to estimate the spillover effects of FDI on productivity of Costa Rican local
firms, this work follows an empirical model widely used in international literature, in
which the productivity of local firms is regressed on a group of independent variables that
are theoretically associated to it (Gorg and Greenaway, 2004[3]; Lesher and Miroudot,
2008[4]). The set of explanatory variables the literature recommends to use may vary
contingent on the measure of productivity chosen and the question being examined. For
this study, the analysis builds upon the work by Ruane and Uǧur (2005[1]) and Haller
(2014[2]), as both works investigated the existence of FDI productivity spillovers through
the presence of foreign firms on local Irish firms, for the manufacturing and the services
sectors, respectively. However, the main contribution of this study is to analyse the
existence of spillovers through backward linkages with foreign-owned firms, by using
Propensity Score Matching (PSM) techniques to generate a counterfactual situation where
productivity is measured in the absence of the backward linkages. The general model and
the methodological details of this work are explained below.
11
Wages were round to the nearest ten to consider overtime payment in the less qualified jobs.
12 Costa Rica has 23 minimum wage categories.
2. FDI SPILLOVERS IN COSTA RICA: BOOSTING LOCAL PRODUCTIVITY THROUGH BACKWARD LINKAGES │ 49
OECD ECONOMIC SURVEY OF COSTA RICA: RESEARCH FINDINGS ON PRODUCTIVITY © OECD 2018
Spillovers through foreign presence
The general model represents the idea that the firm’s productivity is a function of
production factors like capital (𝐾), workers (𝐿), and other determinants of
productivity (𝑒), that are not measured (Griliches, 1979[29]).
𝑷𝒓𝒐𝒅𝒖𝒄𝒕𝒊𝒗𝒊𝒕𝒚 = 𝒇(𝑲, 𝑳, 𝒆) (2.1)
Other factors collected by the term “e” may include technology, R&D practices, and the
spillover generated by the establishment of FDI in the country. This may represent
potential gains in productivity of local firms and workers resulting from the diffusion of
knowledge and technology from foreign investors to domestic firms (Caves, 1974[30]).
Model specification for manufacturing
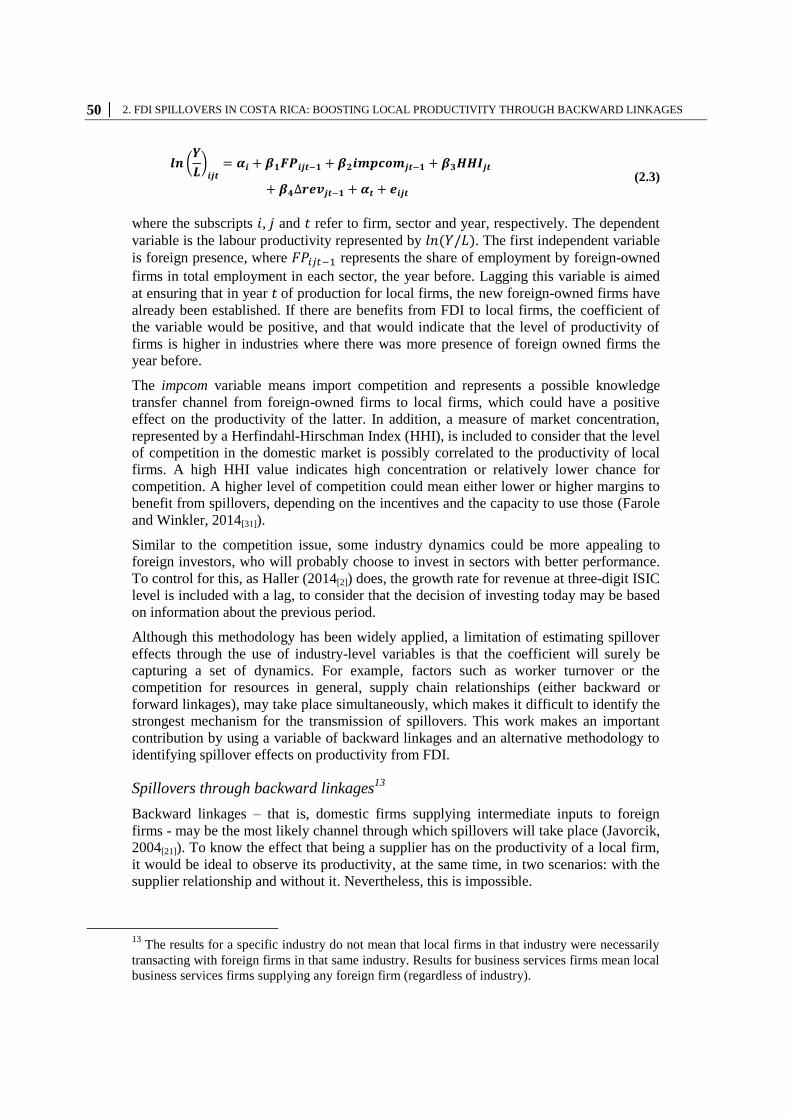
In order to identify the aforementioned factor, and following the proposal of Ruane and
Uǧur (2005[1]), the labour productivity of local manufacturing firms could be defined by
the following equation:
𝒍𝒏 (𝒀
𝑳)𝒊𝒋𝒕
= 𝜷𝟎 + 𝜷𝟏𝒍𝒏 (𝑲
𝑳)𝒊𝒋𝒕
+ 𝜷𝟐 (𝑳𝒔
𝑳)𝒊𝒋𝒕
+ 𝜷𝟑𝑭𝑷𝒋𝒕 + 𝜶𝒊
+ 𝜶𝒕 + 𝒆𝒊𝒋𝒕 (2.2)
where the subscripts 𝑖, 𝑗 and 𝑡 refer to firm, industry and year, respectively. The
dependent variable, 𝑙𝑛(𝑌/𝐿), is the log of labour productivity. The explanatory variables
are the log of capital intensity, 𝑙𝑛(𝐾/𝐿), and the share of highly-skilled workers, (𝐿𝑠/𝐿).
Both variables are directly associated with factors of production and thus a positive
relationship between productivity and each one of them is expected. The most relevant
independent variable for the purpose of this study is the presence of foreign firms at the
industry level, 𝐹𝑃𝑗𝑡. If there are benefits of FDI for the productivity of local firms, the
coefficient of the variable 𝐹𝑃𝑗𝑡 would be positive and that would indicate that the level of
productivity of the firms is higher in the industries with a higher presence of foreign
firms. This variable is aggregated at both the two-digit and three-digit ISIC level to test
for the robustness of the results.
The effect of productivity spillovers on local manufacturing firms in Equation (2.2) is
estimated throughout panel data techniques with fixed effects, to control by
characteristics of the firms that do not vary with time and could be correlated with the
presence of foreign firms. In addition, a time dummy variable for each year is included, to
control for possible temporal effects (𝛼𝑡). Whereas 𝑒𝑖𝑗𝑡 encompass all the other factors
that affect the labour productivity of the firms that are not specified in the regression.
Model specification for services
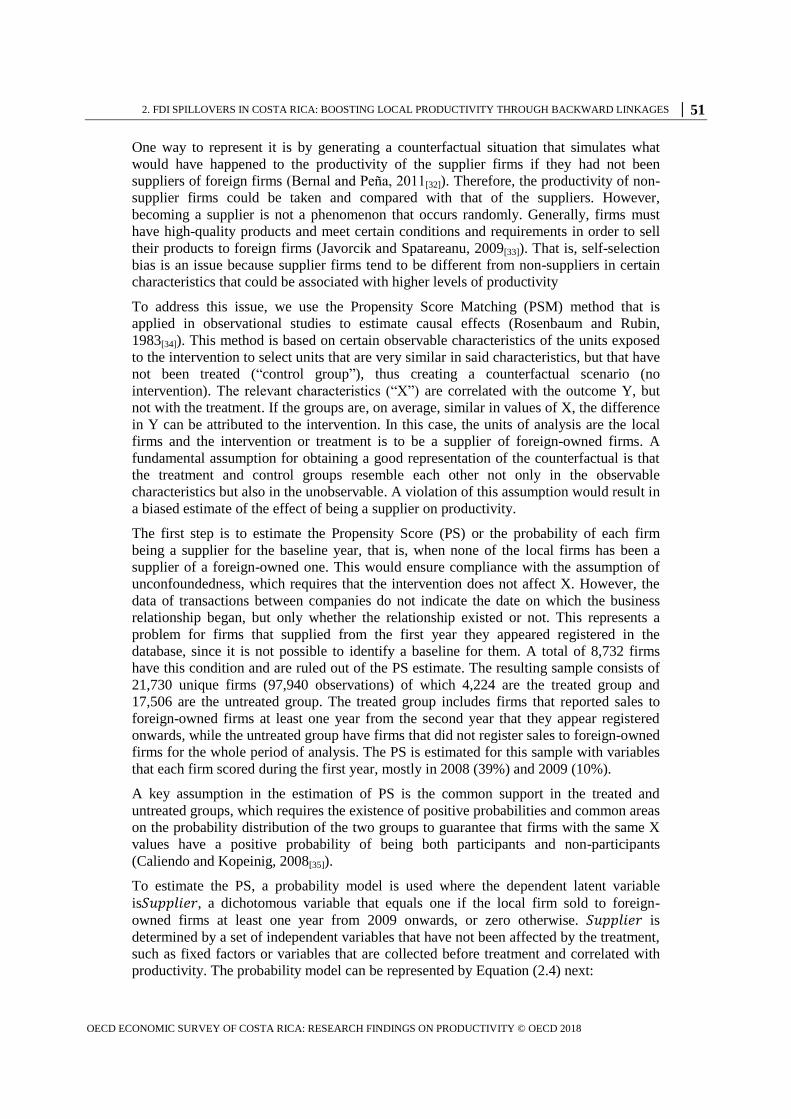
The empirical specification for services follows the work by Haller (2014[2]), which seeks
to estimate the FDI spillover effects on the productivity of local firms by measuring
foreign presence and including control variables, both at the sector level. Equation (2.3)
shows the general model:
50 │ 2. FDI SPILLOVERS IN COSTA RICA: BOOSTING LOCAL PRODUCTIVITY THROUGH BACKWARD LINKAGES
𝒍𝒏 (𝒀
𝑳)𝒊𝒋𝒕
= 𝜶𝒊 + 𝜷𝟏𝑭𝑷𝒊𝒋𝒕−𝟏 + 𝜷𝟐𝒊𝒎𝒑𝒄𝒐𝒎𝒋𝒕−𝟏 + 𝜷𝟑𝑯𝑯𝑰𝒋𝒕
+ 𝜷𝟒∆𝒓𝒆𝒗𝒋𝒕−𝟏 + 𝜶𝒕 + 𝒆𝒊𝒋𝒕 (2.3)
where the subscripts 𝑖, 𝑗 and 𝑡 refer to firm, sector and year, respectively. The dependent
variable is the labour productivity represented by 𝑙𝑛(𝑌/𝐿). The first independent variable
is foreign presence, where 𝐹𝑃𝑖𝑗𝑡−1 represents the share of employment by foreign-owned
firms in total employment in each sector, the year before. Lagging this variable is aimed
at ensuring that in year 𝑡 of production for local firms, the new foreign-owned firms have
already been established. If there are benefits from FDI to local firms, the coefficient of
the variable would be positive, and that would indicate that the level of productivity of
firms is higher in industries where there was more presence of foreign owned firms the
year before.
The impcom variable means import competition and represents a possible knowledge
transfer channel from foreign-owned firms to local firms, which could have a positive
effect on the productivity of the latter. In addition, a measure of market concentration,
represented by a Herfindahl-Hirschman Index (HHI), is included to consider that the level
of competition in the domestic market is possibly correlated to the productivity of local
firms. A high HHI value indicates high concentration or relatively lower chance for
competition. A higher level of competition could mean either lower or higher margins to
benefit from spillovers, depending on the incentives and the capacity to use those (Farole
and Winkler, 2014[31]).
Similar to the competition issue, some industry dynamics could be more appealing to
foreign investors, who will probably choose to invest in sectors with better performance.
To control for this, as Haller (2014[2]) does, the growth rate for revenue at three-digit ISIC
level is included with a lag, to consider that the decision of investing today may be based
on information about the previous period.
Although this methodology has been widely applied, a limitation of estimating spillover
effects through the use of industry-level variables is that the coefficient will surely be
capturing a set of dynamics. For example, factors such as worker turnover or the
competition for resources in general, supply chain relationships (either backward or
forward linkages), may take place simultaneously, which makes it difficult to identify the
strongest mechanism for the transmission of spillovers. This work makes an important
contribution by using a variable of backward linkages and an alternative methodology to
identifying spillover effects on productivity from FDI.
Spillovers through backward linkages13
Backward linkages – that is, domestic firms supplying intermediate inputs to foreign
firms - may be the most likely channel through which spillovers will take place (Javorcik,
2004[21]). To know the effect that being a supplier has on the productivity of a local firm,
it would be ideal to observe its productivity, at the same time, in two scenarios: with the
supplier relationship and without it. Nevertheless, this is impossible.
13
The results for a specific industry do not mean that local firms in that industry were necessarily
transacting with foreign firms in that same industry. Results for business services firms mean local
business services firms supplying any foreign firm (regardless of industry).
2. FDI SPILLOVERS IN COSTA RICA: BOOSTING LOCAL PRODUCTIVITY THROUGH BACKWARD LINKAGES │ 51
OECD ECONOMIC SURVEY OF COSTA RICA: RESEARCH FINDINGS ON PRODUCTIVITY © OECD 2018
One way to represent it is by generating a counterfactual situation that simulates what
would have happened to the productivity of the supplier firms if they had not been
suppliers of foreign firms (Bernal and Pena, 2011[32]). Therefore, the productivity of non-
supplier firms could be taken and compared with that of the suppliers. However,
becoming a supplier is not a phenomenon that occurs randomly. Generally, firms must
have high-quality products and meet certain conditions and requirements in order to sell
their products to foreign firms (Javorcik and Spatareanu, 2009[33]). That is, self-selection
bias is an issue because supplier firms tend to be different from non-suppliers in certain
characteristics that could be associated with higher levels of productivity
To address this issue, we use the Propensity Score Matching (PSM) method that is
applied in observational studies to estimate causal effects (Rosenbaum and Rubin,
1983[34]). This method is based on certain observable characteristics of the units exposed
to the intervention to select units that are very similar in said characteristics, but that have
not been treated (“control group”), thus creating a counterfactual scenario (no
intervention). The relevant characteristics (“X”) are correlated with the outcome Y, but
not with the treatment. If the groups are, on average, similar in values of X, the difference
in Y can be attributed to the intervention. In this case, the units of analysis are the local
firms and the intervention or treatment is to be a supplier of foreign-owned firms. A
fundamental assumption for obtaining a good representation of the counterfactual is that
the treatment and control groups resemble each other not only in the observable
characteristics but also in the unobservable. A violation of this assumption would result in
a biased estimate of the effect of being a supplier on productivity.
The first step is to estimate the Propensity Score (PS) or the probability of each firm
being a supplier for the baseline year, that is, when none of the local firms has been a
supplier of a foreign-owned one. This would ensure compliance with the assumption of
unconfoundedness, which requires that the intervention does not affect X. However, the
data of transactions between companies do not indicate the date on which the business
relationship began, but only whether the relationship existed or not. This represents a
problem for firms that supplied from the first year they appeared registered in the
database, since it is not possible to identify a baseline for them. A total of 8,732 firms
have this condition and are ruled out of the PS estimate. The resulting sample consists of
21,730 unique firms (97,940 observations) of which 4,224 are the treated group and
17,506 are the untreated group. The treated group includes firms that reported sales to
foreign-owned firms at least one year from the second year that they appear registered
onwards, while the untreated group have firms that did not register sales to foreign-owned
firms for the whole period of analysis. The PS is estimated for this sample with variables
that each firm scored during the first year, mostly in 2008 (39%) and 2009 (10%).
A key assumption in the estimation of PS is the common support in the treated and
untreated groups, which requires the existence of positive probabilities and common areas
on the probability distribution of the two groups to guarantee that firms with the same X
values have a positive probability of being both participants and non-participants
(Caliendo and Kopeinig, 2008[35]).
To estimate the PS, a probability model is used where the dependent latent variable
is𝑆𝑢𝑝𝑝𝑙𝑖𝑒𝑟, a dichotomous variable that equals one if the local firm sold to foreign-
owned firms at least one year from 2009 onwards, or zero otherwise. 𝑆𝑢𝑝𝑝𝑙𝑖𝑒𝑟 is
determined by a set of independent variables that have not been affected by the treatment,
such as fixed factors or variables that are collected before treatment and correlated with
productivity. The probability model can be represented by Equation (2.4) next:
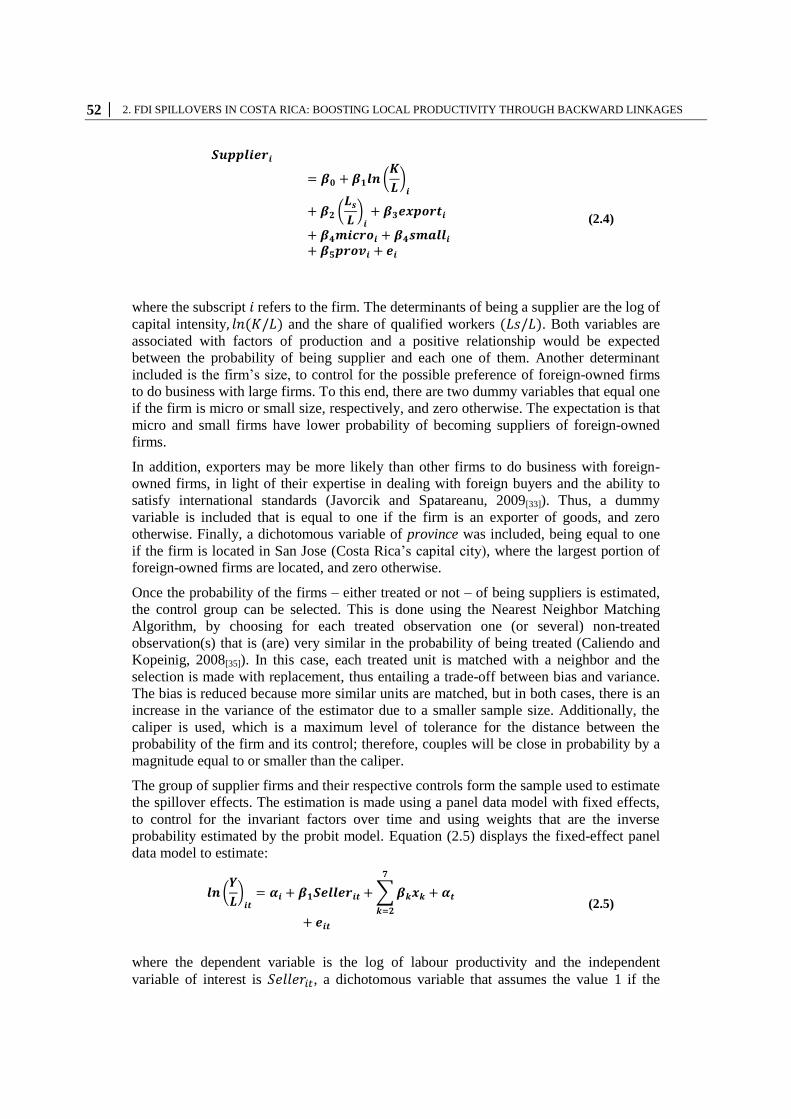
52 │ 2. FDI SPILLOVERS IN COSTA RICA: BOOSTING LOCAL PRODUCTIVITY THROUGH BACKWARD LINKAGES
𝑺𝒖𝒑𝒑𝒍𝒊𝒆𝒓𝒊
= 𝜷𝟎 + 𝜷𝟏𝒍𝒏 (𝑲
𝑳)𝒊
+ 𝜷𝟐 (𝑳𝒔
𝑳)𝒊+ 𝜷𝟑𝒆𝒙𝒑𝒐𝒓𝒕𝒊
+ 𝜷𝟒𝒎𝒊𝒄𝒓𝒐𝒊 + 𝜷𝟒𝒔𝒎𝒂𝒍𝒍𝒊+ 𝜷𝟓𝒑𝒓𝒐𝒗𝒊 + 𝒆𝒊
(2.4)
where the subscript 𝑖 refers to the firm. The determinants of being a supplier are the log of
capital intensity, 𝑙𝑛(𝐾/𝐿) and the share of qualified workers (𝐿𝑠/𝐿). Both variables are
associated with factors of production and a positive relationship would be expected
between the probability of being supplier and each one of them. Another determinant
included is the firm’s size, to control for the possible preference of foreign-owned firms
to do business with large firms. To this end, there are two dummy variables that equal one
if the firm is micro or small size, respectively, and zero otherwise. The expectation is that
micro and small firms have lower probability of becoming suppliers of foreign-owned
firms.
In addition, exporters may be more likely than other firms to do business with foreign-
owned firms, in light of their expertise in dealing with foreign buyers and the ability to
satisfy international standards (Javorcik and Spatareanu, 2009[33]). Thus, a dummy
variable is included that is equal to one if the firm is an exporter of goods, and zero
otherwise. Finally, a dichotomous variable of province was included, being equal to one
if the firm is located in San Jose (Costa Rica’s capital city), where the largest portion of
foreign-owned firms are located, and zero otherwise.
Once the probability of the firms – either treated or not – of being suppliers is estimated,
the control group can be selected. This is done using the Nearest Neighbor Matching
Algorithm, by choosing for each treated observation one (or several) non-treated
observation(s) that is (are) very similar in the probability of being treated (Caliendo and
Kopeinig, 2008[35]). In this case, each treated unit is matched with a neighbor and the
selection is made with replacement, thus entailing a trade-off between bias and variance.
The bias is reduced because more similar units are matched, but in both cases, there is an
increase in the variance of the estimator due to a smaller sample size. Additionally, the
caliper is used, which is a maximum level of tolerance for the distance between the
probability of the firm and its control; therefore, couples will be close in probability by a
magnitude equal to or smaller than the caliper.
The group of supplier firms and their respective controls form the sample used to estimate
the spillover effects. The estimation is made using a panel data model with fixed effects,
to control for the invariant factors over time and using weights that are the inverse
probability estimated by the probit model. Equation (2.5) displays the fixed-effect panel
data model to estimate:
𝒍𝒏 (𝒀
𝑳)𝒊𝒕
= 𝜶𝒊 + 𝜷𝟏𝑺𝒆𝒍𝒍𝒆𝒓𝒊𝒕 + ∑ 𝜷𝒌𝒙𝒌
𝟕
𝒌=𝟐
+ 𝜶𝒕
+ 𝒆𝒊𝒕
(2.5)
where the dependent variable is the log of labour productivity and the independent
variable of interest is 𝑆𝑒𝑙𝑙𝑒𝑟𝑖𝑡, a dichotomous variable that assumes the value 1 if the
2. FDI SPILLOVERS IN COSTA RICA: BOOSTING LOCAL PRODUCTIVITY THROUGH BACKWARD LINKAGES │ 53
OECD ECONOMIC SURVEY OF COSTA RICA: RESEARCH FINDINGS ON PRODUCTIVITY © OECD 2018
local firm sells in the respective year to a foreign-owned firm, and 0 otherwise. The
subscript 𝑘 indicates the number of control variables 𝑥 included in the panel regression
that are determinants of the probability of being a supplier (capital intensity, skilled
employment, two firm size dummies and exporting status) and industry-level variables
(import competition, concentration index and revenue growth). In addition, fixed effects
𝛼𝑖 and temporal effects 𝛼𝑡, are included, while 𝑒𝑖𝑡 is the error term.
Additionally, two variations of the variable of interest are considered: 𝑆𝑎𝑙𝑒𝑠𝑖𝑡, which is
the share of annual sales to foreign-owned firms; and 𝐷𝑜𝑠𝑎𝑔𝑒𝑖𝑡, a measure of the
frequency of being a supplier, which accumulates the number of years that a firm has sold
to foreign-owned firms (Monge-González and Rodríguez-Álvarez, 2013[8]).
Results
This section presents descriptive statistics that characterise the set of data used and the
estimation results obtained by applying panel data methods and PSM. The estimation
results are presented separately according to the independent variable of interest under
analysis – either foreign presence or backward linkages – and according to the productive
sector –manufacturing or services. Also, the results of the effects of backward linkages by
sub-sector are shown. Finally, the results of a robustness test are presented.
Descriptive statistics
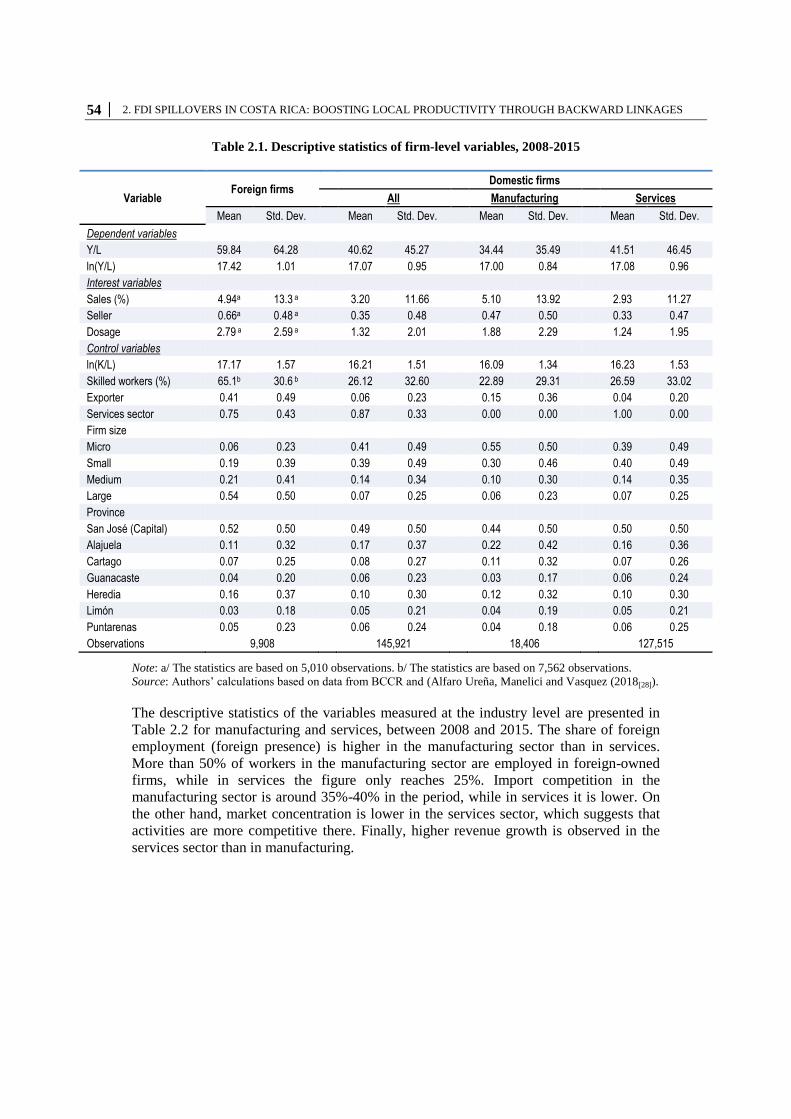
The descriptive statistics of the variables measured at the firm level are presented in
Table 2.1 for foreign-owned firms, as well as for manufacturing and services domestic
firms, over the 2008-2015 period. Foreign firms have about 47% higher productivity than
local firms. They also have a higher share of skilled employees and are larger on average,
as well as being more likely to export than local firms. Just over one half of foreign-
owned firms are located in San José, while 16% are located in Heredia –the province with
the largest presence of firms operating in Free Trade Zones in the country–, while Limón
is the province with the less presence.
Most of the domestic firms are micro or small (79%), belong to the services sector (87%)
and only a few are exporters (6%). Domestic services firms are on average more
productive than manufacturing firms14
, and have a higher share of skilled employment. In
turn, the participation of local manufacturing firms as suppliers of foreign-owned firms is
around 47%, while for services it is 33%.
14
Because the dataset includes formal firms only, it is likely excluding an considerable group of
small services firms with low productivity, that likely to at least partly, reflect of this result.
54 │ 2. FDI SPILLOVERS IN COSTA RICA: BOOSTING LOCAL PRODUCTIVITY THROUGH BACKWARD LINKAGES
Table 2.1. Descriptive statistics of firm-level variables, 2008-2015
Variable Foreign firms
Domestic firms
All
Manufacturing
Services
Mean Std. Dev. Mean Std. Dev. Mean Std. Dev. Mean Std. Dev.
Dependent variables
Y/L 59.84 64.28 40.62 45.27 34.44 35.49 41.51 46.45
ln(Y/L) 17.42 1.01 17.07 0.95 17.00 0.84 17.08 0.96
Interest variables
Sales (%) 4.94a 13.3 a 3.20 11.66 5.10 13.92 2.93 11.27
Seller 0.66a 0.48 a 0.35 0.48 0.47 0.50 0.33 0.47
Dosage 2.79 a 2.59 a 1.32 2.01 1.88 2.29 1.24 1.95
Control variables
ln(K/L) 17.17 1.57 16.21 1.51 16.09 1.34 16.23 1.53
Skilled workers (%) 65.1b 30.6 b 26.12 32.60 22.89 29.31 26.59 33.02
Exporter 0.41 0.49 0.06 0.23 0.15 0.36 0.04 0.20
Services sector 0.75 0.43 0.87 0.33 0.00 0.00 1.00 0.00
Firm size
Micro 0.06 0.23 0.41 0.49 0.55 0.50 0.39 0.49
Small 0.19 0.39 0.39 0.49 0.30 0.46 0.40 0.49
Medium 0.21 0.41 0.14 0.34 0.10 0.30 0.14 0.35
Large 0.54 0.50 0.07 0.25 0.06 0.23 0.07 0.25
Province
San José (Capital) 0.52 0.50 0.49 0.50 0.44 0.50 0.50 0.50
Alajuela 0.11 0.32 0.17 0.37 0.22 0.42 0.16 0.36
Cartago 0.07 0.25 0.08 0.27 0.11 0.32 0.07 0.26
Guanacaste 0.04 0.20 0.06 0.23 0.03 0.17 0.06 0.24
Heredia 0.16 0.37 0.10 0.30 0.12 0.32 0.10 0.30
Limón 0.03 0.18 0.05 0.21 0.04 0.19 0.05 0.21
Puntarenas 0.05 0.23 0.06 0.24 0.04 0.18 0.06 0.25
Observations 9,908
145,921
18,406
127,515
Note: a/ The statistics are based on 5,010 observations. b/ The statistics are based on 7,562 observations.
Source: Authors’ calculations based on data from BCCR and (Alfaro Ureña, Manelici and Vasquez (2018[28]).
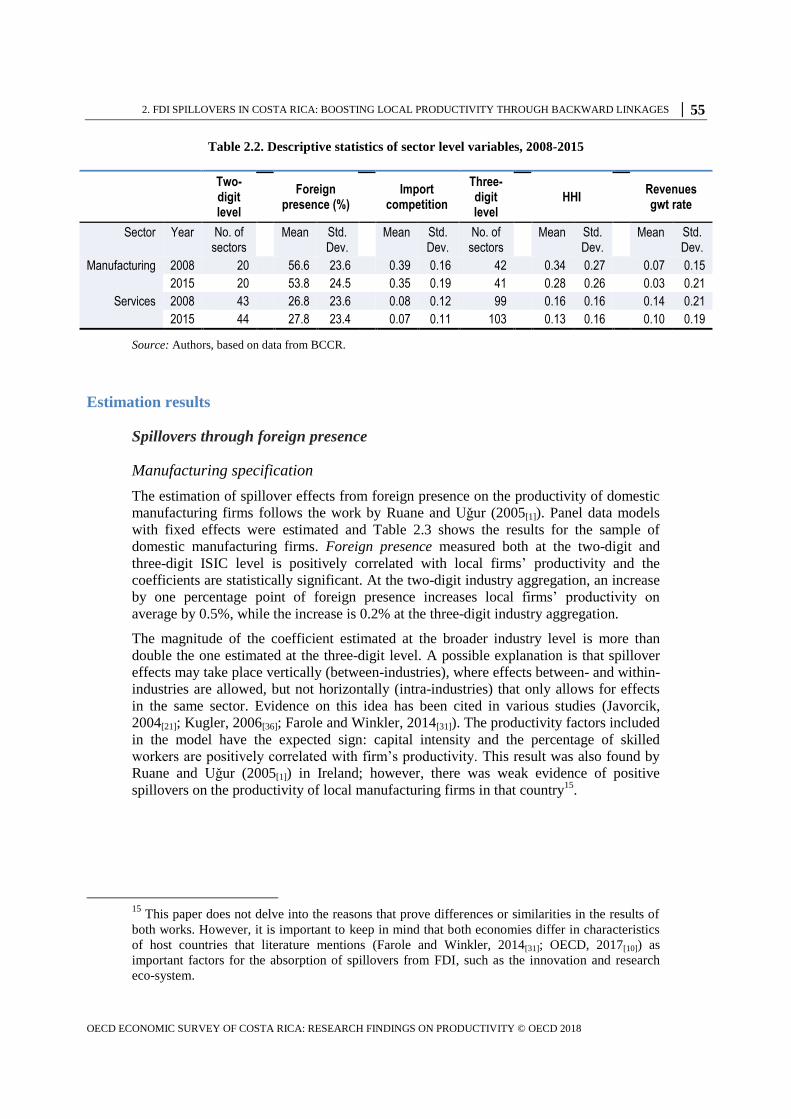
The descriptive statistics of the variables measured at the industry level are presented in
Table 2.2 for manufacturing and services, between 2008 and 2015. The share of foreign
employment (foreign presence) is higher in the manufacturing sector than in services.
More than 50% of workers in the manufacturing sector are employed in foreign-owned
firms, while in services the figure only reaches 25%. Import competition in the
manufacturing sector is around 35%-40% in the period, while in services it is lower. On
the other hand, market concentration is lower in the services sector, which suggests that
activities are more competitive there. Finally, higher revenue growth is observed in the
services sector than in manufacturing.
2. FDI SPILLOVERS IN COSTA RICA: BOOSTING LOCAL PRODUCTIVITY THROUGH BACKWARD LINKAGES │ 55
OECD ECONOMIC SURVEY OF COSTA RICA: RESEARCH FINDINGS ON PRODUCTIVITY © OECD 2018
Table 2.2. Descriptive statistics of sector level variables, 2008-2015
Two-digit level
Foreign presence (%)
Import competition
Three-digit level
HHI Revenues gwt rate
Sector Year No. of sectors
Mean Std. Dev.
Mean Std. Dev.
No. of sectors
Mean Std. Dev.
Mean Std. Dev.
Manufacturing 2008 20 56.6 23.6 0.39 0.16 42 0.34 0.27 0.07 0.15
2015 20 53.8 24.5 0.35 0.19 41 0.28 0.26 0.03 0.21
Services 2008 43 26.8 23.6 0.08 0.12 99 0.16 0.16 0.14 0.21
2015 44 27.8 23.4 0.07 0.11 103 0.13 0.16 0.10 0.19
Source: Authors, based on data from BCCR.
Estimation results
Spillovers through foreign presence
Manufacturing specification
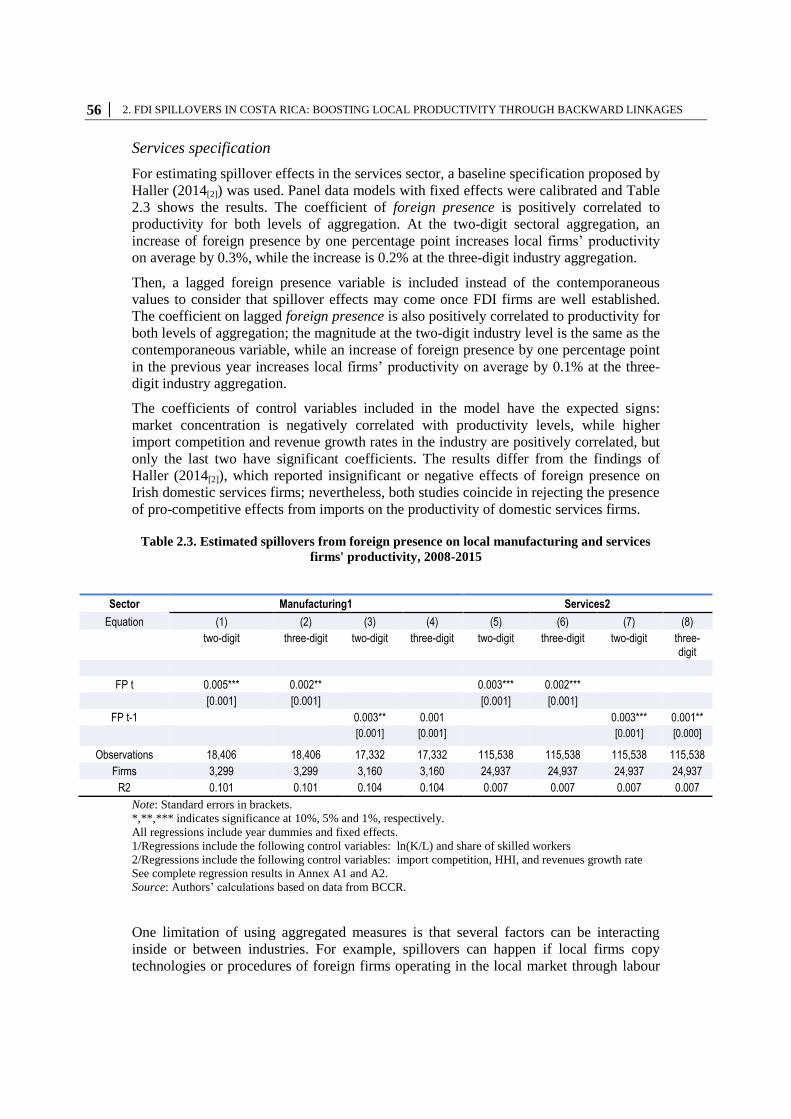
The estimation of spillover effects from foreign presence on the productivity of domestic
manufacturing firms follows the work by Ruane and Uǧur (2005[1]). Panel data models
with fixed effects were estimated and Table 2.3 shows the results for the sample of
domestic manufacturing firms. Foreign presence measured both at the two-digit and
three-digit ISIC level is positively correlated with local firms’ productivity and the
coefficients are statistically significant. At the two-digit industry aggregation, an increase
by one percentage point of foreign presence increases local firms’ productivity on
average by 0.5%, while the increase is 0.2% at the three-digit industry aggregation.
The magnitude of the coefficient estimated at the broader industry level is more than
double the one estimated at the three-digit level. A possible explanation is that spillover
effects may take place vertically (between-industries), where effects between- and within-
industries are allowed, but not horizontally (intra-industries) that only allows for effects
in the same sector. Evidence on this idea has been cited in various studies (Javorcik,
2004[21]; Kugler, 2006[36]; Farole and Winkler, 2014[31]). The productivity factors included
in the model have the expected sign: capital intensity and the percentage of skilled
workers are positively correlated with firm’s productivity. This result was also found by
Ruane and Uǧur (2005[1]) in Ireland; however, there was weak evidence of positive
spillovers on the productivity of local manufacturing firms in that country15
.
15
This paper does not delve into the reasons that prove differences or similarities in the results of
both works. However, it is important to keep in mind that both economies differ in characteristics
of host countries that literature mentions (Farole and Winkler, 2014[31]; OECD, 2017[10]) as
important factors for the absorption of spillovers from FDI, such as the innovation and research
eco-system.
56 │ 2. FDI SPILLOVERS IN COSTA RICA: BOOSTING LOCAL PRODUCTIVITY THROUGH BACKWARD LINKAGES
Services specification
For estimating spillover effects in the services sector, a baseline specification proposed by
Haller (2014[2]) was used. Panel data models with fixed effects were calibrated and Table
2.3 shows the results. The coefficient of foreign presence is positively correlated to
productivity for both levels of aggregation. At the two-digit sectoral aggregation, an
increase of foreign presence by one percentage point increases local firms’ productivity
on average by 0.3%, while the increase is 0.2% at the three-digit industry aggregation.
Then, a lagged foreign presence variable is included instead of the contemporaneous
values to consider that spillover effects may come once FDI firms are well established.
The coefficient on lagged foreign presence is also positively correlated to productivity for
both levels of aggregation; the magnitude at the two-digit industry level is the same as the
contemporaneous variable, while an increase of foreign presence by one percentage point
in the previous year increases local firms’ productivity on average by 0.1% at the three-
digit industry aggregation.
The coefficients of control variables included in the model have the expected signs:
market concentration is negatively correlated with productivity levels, while higher
import competition and revenue growth rates in the industry are positively correlated, but
only the last two have significant coefficients. The results differ from the findings of
Haller (2014[2]), which reported insignificant or negative effects of foreign presence on
Irish domestic services firms; nevertheless, both studies coincide in rejecting the presence
of pro-competitive effects from imports on the productivity of domestic services firms.
Table 2.3. Estimated spillovers from foreign presence on local manufacturing and services
firms' productivity, 2008-2015
Note: Standard errors in brackets.
*,**,*** indicates significance at 10%, 5% and 1%, respectively.
All regressions include year dummies and fixed effects.
1/Regressions include the following control variables: ln(K/L) and share of skilled workers
2/Regressions include the following control variables: import competition, HHI, and revenues growth rate
See complete regression results in Annex A1 and A2.
Source: Authors’ calculations based on data from BCCR.
One limitation of using aggregated measures is that several factors can be interacting
inside or between industries. For example, spillovers can happen if local firms copy
technologies or procedures of foreign firms operating in the local market through labour
Sector Manufacturing1 Services2
Equation (1) (2) (3) (4) (5) (6) (7) (8)
two-digit three-digit two-digit three-digit two-digit three-digit two-digit three-digit
FP t 0.005*** 0.002** 0.003*** 0.002***
[0.001] [0.001] [0.001] [0.001]
FP t-1 0.003** 0.001 0.003*** 0.001**
[0.001] [0.001] [0.001] [0.000]
Observations 18,406 18,406 17,332 17,332 115,538 115,538 115,538 115,538
Firms 3,299 3,299 3,160 3,160 24,937 24,937 24,937 24,937
R2 0.101 0.101 0.104 0.104 0.007 0.007 0.007 0.007
2. FDI SPILLOVERS IN COSTA RICA: BOOSTING LOCAL PRODUCTIVITY THROUGH BACKWARD LINKAGES │ 57
OECD ECONOMIC SURVEY OF COSTA RICA: RESEARCH FINDINGS ON PRODUCTIVITY © OECD 2018
turnover. In addition, a higher presence of foreign firms may deliver more linkages and
learning-by-observation, but also more competition for local resources that push local
firms to use more efficiently their resources (Javorcik, 2004[21]). As many of these
behaviors can happen at the same time, it is difficult to identify clearly from this result
how the presence of FDI firms improves the productivity of local firms. Therefore, this
work goes further by studying spillover effects through business relationships, using
transaction data between local Costa Rican firms and foreign-owned firms operating the
country. In addition to the work by Alfaro Ureña, Manelici and Vasquez (2018[28]), this is
one of the first research efforts that exploits this type of information for Costa Rica, and
which is a novel method internationally.
Spillovers through backward linkages
To identify the spillover effects of FDI presence on local firms’ productivity, the PSM
method and fixed effects regressions are used. Separate estimation of the effects for
manufacturing and services sectors are carried out, as well as for the industries
comprising these sectors.
Manufacturing sector
The manufacturing sector sample consists of 1,931 domestic firms, out of which 490 were
suppliers of foreign-owned firms at least once between 2009 and 2015. Based on this
sample, the PS is estimated using a probit model for the baseline year (the first year that
the companies were not suppliers, which is 2008 for about one half of the cases). The PS
estimate (see Annex A4, column 1) suggests that the intensity of capital, the percentage
of qualified employees and exporting status are positively related to the probability of
being a supplier, while micro and small sizes of firms are less likely to be suppliers
compared with larger firms. Both suppliers and non-suppliers have firms with a positive
probability of being a provider, so the assumption of common support is fulfilled (see
Annex A5). Similarity was verified, as the two groups exhibited similar averages for each
variable after the matching process (See Annex A6, column 1).
The matching of each supplier firm with the most similar non-supplier results in a sample
of 755 firms, 421 treated and 334 control, with all of them being comparable. However,
the panel model includes 4,014 observations from 737 unique firms due to the loss of
observations by the inclusion of lagged industries variables to control for the effects of
competition and growth in the industries. The results can be seen in Table 2.4. The
coefficient of being a supplier is positive and statistically significant; it suggests that local
supplying firms increase their labour productivity on average by 8% when selling to
foreign-owned firms (See Table 2.4, column 1). The lagged supplier coefficient is not
significant, which implies that supplying foreign-owned firms one year ago does not seem
to impact current productivity (See Table 2.4, column 2). A possible hypothesis to
explain this result is that, in order to become suppliers, local companies have to make a
series of adjustments that occur at the beginning of the relationship and that may be the
cause of a contemporaneous increase in productivity. By the other side, international
evidence on transmission channels suggests that productivity increases correspond to
demand effects (Farole and Winkler, 2014[31]). However, evaluating the channels through
which the increase in productivity takes place goes beyond the scope of this study and is,
therefore, a future line of research on the matter.
Additionally, two different measurements of the transaction variable are tested: the share
of sales to FDI firms and the dosage. However, the coefficients were not statistically
58 │ 2. FDI SPILLOVERS IN COSTA RICA: BOOSTING LOCAL PRODUCTIVITY THROUGH BACKWARD LINKAGES
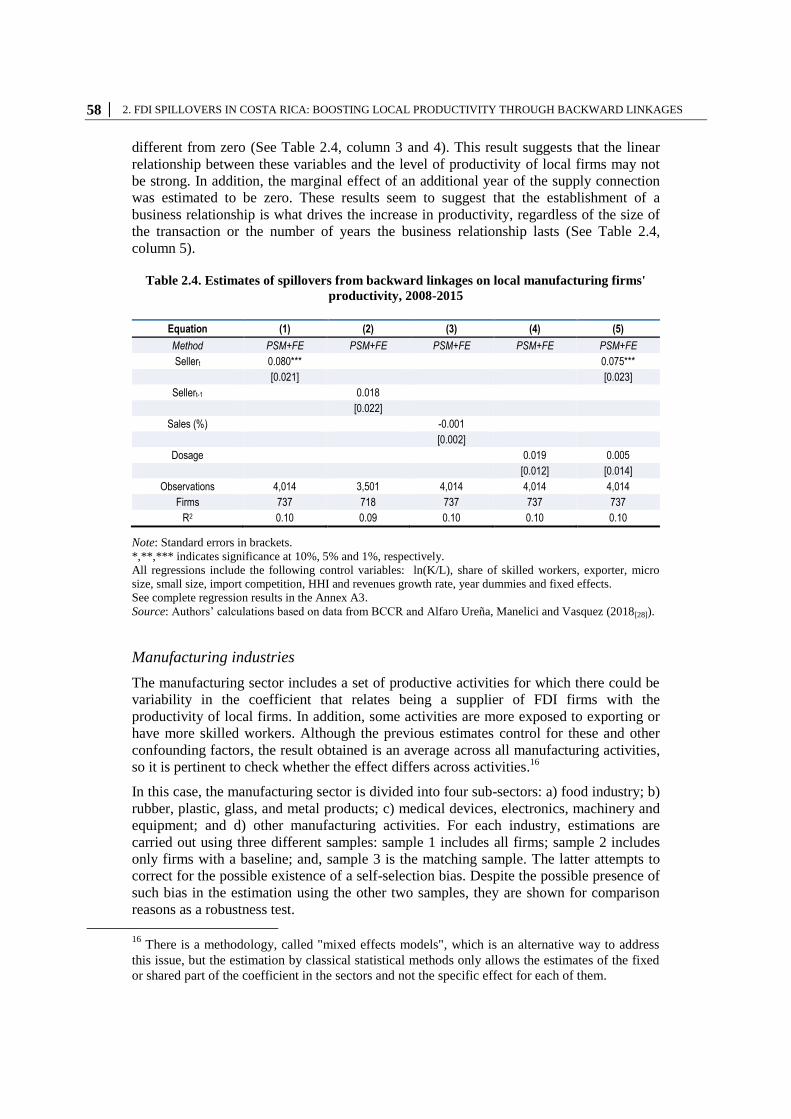
different from zero (See Table 2.4, column 3 and 4). This result suggests that the linear
relationship between these variables and the level of productivity of local firms may not
be strong. In addition, the marginal effect of an additional year of the supply connection
was estimated to be zero. These results seem to suggest that the establishment of a
business relationship is what drives the increase in productivity, regardless of the size of
the transaction or the number of years the business relationship lasts (See Table 2.4,
column 5).
Table 2.4. Estimates of spillovers from backward linkages on local manufacturing firms'
productivity, 2008-2015
Equation (1) (2) (3) (4) (5) Method PSM+FE PSM+FE PSM+FE PSM+FE PSM+FE Sellert 0.080*** 0.075***
[0.021] [0.023] Sellert-1 0.018
[0.022] Sales (%) -0.001
[0.002] Dosage 0.019 0.005
[0.012] [0.014] Observations 4,014 3,501 4,014 4,014 4,014
Firms 737 718 737 737 737 R2 0.10 0.09 0.10 0.10 0.10
Note: Standard errors in brackets.
*,**,*** indicates significance at 10%, 5% and 1%, respectively.
All regressions include the following control variables: ln(K/L), share of skilled workers, exporter, micro
size, small size, import competition, HHI and revenues growth rate, year dummies and fixed effects.
See complete regression results in the Annex A3.
Source: Authors’ calculations based on data from BCCR and Alfaro Ureña, Manelici and Vasquez (2018[28]).
Manufacturing industries
The manufacturing sector includes a set of productive activities for which there could be
variability in the coefficient that relates being a supplier of FDI firms with the
productivity of local firms. In addition, some activities are more exposed to exporting or
have more skilled workers. Although the previous estimates control for these and other
confounding factors, the result obtained is an average across all manufacturing activities,
so it is pertinent to check whether the effect differs across activities.16
In this case, the manufacturing sector is divided into four sub-sectors: a) food industry; b)
rubber, plastic, glass, and metal products; c) medical devices, electronics, machinery and
equipment; and d) other manufacturing activities. For each industry, estimations are
carried out using three different samples: sample 1 includes all firms; sample 2 includes
only firms with a baseline; and, sample 3 is the matching sample. The latter attempts to
correct for the possible existence of a self-selection bias. Despite the possible presence of
such bias in the estimation using the other two samples, they are shown for comparison
reasons as a robustness test.
16
There is a methodology, called "mixed effects models", which is an alternative way to address
this issue, but the estimation by classical statistical methods only allows the estimates of the fixed
or shared part of the coefficient in the sectors and not the specific effect for each of them.
2. FDI SPILLOVERS IN COSTA RICA: BOOSTING LOCAL PRODUCTIVITY THROUGH BACKWARD LINKAGES │ 59
OECD ECONOMIC SURVEY OF COSTA RICA: RESEARCH FINDINGS ON PRODUCTIVITY © OECD 2018
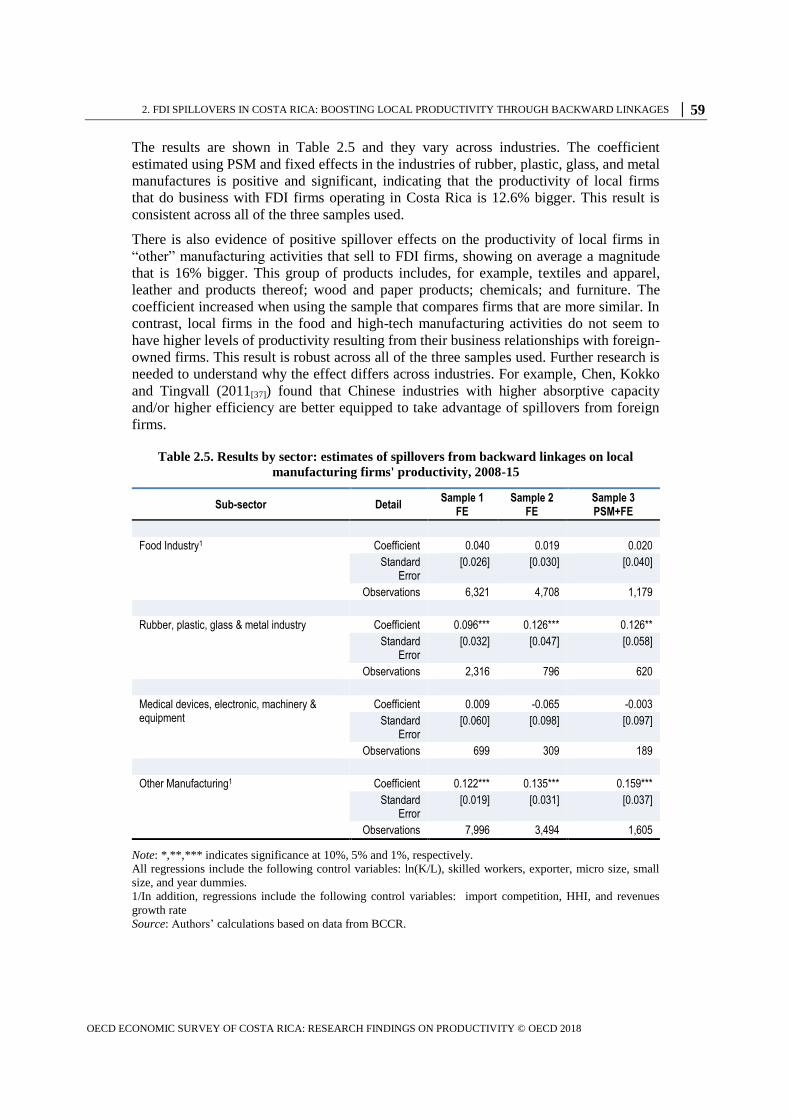
The results are shown in Table 2.5 and they vary across industries. The coefficient
estimated using PSM and fixed effects in the industries of rubber, plastic, glass, and metal
manufactures is positive and significant, indicating that the productivity of local firms
that do business with FDI firms operating in Costa Rica is 12.6% bigger. This result is
consistent across all of the three samples used.
There is also evidence of positive spillover effects on the productivity of local firms in
“other” manufacturing activities that sell to FDI firms, showing on average a magnitude
that is 16% bigger. This group of products includes, for example, textiles and apparel,
leather and products thereof; wood and paper products; chemicals; and furniture. The
coefficient increased when using the sample that compares firms that are more similar. In
contrast, local firms in the food and high-tech manufacturing activities do not seem to
have higher levels of productivity resulting from their business relationships with foreign-
owned firms. This result is robust across all of the three samples used. Further research is
needed to understand why the effect differs across industries. For example, Chen, Kokko
and Tingvall (2011[37]) found that Chinese industries with higher absorptive capacity
and/or higher efficiency are better equipped to take advantage of spillovers from foreign
firms.
Table 2.5. Results by sector: estimates of spillovers from backward linkages on local
manufacturing firms' productivity, 2008-15
Sub-sector Detail Sample 1
FE Sample 2
FE Sample 3 PSM+FE
Food Industry1 Coefficient 0.040 0.019 0.020
Standard Error
[0.026] [0.030] [0.040]
Observations 6,321 4,708 1,179
Rubber, plastic, glass & metal industry Coefficient 0.096*** 0.126*** 0.126**
Standard Error
[0.032] [0.047] [0.058]
Observations 2,316 796 620
Medical devices, electronic, machinery & equipment
Coefficient 0.009 -0.065 -0.003
Standard Error
[0.060] [0.098] [0.097]
Observations 699 309 189
Other Manufacturing1 Coefficient 0.122*** 0.135*** 0.159***
Standard Error
[0.019] [0.031] [0.037]
Observations 7,996 3,494 1,605
Note: *,**,*** indicates significance at 10%, 5% and 1%, respectively.
All regressions include the following control variables: ln(K/L), skilled workers, exporter, micro size, small
size, and year dummies.
1/In addition, regressions include the following control variables: import competition, HHI, and revenues
growth rate
Source: Authors’ calculations based on data from BCCR.
60 │ 2. FDI SPILLOVERS IN COSTA RICA: BOOSTING LOCAL PRODUCTIVITY THROUGH BACKWARD LINKAGES
Services sector
The services sample consists of 19,794 domestic firms out of which 3,729 are suppliers of
FDI firms at least once between 2009 and 2015. Based on this sample, the PS is estimated
using a probit model for the baseline year (the first year that the firms were not suppliers,
which was 2008 in 37% of the cases and around 9% for each of the other years of the
period considered). The PS estimate (see Annex A4, column 2) suggests that the intensity
of capital, the percentage of qualified employees and being located in San José are
positively related to the probability of being a supplier, while micro and small firms are
less likely to be suppliers than larger firms. Both suppliers and non-suppliers have firms
with a positive probability of being a provider, so the assumption of common support is
fulfilled (see Annex A7). Again, the treatment and control group created from the
matching procedure have similar averages for each variable (See Annex 6, column 2).
The matching of each supplier firm with the most similar non-supplier results in a sample
of 6,805 businesses, out of which 3,734 are treated and 3,076 are controls, all of them
with common support. However, the panel model includes 32,458 observations from
6,471 unique firms due to the loss of observations in the inclusion of lagged sector
variables to control for the effects of competition and growth in the sectors. The results
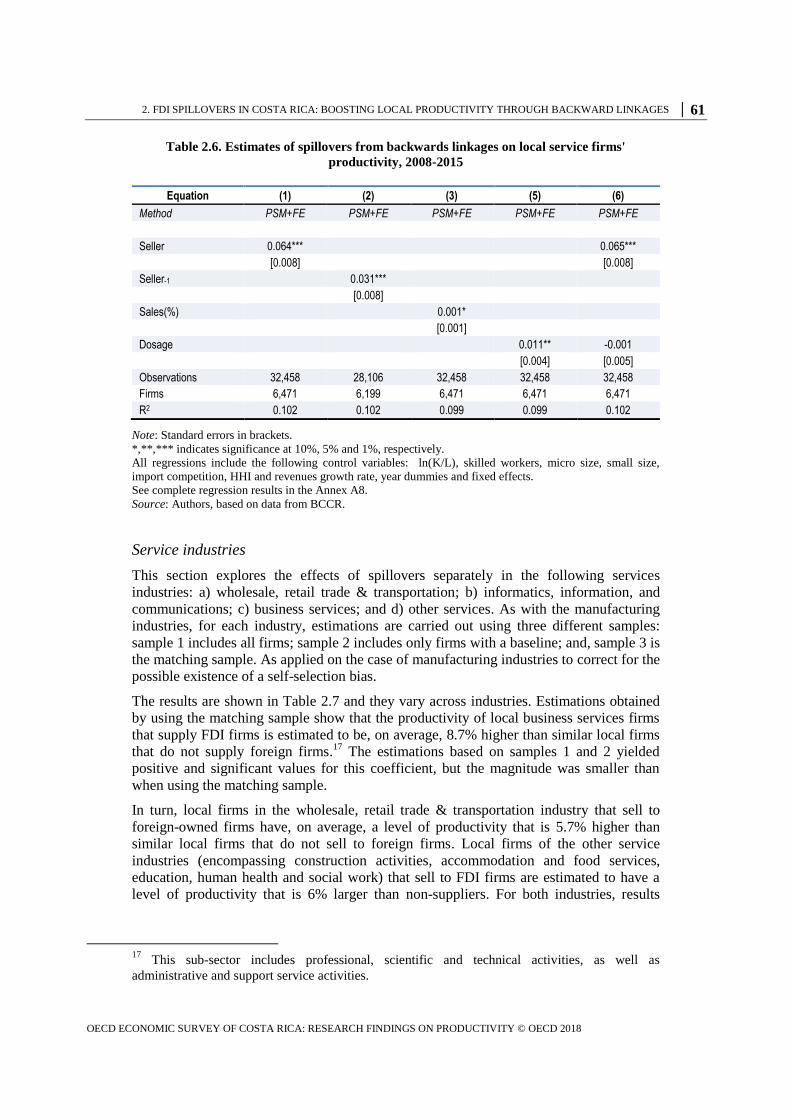
are shown in Table 2.6. The coefficient associated with being a supplier is positive and
statistically significant. This suggests that the labour productivity of local firms that sell
to foreign-owned ones is on average 6.4% higher than the productivity of similar local
firms that do not supply foreign firms (See Table 2.6, column 1). The coefficient of the
lagged variable is also significant, which implies that supplying foreign-owned firms one
year ago pushes local firm’s current productivity upwards by 3.1% (See Table 2.6,
column 2).
In addition, different measurements of the variable of interest are tested (the share of sales
to FDI firms and the cumulative number of years that a local firm supplied a foreign
firm), although there is evidence of a rather modest effect for both. The results suggest
that, other factors equal, for a 1% increase of local services firms’ sales to foreign-owned
firms, the productivity of the former increases by 0.1%. The continuation of the
relationship for an additional year seems to increase productivity by 1.1%, but this effect
becomes insignificant when the dummy seller variable (capturing whether or not the local
firm supplies a foreign firm in any year) is included in the regression, which indicates that
there is no marginal effect of an additional year on the supply relationship. The results
seem to suggest that the establishment of the relationship is what is generating the
increase in productivity, regardless of the size of the transaction or the number of years
the relationship lasts.
2. FDI SPILLOVERS IN COSTA RICA: BOOSTING LOCAL PRODUCTIVITY THROUGH BACKWARD LINKAGES │ 61
OECD ECONOMIC SURVEY OF COSTA RICA: RESEARCH FINDINGS ON PRODUCTIVITY © OECD 2018
Table 2.6. Estimates of spillovers from backwards linkages on local service firms'
productivity, 2008-2015
Equation (1) (2) (3) (5) (6)
Method PSM+FE PSM+FE PSM+FE PSM+FE PSM+FE
Seller 0.064*** 0.065***
[0.008] [0.008]
Seller-1 0.031***
[0.008]
Sales(%) 0.001*
[0.001]
Dosage 0.011** -0.001
[0.004] [0.005]
Observations 32,458 28,106 32,458 32,458 32,458
Firms 6,471 6,199 6,471 6,471 6,471
R2 0.102 0.102 0.099 0.099 0.102
Note: Standard errors in brackets.
*,**,*** indicates significance at 10%, 5% and 1%, respectively.
All regressions include the following control variables: ln(K/L), skilled workers, micro size, small size,
import competition, HHI and revenues growth rate, year dummies and fixed effects.
See complete regression results in the Annex A8.
Source: Authors, based on data from BCCR.
Service industries
This section explores the effects of spillovers separately in the following services
industries: a) wholesale, retail trade & transportation; b) informatics, information, and
communications; c) business services; and d) other services. As with the manufacturing
industries, for each industry, estimations are carried out using three different samples:
sample 1 includes all firms; sample 2 includes only firms with a baseline; and, sample 3 is
the matching sample. As applied on the case of manufacturing industries to correct for the
possible existence of a self-selection bias.
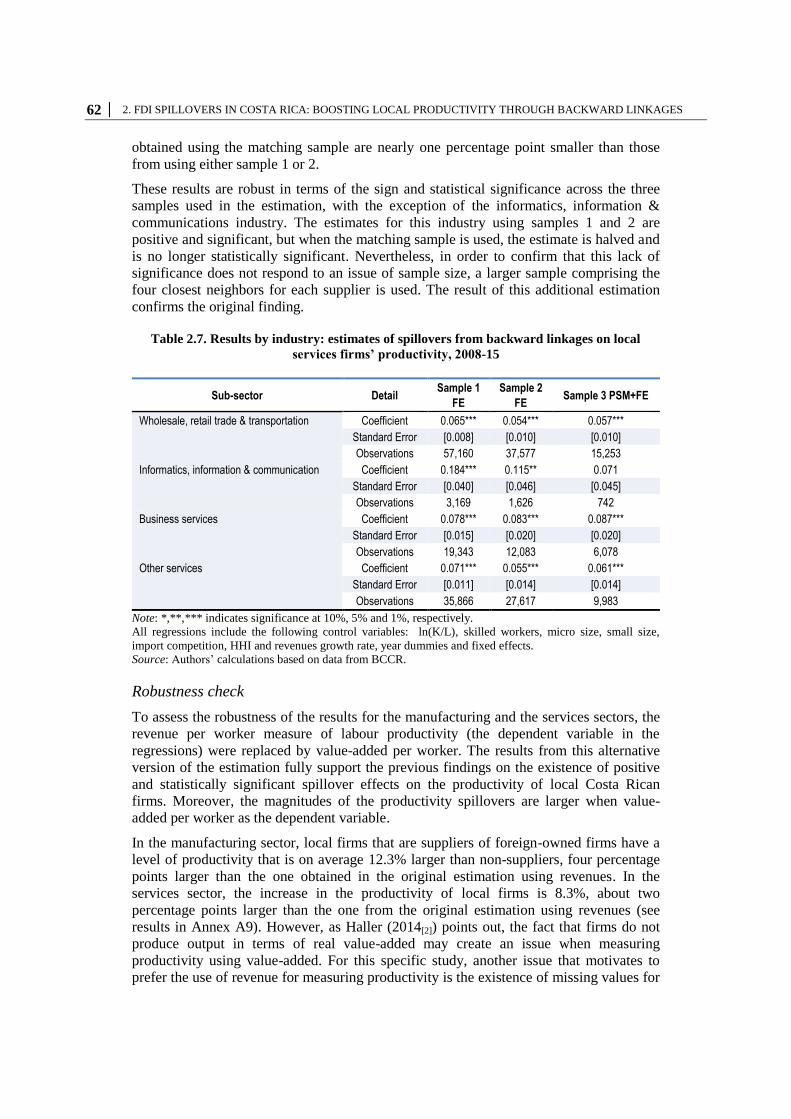
The results are shown in Table 2.7 and they vary across industries. Estimations obtained
by using the matching sample show that the productivity of local business services firms
that supply FDI firms is estimated to be, on average, 8.7% higher than similar local firms
that do not supply foreign firms.17
The estimations based on samples 1 and 2 yielded
positive and significant values for this coefficient, but the magnitude was smaller than
when using the matching sample.
In turn, local firms in the wholesale, retail trade & transportation industry that sell to
foreign-owned firms have, on average, a level of productivity that is 5.7% higher than
similar local firms that do not sell to foreign firms. Local firms of the other service
industries (encompassing construction activities, accommodation and food services,
education, human health and social work) that sell to FDI firms are estimated to have a
level of productivity that is 6% larger than non-suppliers. For both industries, results
17
This sub-sector includes professional, scientific and technical activities, as well as
administrative and support service activities.
62 │ 2. FDI SPILLOVERS IN COSTA RICA: BOOSTING LOCAL PRODUCTIVITY THROUGH BACKWARD LINKAGES
obtained using the matching sample are nearly one percentage point smaller than those
from using either sample 1 or 2.
These results are robust in terms of the sign and statistical significance across the three
samples used in the estimation, with the exception of the informatics, information &
communications industry. The estimates for this industry using samples 1 and 2 are
positive and significant, but when the matching sample is used, the estimate is halved and
is no longer statistically significant. Nevertheless, in order to confirm that this lack of
significance does not respond to an issue of sample size, a larger sample comprising the
four closest neighbors for each supplier is used. The result of this additional estimation
confirms the original finding.
Table 2.7. Results by industry: estimates of spillovers from backward linkages on local
services firms’ productivity, 2008-15
Sub-sector Detail Sample 1
FE
Sample 2
FE Sample 3 PSM+FE
Wholesale, retail trade & transportation Coefficient 0.065*** 0.054*** 0.057***
Standard Error [0.008] [0.010] [0.010]
Observations 57,160 37,577 15,253
Informatics, information & communication Coefficient 0.184*** 0.115** 0.071
Standard Error [0.040] [0.046] [0.045]
Observations 3,169 1,626 742
Business services Coefficient 0.078*** 0.083*** 0.087***
Standard Error [0.015] [0.020] [0.020]
Observations 19,343 12,083 6,078
Other services Coefficient 0.071*** 0.055*** 0.061***
Standard Error [0.011] [0.014] [0.014]
Observations 35,866 27,617 9,983
Note: *,**,*** indicates significance at 10%, 5% and 1%, respectively.
All regressions include the following control variables: ln(K/L), skilled workers, micro size, small size,
import competition, HHI and revenues growth rate, year dummies and fixed effects.
Source: Authors’ calculations based on data from BCCR.
Robustness check
To assess the robustness of the results for the manufacturing and the services sectors, the
revenue per worker measure of labour productivity (the dependent variable in the
regressions) were replaced by value-added per worker. The results from this alternative
version of the estimation fully support the previous findings on the existence of positive
and statistically significant spillover effects on the productivity of local Costa Rican
firms. Moreover, the magnitudes of the productivity spillovers are larger when value-
added per worker as the dependent variable.
In the manufacturing sector, local firms that are suppliers of foreign-owned firms have a
level of productivity that is on average 12.3% larger than non-suppliers, four percentage
points larger than the one obtained in the original estimation using revenues. In the
services sector, the increase in the productivity of local firms is 8.3%, about two
percentage points larger than the one from the original estimation using revenues (see
results in Annex A9). However, as Haller (2014[2]) points out, the fact that firms do not
produce output in terms of real value-added may create an issue when measuring
productivity using value-added. For this specific study, another issue that motivates to
prefer the use of revenue for measuring productivity is the existence of missing values for
2. FDI SPILLOVERS IN COSTA RICA: BOOSTING LOCAL PRODUCTIVITY THROUGH BACKWARD LINKAGES │ 63
OECD ECONOMIC SURVEY OF COSTA RICA: RESEARCH FINDINGS ON PRODUCTIVITY © OECD 2018
value-added, due to lack of information on costs of production for several firms (as noted
in Chapter 4).
Limitations
The criteria used to define the treated group may be inaccurate for firms that were
suppliers before the first year of the period considered, then suspended their sales at some
point in time and resumed them in a year after 2008. For these cases, the determinants of
being a supplier would be affected by the treatment, which would violate the assumption
of unconfoundedness. Then, the matching will look for non-supplying firms with a high
probability of being a supplier and, possibly, with high levels of productivity, which
would generate a downward-biased estimator of the productivity spillover stemming from
being a supplier. One out of every six local supplying firms (16.8% to be precise) was
found to resume its activity as a supplier of FDI firms over the 2009-2015 period. If a
similar incidence is expected to happen for the years before 2008, the possible bias of the
spillover estimates may be a relevant issue.
However, a new stream of work in progress by Alfaro Ureña, Manelici and Vasquez
(2018[28]) identifies the first year of a transactions between local firms and the foreign-
owned ones. The authors are measuring the changes in the productivity, size, and
exposure to the foreign market of local firms with an event study design, in which the
event is the first interaction with a foreign firm. Preliminary findings from this research
suggest that local firms expand and adjust their production process after becoming a first-
time supplier to a foreign firm. In addition, they find evidence that these firms experience
sizable and persistent productivity gains, which lends support to the findings of our study.
The authors also find evidence of gains for the other clients of the foreign firms, which is
suggestive of spillovers to other firms.
Finally, the structure of the unbalanced panel data used and the variability across firms in
the first year of the business relationship means that the baseline corresponds to different
moments in time across firms. Therefore, the estimated probability of being a supplier
does not correspond to the same year for all companies. Approximately, 40% of the
companies have a baseline in 2008, a bit less than 9% in each year between 2009 and
2014, and 7% in 2015. If the probabilities of being a supplier change over time, there
could be a bias due to the matching of different units in the same moment in time.
Conclusions
Costa Rica is an economy that has been able to combine its foreign trade policy with a
successful FDI attraction policy, which together have led to a deep and rapid structural
transformation of the economy. However, some sectors have not been able to benefit
much from such change. In fact, Costa Rican local firms are characterized by two
different levels of performance, as some of them are fully integrated in international
markets and the other do not have the capabilities needed for such integration.
As a general fact from data, it is confirmed that foreign-owned firms operating in Costa
Rica are different from local firms. The former has higher productivity than the latter.
FDI firms also have a higher share of qualified employees, are larger, and have greater
participation in exporting activities. The prevalence of foreign firms is greater in the
manufacturing sector than the services sector. FDI manufacturing firms account for
64 │ 2. FDI SPILLOVERS IN COSTA RICA: BOOSTING LOCAL PRODUCTIVITY THROUGH BACKWARD LINKAGES
nearly half of formal employment in the manufacturing sector, compared with only one
quarter in the services sector.
This study first applied an industry-level measure of the presence of foreign-owned firms
to examine whether spillovers from foreign investment has a positive impact on the
productivity of local firms. We found evidence that the presence of foreign firms is
positively correlated with the productivity of local Costa Rican firms in both the
manufacturing and the services sectors. This contrasts Ruane and Uǧur (2005[1]) and
Haller (2014[2]), which found insignificant or even negative spillover effects from
foreign-owned firms to local Irish firms in the manufacturing and services sectors
respectively. We also found that a lagged measure of foreign presence was positively
correlated to the current productivity of local firms, but that the magnitude was smaller
than the contemporaneous effect. Also, using a more aggregated measure of foreign
presence gives a larger estimate of spillover effects. One possible hypothesis to explain
this is that spillover effects may take place vertically (between-industries) as well as
horizontally (intra-industries).
We then applied a more novel approach, which involved measuring the direct supplier
relationship from local to foreign firms using data on firm-to-firm transactions. Our
analysis of spillovers through these backward linkages revealed a positive and statistically
significant correlation between the existence of business relationships with FDI firms and
the productivity of their domestic suppliers, using propensity score matching techniques
to mitigate self-selection bias. In the manufacturing sector, the local supplying firms
have, on average, 8% higher labour productivity than those that do not have business
relations with foreign-owned firms. However, being a provider of foreign-owned firms
the year before does not seem to affect current productivity. A possible hypothesis to
explain this result is that, in order to become suppliers, local companies have to make a
series of adjustments that occur at the beginning of the relationship and that may be the
cause of an increase in productivity. In the services sector, local firms that are suppliers
of foreign-owned firms have, on average, 6.4% higher labour productivity than those
that do not have business relations with foreign-owned firms. However, in this case being
a supplier of FDI firms the year before was found to increase current productivity, but in
a smaller magnitude than the contemporaneous effect. These results suggest that the
establishment of the business relationship with FDI firms is what is driving the increase
in productivity, regardless of the size of transactions or the number of years the
relationship lasts.
The results vary across industries, both in the manufacturing and services sectors. The
estimated productivity spillover effect is positive for local firms in the industries of
rubber, plastic, glass, metal, and “other” manufacturing industries. Food industry local
firms and those in high-tech manufacturing do not seem to increase their productivity as a
result of being providers of FDI firms. Local business services firms seem to have the
strongest productivity spillover effect among services firms. For the activities of
wholesale, retail trade & transportation, and other services, there is a positive productivity
spillover effect from sales to foreign-owned firms. However, local firms in the
informatics, information & communications industry do not seem to enjoy productivity
spillover effects from such transactions.
In addition to the variability of the effects across sub-sectors, the heterogeneity of firms’
characteristics may play an important role in the observance of spillover effects from FDI
firms (Crescenzi, Gagliardi and Iammarino, 2015[38]). For example, firms that are more
integrated in foreign trade or that bear a higher level of skilled workers may have a
2. FDI SPILLOVERS IN COSTA RICA: BOOSTING LOCAL PRODUCTIVITY THROUGH BACKWARD LINKAGES │ 65
OECD ECONOMIC SURVEY OF COSTA RICA: RESEARCH FINDINGS ON PRODUCTIVITY © OECD 2018
different level of absorption capacity than other firms. Although this hypothesis was not
directly tested in this work, the results by splitting the analysis in sub-sectors suggests
that high-tech sectors, characterized for being exporters and hiring highly skilled workers,
have less room to benefit from FDI spillovers.
The main finding of this work is that FDI firms have the capacity to generate spillovers
on local firms’ productivity. However, taking advantage of it may depend at least on two
factors: the links between the local economy with FDI firms, and the local firm
characteristics. Therefore, it seems to be crucial identify those characteristics of local
firms that allows to take advantages from linkages the most. A non-negligible number of
firms are related to foreign-owned firms, but Costa Rica's dilemma is to make this
foreign-related apparatus expand to the rest of the economy. This reaffirms the need to
continue strengthening FDI attraction strategy, and the programs for local firms to link.
A robustness check was conducted by using value-added per worker instead of revenue
when computing the dependent variable of the regressions. The results confirmed in all
cases the original results, thus providing stronger grounds to document the existence of
positive and statistically significant productivity spillovers from FDI firms operating in
Costa Rica to the domestic firms. The estimated magnitudes of the spillover effect were
even bigger when using value-added, but the fact that firms do not produce output in
terms of real value-added and the existence of missing records for the value-added
variable in the sample, led the authors to prefer the use of revenue for computing the
dependent variable in the regressions.
As our analysis is based on assumptions about the timing of when the business
relationships with foreign-owned firms started, further work is needed to understand
better the mechanisms through which the presence of FDI positively affects domestic
firms. Some additional work could be explored to greater depth on identifying specific
areas of industries and types of firms that most benefit from FDI, but also unbundling the
reasons behind this phenomenon. For example, this could involve investigating whether
firms that are closer to the technological frontier or that have better management practices
are more likely to benefit from spillovers. Understanding these pre-conditions for
benefiting from spillovers could also provide further insights for the design of firm-
assistance policies.
66 │ 2. FDI SPILLOVERS IN COSTA RICA: BOOSTING LOCAL PRODUCTIVITY THROUGH BACKWARD LINKAGES
References
Aitken, B. and A. Harrison (1999), “Do domestic firms benefit from direct foreign investment?
Evidence from Venezuela”, American Economic Review, Vol. 89/3, pp. 605-618.
[18]
Alfaro Ureña, A. and A. Vindas Quesada (2015), “Transformación estructural y productividad
sectorial en Costa Rica”, Documento de Investigación, No. 07-2015, Banco Central de Costa
Rica, San José,
http://www.bccr.fi.cr/investigacioneseconomicas/crecimientoeconomico/Transformacestructural
yproductividadsectorialenCR.pdf.
[12]
Alfaro Ureña, A., I. Manelici and J. Vasquez (2018), “The productivity effects of joining
multinational supply chains: Evidence from firm-to-firm linkages”, Working Paper, Banco
Central de Costa Rica and UC Berkeley, https://papers.nber.org/sched/FNs18.
[28]
Araújo, S. and A. Linares (2018), “A bird’s eye view of Costa Rica’s evolving international trade
patterns”, OECD Economics Department Working Paper, OECD Publishing, Paris,
forthcoming.
[11]
Bernal, R. and X. Pena (2011), Guia Practica para la Evaluacion de Impacto, Universidad de los
Andes, Bogotá.
[32]
Beverinotti, J. et al. (2014), “Diagnóstico de crecimiento para Costa Rica”, Nota Técnica, No. IDB-
TN-672, Inter-American Development Bank,
https://publications.iadb.org/bitstream/handle/11319/6585/Diagn%c3%b3stico%20de%20Creci
miento%20para%20Costa%20Rica%20/%20Nota%20T%c3%a9cnica.pdf?sequence=1&isAllo
wed=y.
[5]
Blomström, M. (1986), “Foreign investment and productive efficiency: The case of Mexico”,
Journal of Industrial Economics, Vol. 35/1, pp. 97-110.
[15]
Caliendo, M. and S. Kopeinig (2008), “Some practical guidance for the implementation of
propensity score matching”, Journal of Economic Surveys, Vol. 22/1, pp. 31-72.
[35]
Caves, R. (1974), “Multinational firms, competition, and productivity in host-country markets”,
Economica, Vol. 41/162, pp. 176-193.
[30]
Chen, T., A. Kokko and P. Tingvall (2011), “FDI and spillovers in China: Non-linearity and
absorptive capacity”, Journal of Chinese Economic and Business Studies, Vol. 9/1, pp. 1-22.
[37]
Crescenzi, R., L. Gagliardi and S. Iammarino (2015), “Foreign multinationals and domestic
innovation: Intra-industry effects and firm heterogeneity”, Research Policy, Vol. 44/3, pp. 596-
609.
[38]
Farole, T. and D. Winkler (eds.) (2014), Making Foreign Direct Investment Work for Sub-Saharan
Africa:Local Spillovers and Competitiveness in Global Value Chains, World Bank, Washington
DC.
[31]
Fons-Rosen, C. et al. (2013), “Quantifying productivity gains from foreign investment”, NBER [27]
2. FDI SPILLOVERS IN COSTA RICA: BOOSTING LOCAL PRODUCTIVITY THROUGH BACKWARD LINKAGES │ 67
OECD ECONOMIC SURVEY OF COSTA RICA: RESEARCH FINDINGS ON PRODUCTIVITY © OECD 2018
Working Paper, No. 18920, National Bureau of Economic Research, Cambridge MA,
http://www.nber.org/papers/w18920.pdf.
Gorg, H. and D. Greenaway (2004), “Much ado about nothing? Do domestic firms really benefit
from foreign direct investment?”, The World Bank Research Observer, Vol. 19/2, pp. 171-197.
[3]
Gorodnichenko, Y., J. Svejnar and K. Terrell (2007), “When does FDI have positive spillovers?
Evidence from 17 emerging market economies”, IZA Discussion Paper Series, No. 3079,
Institute for the Study of Labor, http://ftp.iza.org/dp3079.pdf.
[24]
Griliches, Z. (1979), “Issues in assessing the contribution of research and development to
productivity growth”, Bell Journal of Economics, Vol. 10/1, pp. 92-116.
[29]
Haddad, M. and A. Harrison (1993), “Are there positive spillovers from direct foreign investment?:
Evidence from panel data for Morocco”, Journal of Development Economics, Vol. 42/1, pp. 51-
74.
[17]
Haller, S. (2014), “Do domestic firms benefit from foreign presence and import competition in Irish
services sectors?”, The World Economy, Vol. 37/2, pp. 219-243.
[2]
Haskel, J., S. Pereira and M. Slaughter (2007), “Does inward foreign direct investment boost the
productivity of domestic firms?”, Review of Economics and Statistics, Vol. 89/3, pp. 482-496.
[16]
Javorcik, B. (2004), “Does foreign direct investment increase the productivity of domestic firms? In
search of spillovers through backward linkages”, American Economic Review, Vol. 94/3,
pp. 605-627.
[21]
Javorcik, B. and M. Spatareanu (2009), “Tough love: Do Czech suppliers learn from their
relationships with multinationals?”, Scandinavian Journal of Economics, Vol. 111/4, pp. 811-
833.
[33]
Kugler, M. (2006), “Spillovers from foreign direct investment: Within or between industries?”,
Journal of Development Economics, Vol. 80/2, pp. 444-477.
[36]
Lesher, M. and S. Miroudot (2008), “FDI Spillovers and their Interrelationships with Trade”,
OECD Trade Policy Papers, No. 80, OECD Publishing, Paris,
http://dx.doi.org/10.1787/235843308250.
[4]
Lin, P. and K. Saggi (2007), “Multinational firms, exclusivity, and backward linkages”, Journal of
International Economics, Vol. 71/1, pp. 206-220.
[22]
Markusen, J. (1995), “The boundaries of multinational enterprises and the theory of international
trade”, Journal of Economic Perspectives, Vol. 9/2, pp. 169-189.
[7]
Martínez, J. and R. Hernández (2012), “La inversión extranjera directa en Costa Rica: Factores
determinantes y efectos en el desarrollo nacional y regional”, Aportes para el análisis del
Desarrollo Humano Sostenible, No. 11, Estado de la Nación, San José,
https://www.uned.ac.cr/ocex/images/stories/OcexInforma/Serie_11_aportes_para_el_desarrollo_
humano.pdf.
[23]
Monge-González, R., J. Rosales-Tijerino and G. Arce-Alpízar (2005), “Cost-benefit analysis of the
Free Trade Zone system: The impact of foreign direct investment in Costa Rica”, OAS Trade,
Growth and Competitiveness Studies, Organization of American States Office of Trade, Growth
and Competitiveness, http://http:/www.sice.oas.org/Tunit/tunite.asp.
[14]
Monge-González, R. and J. Rodríguez-Álvarez (2013), “Impact evaluation of innovation and
linkage development programs in Costa Rica: The cases of PROPYME and CR Provee”, IDB
Working Paper, No. IDB-WP-461, Inter-American Development Bank.
[8]
68 │ 2. FDI SPILLOVERS IN COSTA RICA: BOOSTING LOCAL PRODUCTIVITY THROUGH BACKWARD LINKAGES
Monge-González, R. and F. Torres-Carballo (2014), “Productividad y Crecimiento de las Empresas
en Costa Rica ¿Es posible combatir la pobreza y la desigualdad por medio de mejoras en la
productividad?”, Documento de Trabajo, Comisión Asesora en Alta Tecnología, San José,
https://www.uned.ac.cr/ocex/images/stories/Informe_Final_Productividad_CR_2014_formato_
CAATEC.pdf.
[6]
Mulder, N., I. Patiño-Pascumal and R. Monge-González (2016), “Análisis del crecimiento de la
productividad en Costa Rica, 2001-2015”, in Vigesimosegundo Informe Estado de la Nación en
Desarrollo Humano Sostenible 2015.
[13]
OECD (2017), OECD Reviews of Innovation Policy: Costa Rica, OECD Publishing, Paris,
http://dx.doi.org/10.1787/9789264271654-en.
[10]
Rodriguez-Clare, A. (1996), “Multinationals, linkages, and economic development”, American
Economic Review, Vol. 86/4, pp. 852-873.
[20]
Rosenbaum, P. and D. Rubin (1983), “The central role of the propensity score in observational
studies for causal effects”, Biometrika, Vol. 70/1, pp. 41-55.
[34]
Ruane, F. and A. Uǧur (2005), “Foreign direct investment and productivity spillovers in Irish
manufacturing industry: Evidence from plant level panel data”, International Journal of the
Economics of Business, Vol. 12/1, pp. 53-66.
[1]
Sandoval, C. et al. (2017), “Employment dynamics in Costa Rica after the global financial crisis”,
in OECD (ed.), Business Dynamics and Productivity, OECD Publishing, Paris.
[9]
Schoors, K. and B. van der Tol (2002), “Foreign direct investment spillovers within and between
sectors: Evidence from Hungarian data”, Working Paper, Faculty of Economics and Business
Administration, Ghent University, http://wps-feb.ugent.be/Papers/wp_02_157.pdf.
[25]
Stančík, J. (2007), “Horizontal and vertical FDI spillovers: Recent evidence from the Czech
Republic”, Working Paper, No. 340, The Center for Economic Research and Graduate
Education - Economics Institute, Prague, http://www.cerge-ei.cz/pdf/wp/Wp340.pdf.
[19]
Wang, Y. and W. Gu (2006), “FDI, absorptive capacity, and productivity growth: The role of inter-
industry linkages”, http://dx.doi.org/10.2139/ssrn.924771.
[26]
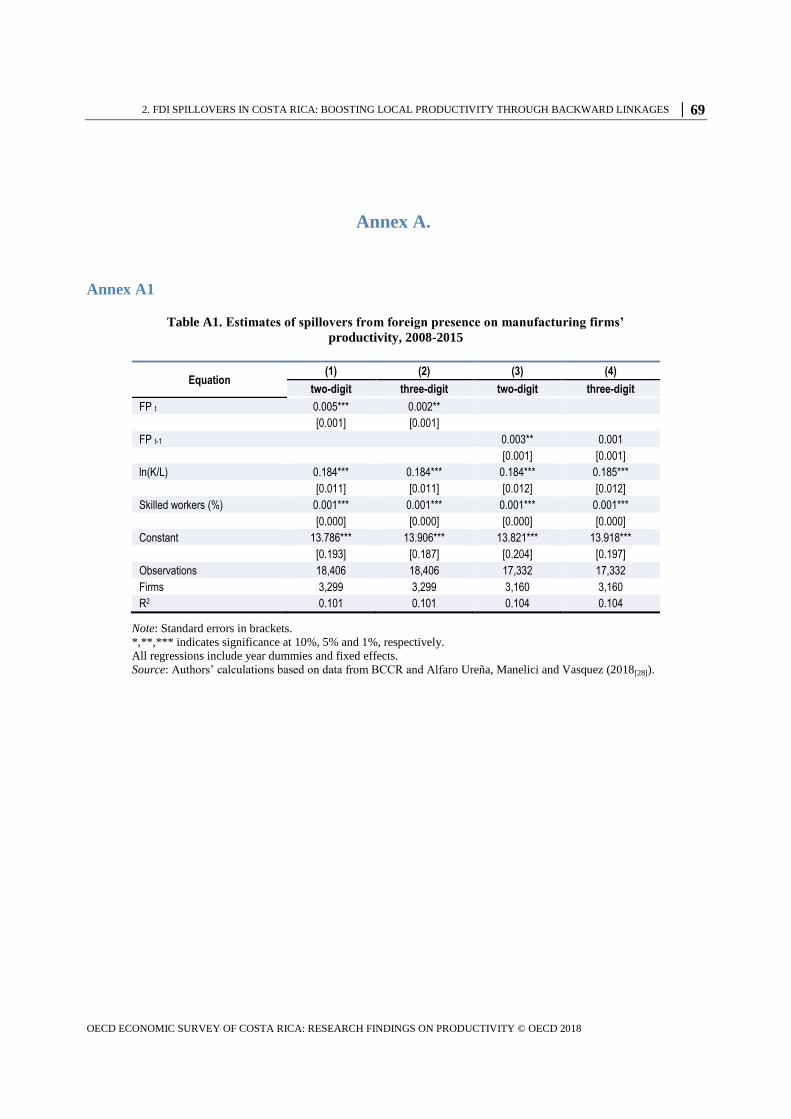
2. FDI SPILLOVERS IN COSTA RICA: BOOSTING LOCAL PRODUCTIVITY THROUGH BACKWARD LINKAGES │ 69
OECD ECONOMIC SURVEY OF COSTA RICA: RESEARCH FINDINGS ON PRODUCTIVITY © OECD 2018
Annex A.
Annex A1
Table A1. Estimates of spillovers from foreign presence on manufacturing firms’
productivity, 2008-2015
Equation (1) (2) (3) (4)
two-digit three-digit two-digit three-digit
FP t 0.005*** 0.002**
[0.001] [0.001]
FP t-1 0.003** 0.001
[0.001] [0.001]
ln(K/L) 0.184*** 0.184*** 0.184*** 0.185***
[0.011] [0.011] [0.012] [0.012]
Skilled workers (%) 0.001*** 0.001*** 0.001*** 0.001***
[0.000] [0.000] [0.000] [0.000]
Constant 13.786*** 13.906*** 13.821*** 13.918***
[0.193] [0.187] [0.204] [0.197]
Observations 18,406 18,406 17,332 17,332
Firms 3,299 3,299 3,160 3,160
R2 0.101 0.101 0.104 0.104
Note: Standard errors in brackets.
*,**,*** indicates significance at 10%, 5% and 1%, respectively.
All regressions include year dummies and fixed effects.
Source: Authors’ calculations based on data from BCCR and Alfaro Ureña, Manelici and Vasquez (2018[28]).
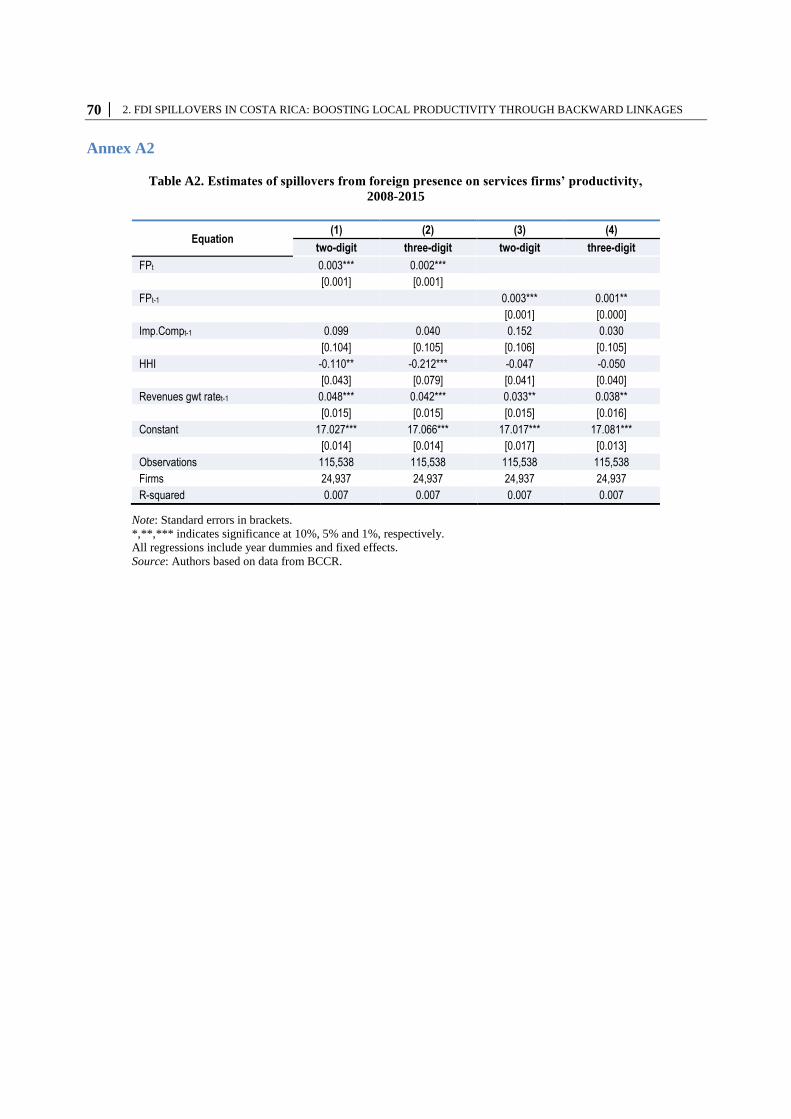
70 │ 2. FDI SPILLOVERS IN COSTA RICA: BOOSTING LOCAL PRODUCTIVITY THROUGH BACKWARD LINKAGES
Annex A2
Table A2. Estimates of spillovers from foreign presence on services firms’ productivity,
2008-2015
Equation (1) (2) (3) (4)
two-digit three-digit two-digit three-digit
FPt 0.003*** 0.002***
[0.001] [0.001]
FPt-1 0.003*** 0.001**
[0.001] [0.000]
Imp.Compt-1 0.099 0.040 0.152 0.030
[0.104] [0.105] [0.106] [0.105]
HHI -0.110** -0.212*** -0.047 -0.050
[0.043] [0.079] [0.041] [0.040]
Revenues gwt ratet-1 0.048*** 0.042*** 0.033** 0.038**
[0.015] [0.015] [0.015] [0.016]
Constant 17.027*** 17.066*** 17.017*** 17.081***
[0.014] [0.014] [0.017] [0.013]
Observations 115,538 115,538 115,538 115,538
Firms 24,937 24,937 24,937 24,937
R-squared 0.007 0.007 0.007 0.007
Note: Standard errors in brackets.
*,**,*** indicates significance at 10%, 5% and 1%, respectively.
All regressions include year dummies and fixed effects.
Source: Authors based on data from BCCR.
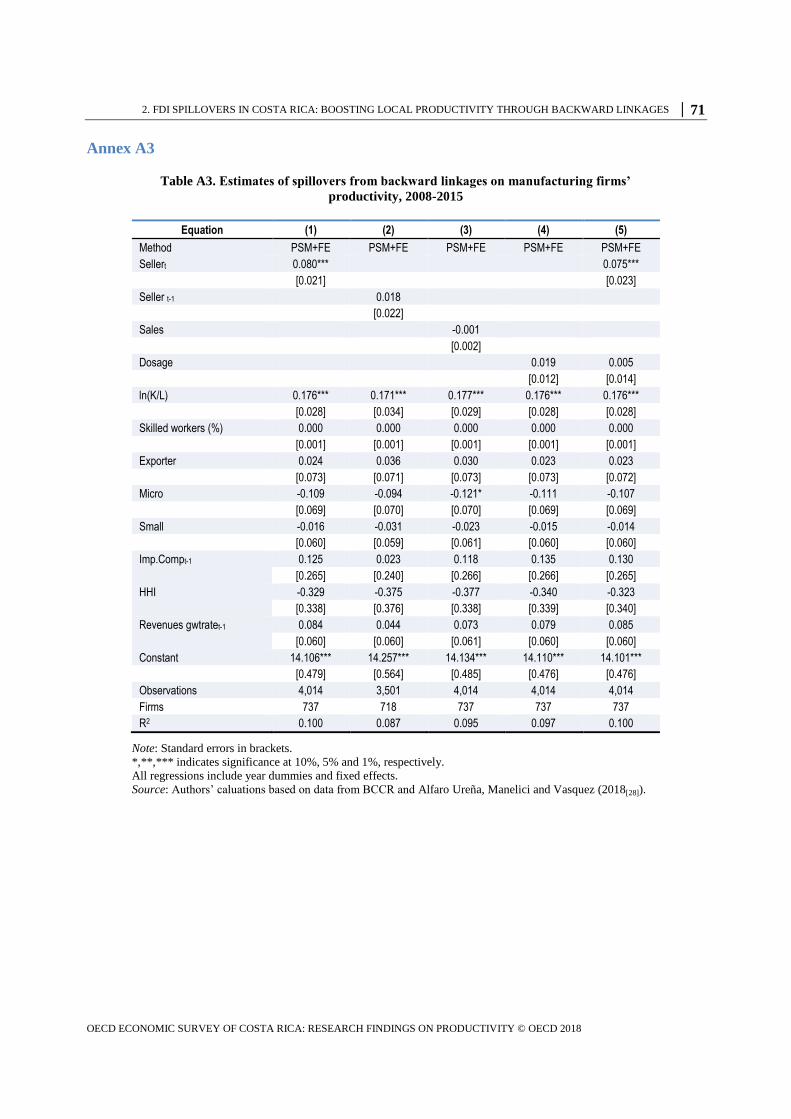
2. FDI SPILLOVERS IN COSTA RICA: BOOSTING LOCAL PRODUCTIVITY THROUGH BACKWARD LINKAGES │ 71
OECD ECONOMIC SURVEY OF COSTA RICA: RESEARCH FINDINGS ON PRODUCTIVITY © OECD 2018
Annex A3
Table A3. Estimates of spillovers from backward linkages on manufacturing firms’
productivity, 2008-2015
Equation (1) (2) (3) (4) (5)
Method PSM+FE PSM+FE PSM+FE PSM+FE PSM+FE
Sellert 0.080*** 0.075***
[0.021] [0.023]
Seller t-1 0.018
[0.022]
Sales -0.001
[0.002]
Dosage 0.019 0.005
[0.012] [0.014]
ln(K/L) 0.176*** 0.171*** 0.177*** 0.176*** 0.176***
[0.028] [0.034] [0.029] [0.028] [0.028]
Skilled workers (%) 0.000 0.000 0.000 0.000 0.000
[0.001] [0.001] [0.001] [0.001] [0.001]
Exporter 0.024 0.036 0.030 0.023 0.023
[0.073] [0.071] [0.073] [0.073] [0.072]
Micro -0.109 -0.094 -0.121* -0.111 -0.107
[0.069] [0.070] [0.070] [0.069] [0.069]
Small -0.016 -0.031 -0.023 -0.015 -0.014
[0.060] [0.059] [0.061] [0.060] [0.060]
Imp.Compt-1 0.125 0.023 0.118 0.135 0.130
[0.265] [0.240] [0.266] [0.266] [0.265]
HHI -0.329 -0.375 -0.377 -0.340 -0.323
[0.338] [0.376] [0.338] [0.339] [0.340]
Revenues gwtratet-1 0.084 0.044 0.073 0.079 0.085
[0.060] [0.060] [0.061] [0.060] [0.060]
Constant 14.106*** 14.257*** 14.134*** 14.110*** 14.101***
[0.479] [0.564] [0.485] [0.476] [0.476]
Observations 4,014 3,501 4,014 4,014 4,014
Firms 737 718 737 737 737
R2 0.100 0.087 0.095 0.097 0.100
Note: Standard errors in brackets.
*,**,*** indicates significance at 10%, 5% and 1%, respectively.
All regressions include year dummies and fixed effects.
Source: Authors’ caluations based on data from BCCR and Alfaro Ureña, Manelici and Vasquez (2018[28]).
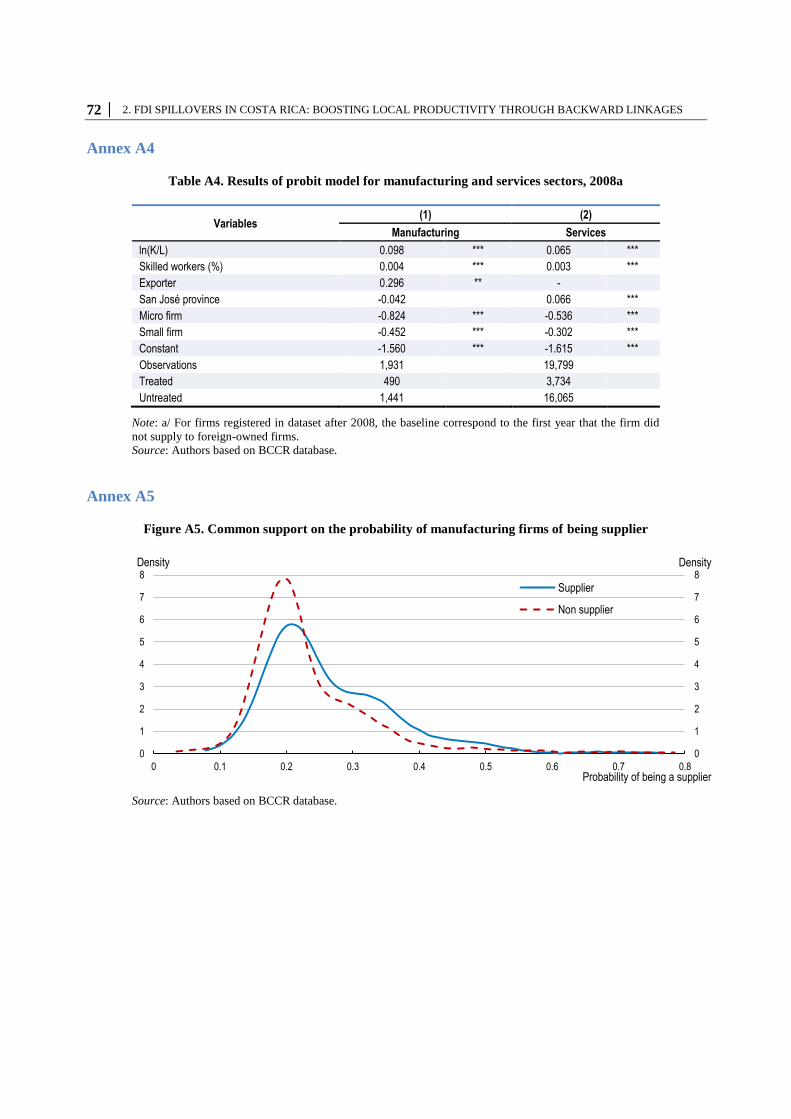
72 │ 2. FDI SPILLOVERS IN COSTA RICA: BOOSTING LOCAL PRODUCTIVITY THROUGH BACKWARD LINKAGES
Annex A4
Table A4. Results of probit model for manufacturing and services sectors, 2008a
Variables (1) (2)
Manufacturing Services
ln(K/L) 0.098 *** 0.065 ***
Skilled workers (%) 0.004 *** 0.003 ***
Exporter 0.296 ** -
San José province -0.042 0.066 ***
Micro firm -0.824 *** -0.536 ***
Small firm -0.452 *** -0.302 ***
Constant -1.560 *** -1.615 ***
Observations 1,931 19,799
Treated 490 3,734
Untreated 1,441 16,065
Note: a/ For firms registered in dataset after 2008, the baseline correspond to the first year that the firm did
not supply to foreign-owned firms.
Source: Authors based on BCCR database.
Annex A5
Figure A5. Common support on the probability of manufacturing firms of being supplier
Source: Authors based on BCCR database.
0
1
2
3
4
5
6
7
8
0
1
2
3
4
5
6
7
8
0 0.1 0.2 0.3 0.4 0.5 0.6 0.7 0.8
DensityDensity
Probability of being a supplier
Supplier
Non supplier
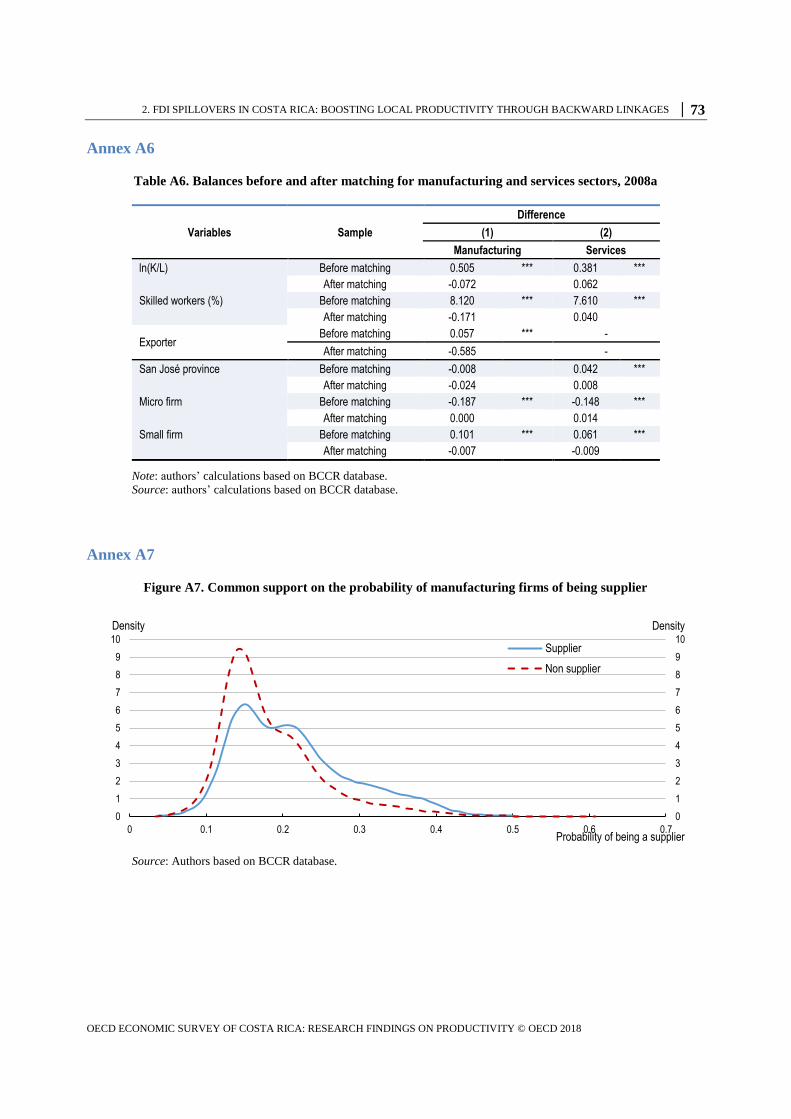
2. FDI SPILLOVERS IN COSTA RICA: BOOSTING LOCAL PRODUCTIVITY THROUGH BACKWARD LINKAGES │ 73
OECD ECONOMIC SURVEY OF COSTA RICA: RESEARCH FINDINGS ON PRODUCTIVITY © OECD 2018
Annex A6
Table A6. Balances before and after matching for manufacturing and services sectors, 2008a
Variables Sample
Difference
(1) (2)
Manufacturing Services
ln(K/L) Before matching 0.505 *** 0.381 ***
After matching -0.072 0.062
Skilled workers (%) Before matching 8.120 *** 7.610 ***
After matching -0.171 0.040
Exporter Before matching 0.057 *** -
After matching -0.585
-
San José province Before matching -0.008 0.042 ***
After matching -0.024 0.008
Micro firm Before matching -0.187 *** -0.148 ***
After matching 0.000 0.014
Small firm Before matching 0.101 *** 0.061 ***
After matching -0.007 -0.009
Note: authors’ calculations based on BCCR database.
Source: authors’ calculations based on BCCR database.
Annex A7
Figure A7. Common support on the probability of manufacturing firms of being supplier
Source: Authors based on BCCR database.
0
1
2
3
4
5
6
7
8
9
10
0
1
2
3
4
5
6
7
8
9
10
0 0.1 0.2 0.3 0.4 0.5 0.6 0.7
DensityDensity
Probability of being a supplier
Supplier
Non supplier
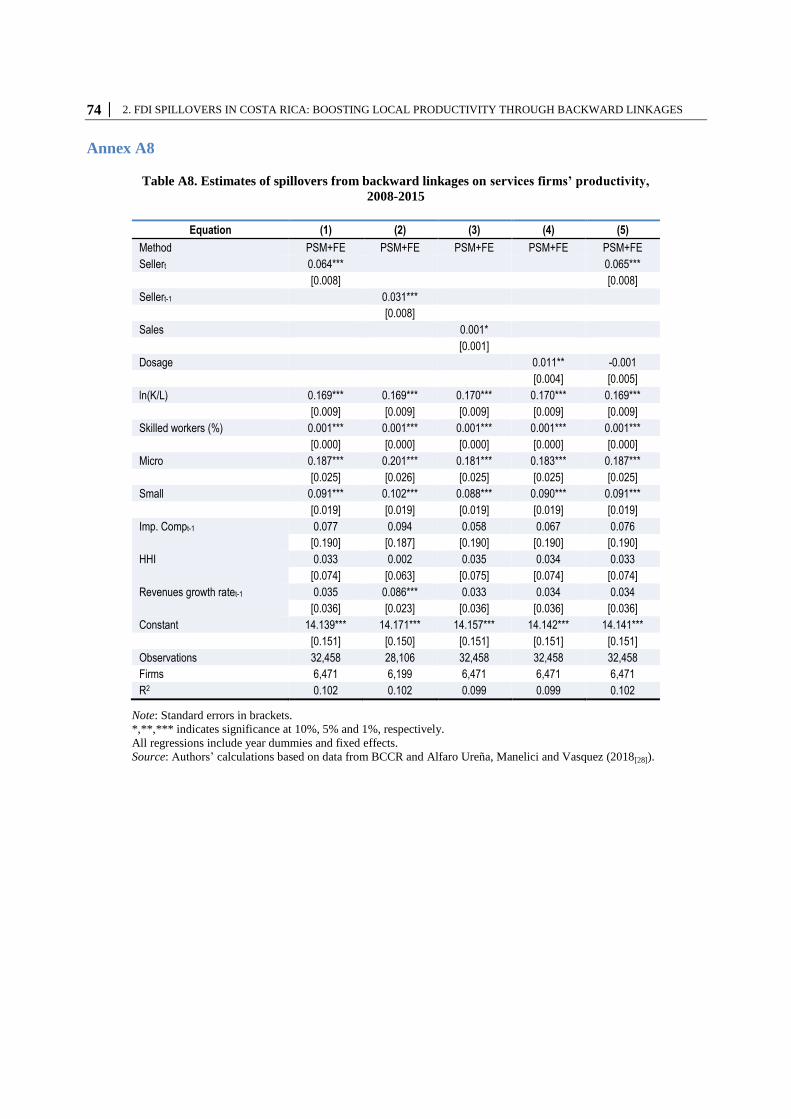
74 │ 2. FDI SPILLOVERS IN COSTA RICA: BOOSTING LOCAL PRODUCTIVITY THROUGH BACKWARD LINKAGES
Annex A8
Table A8. Estimates of spillovers from backward linkages on services firms’ productivity,
2008-2015
Equation (1) (2) (3) (4) (5)
Method PSM+FE PSM+FE PSM+FE PSM+FE PSM+FE
Sellert 0.064*** 0.065***
[0.008] [0.008]
Sellert-1 0.031***
[0.008]
Sales 0.001*
[0.001]
Dosage 0.011** -0.001
[0.004] [0.005]
ln(K/L) 0.169*** 0.169*** 0.170*** 0.170*** 0.169***
[0.009] [0.009] [0.009] [0.009] [0.009]
Skilled workers (%) 0.001*** 0.001*** 0.001*** 0.001*** 0.001***
[0.000] [0.000] [0.000] [0.000] [0.000]
Micro 0.187*** 0.201*** 0.181*** 0.183*** 0.187***
[0.025] [0.026] [0.025] [0.025] [0.025]
Small 0.091*** 0.102*** 0.088*** 0.090*** 0.091***
[0.019] [0.019] [0.019] [0.019] [0.019]
Imp. Compt-1 0.077 0.094 0.058 0.067 0.076
[0.190] [0.187] [0.190] [0.190] [0.190]
HHI 0.033 0.002 0.035 0.034 0.033
[0.074] [0.063] [0.075] [0.074] [0.074]
Revenues growth ratet-1 0.035 0.086*** 0.033 0.034 0.034
[0.036] [0.023] [0.036] [0.036] [0.036]
Constant 14.139*** 14.171*** 14.157*** 14.142*** 14.141***
[0.151] [0.150] [0.151] [0.151] [0.151]
Observations 32,458 28,106 32,458 32,458 32,458
Firms 6,471 6,199 6,471 6,471 6,471
R2 0.102 0.102 0.099 0.099 0.102
Note: Standard errors in brackets.
*,**,*** indicates significance at 10%, 5% and 1%, respectively.
All regressions include year dummies and fixed effects.
Source: Authors’ calculations based on data from BCCR and Alfaro Ureña, Manelici and Vasquez (2018[28]).
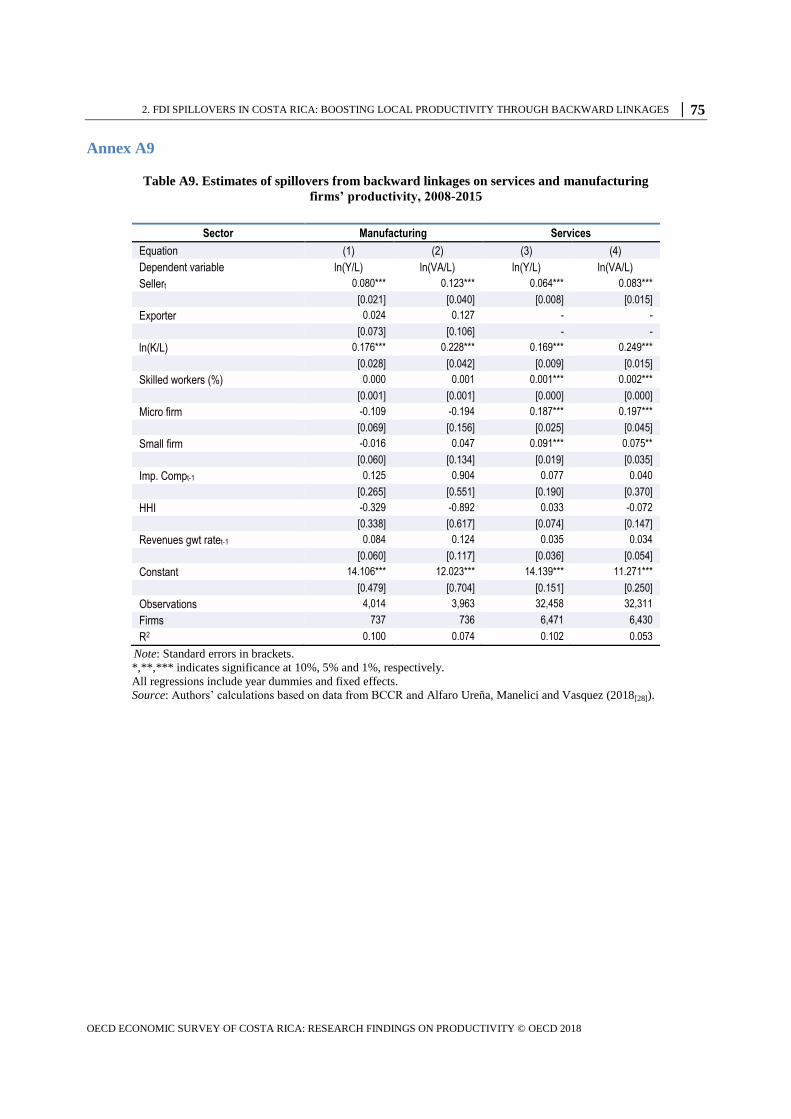
2. FDI SPILLOVERS IN COSTA RICA: BOOSTING LOCAL PRODUCTIVITY THROUGH BACKWARD LINKAGES │ 75
OECD ECONOMIC SURVEY OF COSTA RICA: RESEARCH FINDINGS ON PRODUCTIVITY © OECD 2018
Annex A9
Table A9. Estimates of spillovers from backward linkages on services and manufacturing
firms’ productivity, 2008-2015
Note: Standard errors in brackets.
*,**,*** indicates significance at 10%, 5% and 1%, respectively.
All regressions include year dummies and fixed effects.
Source: Authors’ calculations based on data from BCCR and Alfaro Ureña, Manelici and Vasquez (2018[28]).
Sector Manufacturing Services
Equation (1) (2) (3) (4)
Dependent variable ln(Y/L) ln(VA/L) ln(Y/L) ln(VA/L)
Sellert 0.080*** 0.123*** 0.064*** 0.083***
[0.021] [0.040] [0.008] [0.015]
Exporter 0.024 0.127 - -
[0.073] [0.106] - -
ln(K/L) 0.176*** 0.228*** 0.169*** 0.249***
[0.028] [0.042] [0.009] [0.015]
Skilled workers (%) 0.000 0.001 0.001*** 0.002***
[0.001] [0.001] [0.000] [0.000]
Micro firm -0.109 -0.194 0.187*** 0.197***
[0.069] [0.156] [0.025] [0.045]
Small firm -0.016 0.047 0.091*** 0.075**
[0.060] [0.134] [0.019] [0.035]
Imp. Compt-1 0.125 0.904 0.077 0.040
[0.265] [0.551] [0.190] [0.370]
HHI -0.329 -0.892 0.033 -0.072
[0.338] [0.617] [0.074] [0.147]
Revenues gwt ratet-1 0.084 0.124 0.035 0.034
[0.060] [0.117] [0.036] [0.054]
Constant 14.106*** 12.023*** 14.139*** 11.271***
[0.479] [0.704] [0.151] [0.250]
Observations 4,014 3,963 32,458 32,311
Firms 737 736 6,471 6,430
R2 0.100 0.074 0.102 0.053
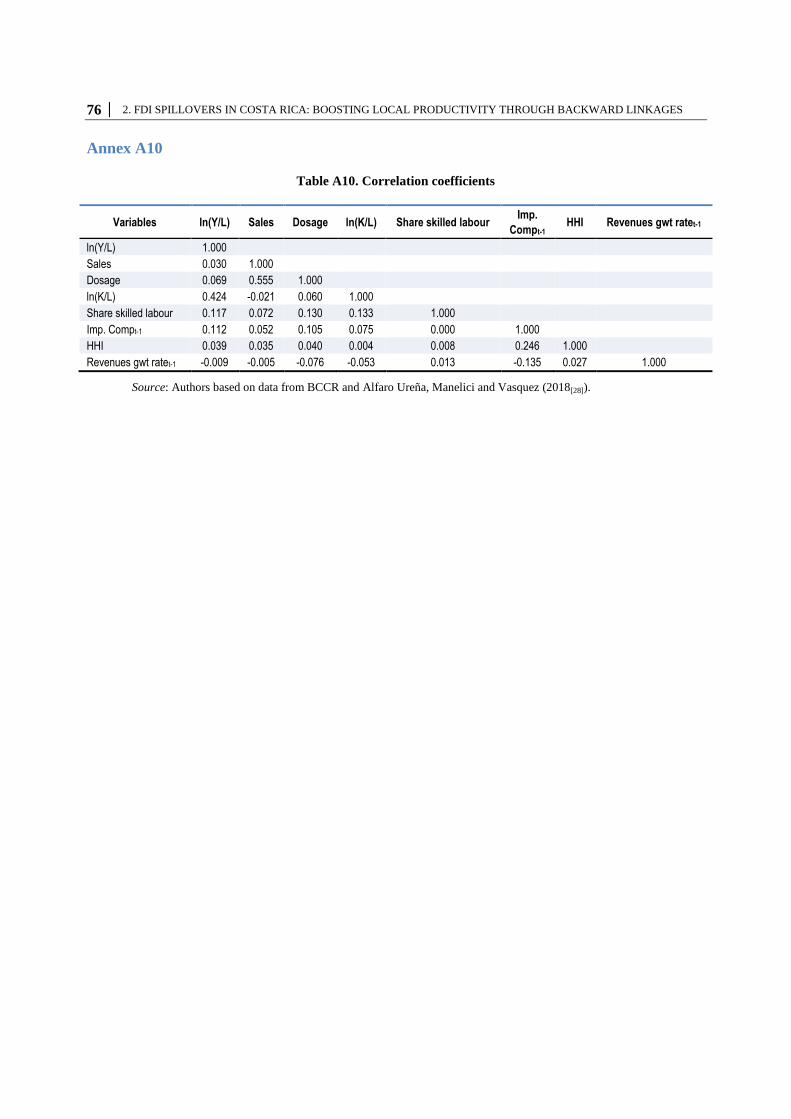
76 │ 2. FDI SPILLOVERS IN COSTA RICA: BOOSTING LOCAL PRODUCTIVITY THROUGH BACKWARD LINKAGES
Annex A10
Table A10. Correlation coefficients
Variables ln(Y/L) Sales Dosage ln(K/L) Share skilled labour Imp.
Compt-1 HHI Revenues gwt ratet-1
ln(Y/L) 1.000
Sales 0.030 1.000
Dosage 0.069 0.555 1.000
ln(K/L) 0.424 -0.021 0.060 1.000
Share skilled labour 0.117 0.072 0.130 0.133 1.000
Imp. Compt-1 0.112 0.052 0.105 0.075 0.000 1.000
HHI 0.039 0.035 0.040 0.004 0.008 0.246 1.000
Revenues gwt ratet-1 -0.009 -0.005 -0.076 -0.053 0.013 -0.135 0.027 1.000
Source: Authors based on data from BCCR and Alfaro Ureña, Manelici and Vasquez (2018[28]).