do fdi spillovers vary among home economies?: evidence
TRANSCRIPT
Do FDI Spillovers Vary Among Home Economies?: Evidence from Indonesian Manufacturing
Sadayuki Takii Research Associate Professor, ICSEAD
Working Paper Series Vol. 2007-13 May 2007
The views expressed in this publication are those of the author(s) and
do not necessarily reflect those of the Institute.
No part of this book may be used reproduced in any manner whatsoever
without written permission except in the case of brief quotations
embodied in articles and reviews. For information, please write to the
Centre.
The International Centre for the Study of East Asian Development, Kitakyushu
1
Do FDI Spillovers Vary Among Home Economies?:
Evidence from Indonesian Manufacturing *
Sadayuki Takii ∗ The International Centre for the Study of East Asian Development, Kitakyushu
11-4 Otemachi, Kokurakita, Kitakyushu, 803-0814 JAPAN
Abstract
The paper addresses the question of whether effects on economic growth of inward FDI differ according to
the origin of investors. Implications are derived for trends of regionalism. To address the question, the
magnitudes of productivity spillovers from foreign firms to local firms are measured using groups of foreign
investors’ home regions with data for Indonesian manufacturing. The results of analyses suggest that MNCs
from eastern Asian economies impart positive externalities to local firms, whereas MNCs from non-Asian
countries did not impart significant effects. Furthermore, the results suggest that eastern Asian countries’ MNCs
impart stronger effects than Japanese MNCs do, whereas the presence of Japanese MNCs enhanced the
magnitude of spillovers from eastern Asian countries MNCs. These results support regionalism in eastern Asian
economies, including Japan.
JEL classification: F23, O14 Keywords: Indonesia, MNCs, manufacturing, productivity spillovers
* This study was supported by Kakenhi (Grant-in Aid for Young Scientists (B), No. 17730198). The author
would like to thank the Ministry of Education, Culture, Sports, Science and Technology (MEXT) for the
financial support. Earlier versions of this paper were presented at the Tenth International Convention of East
Asian Economic Association held in Beijing on 18-19 November 2006 and at the ICSEAD Staff seminar of
March 2007. The author would like to thank participants in these meetings and Ari Kuncoro for useful
comments. However, I am solely responsible for all remaining errors and all opinions expressed. ∗ Email address: [email protected], Tel: +81-93-583-6202, Fax: +81-93-583-4602.
2
1. Introduction
Several economies in eastern Asia have sought regional trade agreements in recent
decades. The ASEAN Free Trade Area (AFTA), which has been in effect since 2002, is a
notable example. Japan and Singapore also concluded a bilateral free trade agreement (FTA)
in 2002. Furthermore, China, Korea, and Japan have each proposed and negotiated FTAs
with ASEAN countries. More recently, Indonesia and Japan reached an agreement in
principle on the major elements of an Economic Partnership Agreement (EPA). Japanese
EPAs with ASEAN countries seek promotion not only of trade but also of foreign direct
investment (FDI). These agreements discriminate among member countries and non-member
countries. Consequently, the importance of national boundaries would decrease within a
region, but would increase between regions. For that reason, the effects of trade and FDI on
economic growth would be more or less affected by the mix of member countries. In addition,
such regional agreements would further promote both regional trade and investment in
eastern Asia, which have been expanded by market-driven forces since the mid-1980s.
Two purposes are advanced in this paper. The paper addresses the question of whether the
effects of inward FDI on economic growth differ according to the investor’s origin, and then
derives the direct implication for trends of regional agreements. To elucidate the matter, the
magnitudes of productivity spillovers from foreign firms to local firms are measured using
groups of foreign investors’ home regions with data for Indonesian manufacturing. To date,
several determinants of productivity spillovers have been examined. Based on the
implications that have emerged from the studies, we can presume different effects of FDI
from different regions. Instead, in this paper, the resulting different effects are measured
directly. Another related purpose is to evaluate the surge in Indonesia’s inward FDI from
less-developed countries (LDCs) that has occurred since the late 1980s. Indonesia
experienced a large inflow of FDI after several waves of deregulation of FDI in 1990s. A
considerable amount of FDI has come from LDCs in eastern Asia. The investments were
mainly export-market-oriented, in contrast to the strong domestic orientation of ‘older’ FDI
under the highly protectionist trade regime (Thee 1991). Although consequences of the surge
in FDI from LDCs into Indonesian manufacturing have been evaluated in some respects (e.g.
manufacturing export growth), the effects on local firms have not been examined sufficiently.
In the subsequent section, the concept of productivity spillovers is explained. Characteristics
3
of spillovers are also discussed, focusing on the relationship to the origins of investors.
Section 3 explains the data examined in this paper, which were newly constructed for these
analyses. Then, a review of policy changes and experiences of the Indonesian manufacturing
during recent decades is presented. Section 4 explains the methodology and results of
econometric analysis. Finally, section 5 presents concluding remarks.
2. How do MNCs affect productivity of local firms?
2.1. Concept of productivity spillovers
Productivity spillovers from foreign firms are defined as externalities derived from
foreign firm presence, which benefits other firms through improvement of their productivity
(Blomström, Kokko and Zejan, 2000). Such spillovers to local firms occur through several
channels. First, local firms can learn how MNC affiliates procure, produce, sell, manage, and
adapt technology; they can then imitate the behavior of MNCs, reflecting a demonstration
effect. Second, MNCs might find it profitable to develop local supplier networks and to help
improve the performance of these networks by providing information related to sophisticated
technology, technical assistance, and other services to local suppliers (Moran 2002, pp. 108–
109). This development creates a backward linkage effect. Third, MNCs might supply similar
services to local customers that purchase their products (e.g. for the use as inputs), thereby
creating a forward linkage effect. Fourth, spillovers can result from the training of workers,
who acquire specific knowledge and/or skills and eventually change their employment to
other local plants or share their knowledge with them through other channels. This
mechanism can be extremely important for developing countries like Indonesia, where public
education systems are weak (Blomström et al. 2000). Fifth, even if no direct contact exists
between MNCs or their workers and local plants, MNCs can increase competition in an
industry and motivate local plants to increase productivity to protect their market shares and
profits. In addition, increased sales or production of, for example, motorcycles by foreign
firms would increase demand in after-markets for parts and components of motorcycles
produced by local firms.
4
2.2. Developed countries’ versus developing countries’ MNCs
Productivity spillovers have been examined empirically in several previous analyses, but
the results are mixed. According to a survey by Görg and Greenaway (2004), several studies
found evidence supporting negative spillovers for developed and developing countries. In
addition, of the 40 studies investigated, only 8 studies using panel data and appropriate
estimation techniques reported evidence of positive spillovers. Moreover, only one of those is
an examination of developing countries. Demonstrably, empirical findings supporting the
existence of positive spillovers in developing countries are very limited. However, some
evidence exists of the existence of positive spillovers in Indonesian manufacturing (e.g. Takii
2005).1
A possible explanation of the mixed results related to spillovers is that the externality
does not automatically benefit local firms: rather, various factors affect the magnitude of
spillovers. Therefore, if the factors differ among examined countries and periods, the
resulting magnitudes of spillovers would also be different. Several studies have examined the
factors influencing the magnitude of spillovers. An important factor is the relative
backwardness of local firms, or technological gaps between MNC affiliates and local firms.
Findlay (1978) constructed a simple dynamic model which emphasizes the importance of
“relative backwardness” based on the idea that pressures for change within a backward region
are positively correlated with the backlog of technological opportunities in the advanced
region. In a cross section of 20 manufacturing sectors in Mexico, Blomström and Wolff
(1994) found that the rate at which local plants catch up to MNCs is higher in sectors with
greatly disparate productivity levels in the initial year. However, as a partial contrast, Kokko
(1994) found that large productivity gaps and large foreign market shares together impede
spillovers in the Mexican samples. Takii (2005) also found evidence supporting that
spillovers are smaller in industries of Indonesian manufacturing, for which technology gaps
are wide.
Takii (2005) also examined the effect of foreign ownership shares on the magnitude of
spillovers. Whole and majority ownership can facilitate control of affiliates, thereby
preventing leakage of firm-specific knowledge. In this case, the greater presence of majority-
1 Lipsey and Sjöholm (2005) provide a survey on productivity spillovers in Indonesian manufacturing.
5
owned or wholly owned foreign plants might reduce the magnitude of spillovers.2 Takii
(2005) found supporting evidence of that hypothesis. The relationship between competition
and spillovers was examined in Kokko (1994). In addition to other factors that have been
examined empirically, several factors have been shown to affect the magnitude of spillovers
theoretically. For example, appropriateness of technology would be an important factor.
Given that foreign-owned plants are large and capital-intensive compared to locally owned
plants, the technology used in foreign-owned plants might not be appropriate for locally
owned plants, which are probably smaller, with more labor-intensive production (Takii 2005).
These arguments indicate that the effects of foreign firms on local firms would be
different if the characteristics of MNCs from different regions were different. For several
reasons, characteristics of MNCs are expected to different according to the origin of investors.
The most important differences might stem from differences in stages of economic
development of the home countries. In particular, for Indonesia, most neighboring countries
are classified as LDCs. The investment development path (IDP) theory suggests that, in the
early stage of IDP, imports and inward FDI contributed to the development of firm-specific
advantages mainly in low/medium knowledge-intensive industries and/or resource-based
sectors (Dunning 1993; UNCTAD 2006, p. 147). Therefore, FDI from LDCs might be
characterized as investment into low/medium knowledge-intensive and/or resource-intensive
technology, whereas MNCs from developed countries exploit high knowledge-intensive
technology in host countries.
Furthermore, the competitive advantages of firms from LDCs are similar and appropriate
to the conditions of other LDCs than competitive advantages firms from developed countries.
Chen (1990) discussed the possibility that MNCs from LDCs tend to establish industries that
are more appropriate and use more appropriate product technology; MNCs from developed
countries do not tend to do so. A two-stage transfer of technology also implies that firms in
LDCs modify the technology introduced from developed countries, thereby adapting it for
use in the local situation. They subsequently transfer the technology to other LDCs (Parry
1981, Chen 1990).
2 MNCs from Asian economies other than Japan tend to have higher foreign ownership shares, on average,
in Indonesian manufacturing (Takii 2007).
6
In addition to the difference between LDCs and developed countries, characteristics of
MNCs are expected to differ among developed countries. One important source of difference
is the distance from home countries to the host country. The theoretical model of Rodriguez-
Clare (1996) predicts that the linkage effects of MNCs on host economy are greater when the
cost of communication between MNC parents and affiliates, which tends to increase with
‘distance’, is high because MNCs have an incentive to procure inputs in host countries,3
which implies that the characteristics of MNCs differ by the origin of investors.
3. MNCs in large and medium manufacturing
3.1. Data
Investors’ countries of origin can be an important issue when the volume of FDI and the
activity of existing MNCs from particular countries or regions are expected to change.
Notwithstanding, it is sometimes difficult to know the situation of FDI and MNCs in a
developing economy, mainly because of a lack of data, especially that related to origins of
investors. Indonesia is no exception. Data from the Investment Coordinating Board (Badan
Koordinasi Penanaman Modal, BKPM) are most commonly used, and can be disaggregated
by industry and country of origin. Another source is the balance of payment statistics from
Bank Indonesia, but those data cannot be disaggregated. Several problems hinder collection
of reliable data related to Indonesia’s inward FDI from these sources (Lindblad and Thee
2007). In addition, although these sources are most reliable for flows of FDI, they are
insufficient to examine the trend of MNCs’ activities because the sources do not contain
information on value added, change of employment, and other variables that are necessary for
economic analyses.
The datasets that enable us to examine the activities of manufacturing plants are those
from the industrial surveys (Statistiki Industri Besar dan Sedang) conducted by BPS-
Statistics since 1975. The survey results are applicable to manufacturing plants with 20 or
3 Javorick, Saggi, and Spatareanu (2004) examined the relationship between vertical spillovers and
investors’ nationalities using data for Romanian firms.
7
more workers (L&M manufacturing plants) including foreign-owned plants; the datasets are
useful for economic analyses. However, the datasets contain no reliable information on the
origin of foreign investors. Although the datasets contain information related to the main
country of investors for each foreign-owned plant in a few years, the information seems
insufficient, with many missing numbers.
Various sources including ownership information were first gathered to estimate the
country of the ultimate beneficial owner and therefore to analyze the characteristics of
foreign-owned plants by the origin of investors. The BPS-Statistics’ Manufacturing Directory
contains information related to the location, sectors, and employment, which are in general
consistent with the two datasets (BPS-Statistics various years b). Furthermore, CIC data
(2003, 2005) were useful to gather information related to the countries of investors for each
firm. Toyo Keizai (various years) and JETRO (2005) data were used to identify Japanese-
owned firms operating in Indonesia. For plants that were not described in these sources,
various sources, including websites of companies, business organizations, and industrial
estates were used. The datasets were then merged and the information from alternative
sources with ownership information described above was aggregated to yield a useful panel
dataset.
Consequently, a new dataset was constructed including information about the country of
the ultimate beneficial owner for the foreign plants. 4 A foreign plant is defined as any plant
with a foreign ownership share of 1% or greater when defining the country of the ultimate
beneficial owner. If a Japanese firm ultimately controls a plant and the Japanese holding is
the largest of known foreign holdings, the plant is defined as a Japanese plant. A similar
methodology was applied to plants that are ultimately controlled by firms from Asian
countries other than Japan (designated as Other Asian plants) and from non-Asian countries
(designated as Non-Asian plants). Sufficient information related to owners for several plants
was impossible to obtain. In such cases, educated guesses were made given the available
information. However, several plants’ owners were not identified. They were defined as
Plants with unknown ownership if such plants reported positive foreign ownership shares.
4 See Section 3 in Takii (2007) for more details of the constructed dataset.
8
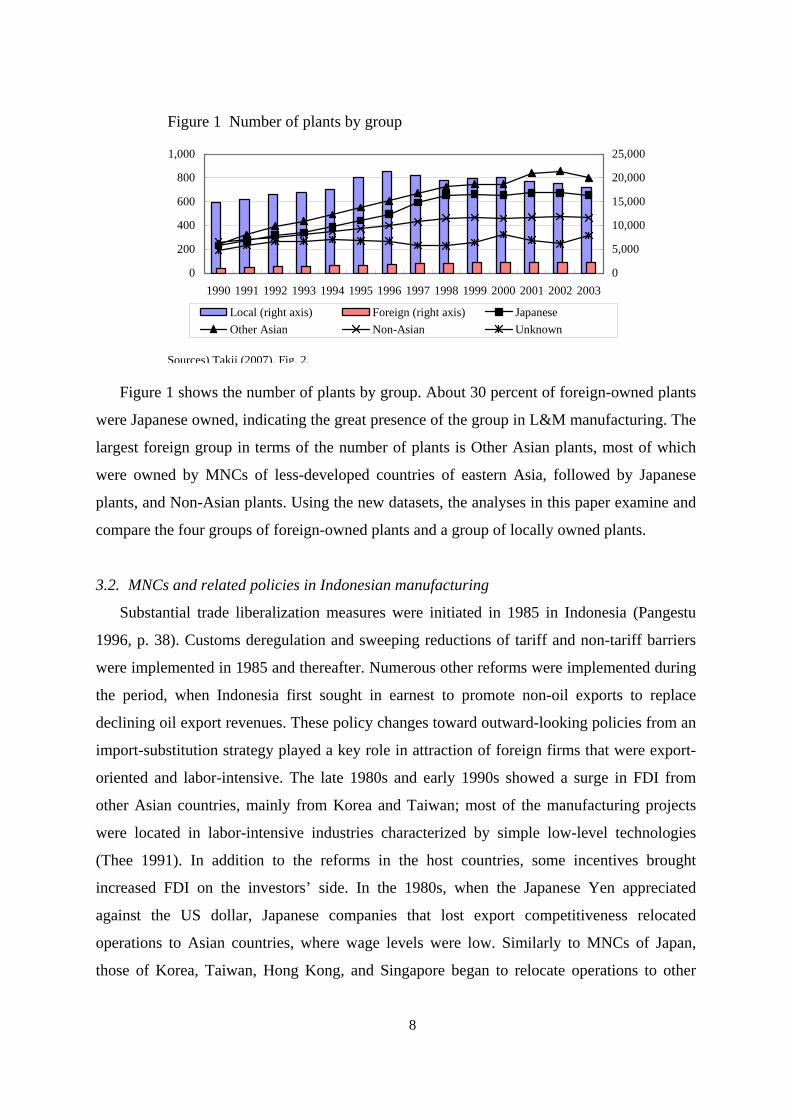
Figure 1 shows the number of plants by group. About 30 percent of foreign-owned plants
were Japanese owned, indicating the great presence of the group in L&M manufacturing. The
largest foreign group in terms of the number of plants is Other Asian plants, most of which
were owned by MNCs of less-developed countries of eastern Asia, followed by Japanese
plants, and Non-Asian plants. Using the new datasets, the analyses in this paper examine and
compare the four groups of foreign-owned plants and a group of locally owned plants.
3.2. MNCs and related policies in Indonesian manufacturing
Substantial trade liberalization measures were initiated in 1985 in Indonesia (Pangestu
1996, p. 38). Customs deregulation and sweeping reductions of tariff and non-tariff barriers
were implemented in 1985 and thereafter. Numerous other reforms were implemented during
the period, when Indonesia first sought in earnest to promote non-oil exports to replace
declining oil export revenues. These policy changes toward outward-looking policies from an
import-substitution strategy played a key role in attraction of foreign firms that were export-
oriented and labor-intensive. The late 1980s and early 1990s showed a surge in FDI from
other Asian countries, mainly from Korea and Taiwan; most of the manufacturing projects
were located in labor-intensive industries characterized by simple low-level technologies
(Thee 1991). In addition to the reforms in the host countries, some incentives brought
increased FDI on the investors’ side. In the 1980s, when the Japanese Yen appreciated
against the US dollar, Japanese companies that lost export competitiveness relocated
operations to Asian countries, where wage levels were low. Similarly to MNCs of Japan,
those of Korea, Taiwan, Hong Kong, and Singapore began to relocate operations to other
Figure 1 Number of plants by group
0
200
400
600
800
1,000
1990 1991 1992 1993 1994 1995 1996 1997 1998 1999 2000 2001 2002 20030
5,000
10,000
15,000
20,000
25,000
Local (right axis) Foreign (right axis) JapaneseOther Asian Non-Asian Unknown
Sources) Takii (2007), Fig. 2.
9
lower cost countries, such as Indonesia, in response to increasing domestic wage levels and
the appreciation of their own countries’ currencies (Agrawal 2002).
The gradual relaxation or removal of restrictions related to FDI and other MNC activities
since the late 1980s was an important reform that was accelerated in the early-1990s to mid-
1990s, which is particularly important in the present context. For example, partial
deregulation in 1992 formally allowed 100 percent foreign ownership for certain types of
investments for the first time since the 1970s, while relaxing previous divestment
requirements. Subsequently, a formal, more sweeping deregulation in 1994 removed
restrictions on foreign ownership shares and minimum capital requirements, and further
relaxed divestment requirements (Pangestu 1996, 2002). These policy changes explain, in
part, why FDI increased more rapidly in the first half of the 1990s, especially from less-
developed economies in the region. The surge in export-market-oriented FDI in the late
1980s and in the 1990s contrasts with the strong domestic orientation of ‘older’ FDI under
the earlier highly protectionist trade regime (Thee 1991). The foreign firms in the 1970s were
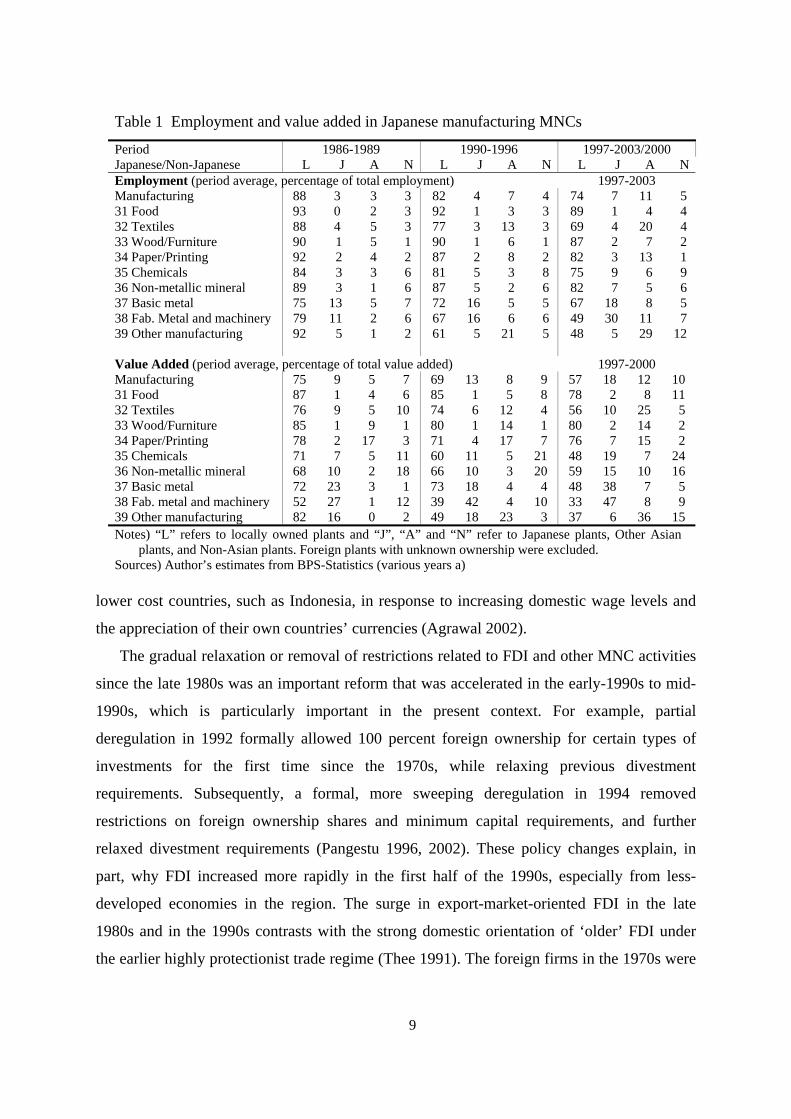
Table 1 Employment and value added in Japanese manufacturing MNCs
Period 1986-1989 1990-1996 1997-2003/2000 Japanese/Non-Japanese L J A N L J A N L J A NEmployment (period average, percentage of total employment) 1997-2003 Manufacturing 88 3 3 3 82 4 7 4 74 7 11 531 Food 93 0 2 3 92 1 3 3 89 1 4 432 Textiles 88 4 5 3 77 3 13 3 69 4 20 433 Wood/Furniture 90 1 5 1 90 1 6 1 87 2 7 234 Paper/Printing 92 2 4 2 87 2 8 2 82 3 13 135 Chemicals 84 3 3 6 81 5 3 8 75 9 6 936 Non-metallic mineral 89 3 1 6 87 5 2 6 82 7 5 637 Basic metal 75 13 5 7 72 16 5 5 67 18 8 538 Fab. Metal and machinery 79 11 2 6 67 16 6 6 49 30 11 739 Other manufacturing 92 5 1 2 61 5 21 5 48 5 29 12 Value Added (period average, percentage of total value added) 1997-2000 Manufacturing 75 9 5 7 69 13 8 9 57 18 12 1031 Food 87 1 4 6 85 1 5 8 78 2 8 1132 Textiles 76 9 5 10 74 6 12 4 56 10 25 533 Wood/Furniture 85 1 9 1 80 1 14 1 80 2 14 234 Paper/Printing 78 2 17 3 71 4 17 7 76 7 15 235 Chemicals 71 7 5 11 60 11 5 21 48 19 7 2436 Non-metallic mineral 68 10 2 18 66 10 3 20 59 15 10 1637 Basic metal 72 23 3 1 73 18 4 4 48 38 7 538 Fab. metal and machinery 52 27 1 12 39 42 4 10 33 47 8 939 Other manufacturing 82 16 0 2 49 18 23 3 37 6 36 15Notes) “L” refers to locally owned plants and “J”, “A” and “N” refer to Japanese plants, Other Asian
plants, and Non-Asian plants. Foreign plants with unknown ownership were excluded. Sources) Author’s estimates from BPS-Statistics (various years a)
10
involved mainly in fields in which Indonesia did not have a comparative advantage: capital-
intensive and technology-intensive projects. They generally enjoyed greater protection under
the import-substitution strategy.
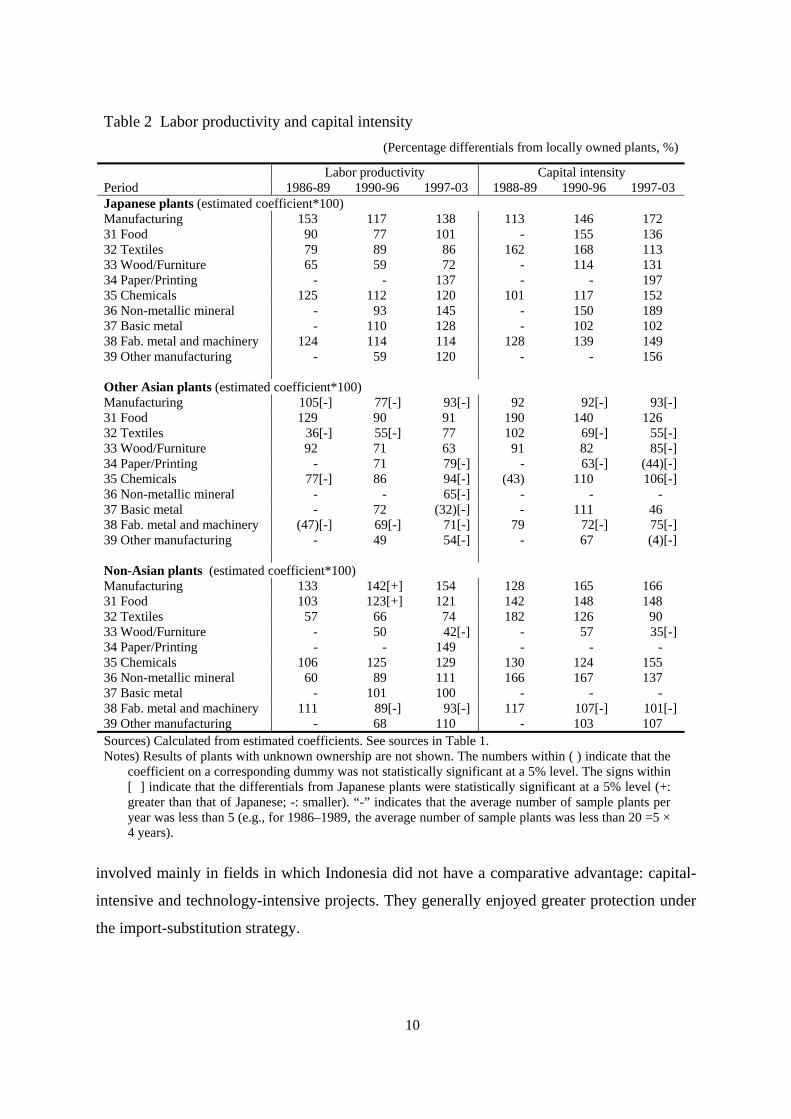
Table 2 Labor productivity and capital intensity (Percentage differentials from locally owned plants, %)
Labor productivity Capital intensity Period 1986-89 1990-96 1997-03 1988-89 1990-96 1997-03 Japanese plants (estimated coefficient*100) Manufacturing 153 117 138 113 146 172 31 Food 90 77 101 - 155 136 32 Textiles 79 89 86 162 168 113 33 Wood/Furniture 65 59 72 - 114 131 34 Paper/Printing - - 137 - - 197 35 Chemicals 125 112 120 101 117 152 36 Non-metallic mineral - 93 145 - 150 189 37 Basic metal - 110 128 - 102 102 38 Fab. metal and machinery 124 114 114 128 139 149 39 Other manufacturing - 59 120 - - 156 Other Asian plants (estimated coefficient*100) Manufacturing 105[-] 77[-] 93[-] 92 92[-] 93[-]31 Food 129 90 91 190 140 126 32 Textiles 36[-] 55[-] 77 102 69[-] 55[-]33 Wood/Furniture 92 71 63 91 82 85[-]34 Paper/Printing - 71 79[-] - 63[-] (44)[-]35 Chemicals 77[-] 86 94[-] (43) 110 106[-]36 Non-metallic mineral - - 65[-] - - - 37 Basic metal - 72 (32)[-] - 111 46 38 Fab. metal and machinery (47)[-] 69[-] 71[-] 79 72[-] 75[-]39 Other manufacturing - 49 54[-] - 67 (4)[-] Non-Asian plants (estimated coefficient*100) Manufacturing 133 142[+] 154 128 165 166 31 Food 103 123[+] 121 142 148 148 32 Textiles 57 66 74 182 126 90 33 Wood/Furniture - 50 42[-] - 57 35[-]34 Paper/Printing - - 149 - - - 35 Chemicals 106 125 129 130 124 155 36 Non-metallic mineral 60 89 111 166 167 137 37 Basic metal - 101 100 - - - 38 Fab. metal and machinery 111 89[-] 93[-] 117 107[-] 101[-]39 Other manufacturing - 68 110 - 103 107 Sources) Calculated from estimated coefficients. See sources in Table 1. Notes) Results of plants with unknown ownership are not shown. The numbers within ( ) indicate that the
coefficient on a corresponding dummy was not statistically significant at a 5% level. The signs within [ ] indicate that the differentials from Japanese plants were statistically significant at a 5% level (+: greater than that of Japanese; -: smaller). “-” indicates that the average number of sample plants per year was less than 5 (e.g., for 1986–1989, the average number of sample plants was less than 20 =5 × 4 years).
11
3.3. Comparisons of MNCs
A main characteristic of the Indonesian L&M manufacturing is that Japanese plants
account for a large share in all value added; they also account for a considerable share in all
employment. Since the mid-1980s, both shares of value added and employment in Japanese
plants have increased rapidly (Table 1). Japanese plants had accounted for large shares of
value added in the fabricated metals and machinery sector and in the basic metals sector in
the latter 1980s. Corresponding shares of employment in these sectors were also high, but
they were lower than that of value added. Shares of Japanese plants in the chemicals sector
increased during 1986–2003/2000.
Another important trend is the surge in shares of plants owned by Asians other than
Japanese. The share of employment of the group in all employment increased from 3 percent
in 1986–1989 to 11 percent in 1997–2003; the corresponding share in all value added
increased from 5 percent in 1986–1989 to 12 percent in 1997–2000. Surges in the
employment share of other Asian plants mainly occurred in the textiles sector, the fabricated
metals and machinery sector, and the paper and printing sector. On the other hand, the
increases of corresponding shares of value added in these sectors were slower that those of
employment, indicating that other Asian plants tended to have engaged in labor-intensive
activities. The shares of non-Asian plants increased more slowly than those of Japanese and
other Asian plants.5
Table 2 shows a comparison of the average labor productivity and capital intensity of
locally owned plants and the three groups of foreign-owned plants. The table shows estimated
coefficients in the following equation:
0 1 2 3 4ln ,it i i i i itY DJ DA DN DUα α α α α ε= + + + + + +αDY (1)
where Yit refers to labor productivity or capital intensity in plant i in year t. DJ, DA, DN, and
DU are dummy variables that equal one, respectively, for Japanese plants, other Asian plants,
non-Asian plants, and plants with unknown ownership. Therefore, the coefficient, α1, can be
interpreted as the percentage difference in Y between Japanese plants and local plants.
Similarly, the coefficients, α2, α3, and α4, respectively represent percentage differences of
5 Takii (2007) compared various aspects of groups of foreign-owned plants.
12
corresponding groups of foreign plants from local plants. In the equation, DY is a vector of
year dummies.
According to the results, each group of foreign-owned plants had higher average
productivity and capital intensity than locally owned plants in all L&M manufacturing. In
addition, of 66 cases in which labor productivity of locally owned plants and each group of
foreign-owned plants were compared by sector, only two cases did not allow rejection of a
hypothesis of equal labor productivity (indicated by parentheses: local versus other Asian
plants in the basic metals sector during 1997–2003 and in the fabricated metals and
machinery sector during 1986–1989). Similarly, each group of foreign-owned plants has
higher capital intensity than locally owned plants in most sectors. In addition, most
comparisons suggest that there are quite large differentials of both labor productivity and
capital intensity between foreign-owned plants and locally owned plants. In 25 of 66 cases of
labor productivity and 42 out of 59 cases of capital intensity, the differentials are of more
than 100 percentage points.
Among groups of foreign-owned plants, average labor productivity and capital intensity
of other Asian plants were, in general, smaller than those of Japanese and non-Asian plants in
all L&M manufacturing (indicated by [-]; except Japanese versus other Asian plants in capital
intensity during 1988–1989 and non-Asian versus other Asian plants in labor productivity
during 1986–1989). These indicate that labor productivity and capital intensity depend on the
stage of economic development in home economies, and/or that foreign-owned plants from
neighboring less-developed economies tend to concentrate in labor-intensive industries. The
former interpretation was supported by sectoral comparisons. Most comparisons between
Japanese and other Asian plants suggest that other Asian plants have lower labor productivity
and capital intensity than do Japanese plants. Particularly, the trend is clear in recent years.
Similar trends are visible when comparisons are made between other Asian and non-Asian
plants.
Statistically significant differentials were not observed in most comparisons of the two
groups of developed economies. Most notable exceptions suggest that Japanese plants have
higher labor productivity and capital intensity compared not only to other Asian plants but
also to non-Asian plants in the fabricated metal and machinery sector.
13
4. Analysis of productivity spillovers
4.1. Statistical methodology for spillover analysis
This section statistically examines the magnitude of productivity spillovers derived by
locally owned plants from each group of foreign-owned plants. Several empirical studies
have been made of spillover effects, arising from foreign presence, on the productivity of
local firms or efficiency in an industry. Most frameworks used for these statistical analyses
are based on the conjecture that technical innovations are diffused most effectively from
foreign firms to local firms when there is personal contact between them (Findlay 1978).
Accordingly, in the empirical models, it has often been assumed that the extent of spillovers
is proportional to foreign presence, which is, for example, measured as a foreign share of all
employment in an industry.6 In sum, the higher the foreign share in an industry, the more
local firms have the opportunity to contact with persons who are engaged with foreign
affiliates; consequently, local firms can better raise their productivity or efficiency because
they can efficiently copy technologies transferred to the foreign affiliates. Therefore,
statistical studies of spillovers generally estimate a production function with a technology
level index that is assumed as a function of foreign share variables and others. The coefficient
on the variable, which is often measured as the share of employment engaged in foreign
affiliates in all employment of an industry, is considered as the magnitude of spillovers. A
coefficient that is significant and positive suggests the existence of positive spillover effects.
The following simple model is first estimated to compare the magnitude of spillovers by a
group of investors’ countries of foreign plants.
2 3
2 24 5 6
ln
ln(ln ln ) (ln ln )
ln(ln ln ) (ln ln )(ln ln ) (ln ln ) .
it i t J it A it N it U it
it it
it it it it it
V FsJ FsA FsN FsU
L L K K
L L L L K K K K
μ η α α α α
α α
α α α ε
= + + + + +
+ − + −
+ − + − − + − +
(2)
Therein, Vit represents the value added for plant i in year t, which is deflated by the wholesale
price index, which appears to be appropriate for each three-digit ISIC classification. The
number of workers and capital stock are denoted respectively by L and K. Capital stock is
6 Early empirical analyses of spillovers were undertaken by Caves (1974), Globerman (1979), and
Blomström and Persson (1983).
14
also deflated by price deflators.7 The upper bars on ln L and ln K respectively denote the
average of ln L or ln K over the sample observations in a regression. Consequently, eq. 2 is a
translog production function with an intercept of sum of μi, ηi, αJFsJ, αAFsA, αNFsN and
αUFsU. The FsJ refers to the share of employment engaged in Japanese plants in all L&M
manufacturing. In addition, FsA, FsN, and FsU respectively correspond to shares of other
Asian plants, non-Asian plants, and plants with unknown ownership. The coefficients of
these four variables can be interpreted as the magnitude of spillovers derived from
corresponding groups of foreign-owned plants. If these coefficients are equal, eq. (2) is a
widely used estimation model for the case in which the origin of investors is not
distinguished. The μi is an individual effect, as estimated using the panel technique. The ηi is
a year-specific effect, as estimated using year dummies. The equation was estimated using a
sample of locally owned plants, for which at least three observations were available during
the period for the regression.
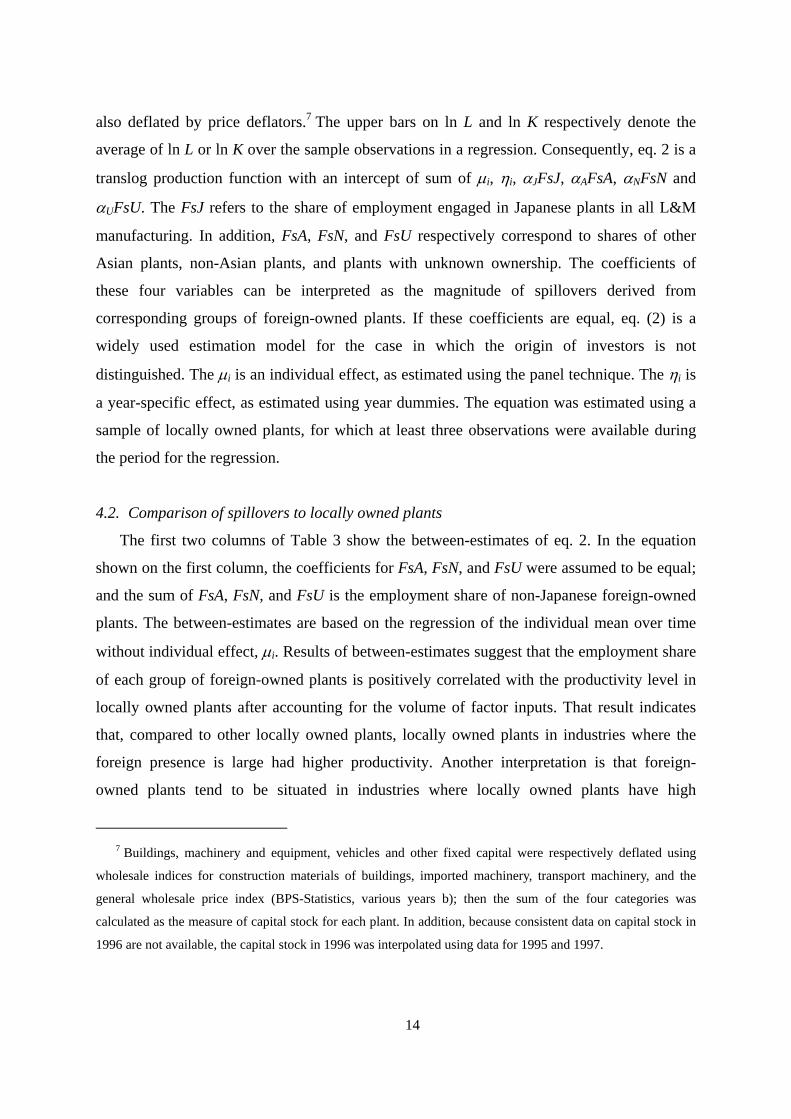
4.2. Comparison of spillovers to locally owned plants
The first two columns of Table 3 show the between-estimates of eq. 2. In the equation
shown on the first column, the coefficients for FsA, FsN, and FsU were assumed to be equal;
and the sum of FsA, FsN, and FsU is the employment share of non-Japanese foreign-owned
plants. The between-estimates are based on the regression of the individual mean over time
without individual effect, μi. Results of between-estimates suggest that the employment share
of each group of foreign-owned plants is positively correlated with the productivity level in
locally owned plants after accounting for the volume of factor inputs. That result indicates
that, compared to other locally owned plants, locally owned plants in industries where the
foreign presence is large had higher productivity. Another interpretation is that foreign-
owned plants tend to be situated in industries where locally owned plants have high
7 Buildings, machinery and equipment, vehicles and other fixed capital were respectively deflated using
wholesale indices for construction materials of buildings, imported machinery, transport machinery, and the
general wholesale price index (BPS-Statistics, various years b); then the sum of the four categories was
calculated as the measure of capital stock for each plant. In addition, because consistent data on capital stock in
1996 are not available, the capital stock in 1996 was interpolated using data for 1995 and 1997.
15
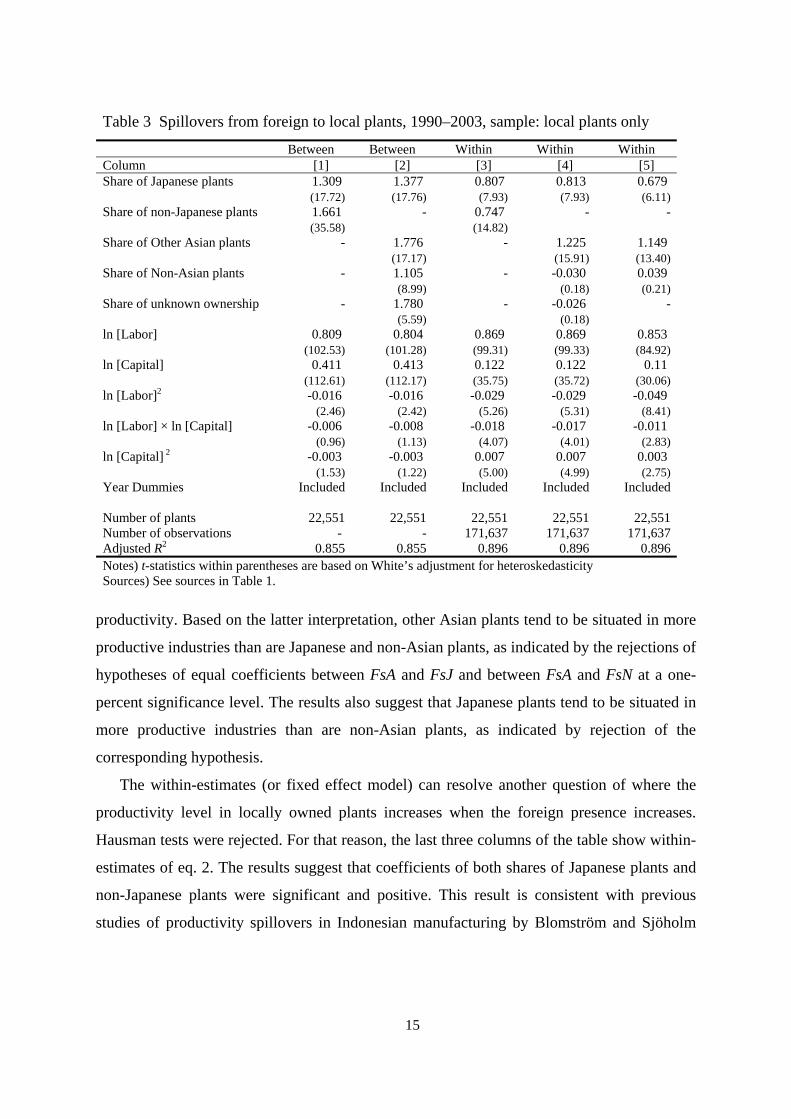
productivity. Based on the latter interpretation, other Asian plants tend to be situated in more
productive industries than are Japanese and non-Asian plants, as indicated by the rejections of
hypotheses of equal coefficients between FsA and FsJ and between FsA and FsN at a one-
percent significance level. The results also suggest that Japanese plants tend to be situated in
more productive industries than are non-Asian plants, as indicated by rejection of the
corresponding hypothesis.
The within-estimates (or fixed effect model) can resolve another question of where the
productivity level in locally owned plants increases when the foreign presence increases.
Hausman tests were rejected. For that reason, the last three columns of the table show within-
estimates of eq. 2. The results suggest that coefficients of both shares of Japanese plants and
non-Japanese plants were significant and positive. This result is consistent with previous
studies of productivity spillovers in Indonesian manufacturing by Blomström and Sjöholm
Table 3 Spillovers from foreign to local plants, 1990–2003, sample: local plants only
Between Between Within Within Within Column [1] [2] [3] [4] [5] Share of Japanese plants 1.309 1.377 0.807 0.813 0.679 (17.72) (17.76) (7.93) (7.93) (6.11)Share of non-Japanese plants 1.661 - 0.747 - - (35.58) (14.82) Share of Other Asian plants - 1.776 - 1.225 1.149 (17.17) (15.91) (13.40)Share of Non-Asian plants - 1.105 - -0.030 0.039 (8.99) (0.18) (0.21)Share of unknown ownership - 1.780 - -0.026 - (5.59) (0.18) ln [Labor] 0.809 0.804 0.869 0.869 0.853 (102.53) (101.28) (99.31) (99.33) (84.92)ln [Capital] 0.411 0.413 0.122 0.122 0.11 (112.61) (112.17) (35.75) (35.72) (30.06)ln [Labor]2 -0.016 -0.016 -0.029 -0.029 -0.049 (2.46) (2.42) (5.26) (5.31) (8.41)ln [Labor] × ln [Capital] -0.006 -0.008 -0.018 -0.017 -0.011 (0.96) (1.13) (4.07) (4.01) (2.83)ln [Capital] 2 -0.003 -0.003 0.007 0.007 0.003 (1.53) (1.22) (5.00) (4.99) (2.75)Year Dummies Included Included Included Included Included Number of plants 22,551 22,551 22,551 22,551 22,551Number of observations - - 171,637 171,637 171,637Adjusted R2 0.855 0.855 0.896 0.896 0.896Notes) t-statistics within parentheses are based on White’s adjustment for heteroskedasticity Sources) See sources in Table 1.
16
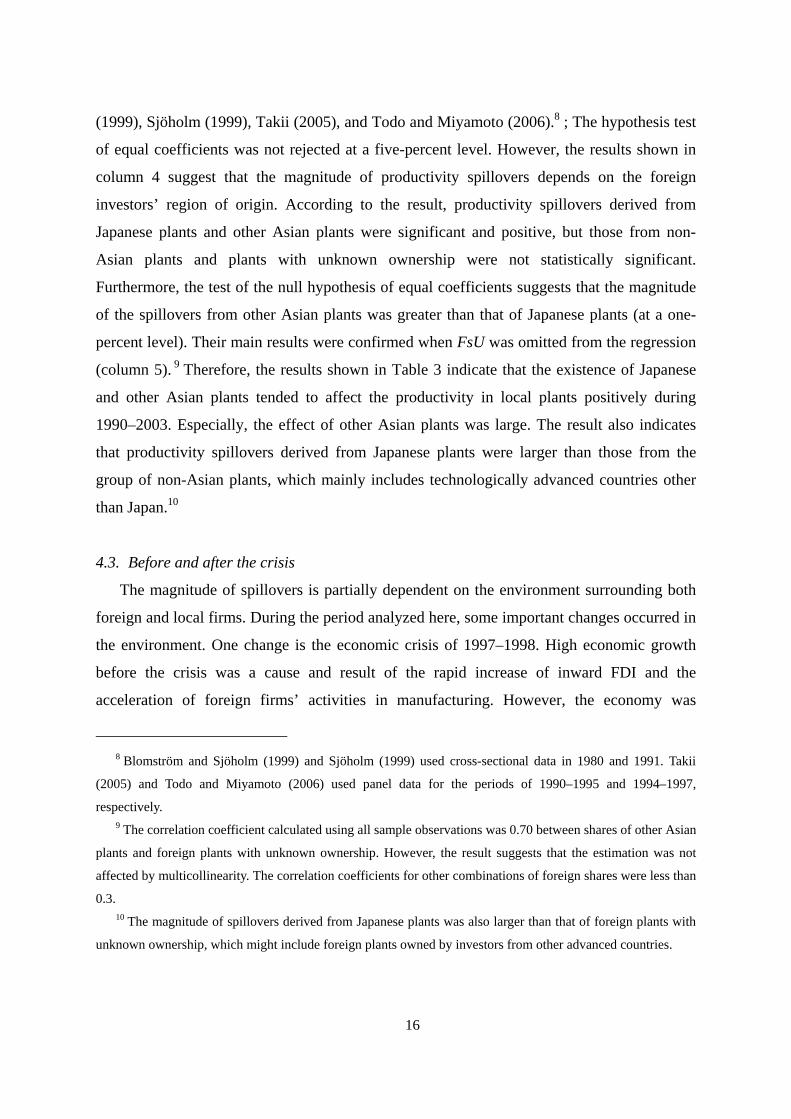
(1999), Sjöholm (1999), Takii (2005), and Todo and Miyamoto (2006).8 ; The hypothesis test
of equal coefficients was not rejected at a five-percent level. However, the results shown in
column 4 suggest that the magnitude of productivity spillovers depends on the foreign
investors’ region of origin. According to the result, productivity spillovers derived from
Japanese plants and other Asian plants were significant and positive, but those from non-
Asian plants and plants with unknown ownership were not statistically significant.
Furthermore, the test of the null hypothesis of equal coefficients suggests that the magnitude
of the spillovers from other Asian plants was greater than that of Japanese plants (at a one-
percent level). Their main results were confirmed when FsU was omitted from the regression
(column 5). 9 Therefore, the results shown in Table 3 indicate that the existence of Japanese
and other Asian plants tended to affect the productivity in local plants positively during
1990–2003. Especially, the effect of other Asian plants was large. The result also indicates
that productivity spillovers derived from Japanese plants were larger than those from the
group of non-Asian plants, which mainly includes technologically advanced countries other
than Japan.10
4.3. Before and after the crisis
The magnitude of spillovers is partially dependent on the environment surrounding both
foreign and local firms. During the period analyzed here, some important changes occurred in
the environment. One change is the economic crisis of 1997–1998. High economic growth
before the crisis was a cause and result of the rapid increase of inward FDI and the
acceleration of foreign firms’ activities in manufacturing. However, the economy was
8 Blomström and Sjöholm (1999) and Sjöholm (1999) used cross-sectional data in 1980 and 1991. Takii
(2005) and Todo and Miyamoto (2006) used panel data for the periods of 1990–1995 and 1994–1997,
respectively. 9 The correlation coefficient calculated using all sample observations was 0.70 between shares of other Asian
plants and foreign plants with unknown ownership. However, the result suggests that the estimation was not
affected by multicollinearity. The correlation coefficients for other combinations of foreign shares were less than
0.3. 10 The magnitude of spillovers derived from Japanese plants was also larger than that of foreign plants with
unknown ownership, which might include foreign plants owned by investors from other advanced countries.
17
severely affected by the crisis: economic growth rates were lower those of the pre-crisis
period. A putative cause of low economic growth has been low FDI. The sluggish demand
would affect the performance of local and foreign plants and their mutual relationship. For
example, some foreign plants might start production of intermediate products that had been
previously produced by and procured from local firms in response to the decreased demand.
Therefore, the spillovers might be impeded. In addition, movements toward economic
integration would also change the procurement system of intermediate products and would
affect the magnitude of productivity spillovers.
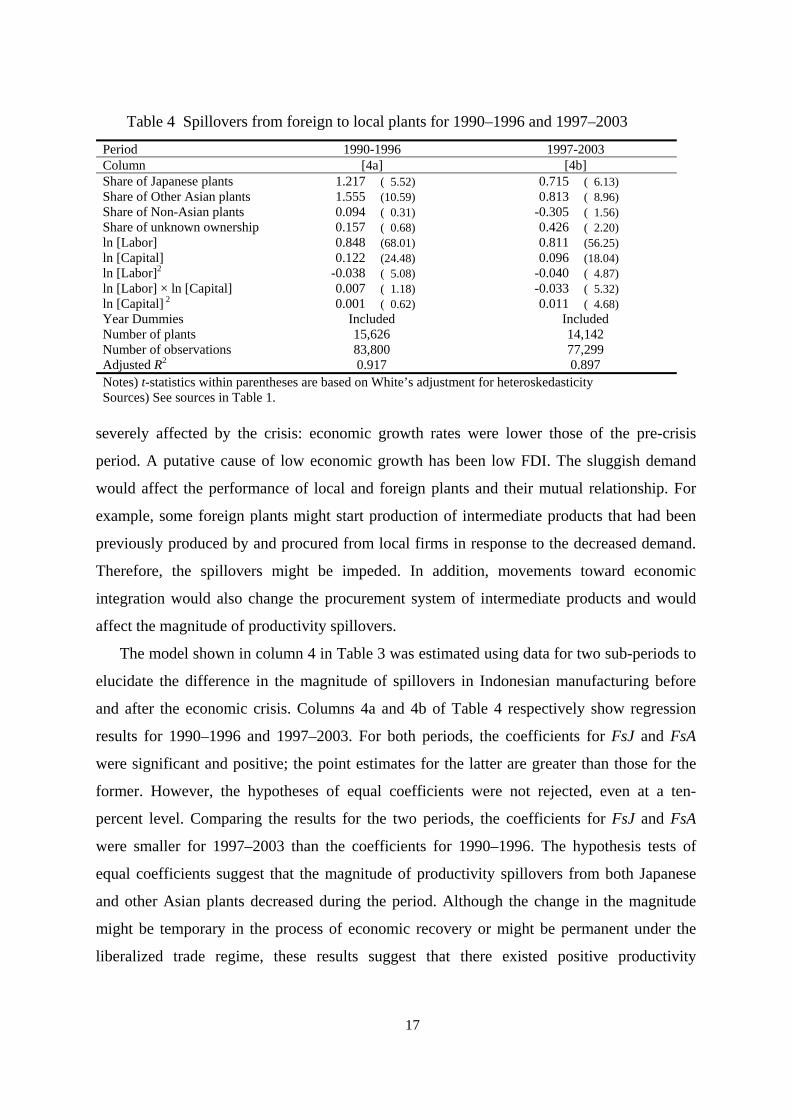
The model shown in column 4 in Table 3 was estimated using data for two sub-periods to
elucidate the difference in the magnitude of spillovers in Indonesian manufacturing before
and after the economic crisis. Columns 4a and 4b of Table 4 respectively show regression
results for 1990–1996 and 1997–2003. For both periods, the coefficients for FsJ and FsA
were significant and positive; the point estimates for the latter are greater than those for the
former. However, the hypotheses of equal coefficients were not rejected, even at a ten-
percent level. Comparing the results for the two periods, the coefficients for FsJ and FsA
were smaller for 1997–2003 than the coefficients for 1990–1996. The hypothesis tests of
equal coefficients suggest that the magnitude of productivity spillovers from both Japanese
and other Asian plants decreased during the period. Although the change in the magnitude
might be temporary in the process of economic recovery or might be permanent under the
liberalized trade regime, these results suggest that there existed positive productivity
Table 4 Spillovers from foreign to local plants for 1990–1996 and 1997–2003
Period 1990-1996 1997-2003 Column [4a] [4b] Share of Japanese plants 1.217 ( 5.52) 0.715 ( 6.13) Share of Other Asian plants 1.555 (10.59) 0.813 ( 8.96) Share of Non-Asian plants 0.094 ( 0.31) -0.305 ( 1.56) Share of unknown ownership 0.157 ( 0.68) 0.426 ( 2.20) ln [Labor] 0.848 (68.01) 0.811 (56.25) ln [Capital] 0.122 (24.48) 0.096 (18.04) ln [Labor]2 -0.038 ( 5.08) -0.040 ( 4.87) ln [Labor] × ln [Capital] 0.007 ( 1.18) -0.033 ( 5.32) ln [Capital] 2 0.001 ( 0.62) 0.011 ( 4.68) Year Dummies Included Included Number of plants 15,626 14,142 Number of observations 83,800 77,299 Adjusted R2 0.917 0.897 Notes) t-statistics within parentheses are based on White’s adjustment for heteroskedasticity Sources) See sources in Table 1.
18
spillovers, but that the magnitude decreased after the economic crisis. Another difference that
is apparent before and after the economic crisis is the coefficients for FsU, which was
significant and positive for 1997–2003, indicating that some important foreign-owned plants
were included in this group.
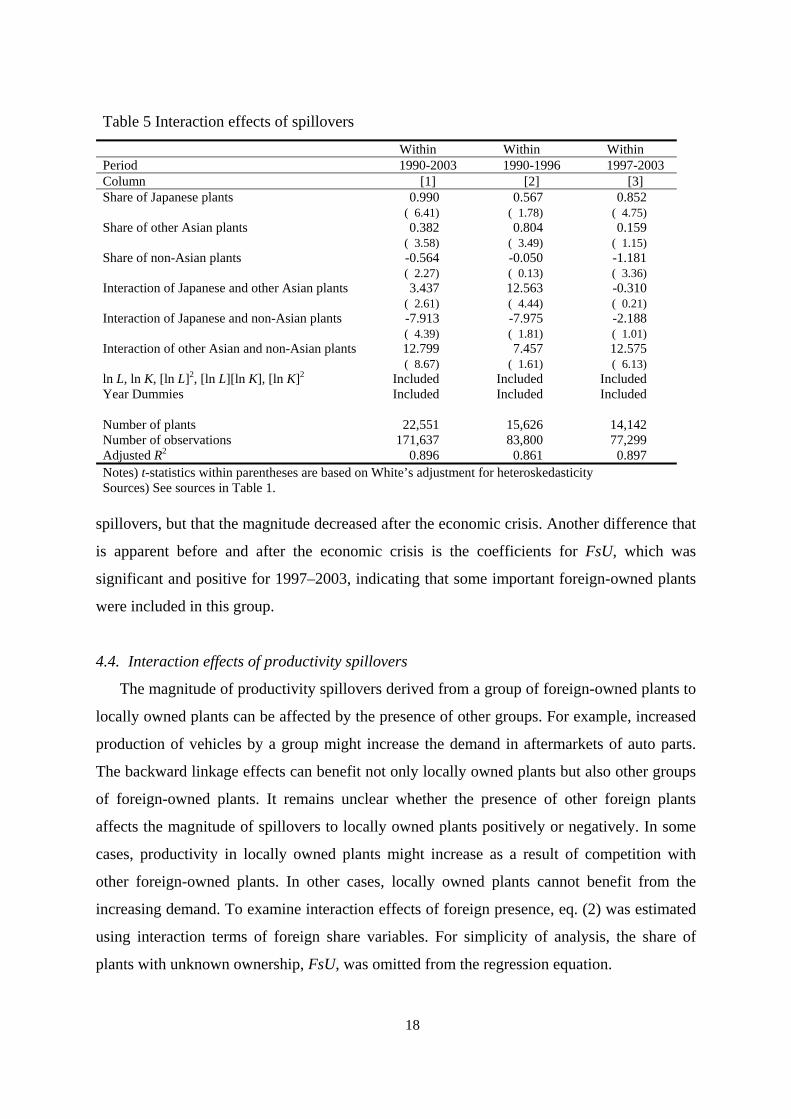
4.4. Interaction effects of productivity spillovers
The magnitude of productivity spillovers derived from a group of foreign-owned plants to
locally owned plants can be affected by the presence of other groups. For example, increased
production of vehicles by a group might increase the demand in aftermarkets of auto parts.
The backward linkage effects can benefit not only locally owned plants but also other groups
of foreign-owned plants. It remains unclear whether the presence of other foreign plants
affects the magnitude of spillovers to locally owned plants positively or negatively. In some
cases, productivity in locally owned plants might increase as a result of competition with
other foreign-owned plants. In other cases, locally owned plants cannot benefit from the
increasing demand. To examine interaction effects of foreign presence, eq. (2) was estimated
using interaction terms of foreign share variables. For simplicity of analysis, the share of
plants with unknown ownership, FsU, was omitted from the regression equation.
Table 5 Interaction effects of spillovers
Within Within Within Period 1990-2003 1990-1996 1997-2003 Column [1] [2] [3] Share of Japanese plants 0.990 0.567 0.852
( 6.41) ( 1.78) ( 4.75) Share of other Asian plants 0.382 0.804 0.159
( 3.58) ( 3.49) ( 1.15) Share of non-Asian plants -0.564 -0.050 -1.181
( 2.27) ( 0.13) ( 3.36) Interaction of Japanese and other Asian plants 3.437 12.563 -0.310
( 2.61) ( 4.44) ( 0.21) Interaction of Japanese and non-Asian plants -7.913 -7.975 -2.188
( 4.39) ( 1.81) ( 1.01) Interaction of other Asian and non-Asian plants 12.799 7.457 12.575
( 8.67) ( 1.61) ( 6.13) ln L, ln K, [ln L]2, [ln L][ln K], [ln K]2 Included Included Included Year Dummies Included Included Included
Number of plants 22,551 15,626 14,142 Number of observations 171,637 83,800 77,299 Adjusted R2 0.896 0.861 0.897 Notes) t-statistics within parentheses are based on White’s adjustment for heteroskedasticity Sources) See sources in Table 1.
19
The estimation results shown in Table 5 suggest that the interaction terms of Japanese
plants and other Asian plants were significant and positive for 1990–2003 and for 1990–1997,
which indicates that the degree of productivity spillovers derived from Japanese plants (other
Asian plants) increases with the presence of other Asian plants (Japanese plants). Similarly,
interaction terms of other Asian and non-Asian plants were also significant and positive for
1990–2003 and for 1997–2003. On the other hand, the interaction term of Japanese and non-
Asian plants, both of which are mainly from developed economies, was significant and
negative for 1990–2003. These indicate that the combination of MNCs from developed and
less-developed economies enhances the productivity spillovers from foreign-owned plants to
locally owned plants. An interpretation is that developed countries’ MNCs impart externality
effects on companies engaging in labor-intensive activities, and that competition between
local firms and less-developed countries’ MNCs increased benefits from the externality.
Nevertheless, the interaction term of Japanese and other Asian plants was not statistically
significant for 1997–2003.
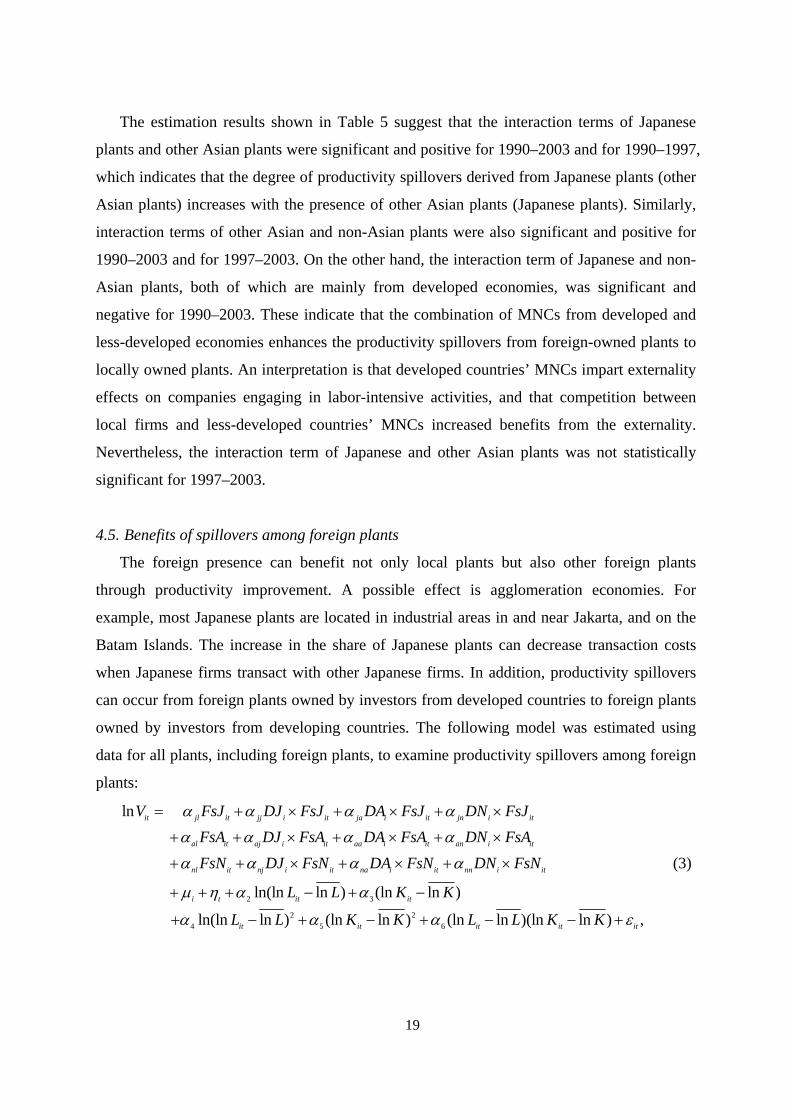
4.5. Benefits of spillovers among foreign plants
The foreign presence can benefit not only local plants but also other foreign plants
through productivity improvement. A possible effect is agglomeration economies. For
example, most Japanese plants are located in industrial areas in and near Jakarta, and on the
Batam Islands. The increase in the share of Japanese plants can decrease transaction costs
when Japanese firms transact with other Japanese firms. In addition, productivity spillovers
can occur from foreign plants owned by investors from developed countries to foreign plants
owned by investors from developing countries. The following model was estimated using
data for all plants, including foreign plants, to examine productivity spillovers among foreign
plants:
2 3
4
ln
ln(ln ln ) (ln ln )
ln(ln ln
it jl it jj i it ja i it jn i it
al it aj i it aa i it an i it
nl it nj i it na i it nn i it
i t it it
it
V FsJ DJ FsJ DA FsJ DN FsJFsA DJ FsA DA FsA DN FsAFsN DJ FsN DA FsN DN FsN
L L K K
L L
α α α α
α α α α
α α α α
μ η α α
α
= + × + × + ×
+ + × + × + ×
+ + × + × + ×
+ + + − + −
+ − 2 25 6) (ln ln ) (ln ln )(ln ln ) ,it it it itK K L L K Kα α ε+ − + − − +
(3)
20
where DJ, DA, and DN are dummy variables which respectively equal one if a plant is a
Japanese plant, other Asian plant, and a non-Asian plant. The coefficients αxy (x, y=J, A, N, L)
can be interpreted as the magnitude of spillovers from a group of foreign plants to other
groups of plants.
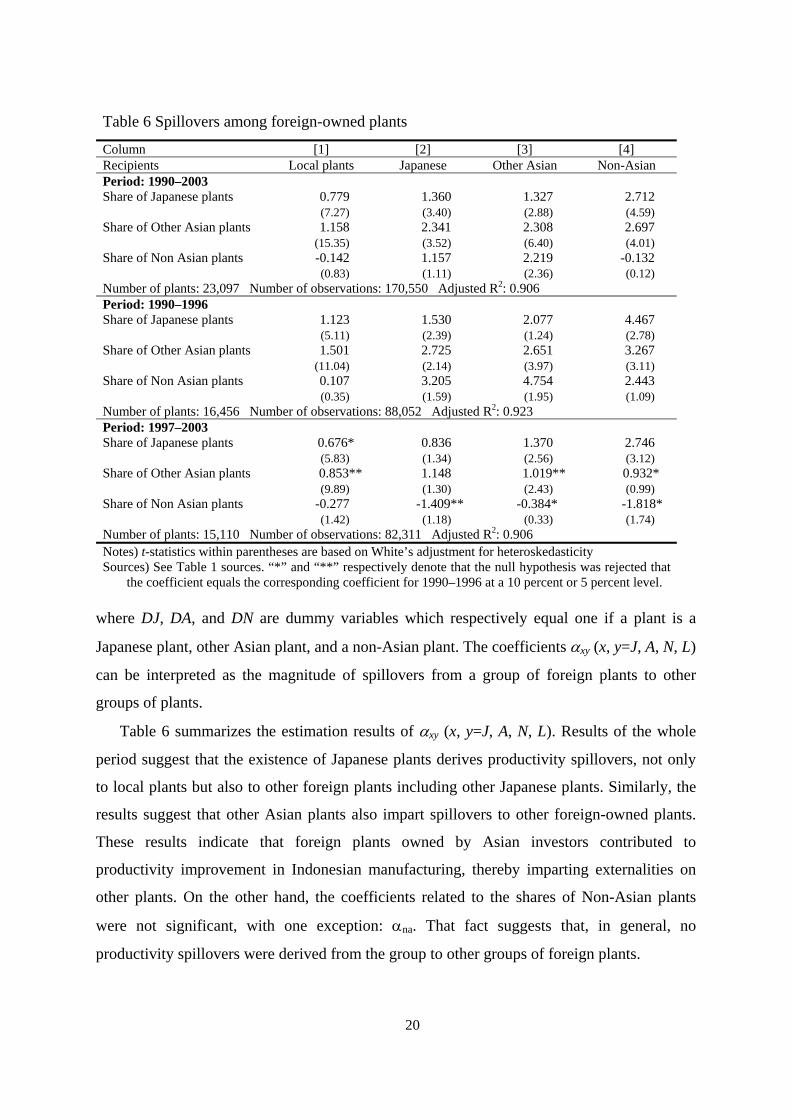
Table 6 summarizes the estimation results of αxy (x, y=J, A, N, L). Results of the whole
period suggest that the existence of Japanese plants derives productivity spillovers, not only
to local plants but also to other foreign plants including other Japanese plants. Similarly, the
results suggest that other Asian plants also impart spillovers to other foreign-owned plants.
These results indicate that foreign plants owned by Asian investors contributed to
productivity improvement in Indonesian manufacturing, thereby imparting externalities on
other plants. On the other hand, the coefficients related to the shares of Non-Asian plants
were not significant, with one exception: αna. That fact suggests that, in general, no
productivity spillovers were derived from the group to other groups of foreign plants.
Table 6 Spillovers among foreign-owned plants
Column [1] [2] [3] [4] Recipients Local plants Japanese Other Asian Non-Asian Period: 1990–2003 Share of Japanese plants 0.779 1.360 1.327 2.712 (7.27) (3.40) (2.88) (4.59) Share of Other Asian plants 1.158 2.341 2.308 2.697 (15.35) (3.52) (6.40) (4.01) Share of Non Asian plants -0.142 1.157 2.219 -0.132 (0.83) (1.11) (2.36) (0.12) Number of plants: 23,097 Number of observations: 170,550 Adjusted R2: 0.906 Period: 1990–1996 Share of Japanese plants 1.123 1.530 2.077 4.467 (5.11) (2.39) (1.24) (2.78) Share of Other Asian plants 1.501 2.725 2.651 3.267 (11.04) (2.14) (3.97) (3.11) Share of Non Asian plants 0.107 3.205 4.754 2.443 (0.35) (1.59) (1.95) (1.09) Number of plants: 16,456 Number of observations: 88,052 Adjusted R2: 0.923 Period: 1997–2003 Share of Japanese plants 0.676* 0.836 1.370 2.746 (5.83) (1.34) (2.56) (3.12) Share of Other Asian plants 0.853** 1.148 1.019** 0.932* (9.89) (1.30) (2.43) (0.99) Share of Non Asian plants -0.277 -1.409** -0.384* -1.818* (1.42) (1.18) (0.33) (1.74) Number of plants: 15,110 Number of observations: 82,311 Adjusted R2: 0.906 Notes) t-statistics within parentheses are based on White’s adjustment for heteroskedasticity Sources) See Table 1 sources. “*” and “**” respectively denote that the null hypothesis was rejected that
the coefficient equals the corresponding coefficient for 1990–1996 at a 10 percent or 5 percent level.
21
Results of estimation by period suggest that Japanese plants benefited from other
Japanese plants in the group of Japanese plants and other Asian plants during 1990–1996.
However, the results for the latter period suggest that these positive effects disappeared in a
statistical sense. On the other hand, the effects from Japanese plants to other Asian plants
turned to be significant and positive in 1997–2003, which indicates the consistency of the
interpretation described in the previous subsection. Similarly, with the effects on the
productivity in local plants, the magnitude of the externality among the foreign groups
decreased after the economic crisis for some cases. These results indicated that the benefit for
foreign plants operating in Indonesian manufacturing was decreased in terms of externalities
derived from and within the foreign groups.
5. Discussion and concluding remarks
Using the newly constructed database, this paper has described the effects of intra-
regional FDI on the performance of locally owned plants. Several implications were derived
from the analyses. First, results of analyses confirmed that Japanese MNCs have accounted
for large shares of employment and value added in Indonesian large and medium
manufacturing, which amount to more than the combined shares of non-Asian countries’
MNCs. Results also confirmed that the presence of eastern Asian less-developed countries’
MNCs has increased drastically since the mid-1980s. These suggest that intra-regional inward
FDI, including that from Japan, has contributed greatly to manufacturing growth in Indonesia
because the remarkable economic growth in the country was a cause and consequence of the
increased inward FDI during recent decades.
Second, eastern Asian less-developed countries’ MNCs show several characteristics that
differ from those of MNCs from developed countries. The results of analysis suggest that the
level of labor productivity and capital intensity in foreign MNCs depends on the stage of
economic development in home economies. Labor productivity and capital intensity of
eastern Asian less-developed countries’ MNCs were confirmed as lower in several industries
than they were in developed countries’ MNCs from Japan and non-Asian countries, which
indicates that the activities by less-developed countries’ MNCs differ from those of other
22
MNCs and are rather similar to those of locally owned plants, which are characterized as less
technology-intensive and less capital-intensive.
The related third result is that productivity spillovers from eastern Asian less-developed
countries’ MNCs are stronger than those of developed countries’ MNCs. This result is
consistent with the results described by Kokko (1994) and Takii (2005), which suggest that
the wider technological gaps between foreign and local firms decrease the magnitude of
productivity spillovers. The result is also supportive of the view that the appropriateness of
technology is an important determinant of productivity spillovers. Furthermore, technological
similarity and product similarity foster higher competition, which might force local firms to
enhance competitiveness. The result also supports the movement to regionalism in eastern
Asia, which would promote intra-regional FDI.
Fourth, the results of analyses also suggest that Japanese MNCs imparted positive
productivity spillovers to local firms whereas non-Asian developed countries’ MNCs did not
have significant effects. Although the magnitude of spillovers derived from Japanese MNCs
was smaller than that of less-developed countries’ MNCs in the region, the results suggest
that Japanese MNCs contribute to the development of the manufacturing sectors in terms not
only of growth of employment and value added but also in terms of external effects on
productivity in local firms.
Fifth, a more important implication is that these effects of FDI have synergistic effects. In
other words, productivity spillovers were enhanced when both developed and less-developed
countries’ MNCs existed in an industry. The results of empirical analyses, for example,
suggest that the magnitude of spillovers from eastern Asian less-developed countries’ MNCs
was positively correlated with the presence of Japanese MNCs during 1990–1996.
Furthermore, the average productivity level in eastern Asian less-developed countries’ MNCs
was also correlated with the presence of Japanese MNCs. The effect in the opposite direction
was also confirmed. These indicate the importance of the existence of developed countries’
MNCs, as well as less-developed countries’ MNCs, for economic development. Assuming
that neighboring countries of a less-developed country are generally less developed, regional
agreement on FDI would benefit member countries through productivity spillovers. However,
the results presented in this paper also suggest that productivity spillovers are enhanced by
the presence of developed countries’ MNCs.
23
Finally, although it is difficult to interpret the results now, the results of analyses suggest
that the magnitude of positive effects from foreign-owned plants decreased after the
economic crisis. An interpretation is that the results for aftermath of the economic crisis do
not reflect the relationship between foreign presence and productivity in local firms, or that
the magnitude of productivity spillovers depends on the economic condition. Another
interpretation is that the characteristics of foreign-owned plants have changed in the
movement toward trade liberalization, including tariff cuts, and the change caused the
decrease on the magnitude of spillovers. However, data for longer periods are necessary to
examine the causes of the decline in the magnitude of spillovers.
References
Agrawal, N. (2002) “The Impact of Deregulation on Employment and Earnings,” in Farrukh Iqbal and William
E. James, (eds), Deregulation and Development in Indonesia, pp. 107-114, Praeger, Westport CT.
American Chamber of Commerce in Indonesia (AmCham) (2005) American Business in Indonesia 2003-2004,
Jakarta, CastleAsia.
Badan Pusat Statistik (2000) Tabel Kesesuaian: Lapangan Usaha/Kegiatan Ekonomi, KBLI2000 KLUI1990
[Comparative Table: Industrial Origin/Economic Activity, KBLI2000 KLUI1990], Badan Pusat Statistik,
Jakarta.
Blomström, M., A. Kokko and M. Zejan (2000) Foreign Direct Investment: Firm and Host Country Strategies,
Macmillan Press, London.
Blomström, M., Persson, H. (1983) “Foreign Investment and Spillover Efficiency in an Underdeveloped
Economy: Evidence from the Mexican Manufacturing Industry,” World Development 11, pp. 493-501.
Blomström, M., Sjöholm, F. (1999) “Technology Transfer and Spillovers: Does Local Participation with
Multinationals Matter?” European Economic Review 43, pp. 915-923.
Blomström, M., Wolff, E.N. (1994) “Multinational Corporations and Productivity Convergence in Mexico,” in
Baumol, W.J., Nelson, R.R., Wolff, E.N. (eds.), Convergence of Productivity: Cross-National Studies and
Historical Evidence. Oxford University Press, Oxford, pp. 263-284.
BPS-Statistics (various years) Diskettes and CD-ROMs containing establishment-level data from Statistik
Industri Besar dan Sedang [Large and Medium Manufacturing Statistics]. Raw data for 1975–2003. Jakarta:
BPS-Statistics.
BPS-Statistics, Indonesia (various years b) Economic Indicators, various issues. BPS-Statistics, Jakarta.
BPS-Statistics, Indonesia (various years c) Manufacturing Industry Directory, various issues. BPS-Statistics,
Jakarta.
24
Caves, R.E. (1974) “Multinational Firms, Competition, and Productivity in Host Country Markets.” Economica
41, pp. 176-193.
Capricorn Indonesia Consult Inc., PT. (CIC) (2003) Indonesian Foreign Joint Venture 2003. CIC, Jakarta.
Capricorn Indonesia Consult Inc., PT. (CIC) (2005) Indonesian Manufactures Directory 2005. CIC, Jakarta.
Chen, E.K.Y. (1990) Foreign Direct Investment in Asia, Asian Productivity Organization, Tokyo.
Dunning, J.H. (1993) Multinational Enterprises and the Global Economy, Addison-Wesley.
Findlay, R. (1978) “Relative backwardness, direct investment and the transfer of technology: a simple dynamic
model,” Quarterly Journal of Economics 92, pp. 1–16.
Globerman, S. (1979) “Foreign Direct Investment and Spillover Efficiency Benefits in Canadian Manufacturing
Industries,” Canadian Journal of Economics 12, pp. 42-56.
Görg, H., Greenaway D. (2004) “Much ado about nothing? Do domestic firms really benefit from foreign direct
investment?” World Bank Research Observer, 19, pp. 171-197.
Japan External Trade Organization (JETRO), Jakarta Center (2005) Directory of Japanese Companies and
Representative Offices in Indonesia, JETRO, Jakarta Center, Jakarta.
Javorcik, B.S., Saggi, K., Spatareanu, M. (2004) “Does It Matter Where You Come From? Vertical Spillovers
from Foreign Direct Investment and the Nationality of Investors,” World Bank Policy Research Working
Paper, No. 3449.
Kokko, A. (1994) “Technology, market characteristics, and spillovers,” Journal of Development Economics 43,
279-293.
Lindblad, J.T., Thee, K.W. (2007) “Survey of Recent Developments,” Bulletin of Indonesian Economic Studies,
43, pp. 7-33.
Lipsey, R.E., Sjöholm, F. (2005) “The impact of inward FDI on host countries: why such different answers?” In
T.H. Moran, E.H. Graham, and M. Blomström (eds.), Does Foreign Direct Investment Promote
Development? Institute for International Economics, Washington, D.C.
Moran, T.H. (2002) Beyond Sweatshops: Foreign Direct Investment and Globalization in Developing Countries,
The Brookings Institution, Washington.
Pangestu, M. (1996) Economic Reform, Deregulation and Privatization, The Indonesian Experience, Centre for
Strategic and International Studies, Jakarta.
Pangestu, M. (2002) Foreign Investment Policy: Evolution and Characteristics, in Farrukh Iqbal and William E.
James (eds), Deregulation and Development in Indonesia, pp. 45-60, Praeger, Westport CT.
Parry, T.G. (1981) “The multinational enterprise and tow-state technology transfer to developing nations,” in
Kumar and McLeod (eds.), Multinational from Developing Countries, Lexington Books.
Rodriguez-Clare, A. (1996) “Multinationals, Linkages, and Economic Development,” American Economic
Review, 86, pp. 852-873.
Sjöholm, F. (1999) “Technology Gap, Competition and Spillovers from Direct Foreign Investment: Evidence
from Establishment Data,” Journal of Development Studies 36, pp. 53-73.
Takii, S. (2005) “Productivity Spillovers and Characteristics of Foreign Multinational Plants in Indonesian
Manufacturing 1990–1995,” Journal of Development Economics 75, pp. 521-542.
25
Takii, S. (2007) “Japanese and Asian Investment in Indonesian Manufacturing,” ICSEAD Working Paper Series
Vol. 2007-12.
Thee, K.W. (1991) “The Surge of Asian NIC Investment into Indonesia,” Bulletin of Indonesian Economic
Studies 27, pp. 55-88.
Todo, Y., Miyamoto, K. (2006) “Knowledge Spillovers from Foreign Direct Investment and the Role of Local
R&D Activities: Evidence from Indonesia,” Economic Development and Cultural Change, 55, pp. 173-200.
Toyo Keizai (various years) Kaigai Shinshutsu Kigyo Soran [Japanese Overseas Investment], 1990–2005
electronic edition, Toyo Keizai, Tokyo.
United Nations Conference on Trade and Development (UNCTAD) (2006) World Investment Report 2006: FDI
from Developing and Transition Economies: Implications for Development, United Nations, New York.