chapter 25 phonetics
TRANSCRIPT

Speech and Language Processing. Daniel Jurafsky & James H. Martin. Copyright © 2020. All
rights reserved. Draft of December 30, 2020.
CHAPTER
25 Phonetics
The characters that make up the texts we’ve been discussing in this book aren’t justrandom symbols. They are also an amazing scientific invention: a theoretical modelof the elements that make up human speech.
The earliest writing systems we know of (Sumerian, Chinese, Mayan) weremainly logographic: one symbol representing a whole word. But from the ear-liest stages we can find, some symbols were also used to represent the soundsthat made up words. The cuneiform sign to the right pro-nounced ba and meaning “ration” in Sumerian could alsofunction purely as the sound /ba/. The earliest Chinese char-acters we have, carved into bones for divination, similarlycontain phonetic elements. Purely sound-based writing systems, whether syllabic(like Japanese hiragana), alphabetic (like the Roman alphabet), or consonantal (likeSemitic writing systems), trace back to these early logo-syllabic systems, often astwo cultures came together. Thus, the Arabic, Aramaic, Hebrew, Greek, and Romansystems all derive from a West Semitic script that is presumed to have been modifiedby Western Semitic mercenaries from a cursive form of Egyptian hieroglyphs. TheJapanese syllabaries were modified from a cursive form of Chinese phonetic charac-ters, which themselves were used in Chinese to phonetically represent the Sanskritin the Buddhist scriptures that came to China in the Tang dynasty.
This implicit idea that the spoken word is composed of smaller units of speechunderlies algorithms for both speech recognition (transcribing waveforms into text)and text-to-speech (converting text into waveforms). In this chapter we give a com-putational perspective on phonetics, the study of the speech sounds used in thephonetics
languages of the world, how they are produced in the human vocal tract, how theyare realized acoustically, and how they can be digitized and processed.
25.1 Speech Sounds and Phonetic Transcription
A letter like ‘p’ or ‘a’ is already a useful model of the sounds of human speech,and indeed we’ll see in Chapter 26 how to map between letters and waveforms.Nonetheless, it is helpful to represent sounds slightly more abstractly. We’ll repre-sent the pronunciation of a word as a string of phones, which are speech sounds,phone
each represented with symbols adapated from the Roman alphabet.The standard phonetic representation for transcribing the world’s languages is
the International Phonetic Alphabet (IPA), an evolving standard first developed inIPA
1888, But in this chapter we’ll instead represent phones with the ARPAbet (Shoup,1980), a simple phonetic alphabet (Fig. 25.1) that conveniently uses ASCII symbolsto represent an American-English subset of the IPA.
Many of the IPA and ARPAbet symbols are equivalent to familiar Roman let-ters. So, for example, the ARPAbet phone [p] represents the consonant sound at the

2 CHAPTER 25 • PHONETICS
ARPAbet IPA ARPAbet ARPAbet IPA ARPAbetSymbol Symbol Word Transcription Symbol Symbol Word Transcription[p] [p] parsley [p aa r s l iy] [iy] [i] lily [l ih l iy][t] [t] tea [t iy] [ih] [I] lily [l ih l iy][k] [k] cook [k uh k] [ey] [eI] daisy [d ey z iy][b] [b] bay [b ey] [eh] [E] pen [p eh n][d] [d] dill [d ih l] [ae] [æ] aster [ae s t axr][g] [g] garlic [g aa r l ix k] [aa] [A] poppy [p aa p iy][m] [m] mint [m ih n t] [ao] [O] orchid [ao r k ix d][n] [n] nutmeg [n ah t m eh g] [uh] [U] wood [w uh d][ng] [N] baking [b ey k ix ng] [ow] [oU] lotus [l ow dx ax s][f] [f] flour [f l aw axr] [uw] [u] tulip [t uw l ix p][v] [v] clove [k l ow v] [ah] [2] butter [b ah dx axr][th] [T] thick [th ih k] [er] [Ç] bird [b er d][dh] [D] those [dh ow z] [ay] [aI] iris [ay r ix s][s] [s] soup [s uw p] [aw] [aU] flower [f l aw axr][z] [z] eggs [eh g z] [oy] [oI] soil [s oy l][sh] [S] squash [s k w aa sh][zh] [Z] ambrosia [ae m b r ow zh ax][ch] [tS] cherry [ch eh r iy][jh] [dZ] jar [jh aa r][l] [l] licorice [l ih k axr ix sh][w] [w] kiwi [k iy w iy][r] [r] rice [r ay s][y] [j] yellow [y eh l ow][h] [h] honey [h ah n iy]
Figure 25.1 ARPAbet and IPA symbols for English consonants (left) and vowels (right).
beginning of platypus, puma, and plantain, the middle of leopard, or the end of an-telope. In general, however, the mapping between the letters of English orthographyand phones is relatively opaque; a single letter can represent very different soundsin different contexts. The English letter c corresponds to phone [k] in cougar [k uwg axr], but phone [s] in cell [s eh l]. Besides appearing as c and k, the phone [k] canappear as part of x (fox [f aa k s]), as ck (jackal [jh ae k el]) and as cc (raccoon [r aek uw n]). Many other languages, for example, Spanish, are much more transparentin their sound-orthography mapping than English.
25.2 Articulatory Phonetics
Articulatory phonetics is the study of how these phones are produced as the variousarticulatoryphonetics
organs in the mouth, throat, and nose modify the airflow from the lungs.
The Vocal Organs
Figure 25.2 shows the organs of speech. Sound is produced by the rapid movementof air. Humans produce most sounds in spoken languages by expelling air from thelungs through the windpipe (technically, the trachea) and then out the mouth ornose. As it passes through the trachea, the air passes through the larynx, commonlyknown as the Adam’s apple or voice box. The larynx contains two small folds of

25.2 • ARTICULATORY PHONETICS 3
Figure 25.2 The vocal organs, shown in side view. (Figure from OpenStax UniversityPhysics, CC BY 4.0)
muscle, the vocal folds (often referred to non-technically as the vocal cords), whichcan be moved together or apart. The space between these two folds is called theglottis. If the folds are close together (but not tightly closed), they will vibrate as airglottis
passes through them; if they are far apart, they won’t vibrate. Sounds made with thevocal folds together and vibrating are called voiced; sounds made without this vocalvoiced sound
cord vibration are called unvoiced or voiceless. Voiced sounds include [b], [d], [g],unvoiced sound
[v], [z], and all the English vowels, among others. Unvoiced sounds include [p], [t],[k], [f], [s], and others.
The area above the trachea is called the vocal tract; it consists of the oral tractand the nasal tract. After the air leaves the trachea, it can exit the body through themouth or the nose. Most sounds are made by air passing through the mouth. Soundsmade by air passing through the nose are called nasal sounds; nasal sounds (likenasal
English [m], [n], and [ng]) use both the oral and nasal tracts as resonating cavities.Phones are divided into two main classes: consonants and vowels. Both kindsconsonant
vowel of sounds are formed by the motion of air through the mouth, throat or nose. Con-sonants are made by restriction or blocking of the airflow in some way, and can bevoiced or unvoiced. Vowels have less obstruction, are usually voiced, and are gen-erally louder and longer-lasting than consonants. The technical use of these terms ismuch like the common usage; [p], [b], [t], [d], [k], [g], [f], [v], [s], [z], [r], [l], etc.,are consonants; [aa], [ae], [ao], [ih], [aw], [ow], [uw], etc., are vowels. Semivow-els (such as [y] and [w]) have some of the properties of both; they are voiced likevowels, but they are short and less syllabic like consonants.

4 CHAPTER 25 • PHONETICS
Consonants: Place of Articulation
Because consonants are made by restricting airflow, we can group them into classesby their point of maximum restriction, their place of articulation (Fig. 25.3).place of
articulation
(nasal tract)
dental
bilabialglottal
palatal velar
alveolar
Figure 25.3 Major English places of articulation.
Labial: Consonants whose main restriction is formed by the two lips coming to-labial
gether have a bilabial place of articulation. In English these include [p] asin possum, [b] as in bear, and [m] as in marmot. The English labiodentalconsonants [v] and [f] are made by pressing the bottom lip against the upperrow of teeth and letting the air flow through the space in the upper teeth.
Dental: Sounds that are made by placing the tongue against the teeth are dentals.dental
The main dentals in English are the [th] of thing and the [dh] of though, whichare made by placing the tongue behind the teeth with the tip slightly betweenthe teeth.
Alveolar: The alveolar ridge is the portion of the roof of the mouth just behind thealveolar
upper teeth. Most speakers of American English make the phones [s], [z], [t],and [d] by placing the tip of the tongue against the alveolar ridge. The wordcoronal is often used to refer to both dental and alveolar.
Palatal: The roof of the mouth (the palate) rises sharply from the back of thepalatal
palate alveolar ridge. The palato-alveolar sounds [sh] (shrimp), [ch] (china), [zh](Asian), and [jh] (jar) are made with the blade of the tongue against the risingback of the alveolar ridge. The palatal sound [y] of yak is made by placing thefront of the tongue up close to the palate.
Velar: The velum, or soft palate, is a movable muscular flap at the very back of thevelar
roof of the mouth. The sounds [k] (cuckoo), [g] (goose), and [N] (kingfisher)are made by pressing the back of the tongue up against the velum.
Glottal: The glottal stop [q] is made by closing the glottis (by bringing the vocalglottal
folds together).
Consonants: Manner of Articulation
Consonants are also distinguished by how the restriction in airflow is made, for ex-ample, by a complete stoppage of air or by a partial blockage. This feature is calledthe manner of articulation of a consonant. The combination of place and mannermanner of
articulationof articulation is usually sufficient to uniquely identify a consonant. Following arethe major manners of articulation for English consonants:
A stop is a consonant in which airflow is completely blocked for a short time.stop
This blockage is followed by an explosive sound as the air is released. The periodof blockage is called the closure, and the explosion is called the release. English
25.2 • ARTICULATORY PHONETICS 5
has voiced stops like [b], [d], and [g] as well as unvoiced stops like [p], [t], and [k].Stops are also called plosives.
The nasal sounds [n], [m], and [ng] are made by lowering the velum and allow-nasal
ing air to pass into the nasal cavity.In fricatives, airflow is constricted but not cut off completely. The turbulentfricatives
airflow that results from the constriction produces a characteristic “hissing” sound.The English labiodental fricatives [f] and [v] are produced by pressing the lowerlip against the upper teeth, allowing a restricted airflow between the upper teeth.The dental fricatives [th] and [dh] allow air to flow around the tongue between theteeth. The alveolar fricatives [s] and [z] are produced with the tongue against thealveolar ridge, forcing air over the edge of the teeth. In the palato-alveolar fricatives[sh] and [zh], the tongue is at the back of the alveolar ridge, forcing air through agroove formed in the tongue. The higher-pitched fricatives (in English [s], [z], [sh]and [zh]) are called sibilants. Stops that are followed immediately by fricatives aresibilants
called affricates; these include English [ch] (chicken) and [jh] (giraffe).In approximants, the two articulators are close together but not close enough toapproximant
cause turbulent airflow. In English [y] (yellow), the tongue moves close to the roofof the mouth but not close enough to cause the turbulence that would characterize africative. In English [w] (wood), the back of the tongue comes close to the velum.American [r] can be formed in at least two ways; with just the tip of the tongueextended and close to the palate or with the whole tongue bunched up near the palate.[l] is formed with the tip of the tongue up against the alveolar ridge or the teeth, withone or both sides of the tongue lowered to allow air to flow over it. [l] is called alateral sound because of the drop in the sides of the tongue.
A tap or flap [dx] is a quick motion of the tongue against the alveolar ridge. Thetap
consonant in the middle of the word lotus ([l ow dx ax s]) is a tap in most dialects ofAmerican English; speakers of many U.K. dialects would use a [t] instead.
Vowels
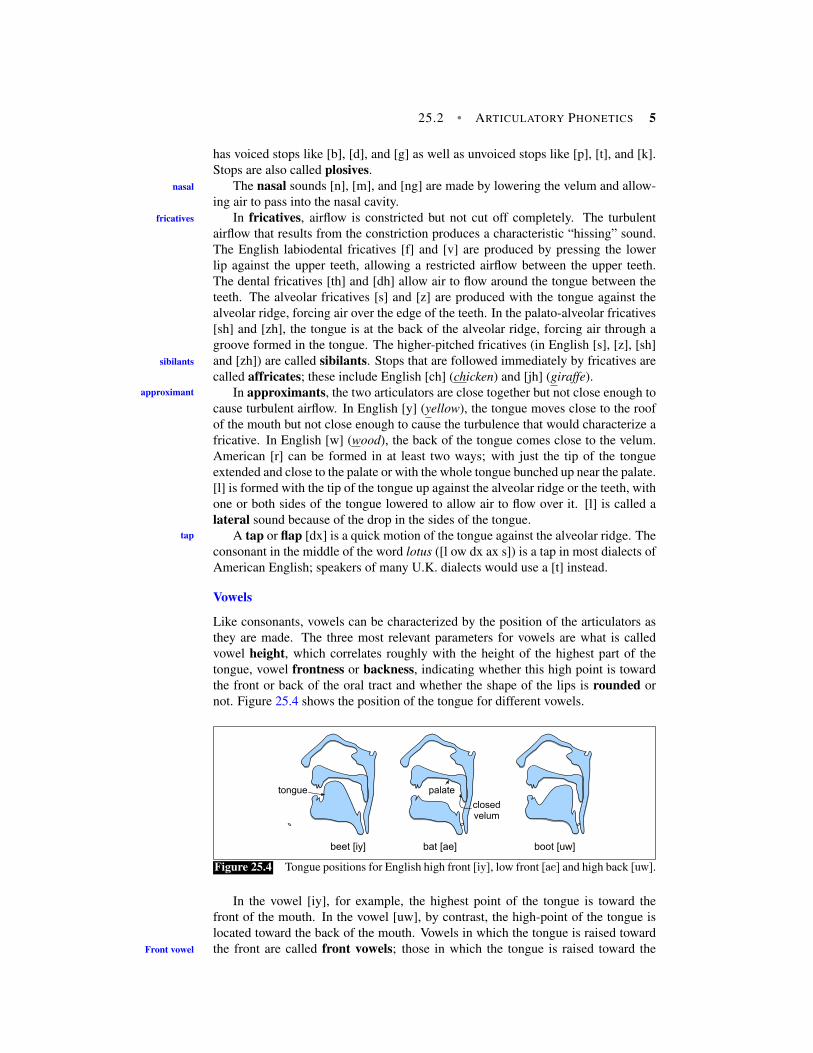
Like consonants, vowels can be characterized by the position of the articulators asthey are made. The three most relevant parameters for vowels are what is calledvowel height, which correlates roughly with the height of the highest part of thetongue, vowel frontness or backness, indicating whether this high point is towardthe front or back of the oral tract and whether the shape of the lips is rounded ornot. Figure 25.4 shows the position of the tongue for different vowels.
boot [uw]
closedvelum
bat [ae]
palate
beet [iy]
tongue
Figure 25.4 Tongue positions for English high front [iy], low front [ae] and high back [uw].
In the vowel [iy], for example, the highest point of the tongue is toward thefront of the mouth. In the vowel [uw], by contrast, the high-point of the tongue islocated toward the back of the mouth. Vowels in which the tongue is raised towardthe front are called front vowels; those in which the tongue is raised toward theFront vowel
6 CHAPTER 25 • PHONETICS
back are called back vowels. Note that while both [ih] and [eh] are front vowels,back vowel
the tongue is higher for [ih] than for [eh]. Vowels in which the highest point of thetongue is comparatively high are called high vowels; vowels with mid or low valueshigh vowel
of maximum tongue height are called mid vowels or low vowels, respectively.
front back
low
high
iy
ih
eh
ae
uw
uh
ax
ahao
aa
y uw
ey ow
oy
ay
aw
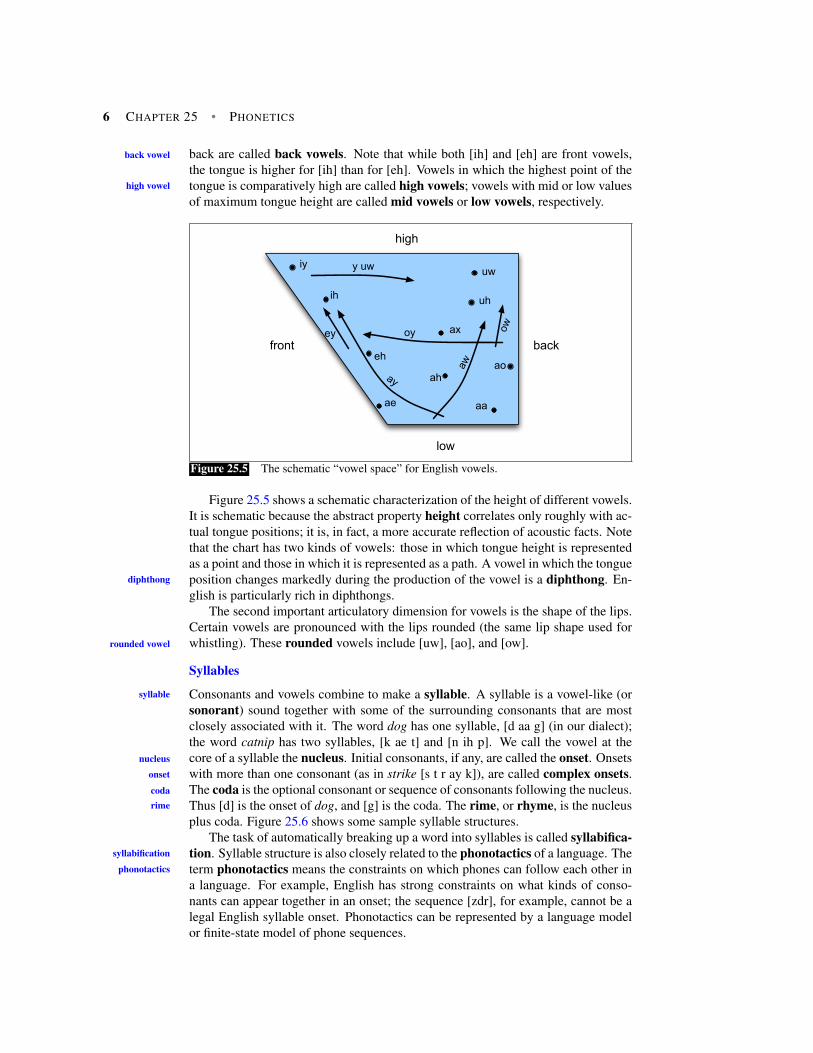
Figure 25.5 The schematic “vowel space” for English vowels.
Figure 25.5 shows a schematic characterization of the height of different vowels.It is schematic because the abstract property height correlates only roughly with ac-tual tongue positions; it is, in fact, a more accurate reflection of acoustic facts. Notethat the chart has two kinds of vowels: those in which tongue height is representedas a point and those in which it is represented as a path. A vowel in which the tongueposition changes markedly during the production of the vowel is a diphthong. En-diphthong
glish is particularly rich in diphthongs.The second important articulatory dimension for vowels is the shape of the lips.
Certain vowels are pronounced with the lips rounded (the same lip shape used forwhistling). These rounded vowels include [uw], [ao], and [ow].rounded vowel
Syllables
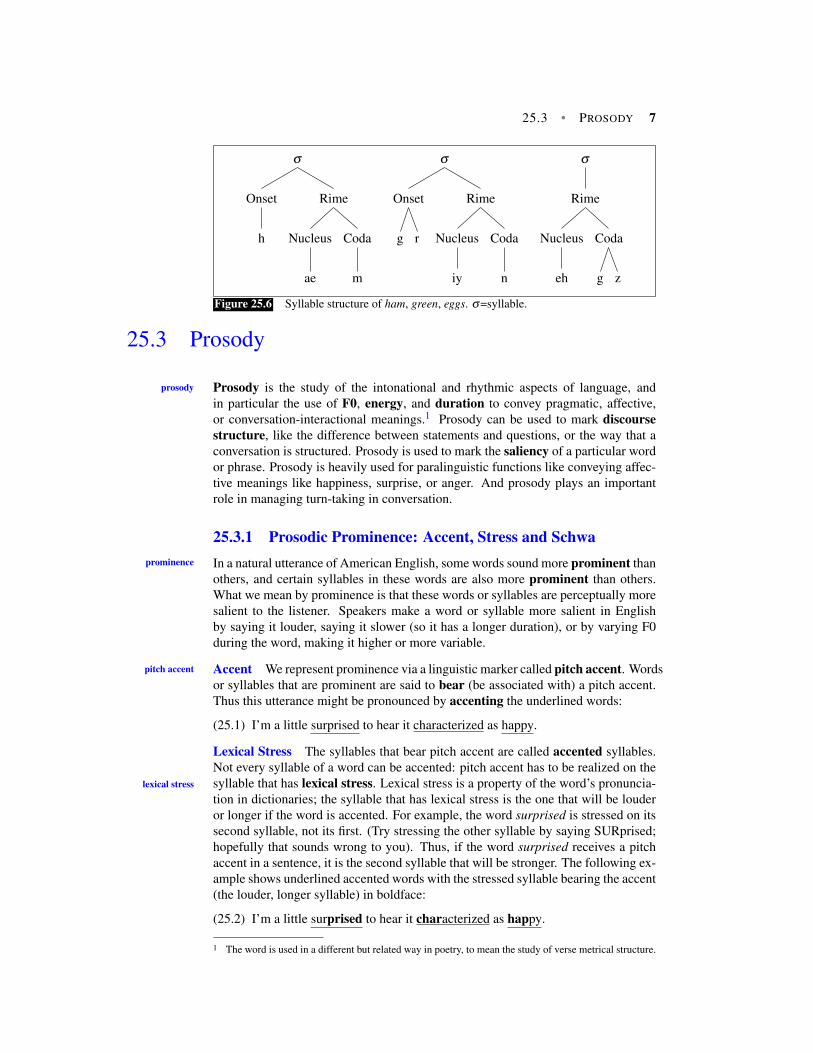
Consonants and vowels combine to make a syllable. A syllable is a vowel-like (orsyllable
sonorant) sound together with some of the surrounding consonants that are mostclosely associated with it. The word dog has one syllable, [d aa g] (in our dialect);the word catnip has two syllables, [k ae t] and [n ih p]. We call the vowel at thecore of a syllable the nucleus. Initial consonants, if any, are called the onset. Onsetsnucleus
onset with more than one consonant (as in strike [s t r ay k]), are called complex onsets.The coda is the optional consonant or sequence of consonants following the nucleus.coda
Thus [d] is the onset of dog, and [g] is the coda. The rime, or rhyme, is the nucleusrime
plus coda. Figure 25.6 shows some sample syllable structures.The task of automatically breaking up a word into syllables is called syllabifica-
tion. Syllable structure is also closely related to the phonotactics of a language. Thesyllabification
term phonotactics means the constraints on which phones can follow each other inphonotactics
a language. For example, English has strong constraints on what kinds of conso-nants can appear together in an onset; the sequence [zdr], for example, cannot be alegal English syllable onset. Phonotactics can be represented by a language modelor finite-state model of phone sequences.
25.3 • PROSODY 7
σ
Rime
Coda
m
Nucleus
ae
Onset
h
σ
Rime
Coda
n
Nucleus
iy
Onset
rg
σ
Rime
Coda
zg
Nucleus
eh
Figure 25.6 Syllable structure of ham, green, eggs. σ=syllable.
25.3 Prosody
Prosody is the study of the intonational and rhythmic aspects of language, andprosody
in particular the use of F0, energy, and duration to convey pragmatic, affective,or conversation-interactional meanings.1 Prosody can be used to mark discoursestructure, like the difference between statements and questions, or the way that aconversation is structured. Prosody is used to mark the saliency of a particular wordor phrase. Prosody is heavily used for paralinguistic functions like conveying affec-tive meanings like happiness, surprise, or anger. And prosody plays an importantrole in managing turn-taking in conversation.
25.3.1 Prosodic Prominence: Accent, Stress and SchwaIn a natural utterance of American English, some words sound more prominent thanprominence
others, and certain syllables in these words are also more prominent than others.What we mean by prominence is that these words or syllables are perceptually moresalient to the listener. Speakers make a word or syllable more salient in Englishby saying it louder, saying it slower (so it has a longer duration), or by varying F0during the word, making it higher or more variable.
Accent We represent prominence via a linguistic marker called pitch accent. Wordspitch accent
or syllables that are prominent are said to bear (be associated with) a pitch accent.Thus this utterance might be pronounced by accenting the underlined words:
(25.1) I’m a little surprised to hear it characterized as happy.
Lexical Stress The syllables that bear pitch accent are called accented syllables.Not every syllable of a word can be accented: pitch accent has to be realized on thesyllable that has lexical stress. Lexical stress is a property of the word’s pronuncia-lexical stress
tion in dictionaries; the syllable that has lexical stress is the one that will be louderor longer if the word is accented. For example, the word surprised is stressed on itssecond syllable, not its first. (Try stressing the other syllable by saying SURprised;hopefully that sounds wrong to you). Thus, if the word surprised receives a pitchaccent in a sentence, it is the second syllable that will be stronger. The following ex-ample shows underlined accented words with the stressed syllable bearing the accent(the louder, longer syllable) in boldface:
(25.2) I’m a little surprised to hear it characterized as happy.
1 The word is used in a different but related way in poetry, to mean the study of verse metrical structure.

8 CHAPTER 25 • PHONETICS
Stress is marked in dictionaries. The CMU dictionary (CMU, 1993), for ex-ample, marks vowels with 0 (unstressed) or 1 (stressed) as in entries for counter:[K AW1 N T ER0], or table: [T EY1 B AH0 L]. Difference in lexical stress canaffect word meaning; the noun content is pronounced [K AA1 N T EH0 N T], whilethe adjective is pronounced [K AA0 N T EH1 N T].
Reduced Vowels and Schwa Unstressed vowels can be weakened even further toreduced vowels, the most common of which is schwa ([ax]), as in the second vowelreduced vowel
schwa of parakeet: [p ae r ax k iy t]. In a reduced vowel the articulatory gesture isn’t ascomplete as for a full vowel. Not all unstressed vowels are reduced; any vowel, anddiphthongs in particular, can retain its full quality even in unstressed position. Forexample, the vowel [iy] can appear in stressed position as in the word eat [iy t] or inunstressed position as in the word carry [k ae r iy].
In summary, there is a continuum of prosodic prominence, for which it is oftenprominence
useful to represent levels like accented, stressed, full vowel, and reduced vowel.
25.3.2 Prosodic StructureSpoken sentences have prosodic structure: some words seem to group naturally to-gether, while some words seem to have a noticeable break or disjuncture betweenthem. Prosodic structure is often described in terms of prosodic phrasing, mean-prosodic
phrasinging that an utterance has a prosodic phrase structure in a similar way to it havinga syntactic phrase structure. For example, the sentence I wanted to go to London,but could only get tickets for France seems to have two main intonation phrases,intonation
phrasetheir boundary occurring at the comma. Furthermore, in the first phrase, there seemsto be another set of lesser prosodic phrase boundaries (often called intermediatephrases) that split up the words as I wanted | to go | to London. These kinds ofintermediate
phraseintonation phrases are often correlated with syntactic structure constituents (Priceet al. 1991, Bennett and Elfner 2019).
Automatically predicting prosodic boundaries can be important for tasks likeTTS. Modern approaches use sequence models that take either raw text or text an-notated with features like parse trees as input, and make a break/no-break decisionat each word boundary. They can be trained on data labeled for prosodic structurelike the Boston University Radio News Corpus (Ostendorf et al., 1995).
25.3.3 TuneTwo utterances with the same prominence and phrasing patterns can still differprosodically by having different tunes. The tune of an utterance is the rise andtune
fall of its F0 over time. A very obvious example of tune is the difference betweenstatements and yes-no questions in English. The same words can be said with a finalF0 rise to indicate a yes-no question (called a question rise):question rise
You know what I mean ?
or a final drop in F0 (called a final fall) to indicate a declarative intonation:final fall
You know what I mean .
Languages make wide use of tune to express meaning (Xu, 2005). In English,

25.4 • ACOUSTIC PHONETICS AND SIGNALS 9
for example, besides this well-known rise for yes-no questions, a phrase containinga list of nouns separated by commas often has a short rise called a continuationrise after each noun. Other examples include the characteristic English contours forcontinuation
riseexpressing contradiction and expressing surprise.
Linking Prominence and Tune
Pitch accents come in different varieties that are related to tune; high pitched accents,for example, have different functions than low pitched accents. There are manytypologies of accent classes in different languages. One such typology is part of theToBI (Tone and Break Indices) theory of intonation (Silverman et al. 1992). EachToBI
word in ToBI can be associated with one of five types of pitch accents shown inin Fig. 25.7. Each utterance in ToBI consists of a sequence of intonational phrases,each of which ends in one of four boundary tones shown in Fig. 25.7, representingboundary tone
the utterance final aspects of tune. There are version of ToBI for many languages.
Pitch Accents Boundary TonesH* peak accent L-L% “final fall”: “declarative contour” of American
EnglishL* low accent L-H% continuation riseL*+H scooped accent H-H% “question rise”: cantonical yes-no question
contourL+H* rising peak accent H-L% final level plateauH+!H* step down
Figure 25.7 The accent and boundary tones labels from the ToBI transcription system forAmerican English intonation (Beckman and Ayers 1997, Beckman and Hirschberg 1994).
25.4 Acoustic Phonetics and Signals
We begin with a very brief introduction to the acoustic waveform and its digitizationand frequency analysis; the interested reader is encouraged to consult the referencesat the end of the chapter.
25.4.1 WavesAcoustic analysis is based on the sine and cosine functions. Figure 25.8 shows aplot of a sine wave, in particular the function
y = A∗ sin(2π f t) (25.3)
where we have set the amplitude A to 1 and the frequency f to 10 cycles per second.Recall from basic mathematics that two important characteristics of a wave are
its frequency and amplitude. The frequency is the number of times a second that afrequency
amplitude wave repeats itself, that is, the number of cycles. We usually measure frequency incycles per second. The signal in Fig. 25.8 repeats itself 5 times in .5 seconds, hence10 cycles per second. Cycles per second are usually called hertz (shortened to Hz),Hertz
so the frequency in Fig. 25.8 would be described as 10 Hz. The amplitude A of asine wave is the maximum value on the Y axis. The period T of the wave is the timeperiod
it takes for one cycle to complete, defined as
T =1f
(25.4)

10 CHAPTER 25 • PHONETICS
Time (s)0 0.5
–1.0
1.0
0
0 0.1 0.2 0.3 0.4 0.5
Figure 25.8 A sine wave with a frequency of 10 Hz and an amplitude of 1.
Each cycle in Fig. 25.8 lasts a tenth of a second; hence T = .1 seconds.
25.4.2 Speech Sound WavesLet’s turn from hypothetical waves to sound waves. The input to a speech recog-nizer, like the input to the human ear, is a complex series of changes in air pressure.These changes in air pressure obviously originate with the speaker and are causedby the specific way that air passes through the glottis and out the oral or nasal cav-ities. We represent sound waves by plotting the change in air pressure over time.One metaphor which sometimes helps in understanding these graphs is that of a ver-tical plate blocking the air pressure waves (perhaps in a microphone in front of aspeaker’s mouth, or the eardrum in a hearer’s ear). The graph measures the amountof compression or rarefaction (uncompression) of the air molecules at this plate.Figure 25.9 shows a short segment of a waveform taken from the Switchboard corpusof telephone speech of the vowel [iy] from someone saying “she just had a baby”.
Time (s)0 0.03875
–0.01697
0.02283
0
Figure 25.9 A waveform of the vowel [iy] from an utterance shown later in Fig. 25.13 on page 14. The y-axisshows the level of air pressure above and below normal atmospheric pressure. The x-axis shows time. Noticethat the wave repeats regularly.
The first step in digitizing a sound wave like Fig. 25.9 is to convert the analogrepresentations (first air pressure and then analog electric signals in a microphone)into a digital signal. This analog-to-digital conversion has two steps: sampling andsampling
quantization. To sample a signal, we measure its amplitude at a particular time; thesampling rate is the number of samples taken per second. To accurately measure awave, we must have at least two samples in each cycle: one measuring the positivepart of the wave and one measuring the negative part. More than two samples percycle increases the amplitude accuracy, but fewer than two samples causes the fre-quency of the wave to be completely missed. Thus, the maximum frequency wavethat can be measured is one whose frequency is half the sample rate (since everycycle needs two samples). This maximum frequency for a given sampling rate iscalled the Nyquist frequency. Most information in human speech is in frequenciesNyquist
frequencybelow 10,000 Hz; thus, a 20,000 Hz sampling rate would be necessary for com-

25.4 • ACOUSTIC PHONETICS AND SIGNALS 11
plete accuracy. But telephone speech is filtered by the switching network, and onlyfrequencies less than 4,000 Hz are transmitted by telephones. Thus, an 8,000 Hzsampling rate is sufficient for telephone-bandwidth speech like the Switchboardcorpus, while 16,000 Hz sampling is often used for microphone speech.
Even an 8,000 Hz sampling rate requires 8000 amplitude measurements for eachsecond of speech, so it is important to store amplitude measurements efficiently.They are usually stored as integers, either 8 bit (values from -128–127) or 16 bit(values from -32768–32767). This process of representing real-valued numbers asintegers is called quantization because the difference between two integers acts asquantization
a minimum granularity (a quantum size) and all values that are closer together thanthis quantum size are represented identically.
Once data is quantized, it is stored in various formats. One parameter of theseformats is the sample rate and sample size discussed above; telephone speech isoften sampled at 8 kHz and stored as 8-bit samples, and microphone data is oftensampled at 16 kHz and stored as 16-bit samples. Another parameter is the number ofchannels. For stereo data or for two-party conversations, we can store both channelschannel
in the same file or we can store them in separate files. A final parameter is individualsample storage—linearly or compressed. One common compression format used fortelephone speech is µ-law (often written u-law but still pronounced mu-law). Theintuition of log compression algorithms like µ-law is that human hearing is moresensitive at small intensities than large ones; the log represents small values withmore faithfulness at the expense of more error on large values. The linear (unlogged)values are generally referred to as linear PCM values (PCM stands for pulse codePCM
modulation, but never mind that). Here’s the equation for compressing a linear PCMsample value x to 8-bit µ-law, (where µ=255 for 8 bits):
F(x) =sgn(x) log(1+µ|x|)
log(1+µ)−1≤ x≤ 1 (25.5)
There are a number of standard file formats for storing the resulting digitized wave-file, such as Microsoft’s .wav and Apple’s AIFF all of which have special headers;simple headerless “raw” files are also used. For example, the .wav format is a subsetof Microsoft’s RIFF format for multimedia files; RIFF is a general format that canrepresent a series of nested chunks of data and control information. Figure 25.10shows a simple .wav file with a single data chunk together with its format chunk.
Figure 25.10 Microsoft wavefile header format, assuming simple file with one chunk. Fol-lowing this 44-byte header would be the data chunk.
25.4.3 Frequency and Amplitude; Pitch and LoudnessSound waves, like all waves, can be described in terms of frequency, amplitude, andthe other characteristics that we introduced earlier for pure sine waves. In soundwaves, these are not quite as simple to measure as they were for sine waves. Let’sconsider frequency. Note in Fig. 25.9 that although not exactly a sine, the wave is

12 CHAPTER 25 • PHONETICS
nonetheless periodic, repeating 10 times in the 38.75 milliseconds (.03875 seconds)captured in the figure. Thus, the frequency of this segment of the wave is 10/.03875or 258 Hz.
Where does this periodic 258 Hz wave come from? It comes from the speedof vibration of the vocal folds; since the waveform in Fig. 25.9 is from the vowel[iy], it is voiced. Recall that voicing is caused by regular openings and closing ofthe vocal folds. When the vocal folds are open, air is pushing up through the lungs,creating a region of high pressure. When the folds are closed, there is no pressurefrom the lungs. Thus, when the vocal folds are vibrating, we expect to see regularpeaks in amplitude of the kind we see in Fig. 25.9, each major peak correspondingto an opening of the vocal folds. The frequency of the vocal fold vibration, or thefrequency of the complex wave, is called the fundamental frequency of the wave-fundamental
frequencyform, often abbreviated F0. We can plot F0 over time in a pitch track. Figure 25.11F0
pitch track shows the pitch track of a short question, “Three o’clock?” represented below thewaveform. Note the rise in F0 at the end of the question.
three o’clock
Time (s)0 0.544375
0 Hz
500 Hz
Figure 25.11 Pitch track of the question “Three o’clock?”, shown below the wavefile. Notethe rise in F0 at the end of the question. Note the lack of pitch trace during the very quiet part(the “o’” of “o’clock”; automatic pitch tracking is based on counting the pulses in the voicedregions, and doesn’t work if there is no voicing (or insufficient sound).
The vertical axis in Fig. 25.9 measures the amount of air pressure variation;pressure is force per unit area, measured in Pascals (Pa). A high value on the verticalaxis (a high amplitude) indicates that there is more air pressure at that point in time,a zero value means there is normal (atmospheric) air pressure, and a negative valuemeans there is lower than normal air pressure (rarefaction).
In addition to this value of the amplitude at any point in time, we also oftenneed to know the average amplitude over some time range, to give us some ideaof how great the average displacement of air pressure is. But we can’t just takethe average of the amplitude values over a range; the positive and negative valueswould (mostly) cancel out, leaving us with a number close to zero. Instead, wegenerally use the RMS (root-mean-square) amplitude, which squares each numberbefore averaging (making it positive), and then takes the square root at the end.
RMS amplitudeNi=1 =
√√√√ 1N
N∑i=1
x2i (25.6)
The power of the signal is related to the square of the amplitude. If the numberpower

25.4 • ACOUSTIC PHONETICS AND SIGNALS 13
of samples of a sound is N, the power is
Power =1N
N∑i=1
x2i (25.7)
Rather than power, we more often refer to the intensity of the sound, whichintensity
normalizes the power to the human auditory threshold and is measured in dB. If P0is the auditory threshold pressure = 2×10⁻⁵ Pa, then intensity is defined as follows:
Intensity = 10log101
NP0
N∑i=1
x2i (25.8)
Figure 25.12 shows an intensity plot for the sentence “Is it a long movie?” fromthe CallHome corpus, again shown below the waveform plot.
is it a long movie?
Time (s)0 1.1675
Figure 25.12 Intensity plot for the sentence “Is it a long movie?”. Note the intensity peaksat each vowel and the especially high peak for the word long.
Two important perceptual properties, pitch and loudness, are related to fre-quency and intensity. The pitch of a sound is the mental sensation, or perceptualpitch
correlate, of fundamental frequency; in general, if a sound has a higher fundamen-tal frequency we perceive it as having a higher pitch. We say “in general” becausethe relationship is not linear, since human hearing has different acuities for differentfrequencies. Roughly speaking, human pitch perception is most accurate between100 Hz and 1000 Hz and in this range pitch correlates linearly with frequency. Hu-man hearing represents frequencies above 1000 Hz less accurately, and above thisrange, pitch correlates logarithmically with frequency. Logarithmic representationmeans that the differences between high frequencies are compressed and hence notas accurately perceived. There are various psychoacoustic models of pitch percep-tion scales. One common model is the mel scale (Stevens et al. 1937, Stevens andMel
Volkmann 1940). A mel is a unit of pitch defined such that pairs of sounds whichare perceptually equidistant in pitch are separated by an equal number of mels. Themel frequency m can be computed from the raw acoustic frequency as follows:
m = 1127ln(1+f
700) (25.9)
As we’ll see in Chapter 26, the mel scale plays an important role in speechrecognition.

14 CHAPTER 25 • PHONETICS
The loudness of a sound is the perceptual correlate of the power. So sounds withhigher amplitudes are perceived as louder, but again the relationship is not linear.First of all, as we mentioned above when we defined µ-law compression, humanshave greater resolution in the low-power range; the ear is more sensitive to smallpower differences. Second, it turns out that there is a complex relationship betweenpower, frequency, and perceived loudness; sounds in certain frequency ranges areperceived as being louder than those in other frequency ranges.
Various algorithms exist for automatically extracting F0. In a slight abuse of ter-minology, these are called pitch extraction algorithms. The autocorrelation methodpitch extraction
of pitch extraction, for example, correlates the signal with itself at various offsets.The offset that gives the highest correlation gives the period of the signal. Thereare various publicly available pitch extraction toolkits; for example, an augmentedautocorrelation pitch tracker is provided with Praat (Boersma and Weenink, 2005).
25.4.4 Interpretation of Phones from a Waveform
Much can be learned from a visual inspection of a waveform. For example, vowelsare pretty easy to spot. Recall that vowels are voiced; another property of vowels isthat they tend to be long and are relatively loud (as we can see in the intensity plotin Fig. 25.12). Length in time manifests itself directly on the x-axis, and loudnessis related to (the square of) amplitude on the y-axis. We saw in the previous sectionthat voicing is realized by regular peaks in amplitude of the kind we saw in Fig. 25.9,each major peak corresponding to an opening of the vocal folds. Figure 25.13 showsthe waveform of the short sentence “she just had a baby”. We have labeled this wave-form with word and phone labels. Notice that each of the six vowels in Fig. 25.13,[iy], [ax], [ae], [ax], [ey], [iy], all have regular amplitude peaks indicating voicing.
she just had a baby
sh iy j ax s h ae dx ax b ey b iy
Time (s)0 1.059
Figure 25.13 A waveform of the sentence “She just had a baby” from the Switchboard corpus (conversation4325). The speaker is female, was 20 years old in 1991, which is approximately when the recording was made,and speaks the South Midlands dialect of American English.
For a stop consonant, which consists of a closure followed by a release, we canoften see a period of silence or near silence followed by a slight burst of amplitude.We can see this for both of the [b]’s in baby in Fig. 25.13.
Another phone that is often quite recognizable in a waveform is a fricative. Re-call that fricatives, especially very strident fricatives like [sh], are made when anarrow channel for airflow causes noisy, turbulent air. The resulting hissy soundshave a noisy, irregular waveform. This can be seen somewhat in Fig. 25.13; it’s evenclearer in Fig. 25.14, where we’ve magnified just the first word she.

25.4 • ACOUSTIC PHONETICS AND SIGNALS 15
she
sh iy
Time (s)0 0.257
Figure 25.14 A more detailed view of the first word “she” extracted from the wavefile in Fig. 25.13. Noticethe difference between the random noise of the fricative [sh] and the regular voicing of the vowel [iy].
25.4.5 Spectra and the Frequency DomainWhile some broad phonetic features (such as energy, pitch, and the presence of voic-ing, stop closures, or fricatives) can be interpreted directly from the waveform, mostcomputational applications such as speech recognition (as well as human auditoryprocessing) are based on a different representation of the sound in terms of its com-ponent frequencies. The insight of Fourier analysis is that every complex wave canbe represented as a sum of many sine waves of different frequencies. Consider thewaveform in Fig. 25.15. This waveform was created (in Praat) by summing two sinewaveforms, one of frequency 10 Hz and one of frequency 100 Hz.
Time (s)0 0.5
–1
1
0
Figure 25.15 A waveform that is the sum of two sine waveforms, one of frequency 10Hz (note five repetitions in the half-second window) and one of frequency 100 Hz, both ofamplitude 1.
We can represent these two component frequencies with a spectrum. The spec-spectrum
trum of a signal is a representation of each of its frequency components and theiramplitudes. Figure 25.16 shows the spectrum of Fig. 25.15. Frequency in Hz ison the x-axis and amplitude on the y-axis. Note the two spikes in the figure, oneat 10 Hz and one at 100 Hz. Thus, the spectrum is an alternative representation ofthe original waveform, and we use the spectrum as a tool to study the componentfrequencies of a sound wave at a particular time point.
Let’s look now at the frequency components of a speech waveform. Figure 25.17shows part of the waveform for the vowel [ae] of the word had, cut out from thesentence shown in Fig. 25.13.
Note that there is a complex wave that repeats about ten times in the figure; butthere is also a smaller repeated wave that repeats four times for every larger pattern(notice the four small peaks inside each repeated wave). The complex wave has afrequency of about 234 Hz (we can figure this out since it repeats roughly 10 times

16 CHAPTER 25 • PHONETICS
Frequency (Hz)1 10 1002 20 2005 50
Sound p
ressure
level (d
B/
Hz)
40
60
80
Figure 25.16 The spectrum of the waveform in Fig. 25.15.
Time (s)0 0.04275
–0.05554
0.04968
0
Figure 25.17 The waveform of part of the vowel [ae] from the word had cut out from thewaveform shown in Fig. 25.13.
in .0427 seconds, and 10 cycles/.0427 seconds = 234 Hz).The smaller wave then should have a frequency of roughly four times the fre-
quency of the larger wave, or roughly 936 Hz. Then, if you look carefully, you cansee two little waves on the peak of many of the 936 Hz waves. The frequency of thistiniest wave must be roughly twice that of the 936 Hz wave, hence 1872 Hz.
Figure 25.18 shows a smoothed spectrum for the waveform in Fig. 25.17, com-puted with a discrete Fourier transform (DFT).
Frequency (Hz)0 4000
So
un
d p
ressu
re le
ve
l (d
B/
Hz)
–20
0
20
0 2000 40000 1000 2000 3000 4000
Figure 25.18 A spectrum for the vowel [ae] from the word had in the waveform of She justhad a baby in Fig. 25.13.
The x-axis of a spectrum shows frequency, and the y-axis shows some mea-sure of the magnitude of each frequency component (in decibels (dB), a logarithmicmeasure of amplitude that we saw earlier). Thus, Fig. 25.18 shows significant fre-quency components at around 930 Hz, 1860 Hz, and 3020 Hz, along with manyother lower-magnitude frequency components. These first two components are justwhat we noticed in the time domain by looking at the wave in Fig. 25.17!
Why is a spectrum useful? It turns out that these spectral peaks that are easilyvisible in a spectrum are characteristic of different phones; phones have characteris-

25.4 • ACOUSTIC PHONETICS AND SIGNALS 17
tic spectral “signatures”. Just as chemical elements give off different wavelengths oflight when they burn, allowing us to detect elements in stars by looking at the spec-trum of the light, we can detect the characteristic signature of the different phonesby looking at the spectrum of a waveform. This use of spectral information is essen-tial to both human and machine speech recognition. In human audition, the functionof the cochlea, or inner ear, is to compute a spectrum of the incoming waveform.cochlea
Similarly, the acoustic features used in speech recognition are spectral representa-tions.
Let’s look at the spectrum of different vowels. Since some vowels change overtime, we’ll use a different kind of plot called a spectrogram. While a spectrumshows the frequency components of a wave at one point in time, a spectrogram is aspectrogram
way of envisioning how the different frequencies that make up a waveform changeover time. The x-axis shows time, as it did for the waveform, but the y-axis nowshows frequencies in hertz. The darkness of a point on a spectrogram correspondsto the amplitude of the frequency component. Very dark points have high amplitude,light points have low amplitude. Thus, the spectrogram is a useful way of visualizingthe three dimensions (time x frequency x amplitude).
Figure 25.19 shows spectrograms of three American English vowels, [ih], [ae],and [ah]. Note that each vowel has a set of dark bars at various frequency bands,slightly different bands for each vowel. Each of these represents the same kind ofspectral peak that we saw in Fig. 25.17.
Time (s)0 2.81397
0
5000
Fre
qu
en
cy (
Hz)
Figure 25.19 Spectrograms for three American English vowels, [ih], [ae], and [uh]
Each dark bar (or spectral peak) is called a formant. As we discuss below, aformant
formant is a frequency band that is particularly amplified by the vocal tract. Sincedifferent vowels are produced with the vocal tract in different positions, they willproduce different kinds of amplifications or resonances. Let’s look at the first twoformants, called F1 and F2. Note that F1, the dark bar closest to the bottom, is in adifferent position for the three vowels; it’s low for [ih] (centered at about 470 Hz)and somewhat higher for [ae] and [ah] (somewhere around 800 Hz). By contrast,F2, the second dark bar from the bottom, is highest for [ih], in the middle for [ae],and lowest for [ah].
We can see the same formants in running speech, although the reduction andcoarticulation processes make them somewhat harder to see. Figure 25.20 showsthe spectrogram of “she just had a baby”, whose waveform was shown in Fig. 25.13.F1 and F2 (and also F3) are pretty clear for the [ax] of just, the [ae] of had, and the[ey] of baby.
What specific clues can spectral representations give for phone identification?First, since different vowels have their formants at characteristic places, the spectrumcan distinguish vowels from each other. We’ve seen that [ae] in the sample waveformhad formants at 930 Hz, 1860 Hz, and 3020 Hz. Consider the vowel [iy] at the

18 CHAPTER 25 • PHONETICS
she just had a baby
sh iy j ax s h ae dx ax b ey b iy
Time (s)0 1.059
Figure 25.20 A spectrogram of the sentence “she just had a baby” whose waveform was shown in Fig. 25.13.We can think of a spectrogram as a collection of spectra (time slices), like Fig. 25.18 placed end to end.
beginning of the utterance in Fig. 25.13. The spectrum for this vowel is shown inFig. 25.21. The first formant of [iy] is 540 Hz, much lower than the first formant for[ae], and the second formant (2581 Hz) is much higher than the second formant for[ae]. If you look carefully, you can see these formants as dark bars in Fig. 25.20 justaround 0.5 seconds.
−10
0
10
20
30
40
50
60
70
80
0 1000 2000 3000
Figure 25.21 A smoothed (LPC) spectrum for the vowel [iy] at the start of She just had ababy. Note that the first formant (540 Hz) is much lower than the first formant for [ae] shownin Fig. 25.18, and the second formant (2581 Hz) is much higher than the second formant for[ae].
The location of the first two formants (called F1 and F2) plays a large role in de-termining vowel identity, although the formants still differ from speaker to speaker.Higher formants tend to be caused more by general characteristics of a speaker’svocal tract rather than by individual vowels. Formants also can be used to identifythe nasal phones [n], [m], and [ng] and the liquids [l] and [r].
25.4.6 The Source-Filter ModelWhy do different vowels have different spectral signatures? As we briefly mentionedabove, the formants are caused by the resonant cavities of the mouth. The source-filter model is a way of explaining the acoustics of a sound by modeling how thesource-filter
modelpulses produced by the glottis (the source) are shaped by the vocal tract (the filter).
Let’s see how this works. Whenever we have a wave such as the vibration in aircaused by the glottal pulse, the wave also has harmonics. A harmonic is anotherharmonic
wave whose frequency is a multiple of the fundamental wave. Thus, for example, a

25.5 • PHONETIC RESOURCES 19
115 Hz glottal fold vibration leads to harmonics (other waves) of 230 Hz, 345 Hz,460 Hz, and so on on. In general, each of these waves will be weaker, that is, willhave much less amplitude than the wave at the fundamental frequency.
It turns out, however, that the vocal tract acts as a kind of filter or amplifier;indeed any cavity, such as a tube, causes waves of certain frequencies to be amplifiedand others to be damped. This amplification process is caused by the shape of thecavity; a given shape will cause sounds of a certain frequency to resonate and hencebe amplified. Thus, by changing the shape of the cavity, we can cause differentfrequencies to be amplified.
When we produce particular vowels, we are essentially changing the shape ofthe vocal tract cavity by placing the tongue and the other articulators in particularpositions. The result is that different vowels cause different harmonics to be ampli-fied. So a wave of the same fundamental frequency passed through different vocaltract positions will result in different harmonics being amplified.
We can see the result of this amplification by looking at the relationship betweenthe shape of the vocal tract and the corresponding spectrum. Figure 25.22 showsthe vocal tract position for three vowels and a typical resulting spectrum. The for-mants are places in the spectrum where the vocal tract happens to amplify particularharmonic frequencies.
Frequency (Hz)0 4000
Sou
nd p
ress
ure
leve
l (dB/
Hz)
0
20
268 2416
F1
F2
[iy] (tea)
Frequency (Hz)0 4000
Sou
nd p
ress
ure
leve
l (dB/
Hz)
0
20
903 1695
F1 F2
[ae] (cat)
Frequency (Hz)0 4000
Soun
d pr
essu
re le
vel (
dB/H
z)
–20
0
295 817
F1 F2
[uw] (moo)
[ae] (cat) [uw] (moo)[iy] (tea)Figure 25.22 Visualizing the vocal tract position as a filter: the tongue positions for three English vowels andthe resulting smoothed spectra showing F1 and F2.
25.5 Phonetic Resources
A wide variety of phonetic resources can be drawn on for computational work.On-line pronunciation dictionaries give phonetic transcriptions for words. Thepronunciation
dictionaryLDC distributes pronunciation lexicons for Egyptian Arabic, Dutch, English, Ger-man, Japanese, Korean, Mandarin, and Spanish. For English, the CELEX dictionary(Baayen et al., 1995) has pronunciations for 160,595 wordforms, with syllabifica-tion, stress, and morphological and part-of-speech information. The open-sourceCMU Pronouncing Dictionary (CMU, 1993) has pronunciations for about 134,000

20 CHAPTER 25 • PHONETICS
wordforms, while the fine-grained 110,000 word UNISYN dictionary (Fitt, 2002),freely available for research purposes, gives syllabifications, stress, and also pronun-ciations for dozens of dialects of English.
Another useful resource is a phonetically annotated corpus, in which a col-lection of waveforms is hand-labeled with the corresponding string of phones. TheTIMIT corpus (NIST, 1990), originally a joint project between Texas Instruments(TI), MIT, and SRI, is a corpus of 6300 read sentences, with 10 sentences each from630 speakers. The 6300 sentences were drawn from a set of 2342 sentences, someselected to have particular dialect shibboleths, others to maximize phonetic diphonecoverage. Each sentence in the corpus was phonetically hand-labeled, the sequenceof phones was automatically aligned with the sentence wavefile, and then the au-tomatic phone boundaries were manually hand-corrected (Seneff and Zue, 1988).The result is a time-aligned transcription: a transcription in which each phone istime-aligned
transcriptionassociated with a start and end time in the waveform, like the example in Fig. 25.23.
she had your dark suit in greasy wash water all yearsh iy hv ae dcl jh axr dcl d aa r kcl s ux q en gcl g r iy s ix w aa sh q w aa dx axr q aa l y ix axr
Figure 25.23 Phonetic transcription from the TIMIT corpus, using special ARPAbet features for narrow tran-scription, such as the palatalization of [d] in had, unreleased final stop in dark, glottalization of final [t] in suitto [q], and flap of [t] in water. The TIMIT corpus also includes time-alignments (not shown).
The Switchboard Transcription Project phonetically annotated corpus consistsof 3.5 hours of sentences extracted from the Switchboard corpus (Greenberg et al.,1996), together with transcriptions time-aligned at the syllable level. Figure 25.24shows an example .
0.470 0.640 0.720 0.900 0.953 1.279 1.410 1.630dh er k aa n ax v ih m b ix t w iy n r ay n aw
Figure 25.24 Phonetic transcription of the Switchboard phrase they’re kind of in betweenright now. Note vowel reduction in they’re and of, coda deletion in kind and right, and re-syllabification (the [v] of of attaches as the onset of in). Time is given in number of secondsfrom the beginning of sentence to the start of each syllable.
The Buckeye corpus (Pitt et al. 2007, Pitt et al. 2005) is a phonetically tran-scribed corpus of spontaneous American speech, containing about 300,000 wordsfrom 40 talkers. Phonetically transcribed corpora are also available for other lan-guages, including the Kiel corpus of German and Mandarin corpora transcribed bythe Chinese Academy of Social Sciences (Li et al., 2000).
In addition to resources like dictionaries and corpora, there are many useful pho-netic software tools. Many of the figures in this book were generated by the Praatpackage (Boersma and Weenink, 2005), which includes pitch, spectral, and formantanalysis, as well as a scripting language.
25.6 Summary
This chapter has introduced many of the important concepts of phonetics and com-putational phonetics.
• We can represent the pronunciation of words in terms of units called phones.The standard system for representing phones is the International Phonetic

BIBLIOGRAPHICAL AND HISTORICAL NOTES 21
Alphabet or IPA. The most common computational system for transcriptionof English is the ARPAbet, which conveniently uses ASCII symbols.
• Phones can be described by how they are produced articulatorily by the vocalorgans; consonants are defined in terms of their place and manner of articu-lation and voicing; vowels by their height, backness, and roundness.
• Speech sounds can also be described acoustically. Sound waves can be de-scribed in terms of frequency, amplitude, or their perceptual correlates, pitchand loudness.
• The spectrum of a sound describes its different frequency components. Whilesome phonetic properties are recognizable from the waveform, both humansand machines rely on spectral analysis for phone detection.
• A spectrogram is a plot of a spectrum over time. Vowels are described bycharacteristic harmonics called formants.
Bibliographical and Historical NotesThe major insights of articulatory phonetics date to the linguists of 800–150 B.C.India. They invented the concepts of place and manner of articulation, worked outthe glottal mechanism of voicing, and understood the concept of assimilation. Eu-ropean science did not catch up with the Indian phoneticians until over 2000 yearslater, in the late 19th century. The Greeks did have some rudimentary phoneticknowledge; by the time of Plato’s Theaetetus and Cratylus, for example, they distin-guished vowels from consonants, and stop consonants from continuants. The Stoicsdeveloped the idea of the syllable and were aware of phonotactic constraints on pos-sible words. An unknown Icelandic scholar of the 12th century exploited the conceptof the phoneme and proposed a phonemic writing system for Icelandic, includingdiacritics for length and nasality. But his text remained unpublished until 1818 andeven then was largely unknown outside Scandinavia (Robins, 1967). The modernera of phonetics is usually said to have begun with Sweet, who proposed what isessentially the phoneme in his Handbook of Phonetics (1877). He also devised analphabet for transcription and distinguished between broad and narrow transcrip-tion, proposing many ideas that were eventually incorporated into the IPA. Sweetwas considered the best practicing phonetician of his time; he made the first scien-tific recordings of languages for phonetic purposes and advanced the state of the artof articulatory description. He was also infamously difficult to get along with, a traitthat is well captured in Henry Higgins, the stage character that George Bernard Shawmodeled after him. The phoneme was first named by the Polish scholar Baudouinde Courtenay, who published his theories in 1894.
Introductory phonetics textbooks include Ladefoged (1993) and Clark and Yal-lop (1995). Wells (1982) is the definitive three-volume source on dialects of English.
Many of the classic insights in acoustic phonetics had been developed by the late1950s or early 1960s; just a few highlights include techniques like the sound spectro-graph (Koenig et al., 1946), theoretical insights like the working out of the source-filter theory and other issues in the mapping between articulation and acoustics((Fant, 1960), Stevens et al. 1953, Stevens and House 1955, Heinz and Stevens 1961,Stevens and House 1961) the F1xF2 space of vowel formants (Peterson and Barney,1952), the understanding of the phonetic nature of stress and the use of duration andintensity as cues (Fry, 1955), and a basic understanding of issues in phone percep-tion (Miller and Nicely 1955,Liberman et al. 1952). Lehiste (1967) is a collection

22 CHAPTER 25 • PHONETICS
of classic papers on acoustic phonetics. Many of the seminal papers of Gunnar Fanthave been collected in Fant (2004).
Excellent textbooks on acoustic phonetics include Johnson (2003) and Lade-foged (1996). Coleman (2005) includes an introduction to computational process-ing of acoustics and speech from a linguistic perspective. Stevens (1998) lays outan influential theory of speech sound production. There are a number of softwarepackages for acoustic phonetic analysis. Probably the most widely used one is Praat(Boersma and Weenink, 2005).
Exercises25.1 Find the mistakes in the ARPAbet transcriptions of the following words:
a. “three” [dh r i] d. “study” [s t uh d i] g. “slight” [s l iy t]b. “sing” [s ih n g] e. “though” [th ow]c. “eyes” [ay s] f. “planning” [p pl aa n ih ng]
25.2 Ira Gershwin’s lyric for Let’s Call the Whole Thing Off talks about two pro-nunciations (each) of the words “tomato”, “potato”, and “either”. Transcribeinto the ARPAbet both pronunciations of each of these three words.
25.3 Transcribe the following words in the ARPAbet:
1. dark2. suit3. greasy4. wash5. water
25.4 Take a wavefile of your choice. Some examples are on the textbook website.Download the Praat software, and use it to transcribe the wavefiles at the wordlevel and into ARPAbet phones, using Praat to help you play pieces of eachwavefile and to look at the wavefile and the spectrogram.
25.5 Record yourself saying five of the English vowels: [aa], [eh], [ae], [iy], [uw].Find F1 and F2 for each of your vowels.

Exercises 23
Baayen, R. H., Piepenbrock, R., and Gulikers, L. (1995). TheCELEX Lexical Database (Release 2) [CD-ROM]. Linguis-tic Data Consortium, University of Pennsylvania [Distribu-tor].
Beckman, M. E. and Ayers, G. M. (1997). Guide-lines for ToBI labelling. Unpublished manuscript, OhioState University, http://www.ling.ohio-state.edu/research/phonetics/E_ToBI/.
Beckman, M. E. and Hirschberg, J. (1994). The ToBI anno-tation conventions. Manuscript, Ohio State University.
Bennett, R. and Elfner, E. (2019). The syntax–prosody inter-face. Annual Review of Linguistics 5, 151–171.
Boersma, P. and Weenink, D. (2005). Praat: doing phoneticsby computer (version 4.3.14). [Computer program]. Re-trieved May 26, 2005, from http://www.praat.org/.
Clark, J. and Yallop, C. (1995). An Introduction to Phoneticsand Phonology (2nd Ed.). Blackwell.
CMU (1993). The Carnegie Mellon Pronouncing Dictionaryv0.1. Carnegie Mellon University.
Coleman, J. (2005). Introducing Speech and Language Pro-cessing. Cambridge University Press.
Fant, G. M. (1960). Acoustic Theory of Speech Production.Mouton.
Fant, G. M. (2004). Speech Acoustics and Phonetics.Kluwer.
Fitt, S. (2002). Unisyn lexicon. http://www.cstr.ed.ac.uk/projects/unisyn/.
Fry, D. B. (1955). Duration and intensity as physical corre-lates of linguistic stress. JASA 27, 765–768.
Greenberg, S., Ellis, D., and Hollenback, J. (1996). Insightsinto spoken language gleaned from phonetic transcriptionof the Switchboard corpus. ICSLP.
Heinz, J. M. and Stevens, K. N. (1961). On the properties ofvoiceless fricative consonants. JASA 33, 589–596.
Johnson, K. (2003). Acoustic and Auditory Phonetics (2ndEd.). Blackwell.
Koenig, W., Dunn, H. K., and Lacy, L. Y. (1946). The soundspectrograph. JASA 18, 19–49.
Ladefoged, P. (1993). A Course in Phonetics. Harcourt BraceJovanovich. (3rd ed.).
Ladefoged, P. (1996). Elements of Acoustic Phonetics (2ndEd.). University of Chicago.
Lehiste, I. (Ed.). (1967). Readings in Acoustic Phonetics.MIT Press.
Li, A., Zheng, F., Byrne, W., Fung, P., Kamm, T., Yi,L., Song, Z., Ruhi, U., Venkataramani, V., and Chen, X.(2000). CASS: A phonetically transcribed corpus of Man-darin spontaneous speech. ICSLP.
Liberman, A. M., Delattre, P. C., and Cooper, F. S. (1952).The role of selected stimulus variables in the perception ofthe unvoiced stop consonants. American Journal of Psy-chology 65, 497–516.
Miller, G. A. and Nicely, P. E. (1955). An analysis of per-ceptual confusions among some English consonants. JASA27, 338–352.
NIST (1990). TIMIT Acoustic-Phonetic Continuous SpeechCorpus. National Institute of Standards and TechnologySpeech Disc 1-1.1. NIST Order No. PB91-505065.
Ostendorf, M., Price, P., and Shattuck-Hufnagel, S. (1995).The Boston University Radio News Corpus. Tech. rep.ECS-95-001, Boston University.
Peterson, G. E. and Barney, H. L. (1952). Control methodsused in a study of the vowels. JASA 24, 175–184.
Pitt, M. A., Dilley, L., Johnson, K., Kiesling, S., Raymond,W. D., Hume, E., and Fosler-Lussier, E. (2007). Buckeyecorpus of conversational speech (2nd release).. Departmentof Psychology, Ohio State University (Distributor).
Pitt, M. A., Johnson, K., Hume, E., Kiesling, S., and Ray-mond, W. D. (2005). The buckeye corpus of conversationalspeech: Labeling conventions and a test of transcriber reli-ability. Speech Communication 45, 90–95.
Price, P. J., Ostendorf, M., Shattuck-Hufnagel, S., and Fong,C. (1991). The use of prosody in syntactic disambiguation.JASA 90(6).
Robins, R. H. (1967). A Short History of Linguistics. IndianaUniversity Press, Bloomington.
Seneff, S. and Zue, V. W. (1988). Transcription and align-ment of the TIMIT database. Proceedings of the SecondSymposium on Advanced Man-Machine Interface throughSpoken Language.
Shoup, J. E. (1980). Phonological aspects of speech recog-nition. Lea, W. A. (Ed.), Trends in Speech Recognition,125–138. Prentice Hall.
Silverman, K., Beckman, M. E., Pitrelli, J. F., Ostendorf,M., Wightman, C. W., Price, P. J., Pierrehumbert, J. B., andHirschberg, J. (1992). ToBI: A standard for labelling En-glish prosody. ICSLP.
Stevens, K. N. (1998). Acoustic Phonetics. MIT Press.
Stevens, K. N. and House, A. S. (1955). Development ofa quantitative description of vowel articulation. JASA 27,484–493.
Stevens, K. N. and House, A. S. (1961). An acoustical theoryof vowel production and some of its implications. Journalof Speech and Hearing Research 4, 303–320.
Stevens, K. N., Kasowski, S., and Fant, G. M. (1953). Anelectrical analog of the vocal tract. JASA 25(4), 734–742.
Stevens, S. S. and Volkmann, J. (1940). The relation of pitchto frequency: A revised scale. The American Journal ofPsychology 53(3), 329–353.
Stevens, S. S., Volkmann, J., and Newman, E. B. (1937). Ascale for the measurement of the psychological magnitudepitch. JASA 8, 185–190.
Sweet, H. (1877). A Handbook of Phonetics. ClarendonPress.
Wells, J. C. (1982). Accents of English. Cambridge Univer-sity Press.
Xu, Y. (2005). Speech melody as articulatorily implementedcommunicative functions. Speech communication 46(3-4),220–251.