chapter 3shodhganga.inflibnet.ac.in/bitstream/10603/11861/9/09_chapter 3.pdf · chapter 3 rock...
TRANSCRIPT
Chapter 3
Chapter 3
ROCK MAGNETIC RECORDS OF THE SEDIMENTS ALONG THE WESTERN MARGIN OF INDIA: EVIDENCE
FOR LATE QUATERNARY CLIMATIC CHANGE
3.1. Introduction
The Arabian Sea is characterised by the reversal of monsoonal winds
that results in large seasonal variations in upwelling and related primary
productivity. Of the two monsoons (SW and NE monsoons), the SW monsoon
is dominant in the Arabian Sea and surface winds associated with this season
(June-September) blow from the southwest direction leading to the increase in
continental humidity and precipitation over the Indian peninsula. As a
consequence, the northeastern Arabian Sea receives eolian sediments
transported from the Arabian coasts and high riverine input through the Indus
River. The hinterland of the SE Arabian Sea (SW margin of India) also
receives heavy rainfall (more than 3000 mm/yr) and upwelling waters
in this region are capped by a thin lens (5-10 m thick) of warm, low-salinity
water, which in part forms from local precipitation and in part from runoff from
the narrow coastal plain (Jayakumar, 1999; Naqvi et al., 2000). During the
SW monsoon, biological productivity increases and results in a permanent
Oxygen Minimum Zone (OMZ) that impinges the continental margins at
depths between 150 and 1200 m (Wyrtki, 1971; von Stackelberg, 1972).
Intensity of the monsoons has varied through time during the Quaternary and
this variability can be traced by measuring independent proxies from
sediments of the continental margins. Relative changes in biological
productivity can be determined from variations in the organic carbon (OC) and
carbonate content of the sediment. Runoff from the land brings enormous
terrigenous supply and variations in the composition and sources of
terrigenous material deposited offshore can be investigated through the study
of the rock-magnetic properties of the sediments. Runoff also influences the
isotopic composition of the seawater. The oxygen isotope composition of the
27
planktonic foraminifers that lived in the near surface waters is influenced by
both the changes in the global ice volume and variations in regional
precipitation and river discharge.
The purpose of the chapter is to report the rock-magnetic properties of
the sediment cores collected along the western margin of India and compare
the results with other parameters such as acid-insoluble residue (AIR), OC,
carbonate content and oxygen isotopes. Such a comparison will provide
better understanding of the utility of rock magnetic properties for extracting the
late Quaternary palaeoclimatic signal recorded in these sediments.
3.2. Previous studies
A few studies have reported magnetic susceptibility variations in
sediments of the northern Indian Ocean, especially the ODP cores (721and
722) from the northwestern Arabian Sea and/or sediments of the deep
Arabian Sea (Bloemendal and de Menocal, 1989; Shankar et al., 1994a;
Sykes and Kidd, 1994; Meynadier et al., 1995; Hounslow and Maher, 1999).
These workers identified the sources of lithogenic flux, the influence of aeolian
sediment deposition from the Asian monsoon during different phases of the
late Quaternary, controls on magnetic susceptibility (carbonate dilution,
diagenetic changes, paramagnetic minerals) and magnetic responses to
climatic changes. The influence of the Antarctic bottom water current
responsible for the transportation of fine-grained magnetic minerals during
warmer episodes was traced by reporting the magnetite / hematite ratio in the
Somali Basin (Meynadier et al., 1995). Sykes and Kidd (1994) used magnetic
susceptibility along with spectral gamma rays to trace volcanic-rich sediments
in the Indian Ocean. Prins et al. (2000) used magnetic susceptibility to identify
eolian and Indus-borne sediments in the turbidites of the Indus Fan. Karbassi
and Shankar (1994) applied rock magnetic techniques locally to the riverine
and estuarine sediments of Mulki River, for stream-bed load sediments of
Bhadra river to assess the influence of Kudremukh iron ore effluents (Shankar
et al., 1994b) and off-shore placers of the SW coast of India (Shankar et al.,
1996). Several workers used magnetic susceptibility data in correlation with

28
terrigenous content to extract high-resolution sedimentological data
(Radhakrishnamurty et al., 1968; Somayajulu et al., 1975; Thompson et al., 1980;
Bloemendal and de Menocal, 1989; Bloemendal et al., 1992, 1995; Yamazaki and
Katsura, 1990; Robinson et al., 1995; Reichert et al., 1997; Rolph et al., 2004;
Kessarkar et al., 2005). Here, detailed rock-magnetic studies along with other proxy
records for the sediment cores along the western margin of India are reported for
the first time.
3.3. Rock magnetic parameters
Magnetic susceptibility (MS) is related to total magnetic mineral
concentrations in the sediments and, in general, is an expression of detrital input
and the dilution by dia- and other paramagnetic minerals. The basic parameters that
indicate variations in magnetic mineral concentrations are xlf, xARM and SIRM.
These parameters increase in value as the concentrations of magnetic material in
the sediment increase. xlf represents the total contribution from Fe-bearing minerals
in the mineral assemblage (Thompson and Oldfield, 1986). It shows the least grain
size dependence and is therefore possibly the best parameter for assessing
concentrations (Peters and Dekkers, 2003). The xARM is controlled by the
concentration of SSD and PSD ferrimagnetic grains (King et al., 1982). SIRM
increases in value with an increase in the concentration of fine magnetic grain sizes
(single domain) (Bloemendal et al., 1992). The interparametric ratios (xARM /xlf and
xARM / SIRM) vary inversely with magnetic grain size and can be used to assess
the relative change in concentrations of finer magnetic grain sizes. SIRM/xlf and
xARM/xlf ratios are low for multidomain (MD>1 gm) and superparamagnetic
(SP<0.03 gm) grains and high for single domain (SD- 0.03 to 1 gm) grains (Maher
and Taylor, 1988). The S-ratio% and HIRM reflect variations in the coercivity
spectrum of the magnetic mineral assemblage and therefore in mineralogy. The S
ratio% is a ratio of high coercivity minerals (e.g. hematite/goethite) to low coercivity
magnetic minerals (titano-magnetite and maghemite). Values of S-ratio% of -100
indicate a high proportion of magnetite, whereas lower values indicate an increasing
25° 70°
N
■0.0"c""
0 100 200km
Gulf of Khambat
2 •
20°—
Mumbai INDIA
Ratnagiri
Goa 15°—
Mangolore
Clay-RECENT
Carbonate Sands 13
10° — RELICT DEPOSITS Terrigenous Sand ____
1111•111111.1.6
111111111...
1.1. 12 IMMi
111=0,
11111111..■ 11111111MOlk
11111■•■■ •■ 111111mAk
11111MOIL 1111Wo..11111
111111:::1111h
V.M1 111111,011111
111.01111 1111110V116. 1111111.111111■ 111111.01•111 axmomir
• Gravity cores
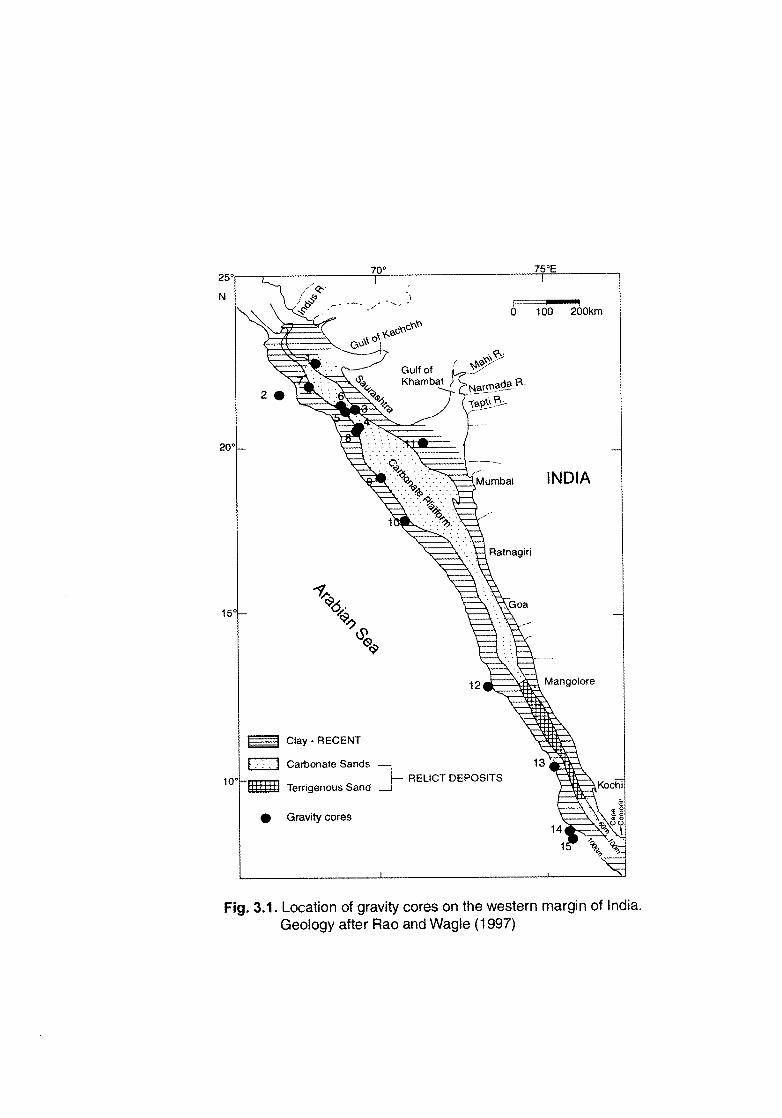
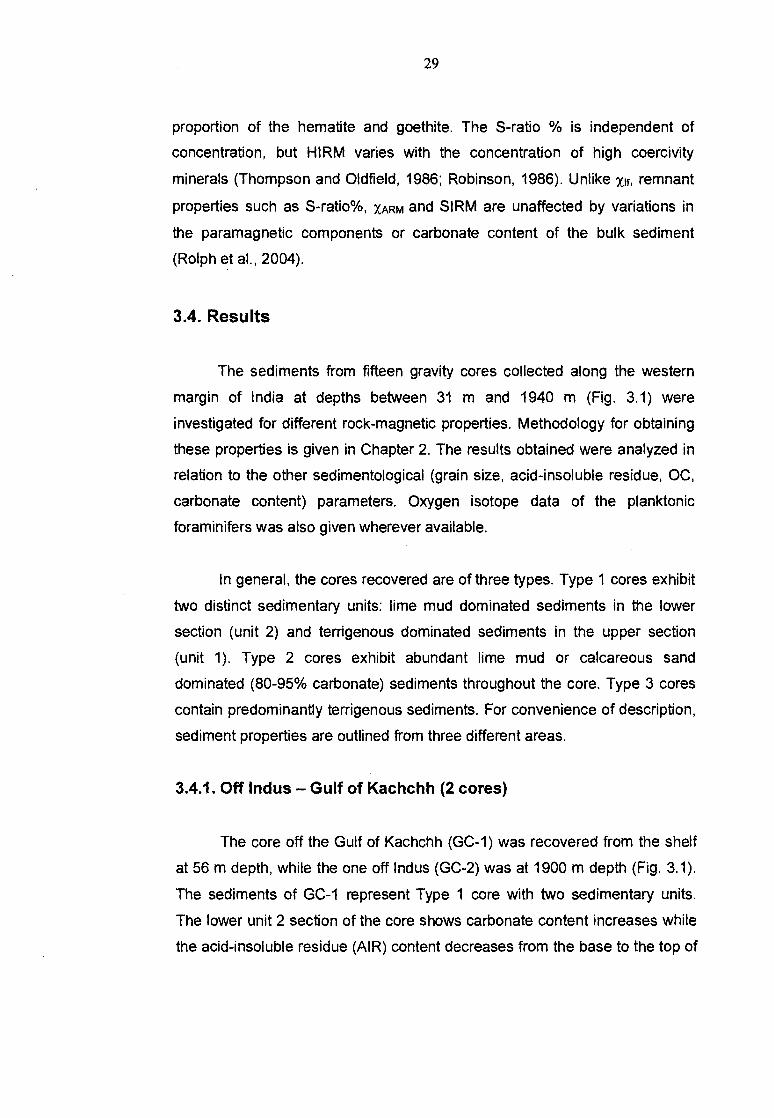
Fig. 3.1. Location of gravity cores on the western margin of India. Geology after Rao and Wagle (1997)
29
proportion of the hematite and goethite. The S-ratio % is independent of
concentration, but HIRM varies with the concentration of high coercivity
minerals (Thompson and Oldfield, 1986; Robinson, 1986). Unlike xif, remnant
properties such as S-ratio%, XARM and SIRM are unaffected by variations in
the paramagnetic components or carbonate content of the bulk sediment
(Rolph et al., 2004).
3.4. Results
The sediments from fifteen gravity cores collected along the western
margin of India at depths between 31 m and 1940 m (Fig. 3.1) were
investigated for different rock-magnetic properties. Methodology for obtaining
these properties is given in Chapter 2. The results obtained were analyzed in
relation to the other sedimentological (grain size, acid-insoluble residue, OC,
carbonate content) parameters. Oxygen isotope data of the planktonic
foraminifers was also given wherever available.
In general, the cores recovered are of three types. Type 1 cores exhibit
two distinct sedimentary units: lime mud dominated sediments in the lower
section (unit 2) and terrigenous dominated sediments in the upper section
(unit 1). Type 2 cores exhibit abundant lime mud or calcareous sand
dominated (80-95% carbonate) sediments throughout the core. Type 3 cores
contain predominantly terrigenous sediments. For convenience of description,
sediment properties are outlined from three different areas.
3.4.1. Off Indus — Gulf of Kachchh (2 cores)
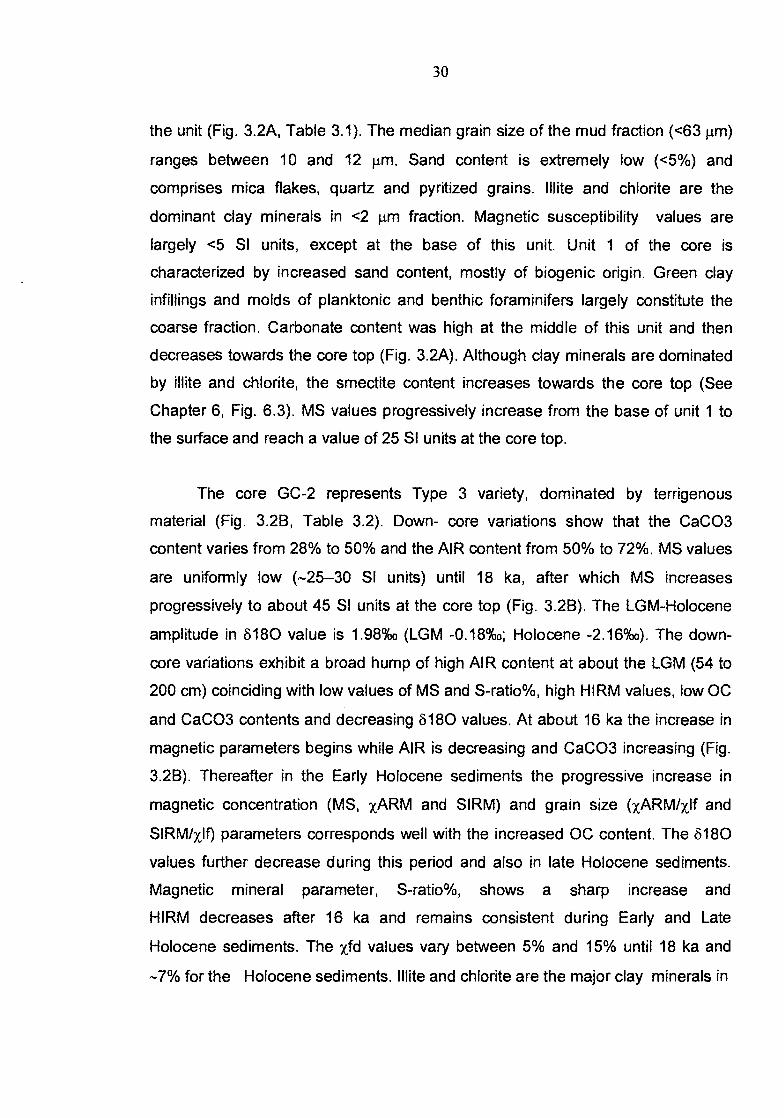
The core off the Gulf of Kachchh (GC-1) was recovered from the shelf
at 56 m depth, while the one off Indus (GC-2) was at 1900 m depth (Fig. 3.1).
The sediments of GC-1 represent Type 1 core with two sedimentary units.
The lower unit 2 section of the core shows carbonate content increases while
the acid-insoluble residue (AIR) content decreases from the base to the top of
30
the unit (Fig. 3.2A, Table 3.1). The median grain size of the mud fraction (<63 pm)
ranges between 10 and 12 pm. Sand content is extremely low (<5%) and
comprises mica flakes, quartz and pyritized grains. Illite and chlorite are the
dominant clay minerals in <2 µm fraction. Magnetic susceptibility values are
largely <5 SI units, except at the base of this unit. Unit 1 of the core is
characterized by increased sand content, mostly of biogenic origin. Green clay
infillings and molds of planktonic and benthic foraminifers largely constitute the
coarse fraction. Carbonate content was high at the middle of this unit and then
decreases towards the core top (Fig. 3.2A). Although clay minerals are dominated
by Mite and chlorite, the smectite content increases towards the core top (See
Chapter 6, Fig. 6.3). MS values progressively increase from the base of unit 1 to
the surface and reach a value of 25 SI units at the core top.
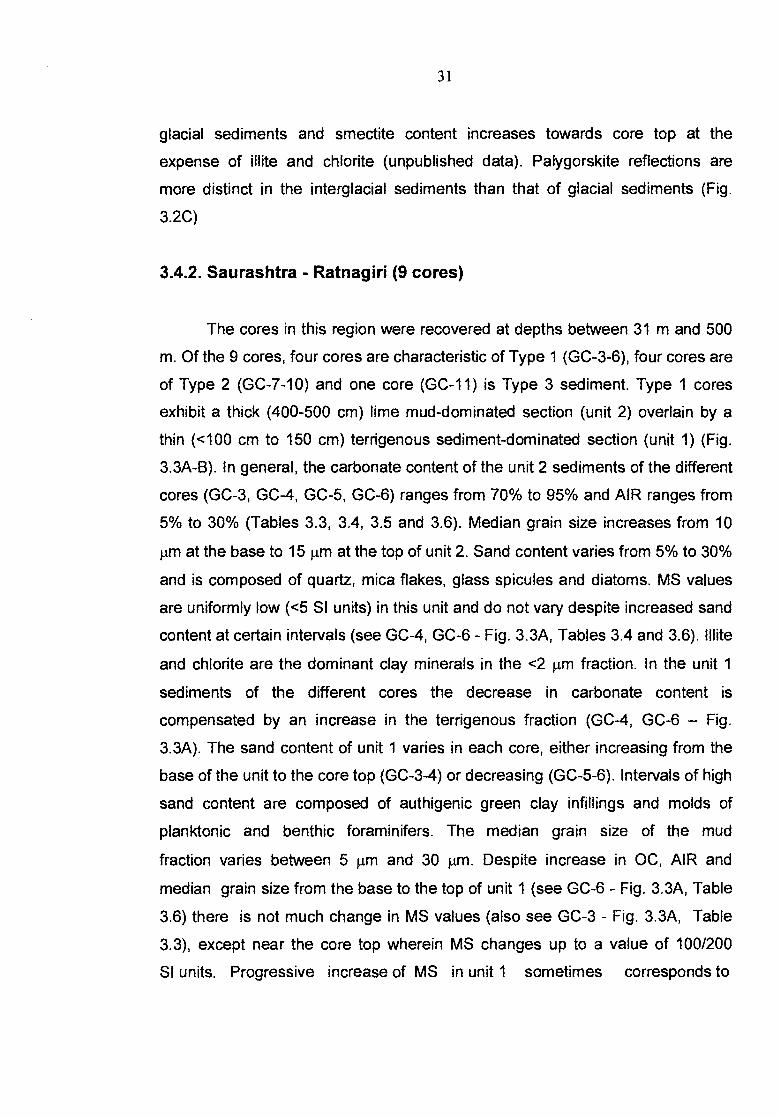
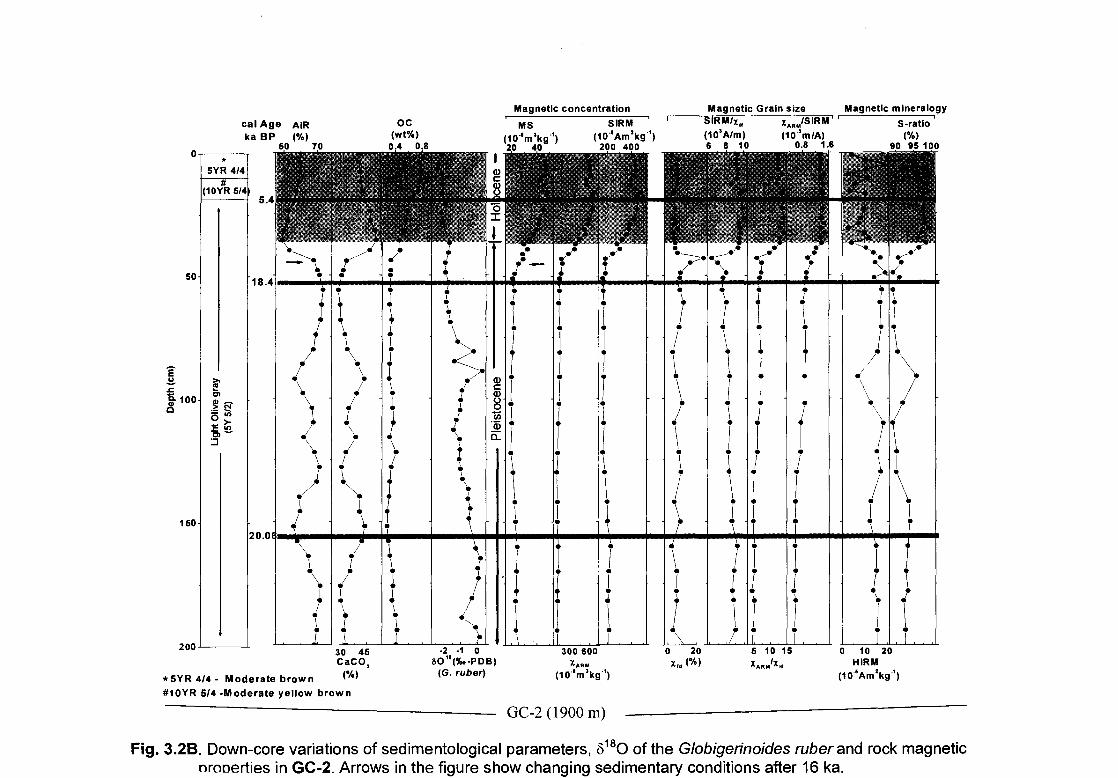
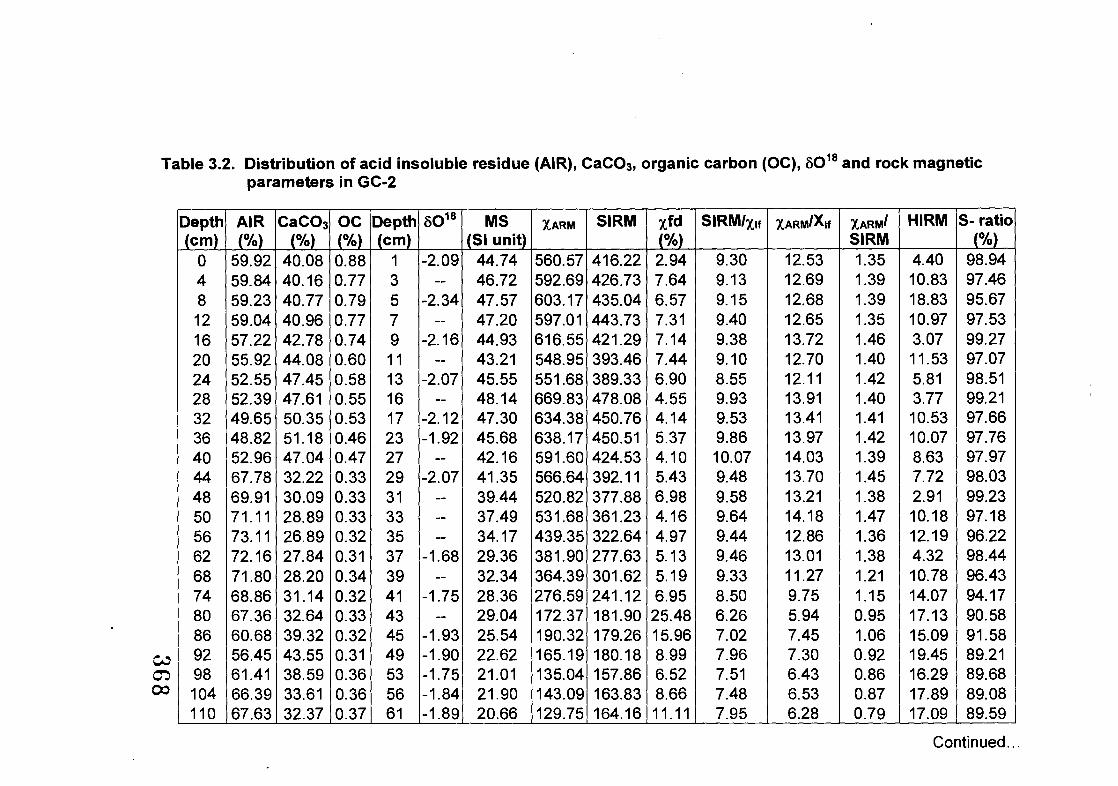
The core GC-2 represents Type 3 variety, dominated by terrigenous
material (Fig. 3.2B, Table 3.2). Down- core variations show that the CaCO3
content varies from 28% to 50% and the AIR content from 50% to 72%. MS values
are uniformly low (-25-30 SI units) until 18 ka, after which MS increases
progressively to about 45 SI units at the core top (Fig. 3.2B). The LGM-Holocene
amplitude in 8180 value is 1.98%0 (LGM -0.18%o; Holocene -2.16%o). The down-
core variations exhibit a broad hump of high AIR content at about the LGM (54 to
200 cm) coinciding with low values of MS and S-ratio%, high HIRM values, low OC
and CaCO3 contents and decreasing 8180 values. At about 16 ka the increase in
magnetic parameters begins while AIR is decreasing and CaCO3 increasing (Fig.
3.2B). Thereafter in the Early Holocene sediments the progressive increase in
magnetic concentration (MS, xARM and SIRM) and grain size (xARM/x,If and
SIRM/xlf) parameters corresponds well with the increased OC content. The 6180
values further decrease during this period and also in late Holocene sediments.
Magnetic mineral parameter, S-ratio%, shows a sharp increase and
HIRM decreases after 16 ka and remains consistent during Early and Late
Holocene sediments. The xfd values vary between 5% and 15% until 18 ka and
-7% for the Holocene sediments. IIlite and chlorite are the major clay minerals in

cal Age MS CaCO3 Median size
ka BP (104m3kg4 ) (%) (µm)
0 0 0 0 10 15
30 50 AIR (%)
GC-1 (56 m)
0.2 0.4 OC (wV/o)
0 50
Sand (%)
0
100
E 200
300
400
?;-;
acv O
9.38
14.05
13.54
12.76
14.52
17.60
Fig. 3.2A. Down-core variations of Magnetic susceptibility (MS) , acid insoluble residue (AIR), CaCO3, organic carbon (OC), median size of the terrigenous mud and sand content of the sediments in GC-1.
31
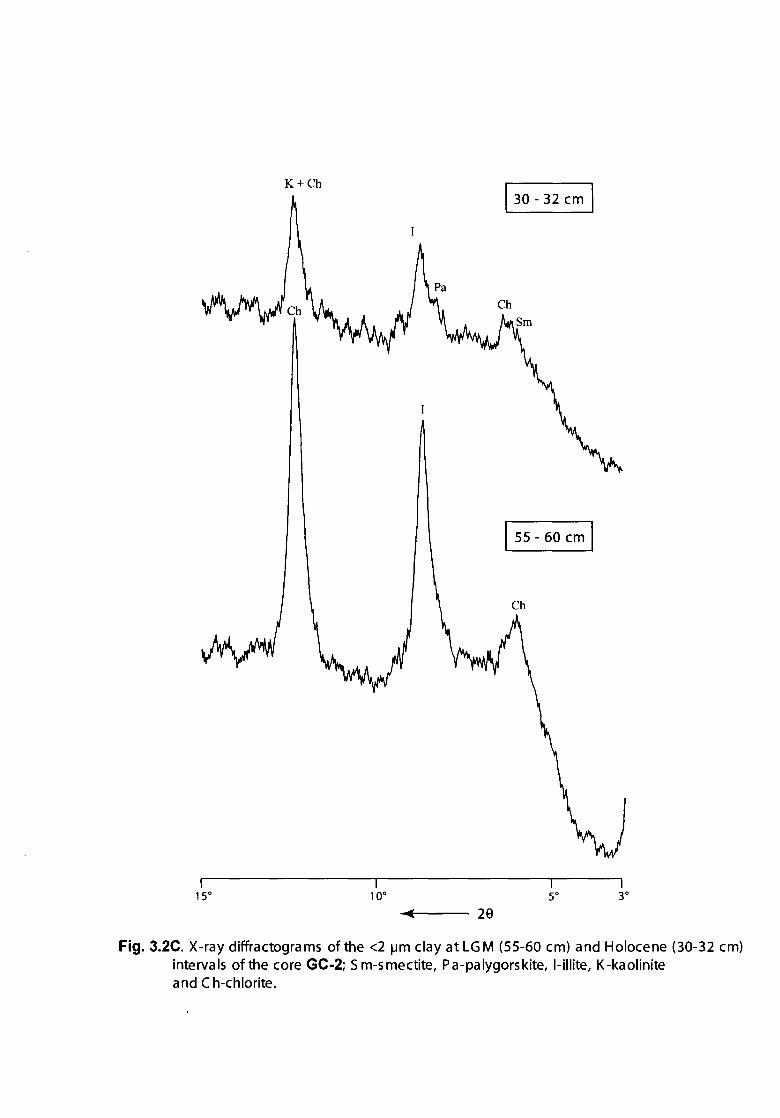
glacial sediments and smectite content increases towards core top at the
expense of illite and chlorite (unpublished data). Palygorskite reflections are
more distinct in the interglacial sediments than that of glacial sediments (Fig.
3.2C)
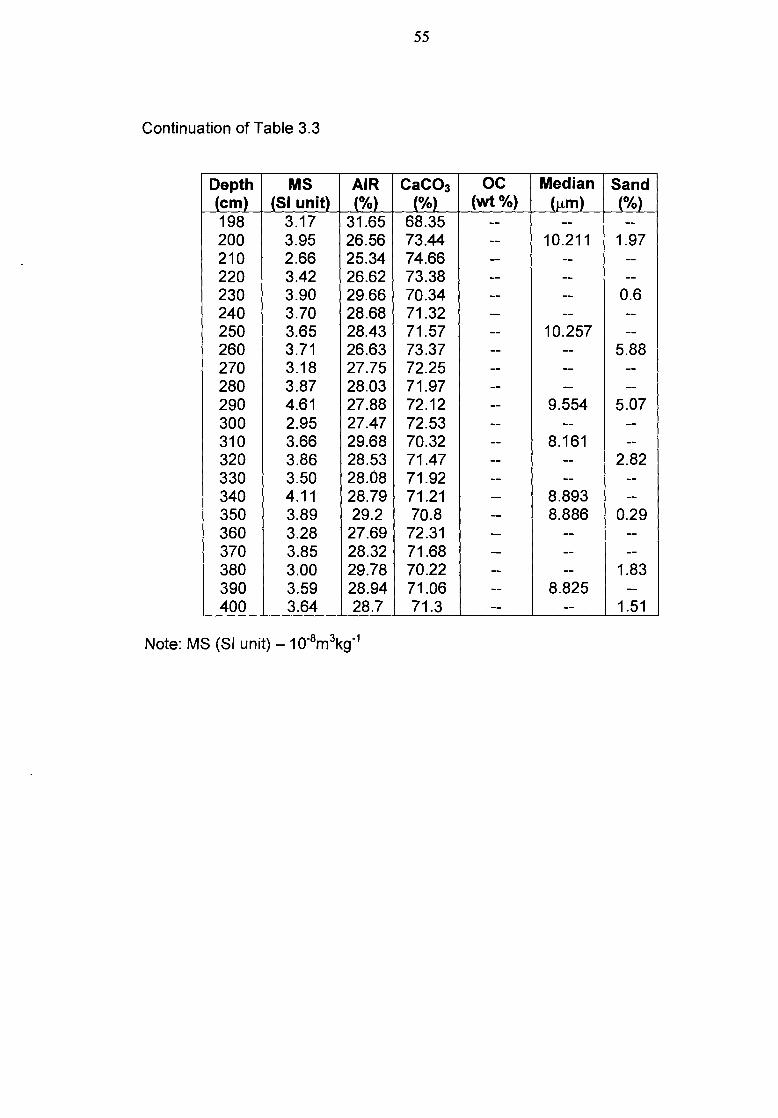
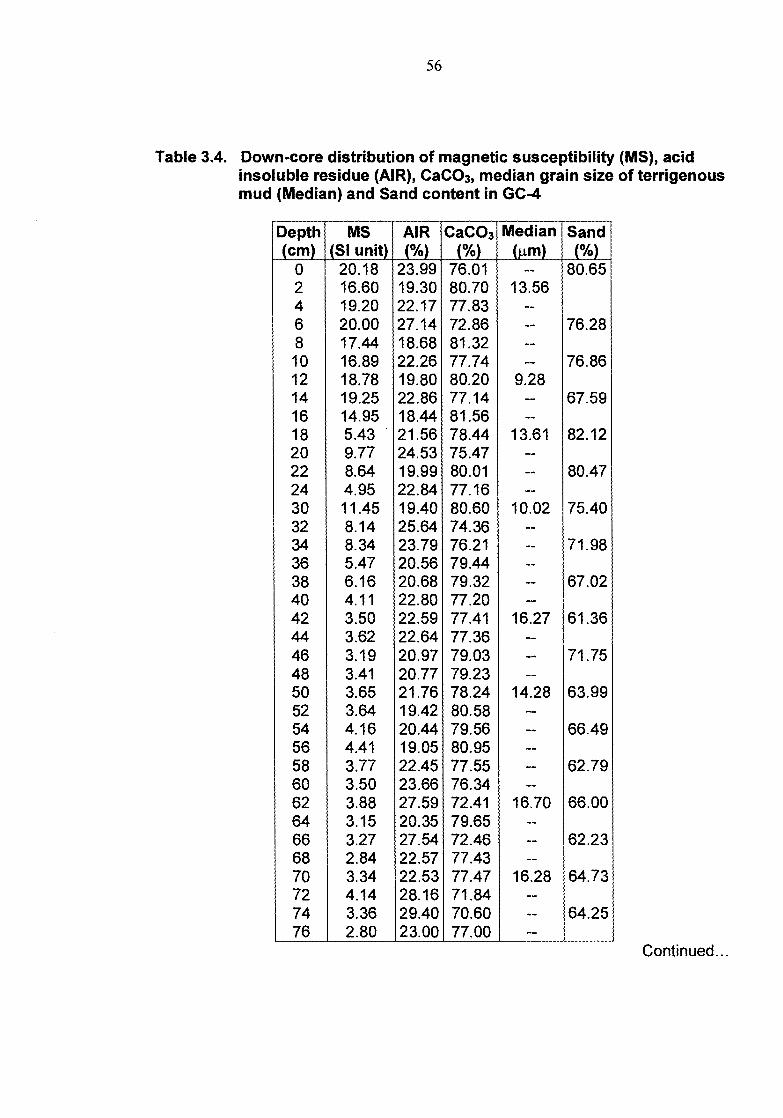
3.4.2. Saurashtra - Ratnagiri (9 cores)
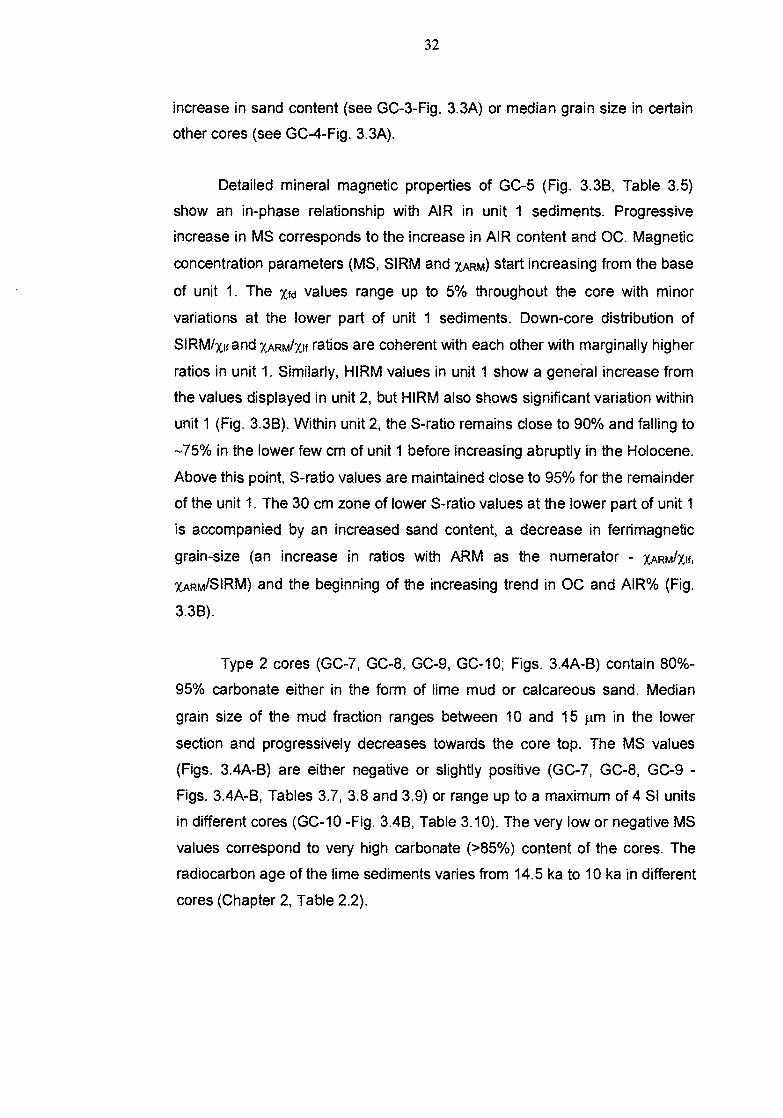
The cores in this region were recovered at depths between 31 m and 500
m. Of the 9 cores, four cores are characteristic of Type 1 (GC-3-6), four cores are
of Type 2 (GC-7-10) and one core (GC-11) is Type 3 sediment. Type 1 cores
exhibit a thick (400-500 cm) lime mud-dominated section (unit 2) overlain by a
thin (<100 cm to 150 cm) terrigenous sediment-dominated section (unit 1) (Fig.
3.3A-B). In general, the carbonate content of the unit 2 sediments of the different
cores (GC-3, GC-4, GC-5, GC-6) ranges from 70% to 95% and AIR ranges from
5% to 30% (Tables 3.3, 3.4, 3.5 and 3.6). Median grain size increases from 10
jarli at the base to 15 pill at the top of unit 2. Sand content varies from 5% to 30%
and is composed of quartz, mica flakes, glass spicules and diatoms. MS values
are uniformly low (<5 SI units) in this unit and do not vary despite increased sand
content at certain intervals (see GC-4, GC-6 - Fig. 3.3A, Tables 3.4 and 3.6). IIlite
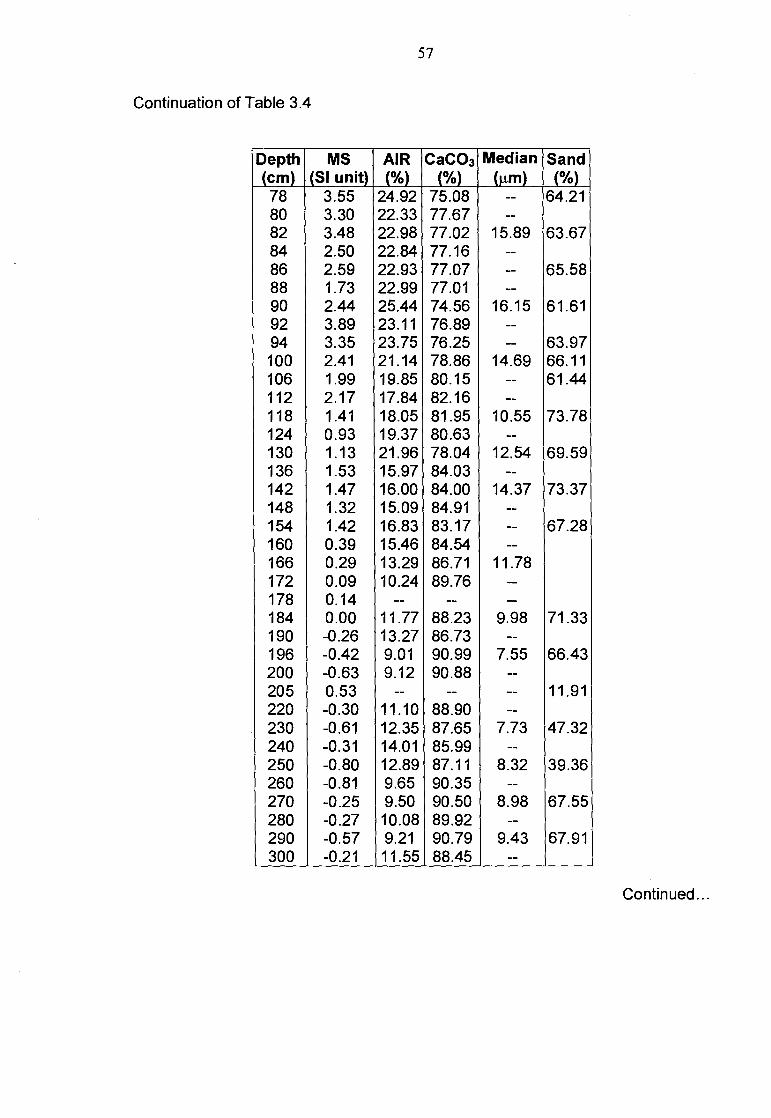
and chlorite are the dominant clay minerals in the <2 prn fraction. In the unit 1
sediments of the different cores the decrease in carbonate content is
compensated by an increase in the terrigenous fraction (GC-4, GC-6 — Fig.
3.3A). The sand content of unit 1 varies in each core, either increasing from the
base of the unit to the core top (GC-3-4) or decreasing (GC-5-6). Intervals of high
sand content are composed of authigenic green clay infillings and molds of
planktonic and benthic foraminifers. The median grain size of the mud
fraction varies between 5 prn and 30 pm. Despite increase in OC, AIR and
median grain size from the base to the top of unit 1 (see GC-6 - Fig. 3.3A, Table
3.6) there is not much change in MS values (also see GC-3 - Fig. 3.3A, Table
3.3), except near the core top wherein MS changes up to a value of 100/200
SI units. Progressive increase of MS in unit 1 sometimes corresponds to
32
increase in sand content (see GC-3-Fig. 3.3A) or median grain size in certain
other cores (see GC-4-Fig. 3.3A).
Detailed mineral magnetic properties of GC-5 (Fig. 3.3B, Table 3.5)
show an in-phase relationship with AIR in unit 1 sediments. Progressive
increase in MS corresponds to the increase in AIR content and OC. Magnetic
concentration parameters (MS, SIRM and xARm) start increasing from the base
of unit 1. The Xfd values range up to 5% throughout the core with minor
variations at the lower part of unit 1 sediments. Down-core distribution of
SIRM/xlf and xAiRmixif ratios are coherent with each other with marginally higher
ratios in unit 1. Similarly, HIRM values in unit 1 show a general increase from
the values displayed in unit 2, but HIRM also shows significant variation within
unit 1 (Fig. 3.3B). Within unit 2, the S-ratio remains close to 90% and falling to
-75% in the lower few cm of unit 1 before increasing abruptly in the Holocene.
Above this point, S-ratio values are maintained close to 95% for the remainder
of the unit 1. The 30 cm zone of lower S-ratio values at the lower part of unit 1
is accompanied by an increased sand content, a decrease in ferrimagnetic
grain-size (an increase in ratios with ARM as the numerator - xARm/xif,
XARm/SIRM) and the beginning of the increasing trend in OC and AIR% (Fig.
3.3B).
Type 2 cores (GC-7, GC-8, GC-9, GC-10; Figs. 3.4A-B) contain 80%-
95% carbonate either in the form of lime mud or calcareous sand. Median
grain size of the mud fraction ranges between 10 and 15 p.m in the lower
section and progressively decreases towards the core top. The MS values
(Figs. 3.4A-B) are either negative or slightly positive (GC-7, GC-8, GC-9 -
Figs. 3.4A-B, Tables 3.7, 3.8 and 3.9) or range up to a maximum of 4 SI units
in different cores (GC-10 -Fig. 3.4B, Table 3.10). The very low or negative MS
values correspond to very high carbonate (>85%) content of the cores. The
radiocarbon age of the lime sediments varies from 14.5 ka to 10 ka in different
cores (Chapter 2, Table 2.2).
Magnetic concentration
ZARM/SIRM S-ratio (10 -3 m/A) (%)
OC (wt%)
SIRM I
(10 4Am'ke) MS
104 3 1(
Magnetic Grain size Magnetic mineralogy SIRM/x,,
(10 3 A/m) cal Age AIR ka BP (%)
50
150
200 5 10 15 0 20
xrd (%)
30 45 CaCO,
(% )
0 10 20 HIRM
(10 -5 Am 2 kg 1 )
300 600
XARM (10 4 i-eke) *5YR 4/4 - Moderate brown
-2 -1 0 80"(70.-PDB)
(G. ruber)
50 70
l' Er
–... ..i.
0 0 8
•
_ 20 40
4
:0 .0 —
.0 t
200 400
• •
•• ."--
. •
•
/•• co
•
W4
499.
to
• ••
•
cao
5, •
•
r1.111, • N."
•
, • [
49---•_•.__ •_
.
•
---6—•
N
/•—• \
•7
\
•
--,../.
9-0
-....9-
, a
..
•
• •
•
•
•
/ / \ / \
• •
E:
Ple
isto
cene
•
1•-9-----•
•
•—•
-•-•—•—
• •
•—•
—0—
7 • 1
/ I
\ 7 / • \ •
•
1 • i
I .N.
/ _ • I • •
\i • _
6+
•
5
' I I
-- -•
--•- •-
•__-i
. _
••—
• •
•
T • •
./
T •
.
5YR 4/4
(10YR 5/4
18.
20.0
#10YR 5/4 -Moderate yellow brown
GC-2 (1900 m)
Fig. 3.2B. Down-core variations of sedimentological parameters, 8 180 of the Globigerinoides ruber and rock magnetic nrocerties in GC-2. Arrows in the figure show changing sedimentary conditions after 16 ka.
33
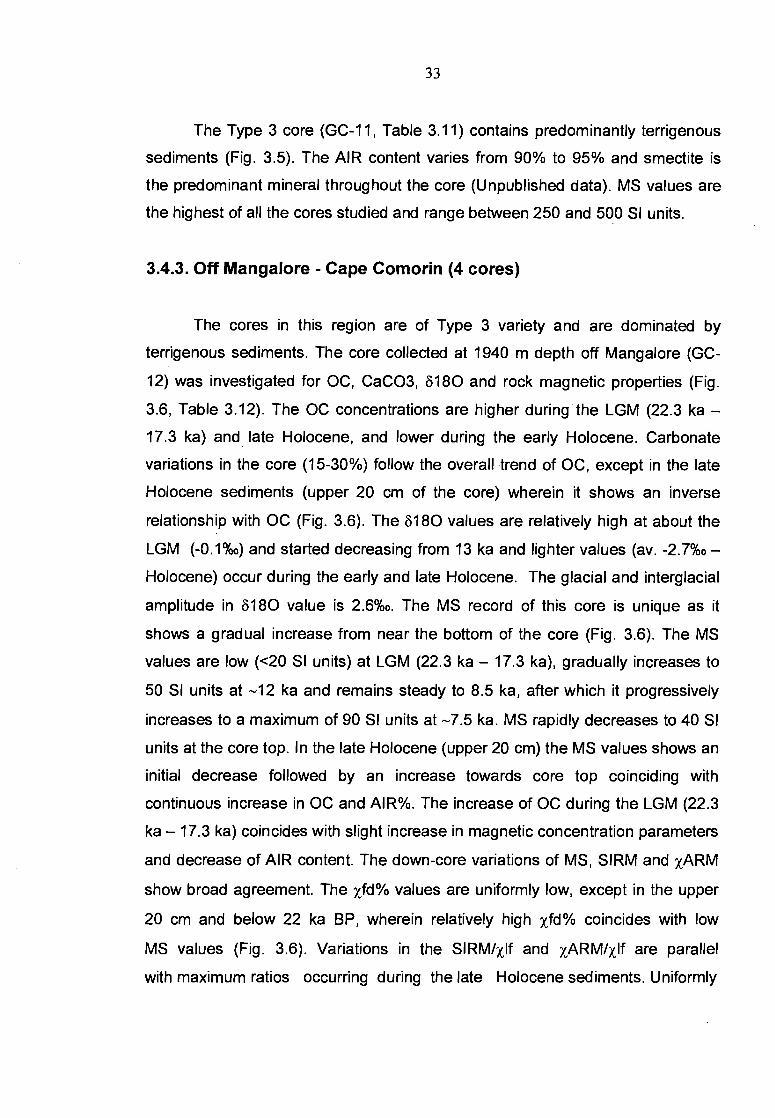
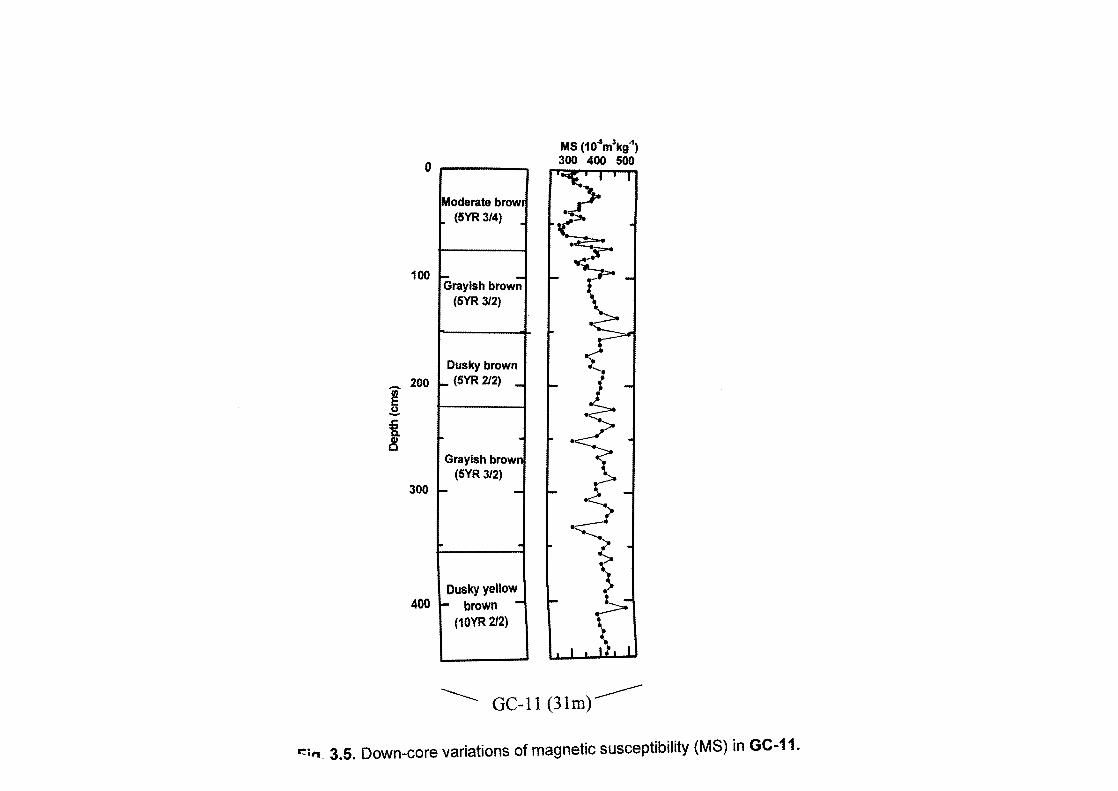
The Type 3 core (GC-11, Table 3.11) contains predominantly terrigenous
sediments (Fig. 3.5). The AIR content varies from 90% to 95% and smectite is
the predominant mineral throughout the core (Unpublished data). MS values are
the highest of all the cores studied and range between 250 and 500 SI units.
3.4.3. Off Mangalore - Cape Comorin (4 cores)
The cores in this region are of Type 3 variety and are dominated by
terrigenous sediments. The core collected at 1940 m depth off Mangalore (GC-
12) was investigated for OC, CaCO3, 8180 and rock magnetic properties (Fig.
3.6, Table 3.12). The OC concentrations are higher during the LGM (22.3 ka -
17.3 ka) and late Holocene, and lower during the early Holocene. Carbonate
variations in the core (15-30%) follow the overall trend of OC, except in the late
Holocene sediments (upper 20 cm of the core) wherein it shows an inverse
relationship with OC (Fig. 3.6). The 8180 values are relatively high at about the
LGM (-0.1%o) and started decreasing from 13 ka and lighter values (ay. -2.7%o -
Holocene) occur during the early and late Holocene. The glacial and interglacial
amplitude in 6180 value is 2.6%o. The MS record of this core is unique as it
shows a gradual increase from near the bottom of the core (Fig. 3.6). The MS
values are low (<20 SI units) at LGM (22.3 ka - 17.3 ka), gradually increases to
50 SI units at -12 ka and remains steady to 8.5 ka, after which it progressively
increases to a maximum of 90 SI units at -7.5 ka. MS rapidly decreases to 40 SI
units at the core top. In the late Holocene (upper 20 cm) the MS values shows an
initial decrease followed by an increase towards core top coinciding with
continuous increase in OC and AIR%. The increase of OC during the LGM (22.3
ka - 17.3 ka) coincides with slight increase in magnetic concentration parameters
and decrease of AIR content. The down-core variations of MS, SIRM and xARM
show broad agreement. The xfd% values are uniformly low, except in the upper
20 cm and below 22 ka BP, wherein relatively high xfd% coincides with low
MS values (Fig. 3.6). Variations in the SIRM/xlf and xARM/xlf are parallel
with maximum ratios occurring during the late Holocene sediments. Uniformly
1 1 1 1 15 ° 10° 5° 3°
-.4--- 20
Fig. 3.2C. X-ray diffractograms of the <2 pm clay at LGM (55-60 cm) and Holocene (30-32 cm) intervals of the core GC-2; S m-smectite, Pa-palygorskite, 1-illite, K-kaolinite and C h-chlorite.
34
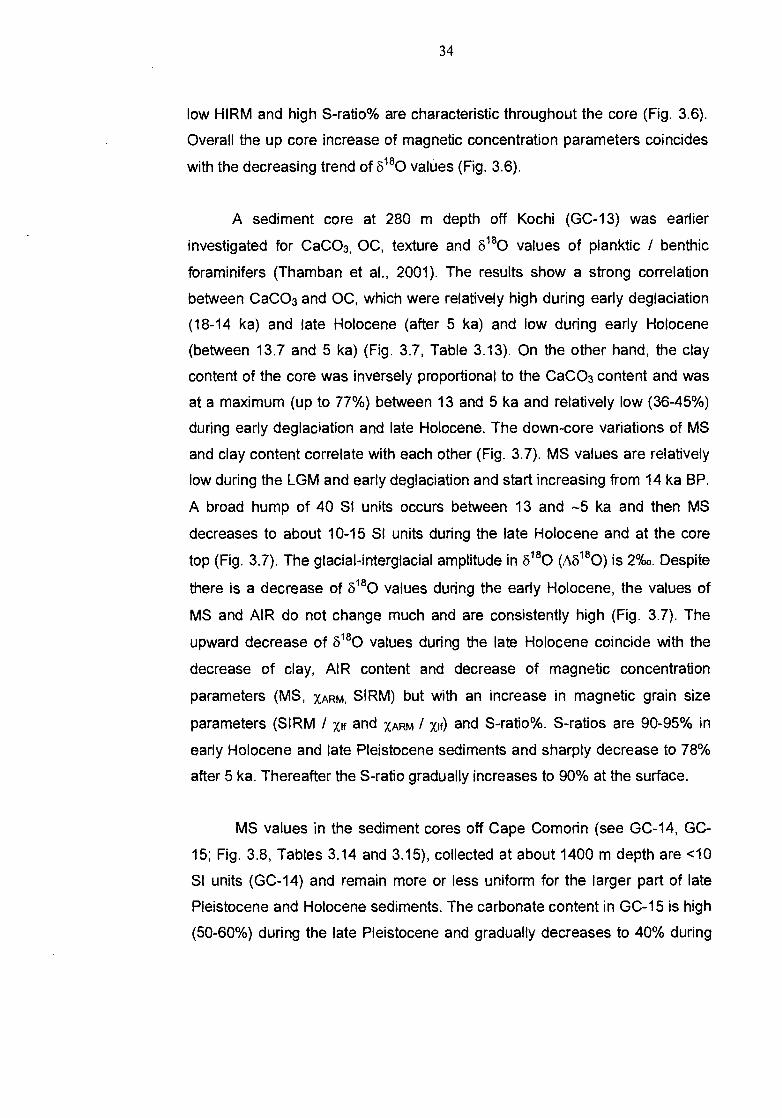
low HIRM and high S-ratio% are characteristic throughout the core (Fig. 3.6).
Overall the up core increase of magnetic concentration parameters coincides
with the decreasing trend of 6 180 values (Fig. 3.6).
A sediment core at 280 m depth off Kochi (GC-13) was earlier
investigated for CaCO3, OC, texture and 8 180 values of planktic / benthic
foraminifers (Thamban et al., 2001). The results show a strong correlation
between CaCO3 and OC, which were relatively high during early deglaciation
(18-14 ka) and late Holocene (after 5 ka) and low during early Holocene
(between 13.7 and 5 ka) (Fig. 3.7, Table 3.13). On the other hand, the clay
content of the core was inversely proportional to the CaCO3 content and was
at a maximum (up to 77%) between 13 and 5 ka and relatively low (36-45%)
during early deglaciation and late Holocene. The down-core variations of MS
and clay content correlate with each other (Fig. 3.7). MS values are relatively
low during the LGM and early deglaciation and start increasing from 14 ka BP.
A broad hump of 40 SI units occurs between 13 and -5 ka and then MS
decreases to about 10-15 SI units during the late Holocene and at the core
top (Fig. 3.7). The glacial-interglacial amplitude in 6 180 (M180) is 2%0. Despite
there is a decrease of 8 180 values during the early Holocene, the values of
MS and AIR do not change much and are consistently high (Fig. 3.7). The
upward decrease of 8 180 values during the late Holocene coincide with the
decrease of clay, AIR content and decrease of magnetic concentration
parameters (MS, XARm, SIRM) but with an increase in magnetic grain size
parameters (SIRM / xif and XARM X1f) and S-ratio%. S-ratios are 90-95% in
early Holocene and late Pleistocene sediments and sharply decrease to 78%
after 5 ka. Thereafter the S-ratio gradually increases to 90% at the surface.
MS values in the sediment cores off Cape Comorin (see GC-14, GC-
15; Fig. 3.8, Tables 3.14 and 3.15), collected at about 1400 m depth are <10
SI units (GC-14) and remain more or less uniform for the larger part of late
Pleistocene and Holocene sediments. The carbonate content in GC-15 is high
(50-60%) during the late Pleistocene and gradually decreases to 40% during
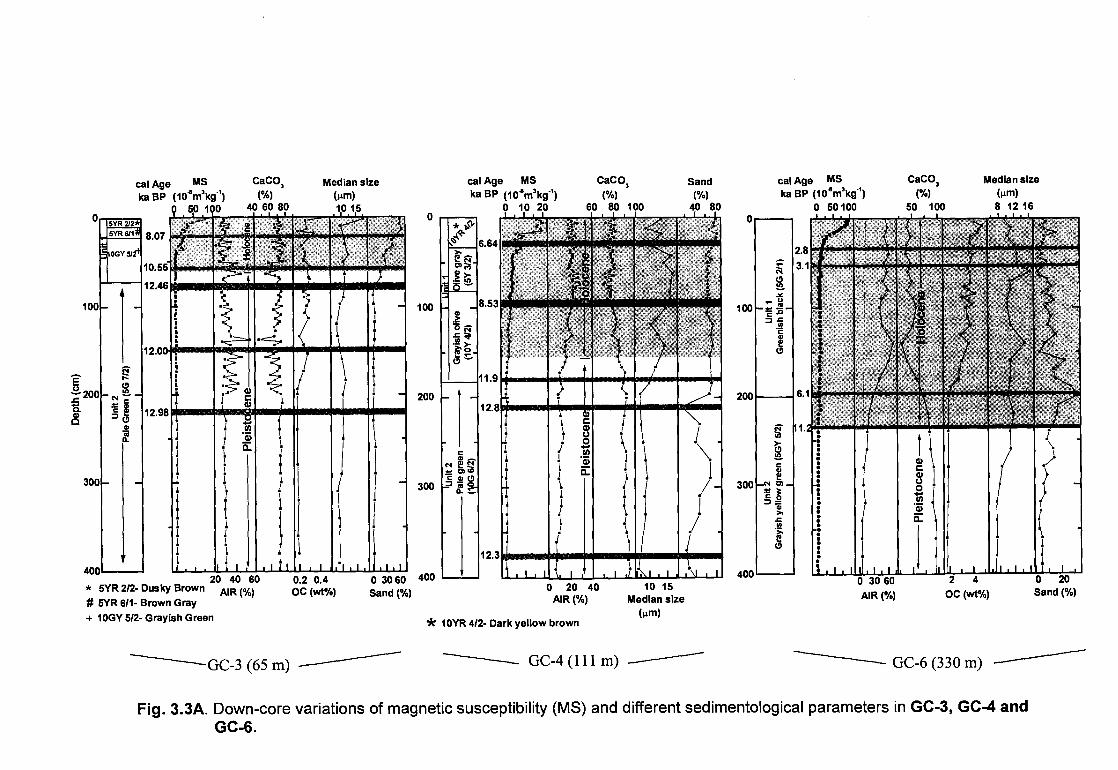
Fig. 3.3A. Down-core variations of magnetic susceptibility (MS) and different sedimentological parameters in GC-3, GC-4 and GC-6.
2
a.
E
—200
8
CaCO3 (%)
40 60 8
ca l Age MS
ka BP (104 1-A9 - ) oo 100
Median size
(gm) 10 15
0 30 60 400 Sand (tt))
0.2 0.4 OC (wt%)
CaCO3
(YO) 60 80 100
Sand
(%) 40 80
cal Age MS ka BP (104m3kg1 )
0 10 20
0 20 40 AIR (%)
10 15 Median size
(gm) * 10YR 4/2- Dark yellow brown
GC-4 (111 m)
64
53
1.9
2.8
2.3
m
1
1 1 1 11
I 1:
1.4
._._._
-- •--
- -*-
-.- .-
- • ''' ''-•
- •- -
- •\,---.
Ile-
•
1,....1":,.7.11,144••••
m A
I ta
nn
in »
_..._
. I
I --.•..)
,,,...........
.,,,-.
---• ̀
.--..,..._.,..,...„.. -----.
- 11111151111111111MIN 1
11
11
ian
nm
ai...1
1111111111111111111111111111111
400 20 40 60
* 5YR 2/2- Dusky Brown AIR (%) # 5YR 6/1- Brown Gray
+ 10GY 5/2- Grayish Green
1":43°V1:31 ■•••
••••■
••••••
1.,.41\11
.- •
) .1 1
1 . J J
,
....•■•••
•■•
.---
ilUi)
.A .A.A.A._
1
I
1 iN
\ I
A
i i
MI
.
li
P
lpis
t
4'
1 '
1
1
. 1 t
1
1 1 i .
I
1
1 . 1
I 1
1
\ 1
. 1 . 1 .
- 1 1 —
1 - i i . 1 . 1
GC-3 (65 m) GC-6 (330 m)
CaCO3
(/0) 50 100
cal Age MS ka BP (10ema kg1 )
0 50 100
Median size
(gm) 8 12 16
1 I1 .
2.8
3.1
w
6.1
1.
1 I . 1 .11. I I
0 30 60 AIR (%)
0 20 Sand (%)
2 4 OC (wt%)
.11
0
100
200
300
400
* .k+
,.;
6
8
o L4 4
1
1
1
100
8 07
12.0
12.98
0
100
200
300 300
5YR 2/2* 5YR 6/1#
ouv stif
35
the Holocene and present. MS values in GC-15 vary from 3 to 8 SI units in the
upper section and 2-5 SI units in the lower section (Fig. 3.8).
3.4.4. Variations in xfd%
The xfd% is a proxy for ultra-fine magnetic particles (Dearing et al.,
1996) and indicates the presence of viscous grains at the superparamagnetic
(SP) / stable single domain (SSD) boundary (0.03 gm). Low xfd% values are
characteristic in many of the samples studied (Figs. 3.2B, 3.3B. 3.6 and 3.7).
High concentrations of paramagnetic and diamagnetic components would
lead to low xfd%. However, the xfd% values at certain intervals in different
cores studied (see Figs. 3.2B, 3.3B, 3.6 and 3.7), range up to 25% and are
more than the normally expected limit of -15% (Dearing et al., 1996). It has
been suggested that only the samples with a very narrow grain-size
distribution and weakly interacting samples show higher Xfd (30-50%) values
(Worm and Jackson, 1999; Muxworthy, 2001). The interval with the highest
values of xfd% correspond to the lowest MS values (see the sediments below
230 cm in GC-12 - Fig. 3.6; upper section of the core GC-13 - Fig. 3.7), not
supporting the suggestion of increased superparamagnetic input. Moreover,
one would expect the high xfd% values correlate well with the increased S-
ratio%, i.e. magnetic softness, unless the high xfd% values correspond to an
influx of material rich only in superparamagnetic and high-coercivity magnetic
minerals. But the high xfd% values do not correlate with high S-ratio% (Fig.
3.3B and Fig. 3.7). Thus it is likely that the high xfd% values are erroneous
and perhaps occurred when MS values of the sediments are close to the limit
of resolution of the instrument, where background fluctuations are of the same
order of magnitude as the MS value.
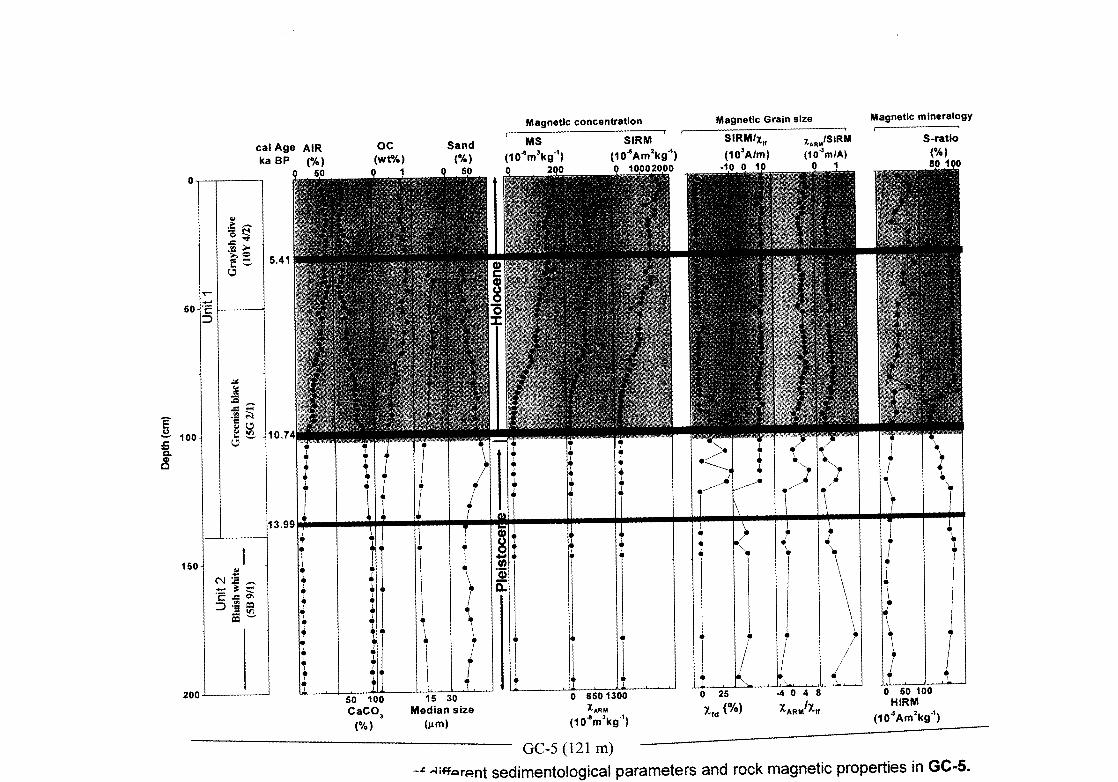
Aiff=i-ent sedimentological parameters and rock magnetic properties in GC-5.
Magnetic Grain size Magnetic mineralogy Magnetic concentration
OC Sand MS SIRM
(wt%) (%) (10 -snAg) (10-5Am2 kg 4 )
0 1 0 50 0 200 • 10002000
cal Age AIR ka BP (%)
0 50 0
s 4 .
1.!
r
(.7
50
• sa
•-■
E 100
6
150 41
tv
c frri
CLI
200
•
50 100 15 30
CaCO3 Median size
(%) (pm)
0 650 1300
XARm (10 4 m 3ke)
GC-5 (121 m)
SIRMix if xAR ./SIRM
(10 3A/m) (104m/A) (%) -10 0 10 1 80 100
S-ratio
36
3.5. Discussion
3.5.1. Provenance of the surficial sediments
Earlier workers reported provenance of the sediments along the
western margin of India based on the distribution of clay minerals of the 156
surficial sediments at water depths between 17 and 2000 m (Nair et al.,
1982a; Rao and Rao, 1995) and Sr-Nd isotopes of the surface and sub-
surface intervals of the sediment cores (Kessarkar et al., 2003) investigated in
this study. The results indicate the existence of three mineralogical provinces
derived from three different sources, namely, the illite and chlorite-rich
assemblage from the Indus, smectite with minor kaolinite, illite and chlorite
assemblage from the Deccan Trap basalts and smectite-kaolinite with minor
illite, chlorite and gibbsite assemblage from the Gneissic province. The Sr-Nd
isotopes provided distinct signatures of these mineral provinces and the
influence of physical and chemical weathering on these isotopes.
The MS values in surficial sediments of the continental margins and
deep-sea are controlled by several factors: (a) MS largely depends on the
supply of land-derived material to the depositional site, which in turn
controlled by the composition of source rocks. (b) Authigenic magnetite was
reported in the sediments both in the aerobic and in the zone of nitrate
reduction (Karlin and Levi, 1983; Peterson and von Dobeneck, 1986; Stolz et
al., 1986; Canfield and Berner, 1987; Robert and Chamley, 1987; Yamazaki
and loka, 1997). Moreover, a high abundance of living magnetotactic bacteria
were reported in the upper most sediment of the continental margins of
southwest Africa. Therefore, biogenic magnetite, though a minor component
of the sediment, contributes towards the total MS signal. (c) Reductive
diagenesis in organic-rich near surface sediments also modifies the MS signal
by the dissolution of fine-grained magnetite and formation of iron sulfides such
as greigite (Lepland and Stevens, 1996; Schmidt et al., 1999). (d) The matrix
minerals (dia- or paramagnetic components) in the sediments also contribute
37
to the bulk susceptibilities. The formation of biogenic magnetite and the
process of reductive diagenesis were largely confined to the subsurface
sediments in the magnetic profiles studied here, and their influence on the
bulk susceptibility of the surficial sediments appears minimal. We found that
the changes in MS cannot be explained by varying carbonate content (see
below) but are dominated by the provenance of the terrigenous component.
As the Type 3 cores and unit 1 sediments of Type 1 cores of all the three
regions are dominated by terrigenous material, the MS signatures of the
surficial sediments (core tops) should allow us to identify the sediment
provinces.
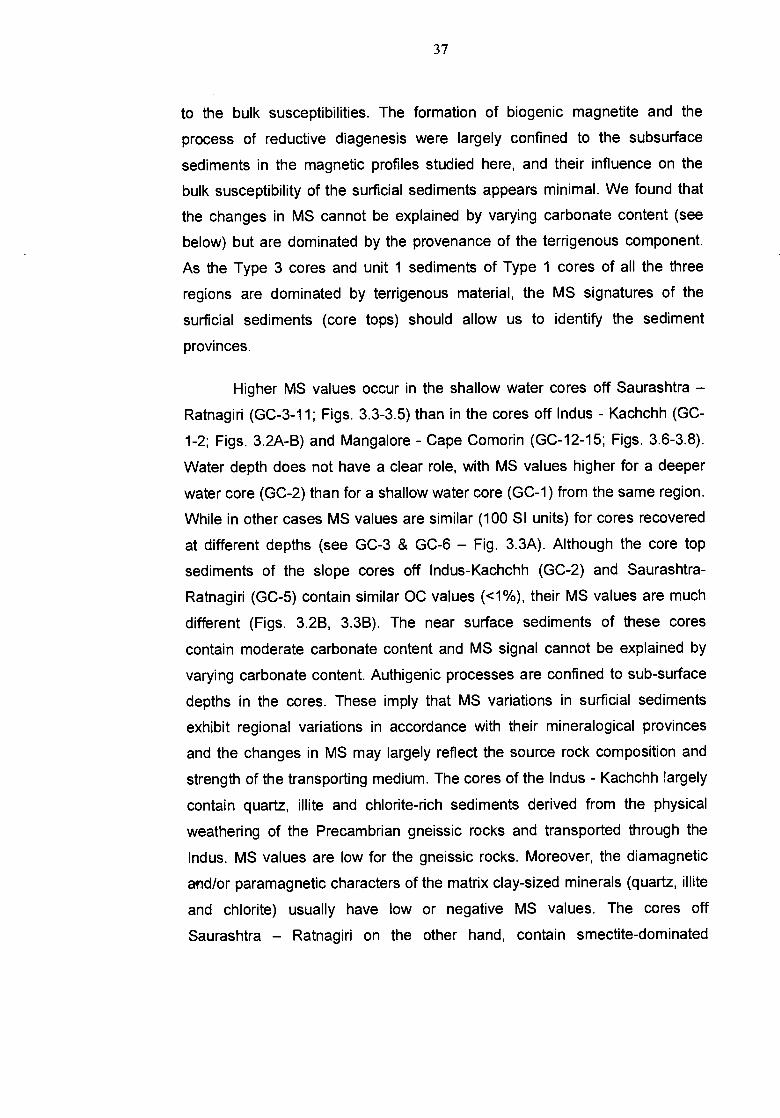
Higher MS values occur in the shallow water cores off Saurashtra —
Ratnagiri (GC-3-11; Figs. 3.3-3.5) than in the cores off Indus - Kachchh (GC-
1-2; Figs. 3.2A-B) and Mangalore - Cape Comorin (GC-12-15; Figs. 3.6-3.8).
Water depth does not have a clear role, with MS values higher for a deeper
water core (GC-2) than for a shallow water core (GC-1) from the same region.
While in other cases MS values are similar (100 SI units) for cores recovered
at different depths (see GC-3 & GC-6 — Fig. 3.3A). Although the core top
sediments of the slope cores off Indus-Kachchh (GC-2) and Saurashtra-
Ratnagiri (GC-5) contain similar OC values (<1%), their MS values are much
different (Figs. 3.2B, 3.3B). The near surface sediments of these cores
contain moderate carbonate content and MS signal cannot be explained by
varying carbonate content. Authigenic processes are confined to sub-surface
depths in the cores. These imply that MS variations in surficial sediments
exhibit regional variations in accordance with their mineralogical provinces
and the changes in MS may largely reflect the source rock composition and
strength of the transporting medium. The cores of the Indus - Kachchh largely
contain quartz, illite and chlorite-rich sediments derived from the physical
weathering of the Precambrian gneissic rocks and transported through the
Indus. MS values are low for the gneissic rocks. Moreover, the diamagnetic
and/or paramagnetic characters of the matrix clay-sized minerals (quartz, illite
and chlorite) usually have low or negative MS values. The cores off
Saurashtra — Ratnagiri on the other hand, contain smectite-dominated

MS (104m3kg4 ) -2 0
0
100
Light greenish - gray -
(5G 811)
I I
am.
200
E
6 c2. 300 8
400
500
Pale olive - (10Y 6/2) -
Dusky green
'(5GY
OWN
yellow
5/2) a
•••■
MIN
Very pale orange
(10YR 812) —
GC-8 (333 m)
-nri different sedimentoloqical parameters in GC-7 and GC -8
cal Age MS
ka BP (104m3kg4)
.9 Grayish
Yellow greet (5GY 512)
12.15
CaCO3 Median size
(%) ( ►lm)
40 0 8 12 0
100
15.7
15.9
1 •
22.0 1
I I I 0 40
AIR (%)
N a3
t_Al. , . 1<1.1 0 1 2 0 20 40
OC (wt%) Sand (%)
200
cUi
300
400
GC-7 (420 m)
38
sediments derived from the Deccan Trap basalts, which supplies a significant
amount of magnetic material. Basalts contain 2-6% iron oxide grains and are
enriched with titano-magnetite (Thompson and Oldfield, 1986).
Low MS values in the cores off Mangalore - Cape Comorin may be due
to the predominance of kaolinite and smectite derived from chemical
weathering of the Gneissic and schistose rocks, which contain poorly
magnetizable material. Despite similar source rocks (largely Precambrian
gneisses and schists), MS values in the sediments off the Indus are higher
than MS values off Mangalore — Cape Comorin. This may be because of two
reasons. (a) As the sediments off the Indus are derived from the physical /
mechanical weathering of the parent rock, they retain the higher primary
magnetic mineral concentrations. Conversely, the hinterland (gneissic) rocks
between Mangalore and Cape Comorin have been extensively lateritized and
subjected to intense chemical weathering. As a consequence, most of the
primary iron has been leached out, producing secondary magnetic minerals,
and leaving the parent rocks with low MS values (Thompson and Oldfield,
1986). (b) The cores off Mangalore-Cape Comorin contain higher organic
carbon in near surface sediments. Firstly, the OC is diamagnetic and the
effect of varying OC content, although little, may have diluted the MS values.
Secondly, reductive diagenesis is likely, at least, in some cores close to the
denitrification zone (GC-12 — Fig. 3.6) that may have resulted in dissolution of
magnetite and therefore decreased MS values.
3.5.2. Down-core variations of magnetic parameters and Climatic
inference
i. Controlling Factors for MS variations
Magnetic susceptibility (MS) variations in the sediments are controlled
by magnetic mineral concentration, grain size and carbonate content. Detrital
magnetite is usually predominant in the sediments. However, the presence of
authigenic iron-rich green clay (verdine / glaucony) minerals and biogenic

cal Age ka BP
0 (10YR 5/4) *
13.05
50
100 14.09
150 .1■•
200 13.99
250
14.08
- Olive (5Y
-
gray _ 3/2)
-
_ Grayish olive . (10Y 4/2)
Dusky yellowish-green
(5GY 5/2)
- -
Grayish (10GY
green 5/2)
- -
_ Grayish green _ (5GY 5/2)
0
100
200
300
400
500
600
MS (104m 3ke) -2 0 2
Median size
(Pm) 8 14
mM• NM=
.1-4 I I
MS (104m3kg) 0 2 4
* Moderate yellow brown 94 96
CaCO 3 (%)
GC-9 (115 m)
0 50 100
Sand (%) GC-10 (500 m)
Fig. 3.4B. Down-core variations of magnetic susceptibility (MS) and different sedimentological parameters in GC-9 and GC-10
39
magnetites locally enhance the magnetic signal. The process of reductive
diagenesis in organic-rich sediments reduces the MS signal.
a. Authigenic green clays: Iron-rich green clays, usually forming in shallow
water depths, occur within the substrates of faecal pellets or skeletal
chambers of planktic and benthic foraminifers and are associated with coarse-
grained sediments (Odin, 1988). MS concentrations increase with increasing
sand content (GC-3 - Fig. 3.3A; GC-9 - Fig. 3.4B), which comprises green
clay molds and infillings of foraminifers. This indicates that the MS is partially
controlled by authigenic green clay in the shelf/shelf break sediments.
b. Authigenic magnetite: Biogenic magnetite of bacterial / fungal origin, as a
source for magnetic minerals, has been reported in the pelagic environments
(Yamazaki and loka, 1997). It is fine-grained (<1 gm) and is not easily
magnetized in a very small-induced magnetic field (Ellwood et al., 2000)
produced by the MS meter. However, the magnetic concentration parameters
(MS, %ARM, SIRM) in GC-2 start to increase while AIR is decreasing at about
16 ka (see arrow in Fig. 3.2B). Moreover, the trend of these magnetic
parameters shows closer correspondence with the trend in organic carbon.
This implies that the magnetic mineral perhaps be dominated by authigenic
bacterial magnetite formed in response to increasing OC and the associated
impact of environmental conditions, at least in this transition zone. Karlin and
Levi (1983) reported the formation of authigenic magnetite of biogenic origin
as an integral part of organic matter decomposition and its occurrence was
reported both in the aerobic as well as in the zone between nitrate and iron
reduction. Kirschvink and Chang (1984) suggested that bacterially
precipitated magnetite might be a major source of stable magnetic remanence
in some marine sediments. Petermann and Bleil (1993) reported magneto-
tactic bacteria between depths of 1 and 4 cm in the sediments and their
maximum concentrations occur in the anaerobic zone compared to only small
numbers in the aerobic zone. Moskowitz et al. (1993) suggested that the
biogenic magnetite and greigite are important source of fine-grained magnetic
material that can contribute significantly to stable natural remnant
Moderate brow (5YR 3/4) _
Grayish brown (5YR 3/2)
Dusky brown (5YR 2/2) _
Grayish brown (5YR 3/2)
Dusky yellow brown —
(10YR 212)
300
200
400
100
0
GC-11 (3 1m)
MS (104mskg4 ) 300 400 500
3.5. Down-core variations of magnetic susceptibility (MS) in GC-11.
40
magnetization in recent and ancient sediments. Magnetites are expected to
dissolve during subsequent diagenesis. The low OC content (<1%) at these
depth intervals may have prevented subsequent dissolution of the magnetite.
c. Carbonate content: MS values are usually influenced by the net carbonate
content, which changes either through productivity variations or through
dilution of terrigenous / siliceous flux. MS values are 25 SI units for 60%
carbonate in GC-1 (Fig. 3.2A) and are 100 and 200 SI units for 70% and 45%
carbonate in GC-3 and GC-5, respectively (see Figs. 3.3A-B). Similarly, MS
values differ for nearly similar carbonate contents in cores GC-12 — GC-15
(see Figs. 3.6-3.8). These imply that the changes in MS in these cores cannot
be explained by varying carbonate content and are dominated by changes in
the provenance/grain size of the terrigenous component, together with
authigenic processes. Negative or slightly positive MS values in Type 2 cores
(Figs. 3.4A and 3.4B) and in unit 2 sediments of the Type 1 cores (Figs. 3.2A,
3.3A) are due to very high amount (90-95% carbonate) of biogenic material
(lime mud or carbonate sand). It is well known that the diamagnetic minerals,
such as calcite, produce negative MS. Moreover, Ellwood and Ledbetter
(1977) showed that a 50% variation in carbonate content could bring only 2-3
units variation in MS. It appears that the MS of paramagnetic minerals is
much greater than that of diamagnetic minerals and therefore a small amount
of paramagnetic mineral can more significantly influence the MS than the
more abundant diamagnetic minerals. As a consequence, the diamagnetic
contribution of the varying carbonate content cannot explain the changes in
the MS signal. If the carbonate variations are caused by dilution, especially by
a terrigenous flux, then the corresponding variations in the MS profile are
expected.
d. Grain size: MS values in Type 1 and Type 3 cores largely correspond to
increases in the terrigenous silt size, which ranges between 10 and 15
However, the MS increase in certain cores (see GC-1) corresponds with a
decrease in median grain size of the silt (Fig. 3.2A) and in others (GC-5; Fig.
3.3B) with an increase in median size of the silt. Increased MS at certain

Magnetic concentration Magnetic Grain size Magnetic mineralogy
zAam/SIRM
(104m/A) 1 2
SIRM4cd
(10 3A/m) 0 10
0 5
X fd (%)
0 20
XARMIXIr
4,__•-• •-
• •-•
[
1 ./ \ •
.
I • '.
I • I • i
I/ .\. :
T. T. ..
I 1
S-ratio
(%) 75 100
0 20 HIRM
(10 -5Am 2k
GC-12 (1940 m)
Fig. 3.6. Down-core variations of different sedimentological parameters, 6180 of the Globigerinoides ruber and rock magnetic GC12.
0
50
100
I a 160
200
250
300
cal Age AIR ka BP (%)
6.0 75
17.3
21.6
22.3
7.1
9.7
I , I I
,
.-4
..
..
-111-•'
\ /. /
•
20 40
CaCO 3
(%)
OC (wt%)
-3 -2 -1 0
50 18 (%) -PDB) (G.ruber)
0 600 1200
XARM
(10 -8m 3ke)
•
•
• •
•
• •
MS
(104m3kg -1 ) 0 50 100
SIRM
(10 -5Am 2ke) 0 300 600
•
Mod. brow (5YR 314)
Light olive gray
(5Y 512)
Olive gray (5Y 3/2)
41
intervals in GC-3 (Fig. 3.3A) and GC-9 (Fig. 3.4B) corresponds to the
increased sand content, which includes green grains (molds and infillings of
iron-rich green clay).
e. Reductive diagenesis: The late Holocene sediments (between 5 and 2 ka)
of the core GC-13 show decreased S-ratio%, magnetic concentration / grain
size (xARmixif and xARm/SIRM) parameters and AIR contents that
corresponding to the increased carbonate and OC contents (Fig. 3.7).
Minimum values of interparametric ratios indicate an increase in
ferromagnetic grain size. This may be due to the oxidative decomposition of
organic matter, in which magnetite and other iron oxides become
progressively reduced due to the processes of reductive diagenesis.
Coincidence of increased OC and median grain size of the sediment with no
marginal change in MS in GC-6 (Fig. 3.3A) may also be due to dissolution of
authigenic magnetite due to reductive diagenesis. In reducing environments
even well crystallized ferrimagnetic oxides become unstable and get dissolved
and/or transform into iron sulphides. Bloemendal et al. (1993) suggested that
reductive diagenesis is a significant determinant of sediment magnetic
properties in high productive areas and has the effect of preferentially
removing the fine-grained ferrimagnetic fraction. Several workers have shown
that reductive diagenesis may greatly modify magnetic mineral inventories in
deeper strata by dissolution of primary iron oxides and authigenic formation of
magnetic iron sulfides (Schmidt et al., 1999; Brachfeld and Banerjee, 2000).
In GC-5, the reduction in S-ratio% results in a negative hump at the
lower part of unit 1 sediments, between 13 and 9 ka (Fig. 3.3B). The S-ratio%
starts decreasing with gradual increase in AIR and increase in XARM/Xlf and
XARm/SIRM ratios. Increase of XARM/Xlf in this part of the core indicates a much
larger amount of finer grain sizes. OC content though increasing is still quite
low (<0.5%) in this interval. The decreased S-ratios therefore are less likely
due to diagenesis, but may be due to the increased proportions of high
coercivity magnetic minerals transported from the shelf. The continental shelf
was exposed to sub-aerial conditions during low-sea level stands of the Last
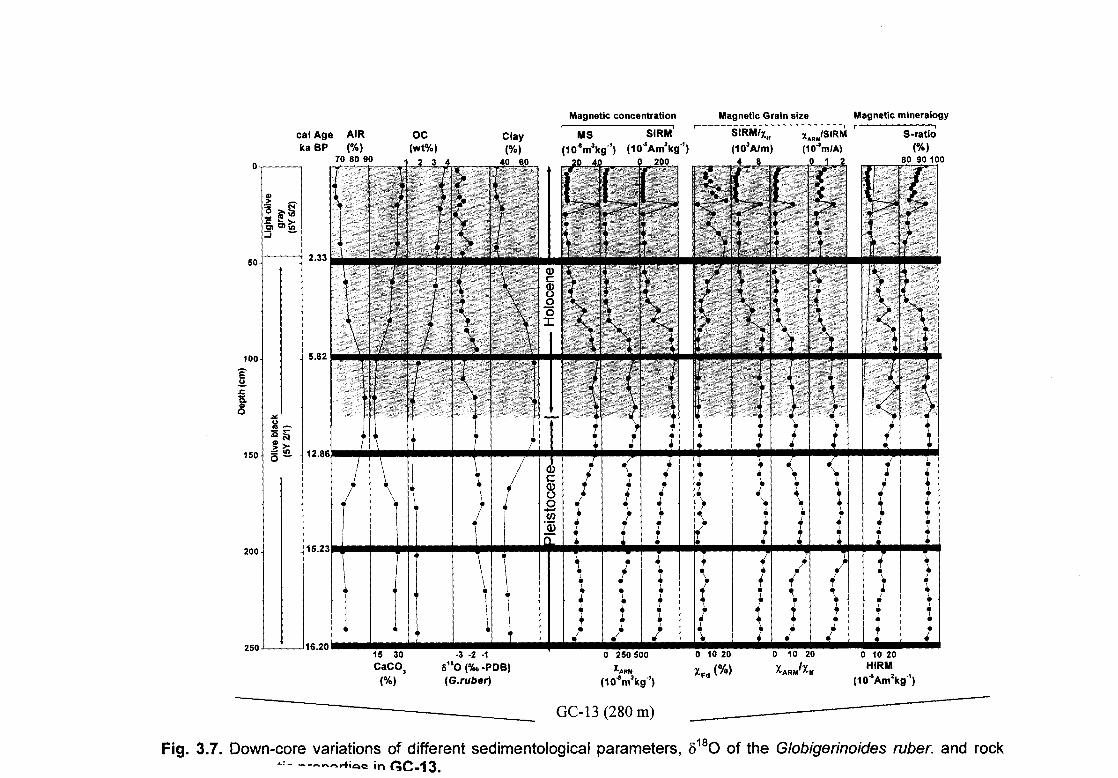
Fig. 3.7. Down-core variations of different sedimentological parameters, 5180 of the Globigerinoides ruber. and rock in (C-13.
15 30
CaCO, -3 -2 -1 0 250 500
6' 40 (%o -PDB) XARM
(%) (G.ruber) (104m3kg -')
GC-13 (280 m)
0 10 20
x„ (%)
0 10 20
lartmiXit
0 10 20 HIRM
(104Am2kg4 )
,. o. ..' 7 7 4 40 60 0 4,9 2 0 6 0 1 2 OV VV IUI
11••••• • ,,,_•-e—
I t
r,\,_
•
: le le
I
Lig
ht o
live
gray
(S
Y 6/
2)
2.33
5.62
12.86
15.23
16 20
--y-
5Y 2/
1)
a) (..)
1
1
i ,i
1 T ?
I
/ •
I I
1
•
\ / C
8 rn CD
v
ti
i 7
. : 1
or • ID'
:
:
‘
11 :
I
: •
4 i • :
• \*
• •
4 •
• •'
*to
•
:
if
:1
i
- -
1 --e-o
-0-9
- e-e
-e-•-e
_ _ i
• •
.
•
•
.
•
•
• i
• • :
• iisr :
! :
./.
: ■ T :
4 . , 1 4
: (
S 1 :
4 •
T % • ■
o
.
•
0--•-•-•-•-•-•-•-•-•
1 ,_•-•-•_•-e-ti-fh-e-• 0
50
150
200
250
cal Age AIR ka BP (%)
Magnetic concentration
MS SIRM
(10am3ke) (104Am2kg4 )
Magnetic Grain size Magnetic mineralogy
100
cQi
fs. 8
Clay (%)
O C (wt%)
S-ratio (%)
xARmISIRM
(104mIA)
SIRM/xii
(103A/m)

42
Glacial Maxima. As a consequence the iron-rich clay minerals (green grains)
and magnetites associated with the outer shelf sediments were oxidized and
subsequently transported to the site, resulting in decreased S-ratio% (Fig.
3.3B).
ii. Climate inferences - Northwestern margin of India
Although the amplitudes of MS, xARM and SIRM variations are
uniformly low in the late Pleistocene sediments in GC-2 (until 16 ka, see
arrows in Fig. 3.2B), the AIR content shows significant down-core variations.
In the interval containing the LGM 54-200 cm), increased AIR values
correspond with decreased S-ratio% and increased HIRM values (Fig. 3.2B)
indicating the presence of high proportions of high coercivity minerals such
as hematite or goethite. These minerals are primarily regarded as products
of continental weathering and diagnostic of eolian or fluvial influxes (Schmidt
et al., 1999). Despite significant decrease in S-ratio%, the overall magnetic
concentration parameters have not changed and magnetic grain size
parameters showed a small increase (Fig. 3.2B). It could be that the
magnetic minerals may have adhered to larger non-magnetic grains or
clumped one to the other and transported together. Previous studies have
indicated that lower S-ratios are an excellent proxy indicator of aeolian
sedimentation in the marine environment (Robinson, 1986; Bloemendal et
al., 1988), with hematite and goethite commonly present as staining on
aeolian particles (Peck et al., 1994; Karbassi and Shankar, 1994).
Palygorskite is a characteristic eolian mineral of Arabian provenance (Kolla
et al., 1981a) and dispersal of this mineral is caused by the northwesterly
winds that transport large quantities of eolian dust to the Arabian Sea.
Relatively small or indistinct reflections of palygorskite in the sediments of
the LGM (Fig. 3.2C) imply that the dust flux from Arabia did not reach the
site at this time, perhaps due to a weaker SW monsoon. Since the hump of
increased AIR and decreased S-ratio% further correspond to the gradual
decrease of 6180 values, it is likely that the hematite/goethite flux adhered
to flaky illite and chlorite minerals and was transported through fluvial supply.
Alternatively, hematite/goethite-rich particles originating in the arid and
semi-arid regions of the Indus River drainage basin could have undergone
43
aeolian transport to the core site. From the magnitude of the
glacial/interglacial change in 8180 value (1.98%0), fluvial supply may not have
been the major factor. For example, of the 1.98%, 1.2%0 accounts for the ice
volume effect (Labeyrie et al., 1987) and -0.5% for the regional sea surface
temperature changes (Rostek et al., 1997). The remaining value (0.28%0),
which can be attributed to local precipitation or river discharge, is insufficient
to represent a major fluvial flux (compare the glacial/interglacial amplitude of
this core with that of the cores from the SW margin of India). Therefore, the
data suggest that hematite and goethite were supplied by dry winds coming
from Pakistan and the Indus drainage basin during the LGM, producing the
low S-ratio% seen in the lower 1.5 m of core GC-2. A cold and dry climate
with weak SW monsoon activity during the LGM is supported by pollen and
lake level studies from the northwest India (Singh et al., 1974; Swain et al.,
1983; Wasson et al., 1984). Singh et al. (1990) further reported that a hyper-
arid climate continued from the LGM to 13,000 yr. BP, due to low precipitation
of the summer monsoon.
The changing sedimentary conditions in glacial and interglacial
sediments of the core are distinct before and after 16 ka BP (see arrows in
Fig. 3.2B). The gradual increase in magnetic concentration / grain size
parameters with high S-ratio%, accompanied by increased OC and AIR
contents corresponding to the gradual decrease in 8180 values both during
the early and late Holocene sediments (Fig. 3.2B). This indicates increased
terrigenous supply due to intensified SW monsoon conditions. Distinct
palygorskite peaks in these sediments (Fig. 3.2C) also support increased
eolian flux from the Arabian Peninsula brought by the southwesterly winds.
Prins et al. (2000) reported that the terrigenous sedimentation in the Indus
Fan area was dominated by eolian dust of Arabian origin after 9 ka BP.
However, von Rad et al. (1999) reported decreased eolian flux from glacial to
interglacial times in the continental margin sediments off Pakistan.
In GC-5, the coincidence of consistently low xlf, xARM and SIRM values
with high carbonate flux in sediments older than 13.99 ka suggests minimal

MS (104m3kg4 ) 2 4 6 8
Sand (%) 20 40
0
CaCO3
(%) 20 40 60
cal Age MS ka BP (104m3141 )
0 30 60
7.3
10.7
18.4
23.7 gray sh olive
— (10Y 4/2) _ 100
32.4 1" 200
t. a
300
i ■
r
400
GC-15 (1420 m)
• •
1 1 I,I,
1 2 3 4
OC (wt%)
- \
I ■ I 1 IP I 40 60 80
AIR (%)
Greenish blac (5G 2/1)
— — Grayish olive
(10 V 4/2)
0
1 00 — Olive gray — (5Y 3/2)
200 W.,
Dusky yellow- - brown -
(5GY 5/2)
300
----------- GC-14 (1380 m) -------
Fig. 3.8. Down -core variations of MS in core GC-14 and GC-15.

44
terrigenous supply that may have allowed the formation of aragonite muds.
This core was located at the shelf edge at 121 m depth. The Glacio-eustatic
sea level at -14 ka was at -110 m (Fairbanks, 1989), and the shallow sea
level conditions at the core site at that time probably facilitated the production
of lime muds. Rao et al. (2005) carried out detailed studies (mineralogy, Sr
content, SEM and oxygen isotopes) on the lime (aragonite) muds of these
cores and suggested that they largely comprise a mixture of carbonate
detritus derived from the disintegration of Halimeda bioherms from the shelf
and the carbonate platform (see Fig. 3.1) and inorganically formed aragonite
muds at insitu depths. The age of the aragonite muds in different cores
(ranges between 17.6 ka and 10 ka - see Figs. 3.2-3.4; Chapter 2, Table 2.2)
indicates that a carbonate depositional environment was prevalent throughout
this time interval. Negative or slightly positive MS values for the lime mud-
dominated sediments (unit 2) (see Figs. 3.2-3.4) indicate abundant
diamagnetic carbonate influences the MS.
The correspondence of increased AIR with decreased S-ratio and low
OC content between 13 ka BP and 9 ka BP (Fig. 3.3B) suggests the presence
of increased proportions of high coercivity magnetic minerals transported from
the shelf (discussed above). The synchronous and gradual increase in
magnetic concentration parameters, AIR content, grain size of the mud
fraction and OC of the sediments from the beginning of the Holocene (after 11
ka BP) imply that the site (GC-5) started to receive a gradually increasing
terrigenous supply, probably due to intensified monsoonal conditions after the
Younger Dryas (11.8-10.8 ka BP - Fairbanks, 1989). The variations in these
parameters show an inverse relationship with carbonate content (Fig. 3.3B).
Uniformly low values of xfd%, SIRM/xif and xARmixif indicate the presence of
multidomain grains. There is no much change in magnetic grain size
parameters after 11 ka BP, except that XARM/Xf and xARm/SIRM show marginal
increase in the late Holocene sediments (near to the core top). This implies
minor authigenic bacterial magnetite formation within this interval, but that the
bulk of the Holocene magnetic material is of detrital origin.
45
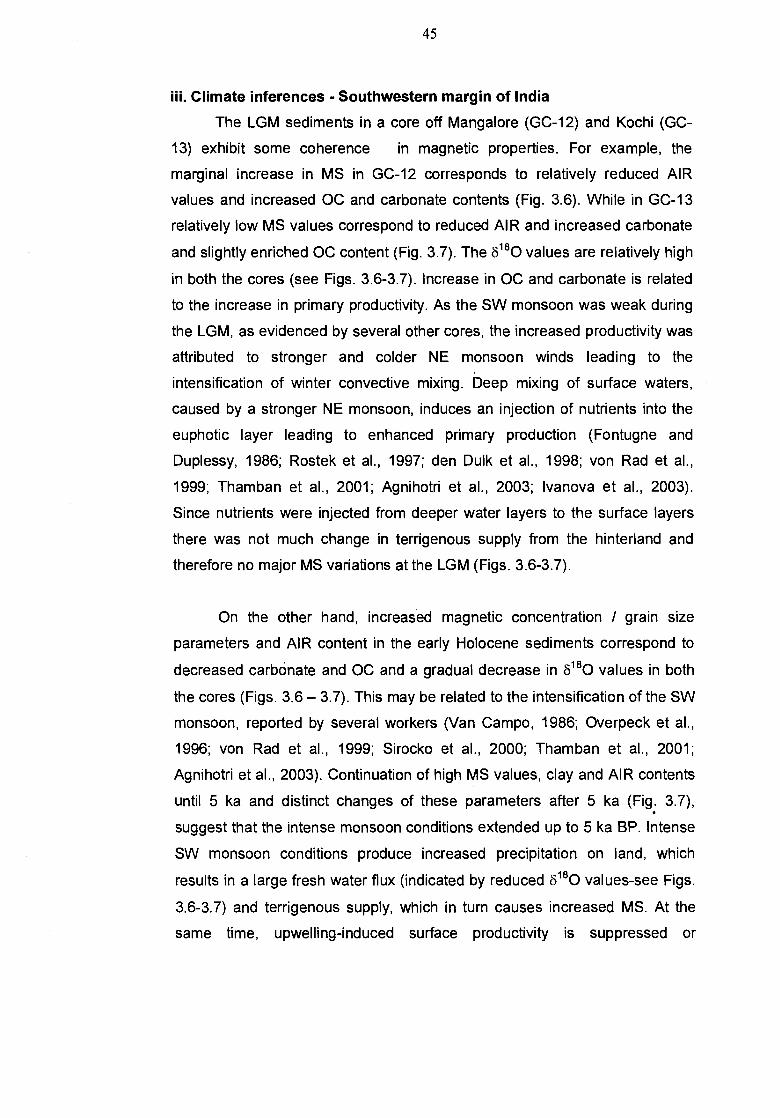
iii. Climate inferences - Southwestern margin of India
The LGM sediments in a core off Mangalore (GC-12) and Kochi (GC-
13) exhibit some coherence in magnetic properties. For example, the
marginal increase in MS in GC-12 corresponds to relatively reduced AIR
values and increased OC and carbonate contents (Fig. 3.6). While in GC-13
relatively low MS values correspond to reduced AIR and increased carbonate
and slightly enriched OC content (Fig. 3.7). The 8 180 values are relatively high
in both the cores (see Figs. 3.6-3.7). Increase in OC and carbonate is related
to the increase in primary productivity. As the SW monsoon was weak during
the LGM, as evidenced by several other cores, the increased productivity was
attributed to stronger and colder NE monsoon winds leading to the
intensification of winter convective mixing. Deep mixing of surface waters,
caused by a stronger NE monsoon, induces an injection of nutrients into the
euphotic layer leading to enhanced primary production (Fontugne and
Duplessy, 1986; Rostek et al., 1997; den Dulk et al., 1998; von Rad et al.,
1999; Thamban et al., 2001; Agnihotri et al., 2003; Ivanova et al., 2003).
Since nutrients were injected from deeper water layers to the surface layers
there was not much change in terrigenous supply from the hinterland and
therefore no major MS variations at the LGM (Figs. 3.6-3.7).
On the other hand, increased magnetic concentration / grain size
parameters and AIR content in the early Holocene sediments correspond to
decreased carbonate and OC and a gradual decrease in 6 180 values in both
the cores (Figs. 3.6 — 3.7). This may be related to the intensification of the SW
monsoon, reported by several workers (Van Campo, 1986; Overpeck et al.,
1996; von Rad et al., 1999; Sirocko et al., 2000; Thamban et al., 2001;
Agnihotri et al., 2003). Continuation of high MS values, clay and AIR contents
until 5 ka and distinct changes of these parameters after 5 ka (Fig. 3.7),
suggest that the intense monsoon conditions extended up to 5 ka BP. Intense
SW monsoon conditions produce increased precipitation on land, which
results in a large fresh water flux (indicated by reduced 8 180 values-see Figs.
3.6-3.7) and terrigenous supply, which in turn causes increased MS. At the
same time, upwelling-induced surface productivity is suppressed or

46
weakened, resulting in low OC and carbonate content (Figs. 3.6-3.7).
Overpeck et al. (1996) have suggested that following deglaciation, monsoons
were intensified at two abrupt events, one between 13 and 12.5 ka and the
other between 10 and 9.5 ka, with the latter extending to about 5.5 ka. The
increased MS values in the early Holocene can therefore be explained by an
increased supply of terrestrial material to the seabed. The early Holocene (at
interval between 9.7 and 7.1 ka) sediments of GC-12 show an increase
followed by decrease in magnetic concentration parameters (Fig. 3.6). This
interval is also associated with increase in xARm/SIRM and carbonate, and
decrease in OC, AIR% and 8 180 with no change in SIRM/xif, XARM/Xif and S-
ratio% (Fig. 3.6). Since organic carbon is falling, direct authigenic magnetite
formation driven by OC decomposition may not be the case for increased MS
values. Authigenic green grains occur in the coarse fraction of this interval.
Authigenic Fe-rich clays formed within the planktonic foraminifers can explain
such MS values. These green clay infilled skeletals were reported on the
outer shelf and upper slope (Thamban and Rao, 2000) and may have been
transported to the core site during the Holocene sea level transgression.
The mineral magnetic properties in the late Holocene sediments,
however, are different in both the cores (Figs. 3.6 and 3.7). MS values in GC-
12 initially decrease and then increase towards the core top despite
continuous increase in OC and AIR content. The decrease in MS is
accompanied by increase in xfd%, SIRM/xlf and XARm/Xif (Fig. 3.6). Since
reductive diagenesis first removes fine magnetic grains, this process should
be registered in XARm data, which is very sensitive to changes in the single
domain content. XARM and SIRM do not decrease noticeably (Fig. 3.6).
However, there is a small decrease in the ratio of XARm /SI RM, which suggest
a small increase in the average grain size of remanence carrying
ferrimagnets. Thus the reductive diagenesis has been very limited in this core
removing only the very finest ferrimagnets. On the other hand, the late
Holocene (75 to 25 cm interval) sediments of the core 13 exhibit consistently
reduced magnetic concentration / grain size / mineralogy parameters

47
accompanied by a gradual reduction in AIR / clay contents and 6 180 values
and by increased OC and carbonate contents (Fig. 3.7). It implies that these
organic-rich sediments are influenced by reductive diagenesis. Alternatively,
since sea level reached its present position at - 6 ka, it is likely that much of
the terrigenous supply during the late Holocene was deposited on the shallow
shelf, and little fine-grained magnetite reached the continental slope, resulting
in low MS values.
3.6. Summary and conclusions
o The magnetic susceptibility of the sediments is largely controlled by the
detrital magnetite content. Regional variations in magnetic
susceptibility are in accord with the mineralogical provinces.
o The highest MS values correspond to the sediments derived from the
Deccan Traps, followed by the sediments from the Indus and least in
the sediments off southern India.
o Intense chemical weathering in the Precambrian rocks of southern
India results in leaching of iron from the source rocks and thereby
reducing the MS value of the associated sediments.
o Authigenic green grains (Fe-rich clays) and biogenic magnetite at
certain intervals in the cores enhance the total MS signal.
o Reductive diagenesis in organic-rich near surface sediments reduces
the MS signal due to the dissolution of fine-grained magnetite.
o The MS contribution from the paramagnetic minerals (ilmenite, garnet,
chlorite, smectite, glauconite, olivine, amphiboles, pyroxene) is much
greater than that of dia-magnetic minerals (quartz, feldspar, calcite).
The MS variations caused by varying carbonate content are minor.
48
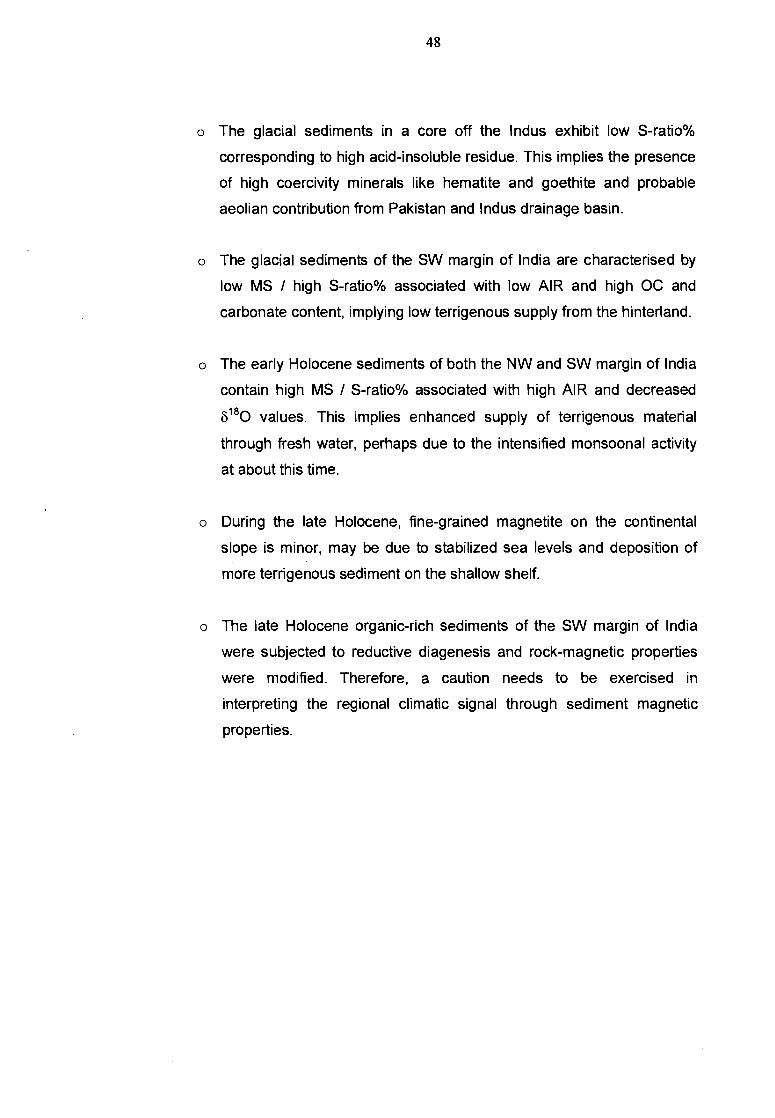
o The glacial sediments in a core off the Indus exhibit low S-ratio%
corresponding to high acid-insoluble residue. This implies the presence
of high coercivity minerals like hematite and goethite and probable
aeolian contribution from Pakistan and Indus drainage basin.
o The glacial sediments of the SW margin of India are characterised by
low MS / high S-ratio% associated with low AIR and high OC and
carbonate content, implying low terrigenous supply from the hinterland.
o The early Holocene sediments of both the NW and SW margin of India
contain high MS / S-ratio% associated with high AIR and decreased
8180 values. This implies enhanced supply of terrigenous material
through fresh water, perhaps due to the intensified monsoonal activity
at about this time.
o During the late Holocene, fine-grained magnetite on the continental
slope is minor, may be due to stabilized sea levels and deposition of
more terrigenous sediment on the shallow shelf.
o The late Holocene organic-rich sediments of the SW margin of India
were subjected to reductive diagenesis and rock-magnetic properties
were modified. Therefore, a caution needs to be exercised in
interpreting the regional climatic signal through sediment magnetic
properties.
49
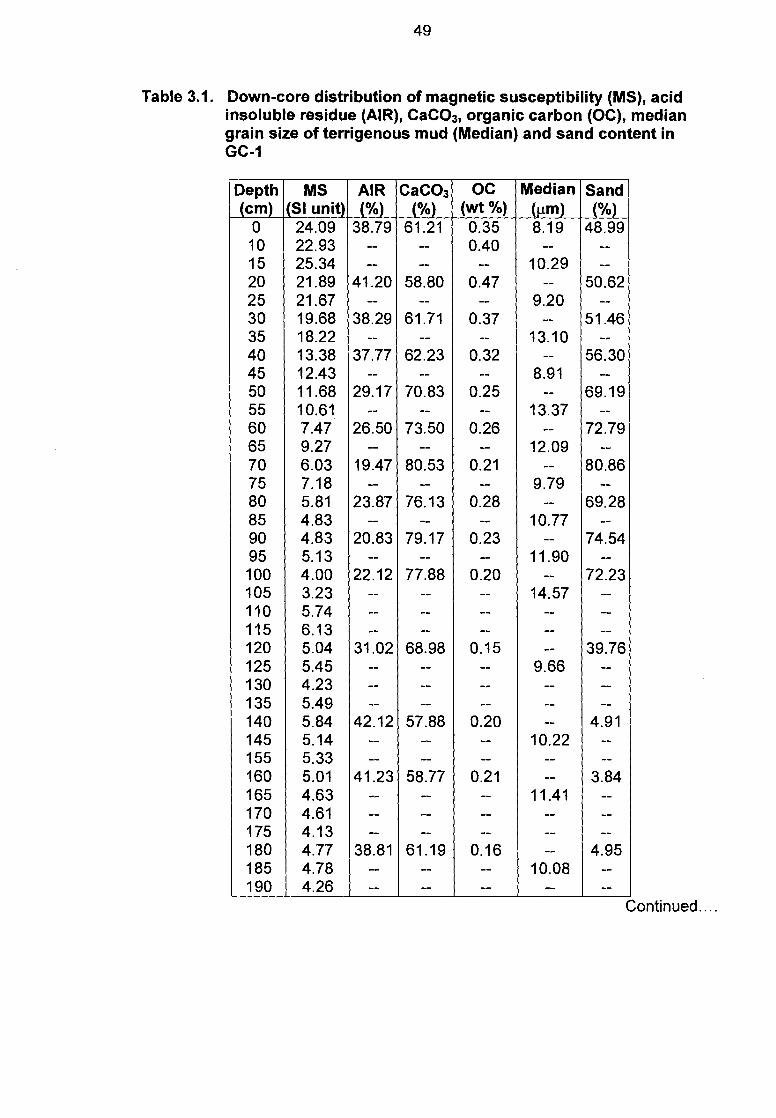
Table 3.1. Down-core distribution of magnetic susceptibility (MS), acid insoluble residue (AIR), CaCO 3, organic carbon (OC), median grain size of terrigenous mud (Median) and sand content in GC-1
Depth (cm)
MS (SI unit)
AIR (%)
CaCO3 (%)
OC (wt %)
Median (lim)
Sand (%)
0 24.09 38.79 61.21 0.35 8.19 48.99 10 22.93 -- -- 0.40 -- -- 15 25.34 -- -- -- 10.29 -- 20 21.89 41.20 58.80 0.47 -- 50.62 25 21.67 -- -- -- 9.20 -- 30 19.68 38.29 61.71 0.37 -- 51.46 35 18.22 -- -- -- 13.10 -- 40 13.38 37.77 62.23 0.32 -- 56.30 45 12.43 -- -- -- 8.91 -- 50 11.68 29.17 70.83 0.25 -- 69.19 55 10.61 -- -- -- 13.37 -- 60 7.47 26.50 73.50 0.26 -- 72.79 65 9.27 -- -- -- 12.09 -- 70 6.03 19.47 80.53 0.21 -- 80.86 75 7.18 -- -- -- 9.79 -- 80 5.81 23.87 76.13 0.28 -- 69.28 85 4.83 -- -- -- 10.77 -- 90 4.83 20.83 79.17 0.23 -- 74.54 95 5.13 -- -- -- 11.90 -- 100 4.00 22.12 77.88 0.20 -- 72.23 105 3.23 -- -- -- 14.57 -- 110 5.74 -- -- -- -- -- 115 6.13 -- -- -- -- -- 120 5.04 31.02 68.98 0.15 -- 39.76 125 5.45 -- -- -- 9.66 -- 130 4.23 -- -- -- -- -- 135 5.49 -- -- -- -- -- 140 5.84 42.12 57.88 0.20 -- 4.91 145 5.14 -- -- -- 10.22 -- 155 5.33 -- -- -- -- -- 160 5.01 41.23 58.77 0.21 -- 3.84 165 4.63 -- -- -- 11.41 -- 170 4.61 -- -- -- -- -- 175 4.13 -- -- -- -- -- 180 4.77 38.81 61.19 0.16 -- 4.95 185 4.78 -- -- -- 10.08 -- 190 4.26 -- -- -- -- --
Continued....
50
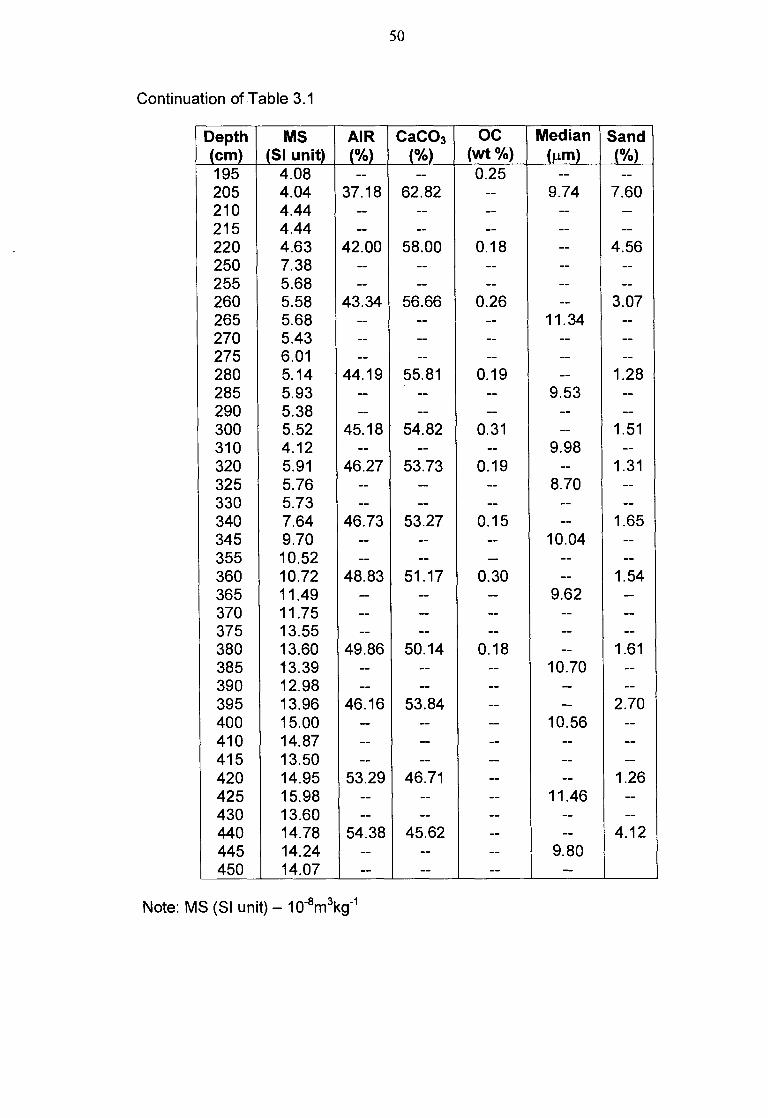
Continuation of Table 3.1
Depth (cm)
MS (SI unit)
AIR (%)
CaCO3 (%)
OC (wt %)
Median (ptm)
Sand (%)
195 4.08 -- 0.25 -- -- 205 4.04 37.18 62.82 -- 9.74 7.60 210 4.44 -- -- -- -- 215 4.44 -- -- -- -- -- 220 4.63 42.00 58.00 0.18 -- 4.56 250 7.38 -- -- -- -- 255 5.68 -- -- -- -- -- 260 5.58 43.34 56.66 0.26 -- 3.07 265 5.68 -- -- -- 11.34 -- 270 5.43 -- -- -- -- -- 275 6.01 -- -- -- -- -- 280 5.14 44.19 55.81 0.19 -- 1.28 285 5.93 -- -- 9.53 -- 290 5.38 -- -- -- -- -- 300 5.52 45.18 54.82 0.31 -- 1.51 310 4.12 -- -- 9.98 -- 320 5.91 46.27 53.73 0.19 -- 1.31 325 5.76 -- -- -- 8.70 -- 330 5.73 -- -- -- -- 340 7.64 46.73 53.27 0.15 -- 1.65 345 9.70 -- -- -- 10.04 -- 355 10.52 -- -- -- -- -- 360 10.72 48.83 51.17 0.30 -- 1.54 365 11.49 -- -- -- 9.62 -- 370 11.75 -- -- -- -- -- 375 13.55 -- -- -- -- -- 380 13.60 49.86 50.14 0.18 -- 1.61 385 13.39 -- -- -- 10.70 -- 390 12.98 -- -- -- -- -- 395 13.96 46.16 53.84 -- -- 2.70 400 15.00 -- -- -- 10.56 -- 410 14.87 -- -- -- -- -- 415 13.50 -- -- -- -- -- 420 14.95 53.29 46.71 -- -- 1.26 425 15.98 -- -- -- 11.46 -- 430 13.60 -- -- -- -- -- 440 14.78 54.38 45.62 -- -- 4.12 445 14.24 -- -- -- 9.80 450 14.07 -- -- -- --
Note: MS (SI unit) - 10 -8m3kg-1
Co
Table 3.2. Distribution of acid insoluble residue (AIR), CaCO3, organic carbon (OC), 8018 and rock magnetic parameters in GC-2
Depth (cm)
AIR (%)
CaCO3 (%)
OC (%)
Depth (cm)
8018 MS (SI unit)
URFA SIRM xfd (%)
SIRM/xif xARm/Xif xARNI/ SIRM
HIRM S- ratio (%)
0 59.92 40.08 0.88 1 -2.09 44.74 560.57 416.22 2.94 9.30 12.53 1.35 4.40 98.94 4 59.84 40.16 0.77 3 -- 46.72 592.69 426.73 7.64 9.13 12.69 1.39 10.83 97.46 8 59.23 40.77 0.79 5 -2.34 47.57 603.17 435.04 6.57 9.15 12.68 1.39 18.83 95.67 12 59.04 40.96 0.77 7 -- 47.20 597.01 443.73 7.31 9.40 12.65 1.35 10.97 97.53 16 57.22 42.78 0.74 9 -2.16 44.93 616.55 421.29 7.14 9.38 13.72 1.46 3.07 99.27 20 55.92 44.08 0.60 11 -- 43.21 548.95 393.46 7.44 9.10 12.70 1.40 11.53 97.07 24 52.55 47.45 0.58 13 -2.07 45.55 551.68 389.33 6.90 8.55 12.11 1.42 5.81 98.51 28 52.39 47.61 0.55 16 -- 48.14 669.83 478.08 4.55 9.93 13.91 1.40 3.77 99.21 32 49.65 50.35 0.53 17 -2.12 47.30 634.38 450.76 4.14 9.53 13.41 1.41 10.53 97.66 36 48.82 51.18 0.46 23 -1.92 45.68 638.17 450.51 5.37 9.86 13.97 1.42 10.07 97.76 40 52.96 47.04 0.47 27 -- 42.16 591.60 424.53 4.10 10.07 14.03 1.39 8.63 97.97 44 67.78 32.22 0.33 29 -2.07 41.35 566.64 392.11 5.43 9.48 13.70 1.45 7.72 98.03 48 69.91 30.09 0.33 31 -- 39.44 520.82 377.88 6.98 9.58 13.21 1.38 2.91 99.23 50 71.11 28.89 0.33 33 -- 37.49 531.68 361.23 4.16 9.64 14.18 1.47 10.18 97.18 56 73.11 26.89 0.32 35 -- 34.17 439.35 322.64 4.97 9.44 12.86 1.36 12.19 96.22 62 72.16 27.84 0.31 37 -1.68 29.36 381.90 277.63 5.13 9.46 13.01 1.38 4.32 98.44 68 71.80 28.20 0.34 39 -- 32.34 364.39 301.62 5.19 9.33 11.27 1.21 10.78 96.43 74 68.86 31.14 0.32 41 -1.75 28.36 276.59 241.12 6.95 8.50 9.75 1.15 14.07 94.17 80 67.36 32.64 0.33 43 -- 29.04 172.37 181.90 25.48 6.26 5.94 0.95 17.13 90.58 86 60.68 39.32 0.32 45 -1.93 25.54 190.32 179.26 15.96 7.02 7.45 1.06 15.09 91.58 92 56.45 43.55 0.31 49 -1.90 22.62 165.19 180.18 8.99 7.96 7.30 0.92 19.45 89.21 98 61.41 38.59 0.36 53 -1.75 21.01 135.04 157.86 6.52 7.51 6.43 0.86 16.29 89.68 104 66.39 33.61 0.36 56 -1.84 21.90 143.09 163.83 8.66 7.48 6.53 0.87 17.89 89.08 110 67.63 32.37 0.37 61 -1.89 20.66 129.75 164.16 11.11 7.95 6.28 0.79 17.09 89.59
Continued...

Continuation of Table 3.2
Depth (cm)
AIR (%)
CaCO3 (%)
OC (%)
Depth (cm)
6018 MS (SI unit)
XARM SIRM xfd (%)
SIRM/xif xARmhOf XARM/ SIRM
HIRM S- ratio (%)
116 61.82 38.18 0.32 71 -1.62 21.98 145.59 166.45 7.92 7.57 6.62 0.87 17.67 89.39 122 68.14 31.86 0.41 81 -0.23 20.45 146.13 166.19 3.37 8.13 7.15 0.88 15.84 90.47 128 71.07 28.93 0.34 91 0.29 19.89 143.72 166.66 5.86 8.38 7.22 0.86 7.10 95.74 134 69.71 30.29 0.32 102 -1.01 19.41 136.22 157.67 10.06 8.12 7.02 0.86 12.91 91.82 140 59.29 40.71 0.31 110 -1.26 20.25 125.19 170.15 4.50 8.40 6.18 0.74 18.57 89.08 146 59.59 40.41 0.28 122 -1.06 19.39 116.40 159.10 7.81 8.20 6.00 0.73 15.66 90.16 152 55.83 44.17 0.28 130 -1.02 21.22 106.39 175.44 9.32 8.27 5.01 0.61 17.43 90.06 158 58.03 41.97 0.30 142 -0.58 22.35 110.88 195.20 4.50 8.73 4.96 0.57 12.76 93.46 164 64.46 35.54 0.32 150 -0.52 23.02 110.76 198.04 8.79 8.60 4.81 0.56 12.24 93.82 170 65.56 34.44 0.36 160 -0.09 24.46 125.63 226.26 2.44 9.25 5.14 0.56 15.20 93.28 176 71.58 28.42 0.37 170 0.03 23.81 120.75 210.04 6.29 8.82 5.07 0.57 15.31 92.71 182 71.43 28.57 0.35 178 -- 24.04 107.95 207.97 6.34 8.65 4.49 0.52 13.86 93.33 188 68.56 31.44 0.40 182 -0.32 23.15 118.55 203.01 6.41 8.77 5.12 0.58 16.08 92.08 194 69.64 30.36 0.42 194 -0.10 23.51 113.30 212.18 3.69 9.03 4.82 0.53 15.68 92.61 200 68.21 31.79 0.41 202 -0.23 26.32 117.31 208.68 14.41 7.93 4.46 0.56 15.47 92.59
Note: MS (10-8m3kg-1 ); XARM (m3kg-1 ); SIRM (10-5Am2kg-1 ); SIRM/xif (103A/m); xARm/SIRM (10 -3m/A); HIRM (10-5Am2kg-1)

53
Table 3.3. Down-core distribution of magnetic susceptibility (MS), acid insoluble residue (AIR), CaCO 3, organic carbon (OC), median grain size of terrigenous mud (Median) and sand content in GC-3
Depth (cm)
MS (SI unit)
AIR (%)
CaCO3 (%)
OC (wt %)
Median (p,M)
Sand (%)
0 89.82 35.63 64.37 0.47 -- -- 2 80.62 28.51 71.49 -- 17.634 63.27 4 64.6 29.16 70.84 0.27 -- -- 6 48.24 27.27 72.73 -- -- -- 8 33.74 34.18 65.82 -- -- 62.39 10 36.98 25.6 74.4 -- 9.67 -- 12 33.63 33.2 66.8 -- -- -- 14 22.09 27.7 72.3 0.28 -- 67.43 16 28.58 29.87 70.13 0.20 -- -- 18 18.67 30.16 69.84 0.35 -- -- 22 27.6 22.21 77.79 -- -- -- 24 24.34 27.06 72.94 -- 10.965 -- 26 22.64 25.47 74.53 -- -- 45.36 28 20.81 36.03 63.97 -- -- -- 30 17.04 23.59 76.41 -- 11.168 -- 32 11.67 20.28 79.72 0.24 -- 47.27 34 19.18 34.96 65.04 -- -- -- 36 23.21 32.93 67.07 0.25 -- -- 38 4.89 27.19 72.81 -- -- 33.64 40 6.56 23.82 76.18 0.27 -- -- 42 3.17 25.88 74.12 -- 12.263 -- 44 3.65 30.08 69.92 0.27 -- 25.33 46 2.89 27.37 72.63 -- -- -- 48 2.98 28.74 71.26 0.25 -- -- 50 3.24 23.82 76.18 -- 10.595 29.77 52 2.25 41.42 58.58 -- -- -- 54 3.16 37.6 62.4 -- .-- -- 56 2.83 28.3 71.7 0.31 -- 32.04 58 2.29 24.53 75.47 0.28 -- -- 62 3.94 39.87 60.13 -- -- 18.92 64 3.27 45.48 54.52 -- 11.004 -- 66 4.35 33.43 66.57 -- -- -- 68 3.19 28.61 71.39 0.30 -- 20.02 70 2.38 27.19 72.81 0.31 -- -- 74 1.81 -- -- -- -- --
Continued...

Continuation of Table 3.3
Depth (cm)
MS (SI unit)
AIR (%)
CaCO3 (%)
OC (wt %)
Median (gm)
Sand (%)
78 2.77 35.21 64.79 0.29 -- 2.85 80 0.9 25.23 74.77 0.30 -- -- 84 2.09 25.87 74.13 0.25 -- -- 88 2.61 29.17 70.83 0.30 -- 1.71 90 2.94 26.45 73.55 0.26 10.63 -- 94 2.31 28.89 71.11 0.30 -- -- 98 2.44 32.16 67.84 -- 9.382 3.23 100 2.28 24.79 75.21 0.28 -- -- 104 3.18 35.73 64.27 -- -- -- 108 2.6 30.16 69.84 0.26 -- 6.14 110 0.45 26.51 73.49 -- -- -- 114 1.6 33.3 66.7 0.30 -- -- 118 4.43 27.63 72.37 -- -- 4.73 120 3.59 30.16 69.84 -- 8.113 -- 124 2.71 35.11 64.89 -- -- -- 128 3.7 33.33 66.67 -- -- 5.38 130 4.38 -- -- -- -- -- 134 3.72 35.11 64.89 0.21 8.368 -- 138 2.94 54.88 45.12 -- -- 4.58 140 3.69 26.25 73.75 -- -- -- 144 3.43 34.6 65.4 0.25 -- -- 148 3.25 33.8 66.2 -- -- -- 150 3.78 27.1 72.9 -- -- 2.21 154 2.92 35.61 64.39 0.29 -- -- 158 3.37 46.58 53.42 -- -- -- 160 3.38 28.79 71.21 -- 9.945 3.18 164 2.99 38.65 61.35 -- -- -- 168 3.45 28.4 71.6 -- -- -- 170 4.82 28.45 71.55 -- -- 1.58 174 3.27 31.75 68.25 0.24 -- -- 178 2.80 39.87 60.13 -- -- -- 180 3.17 28.19 71.81 -- -- 2.6 184 2.76 34.59 65.41 0.21 11.279 -- 188 3.02 42.53 57.47 -- -- -- 190 3.24 26.7 73.3 -- -- 3.67 194 3.09 39.76 60.24 0.18 -- --
54
Continued...
Continuation of Table 3.3
Depth (cm)
MS (SI unit)
AIR (%)
CaCO3 (%)
OC (wt %)
Median (p.m)
Sand (%)
198 3.17 31.65 68.35 -- -- -- 200 3.95 26.56 73.44 -- 10.211 1.97 210 2.66 25.34 74.66 -- -- -- 220 3.42 26.62 73.38 -- -- -- 230 3.90 29.66 70.34 -- -- 0.6 240 3.70 28.68 71.32 -- -- -- 250 3.65 28.43 71.57 -- 10.257 -- 260 3.71 26.63 73.37 -- -- 5.88 270 3.18 27.75 72.25 -- -- -- 280 3.87 28.03 71.97 -- -- -- 290 4.61 27.88 72.12 -- 9.554 5.07 300 2.95 27.47 72.53 -- -- -- 310 3.66 29.68 70.32 -- 8.161 -- 320 3.86 28.53 71.47 -- -- 2.82 330 3.50 28.08 71.92 -- -- -- 340 4.11 28.79 71.21 -- 8.893 -- 350 3.89 29.2 70.8 -- 8.886 0.29 360 3.28 27.69 72.31 -- -- -- 370 3.85 28.32 71.68 -- -- -- 380 3.00 29.78 70.22 -- -- 1.83 390 3.59 28.94 71.06 -- 8.825 -- 400 3.64 28.7 71.3 -- -- 1.51
Note: MS (SI unit) - 10-8m 3kg-1
55
56
Table 3.4. Down-core distribution of magnetic susceptibility (MS), acid insoluble residue (AIR), CaCO3, median grain size of terrigenous mud (Median) and Sand content in GC-4
Depth (cm)
MS (SI unit)
AIR (%)
CaCO3 (%)
Median (iim)
Sand (%)
0 20.18 23.99 76.01 -- 80.65 2 16.60 19.30 80.70 13.56 4 19.20 22.17 77.83 -- 6 20.00 27.14 72.86 -- 76.28 8 17.44 18.68 81.32 -- 10 16.89 22.26 77.74 -- 76.86 12 18.78 19.80 80.20 9.28 14 19.25 22.86 77.14 -- 67.59 16 14.95 18.44 81.56 -- 18 5.43 21.56 78.44 13.61 82.12 20 9.77 24.53 75.47 -- 22 8.64 19.99 80.01 -- 80.47 24 4.95 22.84 77.16 -- 30 11.45 19.40 80.60 10.02 75.40 32 8.14 25.64 74.36 -- 34 8.34 23.79 76.21 -- 71.98 36 5.47 20.56 79.44 -- 38 6.16 20.68 79.32 -- 67.02 40 4.11 22.80 77.20 -- 42 3.50 22.59 77.41 16.27 61.36 44 3.62 22.64 77.36 -- 46 3.19 20.97 79.03 -- 71.75 48 3.41 20.77 79.23 -- 50 3.65 21.76 78.24 14.28 63.99 52 3.64 19.42 80.58 -- 54 4.16 20.44 79.56 -- 66.49 56 4.41 19.05 80.95 -- 58 3.77 22.45 77.55 -- 62.79 60 3.50 23.66 76.34 -- 62 3.88 27.59 72.41 16.70 66.00 64 3.15 20.35 79.65 -- 66 3.27 27.54 72.46 -- 62.23 68 2.84 22.57 77.43 -- 70 3.34 22.53 77.47 16.28 64.73 72 4.14 28.16 71.84 -- 74 3.36 29.40 70.60 -- 64.25 76 2.80 23.00 77.00 --
Continued...
57
Continuation of Table 3.4
Depth (cm)
MS (SI unit)
AIR (%)
CaCO3 (%)
Median (gm)
Sand (%)
78 3.55 24.92 75.08 -- 64.21 80 3.30 22.33 77.67 -- 82 3.48 22.98 77.02 15.89 63.67 84 2.50 22.84 77.16 -- 86 2.59 22.93 77.07 -- 65.58 88 1.73 22.99 77.01 -- 90 2.44 25.44 74.56 16.15 61.61 92 3.89 23.11 76.89 -- 94 3.35 23.75 76.25 -- 63.97 100 2.41 21.14 78.86 14.69 66.11 106 1.99 19.85 80.15 -- 61.44 112 2.17 17.84 82.16 -- 118 1.41 18.05 81.95 10.55 73.78 124 0.93 19.37 80.63 -- 130 1.13 21.96 78.04 12.54 69.59 136 1.53 15.97 84.03 -- 142 1.47 16.00 84.00 14.37 73.37 148 1.32 15.09 84.91 -- 154 1.42 16.83 83.17 -- 67.28 160 0.39 15.46 84.54 -- 166 0.29 13.29 86.71 11.78 172 0.09 10.24 89.76 -- 178 0.14 -- -- --
184 0.00 11.77 88.23 9.98 71.33 190 -0.26 13.27 86.73 -- 196 -0.42 9.01 90.99 7.55 66.43 200 -0.63 9.12 90.88 -- 205 0.53 -- -- -- 11.91 220 -0.30 11.10 88.90 -- 230 -0.61 12.35 87.65 7.73 47.32 240 -0.31 14.01 85.99 -- 250 -0.80 12.89 87.11 8.32 39.36 260 -0.81 9.65 90.35 -- 270 -0.25 9.50 90.50 8.98 67.55 280 -0.27 10.08 89.92 -- 290 -0.57 9.21 90.79 9.43 67.91 300 -0.21 11.55 88.45 --
Continued...
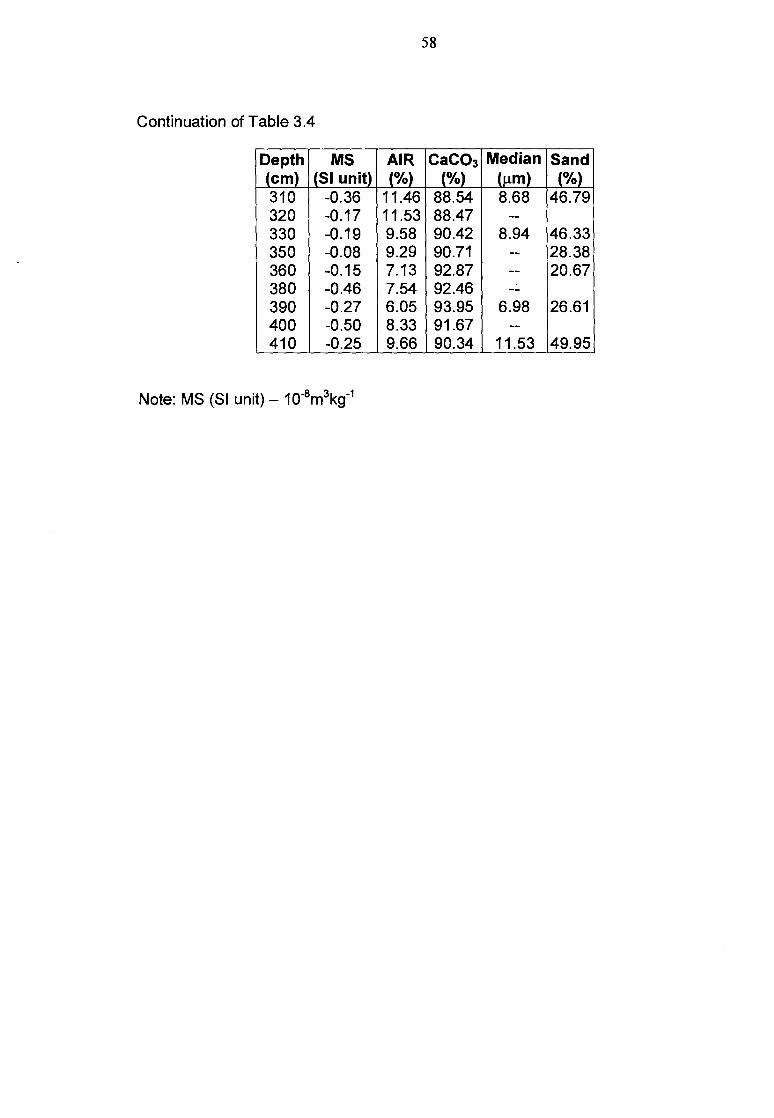
58
Continuation of Table 3.4
Depth (cm)
MS (SI unit)
AIR (%)
CaCO3 (%)
Median (gm)
Sand I%)
310 -0.36 11.46 88.54 8.68 46.79 320 -0.17 11.53 88.47 -- 330 -0.19 9.58 90.42 8.94 46.33 350 -0.08 9.29 90.71 -- 28.38 360 -0.15 7.13 92.87 -- 20.67 380 -0.46 7.54 92.46 -- 390 -0.27 6.05 93.95 6.98 26.61 400 -0.50 8.33 91.67 -- 410 -0.25 9.66 90.34 11.53 49.95
Note: MS (SI unit) - 10-8m3kg-1

Table 3.5. Distribution of acid insoluble residue (AIR), CaCO3, organic carbon (OC), and rock magnetic parameters in GC-5
Depth (cm)
AIR (%)
CaCO3 (%)
OC (%)
Median (11m)
Sand (%)
MS (SI unit)
Um SIRM xfd (%)
SIRM/xif xARm/Xif xARm/ SIRM
HIRM S- ratio (%)
2 46.11 53.89 -- 40.78 183.95 991.96 1721.13 2.67 9.36 5.39 0.58 48.12 97.20 4 55.62 44.38 0.96 -- -- 185.03 1051.69 1838.46 0.00 9.94 5.68 0.57 80.25 95.63 6 55.34 44.66 17.47 31.52 185.71 1148.12 1871.81 0.00 10.08 6.18 0.61 78.16 95.82 8 57.40 42.60 0.88 -- 39.08 182.47 970.26 1709.39 0.21 9.37 5.32 0.57 59.81 96.50 10 61.58 38.42 -- -- 171.66 996.01 1643.68 0.00 9.58 5.80 0.61 41.95 97.45 12 56.09 43.91 0.97 27.85 32.80 170.24 709.85 1227.21 0.13 7.21 4.17 0.58 32.05 97.39 14 60.51 39.49 -- -- 166.44 869.79 1631.52 0.30 9.80 5.23 0.53 75.41 95.38 16 62.22 37.78 0.84 -- 36.03 163.38 800.31 1602.27 0.14 9.81 4.90 0.50 76.42 95.23 18 61.27 38.73 -- -- 147.22 518.75 1338.76 0.33 9.09 3.52 0.39 60.33 95.49 20 58.25 41.75 0.99 -- 45.42 146.24 507.39 1328.01 0.32 9.08 3.47 0.38 90.26 93.20 22 52.97 47.03 19.30 -- 160.76 645.60 1368.75 0.12 8.51 4.02 0.47 61.20 95.53 24 61.28 38.72 0.95 -- 28.18 151.60 659.97 1414.96 0.09 9.33 4.35 0.47 60.64 95.71 26 60.57 39.43 1.04 -- 24.22 155.63 573.81 1382.01 0.00 8.88 3.69 0.42 85.94 93.78 38 57.35 42.65 1.07 16.74 33.88 145.62 539.90 1211.28 0.15 8.32 3.71 0.45 45.59 96.24 40 59.11 40.89 1.01 20.43 39.26 160.98 698.34 1430.54 0.00 8.89 4.34 0.49 43.52 96.96 42 65.01 34.99 -- -- 158.98 720.50 1422.94 0.00 8.95 4.53 0.51 41.27 97.10 44 61.84 38.16 1.14 -- 30.25 137.32 597.06 1235.53 0.31 9.00 4.35 0.48 45.18 96.34 46 60.28 39.72 -- -- 122.91 529.82 1083.21 0.19 8.81 4.31 0.49 41.51 96.17 48 53.42 46.58 0.91 -- 35.96 121.70 531.52 1033.67 0.00 8.49 4.37 0.51 40.64 96.07 50 55.01 44.99 17.19 -- 116.53 518.17 952.25 0.00 8.17 4.45 0.54 27.64 97.10 52 43.91 56.09 0.94 -- 47.71 110.32 334.39 540.69 0.32 4.90 3.03 0.62 19.88 96.32 54 51.08 48.92 1.08 -- 34.60 106.88 494.70 906.00 0.29 8.48 4.63 0.55 69.81 92.29 60 48.07 51.93 0.97 18.94 45.00 111.02 476.94 881.68 6.42 7.94 4.30 0.54 33.34 96.22
Continued...
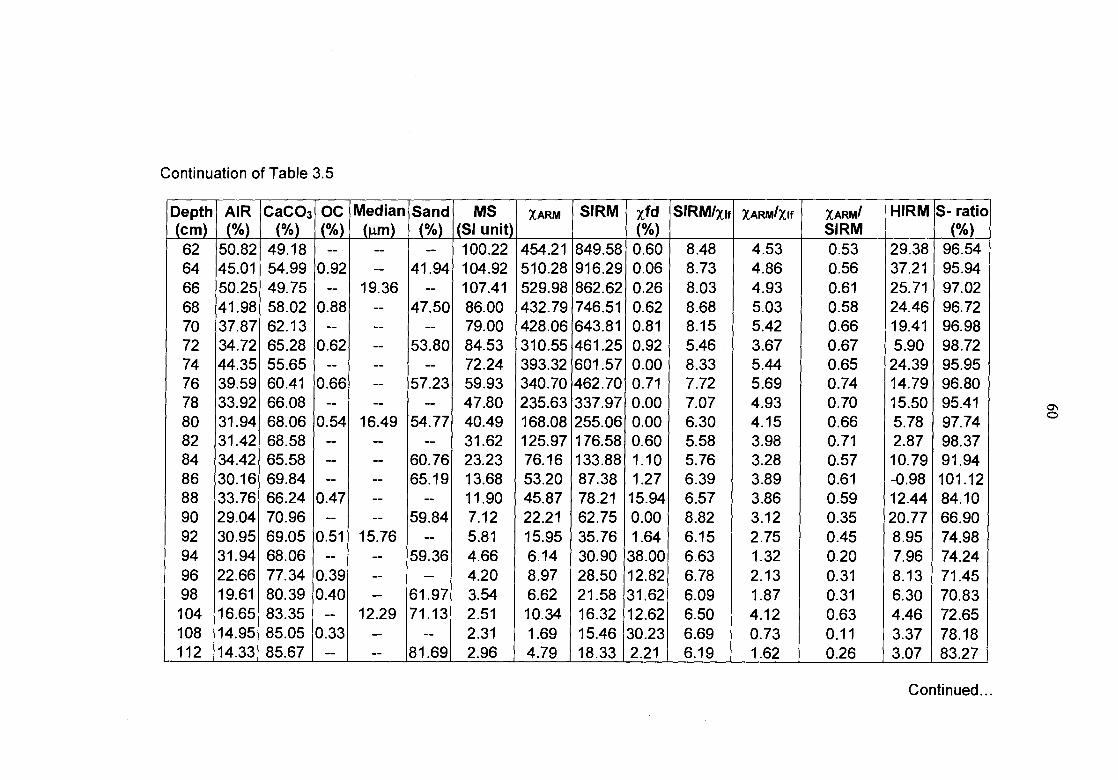
Continuation of Table 3.5
Depth (cm)
AIR (%)
CaCO3 (%)
OC (%)
Median (.tm)
Sand (%)
MS (SI unit)
XARM SIRM xfd (%)
SIRM/xif XARM/Xlf XARM/ SIRM
HIRM S- ratio (%)
62 50.82 49.18 -- -- -- 100.22 454.21 849.58 0.60 8.48 4.53 0.53 29.38 96.54 64 45.01 54.99 0.92 -- 41.94 104.92 510.28 916.29 0.06 8.73 4.86 0.56 37.21 95.94 66 50.25 49.75 -- 19.36 -- 107.41 529.98 862.62 0.26 8.03 4.93 0.61 25.71 97.02 68 41.98 58.02 0.88 -- 47.50 86.00 432.79 746.51 0.62 8.68 5.03 0.58 24.46 96.72 70 37.87 62.13 -- -- -- 79.00 428.06 643.81 0.81 8.15 5.42 0.66 19.41 96.98 72 34.72 65.28 0.62 -- 53.80 84.53 310.55 461.25 0.92 5.46 3.67 0.67 5.90 98.72 74 44.35 55.65 -- -- -- 72.24 393.32 601.57 0.00 8.33 5.44 0.65 24.39 95.95 76 39.59 60.41 0.66 -- 57.23 59.93 340.70 462.70 0.71 7.72 5.69 0.74 14.79 96.80 78 33.92 66.08 -- -- -- 47.80 235.63 337.97 0.00 7.07 4.93 0.70 15.50 95.41 80 31.94 68.06 0.54 16.49 54.77 40.49 168.08 255.06 0.00 6.30 4.15 0.66 5.78 97.74 82 31.42 68.58 -- -- -- 31.62 125.97 176.58 0.60 5.58 3.98 0.71 2.87 98.37 84 34.42 65.58 -- -- 60.76 23.23 76.16 133.88 1.10 5.76 3.28 0.57 10.79 91.94 86 30.16 69.84 -- -- 65.19 13.68 53.20 87.38 1.27 6.39 3.89 0.61 -0.98 101.12 88 33.76 66.24 0.47 -- -- 11.90 45.87 78.21 15.94 6.57 3.86 0.59 12.44 84.10 90 29.04 70.96 -- -- 59.84 7.12 22.21 62.75 0.00 8.82 3.12 0.35 20.77 66.90 92 30.95 69.05 0.51 15.76 -- 5.81 15.95 35.76 1.64 6.15 2.75 0.45 8.95 74.98 94 31.94 68.06 -- -- 59.36 4.66 6.14 30.90 38.00 6.63 1.32 0.20 7.96 74.24 96 22.66 77.34 0.39 -- -- 4.20 8.97 28.50 12.82 6.78 2.13 0.31 8.13 71.45 98 19.61 80.39 0.40 -- 61.97 3.54 6.62 21.58 31.62 6.09 1.87 0.31 6.30 70.83 104 16.65 83.35 -- 12.29 71.13 2.51 10.34 16.32 12.62 6.50 4.12 0.63 4.46 72.65 108 14.95 85.05 0.33 -- -- 2.31 1.69 15.46 30.23 6.69 0.73 0.11 3.37 78.18 112 14.33 85.67 -- -- 81.69 2.96 4.79 18.33 2.21 6.19 1.62 0.26 3.07 83.27
Continued...

Continuation of Table 3.5
Depth (cm)
AIR (%)
CaCO3 (%)
OC (%)
Median (.1m)
Sand (%)
MS (SI unit)
XARM SIRM xfd (%)
SIRM/xif xARmiXif XARSSIRM HIRM S- ratio (%)
116 11.97 88.03 0.24 -- 1.33 7.79 8.36 37.74 6.30 5.87 0.93 1.60 80.84 120 13.09 86.91 0.16 9.95 57.84 4.06 19.27 25.57 31.93 6.30 4.75 0.75 4.14 83.82 124 -- -- -- -- -- -0.27 0.51 3.09 0.00 -11.46 -1.88 0.16 0.25 91.93 132 9.47 90.53 0.18 7.59 44.11 -- -- -- -- -- -- -- -- -- 140 4.46 95.54 -- -- -- -0.76 0.74 1.54 0.00 -2.02 -0.97 0.48 0.16 89.83 144 2.92 97.08 0.10 8.47 32.85 -0.49 1.24 4.05 0.00 -8.30 -2.55 0.31 0.22 94.65 148 -- -- -- -- -- -1.40 1.33 2.12 0.00 -1.52 -0.95 0.62 0.10 95.08 152 3.98 96.02 -- -- 32.45 -- -- -- -- -- -- -- -- -- 156 6.19 93.81 -- -- -- -- -- -- -- -- -- -- -- 160 5.00 95.00 0.11 -- 45.44 -- -- -- -- -- -- -- -- -- 164 5.94 94.06 -- -- -- -- -- -- -- -- -- -- -- -- 168 3.52 96.48 -- -- 35.90 -- -- -- -- -- -- -- -- -- 172 5.93 94.07 -- 9.87 43.42 -- -- -- -- -- -- -- -- -- 176 4.97 95.03 0.09 -- -- -- -- -- -- -- -- -- 180 2.31 97.69 -- 12.02 51.24 -1.17 2.11 1.35 0.00 -1.16 -1.81 1.56 0.14 89.83 184 4.12 95.88 -- -- -- -- -- -- -- -- -- -- -- -- 188 4.52 95.48 -- -- 41.36 -- -- -- -- -- -- -- -- -- 192 6.38 93.62 -- -- -- -- -- -- -- -- -- -- -- -- 196 3.74 96.26 0.06 -- 33.59 -0.33 1.34 2.60 0.00 -7.96 -4.11 0.52 0.40 84.64 200 5.71 94.29 0.06 -- -- -0.94 1.07 1.44 0.00 -1.53 -1.13 0.74 0.18 87.27
Note: MS (10-8m3kg-1 ); XARm (m 3kg-1 ); SIRM (10-5Am2kg-1 ); SIRM/xif (103A/m), xARm/SIRM (10 -3m/A); HIRM (10-5Arn2kg-1)

62
Table 3.6. Down-core distribution of magnetic susceptibility (MS), acid insoluble residue (AIR), CaCO 3, organic carbon (OC), median grain size of terrigenous mud (Median) and Sand content in GC-6
Depth (cm)
MS (SI unit)
AIR (%)
CaCO3 (%)
OC (wt%)
Median (lam)
Sand (%)
0 90.88 54.77 45.23 4.24 9.12 4.92 2 95.97 -- -- -- -- -- 4 90.42 -- -- 4.22 -- 9.19 6 94.03 -- -- -- -- -- 8 86.60 -- -- 4.83 -- 4.73 10 76.16 60.07 39.93 -- 11.24 -- 12 69.36 -- -- 4.57 -- 7.81 14 61.95 -- -- -- -- -- 16 52.02 -- -- 4.47 -- 16.80 18 39.38 -- -- -- -- -- 20 28.71 52.73 47.27 3.86 10.19 7.15 22 27.91 -- -- -- -- -- 24 21.20 -- -- -- -- 7.34 26 22.74 -- -- -- -- -- 28 19.20 -- -- 3.85 -- 6.36 30 16.75 60.27 39.73 -- 12.18 -- 32 16.54 -- -- 4.21 -- 4.53 34 14.21 -- -- -- -- -- 36 13.22 -- -- -- -- 3.94 38 12.71 -- -- 3.77 -- -- 40 11.70 62.33 37.67 4.09 12.77 5.47 42 9.68 -- -- -- -- -- 44 15.61 -- -- 3.92 -- 2.75 46 10.55 -- -- -- -- -- 48 7.34 -- -- -- -- 8.97 50 7.67 52.85 47.15 -- 12.82 -- 52 7.98 -- -- -- -- 5.31 54 6.84 -- -- -- -- -- 56 7.99 -- -- 3.67 -- -- 58 6.55 -- -- -- -- -- 60 10.74 58.73 41.27 3.84 16.15 2.72 62 9.47 -- -- -- -- -- 64 12.70 -- -- -- -- 3.47 66 5.41 -- -- -- -- -- 68 5.08 -- -- -- -- 9.75 70 6.50 50.07 49.93 -- 10.87 -- 72 5.95 -- -- 3.84 -- 10.23
Continued...

63
Continuation of Table 3.6
Depth (cm)
MS (SI unit)
AIR (%)
CaCO3 (%)
OC (wt%)
Median (gm)
Sand (%)
74 7.04 -- -- 76 3.45 -- -- 3.36 -- 12.74 78 6.44 -- -- 80 7.16 60.09 39.91 3.70 11.03 10.05 82 5.55 -- -- 84 7.19 -- -- 4.26 -- 5.70 86 7.15 -- -- -- -- -- 88 6.36 -- -- 3.17 -- 12.67 90 4.82 47.40 52.60 -- 10.16 -- 92 7.49 -- -- 3.68 -- 14.56 94 7.75 -- -- -- -- -- 96 6.65 -- 3.98 -- 9.41 98 6.23 -- -- 100 7.88 42.45 57.55 3.45 10.17 8.31 105 7.73 -- -- 110 8.11 -- 3.60 -- 12.33 115 7.67 -- -- 120 7.32 48.73 51.27 3.83 11.05 10.09 125 7.80 -- -- 130 7.00 -- -- 3.02 -- 16.23 135 8.24 -- -- 140 9.58 70.69 29.31 3.66 14.78 7.42 145 7.82 -- 150 11.42 -- -- -- -- 3.76 155 6.79 -- -- 160 5.90 60.77 39.23 3.08 10.92 23.12 165 5.07 -- -- 170 5.90 -- -- 2.87 -- 14.22 175 8.95 -- -- 180 6.07 41.90 58.10 2.82 10.88 15.86 185 5.51 -- 190 4.44 -- -- 2.14 -- 28.01 195 3.25 -- -- 200 3.83 28.48 71.52 1.98 10.30 32.36 205 4.92 -- -- 210 7.18 -- -- -- -- 17.76 215 7.42 -- -- -- -- --
Continued...
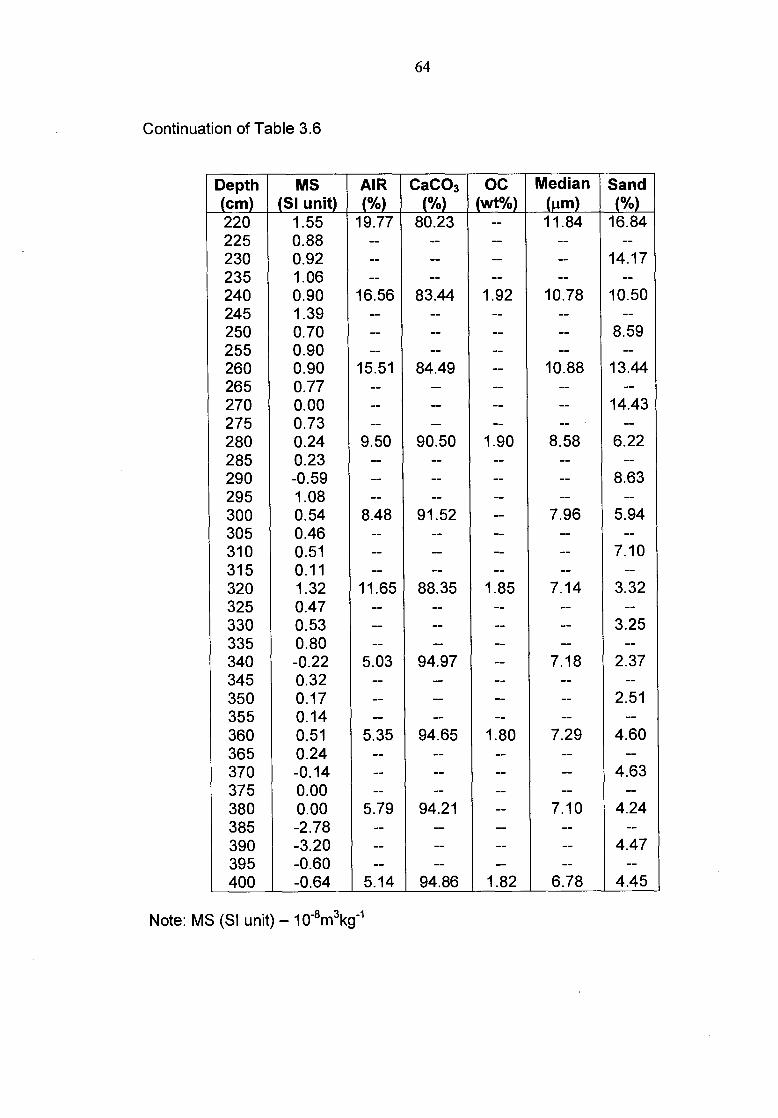
64
Continuation of Table 3.6
Depth (cm)
MS (SI unit)
AIR (%)
CaCO3 (%)
OC (wt%)
Median (in)
Sand (%)
220 1.55 19.77 80.23 -- 11.84 16.84 225 0.88 -- -- -- -- -- 230 0.92 -- -- -- -- 14.17 235 1.06 -- -- -- -- -- 240 0.90 16.56 83.44 1.92 10.78 10.50 245 1.39 -- -- -- -- -- 250 0.70 -- -- -- -- 8.59 255 0.90 -- -- -- -- -- 260 0.90 15.51 84.49 -- 10.88 13.44 265 0.77 -- -- -- -- -- 270 0.00 -- -- -- -- 14.43 275 0.73 -- -- -- -- -- 280 0.24 9.50 90.50 1.90 8.58 6.22 285 0.23 -- -- -- -- -- 290 -0.59 -- -- -- -- 8.63 295 1.08 -- -- -- -- -- 300 0.54 8.48 91.52 -- 7.96 5.94 305 0.46 -- -- -- -- 310 0.51 -- -- -- -- 7.10 315 0.11 -- -- -- -- -- 320 1.32 11.65 88.35 1.85 7.14 3.32 325 0.47 -- -- -- -- -- 330 0.53 -- -- -- -- 3.25 335 0.80 -- -- -- -- -- 340 -0.22 5.03 94.97 -- 7.18 2.37 345 0.32 -- -- -- -- -- 350 0.17 -- -- -- -- 2.51 355 0.14 -- -- -- -- -- 360 0.51 5.35 94.65 1.80 7.29 4.60 365 0.24 -- -- -- -- 370 -0.14 -- -- -- -- 4.63 375 0.00 -- -- -- -- -- 380 0.00 5.79 94.21 -- 7.10 4.24 385 -2.78 -- -- -- -- -- 390 -3.20 -- -- -- -- 4.47 395 -0.60 -- -- -- -- -- 400 -0.64 5.14 94.86 1.82 6.78 4.45
Note: MS (SI unit) - 10 -8m3kg -1
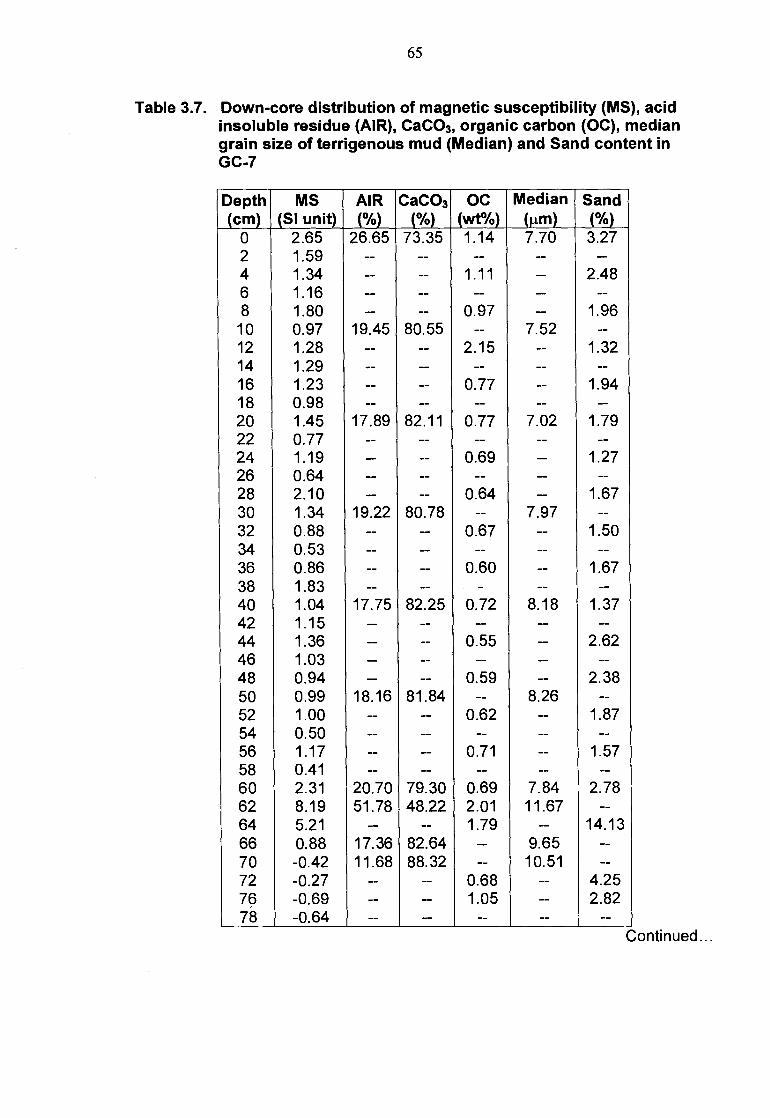
65
Table 3.7. Down-core distribution of magnetic susceptibility (MS), acid insoluble residue (AIR), CaCO3, organic carbon (OC), median grain size of terrigenous mud (Median) and Sand content in GC-7
Depth (cm)
MS (SI unit)
AIR (%)
CaCO3 (%)
OC (wt%)
Median (11m)
Sand (%)
0 2.65 26.65 73.35 1.14 7.70 3.27 2 1.59 -- -- -- -- -- 4 1.34 -- -- 1.11 -- 2.48 6 1.16 -- -- -- -- -- 8 1.80 -- -- 0.97 -- 1.96 10 0.97 19.45 80.55 -- 7.52 -- 12 1.28 -- -- 2.15 -- 1.32 14 1.29 -- -- -- -- -- 16 1.23 -- -- 0.77 -- 1.94 18 0.98 -- -- -- -- -- 20 1.45 17.89 82.11 0.77 7.02 1.79 22 0.77 -- -- -- -- -- 24 1.19 -- -- 0.69 -- 1.27 26 0.64 -- -- -- -- -- 28 2.10 -- -- 0.64 -- 1.67 30 1.34 19.22 80.78 -- 7.97 -- 32 0.88 -- -- 0.67 -- 1.50 34 0.53 -- -- -- -- -- 36 0.86 -- -- 0.60 -- 1.67 38 1.83 -- -- - -- -- 40 1.04 17.75 82.25 0.72 8.18 1.37 42 1.15 -- -- -- -- -- 44 1.36 -- -- 0.55 -- 2.62 46 1.03 -- -- -- -- -- 48 0.94 -- -- 0.59 -- 2.38 50 0.99 18.16 81.84 -- 8.26 -- 52 1.00 -- -- 0.62 -- 1.87 54 0.50 -- -- -- -- -- 56 1.17 -- -- 0.71 -- 1.57 58 0.41 -- -- -- -- -- 60 2.31 20.70 79.30 0.69 7.84 2.78 62 8.19 51.78 48.22 2.01 11.67 -- 64 5.21 -- -- 1.79 -- 14.13 66 0.88 17.36 82.64 -- 9.65 -- 70 -0.42 11.68 88.32 -- 10.51 -- 72 -0.27 -- -- 0.68 -- 4.25 76 -0.69 -- -- 1.05 -- 2.82 78 -0.64 -- -- -- -- --
Continued...
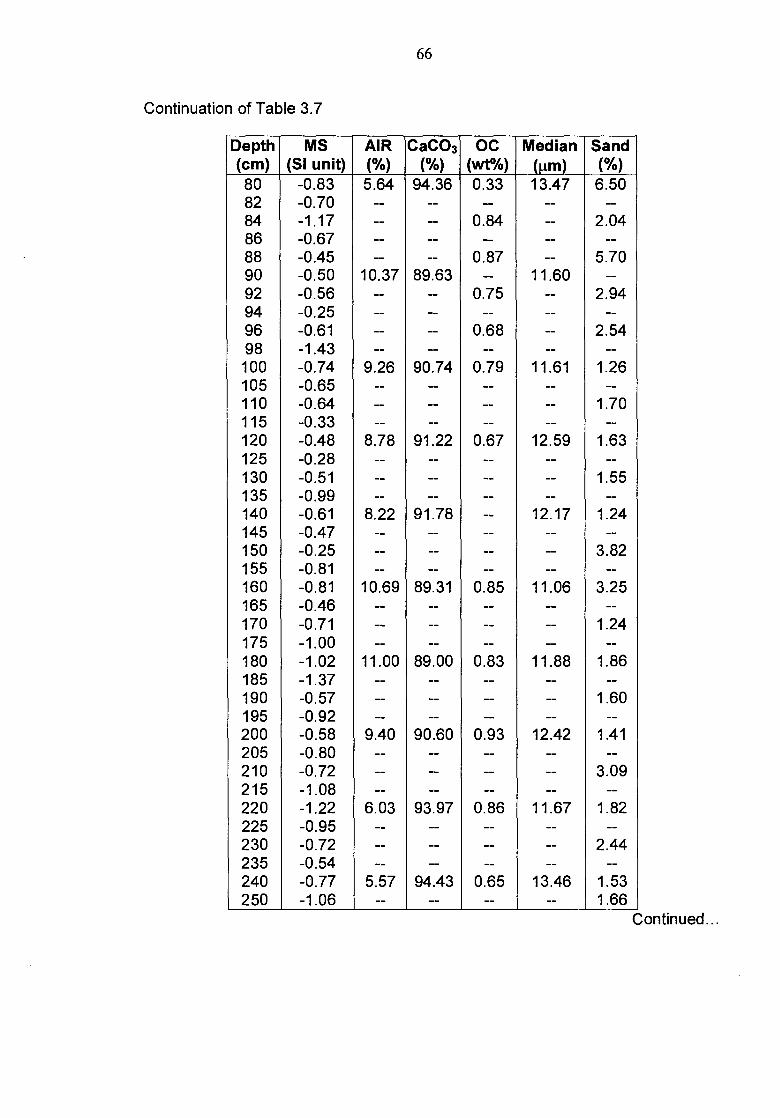
66
Continuation of Table 3.7
Depth (cm)
MS (SI unit)
AIR (%)
CaCO3 (%)
OC (wt%)
Median (p,m)
Sand (%)
80 -0.83 5.64 94.36 0.33 13.47 6.50 82 -0.70 -- -- -- -- -- 84 -1.17 -- -- 0.84 -- 2.04 86 -0.67 -- -- -- -- -- 88 -0.45 -- -- 0.87 -- 5.70 90 -0.50 10.37 89.63 -- 11.60 -- 92 -0.56 -- -- 0.75 -- 2.94 94 -0.25 -- -- -- -- -- 96 -0.61 -- -- 0.68 -- 2.54 98 -1.43 -- -- -- -- -- 100 -0.74 9.26 90.74 0.79 11.61 1.26 105 -0.65 -- -- -- -- -- 110 -0.64 -- -- -- -- 1.70 115 -0.33 -- -- -- -- -- 120 -0.48 8.78 91.22 0.67 12.59 1.63 125 -0.28 -- -- -- -- -- 130 -0.51 -- -- -- -- 1.55 135 -0.99 -- -- -- -- -- 140 -0.61 8.22 91.78 -- 12.17 1.24 145 -0.47 -- -- -- -- -- 150 -0.25 -- -- -- -- 3.82 155 -0.81 -- -- -- -- -- 160 -0.81 10.69 89.31 0.85 11.06 3.25 165 -0.46 -- -- -- -- -- 170 -0.71 -- -- -- -- 1.24 175 -1.00 -- -- -- -- -- 180 -1.02 11.00 89.00 0.83 11.88 1.86 185 -1.37 -- -- -- -- -- 190 -0.57 -- -- -- -- 1.60 195 -0.92 -- -- -- -- -- 200 -0.58 9.40 90.60 0.93 12.42 1.41 205 -0.80 -- -- -- -- -- 210 -0.72 -- -- -- -- 3.09 215 -1.08 -- -- -- -- -- 220 -1.22 6.03 93.97 0.86 11.67 1.82 225 -0.95 -- -- -- -- -- 230 -0.72 -- -- -- -- 2.44 235 -0.54 -- -- -- -- -- 240 -0.77 5.57 94.43 0.65 13.46 1.53 250 -1.06 -- -- -- -- 1.66
Continued...
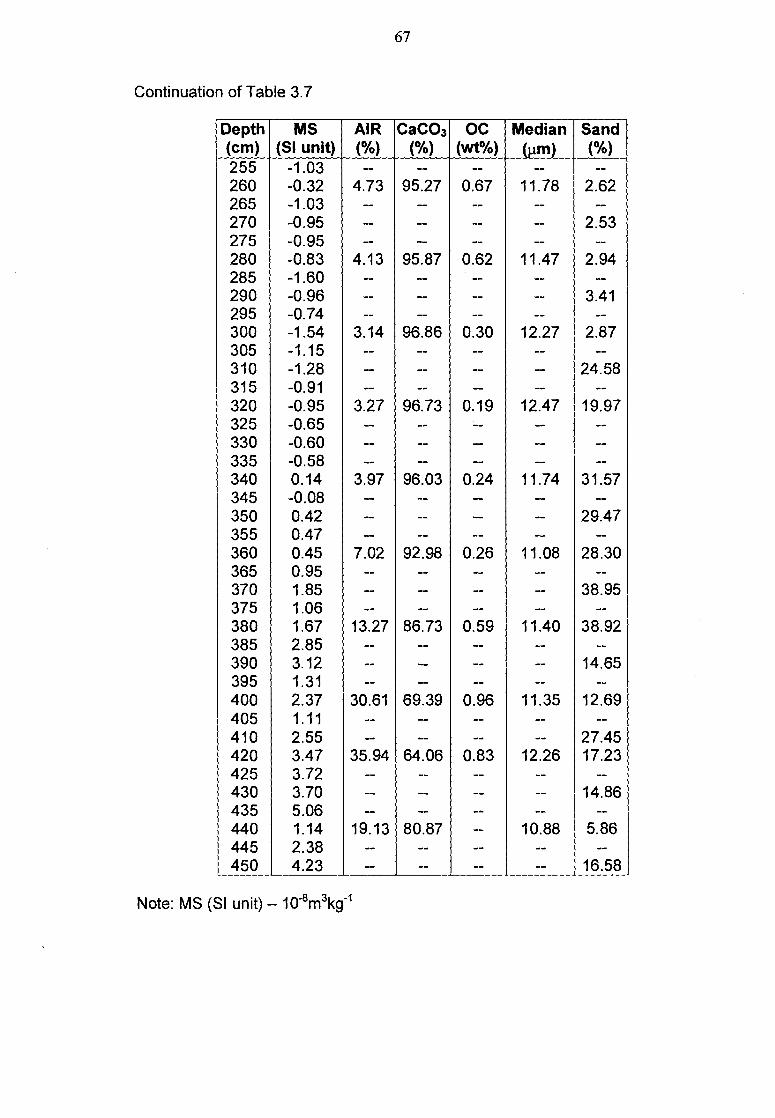
67
Continuation of Table 3.7
Depth (cm)
MS (SI unit)
AIR (%)
CaCO3 (%)
OC (wt%)
Median (pm)
Sand (%)
255 -1.03 -- -- -- -- -- 260 -0.32 4.73 95.27 0.67 11.78 2.62 265 -1.03 -- -- -- -- -- 270 -0.95 -- -- -- -- 2.53 275 -0.95 -- -- -- -- -- 280 -0.83 4.13 95.87 0.62 11.47 2.94 285 -1.60 -- -- -- -- -- 290 -0.96 -- -- -- -- 3.41 295 -0.74 -- -- -- -- -- 300 -1.54 3.14 96.86 0.30 12.27 2.87 305 -1.15 -- -- -- -- -- 310 -1.28 -- -- -- -- 24.58 315 -0.91 -- -- -- -- -- 320 -0.95 3.27 96.73 0.19 12.47 19.97 325 -0.65 -- -- -- -- -- 330 -0.60 -- -- -- -- -- 335 -0.58 -- -- -- -- -- 340 0.14 3.97 96.03 0.24 11.74 31.57 345 -0.08 -- -- -- -- -- 350 0.42 -- -- -- -- 29.47 355 0.47 -- -- -- -- -- 360 0.45 7.02 92.98 0.26 11.08 28.30 365 0.95 -- -- -- -- -- 370 1.85 -- -- -- -- 38.95 375 1.06 -- -- -- -- -- 380 1.67 13.27 86.73 0.59 11.40 38.92 385 2.85 -- -- -- -- -- 390 3.12 -- -- -- -- 14.65 395 1.31 -- -- -- -- -- 400 2.37 30.61 69.39 0.96 11.35 12.69 405 1.11 -- -- -- -- -- 410 2.55 -- -- -- -- 27.45 420 3.47 35.94 64.06 0.83 12.26 17.23 425 3.72 -- -- -- -- -- 430 3.70 -- -- -- -- 14.86 435 5.06 -- -- -- -- -- 440 1.14 19.13 80.87 -- 10.88 5.86 445 2.38 -- -- -- -- -- 450 4.23 -- -- -- -- 16.58
Note: MS (SI unit) - 10 -8m3kg-1

68
Table 3.8. Down-core distribution of magnetic susceptibility (MS) in GC-8
Depth (cm)
MS (SI unit)
0 -0.35 2 -0.43 4 -0.39 6 -0.32 8 -0.27 10 -0.34 12 -0.71 14 -1.96 16 -0.65 18 -0.54 20 -0.47 22 -1.22 24 -0.70 26 -0.71 28 -0.37 30 -0.78 32 -0.81 34 -0.82 36 -0.49 38 -0.52 40 -0.71 42 -0.58 44 -0.60 46 -1.02 48 0.19 50 -0.31 52 -0.49 54 -0.43 56 -0.44 58 -0.73 60 -0.40 62 -0.82 64 -0.51 66 -0.46
Depth (cm)
MS (SI unit)
68 -1.20 70 -0.45 72 -0.67 74 -0.42 76 -0.83 78 -0.82 80 -0.68 82 -0.42 84 -0.55 86 -0.47 88 -0.40 90 -0.64 92 -0.72 94 0.50 96 0.48 98 0.88 100 0.20 105 -0.90 110 0.25 115 0.00 120 0.12 125 -1.35 130 -0.28 135 -0.18 140 -0.51 145 -0.55 150 -0.77 155 -0.96 160 -0.80 165 -1.20 170 -0.30 175 -0.20 180 -0.23 185 -1.11
Depth (cm)
MS (SI unit)
190 -1.11 195 -0.64 200 -0.80 205 -0.86 210 -0.84 215 -0.77 220 -1.00 225 -1.30 230 -0.68 235 -0.50 240 -0.79 245 -0.58 250 -0.61 255 -0.82 260 -0.51 265 -0.68 270 -0.33 275 -0.71 280 -0.64 285 -0.80 290 -0.49 295 -0.54 300 -1.22 305 -0.94 310 -0.55 315 -0.89 320 -0.42 325 -0.36 330 -0.48 335 -0.67 340 -0.98 345 -0.37 350 -0.61 355 -1.20 360 -0.45
Depth (cm)
MS (SI unit)
365 -1.72 370 -2.38 375 -2.22 380 -0.59 385 -0.68 390 -0.97 395 -0.78 400 -0.43 405 -0.57 410 -2.38 415 -1.80 420 -3.06 425 -1.49 430 -0.91 435 -1.21 440 -1.94 445 -0.31 450 -0.44 455 -0.88 460 -0.63 465 -1.29 470 -0.56 475 -0.36 480 -0.56 485 -1.09 490 -1.21 495 -0.69 500 -0.78 505 -0.87 510 -1.20 515 -0.92 520 -0.94 525 -0.58 530 -0.73 540 -1.39
Note: MS (SI unit) - 10 -8m3kg-1
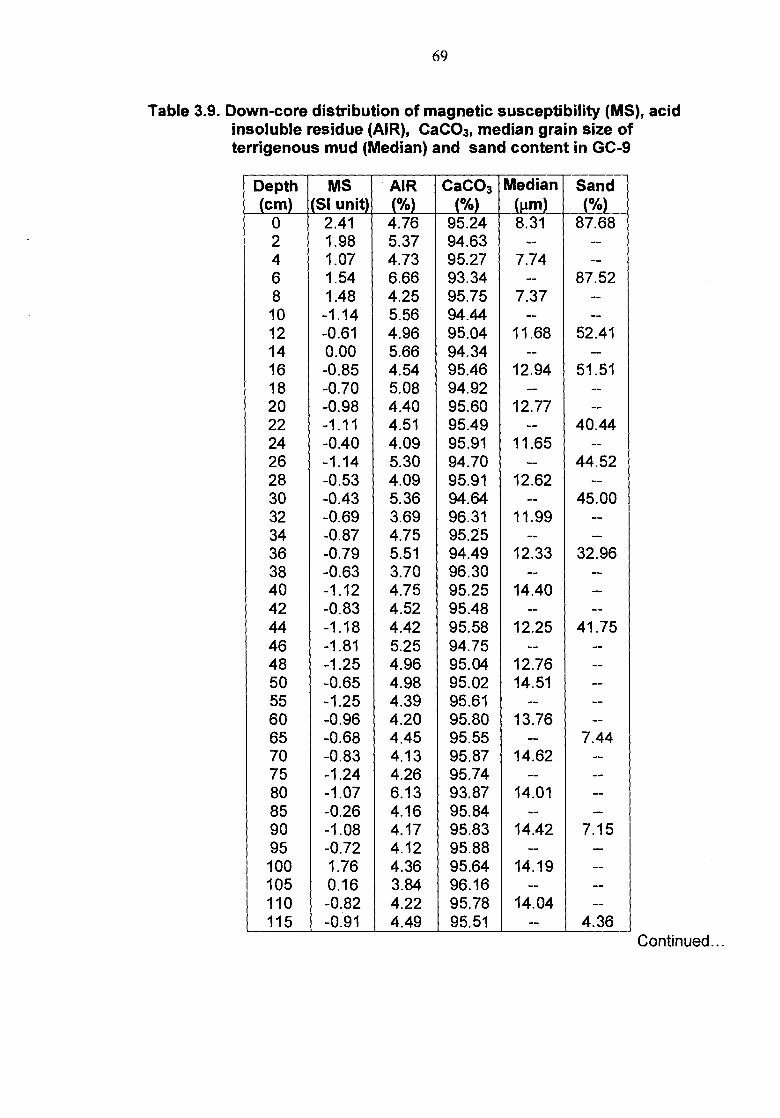
69
Table 3.9. Down-core distribution of magnetic susceptibility (MS), acid insoluble residue (AIR), CaCO3, median grain size of terrigenous mud (Median) and sand content in GC-9
Depth (cm)
MS (SI unit)
AIR (%)
CaCO3 (%)
Median (gm)
Sand (%)
0 2.41 4.76 95.24 8.31 87.68 2 1.98 5.37 94.63 -- -- 4 1.07 4.73 95.27 7.74 -- 6 1.54 6.66 93.34 -- 87.52 8 1.48 4.25 95.75 7.37 -- 10 -1.14 5.56 94.44 -- -- 12 -0.61 4.96 95.04 11.68 52.41 14 0.00 5.66 94.34 -- -- 16 -0.85 4.54 95.46 12.94 51.51 18 -0.70 5.08 94.92 -- -- 20 -0.98 4.40 95.60 12.77 -- 22 -1.11 4.51 95.49 -- 40.44 24 -0.40 4.09 95.91 11.65 -- 26 -1.14 5.30 94.70 -- 44.52 28 -0.53 4.09 95.91 12.62 -- 30 -0.43 5.36 94.64 -- 45.00 32 -0.69 3.69 96.31 11.99 -- 34 -0.87 4.75 95.25 -- -- 36 -0.79 5.51 94.49 12.33 32.96 38 -0.63 3.70 96.30 -- -- 40 -1.12 4.75 95.25 14.40 -- 42 -0.83 4.52 95.48 -- -- 44 -1.18 4.42 95.58 12.25 41.75 46 -1.81 5.25 94.75 -- -- 48 -1.25 4.96 95.04 12.76 -- 50 -0.65 4.98 95.02 14.51 -- 55 -1.25 4.39 95.61 -- -- 60 -0.96 4.20 95.80 13.76 -- 65 -0.68 4.45 95.55 -- 7.44 70 -0.83 4.13 95.87 14.62 -- 75 -1.24 4.26 95.74 -- -- 80 -1.07 6.13 93.87 14.01 -- 85 -0.26 4.16 95.84 -- -- 90 -1.08 4.17 95.83 14.42 7.15 95 -0.72 4.12 95.88 -- -- 100 1.76 4.36 95.64 14.19 -- 105 0.16 3.84 96.16 -- -- 110 -0.82 4.22 95.78 14.04 -- 115 -0.91 4.49 95.51 -- 4.36
Continued...
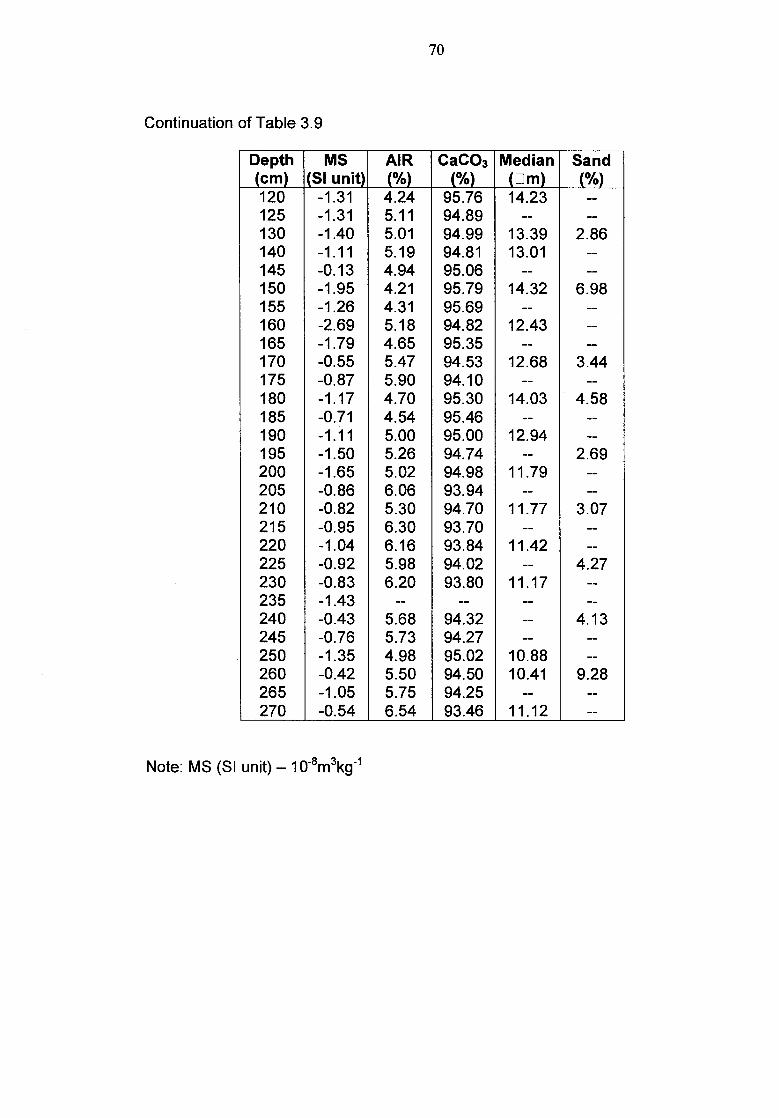
70
Continuation of Table 3.9
Depth (cm)
MS (SI unit)
AIR (%)
CaCO3 (%)
Median ( ❑ m)
Sand (%)
120 -1.31 4.24 95.76 14.23 -- 125 -1.31 5.11 94.89 -- -- 130 -1.40 5.01 94.99 13.39 2.86 140 -1.11 5.19 94.81 13.01 -- 145 -0.13 4.94 95.06 -- -- 150 -1.95 4.21 95.79 14.32 6.98 155 -1.26 4.31 95.69 -- -- 160 -2.69 5.18 94.82 12.43 -- 165 -1.79 4.65 95.35 -- -- 170 -0.55 5.47 94.53 12.68 3.44 175 -0.87 5.90 94.10 -- -- 180 -1.17 4.70 95.30 14.03 4.58 185 -0.71 4.54 95.46 -- -- 190 -1.11 5.00 95.00 12.94 -- 195 -1.50 5.26 94.74 -- 2.69 200 -1.65 5.02 94.98 11.79 -- 205 -0.86 6.06 93.94 -- -- 210 -0.82 5.30 94.70 11.77 3.07 215 -0.95 6.30 93.70 -- -- 220 -1.04 6.16 93.84 11.42 -- 225 -0.92 5.98 94.02 -- 4.27 230 -0.83 6.20 93.80 11.17 -- 235 -1.43 -- -- -- 240 -0.43 5.68 94.32 -- 4.13 245 -0.76 5.73 94.27 -- -- 250 -1.35 4.98 95.02 10.88 -- 260 -0.42 5.50 94.50 10.41 9.28 265 -1.05 5.75 94.25 -- -- 270 -0.54 6.54 93.46 11.12 --
Note: MS (SI unit) - 10 -8m3kg-1

71
Table 3.10. Down-core distribution of magnetic susceptibility (MS) in GC-10.
Depth (cm)
MS (SI unit)
13 4.01 15 3.56 17 3.58 19 1.75 21 1.60 23 2.40 25 1.93 27 1.47 29 2.23 31 1.09 33 1.48 35 1.24 37 0.78 39 0.94 41 1.29 43 1.00 45 0.79 47 0.88 49 0.71 51 1.24 53 1.02 55 0.46 57 0.69 59 1.04 61 0.96 63 1.52 65 1.34 67 1.25 69 1.70 71 1.69 73 1.29 75 1.88 77 2.08 79 2.36 81 1.35 83 1.54 85 1.31 87 1.38 89 1.04
Depth (cm)
MS (SI unit)
91 1.71 93 1.63 95 1.03 97 1.77 99 1.67 101 2.46 103 0.73 105 1.71 107 0.74 109 1.02 111 1.16 113 2.14 115 1.70 117 1.19 119 1.63 121 1.11 123 2.65 125 1.87 127 1.62 129 0.94 131 1.09 133 1.70 135 1.23 137 1.81 139 1.50 141 1.73 143 1.23 145 0.67 147 0.97 149 1.61 151 1.89 153 0.78 155 1.66 157 0.54 159 1.91 160 0.57 162 0.80 163 1.41 165 0.98
Depth (cm)
MS (SI unit)
167 1.70 169 0.84 171 1.50 173 1.39 175 1.40 177 0.93 179 0.98 181 1.46 183 0.89 185 1.36 187 2.11 189 1.42 191 1.51 193 1.68 195 1.56 197 1.37 199 1.58 201 1.14 203 1.17 205 0.50 207 0.58 209 0.91 211 1.15 213 0.73 215 0.91 217 0.35 219 1.26 221 1.00 223 1.21 225 0.91 227 1.72 229 1.11 231 0.78 233 0.82 235 0.62 237 0.80 239 1.07 241 0.65 243 1.04
Depth (cm)
MS (SI unit)
245 1.14 247 1.56 249 0.98 251 1.05 253 1.33 255 0.85 257 1.14 259 0.77 261 1.23 263 1.05 265 0.75 267 1.13 269 1.83 271 1.51 273 1.53 275 1.49 277 1.41 279 1.75 281 1.56 283 0.77 285 1.37 287 1.04 289 1.30 291 1.46 293 1.53 295 1.58 297 1.43 299 1.69 301 1.43 303 1.69 305 1.58 307 1.13 309 1.49 311 1.63 313 1.97 315 1.46 317 1.51 319 1.71 321 1.86
Continued...
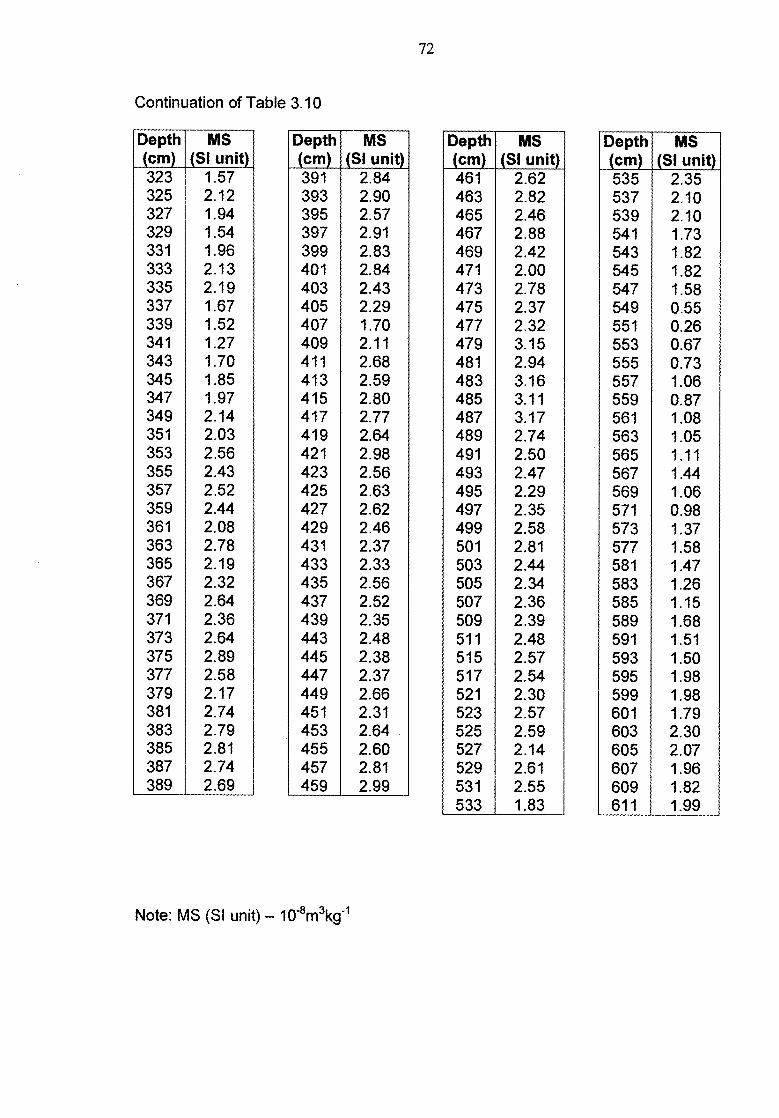
Continuation of Table 3.10
72
Depth (cm)
MS (SI unit)
323 1.57 325 2.12 327 1.94 329 1.54 331 1.96 333 2.13 335 2.19 337 1.67 339 1.52 341 1.27 343 1.70 345 1.85 347 1.97 349 2.14 351 2.03 353 2.56 355 2.43 357 2.52 359 2.44 361 2.08 363 2.78 365 2.19 367 2.32 369 2.64 371 2.36 373 2.64 375 2.89 377 2.58 379 2.17 381 2.74 383 2.79 385 2.81 387 2.74 389 2.69
Depth (cm)
MS (SI unit)
391 2.84 393 2.90 395 2.57 397 2.91 399 2.83 401 2.84 403 2.43 405 2.29 407 1.70 409 2.11 411 2.68 413 2.59 415 2.80 417 2.77 419 2.64 421 2.98 423 2.56 425 2.63 427 2.62 429 2.46 431 2.37 433 2.33 435 2.56 437 2.52 439 2.35 443 2.48 445 2.38 447 2.37 449 2.66 451 2.31 453 2.64 455 2.60 457 2.81 459 2.99
Depth (cm)
MS (SI unit)
461 2.62 463 2.82 465 2.46 467 2.88 469 2.42 471 2.00 473 2.78 475 2.37 477 2.32 479 3.15 481 2.94 483 3.16 485 3.11 487 3.17 489 2.74 491 2.50 493 2.47 495 2.29 497 2.35 499 2.58 501 2.81 503 2.44 505 2.34 507 2.36 509 2.39 511 2.48 515 2.57 517 2.54 521 2.30 523 2.57 525 2.59 527 2.14 529 2.61 531 2.55 533 1.83
Depth (cm)
MS (SI unit)
535 2.35 537 2.10 539 2.10 541 1.73 543 1.82 545 1.82 547 1.58 549 0.55 551 0.26 553 0.67 555 0.73 557 1.06 559 0.87 561 1.08 563 1.05 565 1.11 567 1.44 569 1.06 571 0.98 573 1.37 577 1.58 581 1.47 583 1.26 585 1.15 589 1.68 591 1.51 593 1.50 595 1.98 599 1.98 601 1.79 603 2.30 605 2.07 607 1.96 609 1.82 611 1.99
Note: MS (SI unit) - 10 -8m3kg-1

73
Table 3.11. Down-core distribution of magnetic susceptibility (MS) in GC-11.
Depth (cm)
MS (SI unit)
1 316.31 3 307.46 5 267.36 7 289.89 9 316.65
11 304.46 13 305.48 15 329.00 17 353.39 19 367.11 21 362.07 23 375.20 25 394.87 27 373.82 29 370.22 31 329.10 33 329.21 35 328.56 37 328.57 39 280.95 41 304.01 43 333.43 45 344.82 47 301.31 49 289.04 51 260.48 53 275.24 55 262.45 57 270.47 59 273.90 61 286.87 63 353.70 65 412.99 67 327.91 69 302.51 71 373.16 73 441.96 75 385.71 77 393.82 79 395.90
Depth (cm)
MS (SI unit)
81 377.40 83 348.20 85 318.79 87 327.41 89 357.84 91 351.04 93 411.56 95 449.74 97 404.15 99 402.01 102 365.08 107 367.24 112 364.29 117 376.30 122 384.74 127 389.46 132 407.76 137 464.52 142 374.51 147 401.11 152 504.95 157 403.52 162 404.76 167 409.15 172 359.28 177 381.81 182 372.18 187 417.04 192 415.15 197 405.37 202 408.41 207 399.82 212 398.23 217 376.34 222 454.97 227 359.72 232 405.85 237 452.40 242 415.76 247 396.60
Depth (cm)
MS (SI unit)
252 311.43 257 387.06 262 446.42 267 399.14 272 422.00 277 420.19 282 427.02 287 460.10 292 393.99 297 394.90 302 405.93 307 360.05 312 427.96 317 451.55 322 433.72 327 430.45 332 313.78 337 353.42 342 411.13 347 440.77 352 421.27 357 411.85 362 451.35 367 415.47 372 421.91 377 442.06 382 438.41 387 450.49 392 427.01 397 431.96 407 496.46 412 395.00 417 400.34 422 401.37 427 414.24 432 407.92 437 420.88 442 428.83 447 421.40 453 434.66
Note: MS (SI unit) - 10 -8m3kg-1
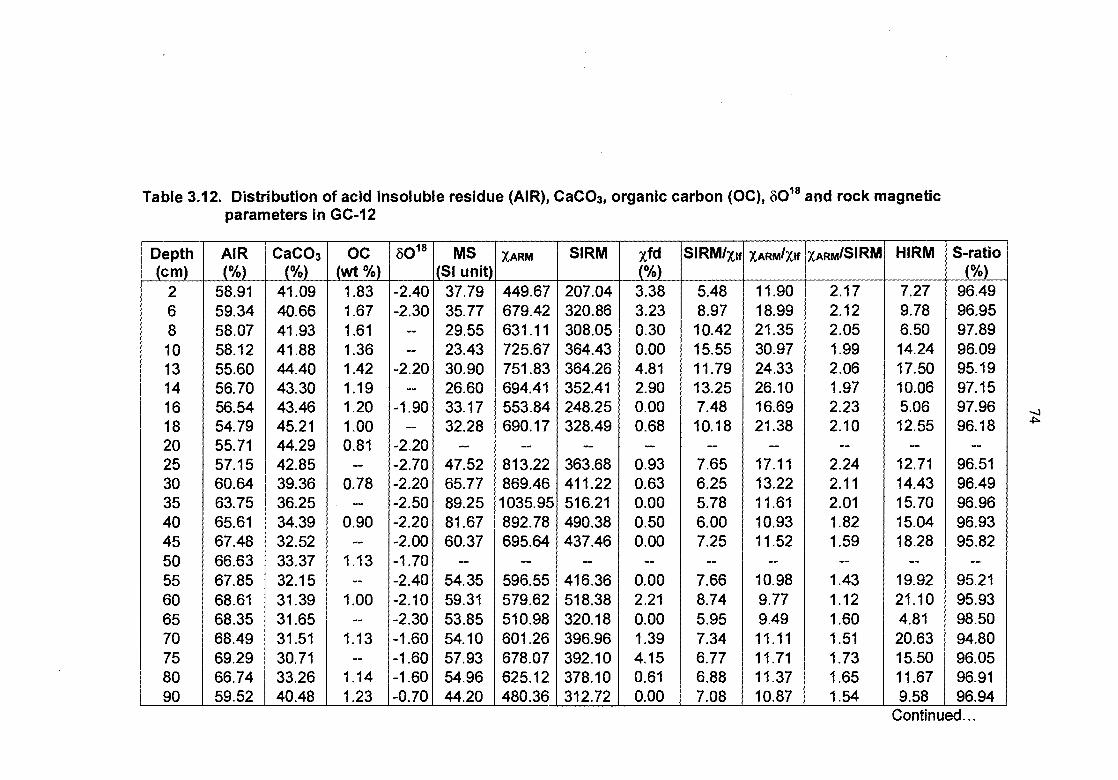
Table 3.12. Distribution of acid insoluble residue (AIR), CaCO3, organic carbon (OC), 60 18 and rock magnetic parameters in GC-12
Depth (cm)
AIR (%)
CaCO3 (%)
OC (wt %)
8018 MS (SI unit)
XARM SIRM xfd (%)
SIRM/xif XARNI/Xlf XARM/SIRM HIRM S-ratio (%)
2 58.91 41.09 1.83 -2.40 37.79 449.67 207.04 3.38 5.48 11.90 2.17 7.27 96.49 6 59.34 40.66 1.67 -2.30 35.77 679.42 320.86 3.23 8.97 18.99 2.12 9.78 96.95 8 58.07 41.93 1.61 -- 29.55 631.11 308.05 0.30 10.42 21.35 2.05 6.50 97.89 10 58.12 41.88 1.36 -- 23.43 725.67 364.43 0.00 15.55 30.97 1.99 14.24 96.09 13 55.60 44.40 1.42 -2.20 30.90 751.83 364.26 4.81 11.79 24.33 2.06 17.50 95.19 14 56.70 43.30 1.19 -- 26.60 694.41 352.41 2.90 13.25 26.10 1.97 10.06 97.15 16 56.54 43.46 1.20 -1.90 33.17 553.84 248.25 0.00 7.48 16.69 2.23 5.06 97.96 18 54.79 45.21 1.00 -- 32.28 690.17 328.49 0.68 10.18 21.38 2.10 12.55 96.18 20 55.71 44.29 0.81 -2.20 -- -- -- -- -- -- -- -- -- 25 57.15 42.85 -- -2.70 47.52 813.22 363.68 0.93 7.65 17.11 2.24 12.71 96.51 30 60.64 39.36 0.78 -2.20 65.77 869.46 411.22 0.63 6.25 13.22 2.11 14.43 96.49 35 63.75 36.25 -- -2.50 89.25 1035.95 516.21 0.00 5.78 11.61 2.01 15.70 96.96 40 65.61 34.39 0.90 -2.20 81.67 892.78 490.38 0.50 6.00 10.93 1.82 15.04 96.93 45 67.48 32.52 -- -2.00 60.37 695.64 437.46 0.00 7.25 11.52 1.59 18.28 95.82 50 66.63 33.37 1.13 -1.70 -- -- -- -- -- -- -- -- -- 55 67.85 32.15 -- -2.40 54.35 596.55 416.36 0.00 7.66 10.98 1.43 19.92 95.21 60 68.61 31.39 1.00 -2.10 59.31 579.62 518.38 2.21 8.74 9.77 1.12 21.10 95.93 65 68.35 31.65 -- -2.30 53.85 510.98 320.18 0.00 5.95 9.49 1.60 4.81 98.50 70 68.49 31.51 1.13 -1.60 54.10 601.26 396.96 1.39 7.34 11.11 1.51 20.63 94.80 75 69.29 30.71 -- -1.60 57.93 678.07 392.10 4.15 6.77 11.71 1.73 15.50 96.05 80 66.74 33.26 1.14 -1.60 54.96 625.12 378.10 0.61 6.88 11.37 1.65 11.67 96.91 90 59.52 40.48 1.23 -0.70 44.20 480.36 312.72 0.00 7.08 10.87 1.54 9.58 96.94
Continued...

Continuation of Table 3.12
Depth (cm)
AIR (%)
CaCO3 (%)
OC (wt %)
6018 MS (SI unit)
XARM SIRM xfd (%)
SIRM/xif xARmiXif XARM/SIRM HIRM S-ratio (%)
95 54.99 45.01 -- -0.50 40.17 464.04 302.70 2.43 7.54 11.55 1.53 6.61 97.82 100 55.35 44.65 1.02 -1.20 37.41 401.99 301.41 3.72 8.06 10.75 1.33 10.01 96.68 110 60.42 39.58 -- -0.80 36.95 481.32 362.64 0.00 9.82 13.03 1.33 23.42 93.54 120 62.45 37.55 1.76 -1.30 35.33 486.60 338.30 2.44 9.58 13.77 1.44 11.56 96.58 130 64.44 35.56 -- -1.10 33.55 480.77 337.60 0.25 10.06 14.33 1.42 16.42 95.14 140 62.98 37.02 2.19 -0.70 29.69 449.76 312.15 0.00 10.51 15.15 1.44 11.93 96.18 150 65.54 34.46 -- -0.10 32.09 375.57 300.75 3.62 9.37 11.70 1.25 13.55 95.50 160 64.39 35.61 2.35 -0.50 -- -- -- -- -- -- -- -- -- 170 63.60 36.40 -- -0.70 23.74 78.00 150.71 4.63 6.35 3.29 0.52 11.18 92.58 180 64.32 35.68 2.40 -0.30 19.95 49.44 103.67 0.00 5.20 2.48 0.48 10.56 89.81 190 -- -- -- -- 20.20 49.37 94.99 1.36 4.70 2.44 0.52 85.43 10.07 200 76.18 23.82 1.80 -0.20 20.64 48.51 99.57 0.70 4.82 2.35 0.49 25.83 74.06 210 -- -- -- -- 19.57 46.94 92.48 1.43 4.73 2.40 0.51 4.00 95.68 220 -- -- -- -- 21.06 50.12 94.94 16.57 4.51 2.38 0.53 10.86 88.57 230 -- -- -- -- 20.03 46.54 88.91 3.88 4.44 2.32 0.52 -5.66 106.36 240 76.76 23.24 2.09 -0.70 18.91 50.71 99.55 0.88 5.26 2.68 0.51 17.13 82.79 250 -- -- -- -- 19.68 50.22 108.09 6.79 5.49 2.55 0.46 8.94 91.73 260 -- -- -- -- 19.51 48.13 119.69 0.83 6.13 2.47 0.40 26.60 77.78 270 -- -- -- -- 21.67 59.37 142.05 12.86 6.56 2.74 0.42 9.52 93.30 280 75.51 24.49 1.53 -- 22.21 68.70 154.87 15.33 6.97 3.09 0.44 8.56 94.48 290 -- -- -- -- 22.25 69.12 160.54 5.53 7.22 3.11 0.43 9.83 93.88 300 -- -- -- -- 20.24 60.38 140.30 0.00 6.93 2.98 0.43 8.10 94.23
Continued...
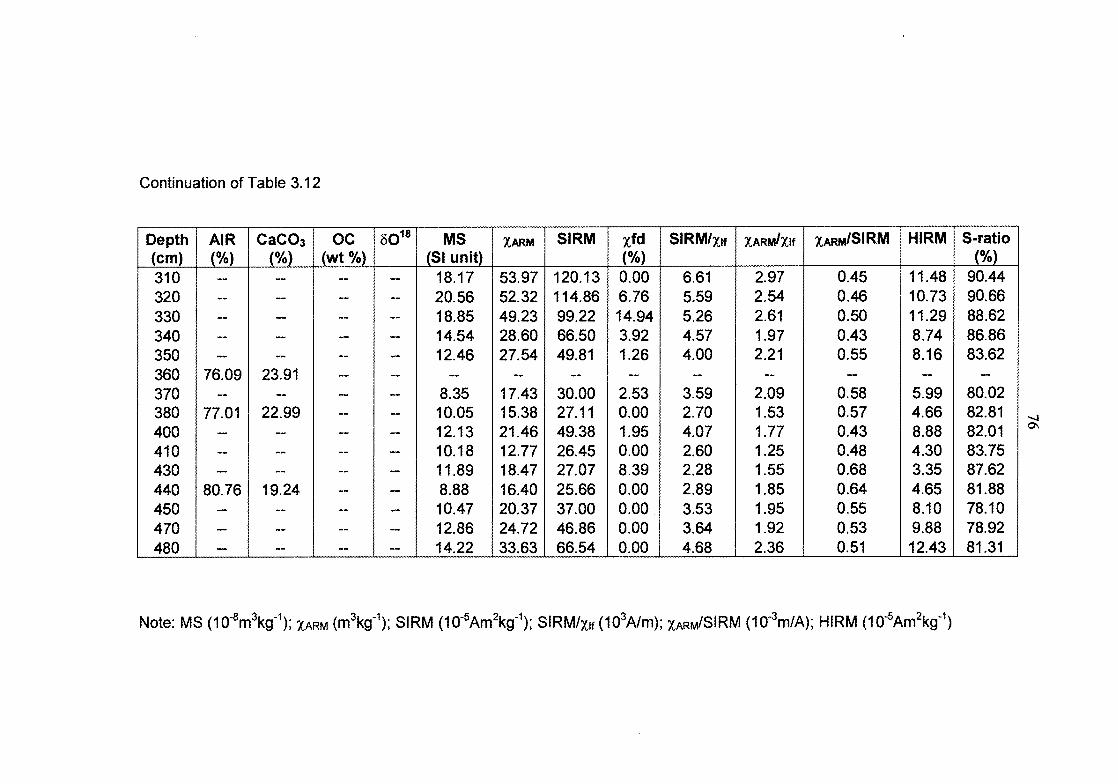
Continuation of Table 3.12
Depth (cm)
AIR (%)
CaCO3 (%)
OC (wt %)
8018 MS (SI unit)
XARM SIRM xfd (%)
SIRM/xif xARmiXif Lemm/SIRM HIRM S-ratio (%)
310 -- -- -- -- 18.17 53.97 120.13 0.00 6.61 2.97 0.45 11.48 90.44 320 -- -- -- -- 20.56 52.32 114.86 6.76 5.59 2.54 0.46 10.73 90.66 330 -- -- -- -- 18.85 49.23 99.22 14.94 5.26 2.61 0.50 11.29 88.62 340 -- -- -- -- 14.54 28.60 66.50 3.92 4.57 1.97 0.43 8.74 86.86 350 -- -- -- -- 12.46 27.54 49.81 1.26 4.00 2.21 0.55 8.16 83.62 360 76.09 23.91 -- -- -- -- -- -- -- -- -- -- -- 370 -- -- -- -- 8.35 17.43 30.00 2.53 3.59 2.09 0.58 5.99 80.02 380 77.01 22.99 -- -- 10.05 15.38 27.11 0.00 2.70 1.53 0.57 4.66 82.81 400 -- -- -- -- 12.13 21.46 49.38 1.95 4.07 1.77 0.43 8.88 82.01 410 -- -- -- -- 10.18 12.77 26.45 0.00 2.60 1.25 0.48 4.30 83.75 430 -- -- -- -- 11.89 18.47 27.07 8.39 2.28 1.55 0.68 3.35 87.62 440 80.76 19.24 -- -- 8.88 16.40 25.66 0.00 2.89 1.85 0.64 4.65 81.88 450 -- -- -- -- 10.47 20.37 37.00 0.00 3.53 1.95 0.55 8.10 78.10 470 -- -- -- -- 12.86 24.72 46.86 0.00 3.64 1.92 0.53 9.88 78.92 480 -- -- -- -- 14.22 33.63 66.54 0.00 4.68 2.36 0.51 12.43 81.31
Note: MS (10-8m3kg-1 ); Vow (m3kg-1 ); SIRM (10-5Am2kg-1 ); SIRM/x0 (10 Alm); xARm/SIRM (10-3m/A); HIRM (10-5Am2ke)
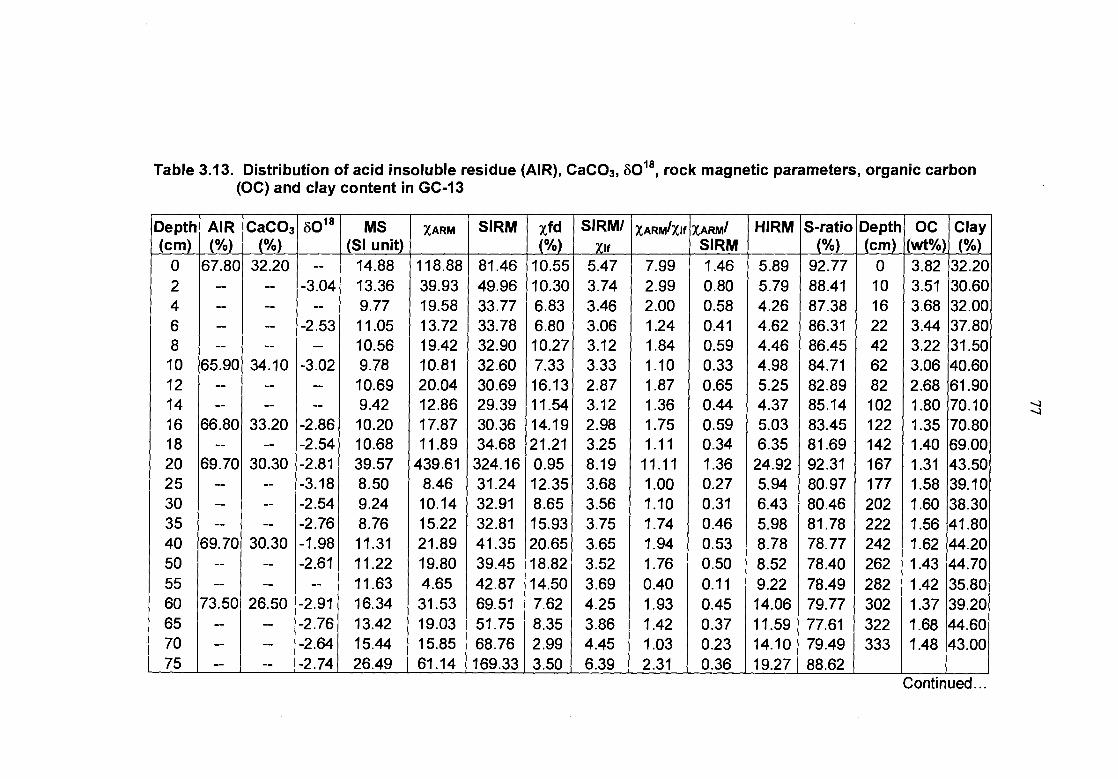
Table 3.13. Distribution of acid insoluble residue (AIR), CaCO3, 60 18, rock magnetic parameters, organic carbon (OC) and clay content in GC-13
Depth (cm)
AIR (%)
CaCO3 (%)
8018 MS (SI unit)
XARm SIRM xfd (%)
SIRM/ xit
xARROXif XARmi SIRM
HIRM S-ratio (%)
Depth (cm)
OC (wt%)
Clay (%)
0 67.80 32.20 -- 14.88 118.88 81.46 10.55 5.47 7.99 1.46 5.89 92.77 0 3.82 32.20 2 -- -- -3.04 13.36 39.93 49.96 10.30 3.74 2.99 0.80 5.79 88.41 10 3.51 30.60 4 -- -- -- 9.77 19.58 33.77 6.83 3.46 2.00 0.58 4.26 87.38 16 3.68 32.00 6 -- -- -2.53 11.05 13.72 33.78 6.80 3.06 1.24 0.41 4.62 86.31 22 3.44 37.80 8 -- -- -- 10.56 19.42 32.90 10.27 3.12 1.84 0.59 4.46 86.45 42 3.22 31.50
10 65.90 34.10 -3.02 9.78 10.81 32.60 7.33 3.33 1.10 0.33 4.98 84.71 62 3.06 40.60 12 -- -- -- 10.69 20.04 30.69 16.13 2.87 1.87 0.65 5.25 82.89 82 2.68 61.90 14 -- -- -- 9.42 12.86 29.39 11.54 3.12 1.36 0.44 4.37 85.14 102 1.80 70.10 16 66.80 33.20 -2.86 10.20 17.87 30.36 14.19 2.98 1.75 0.59 5.03 83.45 122 1.35 70.80 18 -- -- -2.54 10.68 11.89 34.68 21.21 3.25 1.11 0.34 6.35 81.69 142 1.40 69.00 20 69.70 30.30 -2.81 39.57 439.61 324.16 0.95 8.19 11.11 1.36 24.92 92.31 167 1.31 43.50 25 -- -- -3.18 8.50 8.46 31.24 12.35 3.68 1.00 0.27 5.94 80.97 177 1.58 39.10 30 -- -- -2.54 9.24 10.14 32.91 8.65 3.56 1.10 0.31 6.43 80.46 202 1.60 38.30 35 -- -- -2.76 8.76 15.22 32.81 15.93 3.75 1.74 0.46 5.98 81.78 222 1.56 41.80 40 69.70 30.30 -1.98 11.31 21.89 41.35 20.65 3.65 1.94 0.53 8.78 78.77 242 1.62 44.20 50 -- -- -2.61 11.22 19.80 39.45 18.82 3.52 1.76 0.50 8.52 78.40 262 1.43 44.70 55 -- -- -- 11.63 4.65 42.87 14.50 3.69 0.40 0.11 9.22 78.49 282 1.42 35.80 60 73.50 26.50 -2.91 16.34 31.53 69.51 7.62 4.25 1.93 0.45 14.06 79.77 302 1.37 39.20 65 -- -- -2.76 13.42 19.03 51.75 8.35 3.86 1.42 0.37 11.59 77.61 322 1.68 44.60 70 -- -- -2.64 15.44 15.85 68.76 2.99 4.45 1.03 0.23 14.10 79.49 333 1.48 43.00 75 -- -- -2.74 26.49 61.14 169.33 3.50 6.39 2.31 0.36 19.27 88.62
Continued...
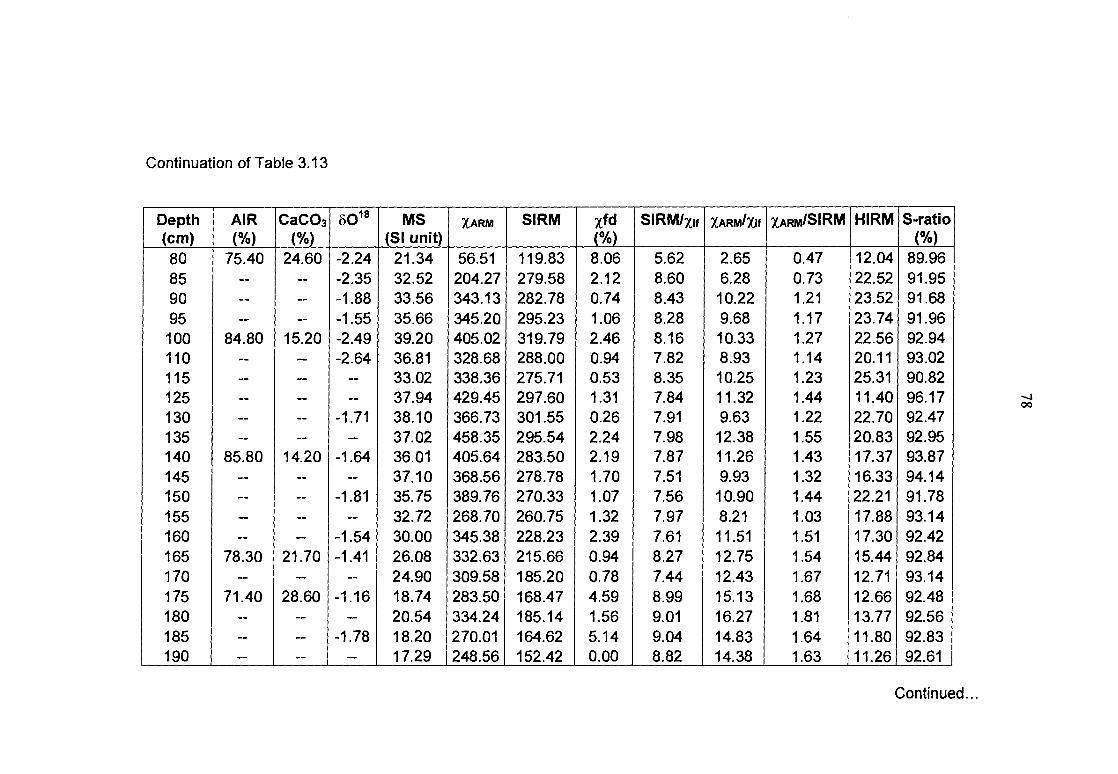
Continuation of Table 3.13
Depth (cm)
AIR (%)
CaCO3 (%)
o018 MS (SI unit)
XARM SIRM xfd (%)
SIRM/xit xARm/Xif XARm/SIRM HIRM S-ratio (%)
80 75.40 24.60 -2.24 21.34 56.51 119.83 8.06 5.62 2.65 0.47 12.04 89.96 85 -- -- -2.35 32.52 204.27 279.58 2.12 8.60 6.28 0.73 22.52 91.95 90 -- -- -1.88 33.56 343.13 282.78 0.74 8.43 10.22 1.21 23.52 91.68 95 -- -- -1.55 35.66 345.20 295.23 1.06 8.28 9.68 1.17 23.74 91.96 100 84.80 15.20 -2.49 39.20 405.02 319.79 2.46 8.16 10.33 1.27 22.56 92.94 110 -- -- -2.64 36.81 328.68 288.00 0.94 7.82 8.93 1.14 20.11 93.02 115 -- -- -- 33.02 338.36 275.71 0.53 8.35 10.25 1.23 25.31 90.82 125 -- -- -- 37.94 429.45 297.60 1.31 7.84 11.32 1.44 11.40 96.17 130 -- -- -1.71 38.10 366.73 301.55 0.26 7.91 9.63 1.22 22.70 92.47 135 -- -- -- 37.02 458.35 295.54 2.24 7.98 12.38 1.55 20.83 92.95 140 85.80 14.20 -1.64 36.01 405.64 283.50 2.19 7.87 11.26 1.43 17.37 93.87 145 -- -- -- 37.10 368.56 278.78 1.70 7.51 9.93 1.32 16.33 94.14 150 -- -- -1.81 35.75 389.76 270.33 1.07 7.56 10.90 1.44 22.21 91.78 155 -- -- -- 32.72 268.70 260.75 1.32 7.97 8.21 1.03 17.88 93.14 160 -- -- -1.54 30.00 345.38 228.23 2.39 7.61 11.51 1.51 17.30 92.42 165 78.30 21.70 -1.41 26.08 332.63 215.66 0.94 8.27 12.75 1.54 15.44 92.84 170 -- -- -- 24.90 309.58 185.20 0.78 7.44 12.43 1.67 12.71 93.14 175 71.40 28.60 -1.16 18.74 283.50 168.47 4.59 8.99 15.13 1.68 12.66 92.48 180 -- -- -- 20.54 334.24 185.14 1.56 9.01 16.27 1.81 13.77 92.56 185 -- -- -1.78 18.20 270.01 164.62 5.14 9.04 14.83 1.64 11.80 92.83 190 -- -- 17.29 248.56 152.42 0.00 8.82 14.38 1.63 11.26 92.61
Continued...
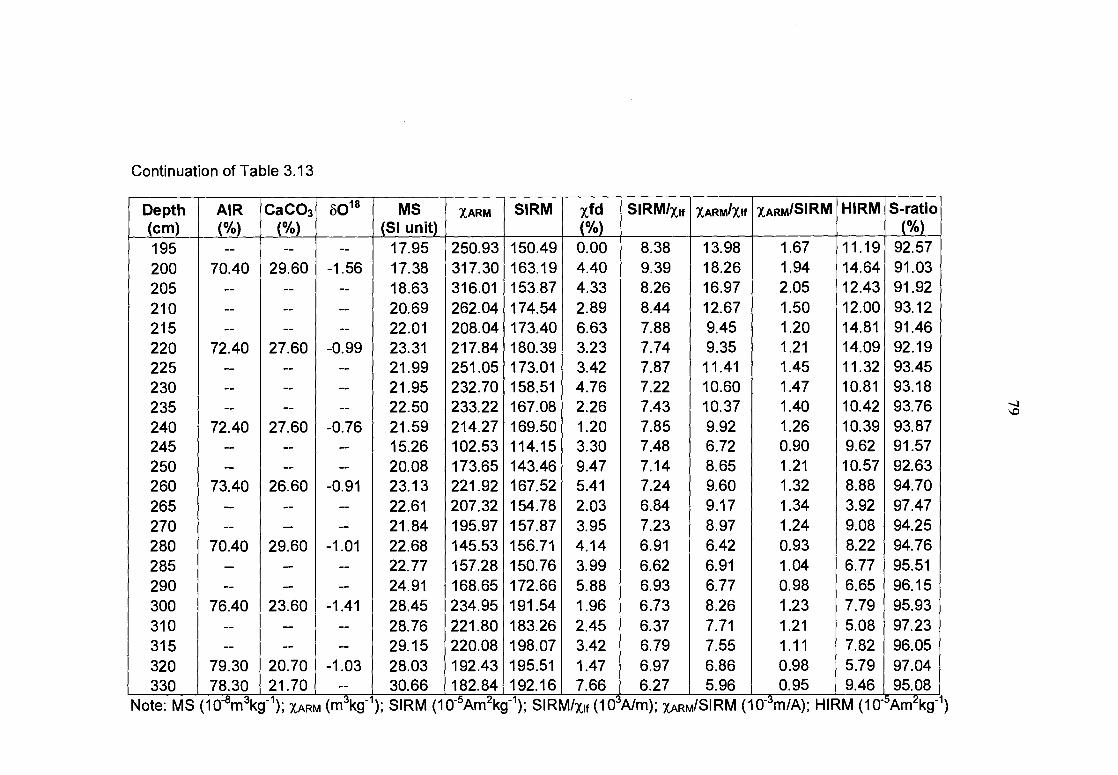
Continuation of Table 3.13
Depth (cm)
AIR (%)
CaCO3 (%)
8018 MS (SI unit)
XARM SIRM xfd (%)
SI RM/Xlf XARM/Xlf XARM/SIRM HIRM S-ratio (%)
195 -- -- -- 17.95 250.93 150.49 0.00 8.38 13.98 1.67 11.19 92.57 200 70.40 29.60 -1.56 17.38 317.30 163.19 4.40 9.39 18.26 1.94 14.64 91.03 205 -- -- -- 18.63 316.01 153.87 4.33 8.26 16.97 2.05 12.43 91.92 210 -- -- -- 20.69 262.04 174.54 2.89 8.44 12.67 1.50 12.00 93.12 215 -- -- -- 22.01 208.04 173.40 6.63 7.88 9.45 1.20 14.81 91.46 220 72.40 27.60 -0.99 23.31 217.84 180.39 3.23 7.74 9.35 1.21 14.09 92.19 225 -- -- -- 21.99 251.05 173.01 3.42 7.87 11.41 1.45 11.32 93.45 230 -- -- -- 21.95 232.70 158.51 4.76 7.22 10.60 1.47 10.81 93.18 235 -- -- -- 22.50 233.22 167.08 2.26 7.43 10.37 1.40 10.42 93.76 240 72.40 27.60 -0.76 21.59 214.27 169.50 1.20 7.85 9.92 1.26 10.39 93.87 245 -- -- -- 15.26 102.53 114.15 3.30 7.48 6.72 0.90 9.62 91.57 250 -- -- -- 20.08 173.65 143.46 9.47 7.14 8.65 1.21 10.57 92.63 260 73.40 26.60 -0.91 23.13 221.92 167.52 5.41 7.24 9.60 1.32 8.88 94.70 265 -- -- -- 22.61 207.32 154.78 2.03 6.84 9.17 1.34 3.92 97.47 270 -- -- -- 21.84 195.97 157.87 3.95 7.23 8.97 1.24 9.08 94.25 280 70.40 29.60 -1.01 22.68 145.53 156.71 4.14 6.91 6.42 0.93 8.22 94.76 285 -- -- -- 22.77 157.28 150.76 3.99 6.62 6.91 1.04 6.77 95.51 290 -- -- -- 24.91 168.65 172.66 5.88 6.93 6.77 0.98 6.65 96.15 300 76.40 23.60 -1.41 28.45 234.95 191.54 1.96 6.73 8.26 1.23 7.79 95.93 310 -- -- -- 28.76 221.80 183.26 2.45 6.37 7.71 1.21 5.08 97.23 315 -- -- -- 29.15 220.08 198.07 3.42 6.79 7.55 1.11 7.82 96.05 320 79.30 20.70 -1.03 28.03 192.43 195.51 1.47 6.97 6.86 0.98 5.79 97.04 330 78.30 21.70 -- 30.66 182.84 192.16 7.66 6.27 5.96 0.95 9.46 95.08
Note: MS (10 m 3kg-1 ); XARM m3kg-1 ); SIRM (10-5Am2kg-1 ); SIRM/xif (103A/m); xARm/SIRM (10-3m/A); HIRM (10-5Am kg-1)
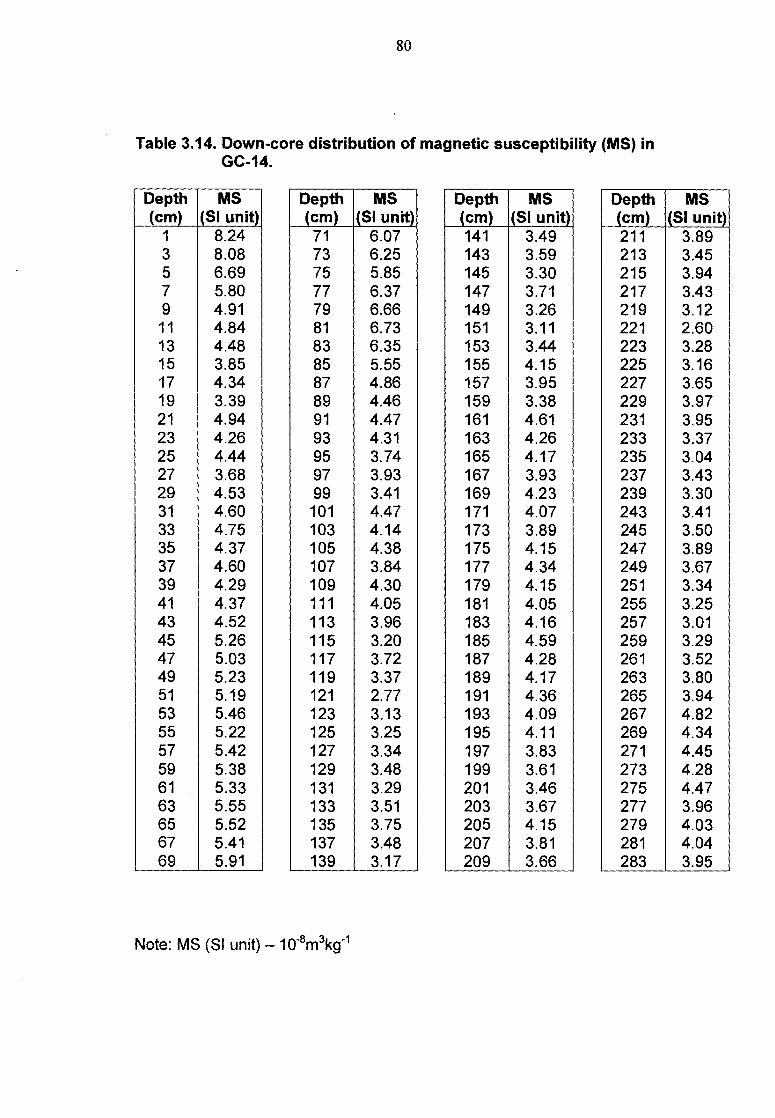
80
Table 3.14. Down-core distribution of magnetic susceptibility (MS) in GC-14.
Depth (cm)
MS (SI unit)
1 8.24 3 8.08 5 6.69 7 5.80 9 4.91 11 4.84 13 4.48 15 3.85 17 4.34 19 3.39 21 4.94 23 4.26 25 4.44 27 3.68 29 4.53 31 4.60 33 4.75 35 4.37 37 4.60 39 4.29 41 4.37 43 4.52 45 5.26 47 5.03 49 5.23 51 5.19 53 5.46 55 5.22 57 5.42 59 5.38 61 5.33 63 5.55 65 5.52 67 5.41 69 5.91
Depth (cm)
MS (SI unit)
71 6.07 73 6.25 75 5.85 77 6.37 79 6.66 81 6.73 83 6.35 85 5.55 87 4.86 89 4.46 91 4.47 93 4.31 95 3.74 97 3.93 99 3.41 101 4.47 103 4.14 105 4.38 107 3.84 109 4.30 111 4.05 113 3.96 115 3.20 117 3.72 119 3.37 121 2.77 123 3.13 125 3.25 127 3.34 129 3.48 131 3.29 133 3.51 135 3.75 137 3.48 139 3.17
Depth (cm)
MS (SI unit)
141 3.49 143 3.59 145 3.30 147 3.71 149 3.26 151 3.11 153 3.44 155 4.15 157 3.95 159 3.38 161 4.61 163 4.26 165 4.17 167 3.93 169 4.23 171 4.07 173 3.89 175 4.15 177 4.34 179 4.15 181 4.05 183 4.16 185 4.59 187 4.28 189 4.17 191 4.36 193 4.09 195 4.11 197 3.83 199 3.61 201 3.46 203 3.67 205 4.15 207 3.81 209 3.66
Depth (cm)
MS (SI unit)
211 3.89 213 3.45 215 3.94 217 3.43 219 3.12 221 2.60 223 3.28 225 3.16 227 3.65 229 3.97 231 3.95 233 3.37 235 3.04 237 3.43 239 3.30 243 3.41 245 3.50 247 3.89 249 3.67 251 3.34 255 3.25 257 3.01 259 3.29 261 3.52 263 3.80 265 3.94 267 4.82 269 4.34 271 4.45 273 4.28 275 4.47 277 3.96 279 4.03 281 4.04 283 3.95
Note: MS (SI unit) - 10-8m3ke

81
Table 3.15. Down-core distribution of magnetic susceptibility (MS), acid Insoluble residue (AIR), CaCO3, organic carbon (OC), and sand content in GC-15
Depth (cm)
MS (SI unit)
Depth (cm)
AIR ( )̀/0)
CaCO3 (%)
OC (wt%)
SAND (%)
10 9.77 2 62.18 37.82 4.39 10.61 14 54.61 6 58.40 41.60 3.56 41.36 16 20.19 10 -- -- -- 9.35 18 5.57 14 53.69 46.31 3.02 12.99 20 6.57 16 -- -- -- 19.52 30 63.68 18 -- -- -- 14.40 35 6.05 20 53.77 46.23 2.53 16.57 40 4.87 30 -- -- -- 19.15 45 7.84 40 51.19 48.81 1.42 24.42 50 6.58 50 -- -- -- 25.38 55 7.39 60 49.60 50.40 1.39 25.50 60 6.80 70 -- -- -- 30.09 65 4.74 80 46.52 53.48 3.08 28.48 70 2.38 90 -- -- -- 28.46 75 4.32 110 61.18 38.82 2.78 32.79 80 3.47 130 46.27 53.73 2.58 32.23 85 4.26 150 43.19 56.81 2.18 38.65 90 20.35 170 42.69 57.31 2.71 35.20 95 4.26 190 45.77 54.23 2.79 33.77 100 4.30 210 -- -- -- 28.49 110 3.41 230 55.69 44.31 2.34 26.70 120 3.56 250 -- -- -- 23.24 130 4.42 270 65.18 34.82 2.69 14.78 140 4.50 290 -- -- -- 14.04 150 3.01 310 71.26 28.74 2.87 7.85 160 0.49 330 -- -- -- 5.91 170 3.18 350 75.76 24.24 3.70 6.38 180 4.32 370 -- -- -- 7.06 190 3.43 390 84.51 15.49 1.93 21.73 200 4.03 410 74.26 25.74 2.41 -- 210 3.40 -- -- -- -- -- 220 3.16 -- -- -- -- -- 230 4.14 -- -- -- -- -- 240 5.38 -- -- -- -- -- 250 5.36 -- -- -- -- -- 260 5.39 -- -- -- -- -- 270 5.76 -- -- -- -- -- 280 5.11 -- -- -- -- --
Continued...
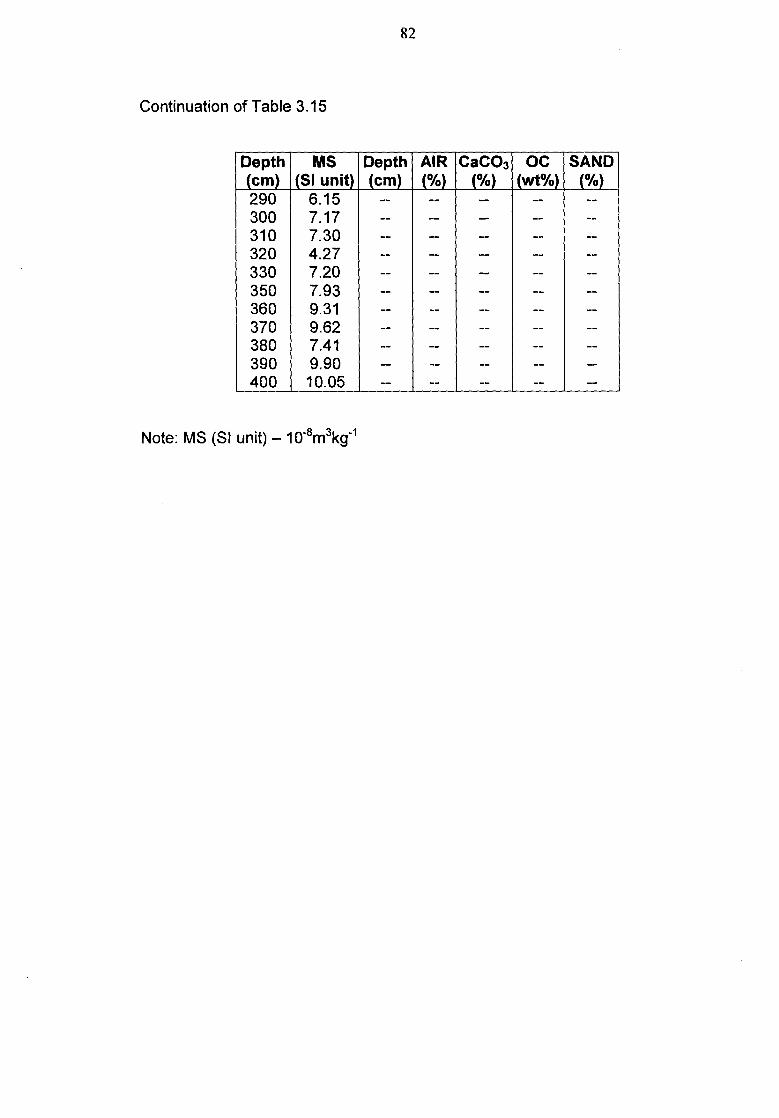
82
Continuation of Table 3.15
Depth (cm)
MS (SI unit)
Depth (cm)
AIR (%)
CaCO3 (%)
OC (wt%)
SAND (%)
290 6.15 -- -- -- -- -- 300 7.17 -- -- -- -- -- 310 7.30 -- -- -- -- -- 320 4.27 -- -- -- -- -- 330 7.20 -- -- -- -- -- 350 7.93 -- -- -- -- -- 360 9.31 -- -- -- -- -- 370 9.62 -- -- -- -- -- 380 7.41 -- -- -- -- -- 390 9.90 -- -- -- -- -- 400 10.05 -- -- -- -- --
Note: MS (SI unit) — 10 -8m3kg-1