chapter 3shodhganga.inflibnet.ac.in/bitstream/10603/98407/9/09_chapter 3.pdf · pic is the...
TRANSCRIPT
45
CHAPTER 3
EXPERIMENTAL DETAILS
Overview- This chapter deals the hardware and software implementation of
developed data acquisition system for monitoring the characteristics of Photovoltaic
cell. First section describes the overall procedural steps to implement this system. In
this section general layout and block diagram are explained. Second section describes
the complete operation of this as per its software. Third section explained the circuit
implementation using Proteus ISIS application package. Fourth section shows the GUI
interface unit for acquire the data from embedded system to digital computer system.
Finally, Simelectronics Model by using MATLAB Simulink is demonstrated for
single solar cell simulation.
3.1 Procedural steps
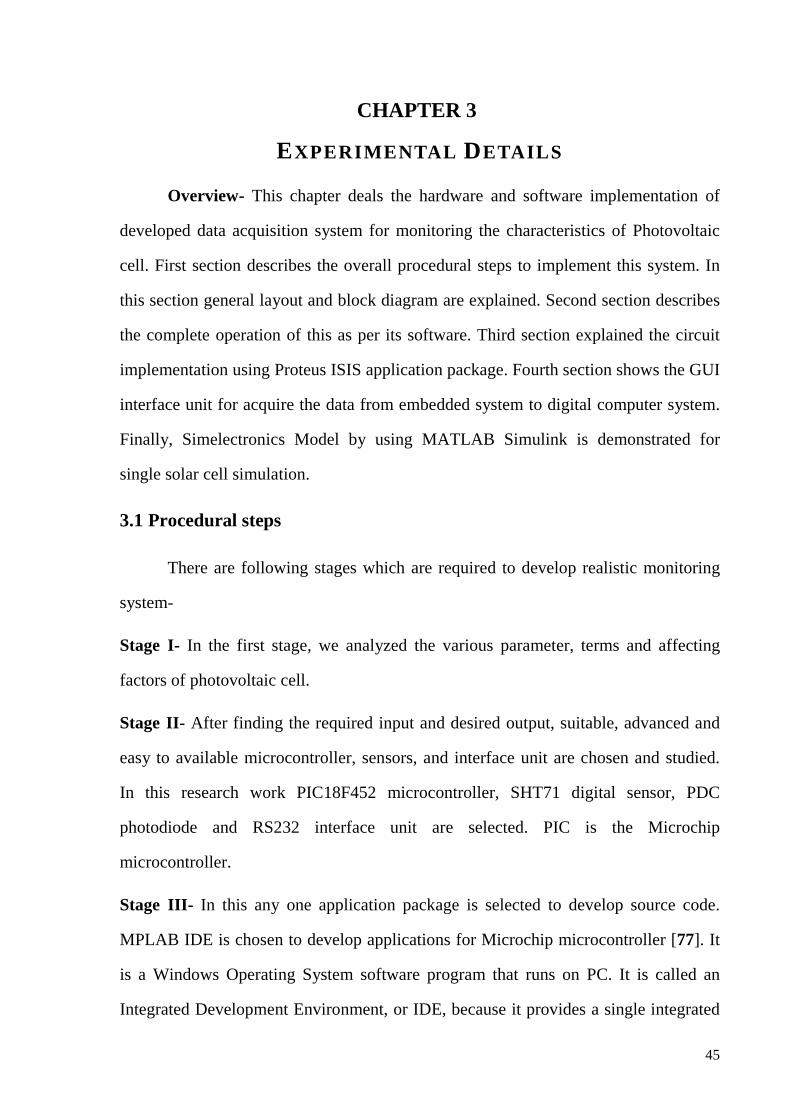
There are following stages which are required to develop realistic monitoring
system-
Stage I- In the first stage, we analyzed the various parameter, terms and affecting
factors of photovoltaic cell.
Stage II- After finding the required input and desired output, suitable, advanced and
easy to available microcontroller, sensors, and interface unit are chosen and studied.
In this research work PIC18F452 microcontroller, SHT71 digital sensor, PDC
photodiode and RS232 interface unit are selected. PIC is the Microchip
microcontroller.
Stage III- In this any one application package is selected to develop source code.
MPLAB IDE is chosen to develop applications for Microchip microcontroller [77]. It
is a Windows Operating System software program that runs on PC. It is called an
Integrated Development Environment, or IDE, because it provides a single integrated
“environment” to develop code for embedded microcontroller
with many Microchip and third party language tools
application code (written in assembly, C or BASIC language) and turn it into
executable code that may be programmed on your selected Microchip device.
system, CCS (Custom Computer Services, Inc.) C compiler (CCSC.exe) is used to
compile source code. The CCS C Compiler has complementary development tools
that work seamlessly with the compiler.
design functionality instead of having to become an MCU architecture expert
Stage IV- In this stage
MPLAB generates hex
application package PIC
“environment” to develop code for embedded microcontrollers. It is designed to work
with many Microchip and third party language tools [78]. These tools take your
application code (written in assembly, C or BASIC language) and turn it into
ay be programmed on your selected Microchip device.
system, CCS (Custom Computer Services, Inc.) C compiler (CCSC.exe) is used to
compile source code. The CCS C Compiler has complementary development tools
that work seamlessly with the compiler. C compiler frees developers to concentrate on
design functionality instead of having to become an MCU architecture expert
In this stage, generated hex file is tested and burned to microcontroller.
MPLAB generates hex file which is embedded into microcontroller by another
PIC ISP for 18x. Before implementing physical system, generated
Figure 3-1 Procedural Stages
46
s. It is designed to work
. These tools take your
application code (written in assembly, C or BASIC language) and turn it into
ay be programmed on your selected Microchip device. In this
system, CCS (Custom Computer Services, Inc.) C compiler (CCSC.exe) is used to
compile source code. The CCS C Compiler has complementary development tools
compiler frees developers to concentrate on
design functionality instead of having to become an MCU architecture expert [79].
, generated hex file is tested and burned to microcontroller.
embedded into microcontroller by another
Before implementing physical system, generated
hex file is simulated by Proteus ISIS application. Developed system is further
calibrated by standard system.
Stage V- Finally, data is recorded in varying parameters. Experimental values are
compared with simulated values. Simulated values are obtained b
Simelectronics model.
monitoring system.
3.2 General Layout
General layout of the
temperature and humidity is shown in figure
humidity (H), irradiance (I
characteristics of PV modules for each v
power available from the maximum power point (MPP) current and voltage. It is
equipped with an autonomous memory. The control of the data collection in the
acquisition system memory is done thr
with the specified communication software
Figure
hex file is simulated by Proteus ISIS application. Developed system is further
calibrated by standard system.
Finally, data is recorded in varying parameters. Experimental values are
compared with simulated values. Simulated values are obtained b
Figure 3-1 shows the required stages to implement realistic
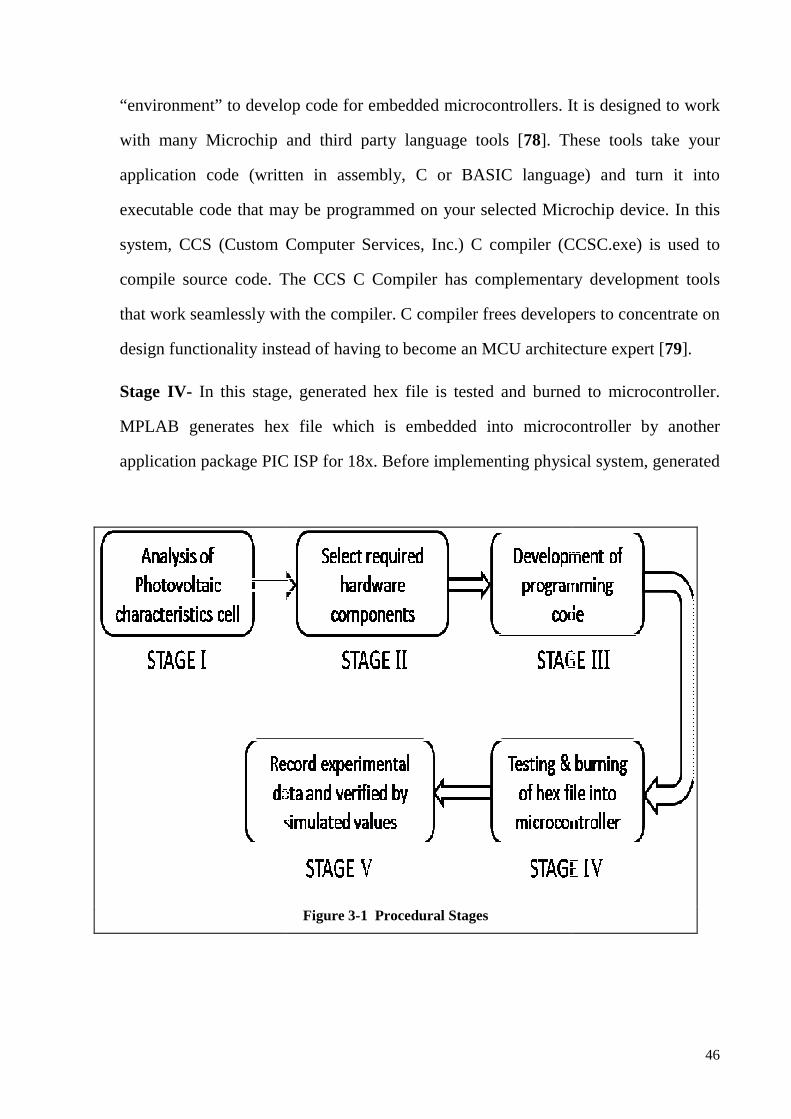
General layout of the acquisition system for measuring the effect of
temperature and humidity is shown in figure 3-2. This system is designed to acquire
, irradiance (Ir) and temperature (T); and records the current &
characteristics of PV modules for each value of H, Ir and T. It calculates the maximum
power available from the maximum power point (MPP) current and voltage. It is
equipped with an autonomous memory. The control of the data collection in the
acquisition system memory is done through RS232 interface connection of the system
with the specified communication software [80].
Figure 3-2 General layout of measuring system
47
hex file is simulated by Proteus ISIS application. Developed system is further
Finally, data is recorded in varying parameters. Experimental values are
compared with simulated values. Simulated values are obtained by single solar cell
1 shows the required stages to implement realistic
acquisition system for measuring the effect of
This system is designed to acquire
T); and records the current & voltage
and T. It calculates the maximum
power available from the maximum power point (MPP) current and voltage. It is
equipped with an autonomous memory. The control of the data collection in the
face connection of the system
48
3.3 Block diagram and flow chart
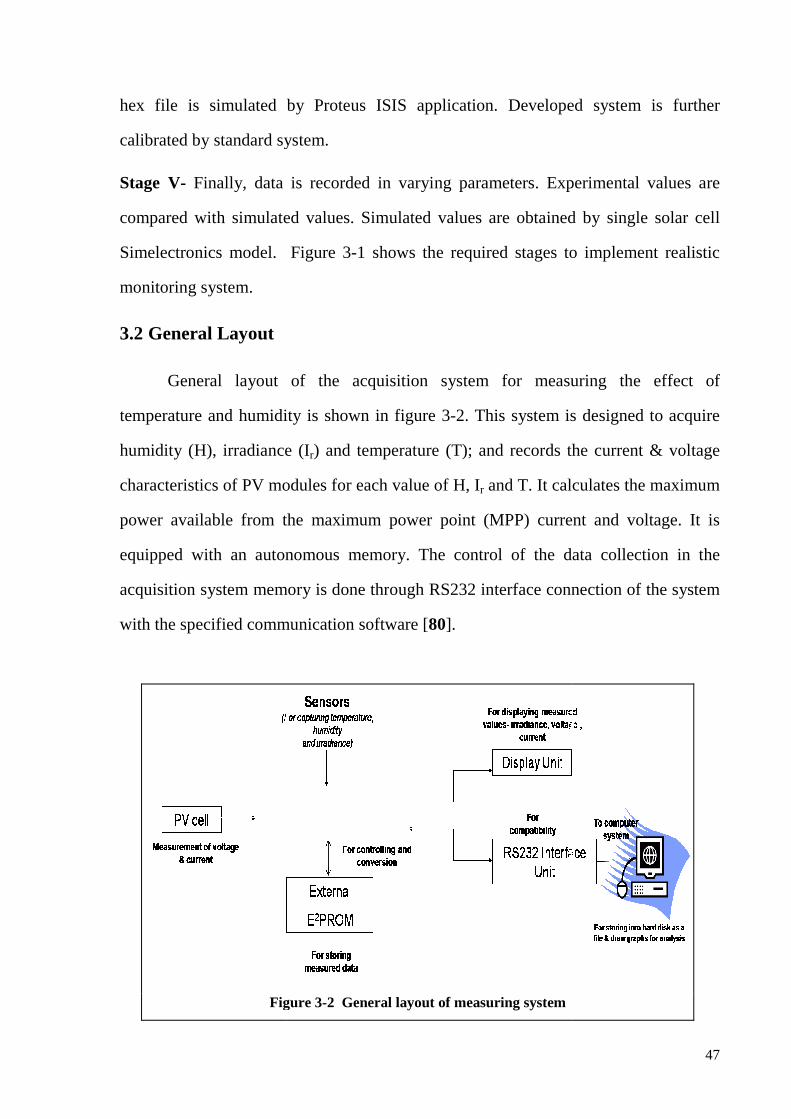
Block diagram of this system which is shown in figure 3-3, has four major
blocks. Block 1 concern the current and voltage measurement, block 2 temperature
and humidity measurement, block 3 is the GUI interface and display unit and block 4
concerns the autonomous memory element [81] [82].
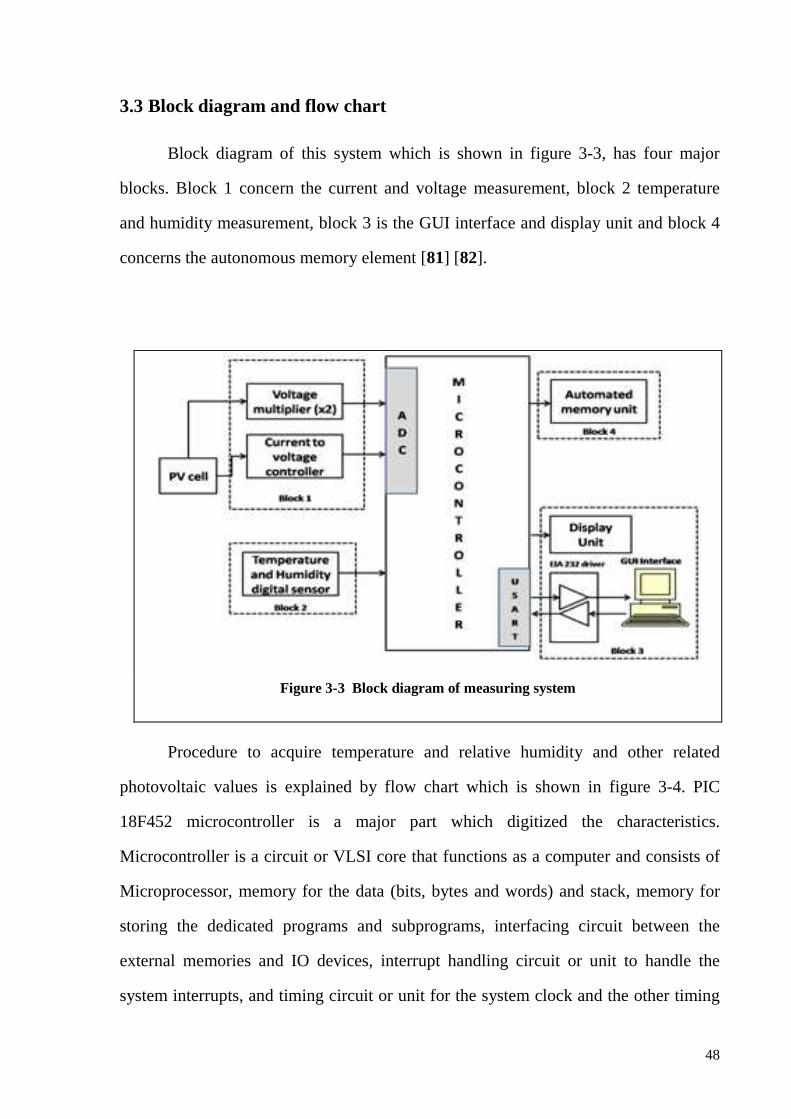
Procedure to acquire temperature and relative humidity and other related
photovoltaic values is explained by flow chart which is shown in figure 3-4. PIC
18F452 microcontroller is a major part which digitized the characteristics.
Microcontroller is a circuit or VLSI core that functions as a computer and consists of
Microprocessor, memory for the data (bits, bytes and words) and stack, memory for
storing the dedicated programs and subprograms, interfacing circuit between the
external memories and IO devices, interrupt handling circuit or unit to handle the
system interrupts, and timing circuit or unit for the system clock and the other timing
Figure 3-3 Block diagram of measuring system

related functions [83] [
record the value from digital sensor, process the command and instruction come from
computer, store the recorded value into EEPROM as well as hard disk of PC as a file
through graphical user interfa
software.
For demonstrating the effect of irradiance and various
is described through flowchart which is shown in figure
[83]. It receives analog signal and then converts into digital,
record the value from digital sensor, process the command and instruction come from
computer, store the recorded value into EEPROM as well as hard disk of PC as a file
through graphical user interface application which is designed through commercial
For demonstrating the effect of irradiance and various wavelengths
is described through flowchart which is shown in figure 3-5.
Figure 3-4 Flowchart of the method
49
It receives analog signal and then converts into digital,
record the value from digital sensor, process the command and instruction come from
computer, store the recorded value into EEPROM as well as hard disk of PC as a file
ce application which is designed through commercial
wavelengths, procedure

Figure 3
3-5 Flow chart to capture various wavelength
50

51
3.4 State diagram of monitoring system
Complete operation of the system can be understood from figure 3-5 which
shows the state machine diagram for the measurement system. The operation of this
system is similar to the one described by Mukaro, [Data Acquisition system] [17] and
other workers [84] [85]. Microcontroller was programmed to be in low-power mode,
except at specific time when monitoring or communication with computer in progress.
The first state of monitoring system is Initial state, entered / appeared after
pressing reset button or power ON. This state initializes all the internal, variables, I/O
ports and various modules like LCD, RS232, sensors etc. It ensures that all are defined
and configured properly. The system then goes into the second which is called WAIT
Figure 3-6 State diagram of monitoring system

52
state. In this state, oscillator remains active to keep track of time but system does
nothing except to wait for interrupt. Instruction executed is stopped, power
consumption is decreased, however and internal RAM contents are preserved. The
program then starts the timer and reads particular channel to check if a computer is
connected to the data acquisition system. If the computer is not connected the timer
awakens the system from the WAIT mode to measure or acquisition mode where set
of readings is taken and stored, after which the data acquisition system goes back into
the WAIT state to wait for another data acquisition and storage cycle. If the computer
is connected, the system makes a transition into the LISTEN mode in which the
operator uses the computer keyboard to communicate with the data acquisition
system. The data acquisition system does not have a real-time clock so the operator
via the computer keyboard supplies the start time for the measurement before the
system is left to run [21].
If the data from sensor is less than ten (equivalent to an irradiance of 65 W/m2),
the system assumes it is night time and does not record this data. This was done to
save memory [86].
Capacitors are used to provide power supply filtering to the microprocessor, the
memory chip and the MAX232 respectively.
Agilent VeePro package [87] is used for data logging; it is facilitated between
this system and computer through RS-232 serial port. Through this program the
computer is able to receive measured values into file as well as for display into the
monitor. These recorded values are used for subsequent analysis. Measured values are
captured every 30 seconds.
53
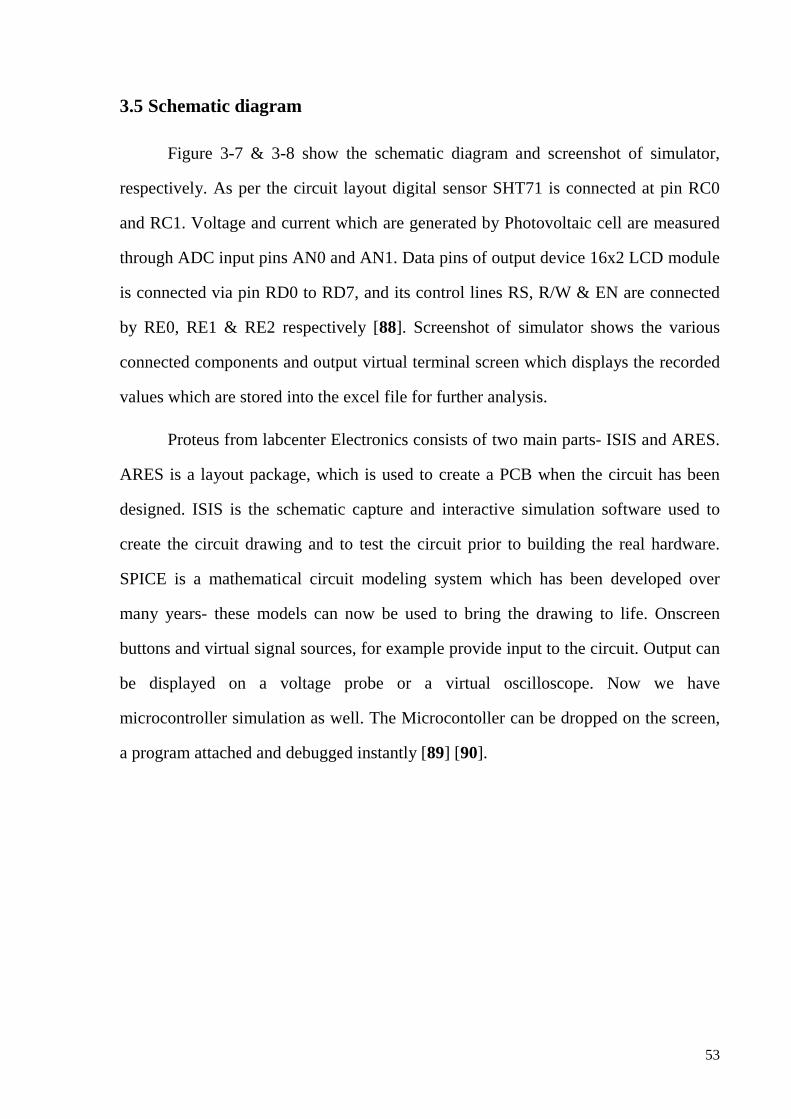
3.5 Schematic diagram
Figure 3-7 & 3-8 show the schematic diagram and screenshot of simulator,
respectively. As per the circuit layout digital sensor SHT71 is connected at pin RC0
and RC1. Voltage and current which are generated by Photovoltaic cell are measured
through ADC input pins AN0 and AN1. Data pins of output device 16x2 LCD module
is connected via pin RD0 to RD7, and its control lines RS, R/W & EN are connected
by RE0, RE1 & RE2 respectively [88]. Screenshot of simulator shows the various
connected components and output virtual terminal screen which displays the recorded
values which are stored into the excel file for further analysis.
Proteus from labcenter Electronics consists of two main parts- ISIS and ARES.
ARES is a layout package, which is used to create a PCB when the circuit has been
designed. ISIS is the schematic capture and interactive simulation software used to
create the circuit drawing and to test the circuit prior to building the real hardware.
SPICE is a mathematical circuit modeling system which has been developed over
many years- these models can now be used to bring the drawing to life. Onscreen
buttons and virtual signal sources, for example provide input to the circuit. Output can
be displayed on a voltage probe or a virtual oscilloscope. Now we have
microcontroller simulation as well. The Microcontoller can be dropped on the screen,
a program attached and debugged instantly [89] [90].

54
Figure 3-7 Schematic diagram
D7
14D
613
D5
12D
411
D3
10D
29
D1
8D
07
E6
RW
5R
S4
VSS
1
VDD
2
VEE
3
LCD1LM016L
MCLR/VPP1
RA0/AN02
RA1/AN13
RA2/AN2/VREF-4
RA3/AN3/VREF+5
RA4/T0CKI6
RA5/AN4/SS/LVDIN7
RE0/RD/AN5 8
RE1/WR/AN6 9
RE2/CS/AN7 10
OSC1/CLKI13
RA6/OSC2/CLKO14
RC0/T1OSO/T1CKI 15
RC2/CCP1 17
RC3/SCK/SCL 18
RD0/PSP0 19
RD1/PSP1 20
RD2/PSP2 21
RD3/PSP3 22
RD4/PSP4 27
RD5/PSP5 28
RD6/PSP6 29
RD7/PSP7 30
RC4/SDI/SDA 23
RC5/SDO 24
RC6/TX/CK 25
RC7/RX/DT 26
RB0/INT033
RB1/INT134
RB2/INT235
RB3/CCP2B36
RB437
RB5/PGM38
RB6/PGC39
RB7/PGD40
RC1/T1OSI/CCP2A 16
U1
PIC18F452
+5V
+88.8Volts
3
21
84
+88.8mV
+5V
R11000R
R2
1k5
Solar cell(+)
+88.
8
mV
solar cell(-)
78%
RV4
1k
+88.8
mV
+88.8µA
3
21
84
R31000R
R4
1k5
+5v
+88.8mV
+88.8Volts
88.031.0
%RH
>
°C
DATA4SCK1
U2
SHT71R510k
LDR1TORCH_LDR
R6(1)
+88.8Volts
R61k
RXD
RTS
TXD
CTS
R81.3k
R9
3.9k
D11N4733A
+88.8mV
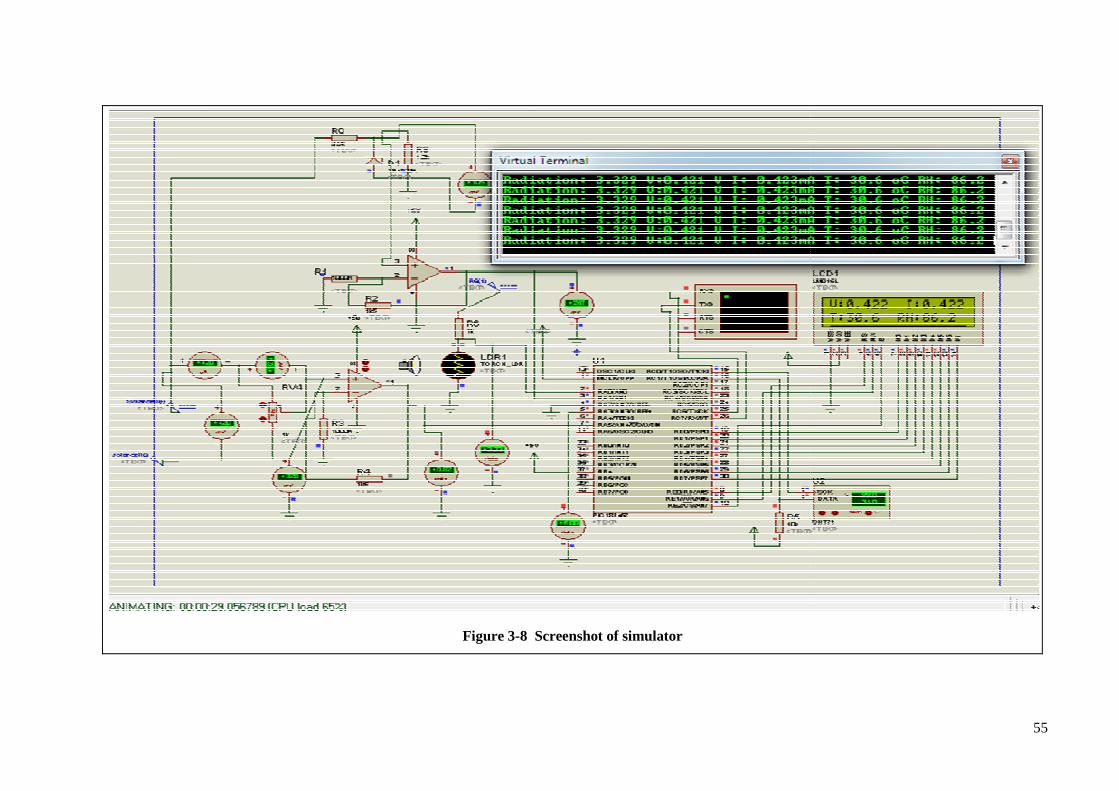
Figure 3-8 Screenshot of simulator
55

3.5.1 Description of Data acquisition
The circuit description of various mentioned blocks are given as follows in
brief. Figure 3-9 shows the circuit detail of block 1 which is bas
voltage and current of PV cell. Operational amplifier is the core part to obtain this
feature.
Block 2 describes the measurement of relative humidity (%) and temperature
(OC) through SHT71 sensor which is manufactured by Sensirion
to choose it to their interface facility with microcontroller. It is a digital sensor.
10-bit ADC with Vref = 5V, resolution = 5 /1024 = 0.0049V. For input signal V
ADC output will be Vo x 0.0049V.
Block 3 permits the interfacing between the microcontroller and the computer
Figure 3-
Description of Data acquisition system
The circuit description of various mentioned blocks are given as follows in
shows the circuit detail of block 1 which is bas
voltage and current of PV cell. Operational amplifier is the core part to obtain this
Block 2 describes the measurement of relative humidity (%) and temperature
(OC) through SHT71 sensor which is manufactured by Sensirion
to choose it to their interface facility with microcontroller. It is a digital sensor.
= 5V, resolution = 5 /1024 = 0.0049V. For input signal V
x 0.0049V.
Block 3 permits the interfacing between the microcontroller and the computer
-9 Voltage and current measurement in block 1
Figure 3-10 Circuit layout of block 2 and 3
56
The circuit description of various mentioned blocks are given as follows in
shows the circuit detail of block 1 which is basically sense the
voltage and current of PV cell. Operational amplifier is the core part to obtain this
Block 2 describes the measurement of relative humidity (%) and temperature
(OC) through SHT71 sensor which is manufactured by Sensirion. The main reason is
to choose it to their interface facility with microcontroller. It is a digital sensor. For
= 5V, resolution = 5 /1024 = 0.0049V. For input signal Vo, the
Block 3 permits the interfacing between the microcontroller and the computer
oltage and current measurement in block 1
57
through EIA-232 driver IC. Figure 3-10 shows the block 2 and 3.
Graphical interface unit which is shown in figure 3-11 is required to visualize
the results of PV cells characteristics on the computer. This interface was
implemented and installed on the PC which provides directly communicates with the
data acquisition system. These recorded data is stored into the EEPROM of
microcontroller as well as in a computer as a file. The central element is the
microcontroller which performs various tasks like activate the ADC, sense to captured
data of digital sensor, transfer to PC through USART module, and store the recorded
data. Here, PIC18F452 microcontroller is chosen. It is a 40-pin RISC microcontroller
which is based on Harvard architecture. It has 16-bit wide instruction and 8-bit wide
data path. It can address program memory up to 32KB. It consumes little power, high
speed FLASH /EEPROM technology and wide operating voltage range (2.0V to 5.5V)
[91] [92]. Agilent VEE pro 9.0 is a powerful intuitive graphical language environment
that provides us the quick and easy path to measurement analysis. It is designed for
engineers and scientists who need to quickly create and automate measurements and
tests. Agilent VEE pro 9.0 can talk to any device from any vendor using GPIB, LAN,
USB, RS-232, VXI, LXI and other interfaces or buses, including PXI and SCXI data
acquisition and modular instrumentation devices from National Instruments. It can
control any standard instruments and many vendor’s PC plug-in cards with an
instrument driver, a vendor-supplied LL or via Agilent VEE pro’s easy and powerful
Direct IO capability [93] [53].

Figure 3-11 Graphical user interface and display sample data in a file
58

3.6 Component detail
SHT71- It is a temperature
sensor. It is manufactured by Sensirion. The main
reason is to choose it to their interface facility with
microcontroller. Its main features are excellent long
term stability, no external components required, ultra
low power consumption, surface mountable or 4
fully interchangeable, small size, automatic power down
etc. Its accuracy in terms of humidity and temperature is
±3.5% RH and ±0.5
measuring range will be 0 to 100% RH for humidity a
-40 OC to +123.8 OC for temperature, it is more than existing system
from appendix III. This is seamlessly coupled to a 14
circuit on the same chip
polymer-sensing element for relative humidity and bandgap temperature sensor.
Humidity is an ambient parameter, which refracts, reflects and diffracts the direct
visible solar irradiation. This dispersion effect results in deterring the reception of th
direct component of solar
Figure 3-13 Digital Sensor
Component details
It is a temperature-humidity digital
It is manufactured by Sensirion. The main
reason is to choose it to their interface facility with
Its main features are excellent long-
term stability, no external components required, ultra
power consumption, surface mountable or 4-pin
fully interchangeable, small size, automatic power down
Its accuracy in terms of humidity and temperature is
OC @25OC, respectively and
measuring range will be 0 to 100% RH for humidity and
C for temperature, it is more than existing system
. This is seamlessly coupled to a 14-bit ADC and a serial interface
circuit on the same chip as referred in appendix III. The device includes a capacit
sensing element for relative humidity and bandgap temperature sensor.
Humidity is an ambient parameter, which refracts, reflects and diffracts the direct
. This dispersion effect results in deterring the reception of th
direct component of solar irradiation by water vapors present in the atmosphere
Figure
Digital Sensor Figure 3-14 Internal diagram of SHT7x
59
C for temperature, it is more than existing system, it is referred
bit ADC and a serial interface
. The device includes a capacitive
sensing element for relative humidity and bandgap temperature sensor.
Humidity is an ambient parameter, which refracts, reflects and diffracts the direct
. This dispersion effect results in deterring the reception of the
by water vapors present in the atmosphere [94].
Figure 3-12 Pin diagram of PIC18F452
Internal diagram of SHT7x

60
3.7 Reasons to choose PIC microcontroller
There are lots of PIC microcontrollers to pick from. The programmer I had
already purchased narrowed this selection down to 40-pin devices. At minimum 8
ADC channels, a UART and counter/timer were used. The first device found to meet
these requirement was the PIC 18F452. It contains 8 channels of 10-bit ADC, an
enhanced UART, two timer counter, 40MHz clock, and flash memory [95] [96]. The
PIC architecture is distinctively minimalist. It is characterized by the following
features (datasheet is given in appendix II)-
� Separate code and data spaces (Harvard architecture)
� A small number of fixed length instructions
� Most instructions are single cycle execution (4 clock cycles), with single delay
cycles upon branches and skips
� A single accumulator (W), the use of which (as source operand) is implied (i.e.
it is not encoded in the opcode)
� All RAM locations function as registers as both source and/or destination of
math and other functions.
� A hardware stack for storing return addresses.
� A fairly small amount of addressable data space (typically 256 bytes), extended
through banking.
� Data space mapped CPU, port, and peripheral registers.
� The program counter is also mapped into the data space and writable (this is
used to implement indirect jumps)
61
� The program counter is also mapped into the data space and writable (this is
used to implement indirect jumps)
� Unlike most other CPUs, there is no distinction between "memory" and
"register" space because the RAM serves the job of both memory and registers,
and the RAM is usually just referred to as the register file or simply as the
registers.
� External data memory can be directly addressable by PIC18F452.
Here, PIC18F452 microcontroller is used, which is low power, high
performance CMOS 8-bit microcontroller with 16Kbyte of code space of Flash
Programmer and Erasable Read Only Memory with 10-bit multi channeled Analog to
Digital converter and 34 I/O pins. The on-chip Flash allows the programmable
memory to be reprogrammed in-system or by a conventional nonvolatile memory
programmer. It is a powerful microcontroller, which provides a highly flexible and
cost effective solution to many embedded control applications [91]. In order to use the
PIC, setting for all the internal registers needed to be determined or calculated via the
datasheet. The internal oscillator was used that set to 2MHz. Next the serial port was
configured. The enhanced UART (EUART) has an internal baud rate generated (no
external timer is needed). The EUART was setup to communicate at 9600 bps, 1 stop
bit, 8 data bits, and no parity. That was easily achieved with little error in bit-rate on
the PIC (about 0.16%). After the serial port was configured the analog to digital
converter was set up. A conversion-time of 4.0 µs as dictated by the datasheet was
selected. Then, registers were set up to use the positive supply as the ADC reference
voltage along with selecting the location of the most significant bit of the result [97].
Microchip provides an integrated development environment (IDE) called
MPLAB for coding, compiling, setting up and controlling programmer for the PIC
series of microcontroller. Included in the IDE is debugger and compiler. A simple

62
com port programmer interfaced to the IDE and reprogrammed the flush program
memory in PIC microcontroller.
Microcontroller firmware- After configuration of peripherals the
microcontroller firmware consisted of a simple loop that acquire samples, convert
them to a format acceptable to Hyper terminal, and echo them to serial port, embedded
program is appended in appendix I. Programming code is attached to the end of this
document in appendix I. The capture event consists of setting ADC registers, then
waiting for the conversion to be completed. These events are repeated three times to
cover all input channels. The high integration of the PIC microcontroller leads to a
very simple hardware solution. On the digital side the PIC controller is connected to a
MAX232, RS-232 to logic-level converter. A 5V power supply and some supply
decoupling capacitor round out the digital section of the hardware. It is constructed on
the PIC kit development board. Highly integrated sensors reduced the difficulty of
implementing an analog interface board. A shunt resistor is chosen as an easy
integrated solution for current sensing [98].
Simelectronics Model- In order to obtain a realistic view of the photovoltaic
system, it is necessary to achieve computer simulations. It is impractical to achieve
complete experimental data due to continuously changing the parameters of
atmosphere. To experiment with PV cells in the laboratory is a time consuming and
costly task. So, to overcome this problem, simulation techniques are used to simulate
the behavior of PV cells under different conditions. For example, the only available
measurement result is often hourly or daily global irradiance on a horizontal plane. So,
modeling is necessary in order to deduce from the available partial data. In literature,
there are several mathematical models [99] [100] [101] that describe the operation and
behavior of the photovoltaic generator. These models differ in the calculation
procedure, accuracy and the number of parameters involved in the calculation of the
63
current-voltage characteristic. The solar cell is modeled and simulated using Matlab
software. (Matlab R2012b (8.0.0.783) 32-bit, August 22, 2012 License number:
724504) [102]. SimElectronics provides component libraries for modeling and
simulating electronic and mechatronic systems. It includes models of semiconductor,
motor, drive, sensor, and actuator components. By using these components we can
perform system-level design of electromechanical actuation systems and to evaluate
analog circuit architectures using behavioral models. Models created from
SimElectronics components support control and algorithm design in electronic and
mechatronic system, such as vehicle body electronics, aircraft servoconductor models
include nonlinear and dynamic temperature effects, enabling us to select components
in amplifiers, analog-to-digital converters, phase-locked loops, and other circuits [103]
[104] [105]. We make validation through the experimental bench: we can use the
method of resistance variation or the charging and discharging capacitor method.
To put the simulation study on firm footing an experimental verification is also
carried out in the laboratory by developing a PC based data acquisition system.
Simulation model developed by many workers [53] [106] [107] for simulation
of a single solar cell has been developed using Simelectronics environment. A solar
cell block is available in simelectronics, which was used with many other blocks to
plot I-V and P-V characteristics under variations of parameters considering one
parameter variation at a time. Effect of two envrionmental parameters of temperature
and irradiance variation could be observed from simulated characteristics.
The solar cell bolck in SimElectronics, represent a single solar cell as a parallel
current source, IL and exponential diode, D and a shunt resistance Rsh that are
connected in series with a resistance Rs. The following SimElectronics Model used for
single solar cell simulation is shown below figure 3-15 [108]. This model was
developed using blocks of Simelectronics and simulink. Solar cell was connected with

64
blocks such as current sensor and voltage sensor to measure the current and voltage
across solar cell [109]. Blocks for varying Irradiance level and temperature, were also
connected in the above model. Reset of the blocks were the interface between major
blocks and used for plotting I-V characteristics

65
Figure 3-15 Single Photovoltaic cell Simelectronics Model