chapter 6 - part 2 spc – attribute control charts
TRANSCRIPT

Chapter 6 - Part 2Chapter 6 - Part 2
SPC – Attribute Control Charts

Types of Control ChartsTypes of Control Charts Attribute charts
Monitor fraction of defective units Monitor number of defects Difference between “defective unit” and a
“defect?” A defective unit is a unit that is either defective. A defect is flaw on a given unit of a product. A unit can have many defects. A defective unit may be defined as, for example, a unit
that has 3 or more defects.

Types of Control ChartsTypes of Control Charts Variables charts
Monitors continuous quality characteristics. Continuous values (variables data) can
theoretically assume an infinite number of values in some interval. Time Weight Ounces Diameter

Types of ControlTypes of Control
Control Chart Monitors
Attribute control charts
p chart Process fraction defective
c chart number of defects
u chart defects per unit
Variables control charts
X-bar chart Process mean
R chart (Range Chart) Process variability
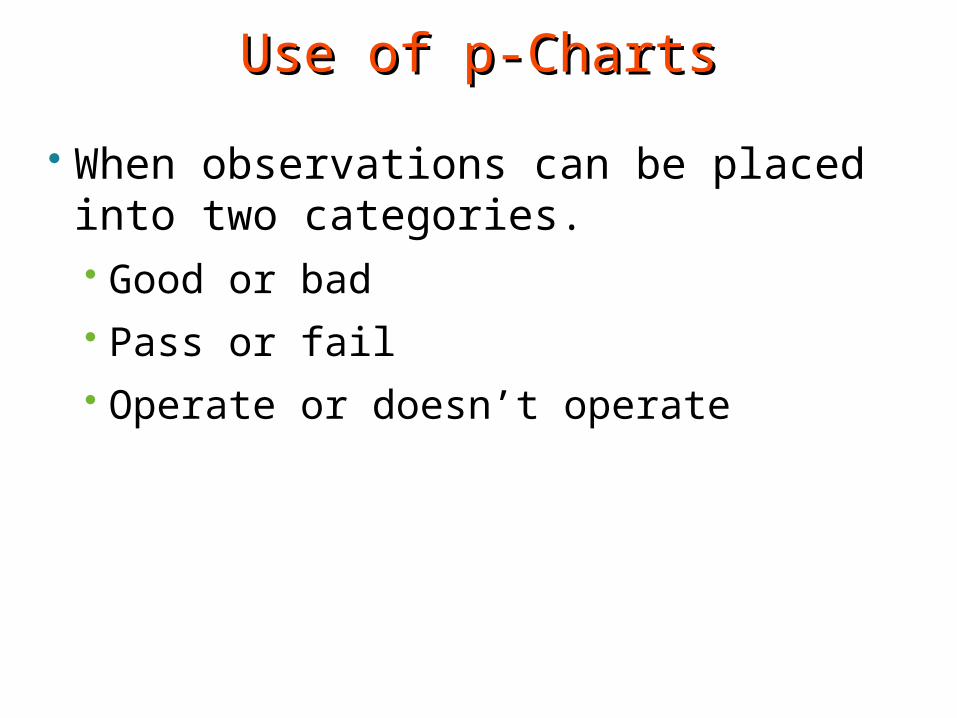
Use of p-ChartsUse of p-Charts
When observations can be placed into two categories. Good or bad Pass or fail Operate or doesn’t operate

p-chartp-chart A company that makes light bulbs wants to
monitor the fraction of defective bulbs. The company decides to select a random
sample of 100 bulbs in each day over a 5 day period
Each of the 100 bulbs are tested to determine if they light up.

p-chartp-chart If a bulb does not light up, the bulb is
defective. The company wants to
Estimate the percentage of defective bulbs and Determine if the percentage of defective bulbs
is increasing over time. A p chart is the appropriate tool for providing
the company with this information.

NotationNotation
Sample size = n = 100
Number of samples (subgroups) = k = 5
X = number of defective bulbs in a sample
p = sample fraction defective = ???
p-bar = estimated process fraction defective P = process fraction defective (unknown)
p-bar is an estimate of P

Inspection ResultsInspection Results
Day n X1 100 202 100 53 100 304 100 355 100 24

Compute Compute pp and and pp-bar-bar
Day n X p=X/n1 100 20 0.202 100 5 0.053 100 30 0.304 100 35 0.355 100 24 0.24
Sum 1.14p-bar 0.23

pp-bar -bar (Estimated Process Fraction (Estimated Process Fraction
Defective)Defective)
k
pp bar -p
23.05
14.1
k
pp
n
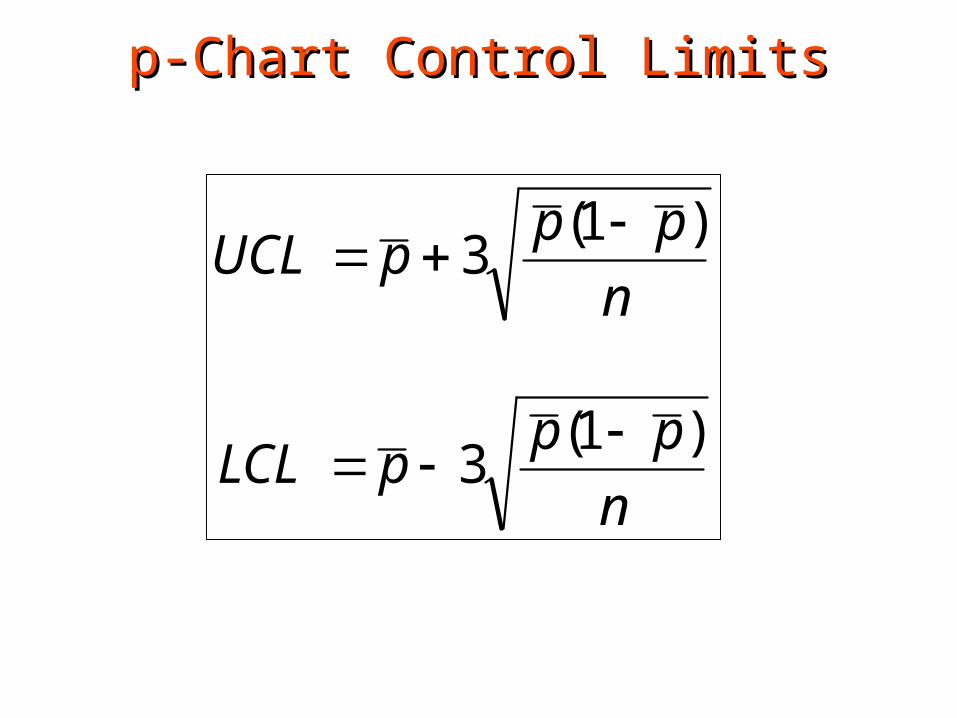
pppLCL
n
pppUCL
)1(3
)1(3
p-Chart Control Limitsp-Chart Control Limits
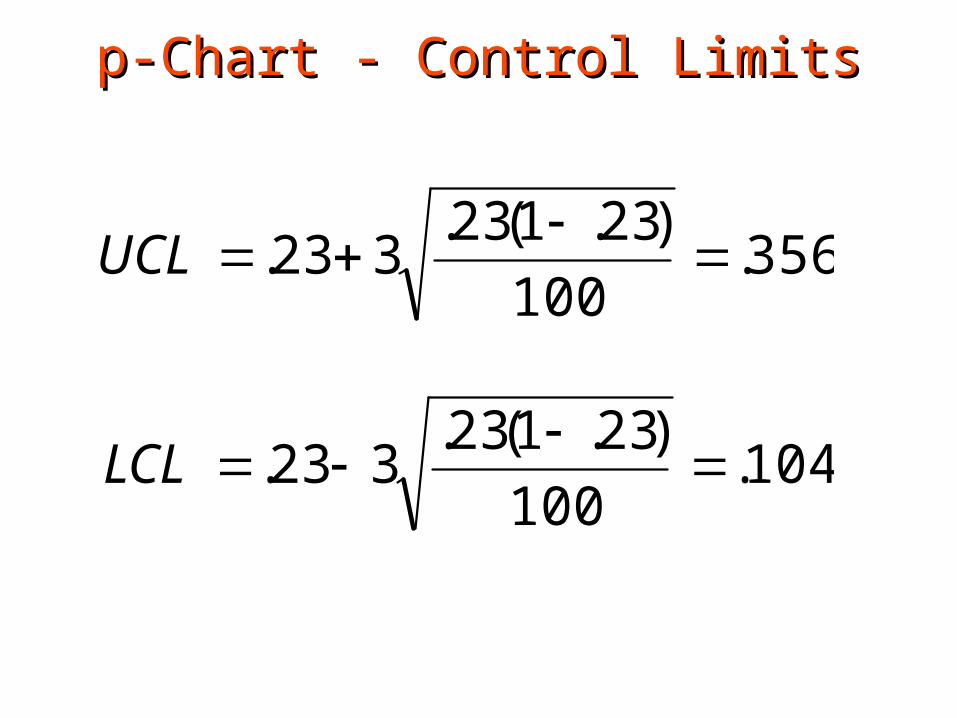
104.100
)23.1(23.323.
356.100
)23.1(23.323.
LCL
UCL
p-Chart - Control Limitsp-Chart - Control Limits

p-Chart for Bulbs
0
0.1
0.2
0.3
0.4
1 2 3 4 5
Day
p
LCL
UCL
p-bar
p

InterpretationInterpretation The estimated fraction of defective bulbs
produced is .23. On Day 2, p was below the LCL. This means that a special cause occurred on
that day to cause the process to go out of control.
The special cause shifted the process fraction defective downward.
This special cause was therefore favorable and should be ???

InterpretationInterpretation After Day 2, the special cause lost its impact
because on Day 4, the process appears to be back in control and at old fraction defective of .23.
Until the special cause is identified and made part of the process, the process will be unstable and unpredictable.
It is therefore impossible to obtain a statistical valid estimate of the process fraction defective because it can change from day to day.

UCL
LCL
p-Chart
Process fractions defective is shifting (trending) upward
SamplingDistribution
P = process fraction
defective PP
PP
Trend Within Control LimitsTrend Within Control Limits

ApplicationsApplications Think of an application of a p-chart in:
Sales Shipping department Law

Use of c-ChartsUse of c-Charts
When we are interested in monitoring number of defects on a given unit of product or service. Scratches, chips, dents on an airplane wing Errors on an invoice Pot holes on a 5-mile section of highway Complaints received per day
Opportunity for a defect must be infinite. Probability of a defect on any one location
or any one point in time must be small.

c-Chartc-Chart
c-chart notation:
c = number of defects
k = number of samples
defects ofnumber mean estimatedc bar -c

c-Chartc-Chart
A car company wants to monitor the number of paint defects on a certain new model of one of its cars.
• Each day one car in inspected.• The results after 5 days are shown on the
next slide.

c-Chartc-Chart
Day c c-bar LCL UCL1 5 6.6 0 14.3072 2 6.6 0 14.3073 8 6.6 0 14.3074 7 6.6 0 14.3075 11 6.6 0 14.307
Sum c 33c-bar 6.60

k
cc
c-Chart - Meanc-Chart - Mean
6.65
33
k
cc

ccUCL
ccLCL
3
3
c-Chart – Control Limitsc-Chart – Control Limits

307.14
6.636.6
3
0or 107.1
6.636.6
3
ccUCL
ccLCL
c-Chart – Control Limitsc-Chart – Control Limits

c-Chart for Number of Paint Defects
0
2
4
6
8
10
12
14
16
1 2 3 4 5
Car
c, n
um
be
r o
f d
efe
cts
c
LCL
UCL
c-bar

ConclusionConclusion Process shows upward trend. Even though trend is within the control limits,
the process is out of control. Mean is shifting upward This is due to an unfavorable special cause. Must identify special cause and eliminate it
from process. Who is responsible for finding and eliminating
special cause?

Mini CaseMini Case Think of an application of a c-chart bank.

u-Chartu-Chart With a c chart, the sample size is one unit.
A u-chart is like a c-chart, except that the sample size is greater than one unit.
As a result, a u-chart tracks the number of defects per unit.
A c-chart monitors the number of defects on one unit.
u-Chartu-Chart A car company monitors the number of paint defects per car by taking a sample of 5 cars each day over the next 6 days.
The results are shown on next side.

Day n c u=c/n u-bar LCL UCL1 5 45 9.0 10.5 6.18 14.8882 5 58 11.6 10.5 6.18 14.8883 5 48 9.6 10.5 6.18 14.8884 5 53 10.6 10.5 6.18 14.8885 5 68 13.6 10.5 6.18 14.8886 5 44 8.8 10.5 6.18 14.888
Sum u 63.2u-bar 10.5
u-Chartu-Chart

k
uu
5.106
2.63
k
uu
u-Chartu-Chart

n
uuUCL
n
uuLCL
3
3
u-Chartu-Chart

89.145
5.1035.10
3
18.65
5.1035.10
3
n
uuUCL
n
uuLCL
u-Chartu-Chart

u-Chartu-Chart
u-Chart Number of Paint Defects Per Car
0
2
4
6
8
10
12
14
16
1 2 3 4 5 6
Car
c, n
um
ber
of
def
ects
LCL
UCL
u
u-bar
ConclusionConclusion The process appears stable. We can therefore get a statistically valid
estimate the process mean number of defects per car.
Our estimate of the mean number of paint defects per car is 10.5, the center line on the control chart.
Thus, we expect each car to have, on average, 10.5 paint defects.

ConclusionConclusion Although the process is stable, the number of
defects per car is too high. Deming calls this a stable process for the
production of defective product. Important take away:
A stable process (process in control) is not necessarily a good process because it can be in control at the wrong level.
A stable process is predictable, but this doesn’t mean that what is being predicted is favorable.

Mini CaseMini Case Who is responsible for improving this
process?
What is required to improve the process?

u-Chart vs. c-Chartu-Chart vs. c-Chart
n
cu
If n = 1, u = c and .cu
Control limits of the two chart will thereforebe the same.

Sample SizeSample Size
Control Chart When To Use Sample Size
p-Chart Monitor the proportion of defectives in a process
At least 50
c-Chart Monitor the number of defects
1
u-chart Monitor the number of defects per unit
>1

In PracticeIn Practice You need 25 to 30 samples before computing
initial control limits. When a special cause occurs, you should
eliminate that sample and re-compute control limits if Special cause is identified Eliminated or made part of process
To identify special causes, workers must keep log sheet, where they record any changes they make to the process.

Tracking ImprovementsTracking Improvements
UCL
LCL
LCLLCL
UCLUCL
Process not centeredand not stable
Process centeredand stable
Additional improvementsmade to the process