spc: control chart fundamentals and...
TRANSCRIPT

SPC: Control Chart Fundamentals and
ApplicationsApplications
January 22, 2016
Dan Mateja
9th Annual ASQ Illiana Quality Conference
Background
• 21 years in the steel industry
– Quality
– Process Technology
• BS and MS in Metallurgical Engineering and Materials
Science
• MS in Quality Assurance
• ASQ CQM/OE
• Certified Black Belt through Whirlpool Operational
Excellence
• ASQ Member since 2009
– Illiana Chief ASQ Exam Proctor
– Illiana Section Chair
2

Agenda
• 7 Quality Tools for Process Improvement
• Control Chart History and Overview
• Variable Control Charts• Variable Control Charts
– Average (X-bar) – Range (R)
– Other Variable Control Charts
• Attribute Control Charts
– P-Chart
– Other Attribute Control Charts
3

Seven Quality Tools
• Cause-and-Effect Diagram – Fishbone Chart
• Check Sheet
• Control Charts
• Histogram• Histogram
• Pareto Chart
• Scatter Diagram
• Stratification
4
Control Chart History and Overview
• Invented by Walter A. Shewhart in the 1920’s
– Improve reliability of Bell Lab telephone transmission lines
– Reduce frequency of failures and repairs
– Recognized common and special cause variation
– Need to bring process in control to predict the future and make a process economically
• Mid 1920’s - W. Edwards Deming recognized significance
– Statistical consultant to Post-World War II Japan
– Used control chart in Japanese manufacturing industry in 1950’s and 1960’s
5

Control Chart History and Overview
X-Bar Chart - Pin Diameter
0.246
0.247
0.248
0.249
0.25
0.251
0.252
0.253
• Basic Definition: Control Charts are tools used to determine if a process is in a state of control
Range Chart - Pin Diameters
1 2 3 4 5 6 7 8 9 10 11 12 13 14 15 16 17 18 19 20
0
0.001
0.002
0.003
0.004
0.005
0.006
0.007
0.008
0.009
0.01
1 7 13 19
6

Control Chart History and Overview
• Control Charts used for several purposes
– Monitor process variables and parameters. Assess the stability of parameter and to “flag” when a process goes out of control. SPC.
– Validate the effect of changes on process parameters. Assess the effectiveness of a change.effectiveness of a change.
– Useful in improvement activities. Understand the relationship between process variables and parameters.
– Useful to understand the stability and variation in critical process variables indentified in trials/experiments (DOE’s) . Control charts used in follow-up studies.
7

Control Chart History and Overview
• Control Charts Basics
– Graph used to study how a process changes over time
– Data plotted in time order
– Central line for average, upper line for upper control limit and a lower line for lower control limit
– Line and limits determined from historical data
– Conclusions about whether the process variation is consistent (in control) or is unpredictable (unstable, out of control, affected by special causes of variation)
8

Control Chart History and Overview
• Control Chart Purpose for SPC
– Recognize the extent of variation currently exists
• Do not react to random variation
– Study the process to identify sources of variation
• Act to eliminate or reduce variation sources
– Special causes
– Common causes
9

Control Chart History and Overview
• Types of Control Charts
– Variable
• Continuous data
• Control charts used in pairs• Control charts used in pairs
– One chart (typically the top) monitors the average or centering of the process distribution
– The other chart (typically the bottom) monitors the range of the distribution
– Attribute
• Non-continuous, Go-No Go, Pass-Fail
• A single control chart10

Control Chart History and Overview
Control Chart Decision Tree
Choose Appropriate Control Chart
Attribute Data
Counted & plotted as discrete events
Continuous Data
Measured & plotted on a continuous scale
11
Counted & plotted as discrete events Measured & plotted on a continuous scale
Defect Data Defective Data
Sample size = 1 Sample is large,
usually ≥ 10
Sample is small,
usually 3 to 5
Variable sample
size
Constant sample
size
Constant sample
size ≥ 50
Variable sample
size ≥ 50
c Chart u Chart np Chart p Chart
I and MR X-Bar and s X-Bar and R

Variable Control Charts – X-Bar-R
Control Charts
Description
Instructions
●
X-Bar Chart - Pin Diameter
This template illustrates a Statistical Process
Control (SPC) chart. A detailed discussion of
SPC charts can be found at www.ASQ.org
Learn About Statistical Process Control
Select the correct subgroup size. When in
doubt, select a subgroup size of one.
Partial subgroups are not displayed.
Quality Tools
0.247
0.248
0.249
0.25
0.251
0.252
0.253
One Two Three
●
●
●
Learn More
Three Sigma Limit A single point outside the control limits
Two Sigma Limit Two of three pts outside the two sigma limit
One Sigma Limit Four of Five pts outside the one sigma limit
Average Eight in a row on the same side of centerline
Learn About Quality
Range Chart - Pin Diameters
Identify any out of control conditions.
Four tests are performed. Use the legend
to identify the points corresponding to a
particular test.
Enter up to 200 data points in the cells
provided. Do not enter values in the
subgroup column. These cells update
automatically to show the subgroup in
which the data point is included.
To learn more about other quality tools, visit
the ASQ Learn About Quality web site.
If a test looks for a proportion of points,
only the offending point will be identified.
For example, if eight points in a row are
on one side of the centerline only the
eighth point will be identified.
0.246
0.247
1 2 3 4 5 6 7 8 9 10 11 12 13 14 15 16 17 18 19 20
0
0.001
0.002
0.003
0.004
0.005
0.006
0.007
0.008
0.009
0.01
1 7 13 19
Four Five Six
12

Variable Control Charts – X-Bar-R0.2501 Xbar/IMR Chart Avg 0.251 Xbar one sigma Upper Limit 0.006 Rbar one sigma Upper Limit
0.0044 Range Chart Avg 0.252 Xbar two sigma Upper Limit 0.008 Rbar two sigma Upper Limit
0.001892 Rbar/d2 0.253 Xbar three sigma Upper Limit 0.009 Rbar three sigma Upper Limit
100 Number of samples 0.249 Xbar one sigma Lower Limit 0.003 Rbar one sigma Lower Limit
5 Subgroup size 0.248 Xbar two sigma Lower Limit 0.001 Rbar two sigma Lower Limit
20 Number of subgroups 0.248 Xbar three sigma Lower Limit n/a Rbar three sigma Lower Limit
Sub
Group Data
Sub
Group Data
Sub
Group Data
Sub
Group Data
Sub
Group Data
Sub
Group Data
Sub
Group Data
Sub
Group Data
1 0.249 6 0.25 11 0.251 16 0.249 21 26 31 36
1 0.251 6 0.25 11 0.249 16 0.25 21 26 31 36
1 0.251 6 0.251 11 0.249 16 0.249 21 26 31 36
1 0.248 6 0.251 11 0.251 16 0.251 21 26 31 361 0.248 6 0.251 11 0.251 16 0.251 21 26 31 36
1 0.25 6 0.251 11 0.252 16 0.252 21 26 31 36
2 0.251 7 0.247 12 0.251 17 0.25 22 27 32 37
2 0.246 7 0.251 12 0.255 17 0.249 22 27 32 37
2 0.252 7 0.253 12 0.248 17 0.25 22 27 32 37
2 0.248 7 0.25 12 0.247 17 0.25 22 27 32 37
2 0.25 7 0.249 12 0.249 17 0.25 22 27 32 37
3 0.25 8 0.25 13 0.25 18 0.248 23 28 33 38
3 0.25 8 0.251 13 0.252 18 0.25 23 28 33 38
3 0.246 8 0.253 13 0.252 18 0.249 23 28 33 38
3 0.25 8 0.249 13 0.249 18 0.251 23 28 33 38
3 0.251 8 0.248 13 0.251 18 0.251 23 28 33 38
4 0.249 9 0.246 14 0.25 19 0.251 24 29 34 39
4 0.253 9 0.25 14 0.251 19 0.248 24 29 34 39
4 0.245 9 0.248 14 0.254 19 0.25 24 29 34 39
4 0.254 9 0.25 14 0.251 19 0.25 24 29 34 39
4 0.249 9 0.251 14 0.251 19 0.252 24 29 34 39
5 0.25 10 0.251 15 0.252 20 0.254 25 30 35 40
5 0.246 10 0.248 15 0.251 20 0.251 25 30 35 40
5 0.251 10 0.249 15 0.248 20 0.254 25 30 35 40
5 0.249 10 0.249 15 0.25 20 0.247 25 30 35 40
5 0.25 10 0.25 15 0.251 20 0.251 25 30 35 40
13

Variable Control Charts – X-Bar-R
• When to Use
– When you have variable data
– When data are generated frequently
– When you want to detect small changes
– Useful for data that that does not form a normal
distribution
– Useful manufacturing – sampling to represent a larger
population
14

Variable Control Charts – X-Bar-R
• Several Purposes
– Used for control
– Used for analyses
– Used for education, communication and documentation
15

Variable Control Charts – X-Bar-R
• Procedure for setting up X-Bar-R control charts
– Step 1:
– Choose what to measure
– Step 2:
– Determine the appropriate time period for collecting
the data
– Determine the number of data points per subgroup
(n) and the number of subgroups (k) (minimum = 20)
– Within each subgroup, samples should as alike as
possible 16
Variable Control Charts – X-Bar-R
• Procedure for setting up X-Bar-R control charts
– Step 3:
– Set up forms for data
17

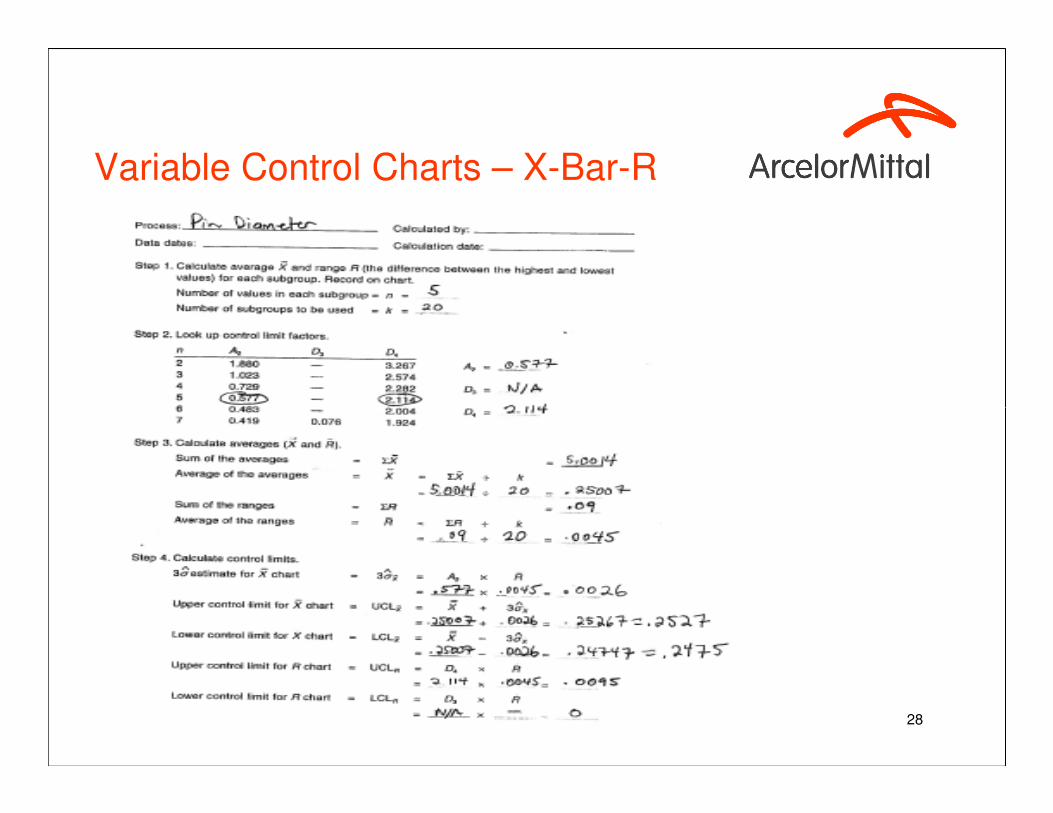
Variable Control Charts – X-Bar-R
18

Variable Control Charts – X-Bar-R
• Procedure for setting up X-Bar-R control charts
– Step 4:
– Collect the samples and record the measurements
– Step 5:
– With raw data, construct a histogram of the individual
data points and the averages of the subgroups
– Check for normality – Anderson-Darling Test
19

Variable Control Charts – X-Bar-R
• Histogram of Individual Data Points
20

Variable Control Charts – X-Bar-R
• Histogram of the Average of the Subgroups
21

Variable Control Charts – X-Bar-R
• Normality Test for Individual Data Points
22

Variable Control Charts – X-Bar-R
• Normality Test for the Average of the Subgroups
23
Variable Control Charts – X-Bar-R
• Procedure for setting up X-Bar-R control charts
• Calculate various statistics and determine the
control limits for charts
– Step 6:
– Calculate the averages x̄ (X-bar)
– Step 7:
– Calculate the average of the averages x̿ (X-double-
bar)
24

Variable Control Charts – X-Bar-R
• Procedure for setting up X-Bar-R control charts
• Calculate various statistics and determine the
control limits
– Step 8:
– Determine the range for the samples
– Step 9:
– Calculate the average of the ranges ( ̅R)
– Step 10:
– Calculate the control limits for the range and x̄ (X-
bar) charts
25

Variable Control Charts – X-Bar-R
26

Variable Control Charts – X-Bar-R
27
Variable Control Charts – X-Bar-R
28

Variable Control Charts – X-Bar-R
29

Variable Control Charts – X-Bar-R
30

Variable Control Charts –X-Bar -R
• Procedure for setting up X-Bar-R control charts
– Step 11:
– Determine the scale for the plots
– Step 12:
– Draw the control limits and averages and plot the
data for both charts
– Connect the dots
31
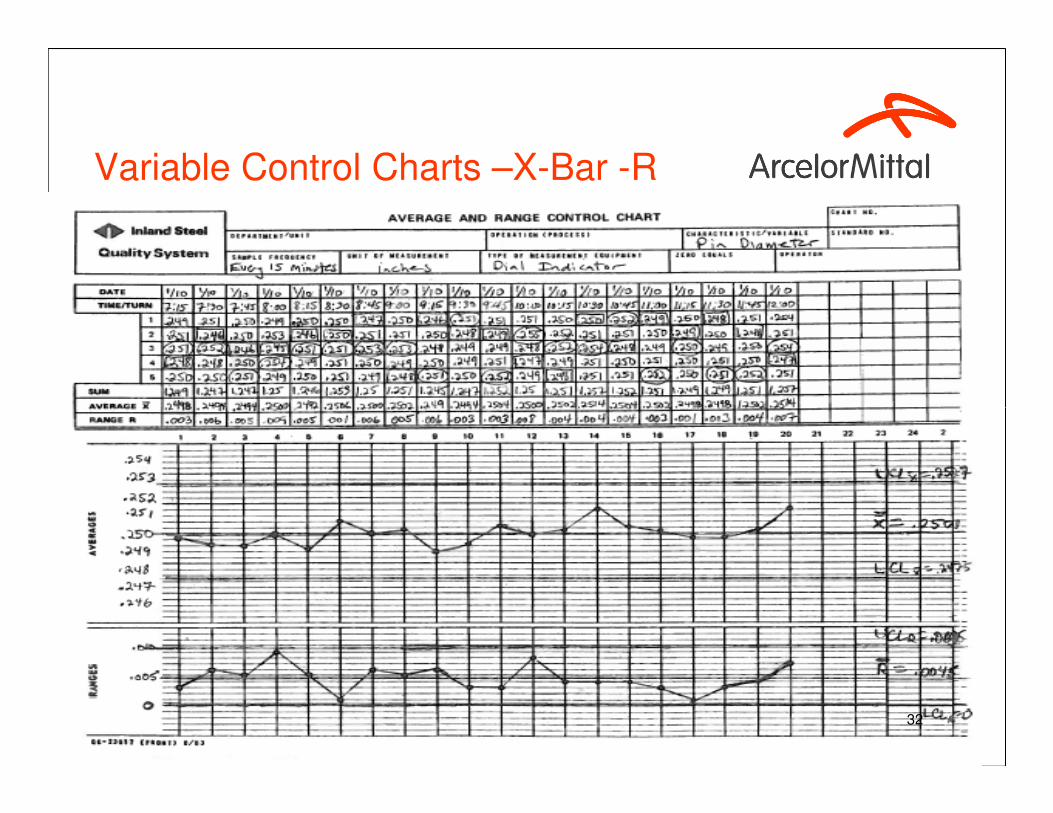
Variable Control Charts –X-Bar -R
32

Variable Control Charts –X-Bar -RX-Bar Chart - Pin Diameter
0.248
0.249
0.25
0.251
0.252
0.253
Range Chart - Pin Diameters
0.246
0.247
1 2 3 4 5 6 7 8 9 10 11 12 13 14 15 16 17 18 19 20
0
0.001
0.002
0.003
0.004
0.005
0.006
0.007
0.008
0.009
0.01
1 7 13 19 33

Variable Control Charts – X-Bar-R
• Analysis
– Step 1:
– Check the range chart for out-of-control points
– If out-of-control, investigate reasons
– Cannot proceed to Step 2 until out-of-control reasons
explained and/or range chart back in control
– Recalculate control limits without out-of-control
points
– Step 2:
– Check the x-bar chart for out-of-control signals
– If out-of-control, investigate reasons34
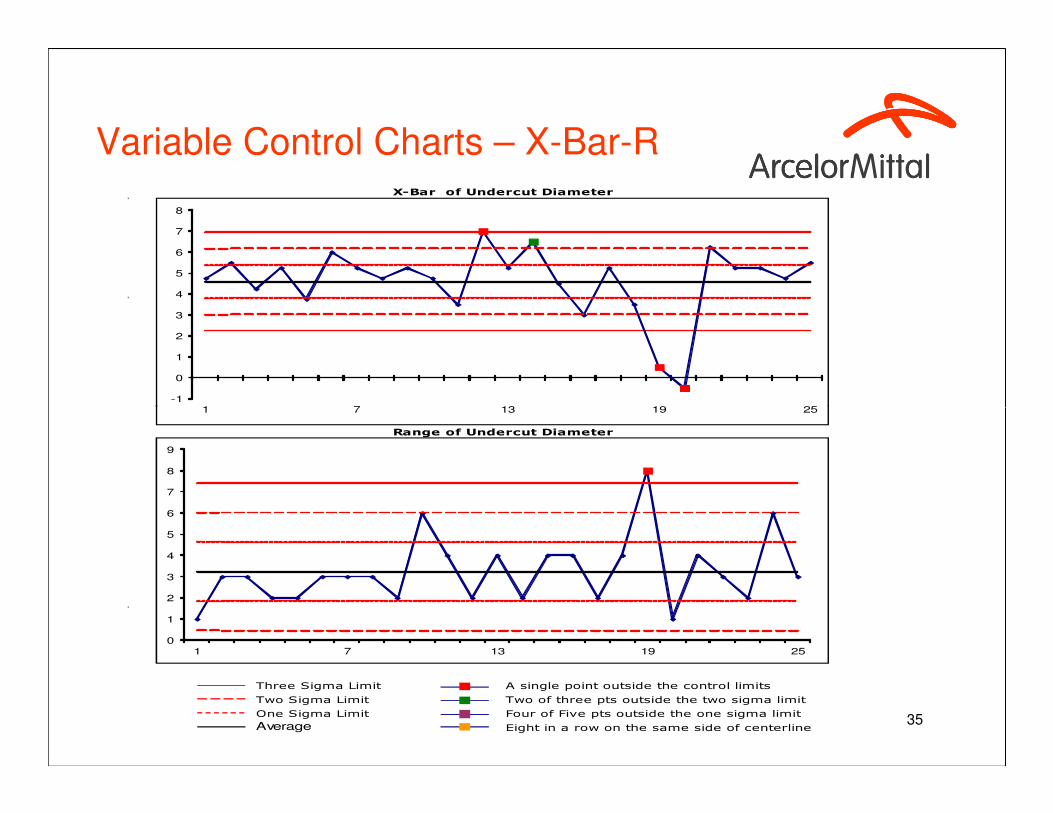
Variable Control Charts – X-Bar-RX-Bar of Undercut Diameter
-1
0
1
2
3
4
5
6
7
8
1 7 13 19 25
Three Sigma Limit A single point outside the control limits
Two Sigma Limit Two of three pts outside the two sigma limit
One Sigma Limit Four of Five pts outside the one sigma limit
Average Eight in a row on the same side of centerline
Range of Undercut Diameter
1 7 13 19 25
0
1
2
3
4
5
6
7
8
9
1 7 13 19 25
35

Variable Control Charts – X-Bar-RX-Bar of Undercut Diameter
1
2
3
4
5
6
7
8
Three Sigma Limit A single point outside the control limits
Two Sigma Limit Two of three pts outside the two sigma limit
One Sigma Limit Four of Five pts outside the one sigma limit
Average Eight in a row on the same side of centerline
Range of Undercut Diameter
01 7 13 19
0
1
2
3
4
5
6
7
8
1 7 13 19
36

Variable Control Charts – X-Bar-R
• Out-of-Control Signals
– Any points outside of control limits
– 2 out of 3 successive points are on the same side of the centerline and further than 2σ from itand further than 2σ from it
– 4 out of 5 successive points are on the same side of the centerline and further than 1σ from it.
– A run of eight in a row on the same side of the control limits
– 6 successive points increasing or decreasing
– Consistent or persistent patterns
– Other
– Limit rules for out-of-control conditions in SPC control charts
37

Variable Control Charts – X-Bar-R
• Out-of-Control Signals
– Considerations
• Signal rules are based on statistics and a normal and predictable curve
• Signals do not indicate whether patterns are undesirable or • Signals do not indicate whether patterns are undesirable or desirable
• Data points cannot show autocorrelation – successful points related to the preceding points
– Data collection time period important
– Autocorrelation test
• Control limits are not specification limits
• Control limits are only recalculated when there is a permanent change in the process
38

Variable Control Charts – X-Bar-R
• Out-of-Control Signals
– Considerations (continued)
• Most useful data are plotted as soon as they are generated by the people working the process
• Software is available• Software is available
• Control charts are often applied incorrectly
39

Control Chart Decision Tree
Choose Appropriate Control Chart
Attribute Data
Counted & plotted as discrete events
Continuous Data
Measured & plotted on a continuous scale
40
Counted & plotted as discrete events Measured & plotted on a continuous scale
Defect Data Defective Data
Sample size = 1 Sample is large,
usually ≥ 10
Sample is small,
usually 3 to 5
Variable sample
size
Constant sample
size
Constant sample
size ≥ 50
Variable sample
size ≥ 50
c Chart u Chart np Chart p Chart
I and MR X-Bar and s X-Bar and R

Variable Control Charts – X-Bar-S
• Similar to X-Bar-R chart except use standard deviation in
place of range
• When to use
– Variable data– Variable data
– Need lots of data, n≥ 10
– Need to detect very small changes
• Standard deviation statistic calculations
41

Variable Control Charts – Individual
– Moving Range
• Study variable data that are not generated
frequently enough for an X-Bar-R Chart
• When to use
– Variable data– Variable data
– Normal distribution
– Cannot use X-Bar-R chart due to infrequent data
– Cannot use X-Bar-R chart because the measurement remains constant for a relatively long period of time before process changes
• Plot individual values and the moving range – difference
between successive individual values42

Variable Control Charts – Individual
– Moving Range
43

Variable Control Charts – Other
• Moving Average-Moving Range
• Each successive subgroup drops the oldest measurement from the previous subgroup
• Cannot use X-Bar-R - measurements remain constant
• Cannot use I-MR – data are not normal
• Target Chart
• Allows the same characteristic from different parts or products to be plotted on the same chart
• Median and Range
• Good to use when data are normal and are not very often disturbed by assignable causes
44

Control Chart Decision Tree
Choose Appropriate Control Chart
Attribute Data
Counted & plotted as discrete events
Continuous Data
Measured & plotted on a continuous scale
45
Counted & plotted as discrete events Measured & plotted on a continuous scale
Defect Data Defective Data
Sample size = 1 Sample is large,
usually ≥ 10
Sample is small,
usually 3 to 5
Variable sample
size
Constant sample
size
Constant sample
size ≥ 50
Variable sample
size ≥ 50
c Chart u Chart np Chart p Chart
I and MR X-Bar and s X-Bar and R

Attribute Control Charts
• Used for go-no go, defects, counts
• Use when you need to monitor a non-measurable in your
product or process
• Only one control chart
• Use variable data where possible
46

Attribute Control Charts – P/NP-Charts
• Used for go-no go, defects, counts
• P-Chart
• Used to study proportion of non-conforming or
defective itemsdefective items
• Items are either good or bad
• P equals the number of defective pieces divided by
sample size
• Sample size can vary
• Sample size should be approximately greater than 50
47

Attribute Control Charts – P/NP-Charts
• NP-Chart
• Same as P-Chart but sample size is constant
• Can also use P-Chart if sample size is constant
• Plot number instead of percent defective
48

Attribute Control Charts – C/U- Charts
• C-Chart
• Count chart used to study the number of non-conformities or defects
• When to use:• When to use:
• Counting non-conformities
• Each sample must have the same opportunity for non-conformities to occur
• More than one non-conformity can be counted per item or per area
• Sample size (length, area, etc.) remains constant
49

Attribute Control Charts – C/U- Charts
• U-Chart
• Similar to C-Chart but used to study the proportion of
non-conformities
• When to use:• When to use:
• Counting non-conformities and
• Sample size varies or
• Where the opportunity for non-conformities changes from one sample to the next
50

Attribute Control Charts – P-Chart
51

Attribute Control Charts – P-Chart
52

Attribute Control Charts – P-Chart
53

Summary
• Control Charts can used for several purposes
– Monitor process variables and parameters - SPC
– Other continuous improvement and/or problem solving activities
• Variable and Attribute Control Charts – try to use variable
• In SPC, important for operators to fill out and react to out of control conditions
• Understand random and special cause variation and stability
• Your process or engineering knowledge will solve the problems!!!!!
54

Computer Programs for Control
Charts
• Minitab
– Good for statistical calculations and charts
• SAS Jump
– Similar to Minitab
• Excel Templates
– ASQ for X-Bar-Range
• Many offered online
• Tailor your own55

Bibliography and Good References
• Amsden, Robert T., Butler, Howard E. and Amsden, Davida, M. SPC Simplified Practical Steps to Quality. Portland, OR: Productivity, Inc., 1998.
• Teague, Nancy R. The Quality Toolbox. Milwaukee, WI: American Society for Quality Press, 2005.Society for Quality Press, 2005.
• Wheeler, Donald J. and Chambers, David S. Understanding Statistical Process Control. Knoxville, TN: SPC Press,1992.
• Moen, Ronald D., Nolan, Thomas, W. and Provost, Lloyd P. Improving Quality Through Planned Experimentation. Boston, MA: McGraw-Hill, 1991.
56