chapter 7-emax power analysis - pdma manual/11_chapter 7-emax pow… · chapter 7: emax power...
TRANSCRIPT

PdMA MCEGold PRODUCT SUPPORT MANUAL EMAX POWER ANALYSIS
REV. 0-04/08 © 2008 PdMA Corporation 7-1
CHAPTER 7: EMAX POWER ANALYSIS
EMAX testing may be started by selecting either the Test Selection or the EMAX Auto
icons on the toolbar.
Selecting the EMAX Auto icon automatically runs the Rotor Evaluation, Eccentricity,Power, and Demod tests. At the completion, after the test results are saved, the Fault ZoneAnalysis window displays. It uses the existing testing setup values.
Selecting the Test Selection icon allows you to verify and/or change the testing setupvalues and select which test you want to run. Test Selection is discussed in detail on page7-3.
TESTING QUICK START1. Connect the EMAX Data Acquisition cable to the PCMCIA DAQ Card in the laptop
computer.
2. Start MCEGold and highlight the motor to be tested on the Site Navigator orWatchList.
3. Select the Test Selection icon on the toolbar.
4. Choose EMAX tab on the Test Selection window.
5. From the Test Selection window select the Power Analysis test. EMAX Auto, RotorEvaluation, Eccentricity, In-Rush/Start-Up, and Demod are Current Analysis tests andare discussed in Chapter Six.
Note: Each test is discussed in detail in the Step-by-step Procedures.
6. Connect the current probes.
7. Make the appropriate changes in the EMAX Test Setup section. The displayed settingswill change depending on the test selected.
8. Click Test. At the end of testing the Test Results window displays test results. Verifythe data is valid and save the test data.
VIEW DATA1. Start MCEGold and highlight the motor on the Site Navigator or WatchList.
2. Select the Test History icon on the toolbar.
3. Select EMAX from the drop down menu on the History Chart window.

EMAX POWER ANALYSIS PdMA MCEGold PRODUCT SUPPORT MANUAL
7-2 © 2008 PdMA Corporation REV. 0-04/08
4. Select the Power tab, located across the top of the History Chart.
INTRODUCTIONPower analysis utilizes three-phase simultaneous voltage and current measurements toperform power quality analysis.
Power analysis test results may include indications of voltage imbalances, voltage andcurrent spikes, excessive harmonic distortion, and stator faults.
High resistance connections result in voltage imbalances and excessive circulatingcurrents. These circulating currents cause increased winding temperatures, which lead toinsulation damage. By recording phase voltages and calculating a voltage imbalance,EMAX quantifies the severity of the high resistance connections by comparing the voltageimbalance to National Electrical Manufacturers Association (NEMA) standards.
Voltage and current spikes can be caused by a number of different events, includingstarting and stopping of plant loads; use of solid state switching equipment, such asvariable frequency drive units; and power distribution system configuration changes.Significant voltage spikes stress the motor’s insulation system, eventually resulting incatastrophic insulation failure. EMAX identifies these voltage spikes by calculating thecrest factor of the voltage and current signals.
Harmonics are primarily caused by the use of solid state switching equipment, such asvariable frequency drives and non-linear loads. The presence of these harmonics can resultin excessive heating of the insulation in the motor, the distribution system, and the driveitself. EMAX quantifies the severity of the harmonic distortion by comparing the harmonicvoltage factor to NEMA standards.
Stator faults can be caused by a number of things, including manufacturing defects,insulation breakdown over the life of the motor, excessive vibration, and rotor/statorcontact due to severe eccentricity or bearing failure. EMAX calculates an impedanceimbalance, which aids in isolating problems between the power distribution system andthe stator.
GETTING STARTEDWARNING:
FOLLOW ALL ELECTRICAL SAFETY PRECAUTIONS AND PROCEDURES FOR WORKING ON ENERGIZED EQUIPMENT.
Power analysis is performed with the motor circuit energized. To maximize theeffectiveness of EMAX, connect the voltage probes as far down in the power circuit aspossible, typically at the “T” lead connections leaving the motor control center.
There are four sizes of current probes and one size of voltage probe. The current probeseach have a different size and current rating. When hooking up the current probes to theDB 9 adaptor cable, ensure that the leads are connected to the correct numbered terminal.
The EMAX voltage test leads contain fuses and are color coded black (phase 1), blue(phase 2), red (phase 3), and green (ground). They connect in the space provided on theright side of the tester deck.

PdMA MCEGold PRODUCT SUPPORT MANUAL EMAX POWER ANALYSIS
REV. 0-04/08 © 2008 PdMA Corporation 7-3
When connecting the three clamp-on current probes to each phase of the three phasemotor, ensure that the arrows on the current probes point in the direction of the cablesleading to the motor.
TEST SELECTION WINDOWThe Test Selection window section is followed by the Test Window and Step-by-Steptesting procedures for AC assets and then DC assets.
Note: Selecting the EMAX Auto icon on the tool bar automatically runs the Rotor
Evaluation, Eccentricity, Power, and Demod tests using either the default or previouslysaved test settings. At the completion, after the test results are saved, the Fault ZoneAnalysis window displays.
To open the Test Selection Window highlight an asset on the Site Navigator or WatchListand click the Test Selection icon on the tool bar.
The Test Selection window is shown in Figure 7-1. The asset name is located on the titlebar to the right of the window name. The Test Selection window is used for both MCE andEMAX testing. Test Type is determined by selecting the desired test type tab.
The asset section tabs are found along the left side of the test selection area and aredependent on the asset type. Possible sections are Stator, Armature, and Field Circuits.
• For AC Induction assets, the only option is Stator.• For AC Synchronous assets, the only option is Stator.• For Wound Rotor assets, the only option is Stator.• For DC assets, options are Armature and Field Circuit.

EMAX POWER ANALYSIS PdMA MCEGold PRODUCT SUPPORT MANUAL
7-4 © 2008 PdMA Corporation REV. 0-04/08
Figure 7-1: EMAX Test Selection Window
Test ListThe top left section of the window contains a list of test selections for either MCE orEMAX, depending on asset type, test type and asset section tabs selected. When a test isselected, the name of the test is highlighted blue and the test set up area changes to valuesappropriate for the test selected. The test list possibilities for EMAX testing are:
• EMAX Auto (AC Induction, Wound Rotor, Synchronous)• Rotor Evaluation (AC Induction, Wound Rotor, Synchronous)• Eccentricity (AC Induction, Wound Rotor, Synchronous)• In-Rush/Start-Up (AC Induction, Wound Rotor, Synchronous)• Power (AC Induction, Wound Rotor, Synchronous)• Demod (AC Induction, Wound Rotor, Synchronous)• DC EMAX Auto (DC Armature Circuit)• DC Power (Armature and Field Circuits)• DC Current Analysis (DC Armature Circuit)• DC In-Rush/Start-Up (Armature and Field Circuits• Drive Input (DC Armature Circuit)
Asset InformationAsset Information is located on the right side. This area displays the Condition Code andnameplate information of the asset being tested. The information comes from the
PdMA MCEGold PRODUCT SUPPORT MANUAL EMAX POWER ANALYSIS
REV. 0-04/08 © 2008 PdMA Corporation 7-5
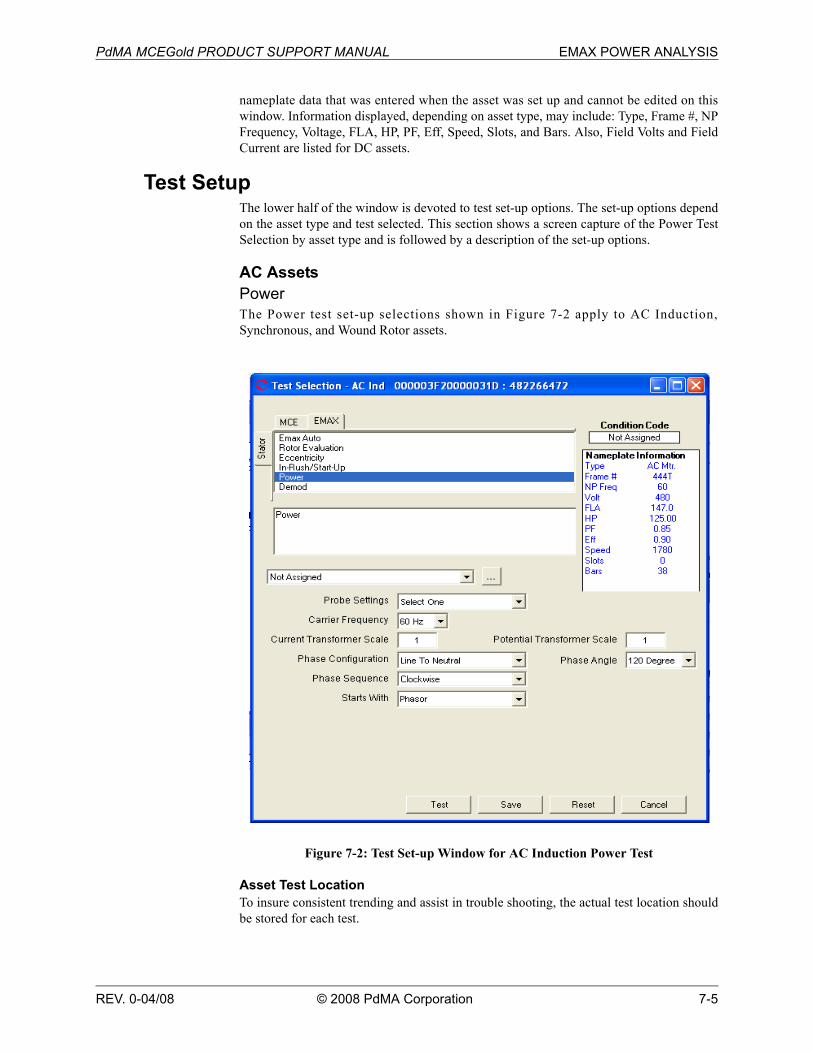
nameplate data that was entered when the asset was set up and cannot be edited on thiswindow. Information displayed, depending on asset type, may include: Type, Frame #, NPFrequency, Voltage, FLA, HP, PF, Eff, Speed, Slots, and Bars. Also, Field Volts and FieldCurrent are listed for DC assets.
Test SetupThe lower half of the window is devoted to test set-up options. The set-up options dependon the asset type and test selected. This section shows a screen capture of the Power TestSelection by asset type and is followed by a description of the set-up options.
AC AssetsPowerThe Power test set-up selections shown in Figure 7-2 apply to AC Induction,Synchronous, and Wound Rotor assets.
Figure 7-2: Test Set-up Window for AC Induction Power Test
Asset Test LocationTo insure consistent trending and assist in trouble shooting, the actual test location shouldbe stored for each test.

EMAX POWER ANALYSIS PdMA MCEGold PRODUCT SUPPORT MANUAL
7-6 © 2008 PdMA Corporation REV. 0-04/08
Asset Test Location selection is available for all asset types and tests.
The Asset Test Location default is Not Assigned. To assign a test location, click the downarrow and select from the list. If the location is not known, click the browse button .The Test Location Selection window opens displaying a test location graph for the type ofasset selected. See Figure 7-3. Use the graph to determine the location, then click thedown arrow in the Test Location text box, select the location from the list, and click OK.
Figure 7-3: Asset Test Location
Probe SettingsProbe Settings selection is available for all asset types andtests. This is a required field.
Select the Probe Settings from the drop down list. It may benecessary to use the scroll bar to see the complete list.
Carrier Frequency/Line FrequencyCarrier Frequency selection is available for all asset types and tests, exceptDC EMAX Auto, DC Current Analysis, and DC In-Rush/Start-Up. For thoseexceptions it is labeled Line Frequency.
Select the Carrier or Line Frequency from the drop down list. The choices are 60 Hz or 50Hz.
Current Transformer ScaleCurrent Transformer Scale is available for all assettypes and tests. Place the cursor in the text box,delete the value and enter the new currenttransformer scale.

PdMA MCEGold PRODUCT SUPPORT MANUAL EMAX POWER ANALYSIS
REV. 0-04/08 © 2008 PdMA Corporation 7-7
Potential Transformer ScaleThis setting is only available for the EMAX Autotest for AC and DC assets and for the Drive Inputtest for DC Assets.
Place the cursor in the text box, delete the value and enter the new current potentialtransformer scale.
Phase ConfigurationThis setting is only available for the EMAX Auto test for ACassets and Drive Input for DC assets.
Select the Phase configuration from the drop down list. Thechoices are Line-to-Neutral and Phase-to-Phase.
Phase AngleThis setting is only available for the EMAX Auto test for AC assets andDC Drive Input test when Line-to-Neutral is selected in the PhaseConfiguration setting.
Select the Phase Angle from the drop down list. The choices are 120degrees or Other.
Phase SequencePhase Sequence is only available for the EMAX Auto test forAC assets and DC Drive Input test for DC assets.
Select the Phase Sequence from the drop down list. Thechoices are Clockwise and Counter-Clockwise.
Starts WithStarts with selects the method of displaying thetest results.Additional graphs may be openedfrom the first one.
Test ButtonClick Test to advance to the test window.
Save ButtonClick Save when the test set-up selections are complete. This saves the settings as defaultvalues for that asset for subsequent tests, but is not required. If forget to save and clickTest, you will be asked if you want to save your changes.
Reset ButtonClick Reset to set values back to the pre-changed value. Note: If you have clicked theSave button they will not reset and it will be necessary to manually change them back.

EMAX POWER ANALYSIS PdMA MCEGold PRODUCT SUPPORT MANUAL
7-8 © 2008 PdMA Corporation REV. 0-04/08
Cancel ButtonClick Cancel to close the Test Selection window without saving setup changes orproceeding to the test window. You will be asked if you want to save test setup settings.
DC AssetsDC Power The Power test set-up selections shown in Figure 7-4 apply to DC assets. The DC Powertest may be run on both the Armature and Field Circuits.
Figure 7-4: Test Set-up Window for DC Power Test
Asset Test LocationTo insure consistent trending and assist in trouble shooting, the actual test location shouldbe stored for each test.
Asset Test Location selection is available for all asset types and tests.
The Asset Test Location default is Not Assigned. To assign a test location, click the downarrow and select from the list. If the location is not known, click the browse button .

PdMA MCEGold PRODUCT SUPPORT MANUAL EMAX POWER ANALYSIS
REV. 0-04/08 © 2008 PdMA Corporation 7-9
The Test Location Selection window opens displaying a test location graph for the type ofasset selected. See Figure 7-5. Use the graph to determine the location, then click thedown arrow in the Test Location text box, select the location from the list, and click OK.
Figure 7-5: DC Asset Test Location
Probe SettingsProbe Settings selection is available for all asset types andtests. This is a required field.
Select the Probe Settings from the drop down list. It may benecessary to use the scroll bar to see the complete list.
Carrier Frequency/Line FrequencyCarrier Frequency selection is available for all asset types and tests, exceptDC EMAX Auto, DC Current Analysis, and DC In-Rush/Start-Up. For thoseexceptions it is labeled Line Frequency.
Select the Carrier or Line Frequency from the drop down list. The choices are 60 Hz or 50Hz.

EMAX POWER ANALYSIS PdMA MCEGold PRODUCT SUPPORT MANUAL
7-10 © 2008 PdMA Corporation REV. 0-04/08
Current Transformer ScaleCurrent Transformer Scale is available for all assettypes and tests. Place the cursor in the text box,delete the value and enter the new currenttransformer scale.
Potential Transformer ScaleThis setting is only available for the EMAX Autotest for AC and DC assets and for the Drive Inputtest for DC Assets.
Starts WithStarts with selects the method of displaying thetest results.The default and only option is TimeDomain.
Test ButtonClick Test to advance to the test window.
Save ButtonClick Save when the test set-up selections are complete. This saves the settings as defaultvalues for that asset for subsequent tests, but is not required. If forget to save and clickTest, you will be asked if you want to save your changes.
Reset ButtonClick Reset to set values back to the pre-changed value. Note: If you have clicked theSave button they will not reset and it will be necessary to manually change them back.
Cancel ButtonClick Cancel to close the Test Selection window without saving setup changes orproceeding to the test window. You will be asked if you want to save test setup settings.
TEST WINDOWOnce the asset section and setup parameters are selected, you are ready to run the Powertest. This section describes step-by-step procedures by asset type and asset section. Testanalysis information begins on page 7-14.
AC Induction AssetsStep-by-Step Power1. Connect the EMAX Data Acquisition cable to the DAQ card in the laptop computer.
2. Start MCEGold.
3. Highlight the motor being tested in the Site Navigator or on a WatchList.
4. Select the Test Selection icon on the toolbar. The Test Selection window,
shown in Figure 7-6 opens

PdMA MCEGold PRODUCT SUPPORT MANUAL EMAX POWER ANALYSIS
REV. 0-04/08 © 2008 PdMA Corporation 7-11
Figure 7-6: Power Test Selection Window - AC Asset
5. Select the EMAX tab.
6. Select the Power test from the test list.
7. Make the test set-up selections and click Test.
8. If you have changed the test setup settings, you will be prompted to save the test setupsettings. Click Yes or No as desired.
9. At the end of testing the test results are displayed in the form chosen in the Starts Withsection of the Test Selection window. Additional test result graphs may be displayedby choosing View and the graph desired.
Note: You may have multiple windows open. They may be positioned by grabbing thetitle bar and dragging them to the desired location or using a command from theWindows menu on the menu bar.
10. To close the Test Results window select File, Close or click the Close button inthe upper right corner.

EMAX POWER ANALYSIS PdMA MCEGold PRODUCT SUPPORT MANUAL
7-12 © 2008 PdMA Corporation REV. 0-04/08
11. You will be asked if you want to save the test data. Click the appropriate button. Theaction is taken. If the test results have been saved they may be viewed using the TestHistory function on the toolbar.
AC Synchronous AssetsEMAX Power test for AC synchronous assets is the same as for AC Induction. See page 7-10 for step-by-step testing procedures.
AC Wound Rotor AssetsEMAX Power test for AC synchronous assets is the same as for AC Induction. See page 7-10 for step-by-step testing procedures.
DC AssetsArmature SectionStep-by-Step DC Power1. Connect the EMAX Data Acquisition cable to the DAQ card in the laptop computer.
2. Start MCEGold.
3. Highlight the motor being tested in the Site Navigator or on a WatchList.
4. Select the Test Selection icon on the toolbar. The Test Selection window,
shown in Figure 7-7 opens.

PdMA MCEGold PRODUCT SUPPORT MANUAL EMAX POWER ANALYSIS
REV. 0-04/08 © 2008 PdMA Corporation 7-13
Figure 7-7: Power Test Selection Window - DC Asset
5. Select the EMAX and Armature tabs.
6. Select the Power test from the test list.
7. Make the test set-up selections and click Test.
8. If you have changed the test setup settings, you will be prompted to save the test setupsettings. Click Yes or No as desired.
9. At the end of testing the DC Power Time Domain is displayed.
10. To close the Test Results window select File, Close or click the Close button inthe upper right corner.
11. You will be asked if you want to save the test data. Click the appropriate button. Theaction is taken. If the test results have been saved they may be viewed using the TestHistory function on the toolbar.

EMAX POWER ANALYSIS PdMA MCEGold PRODUCT SUPPORT MANUAL
7-14 © 2008 PdMA Corporation REV. 0-04/08
Field SectionStep-by-Step DC PowerThe testing procedure for the Field section is the same as for the Armature section. Withthe exception that you need to select the Field tab in step 5. See Page 7-13.
ANALYSISAC Assets
The AC EMAX Power test produces a single, user selected, Test Results window at the endof testing. The selection is made during the test set-up, which is discussed on page 7-7,Starts With.
Power Phasor
Figure 7-8: Test Results - Power Phasor
File MenuSave Test DataSelecting File, Save Test Data saves the test data to the Test History file. When the data issaved a message box informs you “Complete”. Click OK.
Note: Changes made to the appearance of the graph and data is not saved by using themenu save commands. To save the modified spectrum, use Print Preview. From thePrint Preview window you can use File, Export to PDF or Export to HTML.

PdMA MCEGold PRODUCT SUPPORT MANUAL EMAX POWER ANALYSIS
REV. 0-04/08 © 2008 PdMA Corporation 7-15
Save Data AsSelecting File, Save Data As allows you to save the test data to a location you choose. TheSave Data window opens, select a location and enter a file name, click Save. The file issaved as an .xls file type.
Note: Changes made to the appearance of the graph and data is not saved by using themenu save commands. To save the modified spectrum, use Print Preview. From thePrint Preview window you can use File, Export to PDF or Export to HTML.
Print PreviewSelecting File, Print Preview causes the Rotor Evaluation Spectrum to display as it willprint. To print, select the print icon, from the Print window verify the printer destination,and click OK. To close the Print Preview, select File, Close or click the close button inupper right corner.
PrintSelecting File, Print causes the Print window to open, verify the printer destination, andclick OK.
CloseSelecting File, Close closes the Test Results window. If you have not saved the test datayou will be asked if you want to save.
Close AllSelecting File, Close All closes all Test Results windows associated with the Eccentricitytest that are open. If you have not saved the test data you will be asked if you want to save.
EditCreate Message (Ctrl+M)Selecting Edit, Create Message opens the Compose Asset Message window. Use thisfunction to add a message/note to the asset record. The messages/notes can be read usingthe Message Center. Compose Asset Message and the Message Center are discussed inChapter 3- MCEGold, Message Center on page 3-4114
.
ViewThere are seven additional display choices for the Power test results. The initial display isselected during test setup in the Starts With section. You can view additional test resultswindows by selecting View and desired display. The initial window will remain open, theadditional window opens. It is possible to have all windows open at the same time. Youcan drag them to the desired position on your monitor or use the Related Windows menuto display them.
EMAX POWER ANALYSIS PdMA MCEGold PRODUCT SUPPORT MANUAL
7-16 © 2008 PdMA Corporation REV. 0-04/08
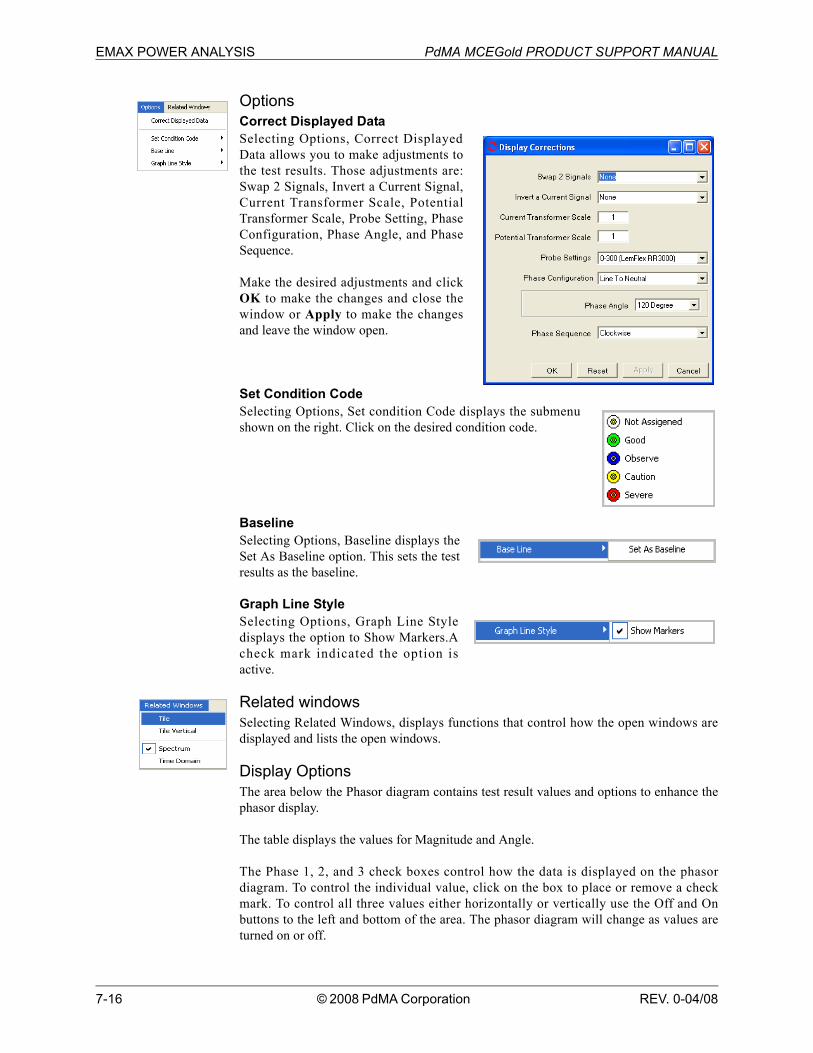
OptionsCorrect Displayed DataSelecting Options, Correct DisplayedData allows you to make adjustments tothe test results. Those adjustments are:Swap 2 Signals, Invert a Current Signal,Current Transformer Scale, PotentialTransformer Scale, Probe Setting, PhaseConfiguration, Phase Angle, and PhaseSequence.
Make the desired adjustments and clickOK to make the changes and close thewindow or Apply to make the changesand leave the window open.
Set Condition CodeSelecting Options, Set condition Code displays the submenushown on the right. Click on the desired condition code.
BaselineSelecting Options, Baseline displays theSet As Baseline option. This sets the testresults as the baseline.
Graph Line StyleSelecting Options, Graph Line Styledisplays the option to Show Markers.Acheck mark indicated the option isactive.
Related windowsSelecting Related Windows, displays functions that control how the open windows aredisplayed and lists the open windows.
Display OptionsThe area below the Phasor diagram contains test result values and options to enhance thephasor display.
The table displays the values for Magnitude and Angle.
The Phase 1, 2, and 3 check boxes control how the data is displayed on the phasordiagram. To control the individual value, click on the box to place or remove a checkmark. To control all three values either horizontally or vertically use the Off and Onbuttons to the left and bottom of the area. The phasor diagram will change as values areturned on or off.
PdMA MCEGold PRODUCT SUPPORT MANUAL EMAX POWER ANALYSIS
REV. 0-04/08 © 2008 PdMA Corporation 7-17
The Phase Sequence area displays the selected phase and the actual phase sequence. Whenthe selected and actual are the same the word Matched is displayed along with a smileyface. When they are not the same the word Unmatched is displayed along with a frowningface.
Review PhasorIn the phasor diagram the base data for voltage and current is represented in polar form.The default phasor diagram indicates the phase relationship between all three currents andvoltages. The purpose of the diagram is to verify proper test connections. Phase-to-phasevoltages may be added. The diagram represents 0-360 degrees of electrical rotation. The 0degree mark is the reference point for phase 1 voltage (V1); 120 degrees for phase 3voltage (V3); 240 degrees for phase 2 voltage (V2). These reference marks are located onthe outside of the circle and are based on a clockwise rotation.
Current lags voltage by an amount determined by the plant power factor. Therefore, phase1 current (I1) is in the 270-0 degrees quadrant. The reference points for current, I1, I2, andI3 are also shown on the outside of the circle.
Actual voltage and current signals are labeled on the signal line inside the circle.
This display shows a qualitative view of the magnitude difference of each of the signals.To see a quantitative measure of the magnitudes of the different signals, refer to the tablebelow the Phasor Diagram. This table lists magnitude and angle for all 3 phases of voltageand current and all 3 phase-to-phase voltage combinations. This table does not change asthe Phasor Diagram changes.
To the right of the table, are nine boxes which control the display of each phase of voltageand current, and combination of phase-to-phase voltage. A check mark in the boxindicates that phase display is turned on. Click in the box to toggle on and off. Click theOff or On buttons to control combination phase-to-phase display.
To the right of the Phase1, 2, and 3 area is the Phase Sequence box. There are threeindications in this box: Selected, Matched/Unmatched, and Actual.
• Selected Phase Sequence indicates the default setting for the motor. To changethis setting, select Options, Correct Displayed Data. Make your changes in theDisplay Corrections window and click OK.
• Actual Phase Sequence is the true relationship of voltages and currents beingtested. Clockwise is phase 1, phase 2, phase 3, left to right. Counter Clockwise iswhen two phases are reversed.
• When the Selected Phase Sequence and Actual Phase Sequence are the same, theword Matched is placed between the Selected and Actual indications with a“smiley” face. When they are not the same, the word Unmatched appears with a“frowning” face.

EMAX POWER ANALYSIS PdMA MCEGold PRODUCT SUPPORT MANUAL
7-18 © 2008 PdMA Corporation REV. 0-04/08
Power Time Domain
Figure 7-9: Test Results - Power Time Domain
The menu options are the same as for the Power Phasor Test Results. See page 7-14.
Display OptionsThe area below the Power Time Domain contains test result values and options to enhancethe Time Domain display.
MagnificationThe drop down list located to the lower right of the test results graphallows you to increase or decrease the magnification of the graph.Depending on the magnification it may be necessary to use the sliderto view the complete results
TableThe table displays the values for RMS Amps.
Phase ControlThe Phase 1, 2, and 3 check boxes control how the data is displayed on the Time Domain.To control the individual value, click on the box to place or remove a check mark. Tocontrol all three values either horizontally or vertically use the Off and On buttons to theright and bottom of the area. The phasor diagram will change as values are turned on oroff.
PdMA MCEGold PRODUCT SUPPORT MANUAL EMAX POWER ANALYSIS
REV. 0-04/08 © 2008 PdMA Corporation 7-19
Review Time DomainThe Voltage and Current Time Domain display is reviewed to verify signal validity, properphase sequence, and general condition. When reviewing the display, ensure all threevoltage and current signals are visible.
The default display shows six waveforms - voltage and current for phases 1, 2, and 3.Additionally, phase-to-phase voltages for 1-2, 2-3, and 3-1 can be displayed.
The current scale is in amps (shown vertically on the left side of the display) and thevoltage scale is in volts (shown vertically on the right). The voltage and current scaleschange as necessary to display all of the graphs. Both are referenced to time in seconds(shown horizontally in the middle).
The Voltage and Current Time Domain display shows if any of the following occurred,which invalidates the test data:
• Improper range selected on current probes• Improper probe connection• Probes not energized during the test
Verify that the proper ranges were selected on the current probes by looking at the displayof the current signals. Flat peaks at the tops of the sine waves indicates that clippingoccurred. This happens when the selected range is too low and the current signalsoverdrive the probes.
Verify that the current probes were energized and voltage and current probes wereconnected properly. If a phase has a very low amplitude and is extremely erratic, theprobes could have been improperly connected or not turned on. An erratic signal can becaused by excessive noise.
Change the zoom factor on the Scale drop-down list box to Full to confirm that the entiresignal capture is valid. Analyze the general condition of the voltage and currentwaveforms by observing the sinewaves for peak to peak variations and non-sinusoidalwaveforms.
Voltage and current imbalances cause variations in the peak to peak values. Non-sinusoidal waveforms result from high frequency harmonics riding on the fundamentalcarrier frequency.
For induction motors verify proper phase sequence by confirming that phase 1 current lagsphase 1 voltage. This is shown on the Voltage and Current vs. Time display as the blackcurrent crossing the x-axis shortly after the black voltage. Phases 2 (blue) and 3 (red)should look the same with a proper phase sequence.
A second method of verifying the phase sequences are matched is by viewing the PhasorDiagram. Confirm the selected and actual voltage phase sequences are matched as seen bythe smiley face. Confirm the selected and actual current phase sequences are matched asseen by the selected I1, I2, and I3 on the outside of the Phasor Diagram lining up in thevicinity with the actual I1, I2, and I3 on the inside.

EMAX POWER ANALYSIS PdMA MCEGold PRODUCT SUPPORT MANUAL
7-20 © 2008 PdMA Corporation REV. 0-04/08
Power Voltage and Current FFTThe Power Voltage and Current FFT graph indicates the effect of the voltage and currentrelationship on the power signal.
Figure 7-10: Test Results - Power Voltage and Current FFT
The menu options are the same as for the Power Phasor Test Results. See page 7-14.
Display OptionsThe area below the test results graph contains options to enhance the test data display.
MagnificationThe drop down list located to the lower right of the test results graphallows you to increase or decrease the magnification of the graph.Depending on the magnification it may be necessary to use the sliderto view the complete results
Linear/Decibel (DB)The default display for the graph is decibel (dB), which shows the current (dB) andFrequency (Hz). Selecting Linear changes the graph to show the current (A) andFrequency (Hz). The values in the Test Results Table change when a change is made to thelinear/decibel display.
+ TablesClicking the +Tables button opens the Add/Edit Cursor Table window. Enter a name in thetext box and click OK. A column is added to the display. When the cursor is moved toanother location you may add an additional column.

PdMA MCEGold PRODUCT SUPPORT MANUAL EMAX POWER ANALYSIS
REV. 0-04/08 © 2008 PdMA Corporation 7-21
Clear TableClicking the Clear Table button removes the column/s added by clicking +Tables.
+ LabelsClicking + Labels places a label on the cursor location on the graph. Each time the cursoris moved, click + Labels to place a label on the new location.
Clear LabelClicking Clear Label removes the labels placed on the graph by clicking + Labels.
+ BothClicking + Both adds a column on the table and places a label on the graph.
Clear BothClicking Clear Both removes the column/s and label/s on the graph. It does not return thecursor to the original location.
ToleranceTolerance is a drop down list of values used to limit the cursor movement to within arange.
Arrows
Use the arrow buttons to move the active cursor right or left one increment at a time.
Find PeakWhen the cursor has been moved, click the Find Peak button to cause the cursor to beplaced exactly on the peak. The values will change in the appropriate table below thegraph.
Show Vertical LineA check mark in the show Vertical Line box causes a vertical line/cursor to display on thegraph. The vertical line must show for the + Tables, + Labels, +Both, Find Peak, Start andEnd buttons to be active.
Test Value TableThe cursor position along with the voltages are displayed in the test value table. Thevalues change depending on the selection of linear or decibel display.
Phase1, 2 and 3The Phase 1, 2, and 3 check boxes control how the data is displayed on the Power VoltageCurrent diagram. To control the individual value, click on the box to place or remove acheck mark. To control all three values either horizontally or vertically use the Off and Onbuttons to the right and bottom of the area. The Power Voltage Current diagram willchange as values are turned on or off.
Review Power Voltage and Current FFTThe default display shows six waveforms - voltage and current for phases 1, 2, and 3.Additionally, phase-to-phase voltages for 1-2, 2-3, and 3-1 can be displayed.
The current scale is in dB (shown vertically on the left side of the display) and the voltagescale is in volts (shown vertically on the right). The voltage and current scales change as

EMAX POWER ANALYSIS PdMA MCEGold PRODUCT SUPPORT MANUAL
7-22 © 2008 PdMA Corporation REV. 0-04/08
necessary to display the entire graph. Both are referenced to frequency in hertz (shownhorizontally).
Below the graph is a table for the frequency, current, and voltage values for each of theparameters. Vertical and horizontal scroll bars are included if needed.
Click anywhere in the graph to show the vertical bar cursor. This causes the values of thedisplayed parameters at the point where the cursor is located to be displayed in the tablebelow the graph.
The voltage and current FFT graph is used to compare the voltage and current frequencypeaks to isolate the source of possible problems to either the power circuit or the motor.Peaks are expected at line frequency and its harmonics for both voltage and current.
If a spike occurs on the current graph that is non-harmonic and does not have a voltagespike associated with it, the probable cause of the spike is the motor. This may be due toeccentricity, bearing defects, mechanical problems, etc.
Power Voltage and Current HarmonicsThe Power Voltage and Current Harmonics graph indicates how the product of voltage andcurrent affects the overall power signal.
Figure 7-11: Test Results - Power Voltage and Current Harmonics
The menu options are the same as for the Power Phasor Test Results, except under Viewthere is no Graph Line Style option. See page 7-14.
Display OptionsThe area below the test results graph contains options to enhance the test data display.

PdMA MCEGold PRODUCT SUPPORT MANUAL EMAX POWER ANALYSIS
REV. 0-04/08 © 2008 PdMA Corporation 7-23
MagnificationThe drop down list located to the lower right of the test results graphallows you to increase or decrease the magnification of the graph.Depending on the magnification it may be necessary to use the sliderto view the complete results.
Phase1, 2 and 3The Phase 1, 2, and 3 check boxes control how the data is displayed on the Power VoltageCurrent diagram. To control the individual value, click on the box to place or remove acheck mark. To control all three values either horizontally or vertically use the Off and Onbuttons to the right and bottom of the area. The Power Voltage Current diagram willchange as values are turned on or off.
Linear/Decibel (DB)The default display for the graph is Linear which shows the voltage and current % of thefundamental at the harmonic number. Selecting Decibel (dB) shows the voltage andcurrent (dB). The values in the Test Results Table change when a change is made to thelinear/decibel display.
Review Power Voltage and Current HarmonicsHarmonics are measured to determine the influence of nonlinear loads on the powersystem. Switching devices, such as computer and variable speed drives, are examples ofnonlinear loads.
Normally, odd numbered harmonics are of the most concern. Specifically, the fifthharmonic tends to be a primary indicator of variable speed drive influence on the powerlines.
Although even numbered harmonics do not oppose the torque in a motor, they stillincrease the load on the system and can be detrimental if they are present in largequantities.
In general, the THD of the voltage signal should be less than 5%. Problems resulting fromexcessive harmonics include exceeding transformer limits and overheating electricmotors. If excessive voltage harmonics are present, EMAX indicates on the Results pagethe recommended horsepower derating NEMA standards.
The default display shows six graphical representations, voltage and current for phases 1,2, and 3 for each harmonic. Additionally, phase-to-phase voltages for 1-2, 2-3, and 3-1 canbe displayed.
The voltage and current scales are in percent of fundamental harmonic (both shownvertically on the left side of the display). Both are referenced to the harmonic number(shown horizontally).
Below the graph is a scroll bar which controls the display horizontally. This permitsviewing the display out to the 50th harmonic.
Power InstantaneousThe Power Instantaneous graph indicates the effect of the voltage and current relationshipon the power signal.

EMAX POWER ANALYSIS PdMA MCEGold PRODUCT SUPPORT MANUAL
7-24 © 2008 PdMA Corporation REV. 0-04/08
Figure 7-12: Test Results - Power Instantaneous
The menu options are the same as for the Power Phasor Test Results. See page 7-14.
Display OptionsThe area below the test results graph contains options to enhance the test data display.
MagnificationThe drop down list located to the lower right of the test results graphallows you to increase or decrease the magnification of the graph.Depending on the magnification it may be necessary to use the sliderto view the complete results.
Phase 1, 2, and 3The Phase 1, 2, and 3 check boxes control how the data is displayed on the PowerInstantaneous diagram. To control the individual display, click on the box to place orremove a check mark. To control all three values use the Off and On buttons to the right ofthe check boxes. The Power Instantaneous diagram will change as phases are turned on oroff.
Review Power InstantaneousThe Instantaneous Power graph indicates the effect of the voltage and current relationshipon the power signal. It also gives a visual representation of the difference in real andreactive power being sent to the motor. This graph is currently included for illustrationonly and has no influence on signal analysis.
The default display shows three graphical representations - power for phase 1, 2, and 3.
The power scale is in kilowatts (shown vertically on the left side of the display). It changesas necessary to display all of the graph. Power is referenced to time (shown horizontally).
PdMA MCEGold PRODUCT SUPPORT MANUAL EMAX POWER ANALYSIS
REV. 0-04/08 © 2008 PdMA Corporation 7-25
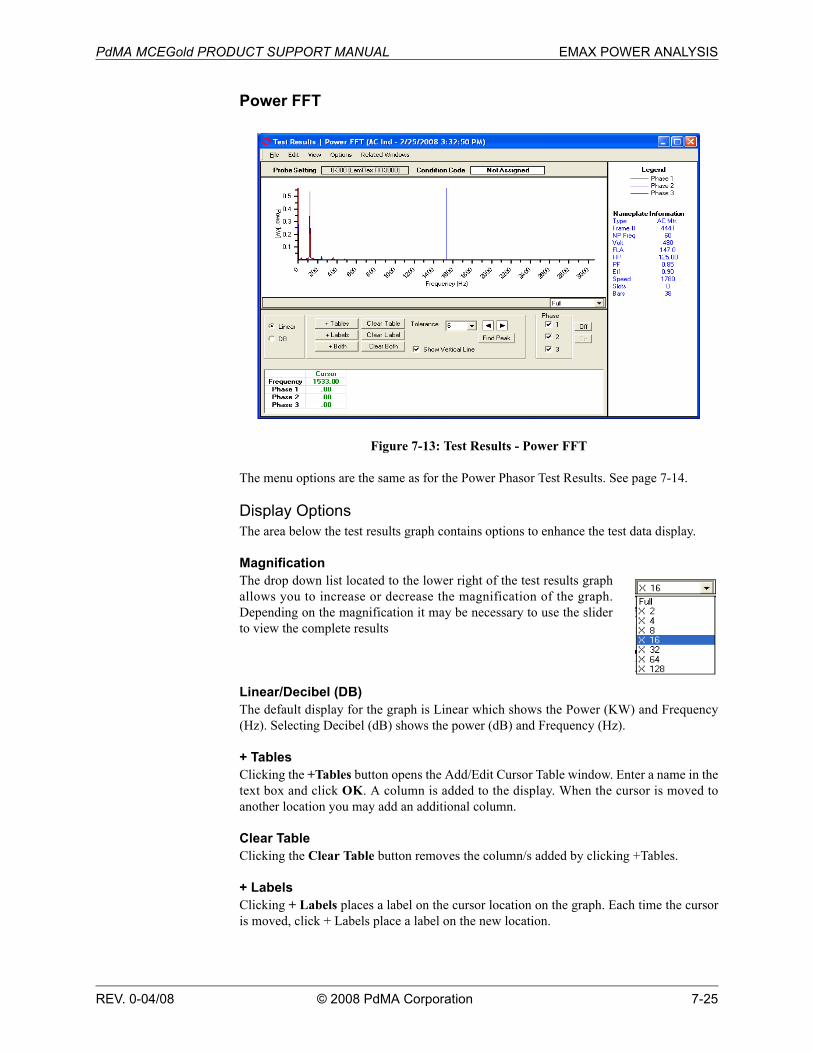
Power FFT
Figure 7-13: Test Results - Power FFT
The menu options are the same as for the Power Phasor Test Results. See page 7-14.
Display OptionsThe area below the test results graph contains options to enhance the test data display.
MagnificationThe drop down list located to the lower right of the test results graphallows you to increase or decrease the magnification of the graph.Depending on the magnification it may be necessary to use the sliderto view the complete results
Linear/Decibel (DB)The default display for the graph is Linear which shows the Power (KW) and Frequency(Hz). Selecting Decibel (dB) shows the power (dB) and Frequency (Hz).
+ TablesClicking the +Tables button opens the Add/Edit Cursor Table window. Enter a name in thetext box and click OK. A column is added to the display. When the cursor is moved toanother location you may add an additional column.
Clear TableClicking the Clear Table button removes the column/s added by clicking +Tables.
+ LabelsClicking + Labels places a label on the cursor location on the graph. Each time the cursoris moved, click + Labels place a label on the new location.

EMAX POWER ANALYSIS PdMA MCEGold PRODUCT SUPPORT MANUAL
7-26 © 2008 PdMA Corporation REV. 0-04/08
Clear LabelClicking Clear Label removes the labels placed on the graph by clicking + Labels.
+ BothClicking + Both adds a column on the table and places a label on the graph.
Clear BothClicking Clear Both removes the column/s and label/s on the graph. It does not return thecursor to the original location.
ToleranceTolerance is a drop down list of values used to limit the cursor movement to within arange.
Arrows
Use the arrow buttons to move the active cursor right or left one increment at a time.
Find PeakWhen the cursor has been moved, click the Find Peak button to cause the cursor to beplaced exactly on the peak. The values will change in the appropriate table below thegraph.
Show Vertical LineA check mark in the show Vertical Line box causes a vertical line/cursor to display on thegraph. The vertical line must show for the + Tables, + Labels, +Both, and Find Peakbuttons to be active.
Phase1, 2 and 3The Phase 1, 2, and 3 check boxes control how the data is displayed on the Power FFTdiagram. To control the individual value, click on the box to place or remove a checkmark. To control all three values use the Off and On buttons to the right of the area. ThePower FFT diagram and the test value table will change as values are turned on or off.
Test Value TableThe cursor position along with the voltages are displayed in the test value table. Thevalues change depending on the selection of linear or decibel display.
Review Power FFTThe Power FFT graph indicates the effect of the voltage and current relationship on theindividual power signal frequencies. This graph is currently included for illustration onlyand has no influence on signal analysis.
The decibel display shows three waveforms - power for phases 1, 2, and 3.
The power scale is in decibels (shown vertically on the left side of the display). It changesas necessary to display all of the graph. Power is referenced to frequency in hertz (shownhorizontally).
Below the graph are the frequency and power values for each of the three parameters.Click anywhere in the graph to show the vertical bar cursor. When you do this, the values
PdMA MCEGold PRODUCT SUPPORT MANUAL EMAX POWER ANALYSIS
REV. 0-04/08 © 2008 PdMA Corporation 7-27
of the displayed parameters at the point where the cursor is located are displayed in thevalue boxes under the graph.
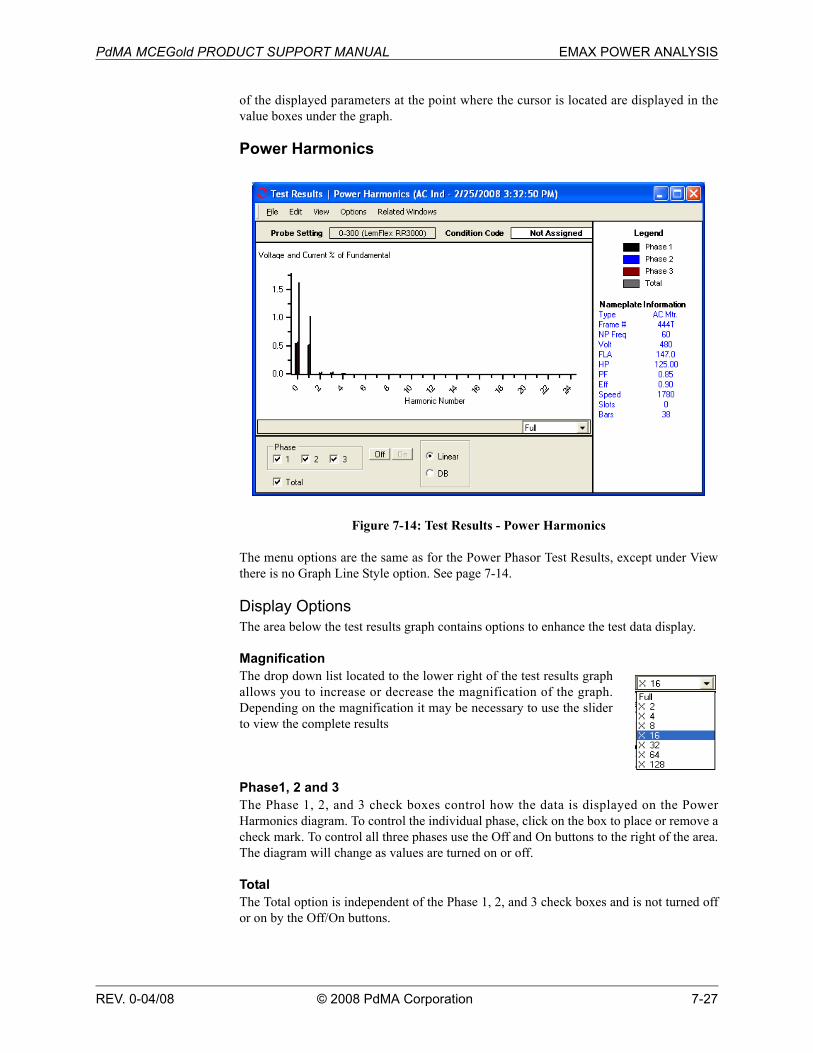
Power Harmonics
Figure 7-14: Test Results - Power Harmonics
The menu options are the same as for the Power Phasor Test Results, except under Viewthere is no Graph Line Style option. See page 7-14.
Display OptionsThe area below the test results graph contains options to enhance the test data display.
MagnificationThe drop down list located to the lower right of the test results graphallows you to increase or decrease the magnification of the graph.Depending on the magnification it may be necessary to use the sliderto view the complete results
Phase1, 2 and 3The Phase 1, 2, and 3 check boxes control how the data is displayed on the PowerHarmonics diagram. To control the individual phase, click on the box to place or remove acheck mark. To control all three phases use the Off and On buttons to the right of the area.The diagram will change as values are turned on or off.
TotalThe Total option is independent of the Phase 1, 2, and 3 check boxes and is not turned offor on by the Off/On buttons.

EMAX POWER ANALYSIS PdMA MCEGold PRODUCT SUPPORT MANUAL
7-28 © 2008 PdMA Corporation REV. 0-04/08
Linear/Decibel (DB)The default display for the graph is Linear which shows the Voltage and Current % ofFundamental. Selecting Decibel (dB) shows the Voltage and Current (dB).
Review Power HarmonicsThe Power Harmonics graph indicates how the product of voltage and current affects theoverall power signal. This graph is currently included for illustration only and has noinfluence on signal analysis.
The default display shows four graphical representations of power for phases 1, 2, 3, andthe total for each harmonic.
The power scale is in kilowatts (shown vertically on the left side of the display). It changesas necessary to display all of the graph. Power is referenced to the harmonic number(shown horizontally).
At the bottom of the window is a scroll bar which controls the display horizontally. Thispermits viewing the display out to the 25th harmonic.
Power ResultsThe Power Results page displays detailed numeric test data and nameplate information. Itis designed to provide a one page summary of an individual test, including warningconditions (caution and alarms). All items on the Results page are included in the TestHistory. No changes can be made on this page.
Figure 7-15: Test Results - Power Results

PdMA MCEGold PRODUCT SUPPORT MANUAL EMAX POWER ANALYSIS
REV. 0-04/08 © 2008 PdMA Corporation 7-29
File MenuSave Test DataSelecting File, Save Test Data saves the test data to the Test History file. When the data issaved a message box informs you “Complete”. Click OK.
Note: Changes made to the appearance of the graph and data is not saved by using themenu save commands. To save the modified spectrum, use Print Preview. From thePrint Preview window you can use File, Export to PDF or Export to HTML.
Print PreviewSelecting File, Print Preview causes the Test Results to display as it will print. To print,select the print icon, from the Print window verify the printer destination, and click OK.To close the Print Preview, select File, Close or click the close button in upper rightcorner.
PrintSelecting File, Print causes the Print window to open, verify the printer destination, andclick OK.
CloseSelecting File, Close closes the Test Results window. If you have not saved the test datayou will be asked if you want to save.
Close AllSelecting File, Close All closes all Test Results windows associated with the Power testthat are open. If you have not saved the test data you will be asked if you want to save.
EditCopyThe Edit, Copy function is used to copy the Results page and paste it in a Detailed Report.
Create Message (Ctrl+M)Selecting Edit, Create Message opens the Compose Asset Message window. Use thisfunction to add a message/note to the asset record. The messages/notes can be read usingthe Message Center. Compose Asset Message and the Message Center are discussed inChapter 3- MCEGold, Message Center on page 3-43.
ViewThere are seven additional display choices for the Power test results. The initial display isselected during test setup in the Starts With section. You can view additional test resultswindows by selecting View and desired display. The initial window will remain open, theadditional window opens. It is possible to have all windows open at the same time. Youcan drag them to the desired position on your monitor or use the Related Windows menuto display them.
OptionsRecalculate Power ResultsRecalculate Power Results is used when changes have been made to the raw data and/ornameplate information. Selecting this option after changes have been made updates thePower Results display.

EMAX POWER ANALYSIS PdMA MCEGold PRODUCT SUPPORT MANUAL
7-30 © 2008 PdMA Corporation REV. 0-04/08
Set Condition CodeSelecting Options, Set condition Code displays the submenushown on the right. Click on the desired condition code.
BaselineSelecting Options, Baseline displays theSet As Baseline option. This set the testresults as the baseline.
Related WindowsSelecting Related Windows, displays functions that control how the open windows aredisplayed and lists the open windows.
Review Power ResultsPower Results is designed to provide a one page summary of an individual test, includingwarning conditions (caution and alarms). All items on the Results page are included in theHistory Chart.
There are two sections to the Results Page window. On the right is the Nameplateinformation. The larger section on the left window contains the test results data.
VoltageThe top three lines have information for phase-to-phase combinations 1-2, 2-3, and 3-1.
• Fund RMS (in volts) is the RMS value for the fundamental voltage signal.• Tot RMS voltage (in volts) is the RMS value for the total voltage signal. This
includes noise and other non-fundamental components.• CF (crest factor) is the ratio between peak and RMS phase-to-phase voltages.• THD (total harmonic distortion; in percent) indicates the RMS value of the signal
with the fundamental component removed, expressed as a percentage of the totalsignal’s RMS value.
Average is the average of the three phase-to-phase voltages (in volts).
% Imbalance is the highest measured deviation from the average of the three phase-to-phase voltages, divided by the average voltage, in percent.
% NEMA Derating indicates the recommended percentage of full load for safe operationof the motor based on the horsepower derating factor recommended by the NationalElectrical Manufacturer’s Association standards. This derating factor is based on thepercentage of voltage imbalance.
HVF is a ratio between the fundamental and non-fundamental voltage signals.
% NEMA Derating indicates the recommended percentage of full load for safe operationof the motor based on the horsepower derating factor recommended by the NEMAstandards. The derating factor is based on HVF.
Next is the information for phase-to-neutral for phases 1, 2, and 3.

PdMA MCEGold PRODUCT SUPPORT MANUAL EMAX POWER ANALYSIS
REV. 0-04/08 © 2008 PdMA Corporation 7-31
• Fund RMS (in volts) is the RMS value for the fundamental voltage signal.• Tot RMS voltage (in volts) is the RMS value for the total voltage signal. This
includes noise and other non-fundamental components.• CF (crest factor) is the ratio between peak and RMS phase-to-phase voltages.• THD (total harmonic distortion; in percent) indicates the RMS value of the signal
with the fundamental component removed, expressed as a percentage of the totalsignal’s RMS value.
Average is the average of the three phase-to-neutral voltages (in volts).
% Imbalance is the highest measured deviation from the average of the three phase-to-neutral voltages, divided by the average voltage, in percent.
CurrentThe top three lines have information for current for phases 1, 2, and 3.
• Fund RMS (in amps) is the RMS value for the fundamental current signal.• Tot RMS current (in amps) is the RMS value for the total current signal. This
includes noise and other non-fundamental components.• CF (crest factor) is the ratio between peak and RMS currents.• THD (total harmonic distortion; in percent) indicates the RMS value of the signal
with the fundamental component removed, expressed as a percentage of the totalsignal’s RMS value.
Average is the average of the three currents (in amps).
% FLA is the percentage of the nameplate full load amps (FLA) at which the motor isrunning.
% Imbalance is the highest measured deviation from the average of the three phasecurrents, divided by the average current, in percent.
ImpedanceThere are real and magnitude impedance values (in ohms) for all three phases, along withthe angle between each. Real indicates the real component of the impedance triangle. Thisdata is used in the calculations for Impedance Imbalance.Magnitude indicates the apparentcomponent of the impedance triangle.
Impedance Imbalance (in percent) is based on voltage and current, and the phase anglebetween them. It is used for stator analysis.
PowerThe Power data table displays kilowatts (kW), kilovolt-amps-reactive (kVAR), kilovolt-amps (KVA), and power factor (PF) values for the total signal of each of the three phases.
The Total row contains the sums of kW, kVAR, and KVA and the average power factorrespectively.
Power sequence contains the sums of each phase for kW, kVAR, and KVA and the averagePF. These values are based on the fundamental signal only

EMAX POWER ANALYSIS PdMA MCEGold PRODUCT SUPPORT MANUAL
7-32 © 2008 PdMA Corporation REV. 0-04/08
EfficiencyEfficiency Calculation is the calculated efficiency of the motor (in percent) at the time ofthe test.
HP Output, kW Output, and Torque Output are the calculated outputs of the motor at thetime of the test.
SequenceThe Sequence data table displays positive, negative, and zero sequence values for phase-to-phase voltage (in volts), phase-to-neutral voltage (in volts), and current (in amps).
• Positive sequence voltage and current produce aiding torque in the motor.
• Negative sequence voltage and current produce opposing torque in the motor.
• Zero sequence voltage and current produce no affect on torque in the motor. These aremonitored for indications of insulation degradation.
Review Test HistoryTo review the Test History, highlight the asset in the Site Navigator or WatchList and click
the Test History icon on the toolbar. In the Test History window select EMAX from
the drop down list and the Power tab. Locate the test by using the scroll bar at the bottomof the window. Figure 7-16 shows the Test History window for an AC Induction asset,EMAX Power test. Use the Scroll Bars to locate the desired test results. The Test Historywindow menus and functions are discussed in Chapter 3 - MCEGold, page 3-28.
Figure 7-16: Test History - Power

PdMA MCEGold PRODUCT SUPPORT MANUAL EMAX POWER ANALYSIS
REV. 0-04/08 © 2008 PdMA Corporation 7-33
There are a number of parameters in the Test History which have Caution and AlarmWarning Levels associated with them. First, look at the parameters with Caution andAlarm setpoints. Then, look at the other parameters which do not have warning levels.
To assist in the analysis process, graphing may be used for visual trending on motors withmore than one set of test results.
Parameters with Warning LevelsVoltage Line-to-Line is monitored to indicate if voltage on any phase changes by a givenpercentage above or below nameplate voltage.
• For example, bad transformer output, single-phasing, or high resistanceconnections can cause motor operation outside design parameters, resulting ininsulation degradation. High voltages cause increased stress to the insulation.Low voltages cause increased currents and overheating of the insulation.
Voltage Imbalance is monitored to indicate if the voltage on any phase deviates by agiven percentage from the average voltage.
• High resistance connections in the power circuit or inside the motor can causevoltage imbalances, resulting in high negative sequence currents and overheatingof the insulation.
Voltage Crest Factor is monitored to indicate if any voltage spikes deviate from the RMSvoltage value by a given amount.
• Switching devices, VFDs, and load transients are all causes of voltagefluctuations. Severe voltage spikes cause stress to the insulation system.
Voltage THD is monitored to indicate if the power signal distortion exceeds a givenvalue.
• VFDs, single-phase loads, and computers are all causes of harmonic distortion, andcan result in overheating of the winding insulation.
Harmonic Factor (Harmonic Voltage Factor) is also monitored to indicate if the powersignal distortion exceeds a given value.
Current RMS is monitored to indicate if current on any phase changes by a givenpercentage above or below nameplate FLA.
• Improper motor applications or excessive loading can result in excessive currentsand overheating of the insulation.
Current Imbalance is monitored to indicate if current on any phase deviates by a givenpercentage from the average current.
• High resistance connections in the power circuit or inside the motor can result incurrent imbalances and overheating of the insulation.
Current Crest Factor is monitored to indicate if current spikes deviate from the RMScurrent value by a given amount.

EMAX POWER ANALYSIS PdMA MCEGold PRODUCT SUPPORT MANUAL
7-34 © 2008 PdMA Corporation REV. 0-04/08
• Switching devices, VFDs, and load transients are all causes of currentfluctuations. Severe current spikes cause stress to the insulation system.
Current THD is monitored to indicate if the power signal distortion exceeds a givenvalue.
• VFDs, single-phase loads, and computers are all causes of harmonic distortion,and result in overheating of the winding insulation.
Self Impedance Imbalance is monitored to indicate if impedance on any phase deviatesby a given percentage from the average impedance.
• Stator winding defects cause inconsistent variations in the phase relationshipbetween voltage and current in each phase leading to motor failure.
DC AssetsThe DC EMAX Power test produces a DC Power Time Domain at the end of testing. ThePower Domain window is the same for the Armature and Field sections. See Figure 7-17.
Power
Figure 7-17: DC Power Armature Section Results
File MenuSave Test DataSelecting File, Save Test Data saves the test data to the Test History file. When the data issaved a message box informs you “Complete”. Click OK.

PdMA MCEGold PRODUCT SUPPORT MANUAL EMAX POWER ANALYSIS
REV. 0-04/08 © 2008 PdMA Corporation 7-35
Note: Changes made to the appearance of the graph and data is not saved by using themenu save commands. To save the modified spectrum, use Print Preview. From thePrint Preview window you can use File, Export to PDF or Export to HTML.
Save Data AsSelecting File, Save Data As allows you to save the test data to a location you choose. TheSave Data window opens, select a location and enter a file name, click Save. The file issaved as an .xls file type.
Note: Changes made to the appearance of the graph and data is not saved by using themenu save commands. To save the modified spectrum, use Print Preview. From thePrint Preview window you can use File, Export to PDF or Export to HTML.
Print PreviewSelecting File, Print Preview causes the Rotor Evaluation Spectrum to display as it willprint. To print, select the print icon, from the Print window verify the printer destination,and click OK. To close the Print Preview, select File, Close or click the close button inupper right corner.
PrintSelecting File, Print causes the Print window to open, verify the printer destination, andclick OK.
CloseSelecting File, Close closes the Test Results window. If you have not saved the test datayou will be asked if you want to save.
Close AllSelecting File, Close All closes all Test Results windows associated with the Eccentricitytest that are open. If you have not saved the test data you will be asked if you want to save.
EditCreate Message (Ctrl+M)Selecting Edit, Create Message opens the Compose Asset Message window. Use thisfunction to add a message/note to the asset record. The messages/notes can be read usingthe Message Center. Compose Asset Message and the Message Center are discussed inChapter 3- MCEGold, Message Center on page 3-41.
OptionsCorrect Displayed DataSelecting Options, Correct displayed Dataallows you to Swap 2 Signals, change theCurrent and Potential Transformer Scaleand change the Probe Settings.
Make the desired adjustments and clickOK to make the changes and close theDisplay Corrections window or Apply tomake the changes and leave the windowopen.

EMAX POWER ANALYSIS PdMA MCEGold PRODUCT SUPPORT MANUAL
7-36 © 2008 PdMA Corporation REV. 0-04/08
Set Condition CodeSelecting Options, Set condition Code displays the submenushown on the right. Click on the desired condition code.
BaselineSelecting Options, Baseline displays theSet As Baseline option. This sets the testresults as the baseline.
Graph Line Styleelecting Options, Graph Line Style displays the sub menucontaining options to Show Patterns and Show Markers on thetest results graph. A check mark indicates the option is active.
Display OptionsMagnificationThe drop down list located to the lower right of the test results graphallows you to increase or decrease the magnification of the graph.
Phase 1 and Phase 2The Phase 1 and Phase 2 areas of the Time Domainwindow are used to add or remove lines on thegraph. They may be controlled individually usingthe check boxes or in combination using the Off/On buttons.
Review Power Time DomainTo verify the signal capture is valid, review the Time Domain display. When reviewing thedisplay, ensure all three current signals are visible.
The Time Domain display shows if any of the following occurred, which invalidates thetest data:
• Improper probe selection• Improper range selected on current probes• Improper probe connection• Probes not energized during testing• Motor speed not constant during testing• Signal failure at the end of the test
Verify that the proper range was selected on the current probes by looking at the display ofthe three current signals. Flat peaks at the tops of the sine waves indicate that clipping

PdMA MCEGold PRODUCT SUPPORT MANUAL EMAX POWER ANALYSIS
REV. 0-04/08 © 2008 PdMA Corporation 7-37
occurred. This happens when the range on the probes is too low and the current signalsoverdrive the probes.
Verify that the probes were energized and connected properly. If a phase has a very lowamplitude and is extremely erratic, the probe could have been improperly connected or notturned on. An erratic signal can also be caused by noise.
Verify that the motor speed was constant during the entire test. Varying peak-to-peakvalues of current are an indication of load changes. Change the scale of the display to fullby selecting full from the scale drop-down list box. Look at the entire waveform andverify that there were no peak-to-peak variations throughout the entire display. The graphmay be scrolled by using the arrow keys on the keyboard or the slide bar located above thegraph.
Review the Test HistoryTo review the Test History, highlight the asset in the Site Navigator or WatchList and click
the Test History icon on the toolbar. In the Test History window select EMAX from
the drop down list and the Power tab. Locate the test by using the scroll bar at the bottomof the window. Figure 7-17 shows the Test History window for an DC asset, EMAX Powertest. The Test History window menus and functions are discussed in Chapter 3 -MCEGold, page 3-28.
Figure 7-18: Test History - EMAX Power DC Asset
EMAX POWER ANALYSIS PdMA MCEGold PRODUCT SUPPORT MANUAL
7-38 © 2008 PdMA Corporation REV. 0-04/08
The top four lines on the Test History show the Date and Time the test was taken, TestLocation, and User (person performing the test). Next the Potential Transformer, CurrentTransformer, and Carrier Frequency information is displayed. These are entered during thetest setup.
The Condition Code, Number of Tests that have been performed on the motor, andNameplate information is displayed along the right side of the window.
There are a number of parameters in the Test History which have Caution and AlarmWarning Levels associated with them. First, look at the parameters with Caution andAlarm setpoints. Then, look at the other parameters which do not have warning levels.
Parameters with Warning Levels Voltage (THD) is taken on the 3-phase line side of an energized DC motor drive. It is theRMS value of the voltage signal with the line frequency removed. A perfect 60 Hz sinewave would have 0% THD. Another way of defining THD is that it is the ratio of the rootmean square of the harmonic content to the root mean square value of the fundamentalquantity, expressed as a percent of the fundamental. This value is only provided from aDrive Input test for the armature section of a DC motor.
Current (THD) is taken on the 3-phase line side of an energized DC motor drive. It is theRMS value of the current signal with the line frequency removed. A perfect 60 Hz sinewave would have 0% THD. Another way of defining THD is that it is the ratio of the rootmean square of the harmonic content to the root mean square value of the fundamentalquantity, expressed as a percent of the fundamental.
Differential Current is the percent difference in current going into and returning from thearmature or field windings under test. Increasing differential current due to droppingvalues of return current may be indicative of increasing leakage current. This value isprovided for armature and field sections of a DC motor.
Warning SettingsWarning levels can be set for each individual asset to indicate problems that exist withinthat asset or asset circuitry. Warnings can be set at both the Caution and Alarm levels.Caution levels indicate less severe conditions than Alarm levels. Predefined default levelsare set in MCEGold by PdMA and may be changed by the user. Based on experience thedefault values may be changed to be more or less conservative. Test results which exceedthe Caution setpoint are shown in yellow and test results which exceed the Alarm setpointare shown in red.
In addition to providing Caution and Alarm warnings based on a parameter varying from asetpoint, MCEGold can provide warnings based on parameters changing from a baselinereading. Again, test results which exceed the Caution value are shown in yellow andresults which exceed the Alarm value are shown in red.
Default warning setpoints are based on testing at the MCC. As you gain experience withthe MCE tester, you may choose to narrow the range of acceptable values. The conditionof the motor and the importance of its application to your operation or process are otherfactors that must be considered when setting up the warning levels within MCEGold.
Changing the warning levels will affect all subsequent, as well as all previous tests.Therefore, whenever a warning level is changed, an uneditable message is automaticallyentered into the motor notes.

PdMA MCEGold PRODUCT SUPPORT MANUAL EMAX POWER ANALYSIS
REV. 0-04/08 © 2008 PdMA Corporation 7-39
Warning levels may be set on the parameters listed below:
Voltage THD (LL) [>#]Current THD [>#]Differential Current [>#, Base+-#]
The information inside the brackets describes how the Caution or Alarm level is set; “<” isless than; “>” is greater than; “Base” indicates the baseline value; “+” means baseline plusthis value; “-” means baseline minus this value; # is the numeric value for the Caution orAlarm for that parameter.
For the settings which do not reference a baseline, the value obtained will be in Caution orAlarm if it is greater than the numbers entered into the Caution and Alarm boxes for theparameters.
For example, for Fp Amplitude the value obtained will be in Caution or Alarm if it is lessthan the numbers entered into the Caution and Alarm boxes for the parameters.
A test point without brackets indicates that there is not a default value.
Change Warning SettingsWarning Settings are changed using the Asset Manager, Warning Settings on the homepage. This is discussed in Chapter 3-MCEGold, page 3-3. They may also be changedusing the Warning Settings menu on each Test History window. See the Test Historyinformation for each test for more information.

EMAX POWER ANALYSIS PdMA MCEGold PRODUCT SUPPORT MANUAL
7-40 © 2008 PdMA Corporation REV. 0-04/08