chapter 7 or 13: are client or lawyer interests paramount? › ~webfac › cbrown › e251_f07 ›...
TRANSCRIPT

Chapter 7 or 13: Are Client or Lawyer Interests Paramount?
Lars Lefgren Brigham Young University
Frank McIntyre Brigham Young University
Michelle M. Miller Boston University
Draft October 2007
1

Introduction
Personal bankruptcy is one of the most important mechanisms through which
Americans are insured against adverse financial, health, and personal shocks. Fifteen of
every one thousand households in the United States filed for personal bankruptcy in 2003
(Lefgren and McIntyre, 2007) on average discharging approximately $36,000 in debt
according to Culhane and White (1999). Cumulatively, bankruptcy transfers more
money than state unemployment insurance programs (UI) and Temporary Assistance for
Need Families (TANF) combined. Himmelstein et al. (2005) and Sullivan, Warren, and
Westbrook (1989 and 2000) provide evidence that a majority of bankrupt households
experience a significant financial shock within the twelve months prior to filing. Despite
the importance of personal bankruptcy as consumption insurance, limited information on
the part of debtors induces a situation in which access to appropriate debt relief is a
lottery based upon which law office a debtor happens to enter.
The nature of a debtor’s bankruptcy experience depends crucially on the chapter
under which he files. An individual debtor filing for bankruptcy relief can file under
Chapter 7 or Chapter 13 of the bankruptcy code.1 Under Chapter 7, often referred to as
liquidation, households may only keep exempt property. All other assets of value are
liquidated by a trustee and distributed to creditors. Most of the debtor’s unsecured debts
are then discharged (forgiven) and the debtor does not have to give up any of his future
income. Alternatively, under Chapter 13, the debtor retains all of his financial assets but
promises to follow a court approved repayment plan over a three to five year period.
1 During the time period in question, Chapter 7 and Chapter 13 relief was available to all debtors. Relief under Chapter 11 was also available to individual debtors, but few debtors chose that option because of the significant cost of filing bankruptcy under Chapter 11.
2
Either chapter may be optimal for a debtor, depending on the particulars of his
financial situation. Filing under Chapter 13 of the bankruptcy code can be beneficial as is
allows households to keep secured assets and discharge a broader set of debts. However,
there are more risks and costs involved in filing a Chapter 13 bankruptcy. Most Chapter
13 bankruptcies are dismissed because the debtor fails to satisfy the conditions of the
court mandated repayment plan.2 In these cases, the debtor is liable for all remaining
debts and does not receive compensation for financial or time costs accrued in filing for
bankruptcy. In addition, lawyer fees are typically hundreds of dollars more in Chapter 13
cases. A majority of households who file under Chapter 13 pay a premium to receive
only temporary relief from creditors even though Chapter 7 bankruptcy was an option.
While it is to be expected that not all bankruptcies will work out as planned,
evidence suggests that the chapter under which households file is not purely a function of
their financial situation.3 Using household level data from Utah, Texas, and California,
we show that an attorney’s fraction of other bankruptcies filed under Chapter 13 explains
10-20 percent of the variation in chapter selection—even controlling for the financial
situation of filing households. This relationship, which is by far the single most
important observable predictor of which chapter gets filed, holds even after instrumenting
the actual attorney’s fraction of bankruptcies filed under Chapter 13 with a measure of
average attorney filing behavior in the debtor’s neighborhood.
2 Lefgren and McIntyre (2007) report that over 60 percent of Chapter 13 bankruptcies are dismissed. A further 10 percent are converted to Chapter 7. 3 For example, Lefgren and McIntyre (2007) report that the fraction of personal bankruptcies filed under Chapter 13 ranges from 0.03 in North Carolina to 0.62 in Georgia, suggesting legal culture plays an important role in chapter choice. Sullivan, Warren, and Westbrook (1998) emphasize that debt loads and repayment ability appear similar for Chapter 7 and Chapter 13 filers. Braucher (1993) presents qualitative evidence on the attorney’s role in the chapter decision.
3

Bankruptcy is an adversarial procedure in which the household’s attorney is
charged with looking after the debtor’s best interests.4 Differences across attorneys in
how they treat similar clients can be rationalized in several ways. First, attorneys
specializing in Chapter 13 may be able secure more favorable terms for debtors under this
chapter than attorneys who seldom use this chapter. Second, some attorneys may file
households under the chapter that maximizes profits as opposed to client benefits. Third,
attorneys may have heterogeneous beliefs regarding the benefits of each type of
bankruptcy for filing households.
Examining the causes of attorney specialization empirically, we find that firms
specializing in Chapter 13 bankruptcy charge more for these bankruptcies (though less
payment is required upfront) yet offer no benefit in terms of lower dismissal rates or
more manageable payment plans. Thus households receive few benefits from attorney
specialization.
Attorney specialization is consistent, however, with firms maximizing profits.
More specifically, large firms and firms with a client mix better suited for Chapter 13
bankruptcies tend to specialize in Chapter 13. This is consistent with a model in which
firms that expect to file a large number of Chapter 13 bankruptcies engage in fixed
investments to reduce the marginal costs of filing such cases. A learning-by-doing model
can also lead to this type of specialization. Thus firms systematically file clients under
Chapter 13 when the costs of doing so are sufficiently low to rationalize pursuing a
higher court-regulated payment than is available in the unregulated market for Chapter 7
bankruptcies.
4 The bankruptcy trustees are charged with looking after the creditors’ interests while judges serve as arbiters.
4
While we cannot empirically reject the hypothesis that attorneys have different
views regarding the advantages of each type of bankruptcy, we can say that attorney
specialization is consistent with debtor interests being subordinate to firm profits.
Ultimately, a typical lawyer-instigated decision to file under Chapter 13 as opposed to
Chapter 7 leads to a substantial transfer of wealth from insolvent households to specialist
attorneys with a reduced probability of long term debt relief.
Review of the Literature
This paper relates to a large existing literature on personal bankruptcy found in
both the economics and legal disciplines. Most closely related to our analysis is a set of
papers that explore factors driving a household’s decision regarding bankruptcy chapters.
Nelson (1999), Domowitz and Sartain (1999), Sullivan and Worden (1990), Li and Sarte
(2002), and Sullivan et al. (1988) all find that financial incentives play a role in the
choice of bankruptcy chapter. However, many other economists note that legal culture
and the choice of attorney also play important roles in the chapter decision. Specifically,
Lefgren and McIntyre (2007) find that the propensity to file under Chapter 13 of the
bankruptcy code varies greatly across localities. And because these differences are
extremely persistent and exist across adjacent states with seemingly similar populations,
they conclude that the differences in the proportion of Chapter 13 filings are likely due to
legal culture. Sullivan et al. (1994) also argue that all of the local variation in chapter
choice cannot be explained by state laws, by the behavior of particular individuals or by
other non-legal factors. The authors develop a model in which the local legal culture is
dominated by lawyers. According to this model, the lawyer, due to specialty, moral
5

preference, or stereotype, undermines the debtor’s decision making, and thus, influences
the chapter choice. Braucher (1993), Neustadter (1986) and Sullivan et al. (1988) all
provide important qualitative evidence that lawyers often steer households toward one
particular bankruptcy alternative.
Our paper is also closely related to the medical literature examining variation in
treatment choice across providers and locations. Health economists have widely
documented the variation in physician practice styles which cannot be explained by
income, insurance, or patient preferences. Recent examples including Chandra and
Staiger (2004), Ketcham and Nicholson (2005), and Grytten and Sørensen (2003) show
that choice of service provider plays an important role in the type of treatment patients
receive. Chandra and Staiger (2004) for example, find that treatment decisions following
a heart attack differ greatly across hospitals and regions. The authors present evidence
that such specialization can be rationalized within a framework in which doctors
maximize patient health outcomes. Allgood and Bachmann (2006) find that
specialization, as indicated by the annual caseloads of surgeons, influences the choice of
surgical treatment, adjuvant therapy provision, and survival time for patients with screen
detected breast cancer. Specifically, higher volume surgeons are more likely to provide
more effective treatment (auxiliary surgery), are less likely to provide the more traumatic
treatments (mastectomy) and obtain the longest survival, independent of prognostic
features. Thus, Allgood and Bachmann (2006) support specialization in the medical
arena. Additionally, Epstein et al. (2005) discuss the welfare implications of such
physician specialization. They find that one-third of the variation in treatment styles
6

across physicians is due to patient-physician matching. This implies that a considerable
part of the variation in medical treatment rates may enhance welfare.
The current study makes three primary contributions to the existing literature on
chapter choice. First, in addition to providing evidence that lawyers influence the chapter
choice, we seek to quantify the magnitude of their role. Second, we address concerns that
the apparent role of lawyers is driven by the endogenous sorting of clients to attorneys.
Third, we examine whether attorney chapter specialization, like physician specialization,
yields benefits for clients.
Institution Background
Personal Bankruptcy in the United States
In the United States, creditors can use multiple mechanisms to compel repayment
of debts. Creditors may attempt collection by sending the household correspondence,
adding late charges to the underlying debt, or harming the household’s credit rating. A
creditor may also seek collection in court; a judgment can be used to place a lien on the
debtor’s property and garnish the debtor’s wages.5 Secured creditors and creditors who
have obtained judgments against the debtor may also seize funds in a debtor’s bank
account and foreclose on property.
For households unable to service their debt, personal bankruptcy serves as a
primary instrument of debt relief. Legal authority for bankruptcy is found in Article 1,
Section 8 of the United States Constitution. For this reason, many aspects of bankruptcy
law are uniform across states. Filing for bankruptcy requires creditors to stop taking any
5 The exact contours of a creditor’s remedies for enforcing a judgment against the debtor are determined by state law.
7

collection measures. A creditor in the process of foreclosing on the debtor’s home must
stop the foreclosure sale. Creditors are no longer allowed to send the debtor
correspondence, and all garnishments must stop.
Upon choosing to file for bankruptcy, debtors must decide under which chapter to
file. Under Chapter 7, debtors are able to obtain a speedy discharge of most unsecured
debts and remove some judicial liens. The downside to Chapter 7 is that debtors must
liquidate all of their assets with a value above the predetermined personal and homestead
exemption levels. These exemptions can vary dramatically across states. For example,
Florida has an unlimited homestead exemption while Delaware has none. Households
filing for bankruptcy under Chapter 7 of the code may suffer from reduced access to
credit in the future. Furthermore, after filing for Chapter 7 bankruptcy relief, debtors
must wait another six years before filing under Chapter 7 again. Until October of 2005,
households of any income level were eligible to file under Chapter 7, though obvious
strategic behavior was not tolerated and could lead to case dismissal. Additionally,
United States trustees, who represent creditor interests, may attempt to force individuals
to file under Chapter 13 if it is clear that the debtors possess the ability to pay a
substantial fraction of their debts. From 1999 to 2001, 70.5 percent of all personal
bankruptcies were filed under Chapter 7.
Under Chapter 13, households retain all of their assets and instead agree to repay
some of their debts according to a court ordered payment plan lasting between three and
five years. Debtors pay their projected monthly disposable income, calculated as the
difference between their monthly income and monthly budgeted living expenses, into the
Chapter 13 payment plan. Upon completion of the plan, the household’s remaining debts
8

are discharged. The Chapter 13 discharge is often referred to as the super-discharge; in
addition to the debts discharged under Chapter 7, Chapter 13 debtors can discharge debts
from property settlements following a divorce, willful and malicious injury,
governmental fines and penalties, unpaid taxes, certain fraudulent tax filings, fraud,
embezzlement, larceny, and damages from personal injury civil action. Significantly,
Chapter 13 bankruptcy also allows debtors to retain possession of collateral even if
clients are in arrears with their payments. Often, households will file under Chapter 13 to
stay in their home or keep an automobile. Debtors can file under Chapter 13 as
frequently as every six months.
While Chapter 13 bankruptcy possesses advantages for some households relative
to Chapter 7 bankruptcy, it is a poor choice for many households. In order to discharge
its debts under Chapter 13, a household must complete its repayment plan. Thus, Chapter
13 is designed for households with a continuing ability to earn income and minimize
future expenditures. If a debtor is unable to commit to a long term plan, his case will be
dismissed, and he will be liable for all his original debts as well as additional court and
lawyer fees. According to Lefgren and McIntyre (2007), while 29.5 percent of
bankruptcies are filed under Chapter 13 of the bankruptcy code, the majority of these
bankruptcies are dismissed (60 percent) largely due to nonpayment on the debtor’s part.
Another 12 percent of the Chapter 13 filings are ultimately converted to Chapter 7
bankruptcies for the same reason. Thus Chapter 13 bankruptcies represent only 10
percent of bankruptcy discharges. For these reasons, the majority of households filing
under Chapter 13 receive few long term benefits.
9

The pricing mechanisms for Chapter 7 and Chapter 13 bankruptcies are quite
different. Typically, clients pay Chapter 7 attorney fees upfront. Chapter 7 attorney fees
are unregulated by the courts. In contrast, the majority of Chapter 13 fees are rolled into
the payment plan. Households are likely insensitive to these fees as they may displace
payments to other creditors. In any event, individual bankruptcy courts set norms for
these fees. Fees above a customary limit are subject to special scrutiny. For this reason,
attorney fees are tightly clustered around this informal limit.6 Allowed fees are typically
much higher than the equilibrium Chapter 7 fees set by the market. In a sample of
bankruptcy filings from February 1st, 2007, attorney fees for Chapter 13 bankruptcies
averaged $2,657 compared to $905 for a Chapter 7 bankruptcy.
Lawyer Specialization
Lawyers vary significantly in the fraction of bankruptcies they file under Chapter
13. Figure 1 is a histogram showing the distribution of lawyers in Texas, Utah, and
California by the fraction of bankruptcies they file under Chapter 13. This histogram
demonstrates the large spread in lawyer behavior. 37 percent of lawyers file less than 5
percent of their cases under Chapter 13 of the bankruptcy code. On the other hand, 20
percent of lawyers file more than 40 percent of bankruptcies under Chapter 7. This
illustrates the high degree of bankruptcy chapter specialization. To the extent that
bankruptcy clients shop for lawyers meeting their specific financial situations, this may
not indicate a strong role of lawyers in determining chapter choice. On the other hand, if
filing households are relatively unsophisticated when it comes to selecting a lawyer, the
6 See Braucher (1993).
10

high degree of lawyer specialization suggests that the choice of lawyer may be an
important determinant of a household’s choice of bankruptcy chapter.
Braucher (1993) effectively documents the roles that attorneys play in guiding
typically unsophisticated clients towards one type of bankruptcy or another. Attorneys
can influence clients to file under Chapter 13 by emphasizing the benefits of retaining
secured assets, the morality of repaying creditors, and access to future credit.7 Other
attorneys shift households towards Chapter 7 bankruptcy by highlighting the difficulty of
maintaining the payment plan, moral obligations to provide financially for their families,
and the predatory nature of some creditors. Braucher finds that clients' guilt and loss of
self-esteem makes them highly vulnerable to lawyers' influence, whether exercised
unwittingly or deliberately. Thus, he concludes that attorney practices have more effect
on chapter choices than features of the law conventionally thought to be important.
Similarly, Sullivan et al. (1988) also find that among other factors, attorneys greatly
influence the choice of chapter. Using data collected during surveys, the authors find that
nearly 32 percent of debtors consulted attorneys specializing in bankruptcy while the
remaining debtors sought counsel from more general practitioners. The authors discover
a positive, moderate correlation (r = 0.27) between seeing a bankruptcy specialist and
filing under the more complicated Chapter 13 of the bankruptcy code. This suggests that
attorneys may exert an important powerful influence over whether debtors file Chapter 7
or Chapter 13.
7 A Chapter 13 bankruptcy stays on an individual’s credit report for seven years as opposed to ten for Chapter 7 bankruptcies. Anecdotally, however, households filing under Chapter 7 bankruptcy have better access to credit immediately after filing for bankruptcy according to Braucher (1993). This is because they no longer have additional credit obligations and lose the option value of filing under Chapter 7 again for the next six years.
11

While it seems plausible that many lawyers steer clients toward one type of
bankruptcy or another, it is useful to consider what economic phenomena might drive this
behavior. Lawyer specialization may occur due to the increased complexity of Chapter
13 bankruptcies. Filing under Chapter 13 of the bankruptcy code requires additional
paperwork than filing under Chapter 7. First, lawyers must file a repayment plan for all
Chapter 13 cases. This requires a detailed collection and investigation of a client’s
receipts and bank statements. Lawyers must then create a comprehensive itemized
budget that their clients must follow over a three to five year period. The paperwork,
planning, and organization required to complete this task is clear. Additionally, the court
must confirm Chapter 13 bankruptcies, a process which is often more difficult and time
consuming than under Chapter 7. And with the amendment of the bankruptcy code in
2005, filing under Chapter 13 of the bankruptcy code became even more rigorous; when
filing a Chapter 13 case, lawyers must now complete an additional form—the Statement
of Current Monthly Income and Calculation of Commitment Period and Disposable
Income Form (Form 22C). With 60 lines of exceptionally detailed information, this form
particularizes the debtor’s monthly income and expenses. Each entry requires thorough
documentation and can create endless paperwork; without the proper clerical system,
disorganized lawyers may find the task impossible. The form also requires lawyers to
predict the debtor’s future income and expenditure.
While more difficult to file, the potential payoff from filing under Chapter 13 is
also greater. The difference in fees provides an obvious financial incentive for lawyers to
file under Chapter 13. Households, on the other hand, are less elastic to these costs. For
a Chapter 7, households typically pay the entire fee upfront to the attorney. In a Chapter
12

13 on the other hand, households usually pay some fees upfront but the majority of the
cost of a Chapter 13 bankruptcy is collected as part of the household’s payment plan.
Attorneys, however, are often preferred relative to other creditors and collect the majority
of their fees at the front end of the payment plan. Thus, even if the plan fails, attorneys
collect the majority of their payment.8
While a formal model is available upon request from the authors, in the interests
of brevity we’ll simply outline how fixed investments can lead to law firm specialization.
Suppose that firms can undertake investments in technology,9 personnel, or human
capital to lower the marginal costs of filing bankruptcies under Chapter 13. Firms that
expect to file enough Chapter 13 bankruptcies would find it optimal to undertake such
investments. Investments made to lower the cost of filing bankruptcies under Chapter 13
lead to law firm specialization. More specifically, investing firms find it optimal to steer
a higher fraction of households to Chapter 13 than non-investing firms, even holding
client mix constant. There are two testable implications of this model of specialization.
The first is that larger firms will file a higher fraction of bankruptcies under Chapter 13
than small firms. The second is that firms with a client mix better suited for Chapter 13
bankruptcy will be more likely to file any given bankruptcy under Chapter 13. Similar
implications can be obtained from a learning-by-doing model in which attorneys become
better at filing Chapter 13 bankruptcies with practice.
8 Braucher (1993) documents that in some jurisdictions, the price differential between Chapter 13 and Chapter 7 bankruptcies is much smaller. In these jurisdictions, lawyers only rarely file bankruptcies under Chapter 13. 9 Specialized software programs automate much of the bankruptcy filing process. According to attorneys, this software is more helpful for the filing of Chapter 13 bankruptcies than the filing of Chapter 7 bankruptcies.
13

Specialization may also yield benefits for filing households. Households that file
under Chapter 13 with firms specializing in this type of bankruptcy may enjoy better
financial outcomes or lower costs than households who file Chapter 13 bankruptcy with
unspecialized firms. We can test this by examining filing costs and dismissal rates of
Chapter 13 households who have filed with different firms.
Of course specialization may also reflect different beliefs by attorneys regarding
the relative benefits of Chapter 7 and Chapter 13 bankruptcy. Lawyers may also vary in
seriously they take their obligation to look after their clients’ best interests. These
hypotheses cannot be tested, however, given available data.
Description of Data
We use several different sources of data to examine the causes and consequences
of lawyer specialization. Bankruptcy data comes from PACER (Public Access to Court
Electronic Records), the court’s centralized registration and billing website. We limit our
analysis to three bankruptcy courts: Utah, Texas Northern, and California Northern from
the period 2000 to 2006. The Utah sample is a census of bankruptcies from 2000 to late
2004 while the Texas and California data are samples from 2003 to 2006. 36 percent of
bankruptcies are filed under Chapter 13 in our sample relative to just under 30 percent in
the U.S. prior to the 2005 law and just over 20 percent in 2006. The filing rates for the
states in our sample are also somewhat higher than the nation as a whole.10
10 The national average was 15 filings per 1,000 households in 2003. For approximately the same time period, California’s filing rate was 16, while Utah’s filing rate was 28, and Texas was 8. In terms of demographics, capita income in 2006 was $25,287 in the entire United States, $21,016 in Utah, $26,974 in California, and $22,501 in Texas. The foreign born percentage was 13 percent in the United States, 8 percent in Utah, 27 percent in California, and 16 percent in Texas. The black percentage was 12 percent in the United States, 1 percent in Utah, 6 percent in California, and 12 percent in Texas. Median age was 36
14

For each petition in our sample, we have information on bankruptcy chapter, filer
address, lawyer identity and location, along with whether the case was dismissed or
received a discharge of debts. Because we know the lawyer used in each case, we can
calculate the fraction of bankruptcies (excluding the reference individual) filed under
Chapter 13 for each attorney. We use information on filer address to merge in 2000
Census block level data. This provides rough information on demographics, income, and
housing values. Summary statistics of the filing information and block level
demographics are shown in Table 1. The Census block data suggests that nearly two
thirds of the population is married, and another 11 percent is divorced. While the large
majority at the block level has completed high school, less than one fifth of the
population has obtained an undergraduate degree. The average median income in the
Census blocks is between $40,000 and $50,000, with the average unemployment rate at 3
percent. The block level data also indicates that approximately 60 percent of bankruptcy
filers are homeowners. Finally, almost the entire sample, 92 percent, resides in an urban
Census block.
In addition to our primary data set, for 1,989 households who filed for bankruptcy
in Utah during 2000, we also collected more detailed information from the Statement of
Financial Affairs. For these individuals, we manually collected income from the prior
year, debt and asset levels, and household composition. Finally, we collected the same
information for a sample of 15,270 Texas filings for which the court provided machine
readable statements of financial affairs. Summary statistics for these two samples are
also provided in Table 1. The means of the Census block group variables are generally
in the United States, 28 in Utah, 34 in California, and 33 in Texas. Naturally, we control for observable demographic differences in the regressions.
15

similar to those of our baseline sample. We can also examine summary statistics of
financial variables reported in the statements of financial affairs. We see that in Utah and
Texas households earn about $2,400 and $3,100 per month, have secured debt levels of
$103,000 and $82,000 and unsecured debt levels of $46,000 and $52,000 respectively.
We use two additional cuts of data near the end of the paper. The first is a set of
Utah filers in 2004 for whom we collected information on whether they had filed a
chapter 7 bankruptcy in the past 4 years. This lets us perform a robustness check on our
results that accounts for the fact that some agents are forbidden from filing chapter 7.
Lastly, we wish to look at outcomes, and so for our Texas sample we collect data on
dismissal rates, reported household budget, and legal fees.
Empirical Strategy
To examine the importance of attorneys in the decision regarding which chapter
to file, we estimate a linear probability model of the following type:
(1) 13 13ij i ji ijchapter X fracβ α ε= + +
where is a binary variable that takes on value of one if individual i filing with
attorney j files under Chapter 13 of the bankruptcy code and zero otherwise.
13ijchapter
iX is a
vector of individual level characteristics correlated to the decision to file under Chapter
13, and 13 jifrac is the fraction of an attorney’s clients who file under Chapter 13
excluding the reference individual. We use 13 jifrac as a proxy for the lawyer’s
underlying propensity to file households under Chapter 13.11 If attorney assignment
11 We also experimented with adjusting 13 jifrac for the observable characteristics of the lawyer’s client mix. The results, shown later in our robustness checks, are virtually identical.
16

were random or if the vector iX were sufficiently rich that lawyer assignment was
conditionally orthogonal to the residual, α would represent the causal effect of being
assigned to a lawyer with a higher propensity to file under Chapter 13.
We start by estimating equation (1) using ordinary least squares. We include
specifications in which we control for Census block group information and also estimate
the relationship using a subset of filers for whom we know income, debt, and asset
information from their statement of financial affairs. We hope that this richer set of
covariates controls for most primary household level factors that drive the decision of the
chapter under which to file.
The assumption that the lawyer’s fraction 13 is orthogonal to the residual
(conditional upon covariates) may not hold. The high propensity some lawyers exhibit to
file under Chapter 13 may reflect the unobserved characteristics of their clients. More
specifically, it might be that all lawyers behave identically but that the variation in the
filing rates is driven by differences in client mix. Alternatively, some lawyers may
specialize in a particular type of bankruptcy and match (through advertising or word of
mouth) with individuals looking to file under that particular chapter.12 In these cases, we
would expect the residual to be correlated with the fraction of an attorney’s other clients
filing under Chapter 13.
To address this concern, we will also pursue an identification strategy in which
we instrument the actual fraction of clients filing under Chapter 13 with a distance-
12 A brief perusal of the yellow pages in Utah found plenty of advertisements for bankruptcy attorneys, but little that suggested specialization in one chapter or the other. One attorney, though, did mention their “flat fee” for Chapter 7—a possible signal of Chapter 7 preference. Braucher (1993) provides more systematic evidence that attorneys do little to signal specialization.
17

weighted average of the fraction Chapter 13 of attorneys in the individual’s area. This
weighted average is defined by the following equation:
(2) 13 * /
13/
ji j ijj
ij ij
j
frac F dfrac
F d=∑
∑
where is the distance (in miles) from debtor i to lawyer j and ijd jF is the annual
number of filings for the lawyer. Thus the instrument computes the average fraction 13
filings, weighting each lawyer by their closeness to the agent and firm size. The first
stage equation in this specification is given by:
(3) 13 13ji i ijifrac X fracγ η= Γ + + .
This strategy takes advantage of variation in filing behavior attributable to residential
location. This strategy yields consistent estimates of α if residential location is
uncorrelated to a household’s propensity to file for bankruptcy conditional upon
observables. We test the plausibility of this assumption by examining the correlation of
13ifrac with households’ block level Census demographic information.
In effect, our instrument is a reduced form version of estimating a set of equations
for lawyer choice. Distance would enter into an agent’s optimal choice, as would other
known factors about each lawyer. Unfortunately, actually estimating such a set of
equations would be both computationally demanding and require fairly strong
assumptions. As all we really are interested in is identifying a viable instrument, we
impose a simple functional form for how distance affects lawyer choice.
Findings
18

OLS Results
Examining Table 2, we see OLS estimates of the impact of lawyer fraction 13 on
individual filing behavior. Recall that for our entire analysis we exclude the individual’s
own filing when calculating lawyer fraction 13. The first column shows the OLS results
for the full sample without controls. Unsurprisingly, the coefficient on lawyer fraction 13
is 0.98. This point estimate suggests that going from a lawyer who files 50 percent of
bankruptcies under Chapter 13 to one who files 60 percent under Chapter 13 would
increase and individual’s own probability of filing under Chapter 13 by 9.8 percentage
points. Furthermore, the r-squared is 0.22 suggesting that nearly a quarter of the
variation in filing rates is correlated to lawyer identity. This result is consistent either
with lawyers having a large causal effect on chapter choice or strong sorting of
individuals to those lawyers who specialize in their chosen type of bankruptcy.
In the second column, we add Census block-group controls. The addition of these
covariates has almost no effect on the lawyer fraction 13 coefficient. Some of the
coefficients are statistically significant, however. For example, the fraction of
households within the block group that are married and the fraction of individuals who
are black are both positively associated with filing under Chapter 13. Conversely, the
fraction of individuals with a college degree is negative correlated with filing under
Chapter 13. Though a few coefficients are statistically significant, the covariates add
virtually no explanatory power of the model. Indeed, their partial r-squared is 0.00.
It may be that most of the variation in personal factors that affects filing decisions
occurs within neighborhoods as opposed to across neighborhoods. In this case,
controlling for block group averages will do little to control for the household
19

heterogeneity that determines chapter choice. To examine this possibility, we examine
two samples for which we have collected household level debt, asset, and income data.
In column 3 we examine our detailed Utah subsample but include no covariates.
Consistent with our earlier results, we estimate a coefficient on lawyer fraction 13 that is
again quite close to 1. In column 4, we see that controlling for individual covariates leads
to a reduction of this coefficient to about 0.9. It appears that households with high asset
levels are more likely to file under Chapter 13, presumably to protect these assets.
Households with higher debt levels, controlling for assets, are more likely to file under
Chapter 7. While the partial r-squared of these individual level covariates is 0.08, lawyer
fraction 13 still explains more of the variation in filing behavior than even household
level covariates.
In the next column, we examine our detailed Texas subsample. When we control
for no additional covariates, the coefficient on lawyer fraction 13 is 0.91, a bit smaller
than in our other samples. Adding covariates causes the coefficient to drop by about 0.12
to 0.79. The pattern of coefficients on our control variables for this subsample differs
somewhat from that we observed in the Utah detailed subsample. In particular, while
high income households are more likely to file under Chapter 13, we don’t see the same
tendency of high asset households to file under Chapter 13. This is likely due to
differences in exemption laws between the two states. For example, in Texas there is an
unlimited homestead exemption, which facilitates the shielding of assets from creditors.
As with all of our prior findings, lawyer fraction 13 is a much stronger predictor of filing
chapter than even household level covariates.
20

IV Results
While the OLS coefficients suggest that lawyers play a central role in chapter
choice, it may be that we have insufficiently controlled for the financial determinants of
chapter selection. To further address this concern, we now provide the results from the
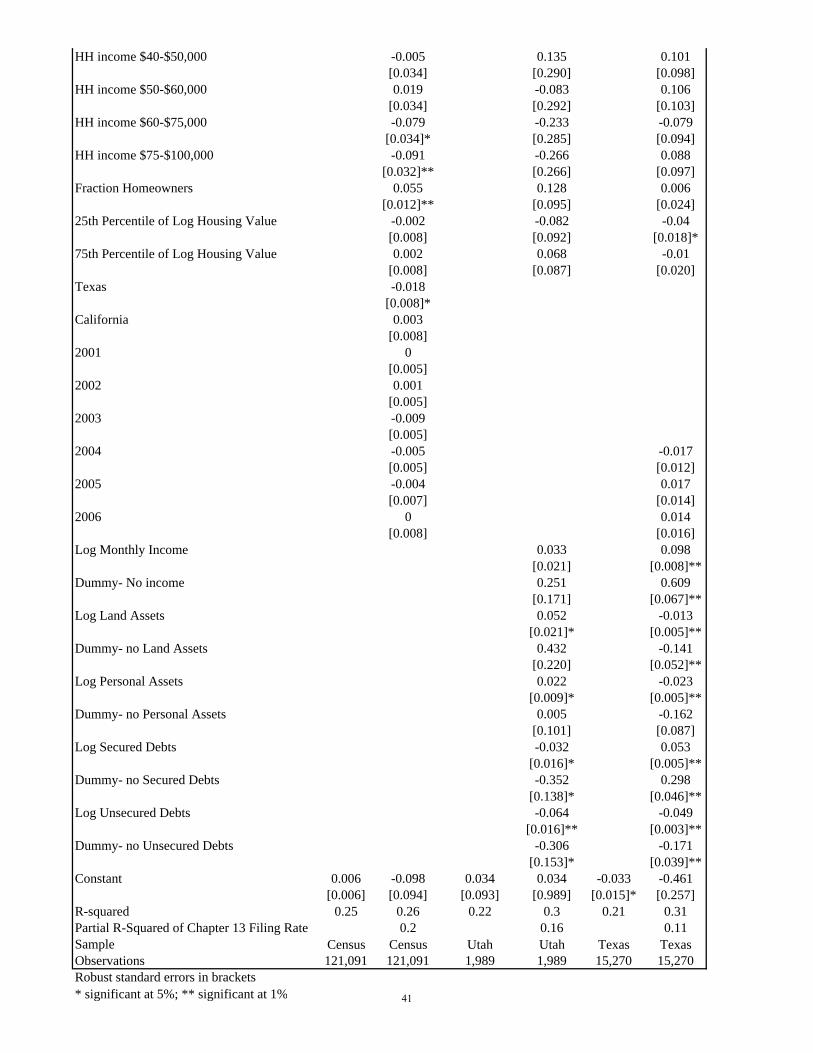
instrumental variables strategy described earlier. Table 3 shows the first stage regression
results. The instrument, reported in the first row, shows that distance-weighted average
of the lawyer’s Chapter 13 filing rate is an excellent predictor of the filing rate for the
lawyer an agent actually goes to; presumably because agents go to lawyers close to them.
The table also reports the F-statistics for the regressors, which suggest that the instrument
is a statistically significant predictor of fraction 13 filed, though the instrument is
substantially weaker in Utah than in Texas. To examine why this is the case, we
compared the standard deviation of lawyer fraction 13 in the two samples to the standard
deviation of the instrument. The standard deviation of lawyer fraction 13 rates in the
Texas and Utah subsamples are 0.25 and 0.23 respectively. The corresponding standard
deviations of the instrument are 0.13 and 0.05. Apparently in Utah, most households are
nearly equidistant from several attorneys with different filing behavior and thus the
variation averages out more than in our Texas sample.
Table 4 reports the second stage estimates. Across all three samples, the
coefficients for lawyer fraction 13 exceed 0.9 in all specifications. Furthermore, the
inclusion of either neighborhood or household covariates has little impact on the
coefficients. This suggests our instrument has a low correlation with the observables that
determine chapter selection. For the comprehensive and the Texas detailed samples, the
standard errors are extremely tight as well. For the comprehensive sample, our
21

confidence interval ranges between 0.91 and 1.01. For the Texas detailed sample, the
confidence interval ranges from 0.79 to 1.08. Overall, these coefficients confirm our
OLS estimates that the idiosyncratic choice of lawyers is the primary driving force
behind chapter selection.
It’s important to recall that IV estimates capture a very particular local average
treatment effect (LATE).13 In particular, assuming our instruments are conditionally
orthogonal to the residual, our IV estimates capture the causal effect of being assigned to
a high fraction 13 lawyer for those households who choose lawyers based on convenience
as opposed to matching. One might expect that such households are particularly
susceptible to filing under the bankruptcy chapter according to the attorney’s best
interests. This may explain why in some cases the IV estimates are slightly larger than
the OLS estimates.
Overall, the OLS and IV estimates suggest that lawyers play a central role in
household decisions regarding bankruptcy choice. To put the findings in perspective, the
25th percentile lawyer in our comprehensive sample files no bankruptcies under Chapter
13 while the corresponding measure for the 75th percentile lawyer is 41 percent. Even if
we rely on the relatively conservative estimate of the effect of lawyer fraction 13 of 0.9,
this suggests that happening to go to a 75th percentile lawyer instead of a 25th percentile
lawyer would increase the probability of filing under Chapter 13 by 37 percentage points.
No other covariate in our model has a similarly large impact on filing behavior.
Robustness and Heterogeneity Checks
13 See Imbens and Angrist (1994).
22

While both our OLS and IV specifications yield remarkably similar estimates, it is
worth considering specific threats to identification. One concern is that our instrument,
the distance weighted average fraction 13, is correlated to the unobserved characteristics
of the filing household. Our model of lawyer specialization (and evidence we present
later) implies that firms tend to specialize in Chapter 13 bankruptcy when its client mix is
better suited for this type of bankruptcy. This suggests that lawyer behavior will be
correlated with observable and possibly unobservable neighborhood characteristics,
potentially invalidating our instruments. To examine the potential importance of this
concern, in Table 5 we regress our instrument on the Census block and household
characteristics. The partial r-squared of neighborhood characteristics is 0.02 in the
comprehensive and Texas samples (though much larger in the Utah sample). These
regressions suggest that while our instruments are correlated with observable
neighborhood characteristics, this relationship is quantitatively small. Additionally, in
our primary characteristics our inclusion of controls for a host of demographic
characteristics may absorb much of the variation in unobserved propensity to file under
Chapter 13. In practice, these controls make little difference to the estimates. Even
controlling for the detailed financial characteristics of the households has little impact on
our estimates.
A second potential problem is that our proxy for lawyer propensity to file under
Chapter 13 may reflect the client mix as opposed to a lawyer’s genuine preference for
filing under a specific chapter. To examine this possibility, we estimate a linear
probability model including the covariates available to us in each sample along with
attorney fixed effects. This can be represented by the following regression equation.
23
(4) 13ij i j ijchapter X B eθ= + + .
We can think of these attorney fixed effects as the propensity to file under Chapter 13,
controlling for client mix. To exclude each household’s own contribution to the attorney
fixed effect, we calculate a residual for each household equal to . We
then average these residuals across all households of a particular lawyer, excluding the
reference individual. Using our base sample and census block group covariates, the
correlation between our adjusted propensity to file under Chapter 13 and the raw fraction
13 is 0.95. In row 1 of Table 6, we show that our findings are quite robust to our use of
this adjusted propensity to file under Chapter 13.
ˆ13ij ichapter X B−
A third concern is that our primary specification is linear even though our
outcome is binary. In row 2 of Table 6, we present the marginal effects of lawyer
fraction 13 on chapter choice using probit and IV probit specifications. The results again
are qualitatively similar to our baseline estimates.
Our instrumental variables specifications take advantage of variation in
geographic location to identify the impact of lawyers on chapter choice. To the extent
that geography drives chapter decisions, our IV estimates may be misleading. An
alternative different approach is to control completely for geography and identify the role
of lawyer based on the decisions of households who live very close to each other but
choose to file with different attorneys. This is essentially using the opposite identifying
assumption as our instrumental variables strategy. In row 3 of Table 6, we show OLS
estimates of the impact of lawyer fraction 13 in which we control for Census block group
fixed effects. The coefficients are once again quite similar to our baseline estimates,
providing convincing evidence that residential location is not driving our estimates.
24

In row 4, we perform our OLS examination on a subset of households in Utah for
which we were able to collect information on prior filings. Since households which have
filed a recent Chapter 7 bankruptcy cannot file under this chapter again, it is a potentially
important covariate. We eliminate from the sample all agents that filed a chapter 7
bankruptcy between 2000 and 2004. Note that we lack detailed filing information for this
sample, thus we have only the neighborhood covariates. Controlling for previous filing
status has no effect on the estimates. The IV estimate is lower with a large standard
error, but unreported estimates confirm that this is not due to removing past filers, simply
due to sampling variation, as one gets the same estimates if we added in the 2004 re-
filers.
Row 5 addresses the fact that new federal legislation went into effect in the Fall of
2005. To make sure that the results are not being driven by a change in regime, we re-run
regressions just for data prior to October 2005. This has no effect on the estimates, which
is not surprising given the small role played by the year dummies already included.
In Table 7, we examine whether our results are robust across jurisdictions and
neighborhoods. In rows 1 to 3, we use our comprehensive sample to examine the implied
impacts of lawyers in the three bankruptcy districts in our sample. We find little
difference in the point estimates. In rows 4 and 5 we report our findings for urban and
rural Census block groups. In rows 6 and 7, we see whether the findings differ across
low and high income block groups. Finally, in rows 8 and 9 we compare the results for
block groups with high and low concentrations of minorities. There is very little
evidence of heterogeneity in the parameter, which is above 0.8 in all specifications and
more typically between 0.9 and 1.
25

The Causes and Consequences of Lawyer Specialization
Our theoretical framework suggests that if lawyer specialization is due to fixed
investments to lower the marginal costs of filing Chapter 13 bankruptcy, we should find
that larger firms should file a higher fraction of bankruptcies under Chapter 13. In Figure
2, we show how fraction 13 varies with firm size. This testable implication is born out in
startling clarity. Indeed, firms that file between 10 and 14 bankruptcies per year file only
15 percent of bankruptcies under Chapter 13. Whereas firms filing more than 250
bankruptcies per year typically file over 40 percent under Chapter 13. A regression of
fraction 13 on log firm size suggests that as firm size increases by 10 percent, the fraction
of bankruptcies filed under Chapter 13 rises by 0.83 percentage points. This coefficient
is highly significant with a t-statistic of 12.14
A second implication of our theoretical framework is that firms with client mixes
well suited for Chapter 13 bankruptcy will tend to specialize in Chapter 13. This will be
mechanically true if we examine the correlation between fraction 13 and demographic
characteristics. To address this issue, we estimate lawyer fixed effects using the
specification outlined in equation (4) for our base sample. A lawyer’s empirical
propensity to file under Chapter 13, holding constant client composition, is θj. jX β
represents the suitability of the attorney’s client mix for Chapter 13 bankruptcy, where
jX represents the average demographic characteristics of an attorney’s clientele. To test
whether lawyers with client mixes suited for Chapter 13 bankruptcy tend to specialize in
14 This finding is consistent with Sullivan, Warren, and Westbrook’s (1988) result that attorneys specializing in bankruptcy law file a higher fraction of cases under Chapter 13 than other attorneys.
26
Chapter 13 we regress jθ j on jX β . The coefficient on jX β is 0.5 with a t-statistics of
6. This implies that if an attorney’s case mix were 10 percentage points more likely to file
under Chapter 13, the attorney will file bankruptcies 5 percentage points more often
under Chapter 13 holding constant client characteristics. This is also consistent with the
implications of our model of attorney specialization.
While there is evidence of lawyer specialization consistent with fixed investments
and learning by doing, this specialization may benefit those households filing under
Chapter 13. To examine this question we focus on households that actually filed under
Chapter 13. We use a subset of our Texas data for which we have information about
outcomes from a computer extraction of court filings. Outcomes include whether the
case was dismissed (and so no relief granted), how much the lawyer reported for the
filers’ household expenses, total legal fees, and upfront legal fees. We restrict data on
dismissal and legal fees to filings from before the BAPCA law change, which limits the
sample size. Due to these restrictions, and the fact that we focus exclusively on chapter
13 filers, the sample size becomes noticeably smaller. Depending on the particular
outcome, we have between 3,800 and 6,500 observations.
Using this sample, we regress the outcomes on the lawyer’s 13 rate, the size of the
firm (captured by the log of the number of cases filed in a year), and the covariates used
previously as controls. These results are shown in Table 8. We report both OLS and IV
specifications for each outcome.
In the results that follow, it is important to keep in mind that the counterfactual is
not the outcome for the agent had they filed a Chapter 7 bankruptcy. Rather it is
27

comparing the outcomes of filing with a lawyer who files many Chapter 13 bankruptcies
as opposed to few, given that the client did file a Chapter 13.
Case dismissal means that the plan was not accepted, and so represents a bad
outcome. The IV point estimates for this are positive, suggesting households filing
Chapter 13 bankruptcy with an attorney specializing in this chapter are more likely to
have their cases dismissed. The coefficient is significant at on the 10 percent level and
the OLS point estimate is very close to zero, however. Thus a more cautious
interpretation is that households filing with Chapter 13 specialists do not enjoy lower
dismissal rates. This may be evidence of some extra competence on their part, however.
To the extent that Chapter 13 specialists steer households in Chapter 13 that are ill-suited
for this type of debt relief, it may be something of a triumph if they manage to get a
similar dismissal rate as attorneys who are more cautious in their use of Chapter 13.
Each bankruptcy filing includes a budget of monthly income and expenditures.
The difference between these two is what the agent plans to pay into the plan on a
monthly basis. Thus, controlling for income, agents that report a higher set of monthly
expenditures may end up with smaller payments. Of course, the filing may not be
accepted by the courts, so this does not guarantee better outcomes, but merely suggests
them. In any case, there is no evidence that log expenditures vary much with lawyer
choice. The point estimates are small and insignificant, though positive.
Lawyer fees are reported in case filings, as well as how much was paid up front as
opposed to through the plan. Even when payments are paid through the plan, it is worth
noting that lawyer fees are often heavily front-loaded, so as to be paid in the early months
of the plan. Chapter 13 fees, though, tend to be carefully monitored by the courts, as this
28

is money that could be paid to the creditors. Thus courts tend to specify an acceptable
rate which most attorneys charge. In columns 5 and 6 we regress total fees on the
lawyer’s rate of filing Chapter 13; column 5 contains OLS results and column 6 shows
the IV results. Lawyers who file many Chapter 13 bankruptcies tend to charge slightly
more—on average about $50 to $100. This is not a huge premium since in the North
Texas Bankruptcy District the average Chapter 13 bankruptcy costs $2,000 before the
law change and $3,000 after. Examining the data, it becomes clear that experienced
lawyers are charging the court-accepted rate, while lawyers who file few Chapter 13
bankruptcies charge less.
The only evidence of a benefit being passed on to filers comes in the last two
columns, which shows that Chapter 13 lawyers charge substantially less up front than
Chapter 7 lawyers. As most bankrupt households are short on funds and credit, this could
be a benefit.
All in all, there does not appear to be much evidence that lawyers who specialize
in Chapter 13 bankruptcies secure better bankruptcies for their clients. They charge
slightly more overall, but slightly less up front. They may have higher dismissal rates.
Of course, all of this is conditional on the agent choosing to file Chapter 13. The simple
act of moving an agent from filing Chapter 7 to filing Chapter 13 vastly increases their
dismissal rate and their fees.
Conclusion
Choosing between Chapter 13 and Chapter 7 bankruptcy involves critical
tradeoffs central to a household’s future financial welfare. While Chapter 13 bankruptcy
29

allows households to keep secured assets, discharge a broader set of debts, maintain
better credit in the future, and preserves the options for a future Chapter 7 bankruptcy,
most Chapter 13 filings are ultimately dismissed or converted to Chapter 7. Because the
failure rate of Chapter 13 bankruptcies is so high, it is crucial to understand which factors
drive the household decision regarding bankruptcy chapter.
Our analysis confirms earlier qualitative work that attorneys play a crucial role in
helping their clients weigh the costs and benefits of each bankruptcy alternative. Ideally,
a household would receive the same appropriate advice, regardless of which attorney they
consult. Unfortunately, this does not appear to be the case. By far, the best observable
predictor of a household’s decision to file under Chapter 13 is the attorney they happen to
go to. This is true even when we control for case level information regarding a
household’s assets and liabilities. The coefficients are the same if we instrument the
fraction 13 of the attorney the household actually chooses with a distance-weighted
average of fraction 13’s of attorneys in the area. Moving from the 25th percentile to the
75th percentile in the distribution increases the probability that a household files under
Chapter 13 by 37 percentage points. In large part, access to appropriate debt relief
depends on which law office a debtor happens to enter.
Attorney specialization can in part be explained by a model in which firms
undertake fixed investments to lower the marginal costs of Chapter 13 bankruptcy. A
learning by doing model generates similar findings. It seems that the benefits of
specialization are enjoyed by the attorney as opposed to the clients, however.
Households who file a Chapter 13 bankruptcy with an attorney specializing in those types
of bankruptcies do not have higher success rates, more generous payment plans, or lower
30

attorney fees. A typical lawyer-instigated switch from Chapter 7 to Chapter 13 leads to a
substantial transfer of wealth from insolvent households to specialist attorneys with a
reduced probability of long term debt relief.
One potential solution to the mismatch between households and bankruptcy
chapter is to better align attorney incentives with those of their clients. In particular,
Braucher (1993) documents that in some high Chapter 13 bankruptcy districts, judges and
trustees allow attorneys to charge far more for a Chapter 13 filing than for a Chapter 7
filing. This encourages the filing of Chapter 13 bankruptcies but may be justified based
on the additional cost of a Chapter 13 filing. Because attorneys are often among the first
to receive payment from the Chapter 13 filing, however, the financial benefit of filing
under this plan is largely invariant to the ultimate success of the bankruptcy filing. By
spacing out the attorney payments over the course of the filing, attorneys would have a
smaller incentive to push households into Chapter 13 bankruptcy when the probability of
dismissal is high.
31

References
Allgood, P.C. and M.O. Bachman (2006) “Effects of Specialization on Treatment and
Outcomes In Screen-Detected Breast Cancers in Wales: Cohort Study.” British
Journal of Cancer 94, pp. 36-42.
Braucher, J. (1993) “Lawyers and Consumer Bankruptcy: One Code, Many Cultures.”
American Bankruptcy Law Journal 67(4), pp. 501-583
Chandra, A. and D. Staiger (2004) “Testing A Roy Model With Productivity Spillovers:
Evidence From the Treatment of Heart Attacks.” NBER Working Paper #10811.
Culhane, M. B. and M. M. White (1999) “Taking the New Consumer Bankruptcy Model
for a Test Drive: Means-Testing Real Chapter 7 Debtors.” American Bankruptcy
Institute Law Review 7 (1).
Domowitz, I. and R.L. Sartain (1999) “Determinants of the Consumer Bankruptcy
Decision.” The Journal of Finance 54 (1), pp. 403-420.
Epstein, A., J. Ketcham and S. Nicholson (2005) “The Welfare Effect of Physician
Specialization: Do We Want Physicians to Practice Alike?” Working Paper.
Imbens, G.W. and J.D. Angrist (1994) “Identification and Estimation of Local Average
Treatment Effects” Econometrica 62(2), pp. 467-475.
Lefgren, L. and F. McIntyre (2007) “Explaining the Puzzle of Cross-State Differences in
Bankruptcy Rates.” Working Paper.
Li, W. and P Sarte (2002) “The Macroeconomics of U.S. Consumer Bankruptcy Choice:
Chapter 7 or Chapter 13?” Federal Reserve Bank Working Paper #03-14.
McGuire, T.G. (2000) “Physician Agency.” in Culyer, A.G., and J.P. Newhouse (eds.)
Handbook of Health Economics, North Holland pp. 461-536.
32

Nelson, J.P. (1999) “Consumer Bankruptcy and Chapter Choice: State Panel Evidence.”
Contemporary Economic Policy 17, pp. 552-566.
Neustadter, G. (1986) “When Lawyer and Client Meet: Observations of Interviewing and
Counseling Behavior in the Consumer Bankruptcy Law Office.” Buffalo Law
Review 35(1), pp. 177-284.
Sullivan, T.A., E. Warren and J.L. Westbrook (1988) “Laws, Models, and Real People:
Choice of Chapter in Personal Bankruptcy.” Law & Social Inquiry 13(4), pp. 661-
706.
Sullivan, T.A., E. Warren and J.L. Westbrook (1989) As We Forgive Our Debtors.
Oxford University Press: New York, New York.
Sullivan, T.A., E. Warren and J.L. Westbrook (1994) “The Persistence of Local Legal
Culture: Twenty Years of Experience From the Federal Bankruptcy Courts.”
Harvard Journal of Law and Public Policy 17(3), pp. 801-865.
Sullivan, T.A., E. Warren and J.L. Westbrook (2000) The Fragile Middle Class. Yale
University Press: New Haven, Connecticut.
Sullivan, A.C. and D.B. Worden (1990) “Rehabilitation or Liquidation: Consumers’
Choices in Bankruptcy.” Journal of Consumer Affairs 24(1), pp. 69-88.
White, M.J. (2005) “Economic Analysis of Corporate and Personal Bankruptcy Law.”
NBER Working Paper #11536.
33

0.1
.2.3
.4A
vera
ge F
ract
ion
Cha
pter
13
File
d
10-14 15-29 30-49 50-99 100-249 250-Number of Annual Filings
Figure 2: Chapter 13 Filing Rate by Annual Filing Rate
0.1
.2.3
.4Fr
actio
n
0 .2 .4 .6 .8 1Fraction Chapter 13 Filings
Figure 1: Histogram of Chapter 13 Filing Rate
34

Table 1: Summary Statistics
VariableCensus Block
SampleUtah Detailed
SampleTexas Detailed
Sample
Texas 0.242 0.000 1.000California 0.199 0.000 0.000Utah 0.559 1.000 0.000Filed 13 0.357 0.379 0.426Lawyer Fraction 13 0.351 0.360 0.482Urban 0.920 0.929 0.877Married 0.651 0.681 0.659Divorced 0.106 0.100 0.117Household of 2 0.286 0.274 0.306Household of 3 0.170 0.171 0.181Household of 4 0.162 0.170 0.166Household of 5 0.096 0.110 0.080Household of 6 0.052 0.064 0.032Household over 6 0.042 0.051 0.020Finished High School 0.719 0.714 0.719Finished college 0.205 0.174 0.200Black 0.052 0.007 0.130Hispanic 0.150 0.107 0.180Other Race 0.082 0.055 0.047Age Below 6 0.103 0.117 0.092Age 6 to 18 0.211 0.228 0.205Age 19 to 24 0.095 0.110 0.075Age 25 to 29 0.080 0.082 0.073Age 30 to 39 0.155 0.141 0.166Age 40 to 49 0.140 0.126 0.154Age 50 to 59 0.092 0.081 0.103Unemployed 0.035 0.036 0.033Self-Employed 0.137 0.137 0.127HH income Under $10,000 0.062 0.053 0.076HH income $10-$20,000 0.097 0.098 0.108HH income $20-$30,000 0.119 0.124 0.127HH income $30-$40,000 0.129 0.142 0.128HH income $40-$50,000 0.121 0.132 0.113HH income $50-$60,000 0.106 0.116 0.100HH income $60-$75,000 0.123 0.125 0.120HH income $75-$100,000 0.120 0.116 0.117Fraction Homeowners 0.606 0.654 0.62025th Percentile of Log Housing Value 109,098 109,098 59,87475th Percentile of Log Housing Value 162,755 162,755 98,7162000 0.092 1.000 0.0002001 0.106 0.000 0.0002002 0.130 0.000 0.0002003 0.181 0.000 0.1182004 0.197 0.000 0.2182005 0.232 0.000 0.4982006 0.062 0.000 0.166Monthly Income 2,481 3,137Fraction with no Income 0.129 0.014Land Assets 94,706 76,201Fraction with no Land Assets 0.314 0.278Personal Assets 17,154 31,518Fraction with no Personal Assets 0.001 0.002Secured Debts 103,297 82,216Fraction with no Secured Debts 0.095 0.106Unsecured Debts 45,966 52,085Fraction with no Unsecured Debts 0.018 0.016Observations 121,091 1,989 15,27035

Table 2: OLS Estimates of Lawyer Impact on Chapter 13 Choice(1) (2) (3) (4) (5) (6)
Lawyer Fraction 13 0.977 0.957 1.01 0.899 0.908 0.763[0.006]** [0.006]** [0.037]** [0.038]** [0.015]** [0.016]**
Urban -0.008 -0.048 0.014[0.006] [0.048] [0.016]
Married 0.085 0.293 0.129[0.026]** [0.192] [0.071]
Divorced 0.086 0.105 0.118[0.042]* [0.308] [0.110]
Household of 2 0.008 -0.348 0.151[0.030] [0.199] [0.077]
Household of 3 0.057 -0.141 0.075[0.036] [0.250] [0.088]
Household of 4 0.018 -0.592 0.207[0.040] [0.238]* [0.096]*
Household of 5 0.046 0.054 0.075[0.043] [0.302] [0.120]
Household of 6 -0.007 -0.184 0.185[0.049] [0.298] [0.156]
Household over 6 0.019 -0.172 0.224[0.058] [0.382] [0.176]
Finished High School 0.078 0.051 0.185[0.032]* [0.223] [0.067]**
Finished college -0.126 -0.024 0.082[0.021]** [0.161] [0.062]
Black 0.194 1.483 0.182[0.019]** [0.643]* [0.025]**
Hispanic 0.047 0.331 0[0.019]* [0.160]* [0.042]
Other Race 0.018 0.234 -0.028[0.017] [0.189] [0.077]
Age Below 6 -0.002 0.301 -0.11[0.061] [0.414] [0.174]
Age 6 to 18 0.01 -0.179 0.016[0.047] [0.364] [0.132]
Age 19 to 24 0.034 0.458 0.237[0.054] [0.320] [0.113]*
Age 25 to 29 -0.009 -0.213 -0.154[0.053] [0.327] [0.142]
Age 30 to 39 0.039 -0.197 -0.104[0.040] [0.310] [0.100]
Age 40 to 49 0.034 0.479 -0.017[0.044] [0.337] [0.113]
Age 50 to 59 -0.07 -0.413 -0.281[0.047] [0.462] [0.134]*
Unemployed -0.089 -1.047 -0.037[0.064] [0.517]* [0.148]
Self-Employed -0.02 0.114 0.059[0.026] [0.173] [0.066]
HH income Under $10,000 -0.012 -0.06 0.226[0.043] [0.365] [0.112]*
HH income $10-$20,000 -0.003 0.05 0.295[0.037] [0.303] [0.112]**
HH income $20-$30,000 -0.078 -0.412 0.232[0.038]* [0.245] [0.108]*
HH income $30-$40,000 -0.036 0.254 0.216[0.033] [0.270] [0.095]*36

HH income $40-$50,000 -0.005 0.145 0.116[0.034] [0.281] [0.101]
HH income $50-$60,000 0.019 -0.046 0.102[0.034] [0.258] [0.102]
HH income $60-$75,000 -0.079 -0.238 -0.087[0.034]* [0.287] [0.092]
HH income $75-$100,000 -0.091 -0.252 0.085[0.032]** [0.260] [0.096]
Fraction Homeowners 0.055 0.141 0.008[0.011]** [0.075] [0.024]
25th Percentile of Log Housing Value -0.002 -0.073 -0.041[0.008] [0.091] [0.017]*
75th Percentile of Log Housing Value 0.002 0.074 -0.011[0.008] [0.084] [0.020]
Texas -0.018[0.007]**
California 0.003[0.008]
2001 0.001[0.005]
2002 0.001[0.005]
2003 -0.009[0.005]
2004 -0.004 -0.011[0.005] [0.011]
2005 -0.004 -0.002[0.006] [0.011]
2006 0 0.038[0.008] [0.013]**
Log Monthly Income 0.036 0.099[0.019] [0.008]**
Dummy- No income 0.27 0.607[0.153] [0.065]**
Log Land Assets 0.056 -0.014[0.016]** [0.005]**
Dummy- no Land Assets 0.468 -0.146[0.188]* [0.052]**
Log Personal Assets 0.023 -0.027[0.008]** [0.004]**
Dummy- no Personal Assets -0.008 -0.16[0.076] [0.086]
Log Secured Debts -0.035 0.056[0.013]** [0.005]**
Dummy- no Secured Debts -0.377 0.321[0.118]** [0.044]**
Log Unsecured Debts -0.068 -0.051[0.011]** [0.003]**
Dummy- no Unsecured Debts -0.331 -0.179[0.142]* [0.038]**
Constant 0.014 -0.098 0.016 -0.074 -0.011 -0.281[0.002]** [0.094] [0.010] [0.872] [0.007] [0.243]
Observations 121,091 121,091 1,989 1,989 15,270 15,270R-squared 0.26 0.26 0.22 0.3 0.21 0.32Partial R Squared of Chapter 13 Filing Rate 0.2 0.16 0.11Sample Census Census Utah Utah Texas TexasRobust standard errors in brackets* significant at 5%; ** significant at 1% 37
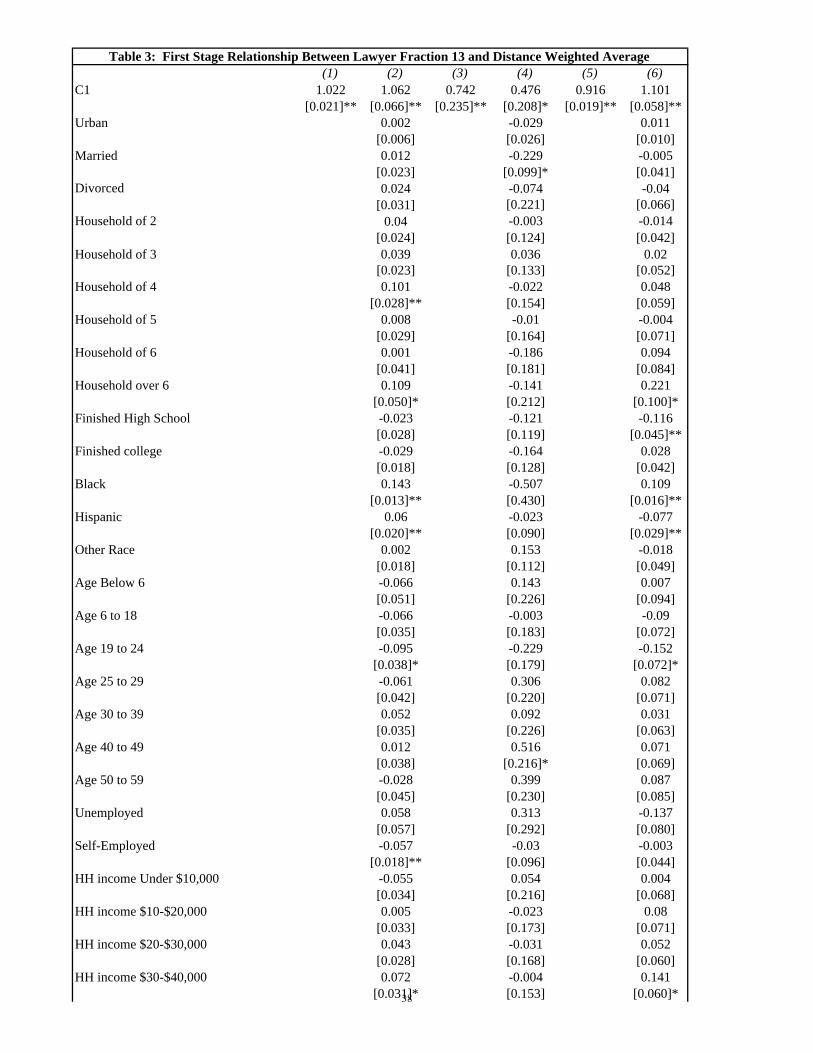
Table 3: First Stage Relationship Between Lawyer Fraction 13 and Distance Weighted Average(1) (2) (3) (4) (5) (6)
C1 1.022 1.062 0.742 0.476 0.916 1.101[0.021]** [0.066]** [0.235]** [0.208]* [0.019]** [0.058]**
Urban 0.002 -0.029 0.011[0.006] [0.026] [0.010]
Married 0.012 -0.229 -0.005[0.023] [0.099]* [0.041]
Divorced 0.024 -0.074 -0.04[0.031] [0.221] [0.066]
Household of 2 0.04 -0.003 -0.014[0.024] [0.124] [0.042]
Household of 3 0.039 0.036 0.02[0.023] [0.133] [0.052]
Household of 4 0.101 -0.022 0.048[0.028]** [0.154] [0.059]
Household of 5 0.008 -0.01 -0.004[0.029] [0.164] [0.071]
Household of 6 0.001 -0.186 0.094[0.041] [0.181] [0.084]
Household over 6 0.109 -0.141 0.221[0.050]* [0.212] [0.100]*
Finished High School -0.023 -0.121 -0.116[0.028] [0.119] [0.045]**
Finished college -0.029 -0.164 0.028[0.018] [0.128] [0.042]
Black 0.143 -0.507 0.109[0.013]** [0.430] [0.016]**
Hispanic 0.06 -0.023 -0.077[0.020]** [0.090] [0.029]**
Other Race 0.002 0.153 -0.018[0.018] [0.112] [0.049]
Age Below 6 -0.066 0.143 0.007[0.051] [0.226] [0.094]
Age 6 to 18 -0.066 -0.003 -0.09[0.035] [0.183] [0.072]
Age 19 to 24 -0.095 -0.229 -0.152[0.038]* [0.179] [0.072]*
Age 25 to 29 -0.061 0.306 0.082[0.042] [0.220] [0.071]
Age 30 to 39 0.052 0.092 0.031[0.035] [0.226] [0.063]
Age 40 to 49 0.012 0.516 0.071[0.038] [0.216]* [0.069]
Age 50 to 59 -0.028 0.399 0.087[0.045] [0.230] [0.085]
Unemployed 0.058 0.313 -0.137[0.057] [0.292] [0.080]
Self-Employed -0.057 -0.03 -0.003[0.018]** [0.096] [0.044]
HH income Under $10,000 -0.055 0.054 0.004[0.034] [0.216] [0.068]
HH income $10-$20,000 0.005 -0.023 0.08[0.033] [0.173] [0.071]
HH income $20-$30,000 0.043 -0.031 0.052[0.028] [0.168] [0.060]
HH income $30-$40,000 0.072 -0.004 0.141[0.031]* [0.153] [0.060]*38

HH income $40-$50,000 0.038 0.08 0.105[0.026] [0.145] [0.065]
HH income $50-$60,000 -0.021 0.268 -0.02[0.024] [0.133]* [0.058]
HH income $60-$75,000 -0.001 -0.047 0.019[0.025] [0.141] [0.051]
HH income $75-$100,000 0.012 0.057 -0.015[0.023] [0.142] [0.051]
Fraction Homeowners 0.025 0.072 0.026[0.008]** [0.046] [0.017]
25th Percentile of Log Housing Value 0.011 0.041 0.004[0.006] [0.049] [0.011]
75th Percentile of Log Housing Value -0.002 0.052 -0.004[0.006] [0.040] [0.011]
Texas -0.042[0.014]**
California -0.03[0.009]**
2001 0.002[0.004]
2002 0[0.007]
2003 0.004[0.004]
2004 0.008 0.007[0.005] [0.007]
2005 0.015 0.044[0.011] [0.010]**
2006 -0.011 -0.049[0.010] [0.012]**
Log Monthly Income 0.019 0.005[0.009]* [0.003]
Dummy- No income 0.128 -0.026[0.072] [0.031]
Log Land Assets 0.031 -0.006[0.009]** [0.003]
Dummy- no Land Assets 0.271 -0.048[0.104]* [0.031]
Log Personal Assets 0.008 -0.023[0.004] [0.002]**
Dummy- no Personal Assets -0.131 0.008[0.206] [0.050]
Log Secured Debts -0.021 0.019[0.006]** [0.003]**
Dummy- no Secured Debts -0.184 0.124[0.058]** [0.027]**
Log Unsecured Debts -0.031 -0.014[0.004]** [0.001]**
Dummy- no Unsecured Debts -0.168 -0.039[0.053]** [0.020]
Constant -0.008 -0.163 0.096 -0.826 0.046 0.134[0.008] [0.087] [0.082] [0.555] [0.010]** [0.159]
Observations 121,091 121,091 1,989 1,989 15,270 15,270R-squared 0.21 0.22 0.02 0.1 0.23 0.29F-Test for Excluded Instrument 2383.86 261.17 9.94 5.23 2285.42 365.15Sample Census Census Utah Utah Texas TexasRobust standard errors in brackets* significant at 5%; ** significant at 1% 39

Table 4: IV Estimates of Lawyer Impact on Chapter 13 Choice(1) (2) (3) (4) (5) (6)
Lawyer Fraction 13 1.001 0.956 0.96 1.04 0.953 0.935[0.018]** [0.025]** [0.265]** [0.426]* [0.030]** [0.075]**
Urban -0.008 -0.042 0.012[0.006] [0.053] [0.017]
Married 0.085 0.325 0.121[0.026]** [0.205] [0.069]
Divorced 0.086 0.113 0.111[0.043]* [0.315] [0.110]
Household of 2 0.008 -0.338 0.17[0.030] [0.210] [0.076]*
Household of 3 0.057 -0.138 0.087[0.036] [0.254] [0.088]
Household of 4 0.018 -0.582 0.207[0.040] [0.241]* [0.095]*
Household of 5 0.046 0.069 0.081[0.043] [0.301] [0.119]
Household of 6 -0.007 -0.139 0.167[0.050] [0.328] [0.157]
Household over 6 0.019 -0.133 0.166[0.058] [0.388] [0.178]
Finished High School 0.077 0.066 0.234[0.032]* [0.229] [0.069]**
Finished college -0.126 0.003 0.077[0.021]** [0.195] [0.062]
Black 0.194 1.526 0.157[0.020]** [0.633]* [0.026]**
Hispanic 0.047 0.333 0.034[0.019]* [0.161]* [0.043]
Other Race 0.018 0.206 -0.037[0.017] [0.201] [0.077]
Age Below 6 -0.002 0.286 -0.112[0.061] [0.402] [0.176]
Age 6 to 18 0.01 -0.187 0.048[0.047] [0.364] [0.132]
Age 19 to 24 0.034 0.487 0.299[0.054] [0.318] [0.118]*
Age 25 to 29 -0.009 -0.263 -0.162[0.053] [0.376] [0.144]
Age 30 to 39 0.04 -0.218 -0.116[0.040] [0.330] [0.101]
Age 40 to 49 0.034 0.396 -0.025[0.044] [0.463] [0.113]
Age 50 to 59 -0.07 -0.466 -0.301[0.047] [0.510] [0.136]*
Unemployed -0.089 -1.096 -0.004[0.064] [0.517]* [0.145]
Self-Employed -0.02 0.123 0.072[0.027] [0.176] [0.066]
HH income Under $10,000 -0.012 -0.064 0.25[0.043] [0.374] [0.114]*
HH income $10-$20,000 -0.004 0.055 0.305[0.037] [0.307] [0.111]**
HH income $20-$30,000 -0.078 -0.405 0.231[0.037]* [0.246] [0.108]*
HH income $30-$40,000 -0.036 0.258 0.201[0.033] [0.273] [0.095]*40
HH income $40-$50,000 -0.005 0.135 0.101[0.034] [0.290] [0.098]
HH income $50-$60,000 0.019 -0.083 0.106[0.034] [0.292] [0.103]
HH income $60-$75,000 -0.079 -0.233 -0.079[0.034]* [0.285] [0.094]
HH income $75-$100,000 -0.091 -0.266 0.088[0.032]** [0.266] [0.097]
Fraction Homeowners 0.055 0.128 0.006[0.012]** [0.095] [0.024]
25th Percentile of Log Housing Value -0.002 -0.082 -0.04[0.008] [0.092] [0.018]*
75th Percentile of Log Housing Value 0.002 0.068 -0.01[0.008] [0.087] [0.020]
Texas -0.018[0.008]*
California 0.003[0.008]
2001 0[0.005]
2002 0.001[0.005]
2003 -0.009[0.005]
2004 -0.005 -0.017[0.005] [0.012]
2005 -0.004 0.017[0.007] [0.014]
2006 0 0.014[0.008] [0.016]
Log Monthly Income 0.033 0.098[0.021] [0.008]**
Dummy- No income 0.251 0.609[0.171] [0.067]**
Log Land Assets 0.052 -0.013[0.021]* [0.005]**
Dummy- no Land Assets 0.432 -0.141[0.220] [0.052]**
Log Personal Assets 0.022 -0.023[0.009]* [0.005]**
Dummy- no Personal Assets 0.005 -0.162[0.101] [0.087]
Log Secured Debts -0.032 0.053[0.016]* [0.005]**
Dummy- no Secured Debts -0.352 0.298[0.138]* [0.046]**
Log Unsecured Debts -0.064 -0.049[0.016]** [0.003]**
Dummy- no Unsecured Debts -0.306 -0.171[0.153]* [0.039]**
Constant 0.006 -0.098 0.034 0.034 -0.033 -0.461[0.006] [0.094] [0.093] [0.989] [0.015]* [0.257]
R-squared 0.25 0.26 0.22 0.3 0.21 0.31Partial R-Squared of Chapter 13 Filing Rate 0.2 0.16 0.11Sample Census Census Utah Utah Texas TexasObservations 121,091 121,091 1,989 1,989 15,270 15,270Robust standard errors in brackets* significant at 5%; ** significant at 1% 41

Table 5: Instrument Regressed on Other X's(1) (2) (3)
Urban -0.014 -0.025 0.003[0.004]** [0.008]** [0.006]
Married 0.029 0.001 0.043[0.018] [0.040] [0.027]
Divorced 0.072 0.044 0.073[0.029]* [0.067] [0.045]
Household of 2 -0.095 -0.14 -0.084[0.021]** [0.052]** [0.033]*
Household of 3 -0.061 -0.123 -0.08[0.019]** [0.038]** [0.038]*
Household of 4 -0.027 -0.101 -0.045[0.019] [0.047]* [0.031]
Household of 5 -0.074 -0.204 -0.026[0.025]** [0.059]** [0.040]
Household of 6 -0.1 -0.28 0.01[0.032]** [0.059]** [0.051]
Household over 6 -0.096 -0.275 0.103[0.045]* [0.074]** [0.058]
Finished High School -0.087 0.022 -0.152[0.022]** [0.038] [0.031]**
Finished college -0.006 -0.047 0[0.020] [0.035] [0.033]
Black 0.061 0.44 0.032[0.010]** [0.144]** [0.011]**
Hispanic 0.034 0.025 -0.109[0.017]* [0.034] [0.025]**
Other Race 0.016 0.1 0.064[0.014] [0.034]** [0.042]
Age Below 6 -0.082 -0.079 0.008[0.036]* [0.072] [0.065]
Age 6 to 18 -0.049 0.125 -0.084[0.029] [0.057]* [0.047]
Age 19 to 24 -0.099 0.05 -0.188[0.032]** [0.072] [0.074]*
Age 25 to 29 0 0.103 -0.031[0.033] [0.082] [0.055]
Age 30 to 39 0.062 0.108 0.035[0.031]* [0.072] [0.051]
Age 40 to 49 0.075 0.145 -0.021[0.031]* [0.083] [0.048]
Age 50 to 59 0.039 -0.054 0.024[0.033] [0.088] [0.051]
Unemployed 0.07 0.077 -0.049[0.043] [0.096] [0.088]
Self-Employed -0.043 -0.064 -0.061[0.016]** [0.035] [0.027]*
HH income Under $10,000 -0.062 -0.063 -0.135[0.034] [0.064] [0.061]*
HH income $10-$20,000 -0.035 -0.023 -0.124[0.034] [0.053] [0.053]*
HH income $20-$30,000 0.023 -0.049 -0.04[0.033] [0.060] [0.050]
HH income $30-$40,000 -0.021 -0.049 -0.048[0.027] [0.053] [0.048]
HH income $40-$50,000 0.03 -0.013 -0.016[0.028] [0.032] [0.041]42

HH income $50-$60,000 0.046 -0.009 -0.001[0.029] [0.039] [0.040]
HH income $60-$75,000 0.018 0.021 -0.058[0.021] [0.032] [0.036]
HH income $75-$100,000 0.058 0.09 -0.004[0.021]** [0.042]* [0.030]
Fraction Homeowners 0.011 0.041 -0.012[0.009] [0.017]* [0.012]
25th Percentile of Log Housing Value 0.015 0.044 -0.009[0.004]** [0.016]** [0.007]
75th Percentile of Log Housing Value 0.005 -0.018 -0.002[0.006] [0.016] [0.007]
Texas 0.186[0.006]**
California -0.008[0.009]
2001 -0.044[0.002]**
2002 -0.031[0.004]**
2003 -0.045[0.002]**
2004 -0.044 0.026[0.003]** [0.002]**
2005 -0.167 -0.138[0.003]** [0.003]**
2006 0.098 0.168[0.003]** [0.003]**
Log Monthly Income 0.002 0[0.002] [0.001]
Dummy- No income 0.012 0.011[0.013] [0.009]
Log Land Assets -0.004 0.001[0.002] [0.001]
Dummy- no Land Assets -0.041 0.017[0.024] [0.012]
Log Personal Assets -0.002 0[0.001]* [0.001]
Dummy- no Personal Assets 0.088 0.001[0.075] [0.009]
Log Secured Debts 0.002 0.001[0.001] [0.001]
Dummy- no Secured Debts 0.013 0.006[0.012] [0.009]
Log Unsecured Debts 0 -0.001[0.001] [0.000]*
Dummy- no Unsecured Debts -0.005 -0.004[0.008] [0.005]
Constant 0.219 0.147 0.825[0.093]* [0.199] [0.124]**
R-squared 0.77 0.25 0.8Partial R-Squared of Neighborhood and Individual Characteristics 0.02 0.25 0.02Observations 121,091 1,989 15,270Robust standard errors in brackets* significant at 5%; ** significant at 1%
43

Table 6: Robustness ChecksExogenous Instrumented
Full Sample Utah Texas Full Sample Utah Texas
Lawyer Propensity Regressor 0.984 0.861 0.96 1.053 1.27 1.136[0.006] [0.04] [0.016] [0.029] [0.613] [0.071]
Probit Marginal Effects 1.132 1.213 1.006 1.094 1.549 1.21[0.011] [0.681] [0.025] [0.034] [0.512] [0.101]
Census Black Fixed Effects 0.958 0.931 0.745 - - -[0.007] [0.057] [0.018]
Prior Filings - 0.956 - - 0.66 -[0.016]** [0.145]
Pre-BAPCA law change 0.965 - 0.782 0.924 - 1.029[0.007] [0.193] [0.031]** [0.081]
Alternate instrument that does not weight by lawyer's # of filings - - - 0.94 0.76 0.933
[0.033] [0.315]* [0.104]**
Robust standard errors in brackets* significant at 5%; ** significant at 1%Prior Filings includes only 2004 Utah data and has no personal filing information.
44
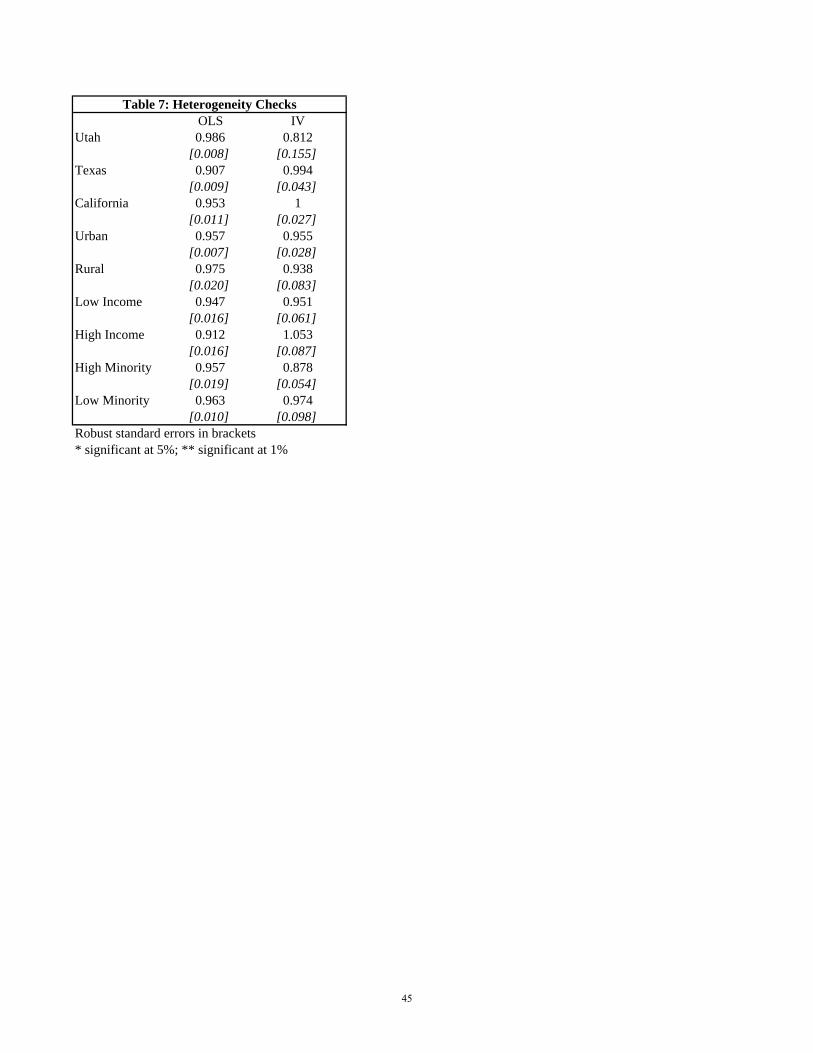
Table 7: Heterogeneity ChecksOLS IV
Utah 0.986 0.812[0.008] [0.155]
Texas 0.907 0.994[0.009] [0.043]
California 0.953 1[0.011] [0.027]
Urban 0.957 0.955[0.007] [0.028]
Rural 0.975 0.938[0.020] [0.083]
Low Income 0.947 0.951[0.016] [0.061]
High Income 0.912 1.053[0.016] [0.087]
High Minority 0.957 0.878[0.019] [0.054]
Low Minority 0.963 0.974[0.010] [0.098]
Robust standard errors in brackets* significant at 5%; ** significant at 1%
45

Table 8: Does Lawyer Specialization Improve Bankruptcy Outcomes (Conditional on Choosing Chapter 13)Specification
(1) (2) (3) (4) (5) (6) (7) (8)
Case Dismissed
Case Dismissed
Log Monthly
Expenditure
Log Monthly
Expenditure
Lawyer Fees
Lawyer Fees
Up-Front Lawyer Fees
Up-Front Lawyer
FeesLawyer Fraction 13 -0.06 0.35 0.04 0.06 45.30 103.18 -305.93 -157.25
[0.054] [0.201]+ [0.027] [0.055] [15.725]** [39.109]** [25.127]** [70.911]*Log(Total Lawyer Filings) 0.05 0.02 0.00 0.00 18.32 14.93 6.01 -2.70
[0.013]** [0.018] [0.006] [0.007] [4.664]** [5.001]** [8.168] [9.582]2004 -0.10 -0.11 0.00 0.00 -3.49 -5.23 30.86 26.39
[0.020]** [0.021]** [0.012] [0.012] [7.279] [7.340] [10.851]** [10.551]*2005 0.00 0.00 0.01 0.02 -12.13 -5.46 -6.30 10.83
[0.000] [0.000] [0.011] [0.013] [8.222] [8.745] [12.618] [15.024]2006 0.27 0.27
[0.022]** [0.022]**Log Monthly Income -0.05 -0.05 0.94 0.94 59.04 59.47 38.44 39.55
[0.023]* [0.024]* [0.022]** [0.023]** [9.932]** [9.897]** [9.994]** [10.058]**Dummy- No income -0.62 -0.65 4.44 4.45 442.70 443.14 407.28 408.40
[0.221]** [0.223]** [0.940]** [0.935]** [89.597]** [89.240]** [115.827]** [116.142]**Log Land Assets 0.02 0.02 0.02 0.02 -5.91 -6.57 18.42 16.72
[0.014] [0.015] [0.010] [0.010] [4.945] [4.854] [6.111]** [6.078]**Dummy- no Land Assets 0.37 0.33 0.12 0.12 -42.00 -48.38 177.71 161.31
[0.146]* [0.151]* [0.096] [0.096] [53.506] [52.161] [64.501]** [63.791]*Log Personal Assets -0.11 -0.10 0.00 0.00 -4.08 -3.73 16.33 17.23
[0.012]** [0.012]** [0.007] [0.007] [3.091] [3.081] [5.262]** [5.331]**Dummy- no Personal Assets -1.49 -1.42 -4.70 -4.70 258.09 268.50 371.37 398.12
[0.184]** [0.197]** [0.917]** [0.913]** [132.865] [128.714]* [302.281] [297.822]Log Secured Debts 0.10 0.10 0.01 0.01 10.58 11.15 1.47 2.96
[0.016]** [0.016]** [0.017] [0.017] [6.827] [6.840] [6.524] [6.661]Dummy- no Secured Debts 0.83 0.87 0.09 0.09 102.95 112.05 123.45 146.82
[0.169]** [0.169]** [0.184] [0.182] [80.306] [80.854] [88.334] [89.518]Log Unsecured Debts -0.03 -0.03 0.01 0.01 -1.53 -1.47 9.66 9.82
[0.006]** [0.006]** [0.004] [0.004] [1.594] [1.591] [2.645]** [2.636]**Dummy- no Unsecured Debts -0.28 -0.27 -0.04 -0.04 -11.17 -12.67 82.09 78.22
[0.079]** [0.081]** [0.052] [0.052] [16.215] [16.085] [31.861]* [31.870]*Urban 0.05 0.04 0.07 0.07 8.39 7.40 -16.11 -18.67
[0.052] [0.054] [0.030]* [0.030]* [10.913] [10.872] [19.452] [19.175]Married -0.05 -0.08 0.00 0.00 -0.70 -9.44 -110.56 -133.02
[0.201] [0.203] [0.081] [0.081] [40.318] [39.567] [74.514] [75.036]Divorced 0.15 0.13 -0.03 -0.02 -115.45 -118.73 41.23 32.79
[0.376] [0.382] [0.183] [0.183] [73.827] [73.514] [125.862] [125.663]Household of 2 -0.12 -0.08 0.03 0.03 -29.18 -19.58 -37.80 -13.12
[0.202] [0.202] [0.085] [0.085] [53.098] [51.391] [81.627] [81.484]Household of 3 0.27 0.30 -0.01 -0.01 -29.90 -20.89 -29.65 -6.52
[0.239] [0.242] [0.108] [0.108] [68.468] [68.587] [94.839] [95.486]Household of 4 -0.06 -0.03 0.01 0.01 -141.08 -136.10 -1.04 11.76
[0.241] [0.252] [0.148] [0.147] [77.948] [77.216] [110.170] [109.625]Household of 5 -0.09 -0.02 0.19 0.19 -114.83 -104.59 -12.11 14.20
[0.314] [0.322] [0.136] [0.136] [93.887] [93.217] [132.450] [133.355]Household of 6 0.07 0.06 -0.11 -0.11 -68.22 -55.72 23.58 55.68
[0.411] [0.411] [0.203] [0.202] [104.924] [103.587] [146.085] [144.594]Household over 6 0.31 0.20 0.00 -0.01 -111.94 -133.92 -92.09 -148.54
[0.474] [0.489] [0.234] [0.233] [149.876] [151.271] [199.320] [205.696]Finished High School 0.02 0.06 -0.04 -0.04 -51.68 -38.85 -258.31 -225.35
[0.201] [0.206] [0.085] [0.085] [60.397] [61.324] [70.819]** [70.773]**Finished college 0.06 0.10 -0.02 -0.03 15.39 10.04 33.22 19.48
[0.187] [0.187] [0.084] [0.084] [53.146] [53.184] [85.077] [84.358]46

Black 0.17 0.14 -0.01 -0.01 -18.25 -23.65 5.11 -8.75[0.061]** [0.064]* [0.028] [0.028] [16.031] [15.719] [21.909] [21.675]
Hispanic 0.11 0.12 -0.04 -0.03 -52.78 -45.34 -80.86 -61.75[0.116] [0.118] [0.052] [0.051] [43.316] [43.670] [45.206] [45.333]
Other Race 0.01 0.03 0.03 0.03 -62.23 -64.61 -35.67 -41.80[0.224] [0.220] [0.106] [0.106] [55.597] [54.758] [92.041] [89.881]
Age Below 6 -0.12 0.00 -0.29 -0.29 36.35 38.81 -295.47 -289.16[0.469] [0.461] [0.225] [0.223] [108.062] [108.080] [154.095] [156.627]
Age 6 to 18 -0.36 -0.28 -0.08 -0.08 107.91 115.02 -99.78 -81.52[0.350] [0.351] [0.129] [0.127] [97.161] [95.168] [140.466] [140.667]
Age 19 to 24 -0.51 -0.50 -0.18 -0.18 -12.84 -6.04 -350.07 -332.60[0.345] [0.337] [0.135] [0.133] [75.310] [73.255] [116.873]** [114.780]**
Age 25 to 29 -0.26 -0.22 0.07 0.07 -15.23 -13.70 197.50 201.42[0.391] [0.408] [0.157] [0.156] [93.595] [94.304] [156.177] [154.357]
Age 30 to 39 -0.01 -0.03 -0.01 -0.01 -2.54 -5.12 56.70 50.08[0.313] [0.313] [0.145] [0.144] [79.665] [80.143] [107.312] [107.732]
Age 40 to 49 -0.32 -0.29 0.01 0.01 20.86 23.93 -131.32 -123.45[0.330] [0.333] [0.124] [0.124] [69.053] [68.675] [127.315] [127.920]
Age 50 to 59 -0.10 -0.13 -0.15 -0.15 70.49 63.12 -147.90 -166.85[0.352] [0.347] [0.194] [0.193] [88.217] [87.961] [137.955] [139.219]
Unemployed -0.16 -0.06 -0.08 -0.08 -165.27 -152.15 93.21 126.93[0.462] [0.474] [0.144] [0.144] [111.999] [110.142] [146.525] [141.568]
Self-Employed 0.05 0.12 0.18 0.19 45.36 47.19 -24.45 -19.74[0.184] [0.181] [0.118] [0.117] [54.827] [54.737] [85.747] [86.425]
HH income Under $10,000 -0.72 -0.67 0.21 0.21 3.74 5.66 -143.61 -138.68[0.324]* [0.322]* [0.171] [0.170] [88.260] [86.405] [142.529] [140.294]
HH income $10-$20,000 -0.43 -0.36 0.09 0.09 60.39 56.67 -313.97 -323.55[0.302] [0.298] [0.173] [0.172] [72.506] [72.516] [142.806]* [142.335]*
HH income $20-$30,000 -0.72 -0.65 0.23 0.23 -59.17 -58.93 -311.14 -310.53[0.261]** [0.250]** [0.212] [0.211] [89.402] [88.881] [132.199]* [130.057]*
HH income $30-$40,000 -0.58 -0.56 -0.01 -0.01 -36.82 -42.31 -203.60 -217.72[0.274]* [0.274]* [0.108] [0.108] [69.425] [68.950] [126.246] [121.955]
HH income $40-$50,000 -0.92 -0.93 0.08 0.08 75.12 65.75 -160.33 -184.40[0.280]** [0.283]** [0.154] [0.155] [70.118] [68.905] [128.953] [131.077]
HH income $50-$60,000 -0.25 -0.20 -0.01 -0.02 8.27 0.92 -144.69 -163.58[0.276] [0.272] [0.130] [0.131] [74.318] [73.697] [130.803] [129.642]
HH income $60-$75,000 -0.36 -0.36 0.16 0.16 -43.57 -43.22 -116.39 -115.50[0.231] [0.231] [0.160] [0.159] [65.006] [64.701] [129.516] [126.857]
HH income $75-$100,000 -0.30 -0.28 0.20 0.20 -146.71 -148.58 -37.78 -42.57[0.273] [0.270] [0.163] [0.162] [66.130]* [65.894]* [125.656] [125.046]
Fraction Homeowners -0.16 -0.15 0.00 0.00 0.71 -0.53 -0.51 -3.70[0.076]* [0.075]* [0.065] [0.065] [15.961] [15.720] [27.962] [27.381]
25th Percentile of Log Housing Value -0.03 -0.02 0.01 0.01 -20.08 -18.60 10.46 14.28
[0.050] [0.050] [0.022] [0.021] [12.535] [12.681] [20.080] [19.878]75th Percentile of Log Housing Value -0.05 -0.07 0.03 0.03 -5.64 -6.73 -8.12 -10.91
[0.059] [0.059] [0.024] [0.024] [14.939] [15.066] [27.045] [26.868]Constant 2.41 2.21 -0.44 -0.45 1791.66 1755.46 136.59 43.60
[0.670]** [0.663]** [0.509] [0.505] [214.086]** [216.165]* [347.324] [344.084]Observations 2432 2432 6505 6505 3870 3870 3870 3870R-squared 0.12 0.76 0.06 0.12F-Test for Instruments 120 513 418 418
Robust standard errors in brackets + significant at 10%; * significant at 5%; ** significant at 1%
47