chapter 8 capital budgeting techniques © 2005 thomson/south-western
TRANSCRIPT

Chapter 8
Capital BudgetingTechniques
© 2005 Thomson/South-Western

2
What is Capital Budgeting?
The process of planning and evaluating expenditures on assets whose cash flows are expected to extend beyond one yearAnalysis of potential additions to fixed assets
Long-term decisions; involve large expenditures
Very important to firm’s future

3
Generating Ideas for Capital Projects
A firm’s growth and its ability to remain competitive depend on a constant flow of ideas for new products, ways to make existing products better, and ways to produce output at a lower cost.
Procedures must be established for evaluating the worth of such projects.

4
Project Classifications Replacement Decisions:Replacement Decisions: whether to
purchase capital assets to take the place of existing assets to maintain or improve existing operations
Expansion Decisions:Expansion Decisions: whether to purchase capital projects and add them to existing assets to increase existing operations
Independent Projects:Independent Projects: Projects whose cash flows are not affected by decisions made about other projects
Mutually Exclusive Projects:Mutually Exclusive Projects: A set of projects where the acceptance of one project means the others cannot be accepted

5
Similarities between Capital Budgeting and Asset Valuation
Uses same steps as in general asset valuation1. Determine the cost, or purchase price, of the asset.
2. Estimate the cash flows expected from the project.
3. Assess the riskiness of cash flows. [Note that we will
explicitly address the risk issue in the next chapter. For
now, risk is taken as given.]
4. Compute the present value of the expected cash flows to
obtain as estimate of the asset’s value to the firm.
5. Compare the present value of the future expected cash
flows with the initial investment.

6
Net Cash Flows for Project S and Project L
1,5001,200
800300
400900
1,3001,500
^Net Cash Flows, CFt
r e dp AEx cte fte -Tax
Year (T) Project S Project L0a $(3,000) $(3,000)1234

7
What is the Payback Period?
The length of time before the original cost of an investment is recovered from the expected cash flows or . . . How long it takes to get our money back.
yearrecovery -fullduring flowcash Total
yearrecovery -full ofstartat cost eredcovUnre
investment originalofrecovery fullbefore years of Number
PBPayback

8
Payback Period for Project S
=PaybackS 2 + 300/800 = 2.375 years
Net Cash Flow
Cumulative Net CF
1,500
-1,500
800
500
1,200
-300
-3,000
-3,000
300
800
PBS0 1 2 3 4

9
=PaybackL 3 + 400/1,500 = 3.3 years
Net Cash Flow
Cumulative Net CF
400
- 2,600
1,300
- 400
900
- 1,700
- 3,000
- 3,000
1,500
1,100
PBL0 1 2 3 4
Payback Period for Project L

10
Strengths of Payback:Strengths of Payback:• Provides an indication of a
project’s risk and liquidity• Easy to calculate and understand
Weaknesses of Payback:Weaknesses of Payback: • Ignores TVM• Ignores CFs occurring after the
payback period
Strengths and Weaknesses of Payback:

11
Net Present Value: Sum of the PVs of Inflows and Outflows
Cost is CF0 and is generally negative.
NPV
CF
kt
nt
t 0 1
.^
NPV
CF
kCF
t
nt
t
0
01
.^
^

12
What is Project S’s NPV?k = 10%
1,500 8001,200(3,000)
1,363.64
991.74
601.05
204.90
161.33
300
0 1 2 3 4
NPVS =

13
What is Project L’s NPV?
k = 10%
400 1300900(3,000)
363.64
743.80
976.71
1024.52
108.67
1500
0 1 2 3 4
NPVL =

14
Calculator Solution, NPV for L :
NPVL = 108.67 = NPVL
Enter in CF for L:
I
-3,000
400
900
1,300
1,500
10%
CF0
CF1
CF2
CF3
CF4

15
Rationale for the NPV method:
NPV = PV inflows - Cost= Net gain in wealth.
Accept project if NPV > 0.
Choose between mutually exclusive projects on basis of higher NPV. Which adds most value?
16
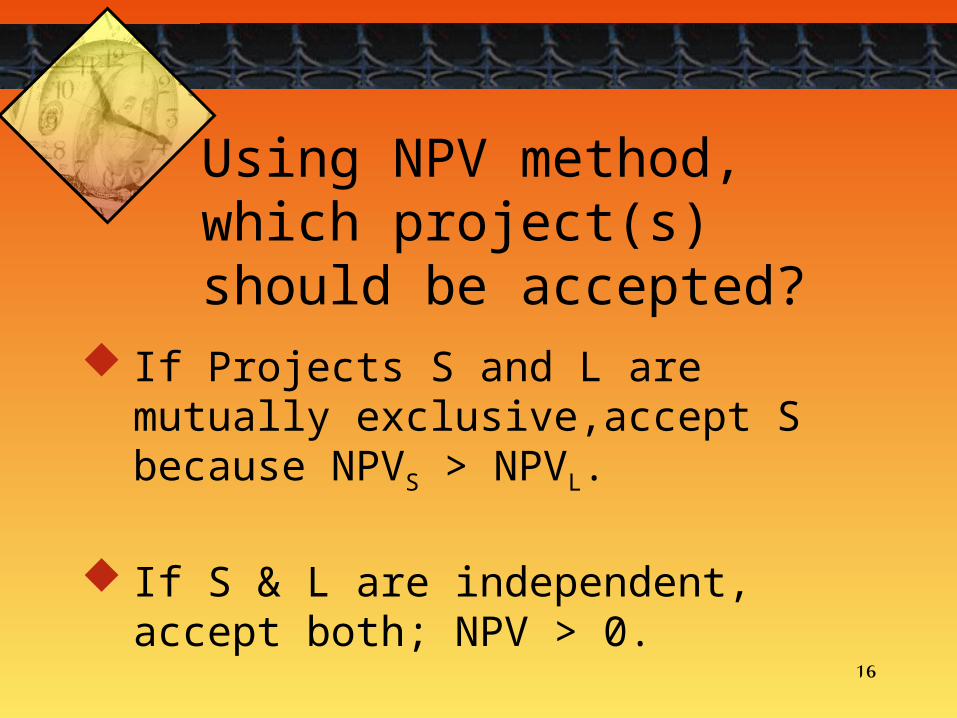
Using NPV method, which project(s) should be accepted?
If Projects S and L are mutually exclusive,accept S because NPVS > NPVL.
If S & L are independent, accept both; NPV > 0.
17
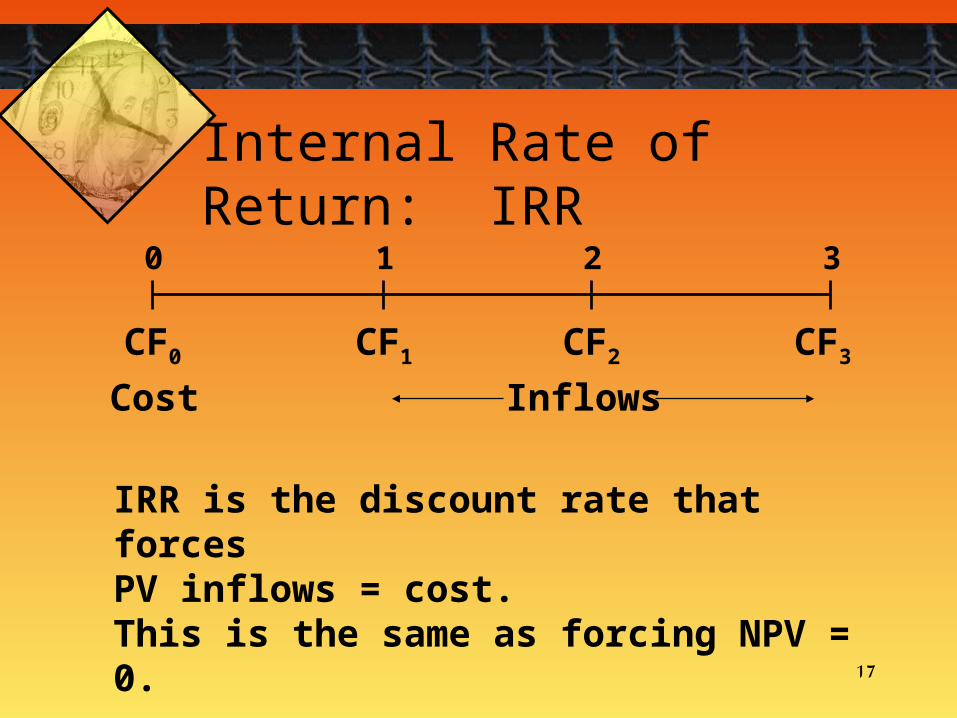
Internal Rate of Return: IRR
0 1 2 3
CF0 CF1 CF2 CF3
Cost Inflows
IRR is the discount rate that forces PV inflows = cost. This is the same as forcing NPV = 0.

18
t
nt
t
CF
kNPV
0 1.
t
nt
t
CF
IRR
0 10.
NPV: Enter k, solve for NPV.
IRR: Enter NPV = 0, solve for IRR.
Calculating IRR

19
What is Project S’s IRR?
NPVS = IRRS = 13.1%Enter CFs in CF register, thenpress IRR:0
(3,000)
IRR = ?0 1 2 3 4
Sum of PVs for CF1-4 = 3,000
1,500 8001,200 300

20
What is Project L’s IRR?
NPVL =Enter CFs in CF register, thenpress IRR: IRRL = 11.4%0
IRR = ?
400 1300900 1500
0 1 2 3 4
Sum of PVs for CF1-4 = 3,000
(3,000)

21
How is a Project’s IRRRelated to a Bond’s YTM?
They are the same thing.A bond’s YTM is the IRRif you invest in the bond.
90 109090
0 1 2 10IRR = ?
-1134.20
IRR = 7.08% (use TVM or CF register)

22
Rationale for the IRR Method:
If IRR (project’s rate of return) > the firm’s required rate of return, k, then some return is left over to boost stockholders’ returns.
Example: k = 10%,IRR = 15%. Profitable.

23
IRR acceptance criteria:
If IRR > k, accept project.
If IRR < k, reject project.

24
Decisions on Projects S and L per IRR
If S and L are independent, accept both. IRRs > k = 10%.
If S and L are mutually exclusive, accept S because IRRS > IRRL .
25
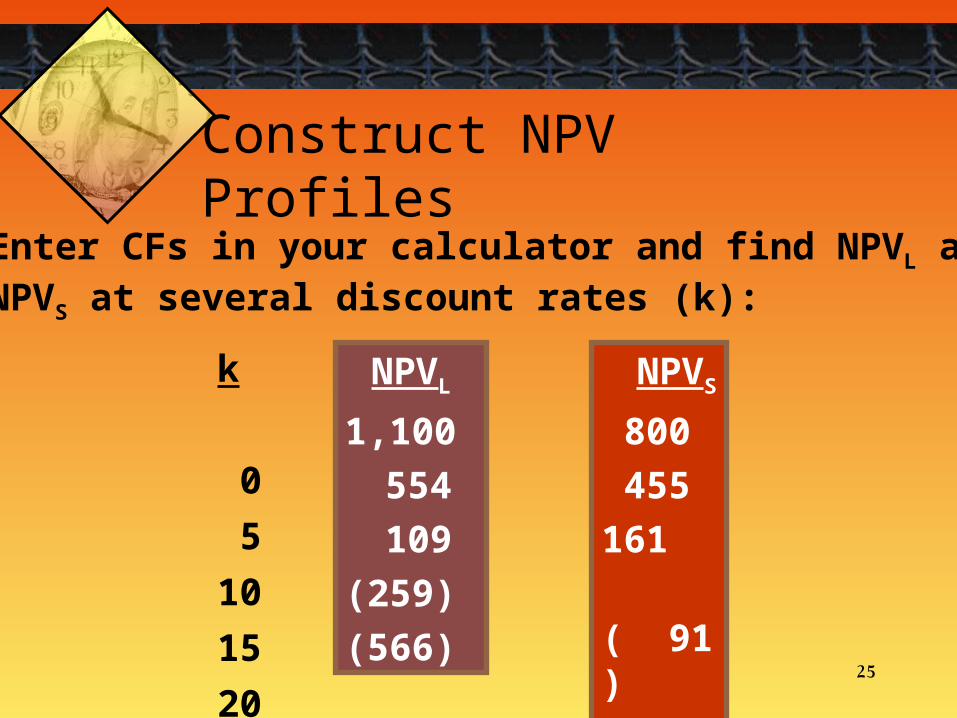
Construct NPV ProfilesEnter CFs in your calculator and find NPVL andNPVS at several discount rates (k):
k
0
5
10
15
20
NPVL
1,100
554
109
(259)
(566)
NPVS
800
455
161
( 91)
(309)

26
IRRL = 11.4%
IRRS = 13.1%
Crossover Point = 8.1%
k
0
5
10
15
20
NPVL
1,100
554
109
(259)
(566)
NPVS
800
455
161
( 91)
(309)
NPV Profiles for Project S and Project L
(800)
(600)
(400)
(200)
0
200
400
600
800
1,000
1,200
0 2 4 6 8 10 12 14 16 18 20
Project L
Project S
27
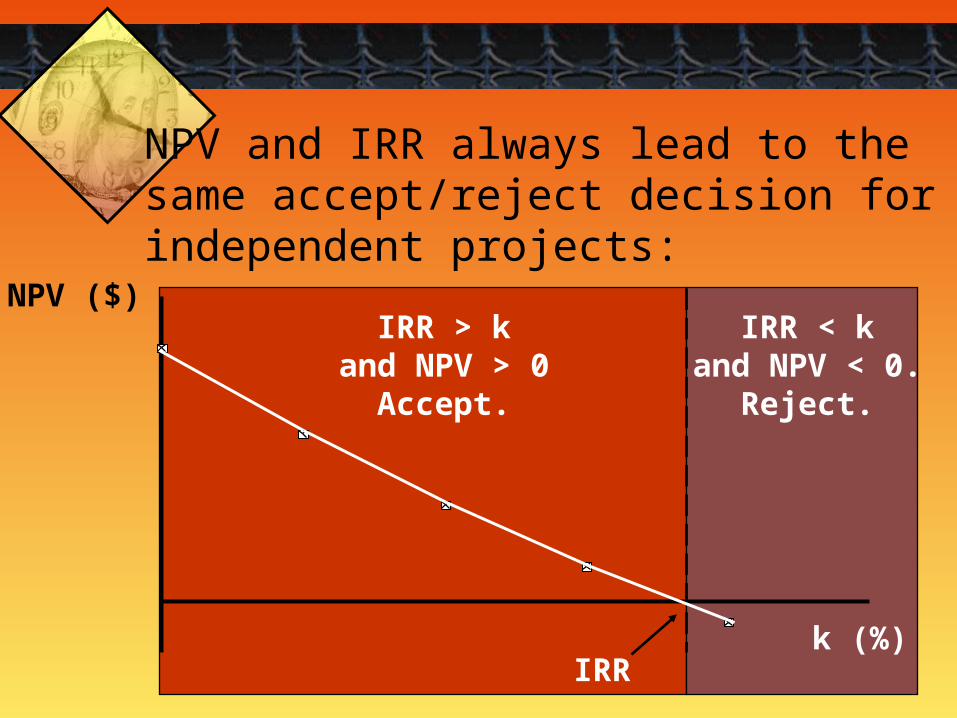
NPV and IRR always lead to thesame accept/reject decision forindependent projects:
IRR < kand NPV < 0.
Reject.
NPV ($)
k (%)IRR
IRR > kand NPV > 0
Accept.

28
Mutually Exclusive Projects
k< 8.1: NPVL> NPVS , IRRL < IRRS
CONFLICT
k> 8.1: NPVS> NPVL , IRRS > IRRL
NO CONFLICT
8.1
NPV
%
IRRs
IRRL
S
L

29
To Find the Crossover Rate:
1. Find cash flow differences between the projects. See data at beginning of the case.
2. Enter these differences in CF register, then press IRR. Crossover rate = 8.11, rounded to 8.1%.
3. Can subtract S from L or vice versa.
4. If profiles don’t cross, one project dominates the other.

30
Two Reasons NPV Profiles Cross:
1) Size (scale) differences.1) Size (scale) differences. Smaller project frees up funds at t = 0 for investment. The higher the opportunity cost, the more valuable these funds, so high k favors small projects.
2) Timing differences.2) Timing differences. Project with faster payback provides more CF in early years for reinvestment. If k is high, early CF especially good, NPVS> NPVL.

31
Reinvestment Rate Assumptions
NPV assumes reinvest at k.
IRR assumes reinvest at IRR.
Reinvest at opportunity cost, k, is more realistic, so NPV method is best. NPV should be used to choose between mutually exclusive projects.

32
End of Chapter 6
Capital Budgeting Techniques