chapter 8 - philadelphia university 8a-acid-base... · the reaction of a hydronium ion with a...
TRANSCRIPT
Chapter 8
Acid-Base Titrations
(Neutralization Titrations

Titrations Curves for Strong Acids and Strong Bases.
• Strong acids and strong bases ionize with 100% efficiency in aqueous solution.
• HA + H2O ----> H3O+ + A-
• MOH ----> M+ + OH-
• The net reaction of strong acids with strong bases is the reaction of a hydronium ion with a hydroxide ion to form water.
H3O+ + OH- ----> H2O
• Titration curves of strong acids with strong bases are divided into domains:
1. Before equivalence.
2. At equivalence.
3. After equivalence.

Before equivalence:
1. Initially, before any base is added to the acid
sample, the [H3O+]total = CHA + [H3O
+]water.
2. If the CHA is greater than 10-6 M, the [H3O+]water can
be ignored.
3. As strong base is added but prior to equivalence,
[H3O+] is consumed. The remaining [H3O
+] is
calculated as follows

At equivalence point
• The acid and base have reacted at the
stoichiometric ratio.
2. The [H3O+] = [OH-] = M
3. The pH = 7 at equivalence.

Beyond equivalence:
1. All the acid is consumed; only base is
present.
2. The amount of base is calculated from the
excess added beyond equivalence.
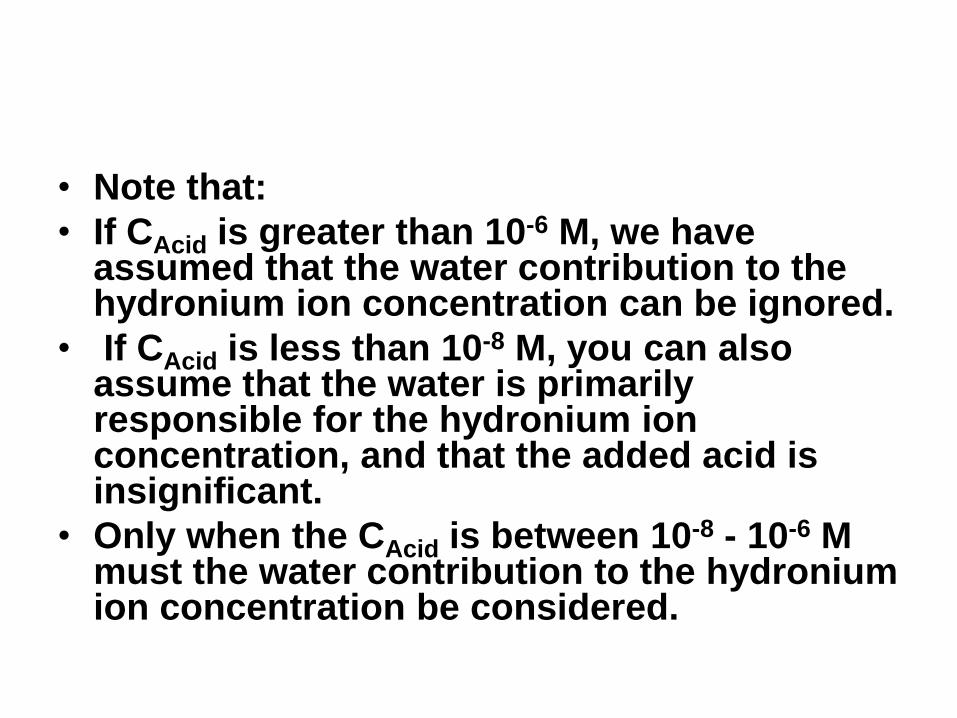
• Note that:
• If CAcid is greater than 10-6 M, we have assumed that the water contribution to the hydronium ion concentration can be ignored.
• If CAcid is less than 10-8 M, you can also assume that the water is primarily responsible for the hydronium ion concentration, and that the added acid is insignificant.
• Only when the CAcid is between 10-8 - 10-6 M must the water contribution to the hydronium ion concentration be considered.

Strong Acid and Strong Base
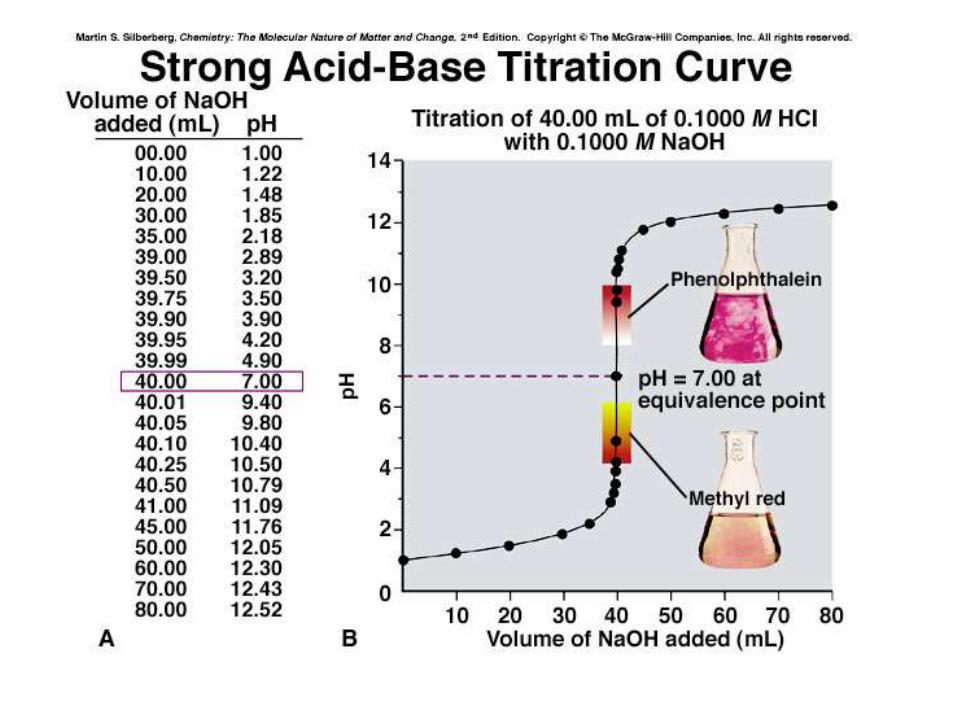
• The following figure shows the titration of a strong
acid with 0.100 M NaOH.
• For titration of a strong acid with a strong base, the equivalence point occurs at a pH of 7.

• We can identify three different regions in this titration experiment.
• Before the equivalence point the pH is determined by the concentration of unneutralized strong acid.
• At the equivalence point the pH, 7, is determined by the dissociation of water.
• After the equivalence point the pH is determined by the concentration of excess strong base that we are adding.

• Acid-base indicators (pH indicators) are weak
organic acids or weak organic bases that change
color as a function of ionization state.
• Acid-base indicators of two types have different
ionization equilibria:
1. Acid-type indicators:
2. Base-type indicators:
Detection of the end-point: Acid-Base Indicators
• As the pH changes, each equilibrium above shifts in
response, producing a color change.
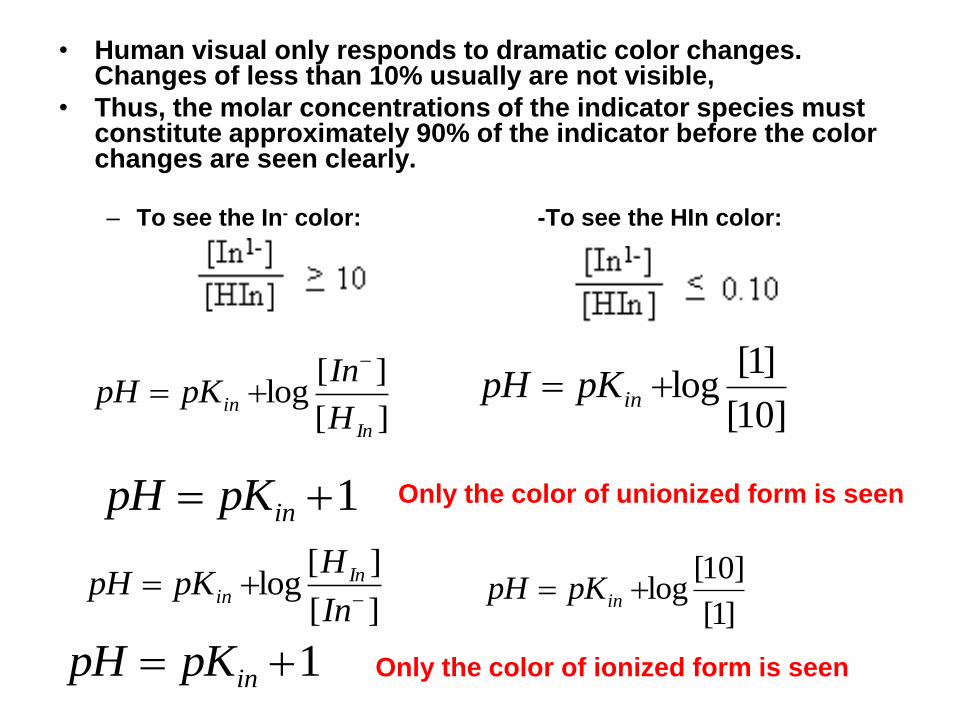
• Human visual only responds to dramatic color changes. Changes of less than 10% usually are not visible,
• Thus, the molar concentrations of the indicator species must constitute approximately 90% of the indicator before the color changes are seen clearly.
– To see the In- color: -To see the HIn color:
][
][log
In
inH
InpKpH
]10[
]1[log inpKpH
1 inpKpH Only the color of unionized form is seen
][
][log
In
HpKpH In
in]1[
]10[log inpKpH
1 inpKpH Only the color of ionized form is seen

– Acid-base indicators (like any ionizable molecule) are 50% ionized at the pKa
– At 1 pH unit above the pKa, 90% of the ionizable indicator is in its basic form.
– At 1 pH unit below the pKa, 90% of the ionizable indicator is in its acid form.
– Thus, indicators show a full color transition +/- 1 pH unit of the pKa, and indicators are generally selected based upon the closeness of their pKa to the endpoint pH.
• Most indicators require a transition range of about 2 pH units
• During the transition the observed color is a mixture of the two colors
• Midway of the transition the concnetration of the two forms are equal
• pka of indicator should be close to the pH of the equivalence point

Variable affecting acid-base indicator behavior include
• Ionic strength (changes Ka, shifts equilibrium).
• Temperature.
• Solvent and solvent polarity (especially organic solvents which
may shift color transitions several pH units).
• Colloidal particulates may interfere through surface adsorption
of the indicator
• If concentrations of acid and base are 0.1 M or higher, it doesn't
make much difference. The large endpoint transition spans the
color transition range of almost all indicators.
• If concentrations drop significantly below 0.1 M, an indicator whose
pKa is as close as possible to pH 7.0 +/- 1 is best.
• If concentrations of acid and base drop too low, (i.e., the endpoint
transition spans less than two pH units), no indicator will work very
well.
Choosing acid-base indicators for strong acid-strong base titration
Acid base indicators
• In an acid-base titration, addition of titrant
near the equivalence point causes the
solution pH to change drastically.
• This pH change is detectable with indicators
that change color as a function of pH.
• Indicators are weak acids that change color
when they gain or lose their acidic proton(s).

• The table lists a few common indicators with the color of their
acidic and basic forms and the pH range over which the color
change occurs. (The listed endpoint color assumes titration of
an acid with base, i.e., increasing pH.)

Color
pH Range Indicator
acidic endpoint basic
bromocresol green yellow green blue 4.0-5.6
methyl red red yellow yellow 4.4-6.2
bromothymol blue yellow green blue 6.2-7.6
phenolpthalein colorless light pink red 8.0-10

Titration Curves for Weak Acids Titrated with a
Strong Base
• Acetic Acid Titrated with NaOH
• Acetic acid is a monoprotic acid (pKa = 4.757).
• NaOH is a monohydroxy, strong base.
• Titration of acetic acid with NaOH follows a curve similar in shape to the strong acid-strong base titration curve, but the equivalence point is not a pH 7.
• Shown below is a titration curve for 0.100 M acetic acid titrated with 0.100 M NaOH.


• During the titration and in the
generation of a titration curve, four
regions will be considered:
– No NaOH added (i.e., 0.100 F acetic acid).
– NaOH added, but before equivalence has
been reached.
– At the equivalence point (i.e., 0.100 F
acetate ion).
– After equivalence.

TITRATION OF A WEAK ACID WITH A STRONG BASE
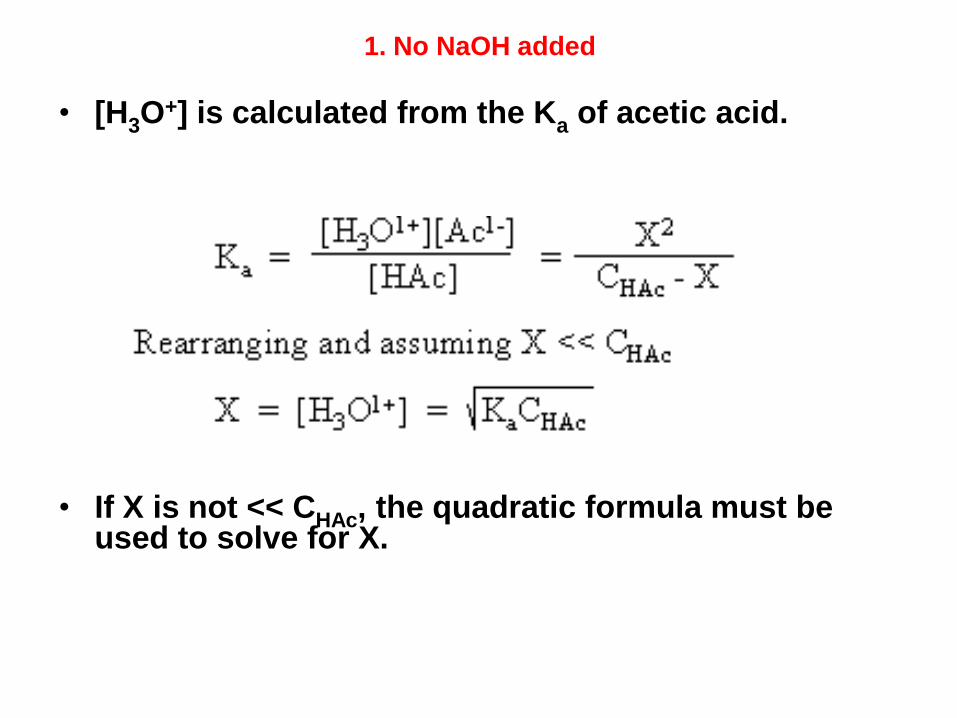
1. No NaOH added
• [H3O+] is calculated from the Ka of acetic acid.
• If X is not << CHAc, the quadratic formula must be used to solve for X.
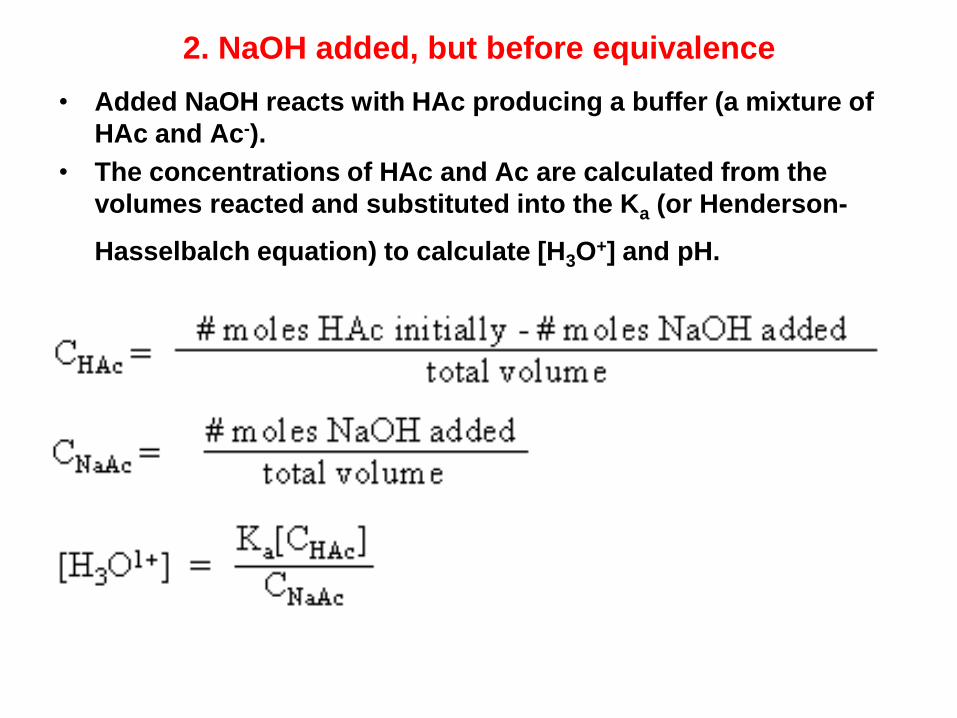
2. NaOH added, but before equivalence
• Added NaOH reacts with HAc producing a buffer (a mixture of
HAc and Ac-).
• The concentrations of HAc and Ac are calculated from the
volumes reacted and substituted into the Ka (or Henderson-
Hasselbalch equation) to calculate [H3O+] and pH.

• In using these equations, check the assumptions
made that allow use of Ka or the Henderson-
Hasselbalch. They are:
– Water equilibrium contributions are negligible.
– CNaAc and CHAc >> [H3O+] and [OH-]
• If the assumptions do not check, use the Charlot
equation.

3. At equivalence point
• At equivalence point, the HAc and NaOH have
reacted at the stoichiometric ratio.
# moles HAc initially present = # moles NaOH added
• The solution at the equivalence point is identical to
dissolving sodium acetate (NaAc) in water. The
[H3O+] may be calculated from the base hydrolysis of
Ac-.
• Note that X is assumed to be << CNaAc. This assumption must be
checked.
• If the assumption is not true, the quadratic formula must be used to
solve for X.

4. Beyond equivalence
• Beyond equivalence, all the HAc is consumed and
the presence of excess OH- prevents the base
hydrolysis of of the Ac-.
• The concentration of the excess OH- is calculated
from the reacted volumes and used to calculate
[H3O+] and pH.

General characteristics of weak acid titrations
with strong bases
• If the concentrations of acid are too low, you cannot ignore the water contributions to [H3O
+] and [OH-].
• Low acid concentrations decrease the magnitude of the pH change at the equivalence point, limiting the selection of endpoint indicator. Conversely, the higher the acid concentrations, the larger the pH change around the equivalence point.
• As Ka gets smaller, the pH change at equivalence gets smaller. Generally, the smaller Ka gets, the more concentrated the solutions must be. Acids with Ka below 10-6-10-7 M are nearly impossible to titrate easily with a buret and typically endpoint indicator.

• Titrations of weak bases with strong acids
are "mirror images" of the weak acid
titrations already discusses.
• Shown below is a typical titration curve:
Titration Curves for Weak Bases Titrated with a Strong Acid.
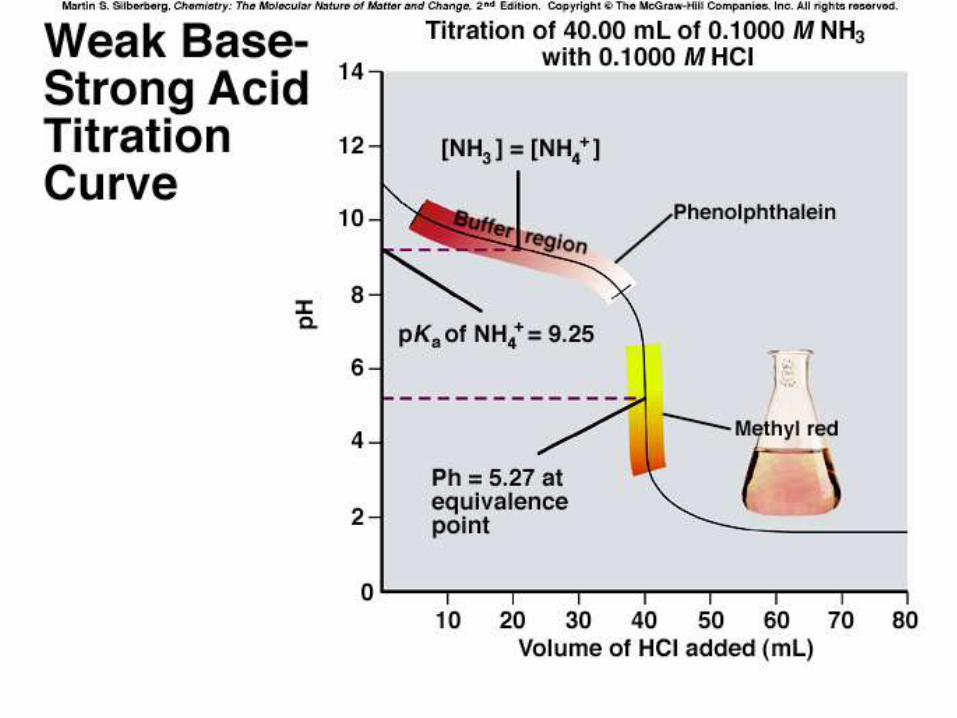

• For the sake of discussion, assume cyanide ion, CN- from NaCN, is being titrated with HCl.
• The titration curve is divided into regions similar to the acid titrations:
– No HCl added.
– HCl added, but before equivalence.
– At equivalence.
– After equivalence.

• Where is the equivalence point?
TITRATION OF A WEAK BASE WITH A STRONG ACID

1. No HCl added region
• [OH-] is calculated from the Kb expression.
• Once [OH-] is calculated, [H3O+] and pH is calculated
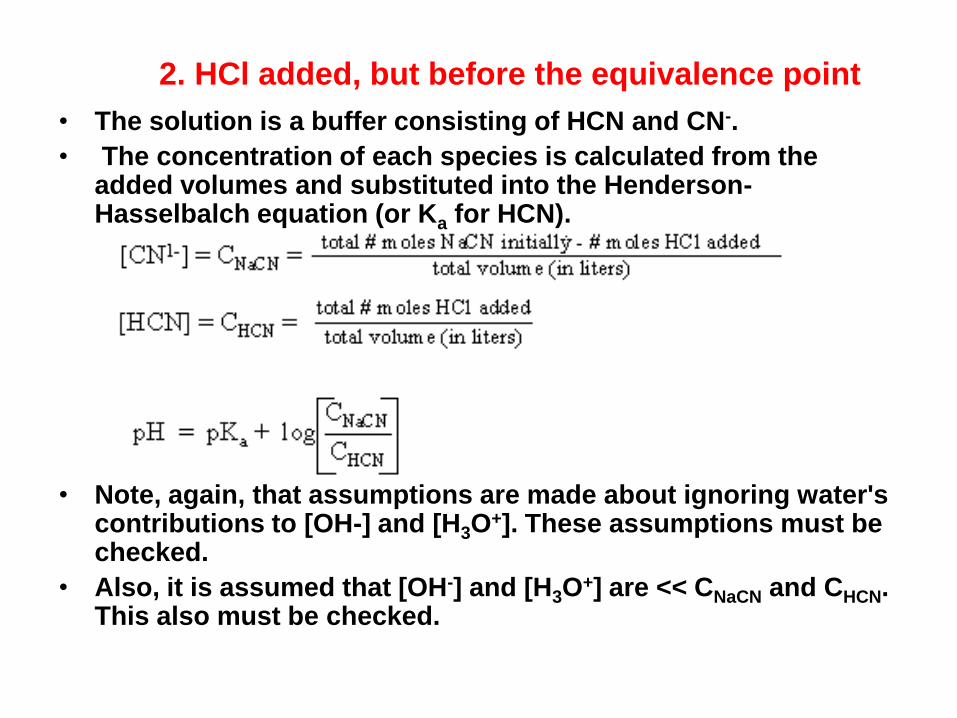
2. HCl added, but before the equivalence point • The solution is a buffer consisting of HCN and CN-.
• The concentration of each species is calculated from the added volumes and substituted into the Henderson-Hasselbalch equation (or Ka for HCN).
• Note, again, that assumptions are made about ignoring water's contributions to [OH-] and [H3O
+]. These assumptions must be checked.
• Also, it is assumed that [OH-] and [H3O+] are << CNaCN and CHCN.
This also must be checked.

• All the CN- has been converted to HCN. The
solution is the same as an HCN solution.
• Note, the same sets of assumptions to be
checked.
3. At the equivalence point:

4. After the equivalence point
• The pH is determined by the amount of acid added in
excess to the amount of CN- initially present.
• Note, yet again, the same sets of assumptions to be
checked.