chapter- i - spogel.comfiles.spogel.com/abstracts/p-0723--a study on attrition... · web view“a...
TRANSCRIPT

A STUDY ON ATTRITION LEVEL IN PONDICHERRY
POLYMERS PRIVATE LTD., PUDUCHERRY
SUMMER PROJECT REPORT
Submitted by
B.AMEER ALI
REGISTER NO: 27348301
Under the Guidance of
Mr. S.JAYA KUMAR., M.E, MBA, MISTE
Faculty, Department Of Management Studies
in partial fulfillment for the award of the degree
of
MASTER OF BUSINESS ADMINISTRATION
DEPARTMENT OF MANAGEMENT STUDIES
SRI MANAKULA VINAYAGAR ENGINEERING COLLEGE
PONDICHERRY UNIVERSITY
PUDUCHERRY, INDIA

SEPTEMBER- 2007
SRI MANAKULA VINAYAGAR ENGINEERING COLLEGE
MADAGADIPET, PUDUCHERRY
DEPARTMENT OF MANAGEMENT STUDIES
BONAFIDE CERTIFICATE
This to certify that the project work entitled “A STUDY ON ATTRITION LEVEL IN
PONDICHERRY POLYMERS PRIVATE LTD, PUDUCHERRY” is a bonafide work done
by B.AMEER ALI [ REGISTER NO: 27348301] in partial fulfillment of the requirement for
the award of Master of Business Administration by Pondicherry University during the academic
year 2007 – 2008.
GUIDE HEAD OF DEPARTMENT
Submitted for Viva-Voce Examination held on
EXTERNAL EXAMINER
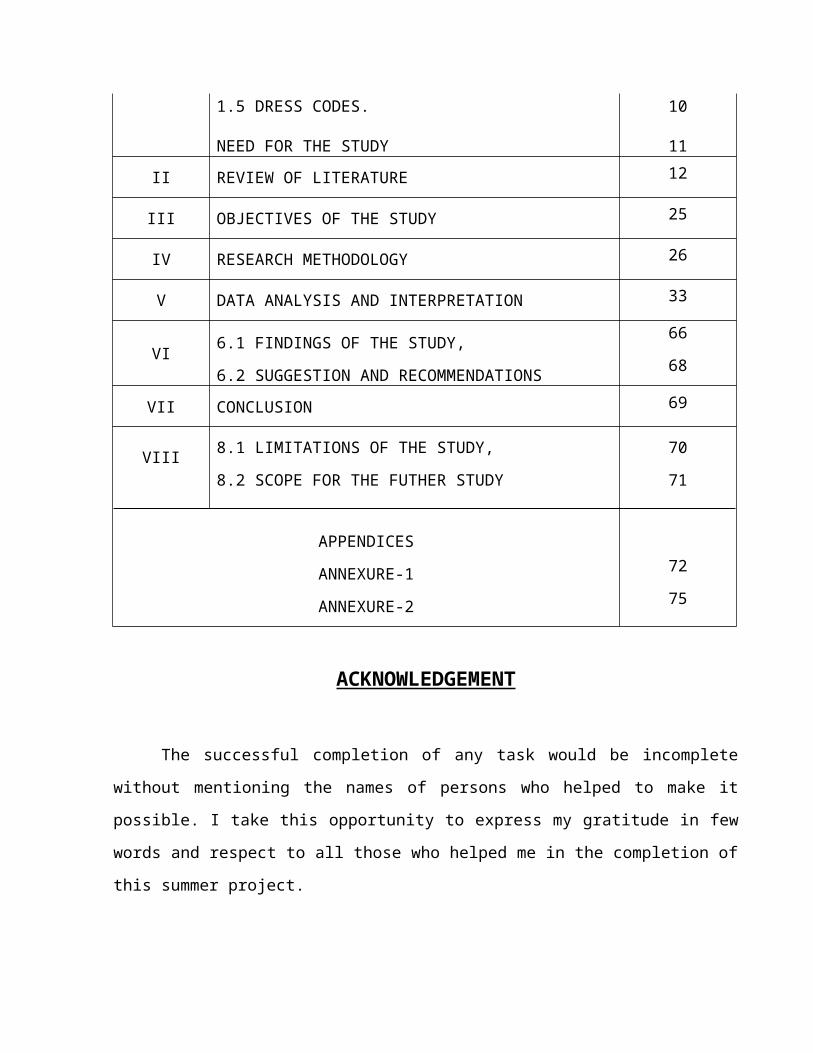
TABLE OF CONTENTS
CHAPTER TITLES PAGE NO
LIST OF TABLES
LIST OF CHARTS
I INTRODUCTION
1.1 PROFILE OF THE COMPANY.
1.2 PRODUCTION PROCESS.
1.3 TARGETS AND ACHIEVEMENTS.
1.4 ORGANIZATION CHART.
1.5 DRESS CODES.
NEED FOR THE STUDY
1
5
8
9
10
11
II REVIEW OF LITERATURE 12
III OBJECTIVES OF THE STUDY 25
IV RESEARCH METHODOLOGY 26
V DATA ANALYSIS AND INTERPRETATION 33
VI 6.1 FINDINGS OF THE STUDY,
6.2 SUGGESTION AND RECOMMENDATIONS
66
68
VII CONCLUSION 69
VIII 8.1 LIMITATIONS OF THE STUDY,
8.2 SCOPE FOR THE FUTHER STUDY
70
71
APPENDICES
ANNEXURE-1
ANNEXURE-2
72
75
ACKNOWLEDGEMENT
The successful completion of any task would be incomplete without mentioning the
names of persons who helped to make it possible. I take this opportunity to express my gratitude
in few words and respect to all those who helped me in the completion of this summer project.
I express my deep gratitude to Mr. N.KESAVAN, Chairman,
Mr. M. DHANASEKARAN, Managing Director and Mr. S.V.SUGUMARAN, Vice-chairman.
Sri Manakula Vinayagar Engineering College.
I am extremely grateful to Our Principal Dr. V.S.K. VENGATACHALAPATHY to
provide necessary and essential facilities to do this project work.
I express our sincere thanks and deep sense of gratitude to our Head of Department
Mr. S.JAYAKUMAR, Department of Management Studies for providing me with an
opportunity to study and for his encouragement, support and guidance to complete this project
work successfully.
I convey my heartiest thanks to Mr. S.PRABAGAR, FACTORY MANAGER,
Pondicherry Polymers Private Ltd, Thiruvandar koil, Puducherry, who kindly granted permission
to do this project work in his esteemed organization.
Finally, I express our sincere thanks and deep sense of gratitude to my parents and friends
for giving timely advice in all the ways and in all aspects for the success of this project work.

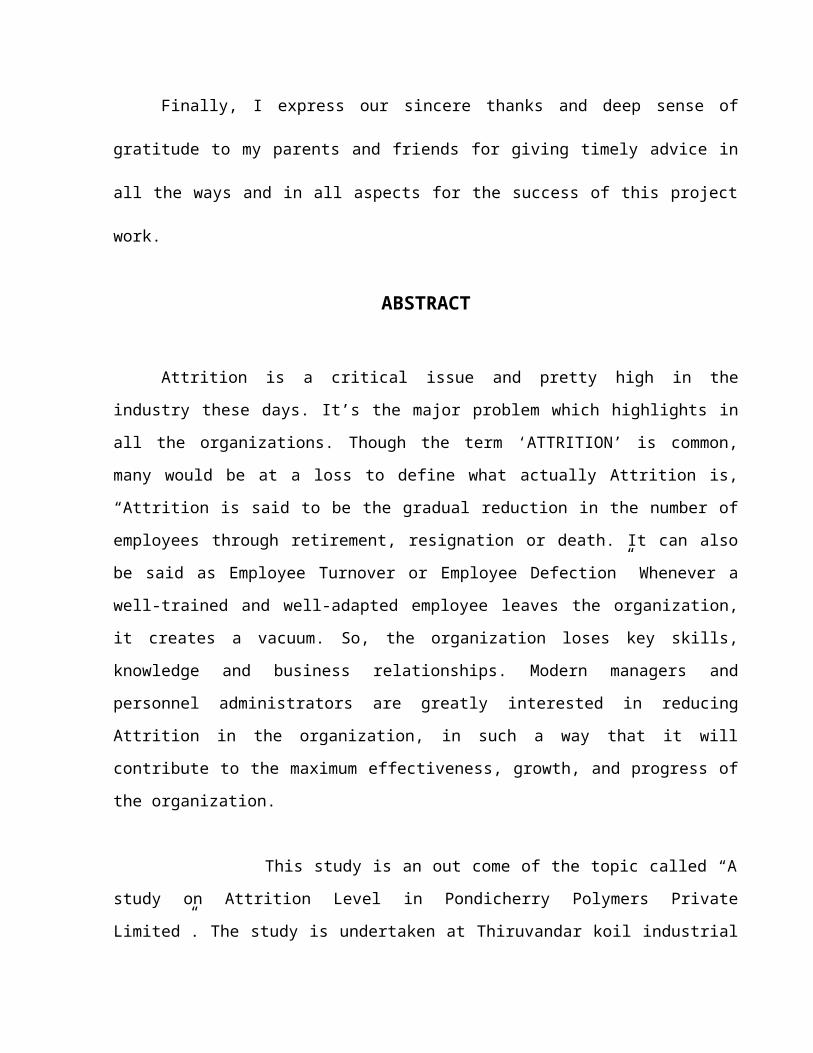
ABSTRACT
Attrition is a critical issue and pretty high in the industry these days. It’s the major
problem which highlights in all the organizations. Though the term ‘ATTRITION’ is common,
many would be at a loss to define what actually Attrition is, “Attrition is said to be the gradual
reduction in the number of employees through retirement, resignation or death. It can also be said
as Employee Turnover or Employee Defection” Whenever a well-trained and well-adapted
employee leaves the organization, it creates a vacuum. So, the organization loses key skills,
knowledge and business relationships. Modern managers and personnel administrators are greatly
interested in reducing Attrition in the organization, in such a way that it will contribute to the
maximum effectiveness, growth, and progress of the organization.
This study is an out come of the topic called “A study on Attrition Level in Pondicherry
Polymers Private Limited”. The study is undertaken at Thiruvandar koil industrial sector area.
The survey is carried out in the company called “PONDICHERRY POLYMERS PRIVATE Ltd”
for a period of one month.
The main objectives of this study is to know the reasons, why attrition occurs, to identify
the factors which make employees dissatisfy, to know the satisfactory level of employees towards
their job and working conditions and to find the areas where Pondicherry Polymer Private Ltd is
lagging behind.
Nearly 50 samples are taken to the study the Attrition level in the organization. Primary
data such as Questionnaire and Interview method has been used to collect the data from the
employees. From the study it is identified that the lack in growth opportunities and the family
issues are the major problems for the occurrence of attrition in the company.
LIST OF TABLES
S.no TABLE NAME PAGE.NO
1 Age Level of the Respondents 33
2 Marital Status of the Respondents 34
3 Educational Qualification of the Respondents 35
4 Years of Experience of the Respondents 36
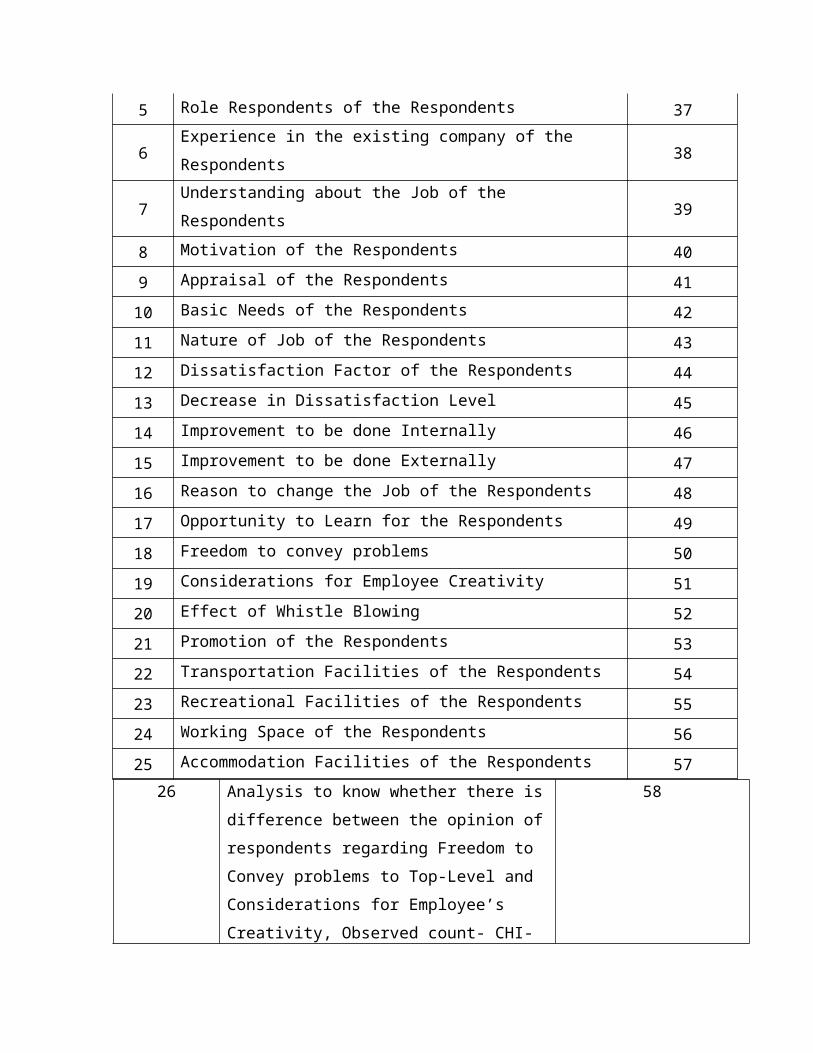
5 Role Respondents of the Respondents 37
6 Experience in the existing company of the Respondents 38
7 Understanding about the Job of the Respondents 39
8 Motivation of the Respondents 40
9 Appraisal of the Respondents 41
10 Basic Needs of the Respondents 42
11 Nature of Job of the Respondents 43
12 Dissatisfaction Factor of the Respondents 44
13 Decrease in Dissatisfaction Level 45
14 Improvement to be done Internally 46
15 Improvement to be done Externally 47
16 Reason to change the Job of the Respondents 48
17 Opportunity to Learn for the Respondents 49
18 Freedom to convey problems 50
19 Considerations for Employee Creativity 51
20 Effect of Whistle Blowing 52
21 Promotion of the Respondents 53
22 Transportation Facilities of the Respondents 54
23 Recreational Facilities of the Respondents 55
24 Working Space of the Respondents 56

25 Accommodation Facilities of the Respondents 57
26
Analysis to know whether there is difference between the opinion of respondents regarding Freedom to Convey problems to Top-Level and Considerations for Employee’s Creativity, Observed count- CHI-SQUARE
58
27 Expected count for chi-square 58
28 Computation of chi-square 59
29
Analysis to know whether there Correlation
between the opinion of respondents regarding
Understanding About Job and Decrease In The
Dissatisfaction Level – Correlation Analysis
60
30 Ranks for correlation data 60
31Analysis to find the ranks of various factors using Weighted Average Calculation 62
32 Point Average 62
33 Years of experience in the company and decrease in dissatisfaction level- ANOVA 64
34 ANOVA Table 65
LIST OF CHARTS
S.no CHART NAME PAGE.NO
1 Age Level 33
2 Marital Status 34
3 Educational Qualification 35
4 Years of Experience 36
5 Role 37
6 Experience in the existing company 38
7 Understanding about the Job 39
8 Motivation 40
9 Appraisal 41
10 Basic Needs 42
11 Nature of Job 43
12 Dissatisfaction Factor 44
13 Decrease in Dissatisfaction Level 45
14 Improvement to be done Internally 46
15 Improvement to be done Externally 47
16 Reason to change the Job 48
17 Opportunity to Learn 49
18 Freedom to convey problems 50
19 Considerations for Employee Creativity 51
20 Effect of Whistle Blowing 52
21 Promotion 53
22 Transportation Facilities 54
23 Recreational Facilities 55
24 Working Space 56
25 Accommodation Facilities 57
CHAPTER- I

INTRODUCTION
1.1 PROFILE OF THE COMPANY
Pondicherry Polymers Pvt Ltd., the pioneers in the field of manufacturing of PET
preforms, PET bottle and containers from 60m1 to 20 Liters. They not only provide customized
packing solution but also relate their selves with their customers with
G M P (Good Manufacturing Practice).
1.1.1 PROMOTOR
Pondicherry Polymers Pvt Ltd., is headed by Shri. Arun Kumar Kainya, Managing
Director, who has wide experience and expertise in running pet industry successfully for several
years.
1.1.2 HISTORY OF COMPANY
Pondicherry Polymers Private Ltd was started in 1997 with a production of 500kgs to
750kgs per day. In this span of 10years it has grown like anything and the production capacity is
increased to 5000kgs per day approximately. They have got fully equipped automatic machines
in which utmost safety is taken care of.
Regarding the customers they have got across the country and even in abroad. The
turnover of the company is also come-up gradually. The PET manufactures in 1997, when they
started their production are very less but there was huge demand.
Now there are around 4 other units also in Pondicherry itself and even after that they are
moving with all the customers with New products and Developments. The customers are being
given very good services and they also satisfied and the repeated orders are coming from the
market.
During this 10 years they have undergone so many expansion with well financial
background formed from the income of the company. They have good reputation in payments to

the suppliers and to their employees too. When the unit started they were aiming to cater to all
over India and they worked on it. They got good reports from the customers about the quality and
it had a wide spread in the market indirectly and the customers lost increased by giving the good
quality products, they are gradually growing in their vision on “To be Pioneer in PET”.
1.1.3 ISI-14513 CERTIFICATION
The company is certified by ISI-14513 for quality management system. The company is
sends their PET performs and the Bottle products to the CIPET (CENTRAL INSTITUTE OF
PLASTIC ENGINEERING & TECHNOLOGY), Chennai for their quality check. This process is
a routine work and is carried often by checking once in every three months and the Institute
assures for the company’s product.
1.1.4 FACTORY AREAS
The company is located at Thiruvandar koil in 0.75 acres with good greenish
and noise free environment. Separate dinning halls and dormitory provided with
basic facilities. Vast stacking point for raw materials and finished products.
Separate Toilet facilities for others from outside and being taken care of separate
cleaning units.
1.1.5 PRODUCTS AND SERVICES
Their pet Performs are transparent food grade corrosion – resisting plastic with high
strength and smooth finish which are widely used for pet bottles of mineral water beverages,
edible oil. Pharmaceuticals, cosmetics etc.
Their pet bottles are the modern hygienic package of choice for many food products,
pharmaceuticals, beverages and “mineral water companies because of its glass like transparency
ability to retain freshness, a toughness which allows manufacture of lightweight, safe- capacity,
and safe unbreakable containers.
Their pet jars are extremely elegant and widely used for lotion, creams and other
products.
1.1.6 PPP- PRODUCTS
PET Preforms:
12gm - 30mm neck
16.5gm - 30mm neck
I8gm - 28mm neck
20gm - 28mm neck
22gm - 28mm neck
22gm - 30mm neck
25gm - 28mm neck
26gm - 28mm neck
33gm - 28mm neck
38gm - 28mm neck
38gm - 30mm neck
41.5gm - 28mm neck
48gm - 28mm neck
l00gm - 45mm neck
110gm - 45mm neck
1.1.7 CLIENTELE
Asian pet Industries, Chennai.
Sabol Associates, Coimbatore,
Classique Water Products, Pondicherry.
Auro Real, Pondicherry.
True drops – River Water, Villupuram.
ARC Aqua puraa – Annamalaiyar Agencies, Palani.
Right Aqua – Trichy Ramesh Aqua, Trichy.
Any Time – Oswal Pet Containers, Bangalore.
Kingfisher – TT Minerals, Bangalore, Goa, Mumbai.
Royal Challenge – Disha pet, Bangalore.
S.S. Aqua, Kolar.
Rimco Industries, Mysore.
Mercury – Arunachala Agencies (Air Sahara & Jet Airways), Chennai.
Kali Mark – kali Aerated Works, Madurai,Chennai & Ariyakudi.
Seven Star Soda, Andaman.
Cheerup – RN Enterprises, Dindugul.
Tanmed pharma, Chennai.
Medicament, Karaikal.
Paris Darkner, Madurai.
Arvind Herbal, Madurai.
Evergreen Enterprises, Erode.
Medopharm, Cbennai.
Virudhu Foods, Dharmapuri.
1.2 PPP-PRODUCTION PROCESS
1.2.1 MANUFACTURING FACILITY

The manufacturing plant is most modern, spread over an area of I Acre. All our-
products are manufactured on latest machineries. Our plant is equipped with injection molding
machines and blow molding machines. Pharma grade bottles are manufactured in single stage
fully automatic ASB NISSIE Machine (Japan). Thereby ensuring total quality minimum physical
contact under most high hygienic standards. All our machines are operated and maintained by
highly qualified engineers and technicians.
1.2.2 FUNCTIONING OF THE PLANT
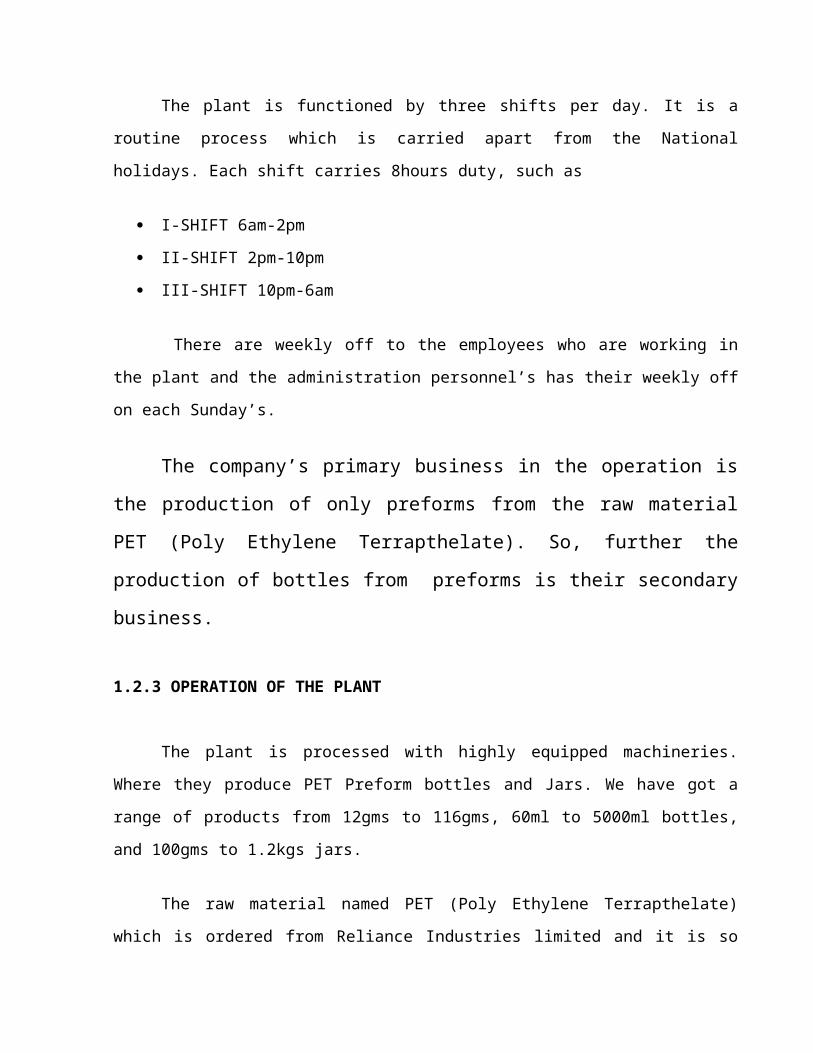
The plant is functioned by three shifts per day. It is a routine process which is carried
apart from the National holidays. Each shift carries 8hours duty, such as
I-SHIFT 6am-2pm
II-SHIFT 2pm-10pm
III-SHIFT 10pm-6am
There are weekly off to the employees who are working in the plant and the
administration personnel’s has their weekly off on each Sunday’s.
The company’s primary business in the operation is the production of only
preforms from the raw material PET (Poly Ethylene Terrapthelate). So, further the
production of bottles from preforms is their secondary business.
1.2.3 OPERATION OF THE PLANT
The plant is processed with highly equipped machineries. Where they produce PET
Preform bottles and Jars. We have got a range of products from 12gms to 116gms, 60ml to
5000ml bottles, and 100gms to 1.2kgs jars.
The raw material named PET (Poly Ethylene Terrapthelate) which is ordered from
Reliance Industries limited and it is so effective in making PET jars for us. The raw material is
easily processed to PET Preforms and then moulded to convert that into jars. There is minimum
wastage of 1.5% to 2% from the production.
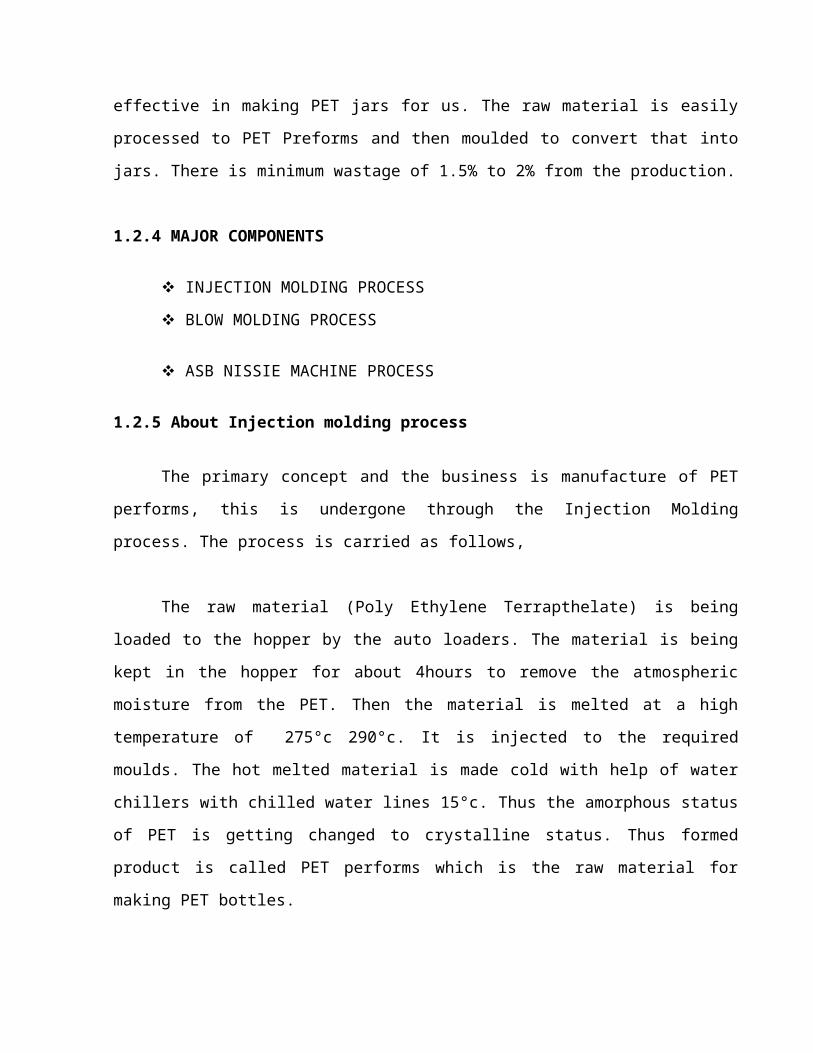
1.2.4 MAJOR COMPONENTS
INJECTION MOLDING PROCESS
BLOW MOLDING PROCESS
ASB NISSIE MACHINE PROCESS
1.2.5 About Injection molding process
The primary concept and the business is manufacture of PET performs, this is undergone
through the Injection Molding process. The process is carried as follows,
The raw material (Poly Ethylene Terrapthelate) is being loaded to the hopper by the auto
loaders. The material is being kept in the hopper for about 4hours to remove the atmospheric
moisture from the PET. Then the material is melted at a high temperature of 275°c 290°c. It is
injected to the required moulds. The hot melted material is made cold with help of water chillers
with chilled water lines 15°c. Thus the amorphous status of PET is getting changed to crystalline
status. Thus formed product is called PET performs which is the raw material for making PET
bottles.
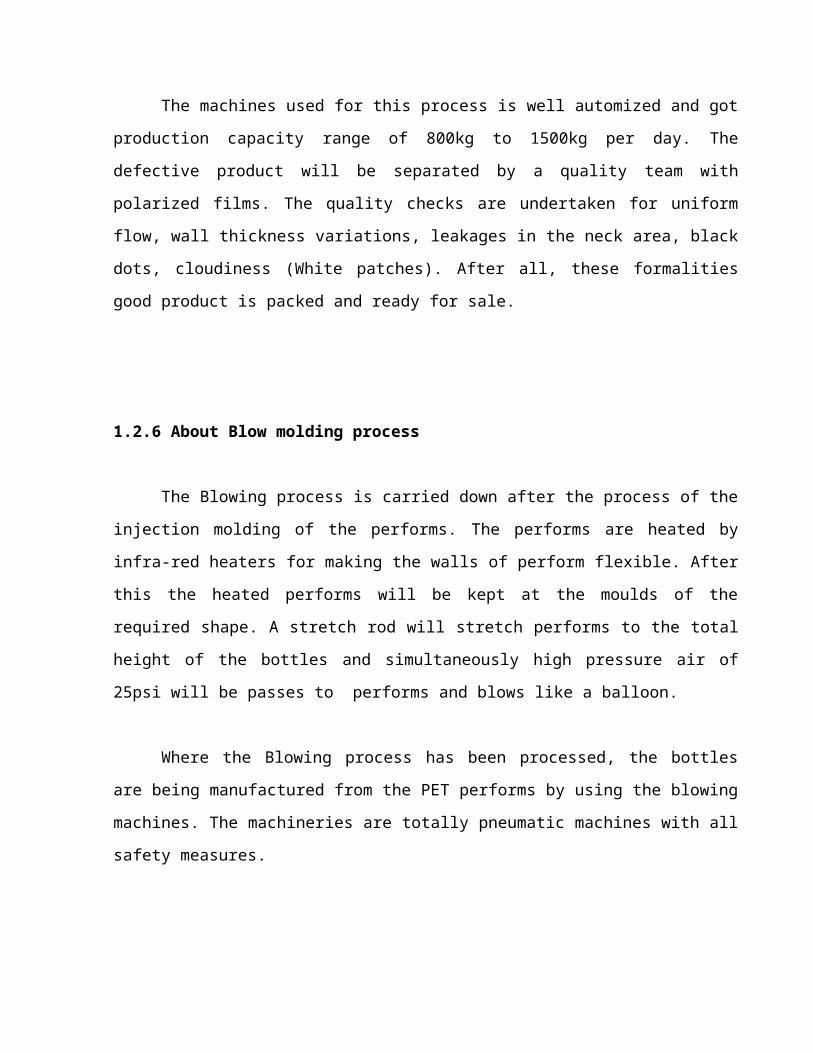
The machines used for this process is well automized and got production capacity range
of 800kg to 1500kg per day. The defective product will be separated by a quality team with
polarized films. The quality checks are undertaken for uniform flow, wall thickness variations,
leakages in the neck area, black dots, cloudiness (White patches). After all, these formalities good
product is packed and ready for sale.
1.2.6 About Blow molding process

The Blowing process is carried down after the process of the injection molding of the
performs. The performs are heated by infra-red heaters for making the walls of perform flexible.
After this the heated performs will be kept at the moulds of the required shape. A stretch rod will
stretch performs to the total height of the bottles and simultaneously high pressure air of 25psi
will be passes to performs and blows like a balloon.
Where the Blowing process has been processed, the bottles are being manufactured from
the PET performs by using the blowing machines. The machineries are totally pneumatic
machines with all safety measures.
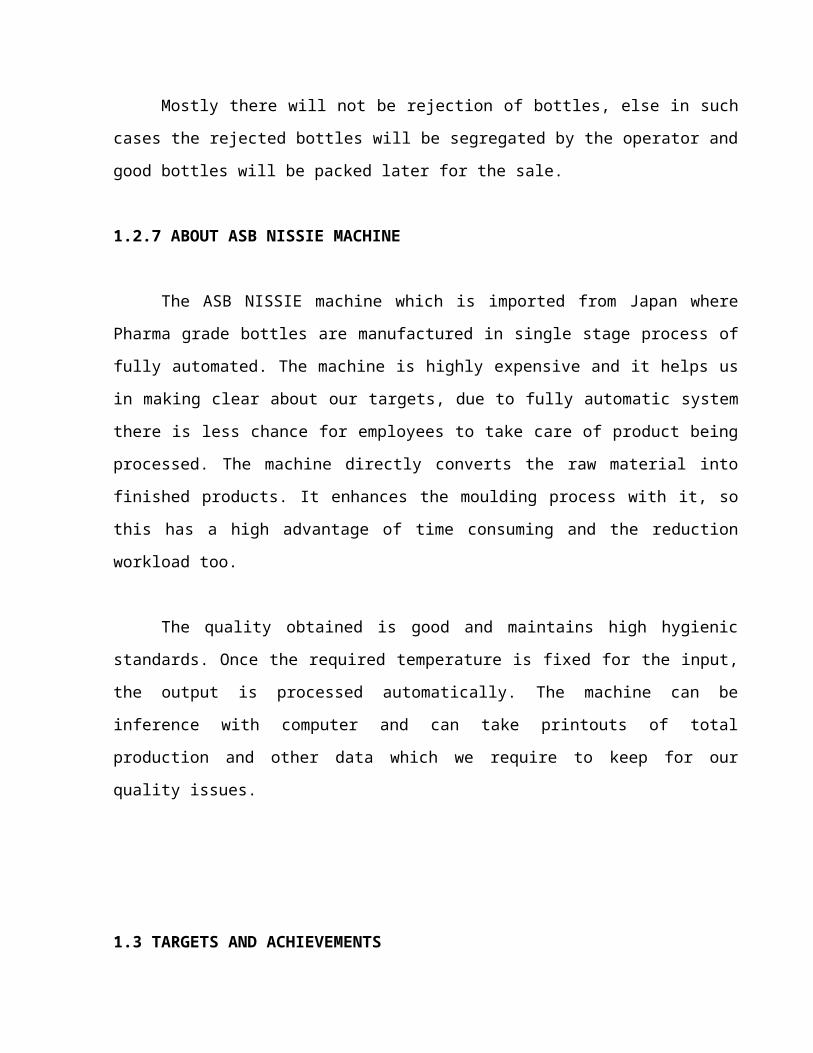
Mostly there will not be rejection of bottles, else in such cases the rejected bottles will be
segregated by the operator and good bottles will be packed later for the sale.
1.2.7 ABOUT ASB NISSIE MACHINE
The ASB NISSIE machine which is imported from Japan where Pharma grade bottles are
manufactured in single stage process of fully automated. The machine is highly expensive and it
helps us in making clear about our targets, due to fully automatic system there is less chance for
employees to take care of product being processed. The machine directly converts the raw
material into finished products. It enhances the moulding process with it, so this has a high
advantage of time consuming and the reduction workload too.
The quality obtained is good and maintains high hygienic standards. Once the required
temperature is fixed for the input, the output is processed automatically. The machine can be
inference with computer and can take printouts of total production and other data which we
require to keep for our quality issues.
1.3 TARGETS AND ACHIEVEMENTS
The company has been attaining an increasable turnover every year and they hardly works
for that too. The company has peak sales at the month of December-May in all the year, usually
the turnover will be nearly 125000kgs. From 2003 they are installing a new machine for their
production in order to attain higher turnover than the existing one.
As such in the year of 2003 the turnover has attained at a rate of 130000kgs, due to an
addition of a new machine.
At the year of 2005, the company had a turnover with the capacity of 1320000kgs in the
month of March.
At the year of 2006, a new expensive machine was been installed to attain their target of
previous year turnover, as such they attained a huge turnover rate of 145000kgs at the
month of April.
In this year too the plant has been installed with a new automated machine ASB NISSIE
Machine from Japan and they are on process to attain their expected turnover to beat the
last year’s achievement and they assure for that.
The company and the management hardly work to attain their further targets.
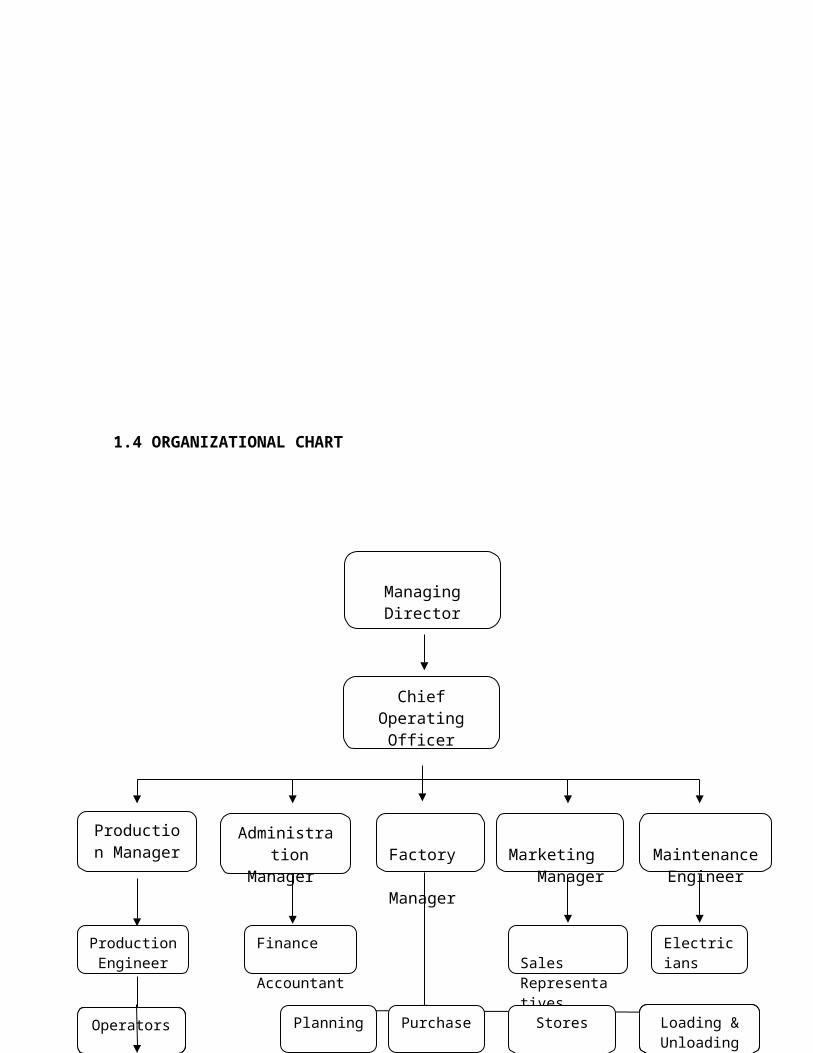
1.4 ORGANIZATIONAL CHART
1.5 DRESS CODES
Managing Director
Production Manager
AdministrationManager
Factory Manager
Marketing Manager
Finance Accountant
Shift In charge
Production Engineer
Maintenance Engineer
SalesRepresentatives
Electricians
Chief Operating Officer
Operators
Planning Purchase Stores Delivery Section
Loading & Unloading
The company has different dress codes according to the employees work environment.
Administration people: The dress code of the Administration personnel’s is Full
Hand Blue Shirts and Black Pants with Black colored Shoes & Socks to the gent staffs
and Light Blue Saree’s to the lady staffs.
Plant Employees: The dress code of employees in plant is Light Brown Half Hand
Shirts and Black Pants with Black colored Shoes, Socks, and White color Caps to cover
their head and a soft gloves in their hands at the work time.
Maintenance Employees: The dress code of the maintenance employees is Grey
colored Half Hand Shirts and Grey colored Pants with Black colored Shoes and Socks.
Employees at the packing area: The dress code of employees in the packing
department is Blue colored Half Hand Shirts and Blue Pants to the male employees and
Blue color Chudi’s to the female employees with a soft gloves in hands to all.
NEED FOR THE STUDY
The success of any manufacturing organization depends largely on the workers, the
employees are considered as the backbone of Pondicherry Polymers Private Ltd.
The attrition rate of the company is 11.4%. So this study focused on why the Attrition
occurs and the possible ways to reduce it.
The study was mainly undertaken to identify the level of employee’s attitude, the
dissatisfaction factors they face in the organization and for what reason they prefer to
change their job. Once the levels of Employee’s attitude are identified, it would be
possible for the management to take necessary action to reduce attrition level. Since they
are considered as backbone of the Company, their progression will lead to the success of
the Company for the long run.
This study can be helpful in knowing, why the employees prefer to change their job and
which factors make employee dissatisfy.
Since the study is critical issue, it is needed by the originations in order to asses the
overall interest and the feelings of the employees towards their nature of job and
organization.
This study can be helpful to the management to improve its core weaknesses by the
suggestions and recommendations prescribed in the project.
This study can serve as a basis for measuring the organization’s overall performance in
terms of employee satisfaction.
The need of this study can be recognized when the result of the related study need
suggestions and recommendations to the similar situation.
CHAPTER – II
REVIEW OF LITERATURE
2.1 What is Attrition..?
"A reduction in the number of employees through retirement, resignation or death".
Attrition, also known as employee churn, employee turnover, or employee defection, is an
industrial term used to describe loss of employees or Man power.
Attrition is pretty high in the industry these days. Attrition is a universal phenomenon and
no industry is devoid of it, but the degree fluctuates from industry to industry. Attrition is a
serious issue in the industries because the industry is knowledge-based and hence employees are
its “assets”.
Deficiencies like inability to influence employee perception of growth; not aligning
employees to roles based on their individual talent, inflexibility in leadership styles, are causing
conflicts at a very intrinsic level, resulting in knowledge employees choosing the proverbial
“easy way out.”
2.2 ATTRITION IS A BUSINESS PERSPECTIVE
Says ABRAHAM.T M, Head-HR, Veeda CR,
Attrition is a phenomenon affecting any business organization in the industry. Over the
past few years, organizations have taken an increased interest in aligning their HR practices to
their business goals.
Where as the deficiencies like inability to influence employee perception of growth; not
aligning employees to roles based on their individual talent, inflexibility in leadership styles, are
causing conflicts at a very intrinsic level, resulting in knowledge employees choosing the
proverbial “easy way out.” Employees thus attempt to change the manager or the work
environment, resulting in employee attrition.
2.3 Attrition occurs due to INEFFECTIVE MANAGERS…

Says BEENA HANDA, Vice-President-HRM of Claris Life sciences. “Attrition also
happens when people hate their working conditions, do not like their team-mates or perhaps do
not like what they are doing. There are also cases when people leave their job for family reasons
or when they wish to migrate. For example, girls often leave their jobs when they get married and
shift to another city,”
Beyond a point, an employee's primary need has less to do with money, and more to do
with how he's treated and how valued he feels. Much of this depends directly on the immediate
manager. And yet, bad bosses seem to happen to good people everywhere. A Fortune magazine
survey some years ago found that nearly 75 per cent of employees have suffered at the hands of
difficult superiors.
A WORKFORCE MAGAZINE ARTICLE, "Knowing how to keep your best and
brightest," reported the results of interviews with 20,000 departing workers. The main reason that
employees chose to leave was poor management. HR magazine found that 95 percent of exiting
employees attributed their search for a new position to an ineffective manager.
2.4 ATTRITION IS A CRITICAL ISSUE
Whenever a well-trained and well-adapted employee leaves any organization, it creates a
vacuum. The organization loses key skills, knowledge and business relationships. And it is not an
easy task to find a sustainable substitute. “Situation is worse when it happens at a critical
(decision making) position, as there is a scarcity of such technical resources in the market,”
explains Head HR, who feels attrition directly affects the company. “Employees want not only
work recognition, but also extra perks.”
2.5 COMBATING HIGH ATTRITION
Alarm bells are ringing loudly in corporate corridors as attrition rates in IT
organizations average 22 percent as per a study conducted by the Indian Institute of Technology,
Bombay (IIT-B) with a sample of 1,028 IT companies in the country.
Says Dr. NANDKISHORE RATHI, placement officer of IIT-B, “After doing the
survey, we found that the lack of match between personal requirements and organizational
culture was quite prevalent.”
Along with the three main reasons as mentioned,
An employee may be concerned about the environment in the organization,
His compatibility with his supervisors,
The attention paid to him.
Hence, the reason for an employee leaving a company could be nothing other than his
growth, If companies take proper steps and adopt methods to serve their employees needs, the
challenge of managing attrition will remain low.
2.6 TREAT EMPLOYEES LIKE CUSTOMERS
Companies should have a similar approach to employees and customers. A company
should strive to retain an employee in the same way it tries to retain a customer.
BIJAY SAHOO, Vice-president
Talent Engagement & Development
Wipro Technologies…
Some employees prefer development to being in a support and maintenance job. To
hold back these people, we give first preference for training them.
RAKESH TIKU, Vice-president
Infinite Computer Solutions…
Says BIJAY SAHOO, vice-president, talent engagement and development, Wipro
Technologies, “Companies should have a similar approach to employees and customers. If a

company strives to retain an employee in the same way it tries to retain a customer, him leaving
the organization could be out of question. Communication is the foundation for the entire process
of managing attrition. This communication begins right from recruitment.
Says RAJEEV MALIK, director, HR, McAfee Software (India), “Conducting regular
meetings and updating employees, especially new entrants, about the company’s status and
achievements is a must.”
2.7 Rathi’s recommendation
Dr NANDKISHORE RATHI, placement officer, IIT-B, has a few tips to reduce attrition,
For HR managers
Consider both a person’s culture-fit and job-fit.
Understand the expectations at the entry level.
To curb a high attrition rate
Top management should communicate continuously with all the employees about the
vision and mission of the company.
Support HR initiatives aimed at retaining people.
Line managers or project managers should establish a connection between the lower-
level and top management.
Manage the company’s growth properly.
Develop leaders at all levels.
Train leaders in the skills they need to manage effectively.

Reduce Attrition: Managers and Professional Employees
We can help you adjust your company vision and manager's performance reviews to
reflect employee turnover, and provide mentoring and interpersonal training to inexperienced
managers.
Develop and communicate a strong strategic vision
Provide relationship coaching and help people develop to their potential
Reward managers for their relationship skills - not only on technical know-how and
financial results.
2.8 LEADERSHIP CRISIS LEADS TO ATTRITION
Says DESIKAMANI.G is Chief Mentor of Mentor Consulting, Chennai, that
LEADERSHIP CRISIS LEADS TO ATTRITION, Lack of good leaders who can motivate and
guide their teams well is a significant reason for the high rate of attrition in the industry.
“Employees don’t leave organizations but their managers.” There has been a phenomenal
change in employee perception of “loyalty” over the last decade and is especially true of
knowledge workers. What the organization can expect from an employee has dramatically
changed from “loyalty” to “commitment-to-cause” and so has the factors causing them.
Deficiencies like inability to influence employee perception of growth; not aligning
employees to roles based on their individual talent, inflexibility in leadership styles, are causing
conflicts at a very intrinsic level, resulting in employees choosing the proverbial “easy way out.”
They attempt to change the manager or work environment and hope for the best to happen.

2.9 FIVE PRINCIPAL REASONS FOR WHICH THE PEOPLE CHANGE JOBS
It doesn't feel good around here. This is a corporate culture issue in most cases. Workers
are also concerned with the company's reputation; the physical conditions of comfort,
convenience, and safety, and the clarity of mission.
They wouldn't miss me if I were gone. Even though leaders do value employees, they
don't tell them often enough. If people don't feel important, they're not motivated to stay.
No one wants to be a commodity, easily replaced by someone off the street. If they are
regarded as expendable, they'll leave for a position where they're appreciated.
I don't get the support I need to get my job done. Contrary to opinions heard all-too-often
from management, people really do want to do a good job. When they're frustrated by too
many rules, red tape, or incompetent supervisors or co-workers, people look for other
opportunities.
There's no opportunity for advancement. No, we're not talking about promotions, although
many deserving people would like to move up. The issue here is learning. People want to
learn, to sharpen their skills and pick-up new ones. They want to improve their capacity to
perform a wide variety of jobs. Call it career security. The desire is for training and
development. If workers can't find the growth opportunities with one company, they'll
seek another employer where they can learn.
Compensation is the last reason people most leave. That's a brash statement, but it's true.
Workers want fair compensation, but the first four aspects must be strong. If they're not,
but money's high, you'll hear people say "you can't pay me enough to stay here."
By,
BIJAY SAHOO, Vice-president
Talent Engagement & Development
Wipro Technologies…
2.10 MANAGING ATTRITION THROUGH CORPORATE ALUMNI
Says CHANDRAPRAKASH LOONKER is Architect (Assistant Vice-president),
Citigroup, corporate investment bank’s Trading Service Technology in New York.
Instead of fighting attrition, organizations should manage it well by creating a network of
corporate alumni says Loonker, Indian companies should adopt a model similar to an educational
institute. Maintain and nurture good relations with employees who leave your company just as
educational institutes do with their alumni. The word “corporate alumni” seems apt here. This
can have following benefits:
Alumni are brand ambassadors. People have special love for their first job as they learn
the most from their first job. These employees will continue to help the organization even years
after they have left it.
Alumni are the best marketing people you can have. Larger the network, bigger the army
of people working free of charge for the organization. Higher the attrition rate, faster the network
grows.
Corporate alumni can act as great mentors for your employees. Whenever an employee
leaves, encourage his colleagues and juniors to maintain strong ties with him. This keeps him
attached to the organization. Also, your current employees will benefit from his experiences.
High attrition has led to great networking between employees of different organizations.
Besides helping in business development, alumni can be very helpful in talent sourcing.
Remember, your alumni know your culture. Hence they can select the best fitting employee for
your organization.

Don’t confront attrition
Don’t push employees into signing contracts or bonds. Instead negotiate longer notice and
transition periods with them. Disgruntled employee, even if he stays back due to a
contract/bond will cause more harm to the organization than good.
Instead of entering into non-poaching agreements in the industry, enter into longer
transition period agreements, which the employees will be more open to.
Don’t hire overqualified people. Always make sure that each of your employee is
stretched to the maximum of his capabilities. Any employee who finds his job boring will
never be excited about his work.
After recruiting a person if you find that he is overqualified, act fast and move him into
jobs where you can stretch him out. Change culture from project-centric to a balance of
project and people-centric.
Encourage people to leave for better opportunities. Keep a very open culture about
moving on. This will allow longer notice periods and hence no last minute transitions.
This will increase outflow but it will increase quality inflow too. Remember that college
presentation which had the list of who’s-who, “They are our alumni” said the presenter.
Don’t restrict the scope by imposing educational pre- requisites. Hire them as
trainees during summers and hire them full-time based upon performance.
Higher training costs are usually compensated by lower salaries of newcomers. Add
training costs to “cost-to-company” calculations.
Hire attitude; Train skills

We can help you hire and inspire appropriate employees...
Build positive, friendly, teamwork attitudes and commitment to customer services
Help new employees feel comfortable as they participate as valued team members
Provide periodic refresher courses to maintain team purpose and functionality.
2.11 ATTRITION: A Key Element to a Successful Staffing Program…
Says KEN GAFFEY, employee of CPS Personal Services.
Attrition is the loss of an employee though voluntary resignation, or involuntary
resignation. (Sometimes due to illness or death, but even staffing has limits on what it can
control.) It results in the loss of the investment made to hire this person and, based on the time
they have been with the company, the loss of training and professional development invested in
this person. As staffing professionals, our reaction to attrition is not unlike a fireman's response to
fire, or a doctor's response to a fever. It is the enemy.
Attrition may be the result of other companies offering better salaries and benefits, but
that does not mean you have to feel the need to respond.
Attrition, like everything else in life, has a price. If you throw enough money at it, you
can make it go away. However, when the cost of preventing attrition exceeds the cost of
hiring and training new employees, then the real enemy is the assumption that all attrition
can and should be prevented.
Attrition allows HR and Staffing to be exposed to a level of honest feedback via exit
interview data that they would never get from an employee who intended to remain and
hopefully build a career within the company.
Attrition is not only a function of "how many" left this year, but "who" left this year.

Exit Interviews
Exit interviews provide an excellent source of information of internal problems,
employees' perceptions of the organization, underlying workplace issues, and managers'
leadership abilities.
“…People don’t leave jobs, they leave managers..! Replace managers who will not develop
relationship skills…”
2.12 ATTRITION BECOMES PROBLEMATIC…
Turnover is likely to be problematic from a management point of view. This is especially
true of situations in which you are losing staff to direct competitors or where customers have
developed relationships with individual employees as is the case in many professional service
organizations. Some employee turnover positively benefits organizations. This happens whenever
a poor performer is replaced by a more effective employee, and can happen when a senior
retirement allows the promotion or acquisition of welcome 'fresh blood'.
2.13 When does employee turnover become problematic..?
There is no set level of employee turnover above which effects on the employing
organization becomes damaging. Everything depends on the type of labor markets in which you
compete. Where it is relatively easy to find and train new employees quickly and at relatively
little cost (i.e. where the labor market is loose), it is possible to sustain high quality levels of
service provision despite having a high turnover rate. By contrast, where skills are relatively
scarce, where recruitment is costly or where it takes several weeks to fill a vacancy.
Moderate levels of staff turnover can also help to reduce staff costs in organizations
where business levels are unpredictable month on month. In such situations when business is
slack it is straightforward to hold off filling recently created vacancies for some weeks.

Like turnover rates, this can be used across an organization as a whole or for a particular
part of it. The usual calculation for the stability index is:
(Number of staff with one or more years service x 100 divided by Number employed a
year ago)
2.14 ATTRITION OCCURS DUE TO…
Ineffective managers and management.
Employee’s ineffective compatibility with supervisors.
Inadequate working environment and conditions.
Lack of pay for performance.
Loss of opportunity for employee’s advancement.
Pushing employees into contracts, agreements or bonds.
Hiring over qualified people in corporate by the management
Lack of attention paid to the employee.
Lack of communication towards the superiors.
Inadequate training to the employees.
Loss of development in relationship between employees.
Uncontrollable stress.
2.15 WHY DO EMPLOYEES LEAVE ORGANISATIONS..?
Employees resign for many different reasons. Sometimes it is the attraction of a new job
or the prospect of a period outside the workforce which 'pulls' them; on other occasions they are
'pushed' due to dissatisfaction in their present jobs to seek alternative employment. Every
company normally faces one common problem of high employee turnout ratio. People are
leaving the company for better pay, better profile.

Sometimes it is mixtures of both pull and push factors. For a fourth group reasons for
leaving are entirely explained by domestic circumstances outside the control of any employer, as
is the case when someone relocates with their spouse or partner.
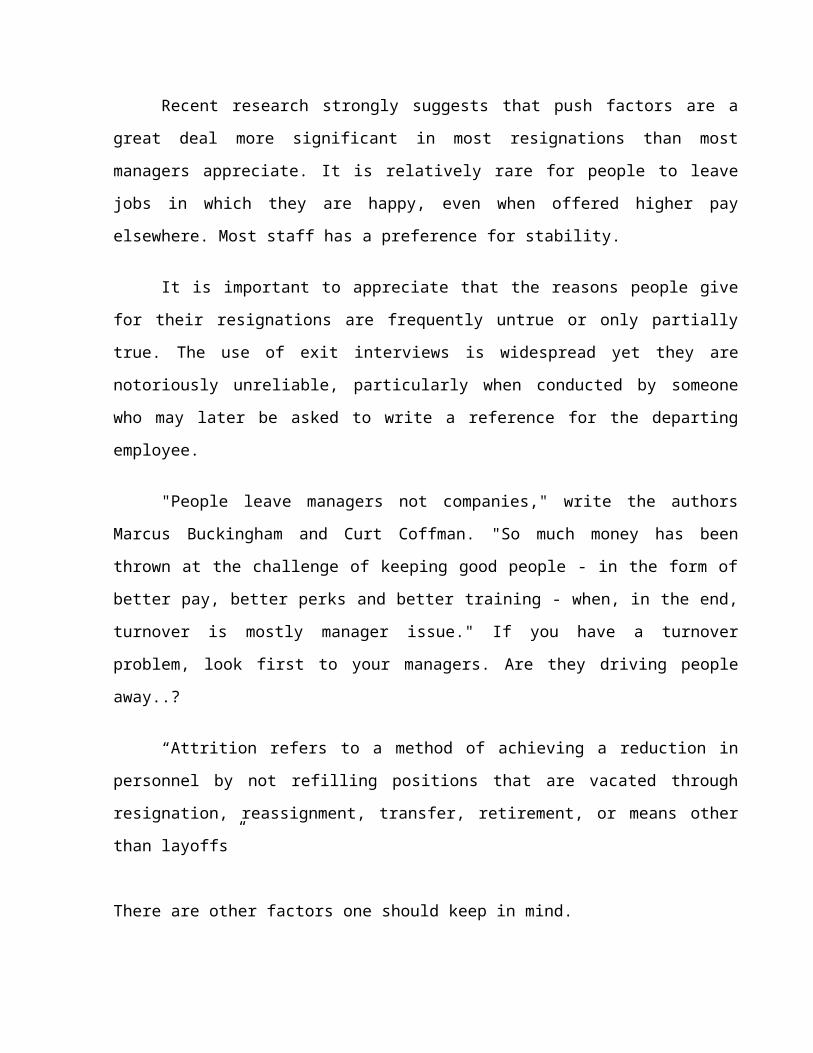
Recent research strongly suggests that push factors are a great deal more significant in
most resignations than most managers appreciate. It is relatively rare for people to leave jobs in
which they are happy, even when offered higher pay elsewhere. Most staff has a preference for
stability.
It is important to appreciate that the reasons people give for their resignations are
frequently untrue or only partially true. The use of exit interviews is widespread yet they are
notoriously unreliable, particularly when conducted by someone who may later be asked to write
a reference for the departing employee.
"People leave managers not companies," write the authors Marcus Buckingham and Curt
Coffman. "So much money has been thrown at the challenge of keeping good people - in the
form of better pay, better perks and better training - when, in the end, turnover is mostly manager
issue." If you have a turnover problem, look first to your managers. Are they driving people
away..?
“Attrition refers to a method of achieving a reduction in personnel by not refilling
positions that are vacated through resignation, reassignment, transfer, retirement, or means other
than layoffs”
There are other factors one should keep in mind.
Attrition and span of service in the Company
Attrition and Age level
Attrition Job Level Band
Attrition and Gender
Attrition and Education Studying all these factors will help you to find the Remedial,
Corrective actions to reduce the Attrition.

2.16 EMPLOYEES LEAVE ORGANIZATIONS FOR A RANGE OF REASON
A Fortune magazine survey some years ago found that nearly 75 per cent of employees
have suffered at the hands of difficult superiors.
Most employees leave their work for reasons other than money - and your organization
can correct these reasons. Most leaving employees seek opportunities that allow them to use and
develop their skills. Leaving employees want more meaning in their work. They often indicate
that they want to use their qualities and skills in challenging teamwork led by capable leaders.
A range of reasons are,
Selection of the wrong job.
Lack of proper induction / orientation, creates frustration.
Lack of future scope.
Lack of promotion opportunity.
Poor perception / relation with boss.
Lack of career planning.
Poor implementation of performance appraisal.
Lack of performance management system.
Lack of pay for performance.
Travel hazard, prefer close to home.
High expectation of the employee.
Prefer self employment.
A flat organization, hence limited scope for progress.
Lack of proper induction / orientation, creates frustration.
CHAPTER – III
OBJECTIVES OF THE STUDY
To know the satisfactory level of employees towards their job and working conditions.
To identify the factors which make employees dissatisfy.
To find the areas where Pondicherry Polymer Private Ltd is lagging behind.
To know the reasons, why attrition occurs.
To find the ways to reduce the attrition in Pondicherry Polymer Private Ltd.

CHAPTER – IV
RESEARCH METHODOLOGY
4.1 RESEARCH DESIGN
“A research design is the arrangement of conditions for collection and analysis data in a
manner that aims to combine relevance to the researcher purpose with economy in procedure”.
It constitutes the blueprint for the collection, measurement and analysis of data. As such
the design includes an outline of what the researcher will do form writing the hypothesis and its
operational implication to the final analysis of data.
More explicitly, the design decisions happen to be in respect of;
What is the study about?
Why is the study being made?
Where will the study be carried out?
What type of data is required?
Where can the data are found?
What periods of time will the study include?
What will be the sample design?
How will the data be analyzed?
In what style will the report be prepared?
What techniques of data collection will be used?
The Research Design undertaken for the study is Descriptive one. A study, which
wants to portray the characteristics of a group or individuals or situation, is known as Descriptive
study. It is mostly qualitative in nature.
4.2 TYPES OF DATA COLLECTED
Primary Data
Questionnaires are prepared and personal interview was conducted. Most of the
questions are consist of multiple choices. The structured interview method was undertaken. The
interview was conducted in English as well as in Tamil. Proper care was taken to frame the
interview schedule in such a manner it should be easily understood in view of educational level
of the employees. Generally 25 questions are prepared and asked to the employees of the
Pondicherry Private Ltd., Puducherry.
Secondary Data
Secondary data was collected from Internets, various books, Journals, and Company
Records.
4.3 QUESTIONNAIRE CONSTRUCTION
Questionnaires were constructed based on the following types
Open ended questions
Close ended questions
Multiple choice questions

4.4 DEFINING THE POPULATIONS
The Population or Universe can be Finite or infinite. The population is said to be finite if
it consist of a fixed number of elements so that it is possible to enumerate it in its totality. So In
this projects consist of finite population.
4.5 SAMPLING PLAN
A sampling plan is a definite design for obtaining a sample from the sampling frame. It
refers to the technique or the procedure the researcher would adopt in selecting some sampling
units from which inferences about the population is drawn. Sampling design is determined before
any data are collected.
Selective Sampling technique was adopted. In this method the researcher select those
units of the population in the sample, which appear convenient to him or the management of the
organization where he is conducting research.
4.6 SAMPLE SIZE
Nearly 50 samples are taken in Pondicherry Private Ltd.,
4.7 FIELD WORK
The field works is done at Pondicherry Private Ltd., Thiruvandar koil, Puducherry.
4.8 PERIOD OF SURVEY
The period is from August, 2007 to September, 2007.

4.9 DESCRIPTION OF STATISTICAL TOOLS USED
Percentage method
Chi-square test
Correlation
Weighted average method and
Analysis of variance (TWO-WAY ANOVA)
4.9.1 PERCENTAGE METHOD
In this project Percentage method test was used. The percentage method is used to know
the accurate percentages of the data we took, it is easy to graph out through the percentages. The
following are the formula
No of Respondent Percentage of Respondent = x 100 Total no. of Respondents
From the above formula, we can get percentages of the data given by the respondents.
4.9.2 CHI-SQUARE TEST
In this project chi-square test was used. This is an analysis of technique which analyzed
the stated data in the project. It analysis the assumed data and calculated in the study. The Chi-
square test is an important test amongst the several tests of significant developed by statistical.
Chi-square, symbolically written as x2 (Pronounce as Ki-Spare), is a statistical measure used in
the context of sampling analysis for comparing a variance to a theoretical variance.
Formula
(O-E) 2

2 = E
O = Observed frequency
E = Expected frequency
4.9.3 CORRELATION
Correlation analysis deals with the association between two or more variables. It
does not tell anything about cause and effect relationship. Correlation is classified in two
types as
Positive and
Negative Correlation.
SPEARMAN Correlation method, it also can be said as Rank Correlation. It is
defined by the symbol ‘r’
6 ∑ di²FORMULA r = 1 - ______________ n (n²-1)
Correlation value shall always lie between +1 and-1. When r =1, it shows there is perfect
positive correlation between variables. When r = 0, There is no correlation.
4.9.4 WEIGHTED AVERAGE METHOD
Weighted average can be defined as an average whose component items are multiplied by
certain values (weights) and the aggregate of the products are divided by the total of
weights.

One of the limitations of simple arithmetic mean is that it gives equal importance to all
the items of the distribution.
In certain cases relative importance of all the items in the distribution is not the same.
Where the importance of the items varies.
It is essential to allocate weight applied but may vary in different cases. Thus weightage
is a number standing for the relative importance of the items.
4.9.5 ANALYSIS OF VARIANCE (ANOVA)
Analysis of variance is an extremely useful technique concerning research. This is used
when multi sample are involved.
Anova is extremely a procedure for testing the difference among different groups of data
for homogeneity. “The essence of ANOVA is that the total amount of variation in a set of data is
broken down into two types such as
ONE-WAY ANOVA
TWO-WAY ANOVA
If we take only one factor and investigate the differences amongst its various categories
having numerous possible values one-way anova can be used. When we investigate two factors at
the same time then we can use two-way anova.
Steps involved in Two-way ANOVA are
1. Name of the Row samples as x1, x2, x3, x4……
2. Name of the Column samples as y1, y2, y3, y4……
3. Calculate the sum of all items by T = ∑ x1 + ∑ x2 + ∑ x3….
4. Correction factor CF = T² N
5. Calculate Total sum of squares SST = ∑ x1² + ∑ x2² + ∑ x3²….

6. Sum of squares between column samples SSC = (∑ y1) ² + (∑ y2) ² + (∑ y3) ² T² n n n N
7. Sum of squares between column samples SSR = (∑ x1) ² + (∑ x2) ² + (∑ x3) ² T² n n n N
8. Calculating Residual or Error SSE = [ SST- (SSC+SSR) ]
The basic principle of the Anova is to test for differences amongst the means of the
population by examing the amount of variation within the samples, relation to the amount of
variation between the samples.
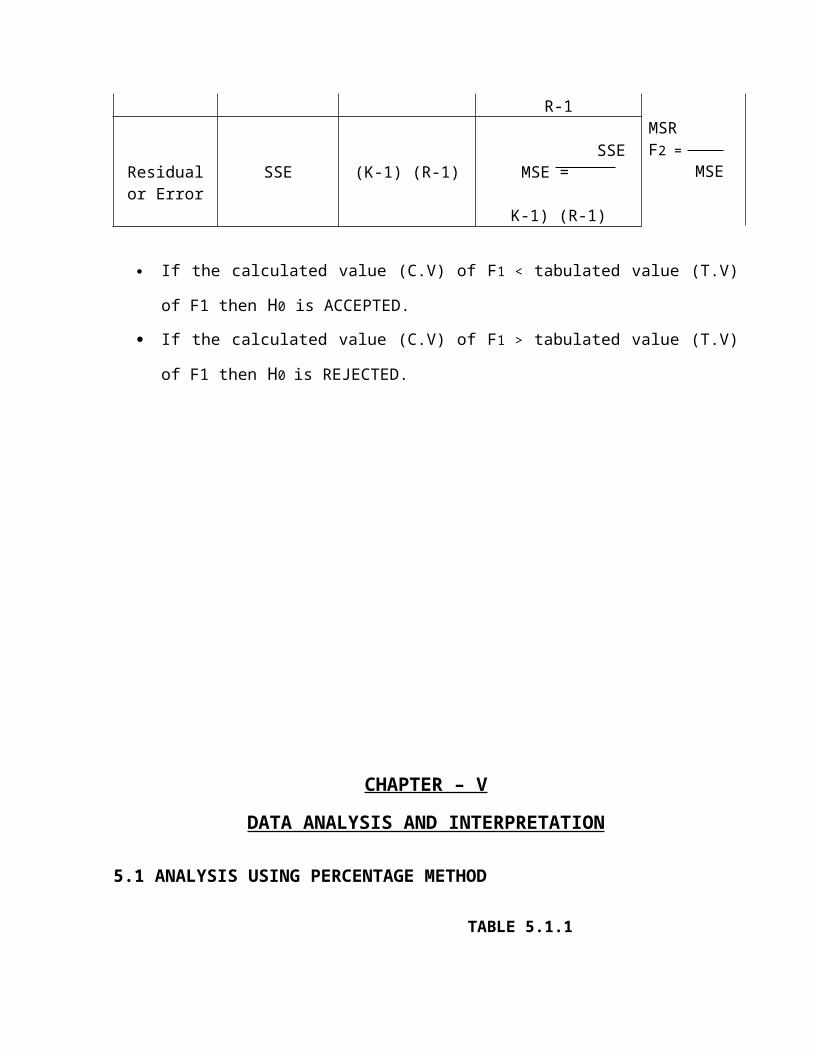
TWO-WAY ANOVA TABLE
SOURCE OF VARIATION
Sum of Squares Degrees of Freedom (d.f) Mean Square (MS) F-ratio
Between Columns Treatment
SSC V1 SSC
MSC = K-1
MSCF1 = MSE
MSRF2 =
MSE
Between Rows
Treatment
SSR V2 SSR
MSR = R-1
Residual or Error
SSE (K-1) (R-1) SSE
MSE = K-1) (R-1)
If the calculated value (C.V) of F1 < tabulated value (T.V) of F1 then H0 is ACCEPTED.
If the calculated value (C.V) of F1 > tabulated value (T.V) of F1 then H0 is REJECTED.

CHAPTER – V
DATA ANALYSIS AND INTERPRETATION
5.1 ANALYSIS USING PERCENTAGE METHOD
TABLE 5.1.1
Classification of the respondents based on their AGE LEVEL
S.No Age No. of Respondents Percentage
1 18-25 35 70
2 26-35 12 24
3 36-45 03 06
4 Above 45 0 0
Total 50 100Source: Primary Data
Inference:
The above table infers that, 70 percent belongs to the age group of 18-25 years, 24 percent
belongs to the age group of 26-35 years, and 6 percent belongs to the age group of 36-45 years.
CHART 5.1.1

010203040506070
18-25 26-35 36-45 Above45
PERCENTAGE
AGE LEVEL
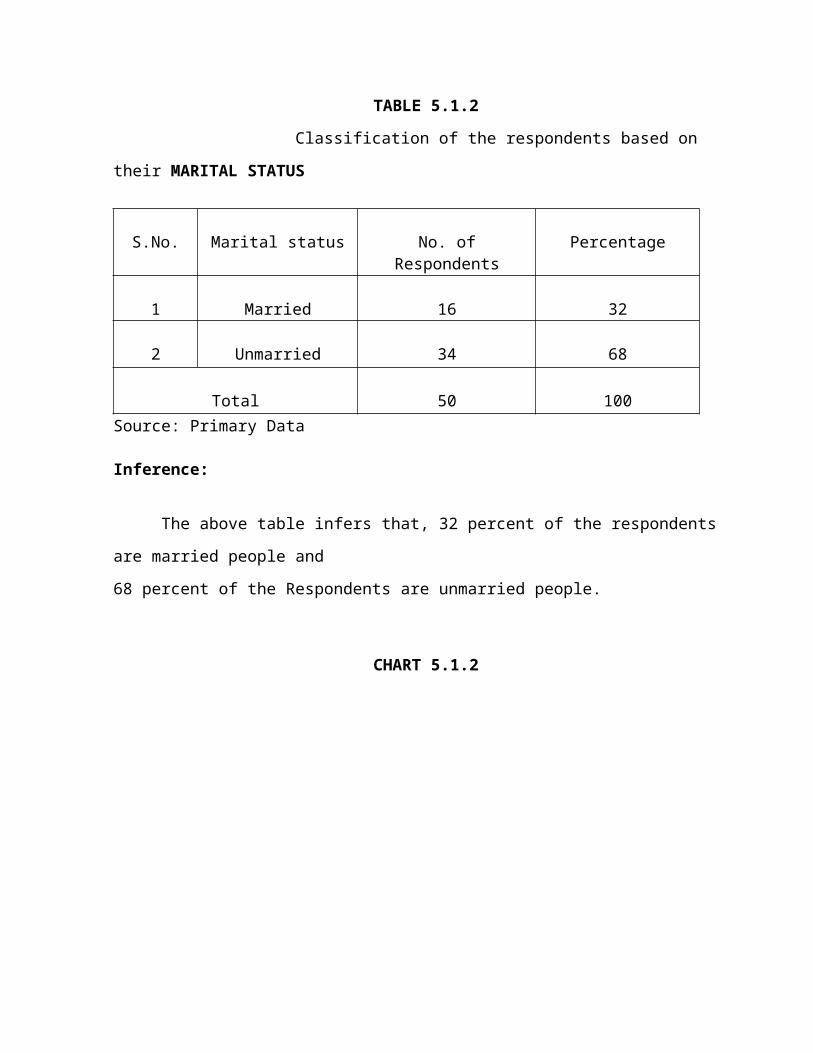
TABLE 5.1.2
Classification of the respondents based on their MARITAL STATUS
S.No. Marital status No. of Respondents Percentage
1 Married 16 32
2 Unmarried 34 68
Total 50 100
Source: Primary Data Inference:
The above table infers that, 32 percent of the respondents are married people and
68 percent of the Respondents are unmarried people.
CHART 5.1.2
0
10
20
30
40
50
60
70
Married Unmarried
PERCENTAGE
MARITAL STATUS
TABLE 5.1.3
Classification of the Respondents based on their EDUCATIONAL QUALIFICATION
S.no Qualification No. of Respondents Percentage
1 Below Hr.Sec 21 42
2 Hr.Sec 13 26
3 UG or PG 12 24
4 I.T.I and Others 04 08
Total 50 100
Source: Primary Data
Inference:
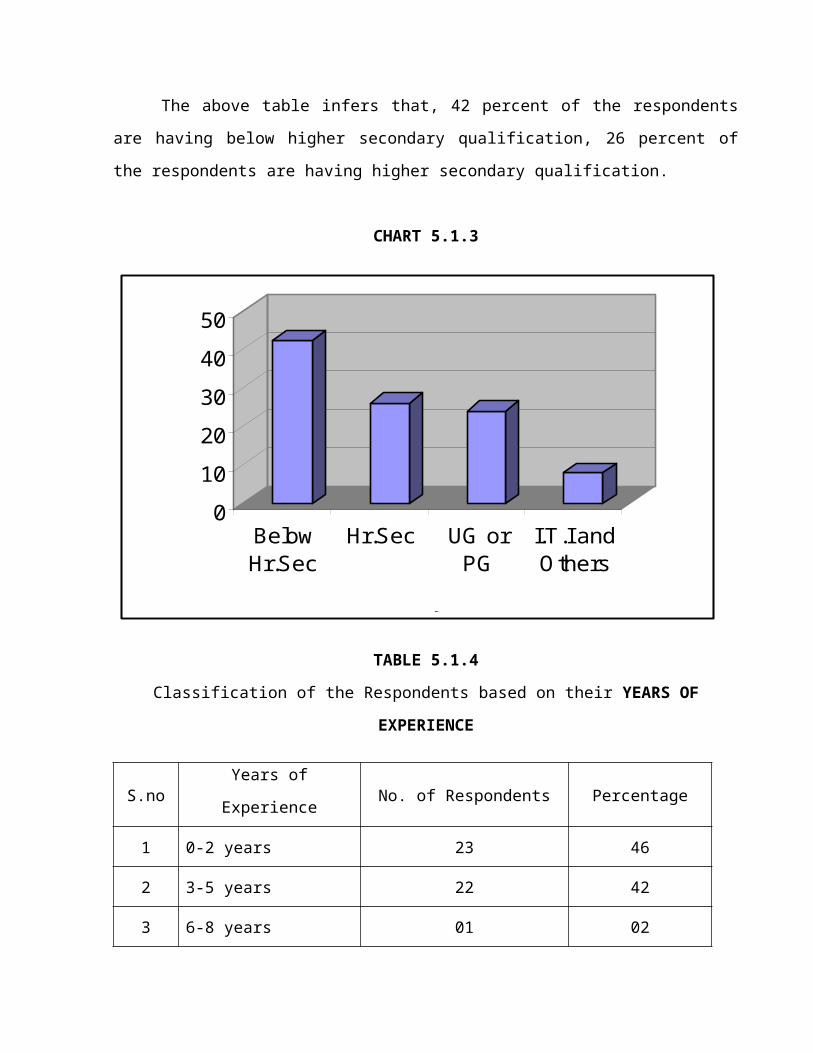
The above table infers that, 42 percent of the respondents are having below higher
secondary qualification, 26 percent of the respondents are having higher secondary qualification.
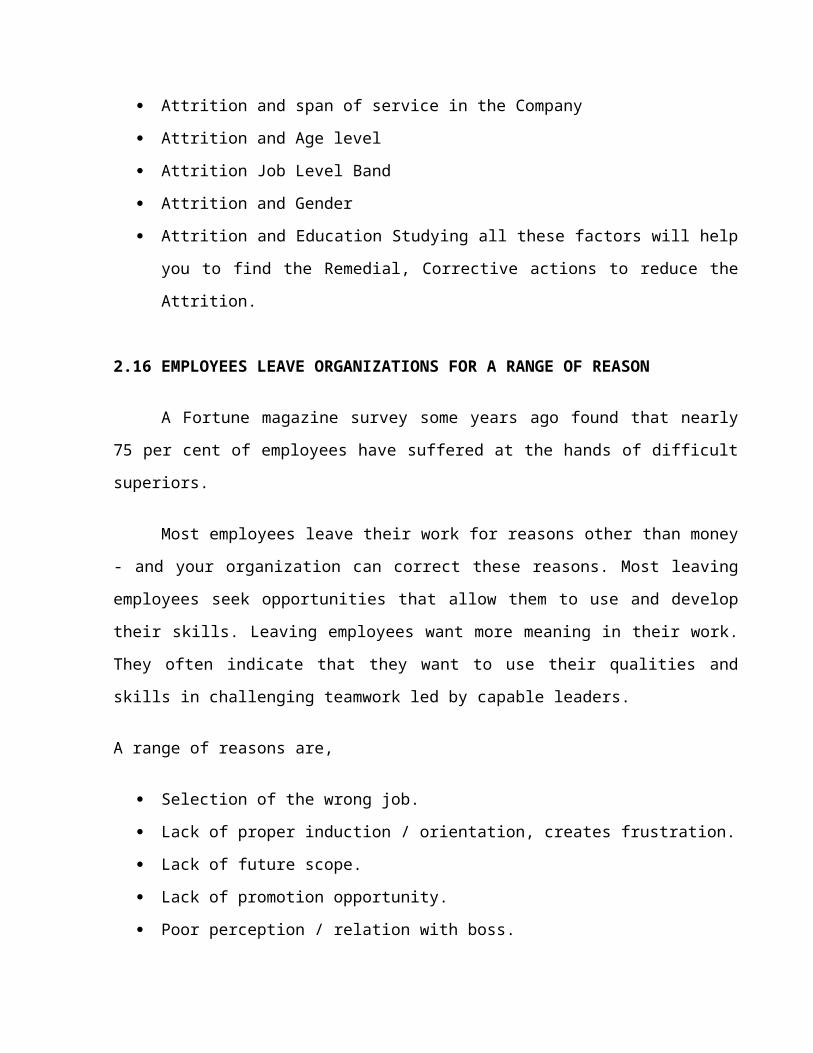
CHART 5.1.3
0
10
20
30
40
50
BelowHr.Sec
Hr.Sec UG orPG
I.T.I andOthers
PERCENTAGE
EDUCATIONAL QUALIFICATION
TABLE 5.1.4
Classification of the Respondents based on their YEARS OF EXPERIENCE
S.no Years of Experience No. of Respondents Percentage
1 0-2 years 23 46
2 3-5 years 22 42
3 6-8 years 01 02
4 Above 8 years 04 08
Total 50 100
Source: Primary Data
Inference:
The above table infers that, 46 percent of the respondents are having 0-2 years experience,
42 percent of the respondents are having 3-5 years, 2 percent has above 5 years of experience.
CHART 5.1.4
0
10
20
30
40
50
0-2 yrs 3-5 yrs 6-8 yrs Above 8yrs
PERCENTAGE
YEARS OF EXPERIENCE
TABLE 5.1.5
Classification of the Respondents based on their ROLE
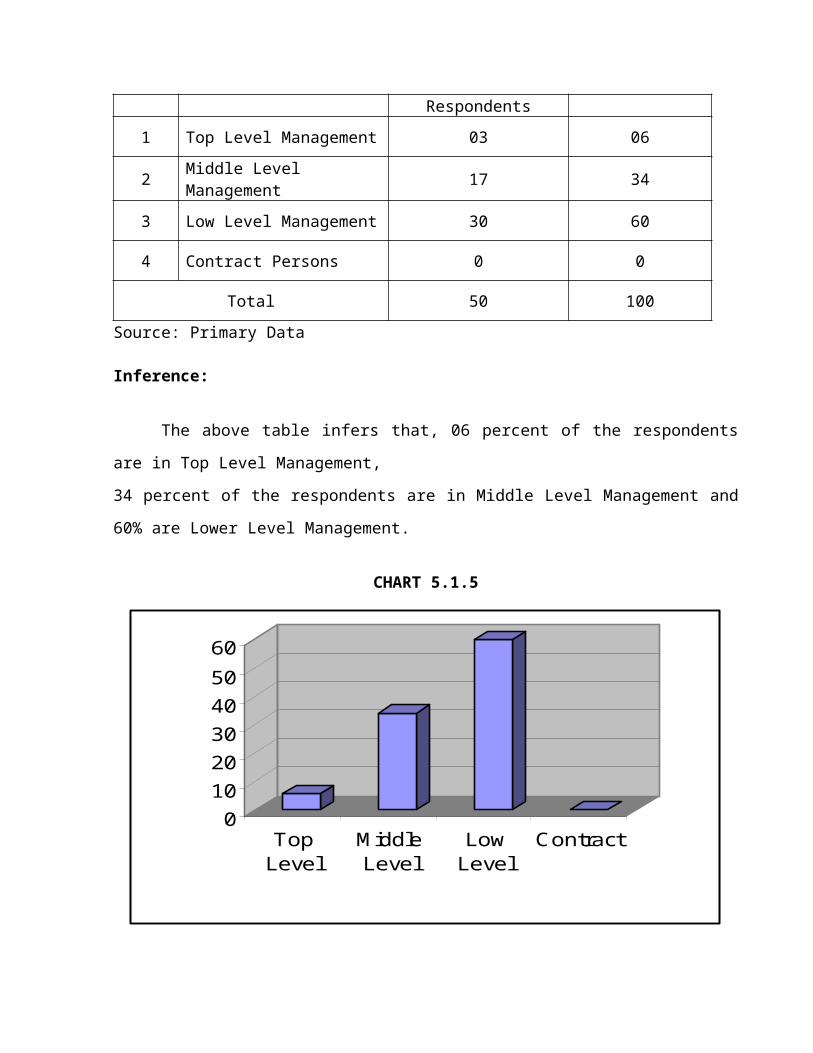
S.no Role of Employees No. of Respondents Percentage
1 Top Level Management 03 06
2 Middle Level Management 17 34
3 Low Level Management 30 60
4 Contract Persons 0 0
Total 50 100
Source: Primary Data
Inference:
The above table infers that, 06 percent of the respondents are in Top Level Management,
34 percent of the respondents are in Middle Level Management and 60% are Lower Level
Management.
CHART 5.1.5
0102030405060
TopLevel
MiddleLevel
LowLevel
Contract
PERCENTAGE
ROLE OF EMPLOYEES
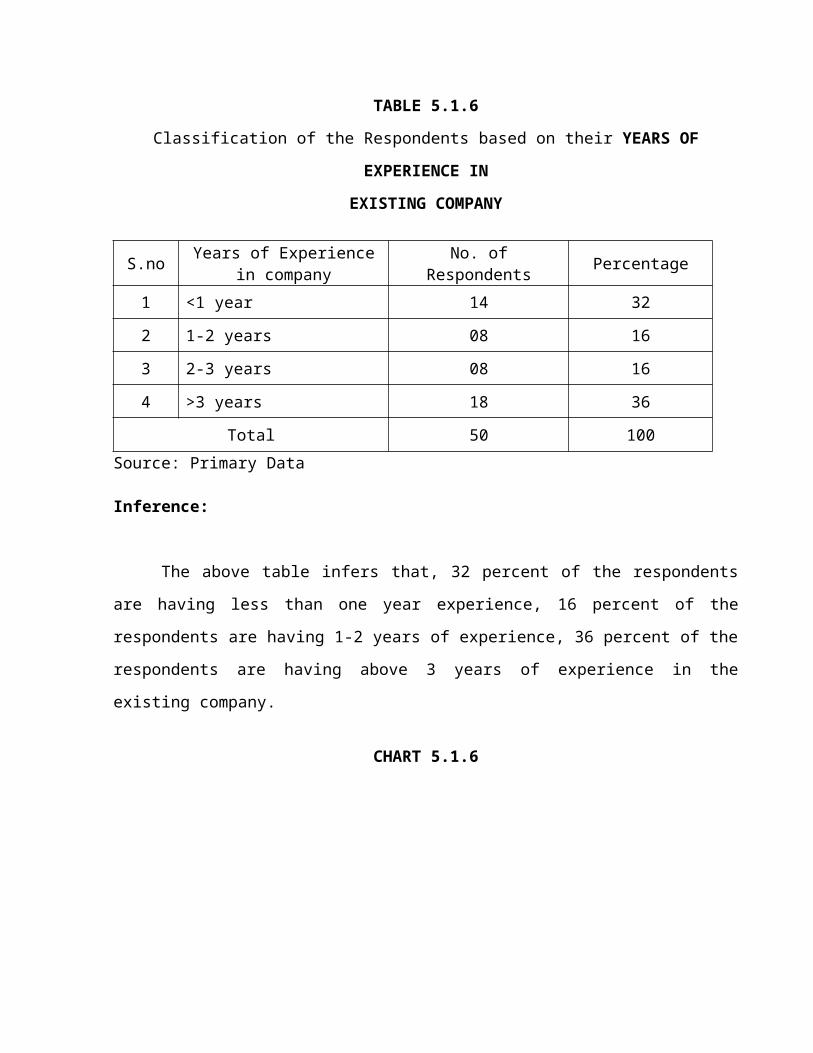
TABLE 5.1.6
Classification of the Respondents based on their YEARS OF EXPERIENCE IN
EXISTING COMPANY
S.no Years of Experience in company No. of Respondents Percentage
1 <1 year 14 32
2 1-2 years 08 16
3 2-3 years 08 16
4 >3 years 18 36
Total 50 100
Source: Primary Data
Inference:

The above table infers that, 32 percent of the respondents are having less than one year
experience, 16 percent of the respondents are having 1-2 years of experience, 36 percent of the
respondents are having above 3 years of experience in the existing company.
CHART 5.1.6
0
10
20
30
40
<1 yr 1-2 yrs 2-3 yrs >3 yrs
PERCENTAGE
EXPERIENCE IN THE COMPANY
TABLE 5.1.7
Classification of the Respondents based on their UNDERSTANDING ABOUT THE JOB
Source: Primary Data Inference:
The above table infers that, 16 percent of the respondents somewhat understand their job,
S.no Level of Attitude No of Respondents percentage
1 Not Really 02 04
2 Some what 08 16
3 Pretty Much 12 24
4 Totally 28 56
Total 50 100
24 percent of the respondents understand their job pretty much and 56 percent of the respondents
totally understand their job.
CHART 5.1.7
0
10
20
30
40
50
60
Not Really Some w hat Pretty Much Totally
LEVEL OF ATTITUDE
PERCENTAGE
TABLE 5.1.8
Classification of the Respondents based on their MOTIVATION
S.no Level of Attitude No. of Respondents Percentage
1 Highly Satisfied (H.S) 07 14
2 Moderately Satisfied (M.S) 26 52
3 Neutral (N) 15 30
4 Moderately Dissatisfied (M.D) 02 04
5 Highly Dissatisfied (H.D) 0 0
Total 50 100
Source: Primary Data
Inference:
The above table shows regarding Motivation that, 14 percent of the respondents are
highly satisfied, 52 percent of the respondents are moderately satisfied, 30 percent of the
respondents are neutral.
CHART 5.1.8
0
10
20
30
40
50
60
H.S M.S N M.D H.D
PERCENTAGE
LEVEL OF ATTITUDE
TABLE 5.1.9
Classification of the Respondents based on their APPRAISAL
S.no Level of Attitude No. of Respondents Percentage
1 Highly Satisfied (H.S) 05 10
2 Moderately Satisfied (M.S) 19 38
3 Neutral (N) 24 48
4 Moderately Dissatisfied (M.D) 02 04
5 Highly Dissatisfied (H.D) 0 0
Total 50 100Source: Primary Data
Inference:
The above table shows regarding Appraisal that, 10 percent of the respondents are highly
satisfied, 38 percent of the respondents are moderately satisfied, 48 percent of the respondents are
neutral.
CHART 5.1.9
0
10
20
30
40
50
H.S M.S N M.D H.D
PERCENTAGE
LEVEL OF ATTITUDE
TABLE 5.1.10
Classification of the Respondents based on their BASIC NEEDS
S.no Level of Attitude No. of Respondents Percentage
1 Highly Satisfied (H.S) 17 34
2 Moderately Satisfied (M.S) 25 50
3 Neutral (N) 05 10
4 Moderately Dissatisfied (M.D) 03 06
5 Highly Dissatisfied (H.D) 0 0
Total 50 100Source: Primary Data
Inference:

The above table shows regarding Basic Needs that, 34 percent of the respondents are
highly satisfied, 50 percent of the respondents are moderately satisfied, 10 percent of the
respondents are neutral.
CHART 5.1.10
0
10
20
30
40
50
H.S M.S N M.D H.D
PERCENTAGE
LEVEL OF ATTITUDE
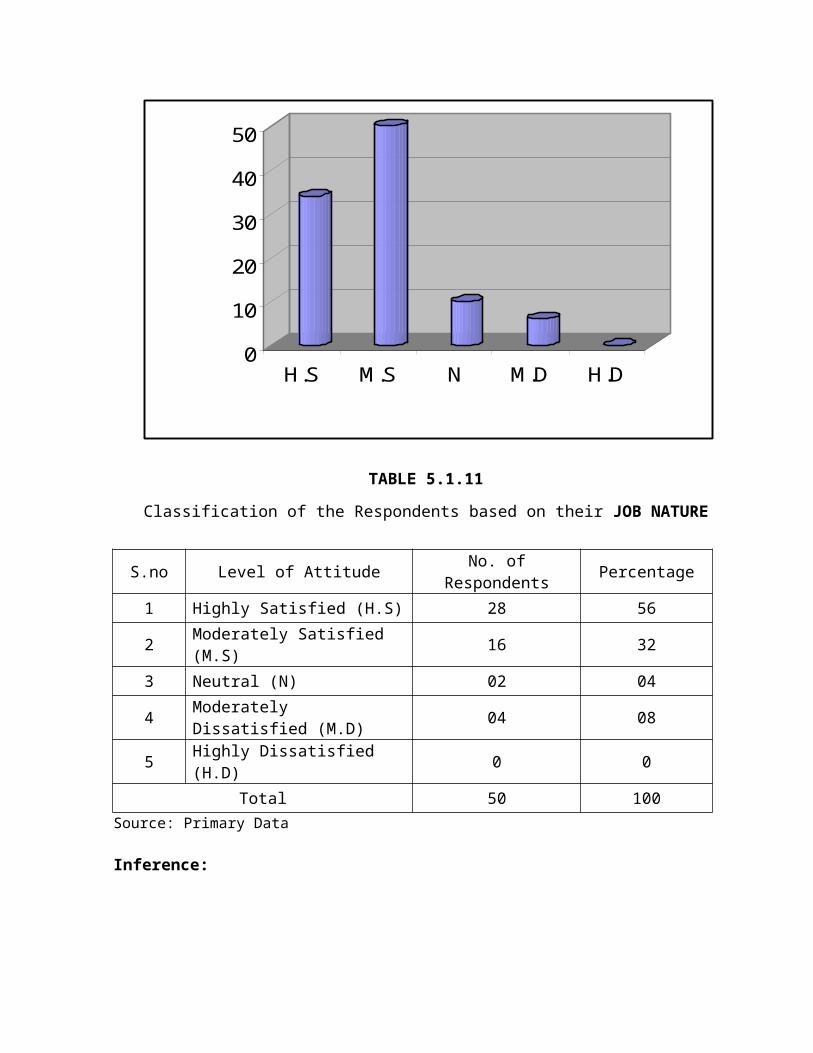
TABLE 5.1.11
Classification of the Respondents based on their JOB NATURE
S.no Level of Attitude No. of Respondents Percentage
1 Highly Satisfied (H.S) 28 56
2 Moderately Satisfied (M.S) 16 32
3 Neutral (N) 02 04
4 Moderately Dissatisfied (M.D) 04 08
5 Highly Dissatisfied (H.D) 0 0
Total 50 100Source: Primary Data
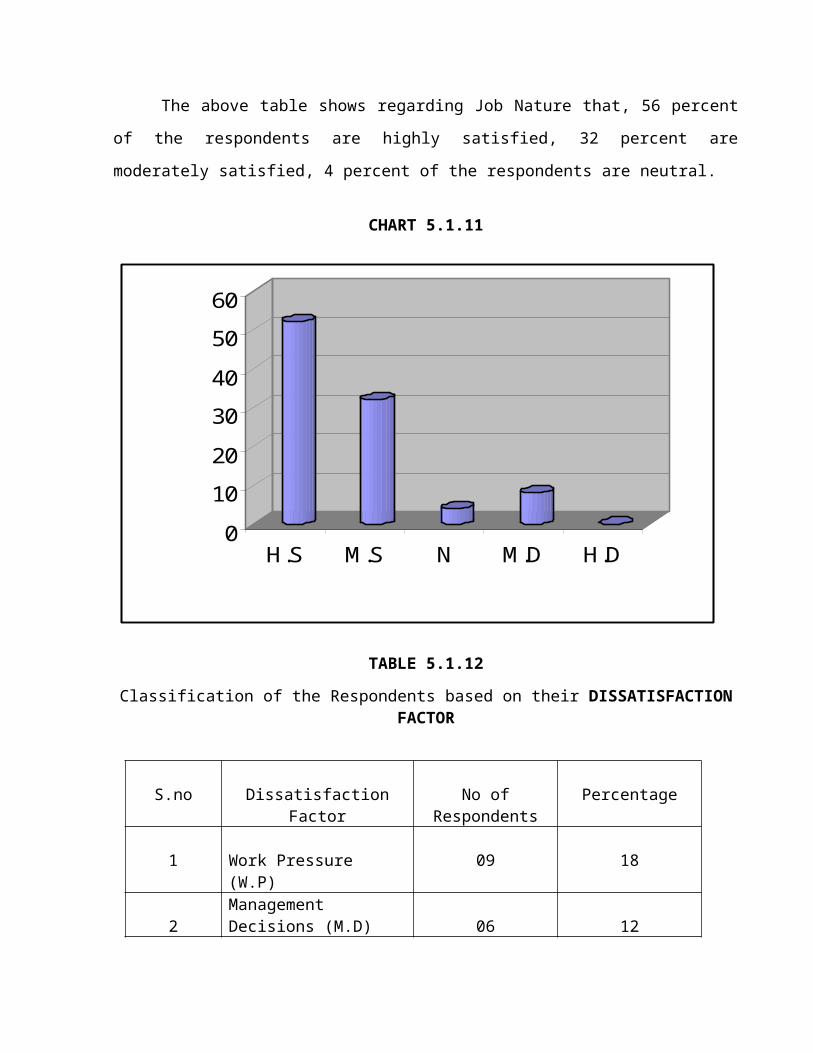
Inference:

The above table shows regarding Job Nature that, 56 percent of the respondents are highly
satisfied, 32 percent are moderately satisfied, 4 percent of the respondents are neutral.
CHART 5.1.11
0
10
20
30
40
50
60
H.S M.S N M.D H.D
PERCENTAGE
LEVEL OF ATTITUDE
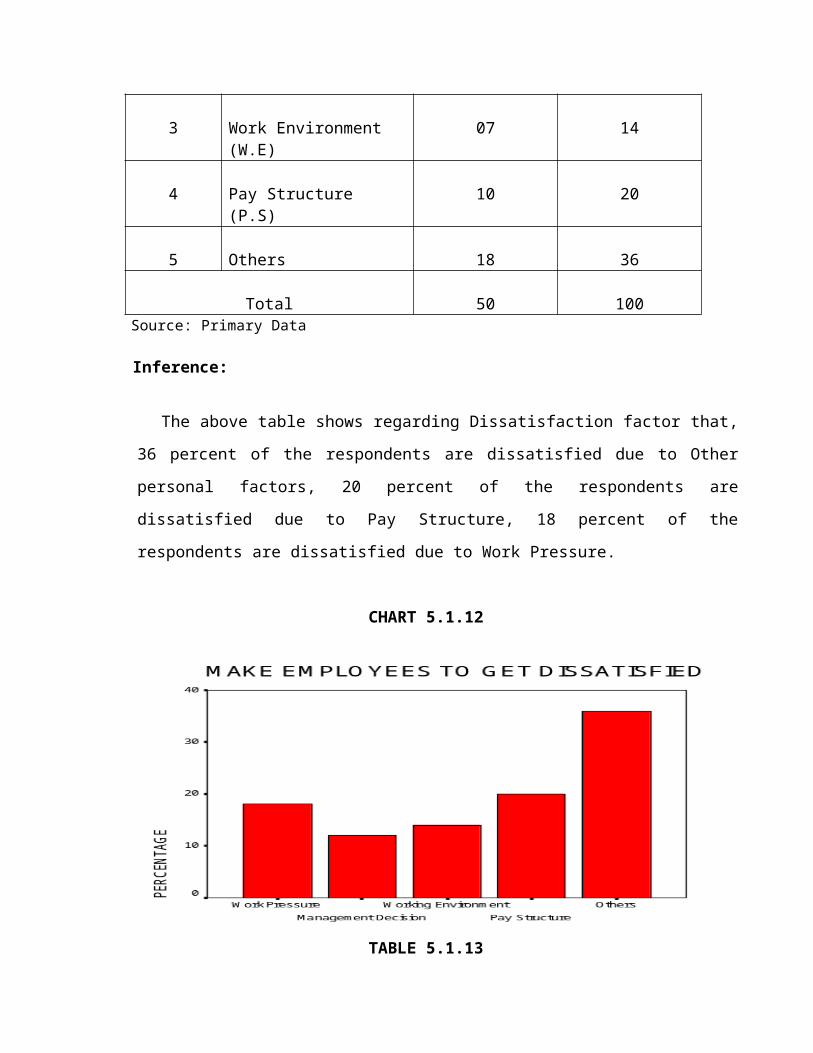
TABLE 5.1.12
Classification of the Respondents based on their DISSATISFACTION FACTOR
S.no Dissatisfaction Factor No of Respondents Percentage
1 Work Pressure (W.P) 09 18
2Management Decisions (M.D) 06 12
3 Work Environment (W.E) 07 14
4 Pay Structure (P.S) 10 20
5 Others 18 36
Total 50 100 Source: Primary Data

Inference:
The above table shows regarding Dissatisfaction factor that, 36 percent of the respondents
are dissatisfied due to Other personal factors, 20 percent of the respondents are dissatisfied
due to Pay Structure, 18 percent of the respondents are dissatisfied due to Work Pressure.
CHART 5.1.12
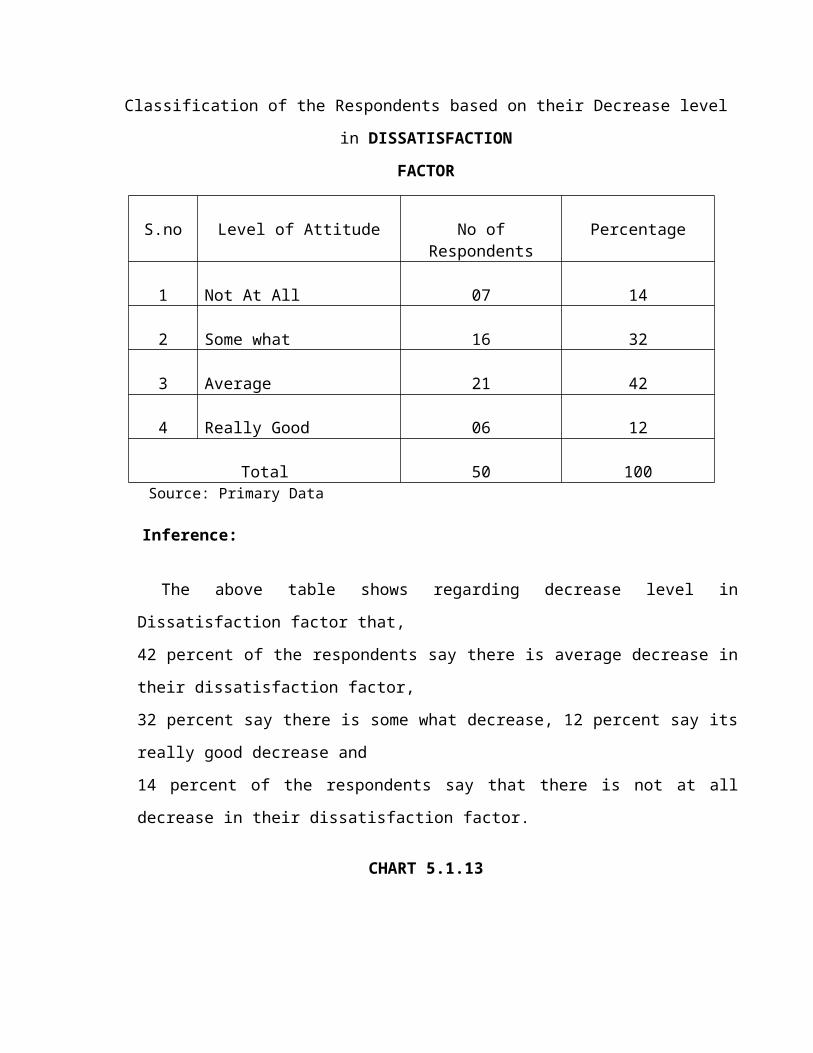
TABLE 5.1.13
Classification of the Respondents based on their Decrease level in DISSATISFACTION
FACTOR
S.no Level of Attitude No of Respondents Percentage
1 Not At All 07 14
2 Some what 16 32
3 Average 21 42
4 Really Good 06 12
Total 50 100 Source: Primary Data
Inference:

The above table shows regarding decrease level in Dissatisfaction factor that,
42 percent of the respondents say there is average decrease in their dissatisfaction factor,
32 percent say there is some what decrease, 12 percent say its really good decrease and
14 percent of the respondents say that there is not at all decrease in their dissatisfaction factor.
CHART 5.1.13
010203040
50
Not At All SomeWhat
Average ReallyGood
PERCENTAGE LEVEL OF ATTITUDE
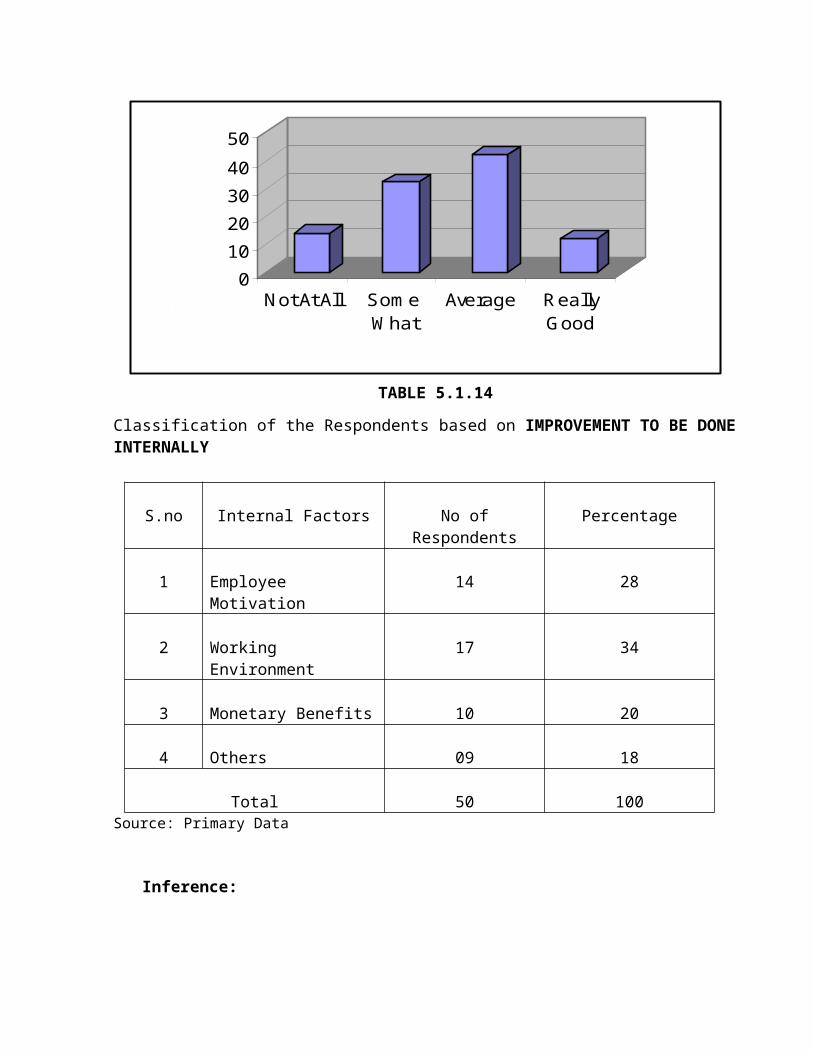
TABLE 5.1.14
Classification of the Respondents based on IMPROVEMENT TO BE DONE INTERNALLY
Source: Primary Data
Inference:
S.no Internal Factors No of Respondents Percentage
1 Employee Motivation 14 28
2 Working Environment 17 34
3 Monetary Benefits 10 20
4 Others 09 18
Total 50 100

The above table shows regarding Improvement to be done internally,
28 percent of the respondents say Employee Motivation, 34 percent of the respondents say
Working Environment and 20 percent of the respondents say Monetary Benefits.
CHART 5.1.14
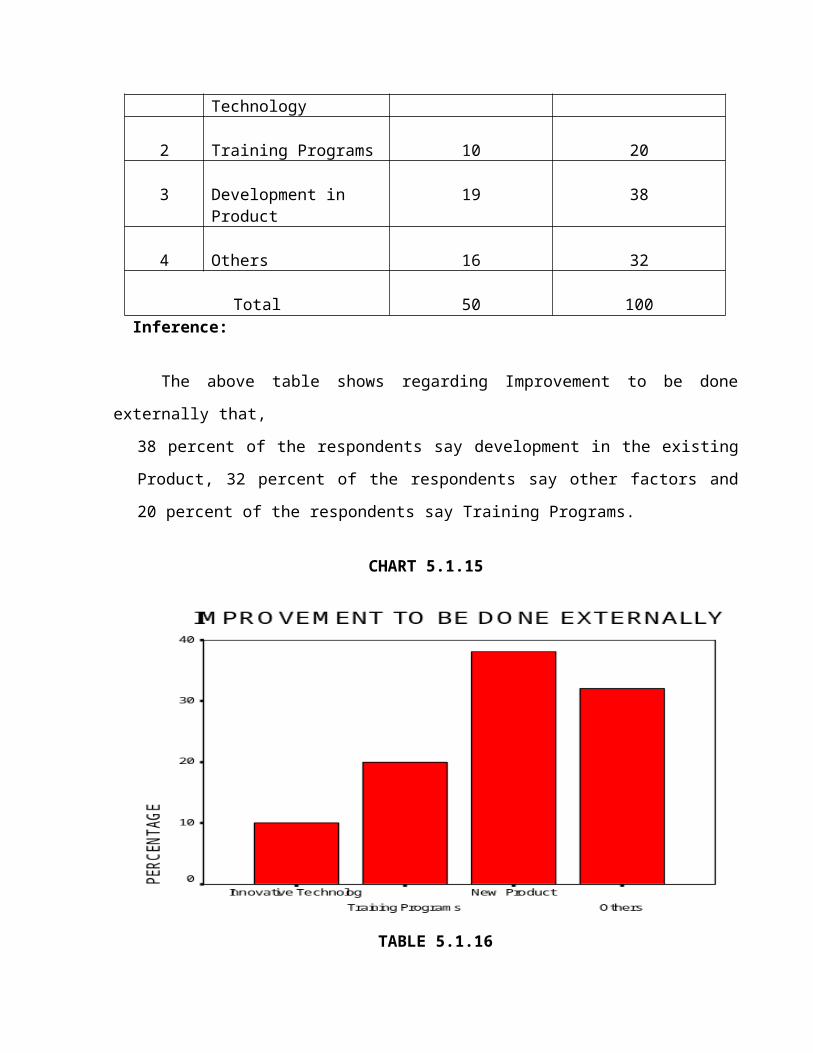
TABLE 5.1.15
Classification of the Respondents based on IMPROVEMENT TO BE DONE EXTERNALLY
S.no Internal Factors No of Respondents Percentage
1 Innovative Technology 05 10
2 Training Programs 10 20
3 Development in Product 19 38
4 Others 16 32
Total 50 100 Inference:
The above table shows regarding Improvement to be done externally that,
38 percent of the respondents say development in the existing Product, 32 percent of the
respondents say other factors and 20 percent of the respondents say Training Programs.
CHART 5.1.15
TABLE 5.1.16
Classification of the Respondents based on their option to CHANGE JOB
S.no Reasons No of Respondents Percentage
1 Working Condition 04 08
2 Family Issues 18 36
3 Growth 20 40
4 Monetary Benefits 08 16
Total 50 100 Source: Primary Data
Inference:

The above table shows regarding Improvement to be done internally that, 40 percent of
the respondents say Growth, 36 percent of the respondents say Family Issues and 16 percent of
the respondents say Monetary Benefits.
CHART 5.1.16
TABLE 5.1.17
Classification of the Respondents based on their OPPORTUNITY TO LEARN
S.no Level of Attitude No of Respondents Percentage
1 More 33 66
2 Less 11 22
3 No 06 12
Total 50 100Source: Primary Data
Inference:
The above table shows regarding opportunity to learn that, 66 percent of the respondents
say there is more opportunity, 22 percent of the respondents say there is less opportunity and
12 percent of the respondents say there is no opportunity.
CHART 5.1.17
0
20
40
60
80
More less No
PERCENTAGE OPPORTUNITY TO LEARN
TABLE 5.1.18
Classification of the Respondents based on their FREEDOM TO CONVEY PROBLEMS
S.no Freedom No of Respondents Percentage
1 Yes 35 70
2 No 15 30
Total 50 100 Source: Primary Data
Inference:
The above table shows regarding Freedom to convey their problems that,
70 percent of the respondents say Yes and 30 percent of the respondents say No.
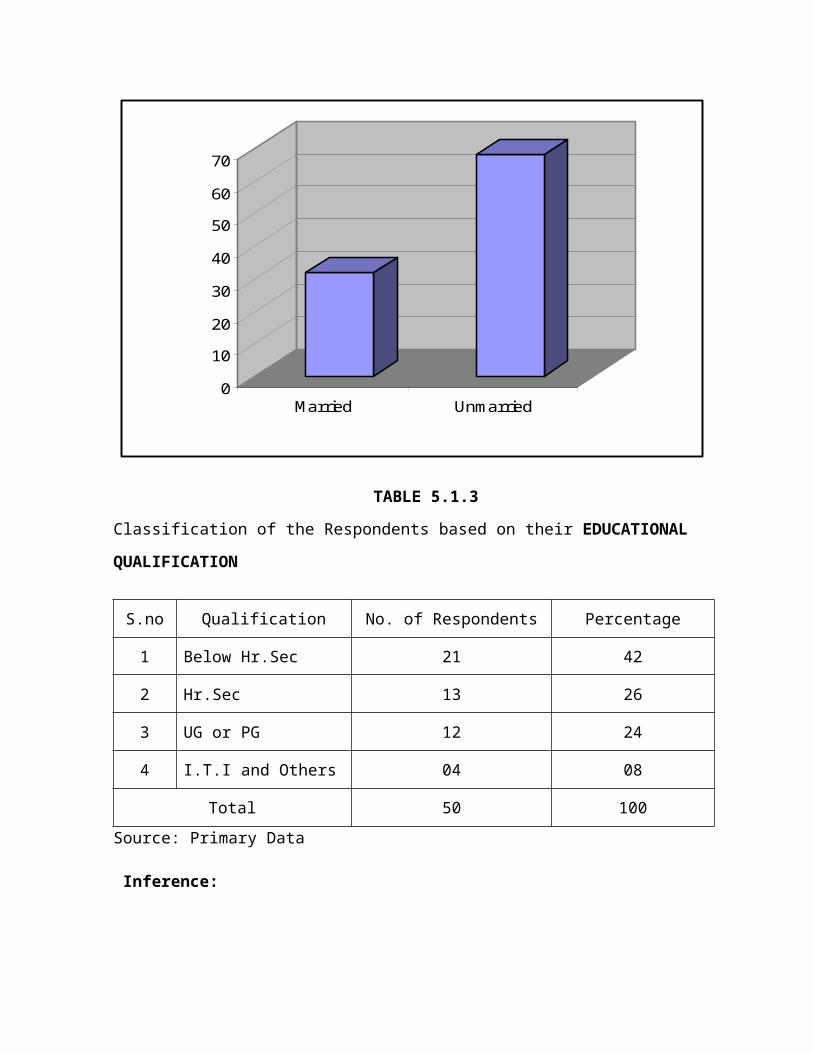
CHART 5.1.18
TABLE 5.1.19
Classification of the Respondents based on their CONSIDERATIONS FOR EMPLOYEE
CREATIVITY
Source: Primary Data
Inference:
The above table shows regarding Considerations for employee creativity that,
78 percent of the respondents say Yes and 22 percent of the respondents say No.
CHART 5.1.19
S.no Considerations No of Respondents
Percentage
1 Yes 39 78
2 No 11 22
Total 50 100
0
20
40
60
80
Yes No
PERCENTAGE CONSIDERATIONS FOR EMPLOYEE CREATIVITY
TABLE 5.1.20
Classification of the Respondents based on EFFECT OF WHISTLE BLOWING
S.no Effect No of Respondents Percentage
1 More 0 0
2 Less 0 0
3 Rare 06 12
4 No Effect 44 88
Total 50 100Source: Primary Data
Inference:
The above table shows regarding opportunity to learn that, 88 percent of the respondents
say there is No effect and 12 percent of the respondents say the effect is Rare.
TABLE 5.1.20

0
20
40
60
80
100
More Less Rare No Effect
PERCENTAGE
EFFECT OF WHISTLE BLOWING
TABLE 5.1.21
Classification of the Respondents based on their PROMOTIONS
S.no Promotion No of Respondents Percentage
1 Yes 27 54
2 No 23 46
Total 50 100
Source: Primary Data
Inference:
The above table shows regarding Promotion that, 54 percent of the respondents say Yes
and 46 percent of the respondents say No.
CHART 5.1.21
42
4446
48
50
5254
Yes No
PERCENTAGE
PROMOTION
TABLE 5.1.22
Classification of the Respondents based on their TRANSPORT FACILITIES
S.no Level of Attitude No. of Respondents Percentage
1 Highly Satisfied (H.S) 09 18
2 Moderately Satisfied (M.S) 15 30
3 Neutral (N) 13 26
4 Moderately Dissatisfied (M.D) 06 12
5 Highly Dissatisfied (H.D) 08 16
Total 50 100Source: Primary Data
Inference:
The above table shows regarding Transport facilities that, 18 percent of the respondents
are highly satisfied, 30 percent of the respondents are moderately satisfied and 26 percent of the
respondents are neutral.
CHART 5.1.22
0
5
10
15
20
25
30
H.S M.S N M.D H.D
PERCENTAGE
LEVEL OF ATTITUDE
TABLE 5.1.23
Classification of the Respondents based on their RECREATIONAL FACILITIES
S.no Level of Attitude No. of Respondents Percentage
1 Highly Satisfied (H.S) 0 0
2 Moderately Satisfied (M.S) 19 38
3 Neutral (N) 15 30
4 Moderately Dissatisfied (M.D) 09 18
5 Highly Dissatisfied (H.D) 07 14
Total 50 100Source: Primary Data
Inference:
The above table shows regarding Recreational facilities that, 38 percent of the
respondents are moderately satisfied, 30 percent of the respondents are neutral and 18 percent of
the respondents are moderately dissatisfied.
CHART 5.1.23

0
10
20
30
40
H.S M.S N M.D H.D
PERCENTAGE
LEVEL OF ATTITUDE
TABLE 5.1.24
Classification of the Respondents based on their WORKING SPACE
S.no Level of Attitude No. of Respondents Percentage
1 Highly Satisfied (H.S) 28 56
2 Moderately Satisfied (M.S) 09 18
3 Neutral (N) 06 12
4 Moderately Dissatisfied (M.D) 02 04
5 Highly Dissatisfied (H.D) 05 10
Total 50 100Source: Primary Data
Inference:
The above table shows regarding Working space that, 56 percent of the respondents are
highly satisfied, 18 percent of the respondents are moderately satisfied, 12 percent of the
respondents are neutral, 10 percent of the respondents are highly dissatisfied.

CHART 5.1.24
0
10
20
30
40
50
60
H.S M.S N M.D H.D
PERCENTAGE
LEVEL OF ATTITUDE
TABLE 5.1.25
Classification of the Respondents based on their ACCOMMODATION
S.no Level of Attitude No. of Respondents Percentage
1 Highly Satisfied (H.S) 20 40
2 Moderately Satisfied (M.S) 23 46
3 Neutral (N) 07 14
4 Moderately Dissatisfied (M.D) 0 0
5 Highly Dissatisfied (H.D) 0 0
Total 50 100Source: Primary Data
Inference:
The above table shows regarding Accommodation that, 39 percent of the respondents are
highly satisfied, 45 percent of the respondents are moderately satisfied, 14 percent of the
respondents are neutral.

CHART 5.1.25
0
10
20
30
40
50
H.S M.S N M.D H.D
PERCENTAGE
LEVEL OF ATTITUDE
5.2 ANALYSIS USING CHI-SQUARE TEST- 2
FREEDOM TO CONVEY PROBLEMS TO TOP-LEVEL Vs CONSIDERATIONS FOR EMPLOYEE CREATIVITY
Null Hypothesis
There is no any significance difference between Freedom to convey problems and
Considerations for employee creativity factors.
TABLE 5.2.1
OBSERVED COUNT
S.no
Freedom to Convey
problemsEmployee Creativity
Yes No Total
1 Yes 33 02 35

2 No 06 09 15
Total 39 11 50 Source: Primary Data
TABLE 5.2.2
EXPECTED COUNT
S.no
Freedom to Convey
problemsEmployee Creativity
Yes No Total
1 Yes 27.3 7.7 35.0
2 No 11.7 3.3 15.0
Total 39.0 11.0 50.0
Source: Primary Data
FORMULA
(O-E) 2 2 = E O = Observed frequency
E = Expected frequency
COMPUTATION OF CHI-SQUARE ( 2 )
TABLE No: 5.2.3
S.No O E (O-E) (O-E)2 (O-E)2 /E
1 33 27.3 5.7 32.49 1.19
2 2 7.7 -5.7 -32.49 4.22
3 6 11.7 -5.7 -32.49 2.78
4 9 3.3 5.7 32.49 9.84

TOTAL 18.03
Source: Primary Data
The calculated value is 18.03
Degree of freedom = (R-1) (C-1) = (2-1) (2-1)
= 1
Level of significance = 5%
Table value 1 of DGF and 5% level of significance = 3.854
18.03 > 3.854 - Calculated Value is greater than Tabulated Value
Hence, Null hypothesis is rejected.
INFERENCE
Thus Chi-Square test infers that there is significance difference regarding Freedom
to convey problems and Considerations for employee creativity factors.
5.3 ANALYSIS USING CORRELATION ANALYSIS
BASED ON RESPONDENT UNDERSTANDING ABOUT JOB VS DECREASE IN THE
DISSATISFACTION LEVEL
Let X be the understanding Level of Employees about their job.
Let Y be the decrease in the dissatisfaction level.
TABLE 5.3.1
S.no Factors X Y
1 Not At All 0 7
2 Average 22 37
3 Really Good 28 6
Total 50 50Source: Primary Data
RANKS
TABLE 5.3.2
S.no Rank of X Rank of Y di² = (Xi-Yi)²
1 3 2 1
2 2 1 1
3 1 3 4
Total ∑ (Xi-Yi)² 6
6 ∑ di² Formula r = 1- n (n²-1)
By substituting the data to the formula,
6 * 6 Formula r = 1- = -0.5 3 (3²-1)
Therefore we get r = -0.5 INFERENCE
The value obtained is in negative, where it infers that a change in one variable has an
opposite change in another variable. From the correlation analysis it is inferred that, when the
employee’s understand about their job well then they adopt to the organization, so the level of
dissatisfaction get decreases.
5.4 ANALYSIS USING WEIGHTED AVERAGE METHOD
The respondents are asked about some factors listed below in the organization. Their
levels of attitude for those factors are calculated below.
TABLE No: 5.4.1
FACTORS Highly satisfied Satisfied Neutral Dissatisfied
Motivation 7 26 15 2
Appraisal 5 19 24 2
Basic needs 17 25 5 3
Job nature 28 16 2 4
Source: Primary Data
TABLE No: 5.4.2
POINT WEIGHTAGE
4 3 2 1
FACTORS Highly satisfied
Satisfied Neutral Dissatisfied TOTAL AVG RANK
Motivation 28 78 30 2 138 2.76 3
Appraisal 20 57 48 2 127 2.54 4
Basic needs 68 75 10 3 156 3.12 2
Job nature 12 48 4 4 168 3.36 1Source: Primary Data
INFERENCE
The above table infers that the company gives more weightage
First to the job nature of employees,
Second to the basic needs,
Third to motivation and
Finally to the appraisal factor.
This shows that the employees are very much satisfied with their job nature and they tend
to retain in the same company.
5.5 ANALYSIS USING ANOVA
YEARS OF EXPERIENCE IN THE COMPANY Vs DECREASE IN DISSATISFACTION LEVEL
Null Hypothesis
i. There is no any significance difference between years of experience in the existing
company.
ii. There is no any significance difference between the decreases in dissatisfaction level.
TABLE 5.5.1
S.no
Decrease in Dissatisfaction
Level
Working Years
Not at All Somewhat Ok Average Really
GoodTotal
1 <1 year 1 3 11 1 16
2 1-2 years 1 3 3 1 8
3 2-3 years 0 2 5 1 8
4 >3 years 5 8 2 3 18
Total 7 16 21 6 50Source: Primary Data
STEPS IN TWO-WAY ANOVA
Number of all items N = 16
Sum of all items are T= 50
T²Correction factor CF = = 156.25 N
Total sum of squares SST = 127.75
Sum of squares between column samples SSC = 39.25
Sum of squares between column samples SSR = 20.75
Residual or Error SSE = 67.75
ANOVA TABLE 5.5.2
Source Of Variation
Sum of Squares
Degrees of Freedom (d.f) Mean Square (MS) F-ratio
Treatmentbetween Decrease in Dissatisfaction level
39.25 3 13.08
1.737
1.088
Treatment between Years of Experience in the Company
20.75 3 6.916
Residual or Error 67.75 9 7.527
Tabulated value for (3,9) d.f at 5% level of Significance is 3.86

INFERENCE
i. Calculated value (1.737) < Tabulated value (3.86)
Therefore H0 is accepted.
This shows that there is no any significant difference between the decreases in the
dissatisfaction level of employees.
ii. Calculated value (1.088) < Tabulated value (3.86)
Therefore H0 is accepted.
This shows that there is no any significant difference between the years of experience in
the existing company.
CHAPTER – VI
FINDINGS OF THE STUDY, SUGGESSTION AND RECOMMENDATION
6.1 FINDINGS
From the Survey it is found that, 70 % belongs to the age group of 18-25 years, 24 %
belongs to the age group of 26-35 years, 6% belongs to the age group of 36-45 years.
The study has found that 32% are married and 68% are unmarried.
According to the respondents, 42% are below H.Sc, 26% completed H.Sc, 24% are upto
UG or PG, 8% are ITI.
The survey found that 46% belongs to 0-2 years experience, 42% belongs to 3-5 years
experience, 2% belongs to 6-8 years and 8% belongs to experience of above 8years.
According to the survey 6% are from Top-level, 34% are from Middle-level and 60% are
from Lower-level management and no any contracted persons.
The study has found 32% has <1 year experience in the existing company, 16% has 1-2
years experience, 16% has 2-3 years experience, 36% has >3 years work experience in the
company.
From the Survey it is found that, 4% are rarely understood about their job, 16% are
somewhat understood, 24% are pretty much in their job, 56% are totally underst6ood
about their present job.
The study has found that 18% of employees get dissatisfy due to work pressure, 12% due
to management decisions, 14% due to working environment, 20% due to pay structure
and 36% gets dissatisfy due to other personal factors.
It has been found that 42% of respondents say that they have some decrease level in their
dissatisfaction level, so majorly there is a decrease in those factors.
The study has found that 34% of respondents suggest working environment and 28%
suggest employee motivation to be improved internally.
From the survey it is found that 38% suggest for development in the existing products,
20% suggest for training programs to be improved externally.
From the respondents it has been found that 40% prefers to change job due to lack of
growth in their career, 36% for family issues, and 16% for their monetary benefits.
The study has found that 66% of respondents say that they have opportunity to learn
further, so it infers that the respondents have opportunity to learn.
From the survey it is found that 70% of respondents have freedom to convey problems to
the top-level, so it infers that there is a good flow of communication channel.
The study has found that 78% of respondent’s creativity is considered in the organization.
From the survey it is found that 88% of respondent’s prefer no effect of whistle-blowing,
this infers that there is no such an effect which can lead to attrition.
The study has found that 30% of respondents are moderately satisfied with their
transportation facility, 12% are moderately dissatisfied.
From the survey it has been found that 46% of respondents are moderately satisfied with
their accommodation facilities and 40% are highly satisfied.
From the chi-square analysis it has been found that there is significant difference
regarding Freedom to convey problems and Considerations for employee’s creativity
factors.

From the correlation analysis it is inferred that, when the employee’s understand about
their job well then they adopt to the organization, so there will be a decrease in the
dissatisfaction level.
From the Analysis of variance it is inferred that there is no any significant difference
between the decreases in the dissatisfaction level of employees and the years of
experience in the existing company.
6.2 SUGGESTIONS AND RECOMMENDATIONS
More than half of the employees are satisfied with their nature of job and with their
working conditions. So the company can attain a further improvement level for the rest if
it guides its employees.
Very few employees are comfortable with their present salary. Majority of them has the
opinion that low salary is their problem in their organization. So the Company is
suggested to provide salary, which satisfies its employees at least to some extent.
Many employees suggest improving working environment and employee motivation in
the survey. So the company should give attention to the factors which it can improve itself
internally.
Many of the respondents suggest improving some developments in the existing product.
So the company can be benefited if they consider the employees view for their long run.
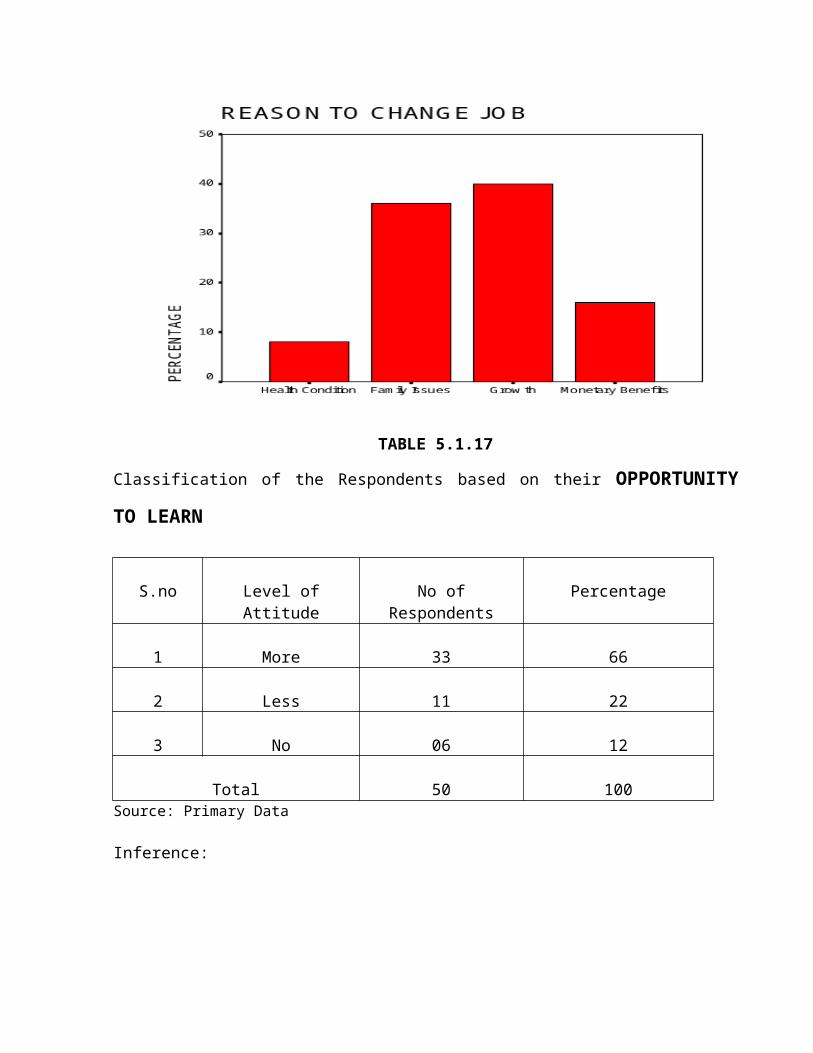
The company has less number of employees so the company could recruit many new
employees. So, there will be a decrease level in work pressure among employees.
Even though the employees are satisfied with their job nature, it is identified in the study
that many employees prefer to change their job due to lack in their growth opportunities
in their job. So the company can look for some Innovative technologies to decrease their
attrition level by providing growth opportunities.
The company should conduct regular meetings to know about what exactly employee
expects.
The company may give training like Personality Development and Self improvement
training to the employees, every three or six months once this status has to be reviewed
and necessary action can be taken. It is better to have such training in the future.
CHAPTER – VII
CONCLUSION
The main aim of any organization is to earn profit. But to attain the maximum profit, the
organization should concentrate more on employees and the ways to retain them for their long
run.
To control attrition level in the Pondicherry Polymers Private Ltd., the company should focus on
What the employees really expect from the organization?
The common reasons for which the employees feel to change their job?
What makes employee to get dissatisfy in the organization?
From the study it is identified that, the Lack of growth opportunities and the Family issues
are the major problem which makes employees to change their job from this organization.
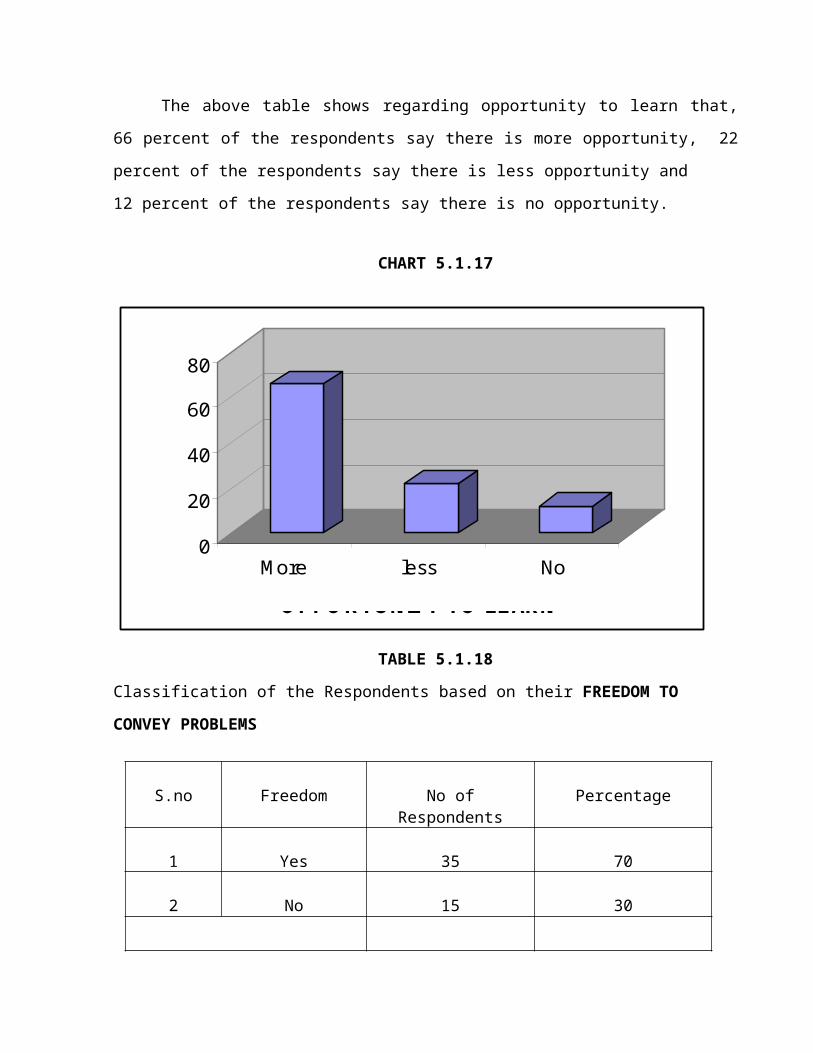
This study concludes that to reduce attrition, Pondicherry Polymers Private Ltd should
create some opportunities for the growth of their employees through adopting new Innovative
Technologies, Effective training programs and the company can recruit people’s who are around ,
so the family issue factor will not lead to attrition in future and the company can curb attrition.
CHAPTER – VIII
8.1 LIMITATIONS OF THE STUDY
The size of sample size was 50 respondents only. If the sample size were more then the
results of the inferences would have been different.
As majority of workers are from northern states, the interview was conducted in
Hindi language also.
This study has been done based on the existing employees and not with any Corporate
Alumni’s. Because the employees may leave out of the company before a year, so they
may not know about the present situation of the company.
The data collected in the study will be valid for few months. Hence the result obtained
might not be helpful for the management after a period of months.
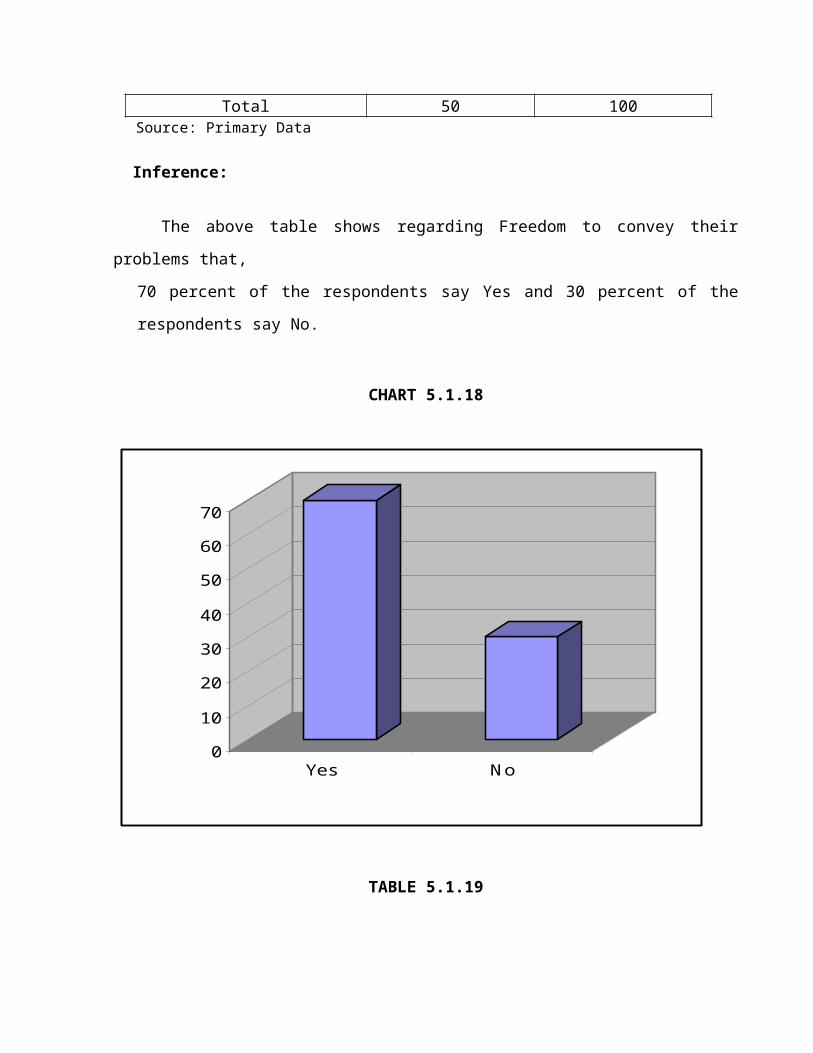
8.2 SCOPE FOR THE FURTHER STUDY
The scope of this study is confined to Pondicherry Polymers Private Ltd. with respect to
the employees at all the levels of management.
This study can help the management to know where the company is lagging behind and
helps to improve its internal and external environment.
The project throws light through valuable suggestion to decrease attrition level in the
organization.
This study can help the management to find the weaker parts of the employee feels
towards the organization and also helps in converting those weaker part in to stronger
by providing the optimum suggestions or solutions.
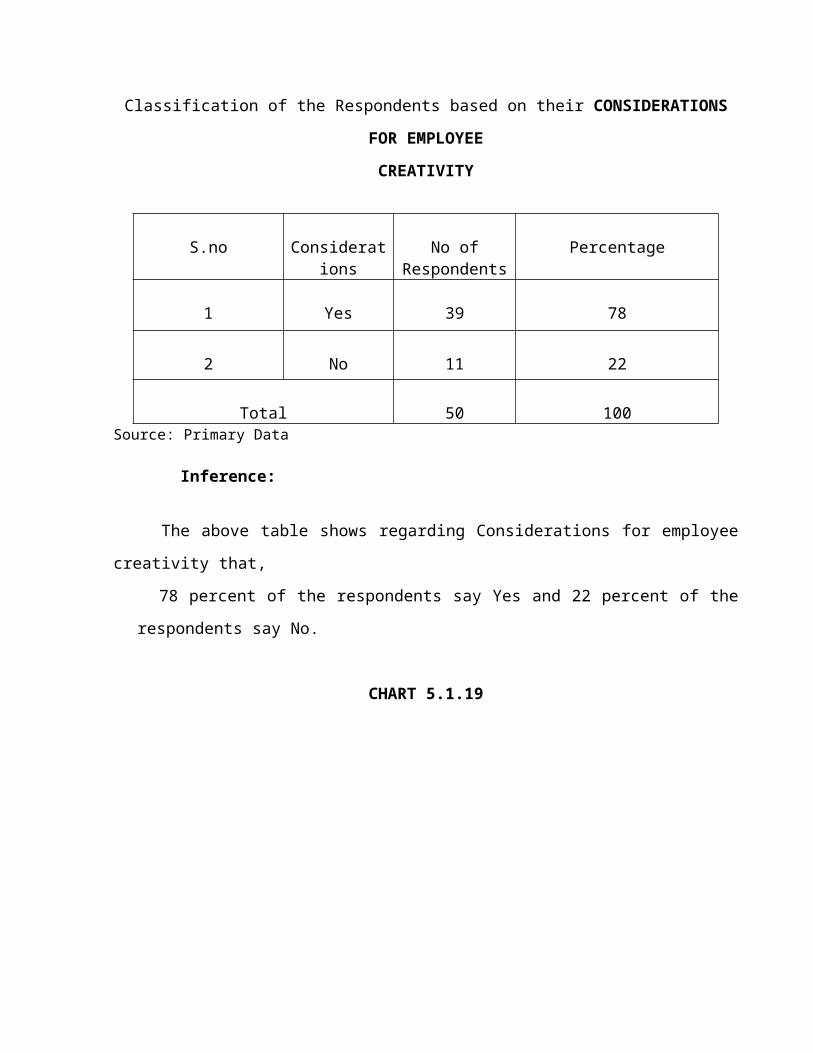
This study has a wider for scope in any kind of organization since “attrition” is general
one and makes the employees to put forth their practical difficulties and need factors in
the organization.
This study can help the management to know for which the reason employees tend to
change their job, through dissatisfaction factors faced in the organization and also helps
to recover by providing the optimum suggestions or solutions.
This project can be base for the students who are doing the project in the related area.
APPENDICES
ANNEXURE-1
QUESTIONNAIRE
A STUDY ON ATTRITION LEVEL IN PONDICHERRY POLYMERS
PRIVATE LTD, PUDUCHERRY
PERSONAL DATA :
1. Name:
2. Designation:
3. Age: a) 18 -25 b) 26 – 35 c) 36 -45 d) above 45
4. Marital status: a) Married b) unmarried
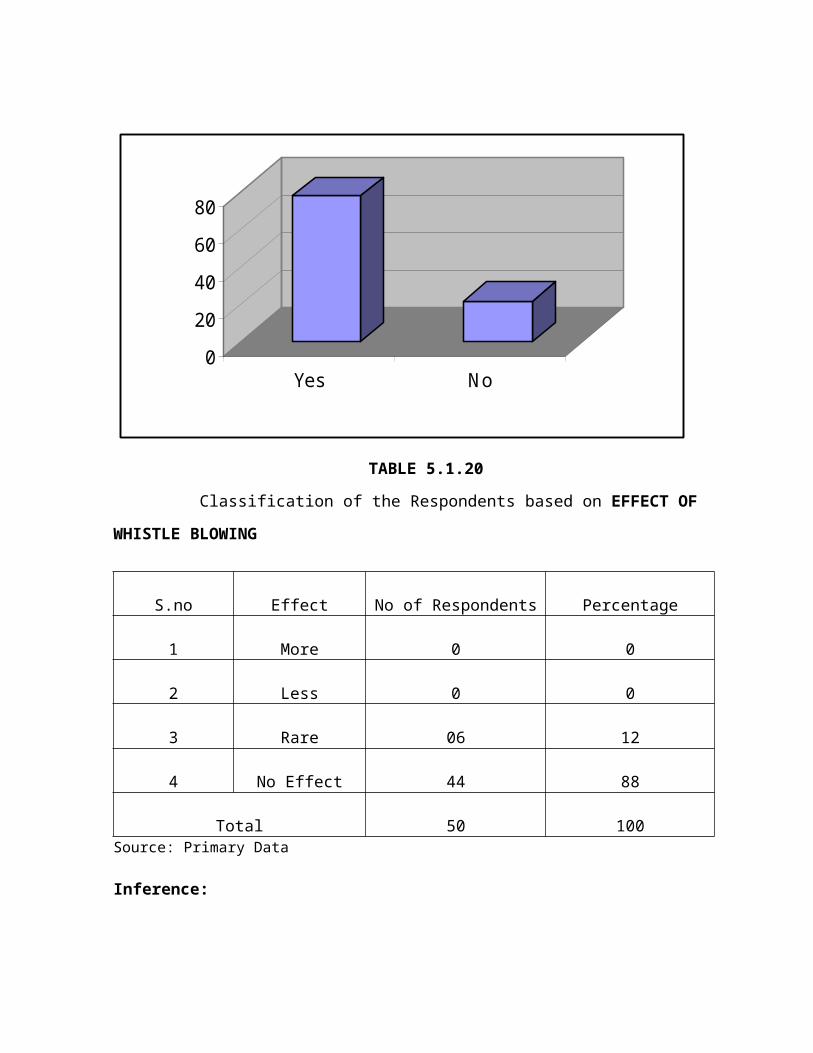
5. Educational Qualification:
a) Below Hr. Sec. b) Hr. Sec c) UG or PG d) ITI or e) Others
6. Years of Experience: a) 0 – 2 years b) 3 – 5 years c) 6 – 8 years d) Above 8 years
7. Contact No & Address:
OTHER DATA:
8. Identify your role in ------?
□ Top level mgt □ Middle level mgt□ Lower level mgt □ Contracted person
9. How long you are working here?
□ <1 year □ 1-2 years □ 2-3 years □ > 3 years
10. How well do you understand your job and the role it plays in achieving your vision ?
□ Not at all □ Not really □ Somewhat□ Pretty much □ Totally
11. Rate the following factors
Highly satisfied
Satisfied Neutral Dissatisfied Highly Dissatisfied
Motivation
Appraisal
Basic Needs
Nature of Job
12. Which of the following makes you to get dissatisfied..?

□ Work Pressure □ Management decisions □ Working Environment □ Pay structure □ others
13. Do you believe that there is a decrease in your Dissatisfaction level -----?
□ Not at all □ Somewhat ok □ Average □ Really good
14. Specify the area where improvement is required Internally..?
□ Employee motivation □ Working environment □ Monetary benefits □ Others
15. Specify the area where improvement is required Externally..?
□ Innovative technology □ Training programs □ New products □ Others
16. For which reason, you prefer to change the job..?
□ Health condition □ Family issues □ Growth □ Monetary benefits □ Others
17. Is there any opportunities to learn forward about your job..?
a) More b) Less c) No
18. Do you have any freedom to convey your immediate problems to Top-level people..?
a) Yes b) No
19. Is there any considerations for the employee’s creativity..?
a) Yes b) No
20. Effect of Whistle-Blowing…
a) High b) Low c) Rare d) No Effect
21. Whether promotion is given based on skill…?
a) Yes b) No

22. Transportation:
a) Highly Satisfied b) Moderately satisfied c) Neutral
d) Moderately dissatisfied e) Highly dissatisfied
23. Recreation facilities:
a) Highly Satisfied b) Moderately satisfied c) Neutral
d) Moderately dissatisfied e) Highly dissatisfied
24. Working Space:
a) Highly Satisfied b) Moderately satisfied c) Neutral
d) Moderately dissatisfied e) Highly dissatisfied
25. Accommodation:
a) Highly Satisfied b) Moderately satisfied c) Neutral
d) Moderately dissatisfied e) Highly dissatisfied
ANNEXURE-2
BIBILIOGRAPHY
BOOKS
Human Resource Management. The ICFAI Center of Management Research, Banjara
Hills, Hyderabad.
Kothari, C.R., Research Methodology - Methods & Techniques , New Delhi, New Age
international (P) Ltd., Publishers, Second Edition,2004.
Gupta, S.P., Statistical Methods, New Delhi, Sultan Chand & Sons Publishers, Thirty
Fourth Edition, 2005.
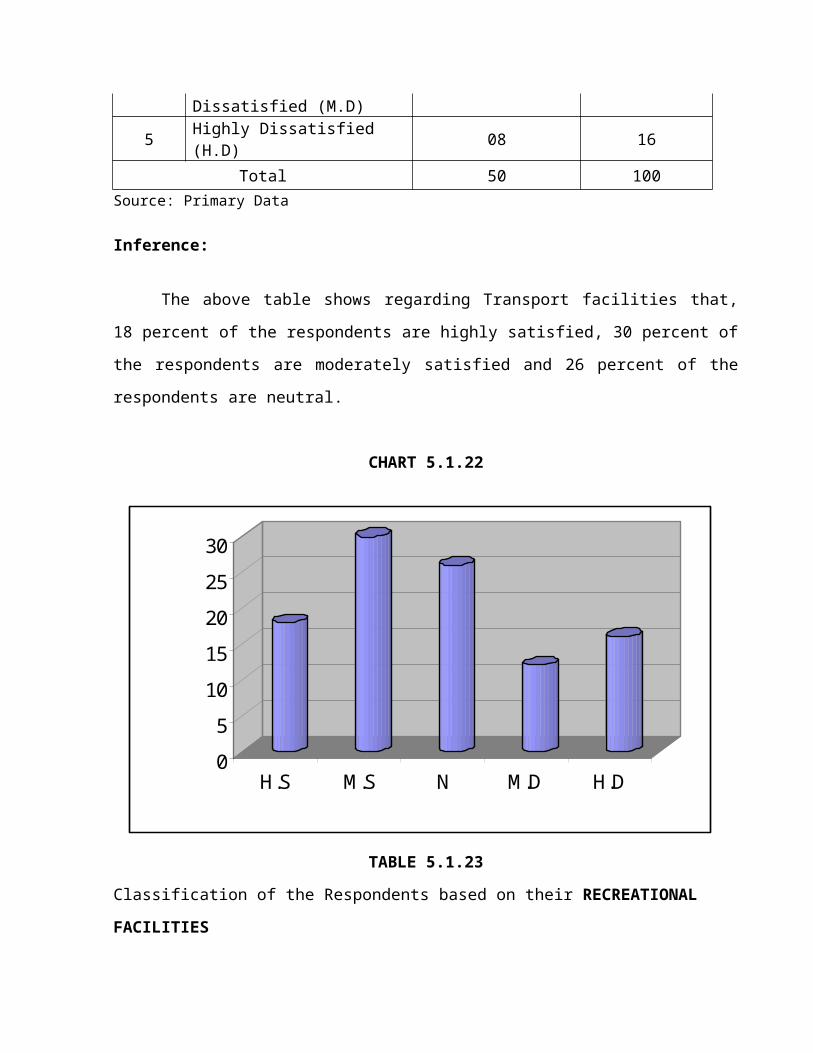
WEBSITES
www.pppkainya.com
www.attrition.org/attrition/about.html
www.answers/topic/attriton.com
www.geocites.com/tutor19US/attrition.html
www.bpotimes.com
www.mangamentorg.com