chapter key ideas outline - university of daytonacademic.udayton.edu/pmac/im/macro18.pdf · * *...
TRANSCRIPT

401
18 INTERNATIONAL FINANCE**
* * This is Chapter 34 in Economics.
C h a p t e r K e y I d e a s
¥ $
A. The yen (¥), the euro ( ), and the dollar ($) are the world’s three big currencies.
B. Why do currency exchange rates fluctuate? Why has the dollar fallen against the other major currencies?
C. Foreigners are buying up American assets on a big scale. Why?
O u t l i n e
I. Financing International Trade
A. When we buy something from another country, we use the currency of that country to make the transaction. And we record international transactions in the balance of payments accounts.
B. Balance of Payments Accounts
1. A country’s balance of payments accounts records its international trading, borrowing, and lending.
2. There are three balance of payments accounts:
a) The current account records payments for imports of goods and services from abroad, receipts from exports of goods and services sold abroad, net interest paid abroad, and net transfers (such as foreign aid payments). The current accounts balance equals the sum of: exports minus imports, net interest income and net transfers.
b) The capital account records foreign investment in the United States minus U.S. investments abroad. (This account also has a statistical discrepancy that arises from errors and omissions in measuring capital transactions.)
c) The official settlements account records the change in U.S. official reserves. U.S. official reserves are the government’s holdings of foreign currency. If U.S. official reserves increase, the official settlements account is negative. This occurs because holding foreign currency is like (but not the same as) investing abroad, which is a negative entry in the capital account.
3. The balances of these three accounts sum to zero.
C h a p t e r

4 0 2 C H A P T E R 1 8
4. Table 18.1 shows the balance of payments for the United States in 2003.
5. Figure 18.1 shows the balance of payments as a ratio of GDP over the period 1983 to 2003.
I N T E R N A T I O N A L F I N A N C E 4 0 3
C. Borrowers and Lenders, Debtors and Creditors
1. A country that is borrowing more from the rest of the world than it is lending to it is called a net borrower. A country that is lending more to the rest of the world than it is borrowing from it is called a net lender.
a) Since the 1970s, the United States has been a net borrower. The total net foreign borrowing in the year 2003 was $3.8 trillion, about 35 percent of the total value of our nation’s goods and services produced.
b) A country can be a net borrower if it is reducing its stock of foreign investment, or it may be going deeper into debt.
2. A debtor nation is a country that during its entire history has borrowed more from the rest of the world than it has lent to it. A creditor nation is a country that has invested more in the rest of the world than other countries have invested in it. The difference between being a borrower/lender nation and being a creditor/debtor nation is the same as the difference between stocks and flows of financial capital.
3. Being a net borrower is not a problem provided the borrowed funds are used to finance capital accumulation that increases income. Being a net borrower is a problem if the borrowed funds are used to finance consumption.
D. Current Account Balance
1. The current account balance (CAB) is:
CAB = NX + Net interest income + Net transfers
2. The main item in the current account balance is net exports (NX). The other two items are much smaller and don’t fluctuate much.
4 0 4 C H A P T E R 1 8
E. Net Exports
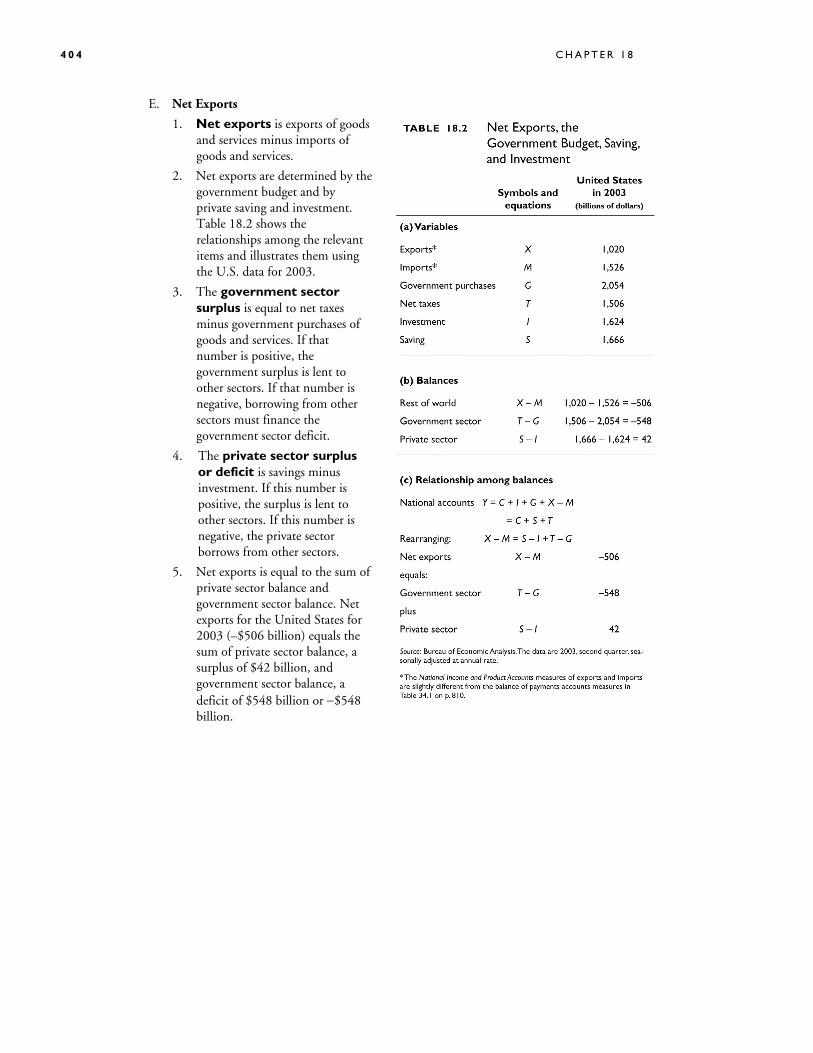
1. Net exports is exports of goods and services minus imports of goods and services.
2. Net exports are determined by the government budget and by private saving and investment. Table 18.2 shows the relationships among the relevant items and illustrates them using the U.S. data for 2003.
3. The government sector surplus is equal to net taxes minus government purchases of goods and services. If that number is positive, the government surplus is lent to other sectors. If that number is negative, borrowing from other sectors must finance the government sector deficit.
4. The private sector surplus or deficit is savings minus investment. If this number is positive, the surplus is lent to other sectors. If this number is negative, the private sector borrows from other sectors.
5. Net exports is equal to the sum of private sector balance and government sector balance. Net exports for the United States for 2003 (–$506 billion) equals the sum of private sector balance, a surplus of $42 billion, and government sector balance, a deficit of $548 billion or −$548 billion.

I N T E R N A T I O N A L F I N A N C E 4 0 5
F. The Three Sector Balances
1. Figure 18.2 shows how the three balances have fluctuated for the United States from 1983 through 2003.
2. The private sector balance has moved in the opposite direction to the government balance.
3. There is not a strong relationship between net exports and the other two balances individually.
G. Is U.S. Borrowing for Consumption or Investment?
1. U.S. borrowing from abroad finances investment.
2. U.S. borrowing is much less than private investment and similar to government investment in public infrastructure capital.
II. The Exchange Rate
A. We get foreign currency and foreigners get U.S. dollars in the foreign exchange market—the market in which the currency of one country is exchanged for the currency of another.
1. The price at which one currency exchanges for another is called a foreign exchange rate. a) Currency depreciation is
the fall in the value of the currency in terms of another currency.
b) Currency appreciation is the rise in value of the currency in terms of another currency.
2. The exchange rate is a price that is determined by demand and supply in the foreign exchange market.
3. Figure 18.3 shows the exchange rate of the U.S. dollar in terms of the Japanese yen and the European euro between 1993 and 2003.
B. Demand in the Foreign Exchange Market
1. The quantity of dollars that traders plan to buy in the foreign exchange market during a given period depends on:
a) The exchange rate b) Interest rates in the United States and other countries c) The expected future exchange rate

4 0 6 C H A P T E R 1 8
C. The Law of Demand for Foreign Exchange
1. The demand for dollars is a derived demand. People buy dollars so that they can buy U.S.-made goods and services or U.S. assets.
2. Other things remaining the same, the higher (lower) the exchange rate, the smaller (greater) is the quantity of dollars demanded in the foreign exchange market.
3. There are two sources of the derived demand for U.S. dollars:
a) Exports affect: The larger the value of U.S. exports, the larger is the quantity of dollars demanded on the foreign exchange market. And the lower the exchange rate, the greater is the demand for U.S.-made goods and services, so the greater is the quantity of dollars demanded.
b) Expected profit effect: For a given expected future U.S. dollar exchange rate, the lower (higher) the exchange rate, the greater (smaller) is the expected profit from holding U.S. dollars, and the greater (smaller) is the quantity of U.S. dollars demanded on the foreign exchange market.
4. Figure 18.4 illustrates a demand curve for U.S. dollars.
D. Changes in the Demand for Dollars
1. A change in any influence on the quantity of dollars that people plan to buy, other than the exchange rate, brings a change in the demand for dollars and a shift in the demand curve for dollars. The demand for dollars either increases or decreases.
2. These other influences are:
a) Interest rates in the U.S. and in other countries: The U.S. interest rate minus the foreign interest rate is called the U.S. interest rate differential. If the U.S. interest differential rises (falls), the demand for U.S. dollars increases (decreases) and the demand curve for dollars shifts rightward (leftward).
b) The expected future interest rate: At a given exchange rate, if the expected future exchange rate for U.S. dollars rises (falls), the demand for U.S. dollars increases (decreases) and the demand curve for dollars shifts rightward (leftward).

I N T E R N A T I O N A L F I N A N C E 4 0 7
3. Figure 18.5 shows how the demand curve for U.S. dollars shifts in response to changes in the U.S. interest rate differential and expectations of future exchange rates.
E. Supply in the Foreign Exchange Market
1. Other things remaining the same, the higher (lower) the exchange rate, the greater (smaller) is the quantity of dollars supplied in the foreign exchange market.
2. There are two sources of the supply of U.S. dollars:
a) Imports affect: The larger the value of U.S. imports, the larger is the quantity of dollars supplied on the foreign exchange market. And the higher the exchange rate, the greater is the demand for foreign-made goods and services, so the greater is the quantity of dollars supplied.
b) Expected profit effect: For a given expected future U.S. dollar exchange rate, the lower (higher) the exchange rate, the greater (smaller) is the expected profit from holding U.S. dollars, and the smaller (greater) is the quantity of U.S. dollars supplied on the foreign exchange market.

4 0 8 C H A P T E R 1 8
3. Figure 18.6 illustrates a supply curve of U.S. dollars.
F. Changes in the Supply of Dollars
1. A change in any influence on the quantity of dollars that people plan to sell, other than the exchange rate, brings a change in the supply of dollars and a shift in the supply curve of dollars. The supply of dollars either increases or decreases.
2. These other influences are:
a) Interest rates in the U.S. and in other countries: If the U.S. interest differential rises (falls), the supply for U.S. dollars decreases (increases) and the supply curve of dollars shifts leftward (rightward).
b) The expected future exchange rate: At a given exchange rate, if the expected future exchange rate for U.S. dollars rises (falls), the supply of U.S. dollars decreases (increases) and the demand curve for dollars shifts leftward (rightward).
3. Figure 18.7 shows how the supply curve of U.S. dollars shifts in response to changes in the U.S. interest rate differential and expectations of future exchange rates.

I N T E R N A T I O N A L F I N A N C E 4 0 9
G. Market Equilibrium
1. Figure 18.8 shows how demand and supply in the foreign exchange market determine the exchange rate.
2. If the exchange rate is higher than the equilibrium exchange rate, a surplus of dollars drives the exchange rate down.
3. If the exchange rate is lower than the equilibrium exchange rate, a shortage of dollars drives the exchange rate up.
4. The market is pulled (quickly) to the equilibrium exchange rate at which there is neither a shortage nor a surplus.
H. Changes in the Exchange Rate
1. Changes in demand and supply in the foreign exchange market change the exchange rate (just like they change the price in any market).
a) If demand increases, the exchange rate rises.
b) If demand decreases, the exchange rate falls.
c) If supply increases, the exchange rate falls.
d) If supply decreases, the exchange rate rises.
2. The exchange rate is sometimes volatile because a change in the interest differential or in the expected future exchange rate change both demand and supply and in opposite directions, so they bring a large change in the exchange rate.
3. Figure 18.9(a) shows that how changes in expectations changed the demand for U.S. dollars and the supply of U.S. dollars between 1999 and 2001 and brought a rise in the U.S. dollar exchange rate.
4 1 0 C H A P T E R 1 8
4. Figure 18.9(b) shows that how changes in expectations changed the demand for U.S. dollars and the supply of U.S. dollars between 2001 and 2003 and brought a fall in the U.S. dollar exchange rate.
I. Exchange Rate Expectations
1. Purchasing power parity: A currency is worth the value of goods and services that it will buy. The quantity of goods and services that one unit of a particular currency will buy will differ from the quantity of goods and services that one unit of another currency will buy. When two quantities of money can buy the same quantity of goods and services, this situation is called purchasing power parity, which means equal value of money.
a) If one U.S. dollar exchanges for 1.33 Canadian dollars, then purchasing power parity is attained when one U.S. dollar buys the same quantity goods and services in the United States as 1.33 Canadian dollars buys in Canada.
b) If one U.S. dollar buys more goods and services in the United States than 1.33 Canadian dollars buy in Canada, people will expect that the U.S. dollar will eventually appreciate.
c) Similarly, if one U.S. dollar buys less goods and services in the United States than 1.33 Canadian dollars buy in Canada, people will expect that the U.S. dollar will eventually depreciate.
2. Interest rate parity: A currency is worth what it can earn. The return on a currency is the interest rate on that currency plus the expected rate of appreciation over a given period. When the returns on two currencies are equal, interest rate parity prevails. Interest rate parity means equal rate of return. Market forces achieve interest rate parity very quickly.
J. The Fed in the Foreign Exchange Market
1. The U.S. interest rate is determined by the demand for and supply of money. The Fed determines the supply of money and through its influence on the interest rate influences the exchange rate.
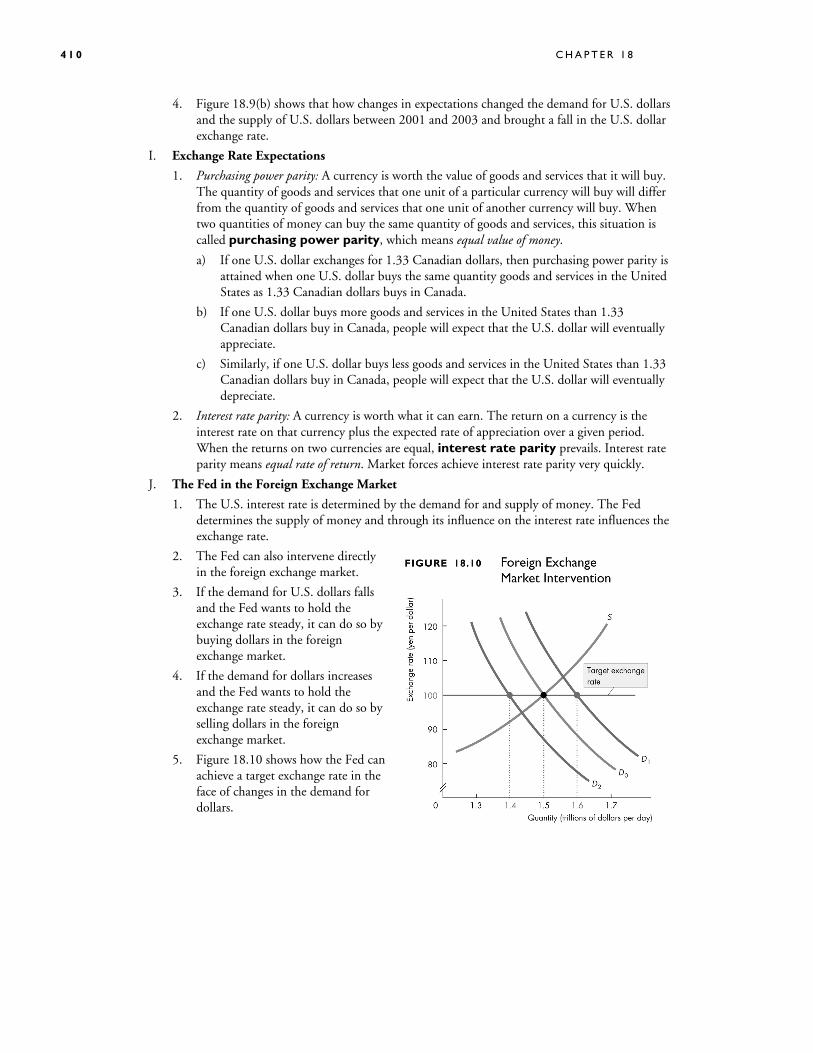
2. The Fed can also intervene directly in the foreign exchange market.
3. If the demand for U.S. dollars falls and the Fed wants to hold the exchange rate steady, it can do so by buying dollars in the foreign exchange market.
4. If the demand for dollars increases and the Fed wants to hold the exchange rate steady, it can do so by selling dollars in the foreign exchange market.
5. Figure 18.10 shows how the Fed can achieve a target exchange rate in the face of changes in the demand for dollars.

I N T E R N A T I O N A L F I N A N C E 4 1 1
R e a d i n g B e t w e e n t h e L i n e s The news article describes the depreciation of the U.S. dollar against the euro at the end of 2003. The analysis discusses how the exchange rate movements relate to purchasing power parity and interest rate parity.
N e w i n t h e S e v e n t h E d i t i o n The data and graphs have been updated. In addition to the yen-dollar exchange rate, the euro-dollar exchange rate is also considered.
The experience of the U.S. dollar and Japanese yen during 1999-2001 (appreciating dollar) and 2001–2003 (depreciating dollar) replaces the coverage of earlier periods in the sixth edition. The Reading Between the Lines examines the depreciation of the U.S. dollar in 2002-2003.
Te a c h i n g S u g g e s t i o n s 1. Financing International Trade Something new almost every day. This topic is one that is easily kept current. Frequent news reports
about the balance of payments appear in the Wall Street Journal and on the news Web sites. And the Bureau of Economic Analysis and Commerce Department report the latest data that you can access using the links of the Economics Place.
Herb Stein’s Dictum. Larry Summers, in his interview on pp. 54–56 reminds us of Herb Stein’s dictum: “the unsustainable cannot be sustained and must surely end!” Ask your students what will happen to end the unsustainable current account deficit. They will want to say, a change in the exchange rate. And that is surely part of the answer. But fundamentally, unless American’s save more relative to U.S. investment, the current account will be in deficit no matter what the exchange rate does. Understanding this fundamental fact is the first big lesson in this chapter
2. The Exchange Rate The data. You and your students can get up to the minute exchange rate data and useful historical
exchange rate data at PACIFICA (http://pacific.commerce.ubc.ca/xr/). This site also has data on deviations from purchasing power parity.
The strength of a nation’s currency matters, but it isn’t a sign of manhood or womanhood! A lot of silly ideas about the exchange rate find their way into the popular media. The most notable on is that the strength of a nation’s currency on the foreign exchange market is somehow a sign of the nation’s overall strength—its manhood/womanhood so to speak.
Explain that the exchange rate is just a price. And it is the relative price of two currencies that ultimately depends on the price levels in two countries. A downward trend in an exchange rate means that a country is experiencing more rapid inflation that another country. That is all. The exchange rate trend tells us nothing—absolutely nothing—about productivity and real income growth in the two countries.
Interest Rate Parity. Be sure that your students appreciate interest rate parity. There are many horror stories of people losing their shirts by misunderstanding interest rate parity.
One story concerns the once wealthy Catholic Church of Australia that decided to borrow in Japan at a low interest rate and lend the proceeds of its borrowing in Australia at higher interest rates.

4 1 2 C H A P T E R 1 8
When the Australian dollar nosedived against the Japanese yen, the church struggled to repay its loans.
Interest rate parity always holds. Interest rates might look unequal, but the market expectation of the change in the exchange rate equals the gap between interest rates. It is a fooling person (or organization) that acts as if it can beat the market.
Purchasing Power Parity. You can easily get your students to test purchasing power parity. Have them check the prices of some well-known titles at amazon.com and at amazon.co.uk, get the latest exchange rate for the U.S. dollar and the U.K. pound, and see whether it is cheaper to buy a given title in the United States or the United Kingdom.
T h e B i g P i c t u r e
Where we have been
Chapter 18 uses the national income accounting identities introduced in Chapters 5, demand and supply of Chapter 3, and (very slightly), money and interest rate determination from Chapter 11.
Where we are going
Chapter 18 is the end of the coverage of international economics and the last chapter in the textbook.
O v e r h e a d Tr a n s p a r e n c i e s
Transparency Text figure Transparency title
112 Figure 18.1 The Balance of Payments, 1983–2003
113 Figure 18.3 The Yen-Dollar Exchange Rate
114 Figure 18.8 Equilibrium Exchange Rate
115 Figure 18.9 Exchange Rate Fluctuations
116 Figure 18.10 Foreign Exchange Market Intervention
117 Table 34.2 Net Exports, the Government Budget, Saving, and Investment
E l e c t r o n i c S u p p l e m e n t s MyEconLab
MyEconLab provides pre- and post-tests for each chapter so that students can assess their own progress. Results on these tests feed an individualized study plan that helps students focus their attention in the areas where they most need help.
Instructors can create and assign tests, quizzes, or graded homework assignments that incorporate graphing questions. Questions are automatically graded and results are tracked using an online grade book.

I N T E R N A T I O N A L F I N A N C E 4 1 3
PowerPoint Lecture Notes
PowerPoint Electronic Lecture Notes with speaking notes are available and offer a full summary of the chapter.
PowerPoint Electronic Lecture Notes for students are available in MyEconLab.
Instructor CD-ROM with Computerized Test Banks
This CD-ROM contains Computerized Test Bank Files, Test Bank, and Instructor’s Manual files in Microsoft Word, and PowerPoint files. All test banks are available in Test Generator Software.
A d d i t i o n a l D i s c u s s i o n Q u e s t i o n s 1 1. In 2002-2003, the exchange rate of U.S. dollars declined relative to both the Japanese yen and the
European euro. What would you need to know about the U.S. economy to determine whether this would be a benefit or a problem for the U.S. economy? Point out that the United States was just starting to pull out of a recession in 2001, as was Japan and most of Europe. The following are relevant aspects of the relationship between the U.S., Japan and the European Union economies as well as the composition of the U.S. economy:
• In the first quarter of 2001, the dollar fell 6 percent against the euro and 7 percent against the yen.
• Japan is the second largest trading partner to the United States, receiving 10 percent of our total exports and providing 14 percent of our imports. The European Union is also a significant trading partner with the United States.
• Japan is a net exporter. In 2001, Japan exported 13.7 percent of its total output and imported 11.6 percent.
• The U.S. is a net importer. In 2001, the United States exported 11 percent of our total output and imported 15 percent.
What impact would you predict would happen to the U.S. and Japanese import and export markets as a result of this weakening of the dollar, all else equal? Emphasize a decline in the exchange rate of the U.S. dollar will impact both the export and import industries of the U.S. economy and the Japanese economy:
• Falling exchange rates for the dollar means the dollar became weaker against both the yen and the euro.
• This means Japanese and European exports are becoming relatively more expensive than U.S. exports. This implies that Japanese and European demand for U.S. exports will increase and Japanese and European consumer demand for Japanese made products will decrease.
• This also means that Japanese and European imports into the United States are relatively less expensive than U.S.-made products. This implies that U.S. consumer demand for Japanese and European exports into the U.S. will increase, and U.S. consumer demand for U.S. made products will decrease.
Is the weakened U.S. dollar good news or bad news for the United States? for Japan? Point out that a weaker currency may be beneficial for a country’s exporting firms, but it can be a problem for a country’s non-exporting firms.
• U.S. treasury officials have maintained a strong dollar policy in public announcements despite the depreciation of the dollar. Could this be because the U.S. is a net importer?

4 1 4 C H A P T E R 1 8
• Japanese Finance Ministry officials have publicly stated that a stronger yen presents a challenge for Japan to overcome when trying to recover from its recent economic recession. In May of 2002, Japan’s government purchased a significant quantity of dollars in an attempt to shore up demand for the U.S. currency and keep the yen weak. Could this be because Japan is a net exporter?
2. When the Federal Reserve Chairman Alan Greenspan repeatedly decreased the discount rate during 2001, he was attempting to stimulate the U.S. economy by lowering the interest rates in the U.S. financial markets and lowering the cost of employing productive capital. What impact would this have on the exchange rates in the foreign exchange markets, all else equal? Emphasize how the link between the financial markets and the foreign exchange markets can cause international trade to flow against the economic policies pursued by the Federal Reserve chairman:
• A fall in interest rates means that the U.S. interest differential is falling, and foreign owners of U.S. capital will want to sell off their assets seeking a higher rate of return in another country’s assets.
• This sell-off of assets increases the quantity of dollars supplied to the foreign currency exchange market, shifting the supply curve of dollars to the right. This also decreases the dollars demanded, shifting the demand curve for dollars to the left. The equilibrium market exchange rate for dollars falls.
Are there market forces in the foreign exchange markets that could confound Greenspan’s efforts at promoting economic activity in the U.S. economy?
• As the value of the dollar weakens, foreign imports become relatively cheaper than domestically produced goods and services. This causes U.S. consumer demand for domestic goods and services to decrease in favor of imports. This has a negative impact on the U.S. economy, all else equal.
• As the value of the dollar weakens, U.S. exports to other countries become cheaper relative to other countries. International demand for U.S. exports increases, providing a positive impact on the U.S. economy, all else equal.
• The countervailing market forces must be weighed to determine what the net impact on the U.S. economy will be. However, it is clear that all the influences arising from a lower interest rate will boost the U.S. economy.
3. The U.S. government budget has recently changed from a small surplus to a large deficit the federal government deficit. What impact would this have on the net exports and private sector balances, all else equal? Point out that the three balances are related: Net exports equal the sum of government and private sector balances.
• U.S. net exports depend upon the exchange rate of the U.S. dollar, which in turn depends upon the expectations of the future exchange rate and the U.S. interest rate differential.
• Assuming these factors initially remain unchanged in the face of an increase in the government budget deficit (though they will likely change eventually), this implies that the country’s net exports remain unchanged. This means that the private sector balance must become more positive to accommodate the decrease in the government balance.
What impact would a more positive private sector balance have on interest rates in the U.S. financial markets, the U.S. interest rate differential, and the exchange rate for the U.S. dollar, all else equal?
• If the private sector balance is to become more positive (less negative) then this means that private sector borrowing must decline.
• A decline in the amount of borrowing in the financial markets means the interest rates in the U.S. financial markets have increased. When a decline in private sector borrowing is a direct

I N T E R N A T I O N A L F I N A N C E 4 1 5
result of increased government deficits, this is the classic case of “crowding out” of private sector investment.
• Higher interest rates increase the U.S. interest rate differential, attracting foreign investment in U.S. financial assets. This increase in foreign demand for assets shifts the demand curve for dollars to the right and the supply curve for dollars to the left, raising the equilibrium exchange rates. The dollar is initially stronger against other currencies, all else equal.
4 1 6 C H A P T E R 1 8
A n s w e r s t o t h e R e v i e w Q u i z z e s
Page 442 (page 814 in Economics) 1. The American art dealer must use French francs to pay the French art gallery for the paintings she
purchases.
2. The German car manufacturer pays the U.S. parts dealer in U.S. dollars.
3. The current account records payments for imports of goods and services from abroad, receipts from exports of goods and services sold abroad, net interest paid abroad, and net transfers (such as foreign aid payments). The capital account records foreign investment in the U.S. minus U.S. investments abroad. The official settlements account records the change in U.S. official reserves.
4. Net exports is equal to the sum of government and private sector balances.
Page 451 (page 823 in Economics) 1. The price at which one currency is exchanged for another is called the foreign currency exchange
rate. Demanded and supply in the foreign exchange market determines the exchange rate for currencies.
2. The demand for U.S. dollars is derived from:
• Exports affect: The larger the value of U.S. exports, the larger the quantity of dollars demanded for purchasing those exports from U.S. firms. When the exchange rate for U.S. dollars falls (rises) the U.S. exports become cheaper (more expensive) relative to other country’s goods and services. This increases (decreases) demand for U.S. exports, and increases (decreases) the demand for U.S. dollars to finance their purchase, all else held constant.
• Expected profit effect: The lower (higher) the exchange rate for U.S. dollars, the greater (lower) the expected profit will be from holding U.S. currency, all else held constant. This implies that the larger (smaller) the expected profits from holding U.S. dollars, the greater (smaller) the foreign demand for U.S. currency.
The supply for U.S. dollars is derived from:
• Exports affect: The larger the value of U.S. imports, the larger the quantity of dollars supplied for purchasing those imports from foreign firms. When the exchange rate for U.S. dollars rises (falls) the foreign imports become cheaper (more expensive) relative to domestic firms goods and services. This increases (decreases) demand for foreign imports, and decreases (increases) the supply of U.S. dollars to exchange for foreign currency to finance the purchase of imports, all else held constant.
• Expected profit effect: The lower (higher) the exchange rate for U.S. dollars, the greater (lower) the expected profit will be from holding U.S. currency, all else held constant. This implies that the larger (smaller) the expected profits from holding U.S. dollars, the smaller (larger) the supply of U.S. currency made available.
3. When the general expectation of people is for the exchange rate of a particular currency to decrease (increase) in the future, this shifts the current period demand curve for the currency leftward (rightward) and shifts the current period supply curve for the currency rightward (leftward). The equilibrium exchange rate for the currency in the current period will decline (rise).
4. If the purchasing power of the U.S. dollar is higher than the Japanese yen, and the prices in the Japanese economy are not expected to fall, then people will generally expect the value of the yen to fall against the U.S. dollar to restore purchasing power parity. If the rate of return for the U.S. dollar is higher than the Japanese yen, and the interest rates in the Japanese economy are not

I N T E R N A T I O N A L F I N A N C E 4 1 7
expected to fall, then people will generally expect the value of the yen to fall against the U.S. dollar to restore interest rate parity.
5. If the Fed wants to hold the exchange rate steady in the presence of diminished demand for U.S. dollars, the Fed can prop up demand by buying dollars in the foreign exchange market and keeping the exchange rate from falling. If the demand for dollars increases, it can sell dollars to keep the exchange rate from rising by selling dollars.

4 1 8 C H A P T E R 1 8
A n s w e r s t o t h e P r o b l e m s 1. a. A table like Table 18.1 on page 438 (Table 34.1 on page 810 in Economics) with the numbers
provided in the problem. The current account shows Imports of goods and services –350 billions of grains, Exports of goods and services, 500 billions of grains, Net interest income, unknown, and Net transfers, unknown. You cannot calculate the current account balance from these numbers because of the two unknown items. The capital account shows Foreign investment in Silecon, 60 billions of grains, Silecon investment abroad, −200 billions of grains, and a capital account balance of –140 billions of grains (a deficit).
The official settlements account is −10 billions of grains (minus because it is an increase). Because the sum of the three balances is zero, you can now calculate the current account balance, 150 billions of grains, a surplus. Exports of goods and services minus imports of goods and services equal 150 billions of grains. So the sum of Net interest income and Net transfers is zero, but we don’t know the values of these two items separately.
b. The Silecon central bank intervenes in the foreign exchange market. We know that the central bank intervenes in the foreign exchange market because its official reserves changed.
2. a. A table like Table 18.1 on page 438 (Table 34.1 on page 810 in Economics) with the numbers provided in the problem. The current account shows Imports of goods and services –100 billions of wheels, Exports of goods and services, 120 billions of wheels, Net interest payments, unknown, and Net transfers, unknown. You cannot calculate the current account balance from these numbers because of the two unknown items. The capital account shows Foreign investment in Spin, 4 billions of wheels, Spin investment abroad, −24 billions of wheels, and a capital account balance of –20 billions of wheels (a deficit). The official settlements account shows Increase in official Spin reserves, 0 billions of wheels. Because the sum of the three balances is zero, you can now calculate the current account balance, 20 billions of wheels, a surplus. Exports of goods and services minus imports of goods and services equal 20 billions of wheels. So the sum of Net interest income and Net transfers is zero, but we don’t know the values of these two items separately.
b. The Spin central bank might intervene in the foreign exchange market. The change in official holdings of foreign currency is zero. It could be that the Spin central bank does not intervene in the foreign exchange market or it could be that the Spin central bank does intervene in the foreign exchange market and in 2003 the net change in official holdings of foreign currency is zero.
3. a. Net exports are –$20 million. Use the fact that Y = C + I + G + NX and solve for NX as NX = Y – C – I – G, which equals NX = 120 – 72 – 40 – 28 = –20.
b. Saving is $24 million. Use the fact that Y = C + S + NT and solve for S as S = Y – C – NT, which equals S = 120 – 72 – 24 = 24.
c. National saving and foreign borrowing finance investment. I = S + NT – G – NX, which equals I = 24 + 24 – 28 – (– 20) = 40.
4. a. Net exports are –$10 million.

I N T E R N A T I O N A L F I N A N C E 4 1 9
Use the fact that Y = C + I + G + NX and solve for NX as NX = Y – C – I – G, which equals NX = 130 – 72 – 40 – 28 = –10.
b. Saving is $34 million. Use the fact that Y = C + S + NT and solve for S as S = Y – C – NT, which equals S = 130 – 72 – 24 = 34.
c. National saving and foreign borrowing finance investment. I = S + NT – G – NX, which equals I = 34 + 24 – 28 – (– 10) = 40.
5. a. Imports of goods and services are 26 billion bands. Use the fact that Y = C + I + G + X – M and solve for M as M = – Y + C + I + G + X, which is MS = –100 + 60 + 22 + 24 + 20 so that M = 26.
b. The current account balance is – 6 billion bands (assuming that net interest income plus net transfers is zero). Use the fact that CAB = X – M so that CAB = 20 – 26 = – 6.
c. The capital account balance is unknown. The sum of the current account, capital account, and official settlements account is zero. The capital account balance cannot be calculated unless information is given about the official settlements account.
d. Net taxes are 20 billion bands. Use the fact that Government budget deficit = G – NT, so NT = G – Gov. budget deficit, which is NT = 24 – 4 = 20.
e. The private sector balance is –2 billion bands (a deficit). Use the fact that Private sector surplus = S – I, with S = Y – C – NT, or Private sector surplus = Y – C – NT – I, which is Private sector surplus = 100 – 60 – 20 – 22 so that the private sector surplus = – 2.
6. a. Imports of goods and services are 120 billion rocks. Use the fact that Y = C + I + G + X – M and solve for M as M = – Y + C + I + G + X, which is M = – 400 + 240 + 100 + 100 + 80 so that M = 120.
b. The current account balance is –40 billion rocks (assuming that net interest income plus net transfers is zero). Use the fact that CAB = X – M so that CAB = 80 – 120 = – 40.
c. The capital account balance is unknown. The sum of the current account, capital account, and official settlements account is zero. The capital account balance cannot be calculated unless information is given about the official settlements account.
d. Net taxes are 70 billion rocks. Use the fact that Y= C+ S+ NT, so NT = Y – C – S, which is NT = 400 – 240 – 90 = 70.
e. The private sector balance is –10 billion rocks (a deficit). Use the fact that Private sector surplus = S – I, so Private sector surplus = 90 – 100 Private sector surplus = – 10.
f. The government sector balance is –30 billion rocks (a deficit). Use the fact that Government sector balance = NT – G, so Government sector balance is equal to 70 – 100, or = –30.
7. a. The central bank intervenes in the foreign exchange market to limit upward movement of the exchange rate but not strongly enough to prevent some appreciation.

4 2 0 C H A P T E R 1 8
b. Nothing. The current account is financed by the capital account and the official settlements account and without information about the capital account balance, we can’t tell whether the current account is in surplus or deficit.
c. The official settlements account balance is negative—an increase in reserves is like investing in other country’s assets.
8. a. The exchange rate most likely rises—the currency appreciates. The reason is that to preserve purchasing power parity, with a lower inflation rate, the currency must appreciate.
b. The current account balance depends on domestic investment relative to national saving. The balance could be positive or negative.
c. The exchange rate will be expected to appreciate so the expected future exchange rate is higher than the current exchange rate.
d. The interest rate differential is negative. The interest rates in some other country exceeds the domestic interest rate by a amount equal to the inflation rate in that other country minus the domestic inflation rate.
e. Interest rate parity holds every day. If it did not, profits would be available. Such profit opportunities do not go unexploited.
f. Purchasing power parity probably doesn’t hold every day, but does hold on the average in the long run.