chapterfour work and financial security - women nsw oecd (2002) chapter 2: women at work: who are...
TRANSCRIPT
Women in NSW 2013 92
Chapter
fourWork and financial security
The NSW Government seeks to grow the economy, stimulating investment and employment, with specific industry growth targets in critical industries including professional services, manufacturing, digital economy and international education and research.
Photo: Claudia Garbayo, child care worker from Hoskins Education and Care Centre, Warrawong.

Women in NSW 2013 93
Work and financial security
There are a number of policy reasons to encourage workforce participation by women. Lower participation rates for women than men constitute a significant source of underutilised skills to improve productivity in the NSW economy.
Underemployment affects the ability of women to save for their retirement and children in workless households are at greater risk of poverty.1
The usual pattern of family employment in Australia today is unusual in comparison to many other countries.2 One parent (usually the man) works full-time; and the other (usually the woman) works part-time.
Data presented for the first time in this year’s Report highlights the different workplace arrangements mothers and fathers use to care for children, and how frequently they use them. Future reports will monitor this issue.
The family employment pattern contributes to the gender pay gap, which, as in last year’s Report is measured using hourly, weekly and annual indicators. However, occupational and industry workforce segregation patterns are also a major factor in explaining women’s relatively lower earnings. Segregation patterns are tracked, with greater attention to the trade and technical occupations where women are highly underrepresented.
Key findingsA long-term trend towards greater participation in paid work is evident among NSW women, as it is
1 OECD. (2008) Growing Unequal? Income Distribution and Poverty in OECD Countries. Paris: OECD2 OECD (2002) Chapter 2: Women at work: who are they and how are they faring? in Employment Outlook.
among women in most developed countries. Today, 57 percent of women in NSW participate in the labour force compared to 70 percent of men. The gender difference has reduced substantially, from a difference of 36 percentage points between women and men in 1978 to 13 percentage points today. This is in part because men’s labour force participation rate has fallen.
This year’s data confirms that underemployment is almost as big a problem for women as unemployment. Despite improvement since last year, women remained more likely to experience underemployment than men by 3.2 percentage points.
The unemployment rates of non-Aboriginal women and men this year were very similar, equalising since the period following the Global Financial Crisis when women experienced higher unemployment.
Aboriginal women’s unemployment rate is nearly three times that of non-Aboriginal women; women in South Western Sydney also experience disproportionate unemployment, although the rate for women in Canterbury- Bankstown fell compared to last year.
The stabilisation of casual employment was evident this year as last and although women make up 56 percent of casual employees, men now make up a majority of fulltime casuals. New data presented this year on flexible work arrangements shows that although both sexes report having access to such arrangements, mothers are far more likely than fathers to use them to care for children. Childcare data underlined the importance of formal care for NSW’s single parent
families, with 84 percent of such families using it in 2011 where the parent was employed.
Gender patterns in the jobs women and men do and the pay they receive on average remain little changed from last year. When we look at hourly pay, the gender pay gap for non-managerial employees improved slightly, with women’s hourly earnings reaching 92 percent of men’s in 2012. However, the weekly gender pay gap for all employees worsened by two percentage points, with NSW men earning 16 percent or $241 more each week than women in 2012. This is similar to the median annual pay gap.
In this year’s Report we calculate the number of hours a woman would have to work to earn as much as her male counterpart. Figure 4.1 provides some thought provoking examples, for example with women legal professionals needing to work 11 extra hours. While rates of housing affordability stress, on the whole, remained stable or improved compared to the data in last year’s Report, it is clear that many single women, and older women, are financially vulnerable and may face difficulties affording the housing available to them, especially if they live in Sydney.
The chapter points to areas where there are major differences between groups of women. Women’s unemployment rates show dramatic variation by region. Because this year Census 2011 data is available we can report on the high rate of unemployment experienced by Aboriginal women. At 15 percent in 2011, it was triple that of non- Aboriginal women.

Women in NSW 2013 94
Work and financial security
Gender indicators: Work and financial securityIn this chapter, women’s experiences are reported against six work and financial security topics of importance for women. Many indicators align with state, national and international frameworks and these linkages are shown below.
State Plan NSW 2021 Goal 1: Improve the performance of the NSW economy
The NSW government seeks to grow the economy, stimulating investment and employment, with specific industry growth targets in critical industries including professional services, manufacturing, digital economy and international education and research. The topics covered in this chapter relate to State Plan Goal 1: Improve the performance of the NSW economy. The linkages between individual indicators and State Plan targets are shown below.
Topic Indicators Linkages
Topic 1: Workforce engagement
1.1 Workforce participation
1.2 Unemployment and underutilisation
NSW 2021 Goals 1 and 4
ABS Gender Indicators
United Nations Gender Equality Index
OECD Gender Equality Indicators
World Economic Forum Global Gender Gap Index
Topic 2: Workforce security
2.1 Casual employment
2.2 Part-time employment
ABS Gender Indicators
OECD Gender Equality Indicators
Topic 3: Balancing work and caring responsibilities
3.1 Flexible work arrangements
3.2 Childcare
3.3 Time spent in unpaid household work
3.4 Feeling rushed
Productivity Commission, Review of Government Services
ABS Gender Indicators
OECD Gender Equality Indicators
Topic 4: Workforce segregation
Focus topic
4.1 Occupational segregation
4.2 Industry segregation
4.3 Non-traditional jobs for women
Women in trades and technical occupations
NSW 2021 Goal 1
OECD Gender Equality Indicators
Topic 5: Gender pay gap
5.1 Average weekly earnings
5.2 Average hourly earnings
5.3 Public service annual earnings
ABS Gender Indicators
OECD Gender Equality Indicators
World Economic Forum Global Gender Gap Index
Topic 6: Financial security
6.1 Housing stress
6.2 Commonwealth Rent Assistance and rental affordability
ABS Gender Indicators
Work and financial security topics and indicators
Women in NSW 2013 95
Work and financial security
Current levels and trendsThis section outlines the current status of NSW women in the topic areas listed above and the direction
of change over time, where time-series information is available. The latest available data is used in each case.
For some indicators no new data is available since the 2012 Women
in NSW Report. In this case, indicators are not repeated in the body of the chapter but are listed in the box below.
Indicator Women in NSW 2012 figure Source
Labour force participation of female carers43% (primary carers) ABS Survey of Disability, Ageing
and Carers Australia, 200957% (all carers)
Employment rate of female carers42% (primary carers)
54% (all carers)
Government pension is main source of income (female carers)
42% (primary carers) ABS Survey of Income and Housing 2009-10. Cat. no. 6541.0.30.001, unpublished data
53% (all carers)
Volunteer rate (in last 12 months)40% (women) ABS General Social Survey, 2010
33% (men)
Rate of reliance on pensions in old age82% (women) ABS Survey of Employment
Arrangements, Retirement and Superannuation, 2007
75% (men)
Median superannuation balance (all people)$18,238 (women)
$30,555 (men)
Median superannuation balance (people aged 45 to 60 years)
$26,142 (women)
$55,143 (men)
Topic 1 Workforce engagement
Women’s participation in the labour force is important for personal, social and economic reasons. For women and their families it is central to current and future financial security. Paid employment is particularly important for building private retirement savings and for housing security. For governments,
labour market participation is inversely related to welfare dependence and is therefore a significant factor affecting government expenditure.
Indicators of labour force participation (unemployment and underemployment) are reported in this section.

Women in NSW 2013 96
Work and financial security
1.1 Workforce participationLabour force and employment participation rates
Current position In January 2013, 57 percent of NSW women were participating in the labour force (that is, they were either employed or looking for work). This compares to 70 percent of NSW men.
Of the NSW adult population, 54 percent of NSW women were employed (part or full-time) compared with 67 percent of NSW men.
Gender gap
• Women’slabourforceparticipationrateis13percentagepointslowerthanmen’s.
• Women’semploymentrateis13percentagepointslowerthanmen’s.
The direction of change over time
There has been little change since last year’s Report. Both women’s employment and labour force participation rates have remained constant (comparing January dates each year).1
However, NSW women’s participation in the labour force, and the percentage of NSW women employed as a ratio of the adult population have both increased significantly over time. By contrast, men’s participation in the labour force, and their employment rate, have fallen over time (see Figure 4.1).
In 1978, the gender gap in labour force participation was 36 percentage points compared to 13 percentage points today, due in part to men’s falling participation.
When we look at employment participation, the gender gap has reduced by 21 percentage points in 1978 to 13 percentage points today. Around one-third of the reduction is due to men’s employment rate falling by 8 percentage points in the period.
Discussion Labour force participation varies significantly by birthplace. Table 4.1 shows the rates for working age women from the top 10 most numerous birthplace groups of women arriving in the last two decades, since 1992 (these are discussed in Chapter One).
Of these groups, South African, Filipino, New Zealand and English working-age women were more likely to be in the workforce than the Australian-born and other overseas-born women.
Women from China, Vietnam, South Korea and Iraq were among the groups with relatively low labour force participation.
Within birthplace groups, gender gaps in the labour force participation diverge widely. Australia-born women and men have the smallest participation gap of the top 10 groups at 11 percentage points, and Iraqi women and men have the largest at 28 percentage points.
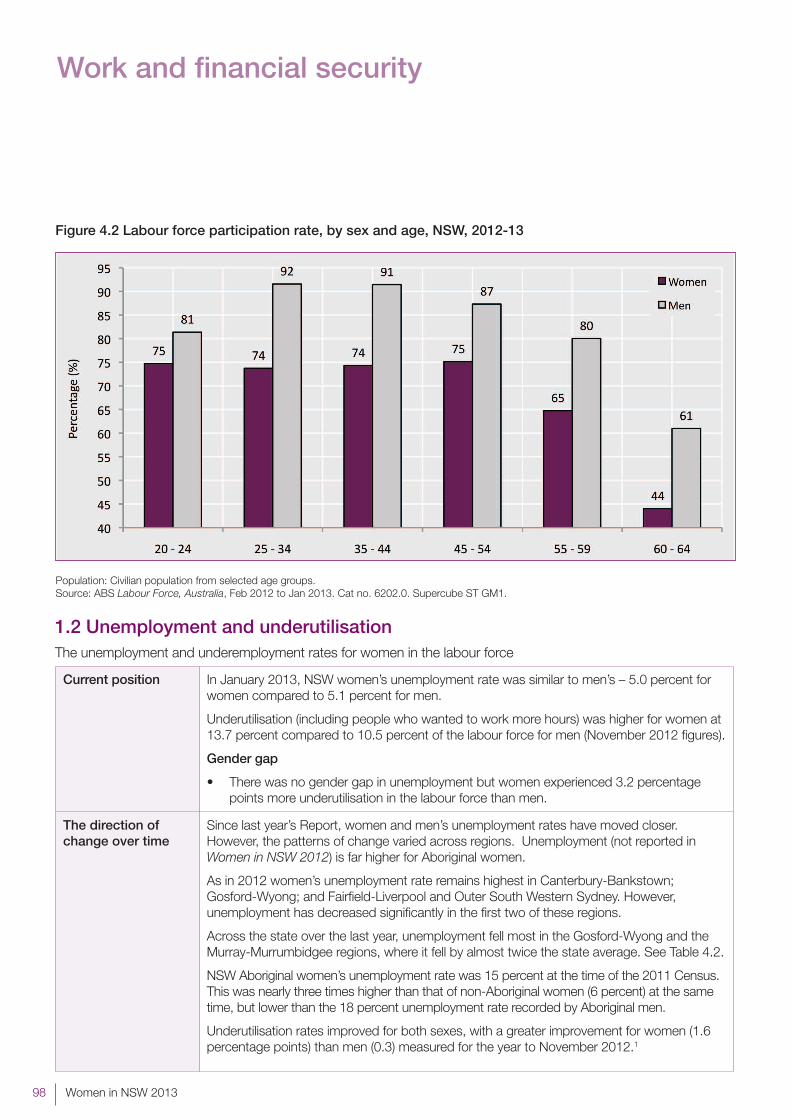
Labour force participation by age is shown in Figure 4.2. Women’s and men’s rates are closest when women are young (20 to 24) or in their middle years (45 to 54) when the gap is 12 percent. Women’s participation dips during the peak child-bearing years when the gender gap is 18 percent. Among 60 to 64 year-olds the gap is also relatively large at 17 percent, reflecting women’s earlier retirement from the workforce.
Two indicators measure the extent to which people of working age are participating in the workforce. The labour force participation rate reflects the extent to which people are active in the paid labour force: that is, employed, engaged in business, or looking for work. The employment rate is a ratio of those people who are currently employed (that is, have worked in a paid job for at least one hour during the last week) to the civilian population aged 15 years and over.
Year collected: January 2013.Data source: ABS (2013) Labour Force, Australia, January 2013. Cat no. 6202.0. Trend series data. More information is available at www.abs.gov.au Understanding Labour Force page.
1 Note that last year’s figure of 53 percent was a February figure and based on seasonally adjusted not trend data.

Women in NSW 2013 97
Work and financial security
Figure 4.1 Labour force participation rate, by sex, NSW, 1978 to 2013
Note: All data are trend data, and a trend line is shown.Population: Civilian population 15 years and over.Source: ABS (2013) Labour Force, Australia, Jan 2013. Cat no. 6202.0.
Birthplace Labour force participation
%
Women Gender gap in labour force participation
%South Africa 78 15,159 15
Philippines 77 35,647 13
New Zealand 77 42,734 13
England 75 70,102 12
Australia 74 1,297,660 11
India 71 34,912 22
Indonesia 69 12,068 17
China 61 70,181 14
Vietnam 56 33,431 21
South Korea 54 18,205 24
Iraq 26 10,935 28
All birthplaces 71 1,992,996 13
Table 4.1 Labour force participation of working-age women by selected birthplace
Note: Listed birthplaces are Australia plus the 10 birthplaces from which most women emigrated to Australia between 1992 and 2011 (see Chapter One). Those who didn’t provide a response (‘not stated’) are not included in the total but make up nearly 6 percent of the total population.Population: NSW women aged 20 to 64 years from selected birthplace groups.Source: ABS Census of Population and Housing 2011.
Women in NSW 2013 98
Work and financial security
Figure 4.2 Labour force participation rate, by sex and age, NSW, 2012-13
Population: Civilian population from selected age groups.Source: ABS Labour Force, Australia, Feb 2012 to Jan 2013. Cat no. 6202.0. Supercube ST GM1.
Current position In January 2013, NSW women’s unemployment rate was similar to men’s – 5.0 percent for women compared to 5.1 percent for men.
Underutilisation (including people who wanted to work more hours) was higher for women at 13.7 percent compared to 10.5 percent of the labour force for men (November 2012 figures).
Gender gap
• Therewasnogendergapinunemploymentbutwomenexperienced3.2percentagepoints more underutilisation in the labour force than men.
The direction of change over time
Since last year’s Report, women and men’s unemployment rates have moved closer. However, the patterns of change varied across regions. Unemployment (not reported in Women in NSW 2012) is far higher for Aboriginal women.
As in 2012 women’s unemployment rate remains highest in Canterbury-Bankstown; Gosford-Wyong; and Fairfield-Liverpool and Outer South Western Sydney. However, unemployment has decreased significantly in the first two of these regions.
Across the state over the last year, unemployment fell most in the Gosford-Wyong and the Murray-Murrumbidgee regions, where it fell by almost twice the state average. See Table 4.2.
NSW Aboriginal women’s unemployment rate was 15 percent at the time of the 2011 Census. This was nearly three times higher than that of non-Aboriginal women (6 percent) at the same time, but lower than the 18 percent unemployment rate recorded by Aboriginal men.
Underutilisation rates improved for both sexes, with a greater improvement for women (1.6 percentage points) than men (0.3) measured for the year to November 2012.1
1.2 Unemployment and underutilisationThe unemployment and underemployment rates for women in the labour force

Women in NSW 2013 99
Work and financial security
Discussion In the period following the Global Financial Crisis, women’s unemployment rates tended to exceed men’s. This changed around mid-2012, and today women and men’s rates are similar.
Underutilisation combines the people who are unemployed with those who are underemployed, either because they are full-time workers working short hours, or because they are part-time workers wanting to work more hours.
In the November 2012 data cited above, most of the gap between women and men is due to women’s higher rates of underemployment.
Figure 4.3 shows that, although labour force underutilisation closely follows the economic cycle, women’s rates are consistently higher than men’s.
The proportion of people in the paid labour force who are unemployed and underemployed are reported in this indicator. The unemployed are people who were actively looking for work and available to start immediately. The underemployed are those who are already working (part-time and full-time) and would like to, and are able to within four weeks, work more hours. These two groups together are referred to as people who are underutilised in the labour force.
Year collected: January 2013 for unemployment rates, November 2012 for underutilisation rates, 2011 for Aboriginal data.Data source: ABS (2013) Labour Force, Australia, Jan 2013, Cat no. 6202, Trend series. ABS (2012) Australian Labour Market Statistics July 2012, ABS Cat no. 6105.0, ABS Census of Population and Housing 2011.
More information is available at www.abs.gov.au Understanding Labour Force page. 1Please note that in this chapter changes to the data series used last year have occurred for some indicators. For example, in some cases we are now using trend rather than last year’s original series data. This results in slight changes to the earlier figures which were published in Women in NSW 2012. Historic changes discussed in this section use the new data sources.
Sydney or NSW region Women %
Change since 2012 %
Canterbury-Bankstown 8.0 1.3
Fairfield-Liverpool and Outer South Western Sydney 7.9 -0.3
Gosford-Wyong 6.4 1.5
Richmond-Tweed and Mid-North Coast 6.2 -0.1
North Western Sydney 5.9 1.0
Central Western Sydney 5.8 0.1
Illawarra and South Eastern 5.7 0.3
Murray-Murrumbidgee 4.9 1.5
Northern, Far West-North Western and Central West 4.4 1.0
Hunter 4.0 0.6
Northern Beaches 3.9 -0.5
Inner Sydney and Inner Western Sydney 3.7 0.9
Central Northern Sydney 3.6 0.7
Lower Northern Sydney 3.6 0.0
St George-Sutherland 3.5 1.1
NSW total 5.0 0.7
Table 4.2 Female unemployment by region
Note: These regions are ABS dissemination regions based on the Australian Standard Geographical Classification 2006.
Population: Women 15 years and over.Source: ABS (2013) Labour Force, Australia, Detailed, Jan 2013. Cat no. 6291.0.55.001.

Women in NSW 2013 100
Work and financial security
Figure 4.3 Labour force underutilisation, by sex, NSW, 1982 to 2012
Note: Underutilisation refers to people who are unemployed or underemployed.Population: Civilian population 15 years and over.Source: ABS (2013) Labour Force, Australia, Jan 2013. Cat no. 6202.0.
Topic 2 Workforce securityAnother indicator of labour market experience is job permanency or security, as indicated by ongoing or casual status. Ongoing employment provides a more solid basis for housing security and family formation, as opposed to
jobs with shorter tenure. Ongoing jobs typically provide employment benefits such as sick, annual and long service leave which help people deal with adversity and take rest. Part-time work is also discussed here as a second indicator because of its close historical association with casual work and workforce security.
Women’s share of full-time employment has increased from 28 percent in 1978 to 36 percent in 2013.
Women today make up over half of casual workers and 70 percent of part-time workers.

Women in NSW 2013 101
Work and financial security
Current position In 2011, 28 percent of NSW employed women worked on a casual basis, compared to 21 percent of men.
Gender gap
• ThegendergapforcasualworkinNSWis7percent.
The direction of change over time
The gender gap for casual employment remained constant compared to data reported in last year’s Report.
Discussion The big increases in casual employment in Australia occurred in the 1980s. As Figure 4.4 shows, since the early 1990s, there has been growth in casual employment among male full-time workers, with the rate going from around 6 percent to 11 percent in 2011. Women’s rate of casual employment also increased, but more slowly.
During the same period, rates of casual work among part-time employees declined, particularly among women where the rate fell from 63 percent in 1992 to 50 percent in 2011 (see Figure 4.5).
In 2011, women made up 56 percent of all casual employees in NSW.
The ABS defines casuals as employees who do not have paid leave entitlements, such as sick leave and holiday leave. They include people in both full and part-time employment. The ABS definition is used in this section, but it should be noted that this group excludes a proportion (around 11 percent) of owners/managers who are estimated to be ‘fixed term’ or temporary workers operating as contractors.
Year collected: November 2011.Data source: ABS (2012) Australian Labour Market Statistics. Cat no. 6105.0.More information is available at www.abs.gov.au
2.1 Casual employmentParticipation in jobs without paid leave entitlements
Figure 4.4 Casual work among full-time workers by sex, NSW, 1992-2011
Note: Casual workers are defined here as employees without leave entitlements.Population: NSW employees.
Source: ABS (2012) Australian Labour Market Statistics Cat no. 6105.0.

Women in NSW 2013 102
Work and financial security
Figure 4.5 Casual work among female and male part-time workers, NSW, 1992-2011
Note: Casual workers are defined here as employees without leave entitlements. Note that this graph has a different scale (y-axis) to the previous one. The graph shows the percentage of part-time workers who are casual, but note that there are 2.5 times more female part-time workers than male part-time workers.Population: NSW employees.Source: ABS (2012) Australian Labour Market Statistics Cat no. 6105.0.
Current position In 2013, 45 percent of NSW employed women worked part-time, compared to 16 percent of men.
Gender gap
• Thegendergapforpart-timeworkinNSWis29percent.
The direction of change over time
The percentage of women working part-time is similar to one year ago.
Discussion Part-time work has become more common among both women and men in recent decades. However, the increase is from a much higher base among women (see Figure 4.6). Over 30 percent of employed women worked part-time in 1978.
Women make up 70 percent of part-time workers in NSW.
The ABS defines part-time workers as employed people who usually work less than 35 hours a week and who did so during the reference period for the survey.
Year collected: January 2013. Data source: ABS (2013) Labour Force, Australia, Jan 2013. Cat no. 6205. More information is available at www.abs.gov.au
2.2 Part-time employmentWomen’s and men’s participation rate in part-time employment

Women in NSW 2013 103
Work and financial security
Figure 4.6 Part-time employment, by sex, NSW, 1978 to 2013
Population: Civilian population 15 years and over.Source: ABS (2013) Labour Force, Australia, Jan 2013. Cat no. 6202.0.
Work-family balance is an important issue facing Australian families today. As research on voluntary and caring work shows, unpaid family and community duties are as central to many people’s daily lives and identities as paid employment.
New indicators have been added to this topic since last
Topic 3 Balancing work and caring responsibilities
year’s Report. These include the extent to which people use work arrangements and different types of childcare to balance caring and paid employment responsibilities successfully (Indicators 3.1 and 3.2). In the discussion on Indicator 3.1 we also provide data on NSW parents using the new parental leave payments available through Centrelink from 2011.
The amount of unpaid household and family work people undertake and the extent to which women and men feel rushed make up Indicators 3.3 and 3.4, also included in this topic.

Women in NSW 2013 104
Work and financial security
Current position In 2010, some 91 percent of women and men aged 20 to 64 years said that one or more type of flexible work arrangement was available in their workplace to assist in meeting family or community arrangements.
However, 74 percent of employed mothers and 41 percent of employed fathers in 2011 reported that they used one or more type of flexible work arrangement to care for children.
Part-time work and flexible working hours were used most frequently by mothers, while flexible working hours were used most frequently by fathers.
Gender gap
• Womenwerenearlytwiceaslikelyasfatherstouseflexibleworkingarrangementstocarefor children.
The direction of change over time
No historic data is available for this indicator.
3.1 Flexible work arrangementsAvailability and use of flexible work arrangements for caring purposes

Women in NSW 2013 105
Work and financial security
Discussion Availability of flexible work arrangements
The vast majority of women and men report that employers make flexible work arrangements available to them to assist in meeting family or community commitments. The type of arrangements most commonly listed are flexible working hours, and various forms of leave including annual, carer’s, sick, long service and unpaid leave. Differences between women and men are minor, although women are more likely to report the availability of permanent part-time work.
Use of flexible work arrangements
However, another ABS survey of people with children 12 years and under suggests that there are major gender differences in use of those arrangements. See Table 4.3.
Flexible working hours is the arrangement that men use most (29 percent of men use this). Many women also use it (41 percent of women).
Working at home is less frequently used by either sex with 17 percent of women and 12 percent of men using it.
The other common form of working arrangement is part-time work; this is where the gender gap is largest. Only 5 percent of men use part-time work to assist them to care for children, compared to 42 percent of women.
Paid parental leave
The new national scheme providing up to 18 weeks of Parental Leave Pay (PLP) at the rate of the minimum wage was introduced in January 2011. Nearly 41,300 expectant and new parents took advantage of the scheme in NSW during 2011-12, one-third of the national total.
This equates to around 42 percent of all births registered in NSW during 2011, although note that only people who have met the income and work tests, which include having worked at least one day per week in 10 of the 13 months prior to the baby’s birth, are eligible for PLP.
Indicator 3.1 uses a survey of employed people with children to describe use of work arrangements to assist in their care during the reference week of the survey. These work arrangements are made available by an employer or are self-initiated. ‘Flexible working hours’ refers to workers having some control over starting, finishing and/or break times; ‘part-time work’ refers to working less than 35 hours per week; and ‘work at home’ refers to conducting work duties occasionally or always from home rather than an external location.
The General Social Survey data is for a different population, employed people aged 20 to 64 years, who are asked about the availability (as opposed to use) of such conditions. The survey covers a wider range of working arrangements but sample sizes preclude further analysis for NSW.
Parents receiving parental leave payments are compared to the number of registered births in NSW, but note that multiple births and the eligibility criteria for PLP mean there is not a one-to-one correspondence between the two.
Year collected: 2010 (General Social Survey), 2011 (Childhood Education and Care), 2011-12 (Parental Leave Pay).Data source: ABS (2011) General Social Survey, Australia, 2010 (unpublished data). Cat no. 4159.0. ABS (2012) Childhood Education and Care, Australia, June 2011, Cat no. 4402.0, Births Australia (2012) Cat no. 3301.0, FAHCSIA Paid Parental Leave data for NSW, unpublished. More information is available at www.abs.gov.au; www.humanservices.gov

Women in NSW 2013 106
Work and financial security
Table 4.3 Use of work arrangements to care for children, by sex, NSW, 2011
Employed female parent
%
Employed male parent
%Used work arrangements (total) 74 41
Flexible working hours 41 29
Part-time work 42 5
Work at home 17 12
Any other arrangement 9 7
Did not use work arrangements 26 58
Total employed parents with one or more children 12 years and under
100 100
Note: The table shows use of work arrangements to care for children by an employed female and male parent or guardian in families where at least one parent is employed. Numbers may not add up to 100 due to rounding.Population: Families in NSW with children aged 0 to 12, with at least one parent employed.Source: ABS (2012) Childhood Education and Care, Australia, June 2011. Cat no. 4402.0.
Current position In 2011, 63 percent of couple families with children 12 years and under and where both parents were employed used childcare of some type to assist with their childcare responsibilities. The percentage was significantly greater for employed single parents, among whom 84 percent used some type of care.
Informal care was more frequently used than formal care among both groups. Informal care was relied on at much higher rates by single parents.
The direction of change over time
No historic data is available for this indicator.
Discussion Formal care (long day care and before and after school care) was used by roughly 30 percent of employed couple and single parents. Pre-school, which often has more restrictive hours than long day care, was used more commonly by couple families (90 percent) with only 61 percent of single families using it for children aged 4 to 5 years.
Informal care, however, was used by three-quarters of single parent families, indicating the importance of family and community support in facilitating paid employment for this group. Less than half of employed couple families used informal care.
Among informal care providers, grandparents are by far the most important, accounting for over half of informal care for both types of families.
Between 3 percent (where children were not using care) and 9 percent (where children were using care) of people reported needing additional pre-school or formal care for their children 12 years of age and under. See Table 4.4.
Formal care is regulated care away from the child's home. It includes long day care, family day care, before and after school care and occasional care. Informal care is unregulated care (including by a nanny) either in the child's home or elsewhere.
Year collected: 2011.Data source: ABS (2012) Childhood Education and Care, Australia, June 2011. Cat no. 4402. More information is available at www.abs.gov.au
3.2 ChildcareUse of and need for childcare by employed parents

Women in NSW 2013 107
Work and financial security
Table 4.4 Types of childcare used and needed by NSW families, 2011
Children aged 0 to 12 years Couple family (both parents employed)
%
One parent family (parent employed)
%Usually attended care 63 84
Did not usually attend care 37 16
Type of care
Before and/or after school care 11 18
Long day care 18 9
Total formal care 31 29
Grandparent 34 40
Non-resident parent 2 31
Other relative 7 15
Other person 9 10
Total informal care 46 74Children aged 4 to 5 years not in school Couple family
%One parent family
%
Usually attended preschool 90 61
Did not usually attend preschool 10* 39*Children aged 0 to 12 years (all families) Additional preschool or formal care is currently required
%
Usually attended formal care or preschool 9
Usually attended informal care only 5
Did not usually attend care or preschool 3
Note: Formal care is regulated care away from the child’s home. It includes long day care, family day care, before and after school care and occasional care. Informal care is unregulated care (including by a nanny) either in the child’s home or elsewhere. Not all forms are shown and note that some children may attend several forms of care.
Population: NSW families with children aged 0 to 12 years.Source: ABS (2012) Childhood Education and Care, Australia, June 2011. Cat no. 4402.0.

Women in NSW 2013 108
Work and financial security
Current position In 2011, women with dependent children who worked full-time spent 44 hours on average doing household duties every week.
Men, on average, spent 26 hours on household duties every week.
Gender gap
• Womenspentonaverage18hoursperweekmorethanmenonhouseholdworkeachweek in 2011.
The direction of change over time
Both women and men reported doing more household work in 2011 compared to nine years ago when the survey started in 2002. However, women’s unpaid household work hours have increased the most: by 9 hours from 35 hours in 2002 to 44 hours in 2011. Men’s hours increased by just 3 hours in the period.
This increase is due to women spending significantly more time on childcare (see Table 4.5). Time spent on housework as such has changed little. Men have also been spending more time on household duties, mainly on errands – 3.9 hours each week in 2011 compared to 2.6 hours in 2002.
There was little change between 2011 and the 2010 data reported in Women in NSW 2012.
Discussion Women’s workforce participation and paid employment have increased substantially over time, but the amount of unpaid household work performed by women and men has not adjusted accordingly.
Not only do women spend 18 hours more on household duties every week, one-third of their time is spent on housework compared to one-fifth of men’s time. Men spend more of their time on childcare.
As well as the amount of time spent, gender imbalances also include dimensions such as who takes responsibility for planning and managing household work. These are not covered in the data above.
Indicator 3.3 focuses on people for whom time pressures are acute: full-time workers 15 to 64 years with dependent children aged 0 to 14 years. ‘Unpaid household work’ in the HILDA survey includes activities to which people have committed because of their social relationships, including housework, household management, shopping and childcare.
Year collected: 2011 and previous years. Data source: Household, Income and Labour Dynamics of Australia (HILDA) survey, Waves 2 and 11. More information is available at www.melbourne.com/HILDA
3.3 Time spent in unpaid household workAverage time spent in unpaid household work

Women in NSW 2013 109
Work and financial security
Table 4.5 Unpaid household work, NSW women and men, 2002 and 2011
Type of work Women hours
Men hours
2002 2011 2002 2011
Childcare 12.7 20.8 10.1 11.9
Housework 15.2 14.4 5.0 5.5
Errands 4.7 5.4 2.6 3.9
Outdoor 2.8 3.0 4.7 4.6
Total hours 35.4 43.6 22.4 25.9
Note: Average hours undertaken each week on selected household duties.Population: People in NSW aged 15 to 64, employed full-time with dependent children aged 0 to 14.Source: HILDA survey, releases 2.0 and 11.0.
Current position In 2011, around two-thirds (67 percent) of women with dependent children who worked full-time felt rushed or pressed for time ‘almost always’ or ‘often’.
By comparison, just under half (48 percent) of men in the same situation reported feeling rushed or pressed for time so frequently.
Gender gap
• Therewasagendergapof19percentagepointsinfeelingrushedorpressedfortime‘almost always’ or ‘often’.
The direction of change over time
Although the figure for women is high, it represents a slight decrease since 2010. There has been a downward trend in women reporting feelings of being rushed and pressed for time over the decade since 2002.
The figure for men has remained relatively constant since 2002.
Discussion The pressure on women to both earn and take responsibility for the majority of the household work and care for family is reflected in the considerably higher incidence of women who report being time-pressured than men.
One reason for the downward trend in this indicator may relate to the greater emphasis women are now placing on care of children, over other household tasks. It may be that feelings of not having enough time are most acutely felt in this area.
Indicator 3.4 is the frequency with which people feel ‘rushed or pressed for time’. As in Indicator 3.1, the population is full-time workers aged 15 to 64 years with dependants aged 0 to 14 years, for whom the issue of work-life balance is typically most acute.
Year collected: 2011 and previous years. Data source: HILDA survey, Waves 2 and 11. More information is available at www.melbourne.com/HILDA
3.4 Feeling rushedFeeling rushed or pressed for time

Women in NSW 2013 110
Work and financial security
48%
67%
Percentage of men and women with dependent children and working full-time who feel rushed or pressed for time ‘almost always’ or ‘often’
WOMEN
MEN
Topic 4 Workforce segregation
Women hold 46 percent of all jobs in NSW, but their share of specific occupational groups and industries varies considerably.
Many men and women work in jobs where the majority of other workers are of the same sex – a pattern
known as gender segregation. In Australia these informal divisions between ‘women’s work’ and ‘men’s work’ have been relatively stable over time, with some exceptions including certain management and professional jobs where women have increased their representation in recent decades.
Gender segregation in major occupational and industry
Source: HILDA survey, 2011.
Figure 4.7 Who’s in a hurry?
groups is reported at 4.1 and 4.2, while 4.3 focuses on the most male-dominated jobs in the NSW workforce – those with 25 percent women or less. Women’s representation in the jobs making up the ‘technicians and tradespeople’ occupational group is discussed in the focus topic for this chapter.

Women in NSW 2013 111
Work and financial security
Current position Clerical and administrative, community and personal services, and sales jobs are mainly undertaken by female workers.
Managers; technical and trades jobs; machinery operators and drivers; and labourers have a mainly male workforce.
Gender gap
• Womenmakeuponly9percentofmachineryoperatorsanddrivers,14percentoftechnical and tradespeople and 35 percent of both managers and labourers in NSW.
• Professionaloccupationsisthemajoroccupationalgroupsplitmostevenlywith52percent women to 48 percent men.
The direction of change over time
In the period 1996-97 to 2012-13 some occupational groups became more integrated and others became more segregated (Table 4.6).
Women increased their share of the occupational group ‘managers’ from 29 to 35 percent over the 16-year period, making it a more gender-balanced occupational group.
Each of the gender unbalanced groups, community and personal services; machinery operators; and labourers became more segregated with fewer men in the first of these groups, and fewer women in the second two.
More women entered the sales and technicians and trades occupational groups, as well as the already gender-balanced group, professionals.
There was no change between 2011-12 (last year’s data) and 2012-13.
Discussion Professionals is the only major occupational group that is currently split evenly between women and men.
Australia’s workforce, like that in other countries, is gender segregated. Occupational gender segregation persists across most countries, irrespective of other social and economic differences.1 However, difficulties in comparative measurement make it hard to rank countries in terms of the degree of segregation.
Indicator 4.1 is occupational segregation at the major occupational group level within the Australian and New Zealand Standard Classification of Occupations (ANZSCO). Note that the degree of integration or segregation visible depends on the level of disaggregation selected – within each occupational group is a range of subgroups with their own patterns of segregation.
Year collected: Four quarters to February 2013 and previous years. Data source: ABS Labour Force, Australia, Detailed, Quarterly. Cat no. 6291.0.55.003. SuperTable E08. More information is available at www.abs.gov.au
4.1 Occupational segregationThe percentage of women and men in major occupational groups
1 Walts, M. (2003) The Evolution of occupational gender segregation in Australia: measurement and interpretation in Australian Journal of Labour Economics, Vol. 6, No. 4, December 2003, pp 631-655.

Women in NSW 2013 112
Work and financial security
WomenOccupational group 1996-97
%2012-13
%
Machinery operators and drivers 13 9
Technicians and tradespeople 13 14
Managers 29 35
Labourers 35 35
Professionals 48 52
Sales workers 61 63
Community and personal service workers 66 68
Clerical and administrative workers 76 76
Total workforce 43 46
Table 4.6 Women’s share of major occupational groups, 1996-97 to 2012-13
Note: The occupational classification follows 1-digit ANZSCO major groups. The industries are listed in order of lowest to highest women’s representation in 2012-13, using a four-quarter average. Population: All employed people 15 years or older. Source: ABS Labour Force, Australia, Detailed, Quarterly. Cat no. 6291.0.55.003.
Current position Strongly male-dominated industries include mining; construction; transport, postal and warehousing; and electricity, gas, water and waste.
Health care and social assistance; and education and training stand out as highly female-dominated industries.
Gender gap
• Womenhold8percentofminingindustryjobsand10percentofjobsinconstruction in NSW.
• Alternatively,theyhold78percentofjobsinhealthcareandsocialassistanceand69percent in education and training.
The direction of change over time
Little has changed in terms of representation of women in male-dominated industries over the past 16 years (see Table 4.7).
In the period from 1996-97 to 2012-13, women increased their presence in the mining; wholesale; and public administration and safety industries.
Discussion As well as being concentrated in certain occupational groups, women are concentrated in a narrow range of industries.
As with occupational segregation, jobs in industry sectors that are dominated by women are often undervalued in terms of pay, but may have working conditions that better suit women’s requirements.
Indicator 4.2 is industry segregation at the industry division level within the Australian and New Zealand Standard Industrial Classification (ANZSIC). Note that the degree of integration or segregation visible depends on the level of disaggregation selected – within each industry division is a range of sub-divisions with their own patterns of segregation. Year collected: Four quarters to February 2013 and previous years.
Data source: ABS Labour Force, Australia, Detailed, Quarterly. Cat no. 6291.0.55.003, SuperTable E08. More information is available at www.abs.gov.au
4.2 Industry segregationThe percentage of women and men in major industry divisions

Women in NSW 2013 113
Work and financial security
Industry
Women
1996-97 %
2012-13 %
Mining 4 8
Construction 12 10
Transport, postal and warehousing 23 21
Electricity, gas, water and waste services 21 22
Manufacturing 28 27
Agriculture, forestry and fishing 30 30
Wholesale trade 32 39
Information media and telecommunications 40 40
Other services 38 41
Public administration and safety 36 43
Professional, scientific and technical services 46 44
Arts and recreation services 49 47
Rental, hiring and real estate services 45 47
Financial and insurance services 54 48
Administrative and support services 51 52
Accommodation and food services 53 52
Retail trade 55 57
Education and training 66 69
Health care and social assistance 76 78
Total workforce 43 46
Table 4.7 Women’s share of industry employment over time
Note: The industry classification follows ANZSIC divisions. The industries are listed in order of lowest to highest women’s representation in 2012-13. Population: Employed people 15 years and over. Source: ABS Labour Force Australia, Detailed Quarterly. Cat no. 6291.055.003, SuperTable E06.

Women in NSW 2013 114
Work and financial security
Current position 14 out of 43 occupational subgroups in NSW are ‘non-traditional’ in 2012-13 according to the definition used in NSW 2021, the State Plan.
Gender gap
As at February 2013, women made up 11 percent of workers in NSW’s most male-dominated occupations.
The direction of change over time
Women’s share of certain individual non-traditional occupational groups has varied over time.
Notably, women have increased their representation among engineering, ICT and science technicians (20 to 25 percent in the 15 years to 2012-13) and among chief executives, general managers and legislators (18 to 23 percent). Women’s share of the group ‘other labourers’ also grew from 14 to 20 percent between 1997-98 and 2012-13. See Table 4.8.
Contrary to the rising trend among engineering, ICT and science technicians, women’s share of ICT professionals fell. Their representation among farmers and farm managers also fell significantly over the last 15 years, perhaps reflecting greater the effect of consolidation in the agriculture industry.
Women’s already low share of the occupation ‘machinery operators’ nearly halved in the same period.
Discussion NSW 2021, the State Plan, targets increasing women’s participation in non-traditional occupations as a way of increasing women’s income security and opportunities and ensuring a sustainable workforce in NSW.
Many of the occupations where women have scant presence have experienced significant growth, including replacement job opportunities, and are at risk of skill shortages.
Occupational subgroups are defined at the ANZSCO submajor or two digit occupational grouping. See also the Focus topic. Year collected: Four-quarter average to February 2013 and preceding years. Data source: ABS Labour Force, Australia, Detailed, Quarterly. Cat no. 6291.0.55.003. SuperTable E08. More information is available at www.abs.gov.au
4.3 Non-traditional jobs for womenWomen’s participation in occupational subgroups that have 25 percent or fewer women

Women in NSW 2013 115
Work and financial security
Occupational submajor group Four quarter average ending February
1997-98 %
2011-12 %
2012-13 %
16 to 25 percent women
Engineering, ICT and science technicians 20 25 25
Chief executives, general managers and legislators 18 22 23
Farmers and farm managers 27 24 21
Other labourers 14 19 20
Storepersons 17 19 17
ICT professionals 22 18 17
6 to 15 percent women
Protective service workers 12 13 15
Machine and stationary plant operators 24 13 13
Less than 6 percent women
Road and rail drivers 3 6 3
Mobile plant operators 4 4 3
Electrotechnology and telecommunications trades 2 2 1
Automotive and engineering trades workers 0 1 1
Construction trades 0 0 0
Construction and mining labourers 0 0 2
Total - - 11
Table 4.8 Women’s share of non-traditional occupations 1997-98 to 2012-13
Note: Occupation sub-major groups follow the ANZSCO classification. 14 occupational subgroups are identified as having 25% or fewer women in 2012-13. Note that the figures are derived using a more reliable four-quarter average for the given year, resulting in slightly different figures to last year’s Report when one quarter data was used. Population: Employed people 15 years and over. Source: ABS Labour Force, Australia, Detailed, Quarterly. Cat no. 6291.0.55.003. SuperTable E08.
In NSW, fewer than two percent of each of the trades groups, construction, automotive and electrical trades, were women in 2011. There were just 200 female carpenters, 260 female motor mechanics, 170 female plumbers and 380 female electricians within a total technicians and trades workforce of nearly 415,000 people, just over 13 percent of the workforce.1 In the largest single trade occupation in NSW – that of
electrician – women were just 1.1 percent of total workers.
Despite awareness of the issue and government and non-government initiatives since the 1980s, women today have a substantial foothold in only a handful of trade and technical occupations. These include hairdressing and cooking (both trades associated with women’s traditional domestic roles), medical technicians, and animal care roles such as veterinary
nurse and animal attendant. Of the 62,600 women in trades and technical jobs in NSW, some 13,850 are hairdressers and nearly 14,000 are cooks or chefs.2
1 ABS Census of Population and Housing 2011, figures generated using ABS TableBuilder and rounded.2 While women outnumber men in the trade of ‘cook’, in the separate trade of ‘chef’, only 29 per cent or 4,250 are women. Bakers and pastrycooks are also included in the figures.
Focus topic Women in trades and technical occupations

Women in NSW 2013 116
Work and financial security
How did this degree of male domination within the trades workforce develop? How has it been sustained, given women’s entry into so many other areas of social life, and over three decades
of equal opportunity and anti-discrimination laws and policies?
Women’s share of some technician and trades occupations has increased a little over time (see Table 4.9).
Occupational subgroup 1996-97
%2006-07
%2011-12
%Other technicians and trades (incl. hairdressers, wood and printing tradesworkers)
34 42 48
Skilled animal and horticultural trades 22 22 34
Food trades 24 30 25
Engineering, ICT and science technicians 23 24 25
Electrotechnology and telecommunications trades 3 2 2
Construction trades 1 1 1
Automotive and engineering trades 1 1 0
Technicians and trades nfd* - - -
Total technicians and trades workers 12 14 15
Table 4.9 Women in technicians and trades subgroups, NSW
Note: *The nfd sub-group is technicians and trades workers not further defined. Population: Employed people aged 15 years and over. Source: ABS Labour Force, Australia, Detailed, Quarterly. Cat no. 6291.0.55.003. SuperTable E08.
Since the late 1980s, there has been a strong and growing presence of women in:
• theskilledanimalandhorticultural trades (where women are mainly veterinary nurses, animal attendants and trainers, and florists)
• foodtrades(ascooksandtoa lesser extent chefs)
• engineering,informationtechnology and science technicians (where women are mainly medical and ICT support technicians, occupations previously classified as ‘para-professional’).
However, gender segregation has remained extreme in the
construction, automotive and electrotechnology trades where women have been the ‘missing 48 percent’ – less than 2 percent of the workforce – for the last 25 years. In 1971, women made up 3.4 percent of ‘trade-dominated occupational groups’ as they were then called; 40 years later, in 2011, Women NSW has calculated that women comprised 1.8 percent of a similar grouping of occupations.1
1 Women NSW (2013) Women in the trades: the missing 48 percent, Women NSW Occasional Paper, March 2013, available at www.women.nsw.gov.au The change since 1971 is discussed in this paper.
What do we know about non-traditional tradeswomen?
In order to investigate the experiences of this tiny group of women further, Women NSW commissioned analysis of longitudinal HILDA survey data. Examining women who have left the trades can give us clues about tradeswomen’s pay and also their perceptions about this important aspect of employment. Watson

Women in NSW 2013 117
Work and financial security
20122 reports on the fortunes of a sample group of women and men who were working in trades and technical occupations in 2001, following the same people through the labour market until 2010.
The first point to note is that retention in trades employment is
2 Watson (2012) Qualitative career paths of women in the trades 2001 to 2010, Report for NSW CWEO, available at www.women.nsw.gov.au The data used is the population of the Household, Income and Labour Dynamics in Australia (HILDA) survey which is a representative longitudinal household survey. The geographical coverage is Australia. Note that because of the small number of tradeswomen in the HILDA sample (49 women were employed in a non-traditional trade in the 2001 sample) the findings are not representative of the total population but can be used indicatively.
relatively low for all age groups and both sexes. Only around one-third of people working in the trades in 2001 were still working in the trades nine years later in 2010. This high drop-out rate explains in part the skill shortages experienced by employers. The replacement demand for tradespeople is high because of turnover, although there has been little growth in overall numbers required in the workforce.
In the HILDA sample, women were less likely to stay in a trade than men. Of those who were in a trade in 2001, women were less likely than men to be in a trade 10 years later.
Only 17 percent (33/197) of the women who were tradeswomen
in 2001 were in a trade in 2010 compared to 38 percent of the 2001 male cohort (366/966) (Table 4.10).
Within this general picture, women in non-traditional trades were more likely to stay than those in the traditional female trades. Roughly a quarter of non-traditional tradeswomen were still in a trade in 2010, working as safety inspectors, chefs and draftspeople, compared to one-seventh of traditional tradeswomen, who worked as cooks, veterinary nurses, printers and agricultural, medical and science technicians (Watson 2012:27). As would be expected, the total numbers of men (stayers and leavers) were far greater than the total numbers of women.
2001 Number
2010* Number and %
Employed in a trade (total)
Men 996 366 (38%)
Women 197 33 (17%)
Employed in their non-traditional trade
Men 227 70 (31%)
Women 49 12 (24%)
Employed in their traditional trade
Men 739 269 (36%)
Women 148 21 (14%)
Table 4.10 Tradespeople in the HILDA survey sample, 2001 to 2010
Note: *Employed in a trade in 2010 includes those who left but subsequently returned to a trade. Source: Data sourced from Watson 2012.
Population: Women and men in the HILDA survey sample in 2001.

Women in NSW 2013 118
Work and financial security
Tracking the HILDA sample suggests that women in non-traditional trades are at least as likely, and perhaps more likely, to remain working in their trade over a 10 year period as women in the traditional trades such as hairdressing, cookery and floristry.
What else do we know about tradeswomen and non-traditional tradeswomen in particular? Census 2011 data tells something about their background, pay and working arrangements.
Country of birth
While some 15 percent of all NSW technicians and tradespeople in 2011 were women, in some overseas-born groups, the percentages of tradeswomen were higher. For example, around a quarter of Japanese and Korean, South-East Asian and North American tradespeople in NSW in 2011 were women.
Among all overseas-born people, 18 percent of technicians and tradespeople were women, possibly reflecting immigration selection criteria, downward mobility for immigrant women in Australia and the structure of women’s employment profile in some overseas countries.
Pay and working arrangements
In terms of pay and working arrangements the following observations stand out:
• Womenhavealowerearnings profile than men within technical and trades jobs, even when the low-paid female-dominated trades of hairdressing and cooking are excluded (see Women NSW and Watson 2012)
• Womenworkinginnon-traditional trades experienced a considerable pay premium over their counterparts in traditional female trades at every age and stage of their working life.
• Thegapwasslightlygreaterfor annual wages than for hourly rates.
• Womeninnon-traditionaltrades expressed high levels of satisfaction with the work itself and the job overall. However, they expressed relatively low levels of satisfaction with the hours of work. Women who left non-traditional trades expressed more satisfaction with work-life balance than those who stayed.
Conclusion
Women do well in non-traditional trades but are likely to leave because of hours (unlike men who do not leave as frequently). They are less likely to leave than traditional tradeswomen, who earn less.

Women in NSW 2013 119
Work and financial security
Topic 5 Gender pay gap
The difference between what women and men earn, on average, is referred to as the gender pay gap. Pay gaps, whether driven by discrimination or other factors,
compromise the current and future economic security of women and their families. There are many alternative ways to compare men’s and women’s earnings (for detail see Women in NSW 2012). Two commonly used standards – average weekly and average hourly earnings – comprise Indicators 5.1 and 5.2.
Current position As of November 2012, NSW women working full-time ordinary hours earned $1,246 each week on average, compared with $1,487 earned by men.
Gender gap
• MeninNSWearned16percentor$241moreeachweekthanwomenin2012.
The direction of change over time
The gender gap in NSW in the latest data was two percentage points greater than the 2011 figure of 14 percent reported in Women in NSW 2012.
There has been a slight downward trend in the AWOTE gender pay gap since 1995, but the figures fluctuate considerably year to year.
Discussion Comparing women’s and men’s earnings is a complex task, as women are less likely to work full-time and long hours. Ordinary time earnings for fulltime workers is one way to compare like with like, as it relates to the amount before any overtime or bonuses are taken into account.
Average weekly earnings refers to the gross (before tax pay) of employees, and are exclusive of amounts deducted by salary sacrifice. Adult employees are those employees 21 years of age or over and those employees who, although under 21 years of age, are paid at the full adult rate for their occupation.
Year collected: 2012. Data source: ABS (2013) Average Weekly Earnings, Australia, Nov 2012. Cat no. 6302.0. More information is available at www.abs.gov.au
5.1 Average weekly earningsAverage weekly ordinary time earnings for full-time adult employees (AWOTE)
Women in NSW 2013 120
Work and financial security
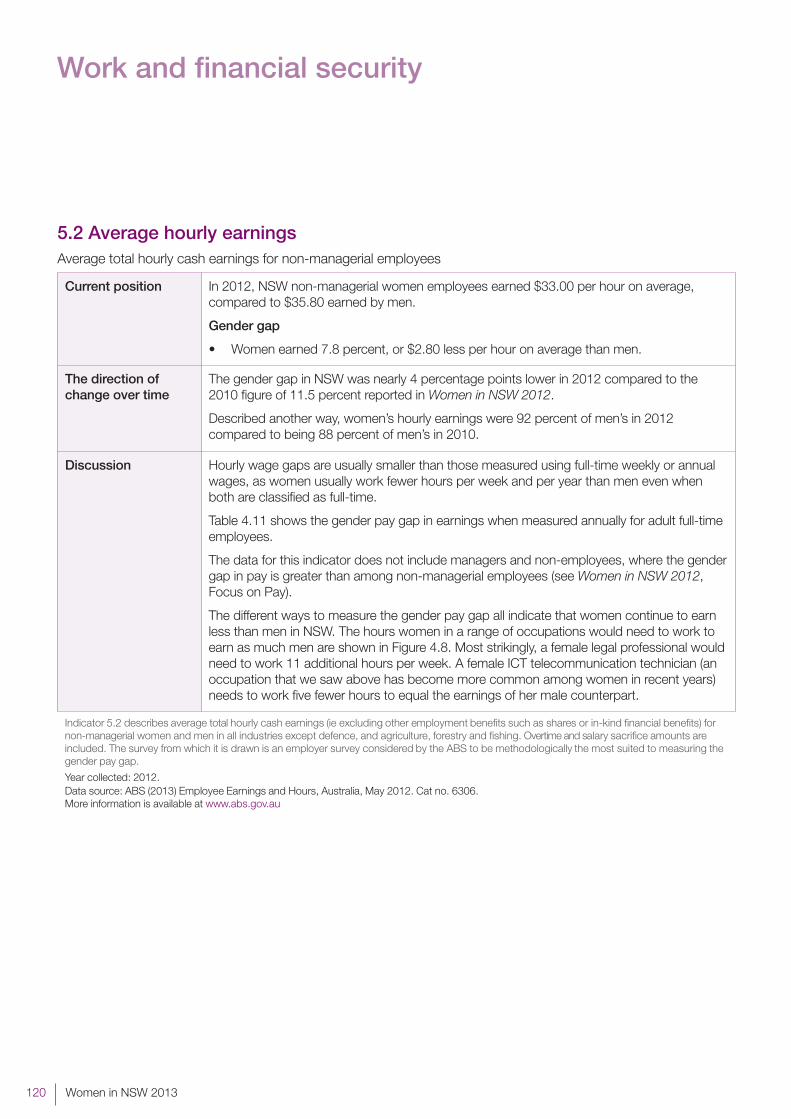
Current position In 2012, NSW non-managerial women employees earned $33.00 per hour on average, compared to $35.80 earned by men.
Gender gap
• Womenearned7.8percent,or$2.80lessperhouronaveragethanmen.
The direction of change over time
The gender gap in NSW was nearly 4 percentage points lower in 2012 compared to the 2010 figure of 11.5 percent reported in Women in NSW 2012.
Described another way, women’s hourly earnings were 92 percent of men’s in 2012 compared to being 88 percent of men’s in 2010.
Discussion Hourly wage gaps are usually smaller than those measured using full-time weekly or annual wages, as women usually work fewer hours per week and per year than men even when both are classified as full-time.
Table 4.11 shows the gender pay gap in earnings when measured annually for adult full-time employees.
The data for this indicator does not include managers and non-employees, where the gender gap in pay is greater than among non-managerial employees (see Women in NSW 2012, Focus on Pay).
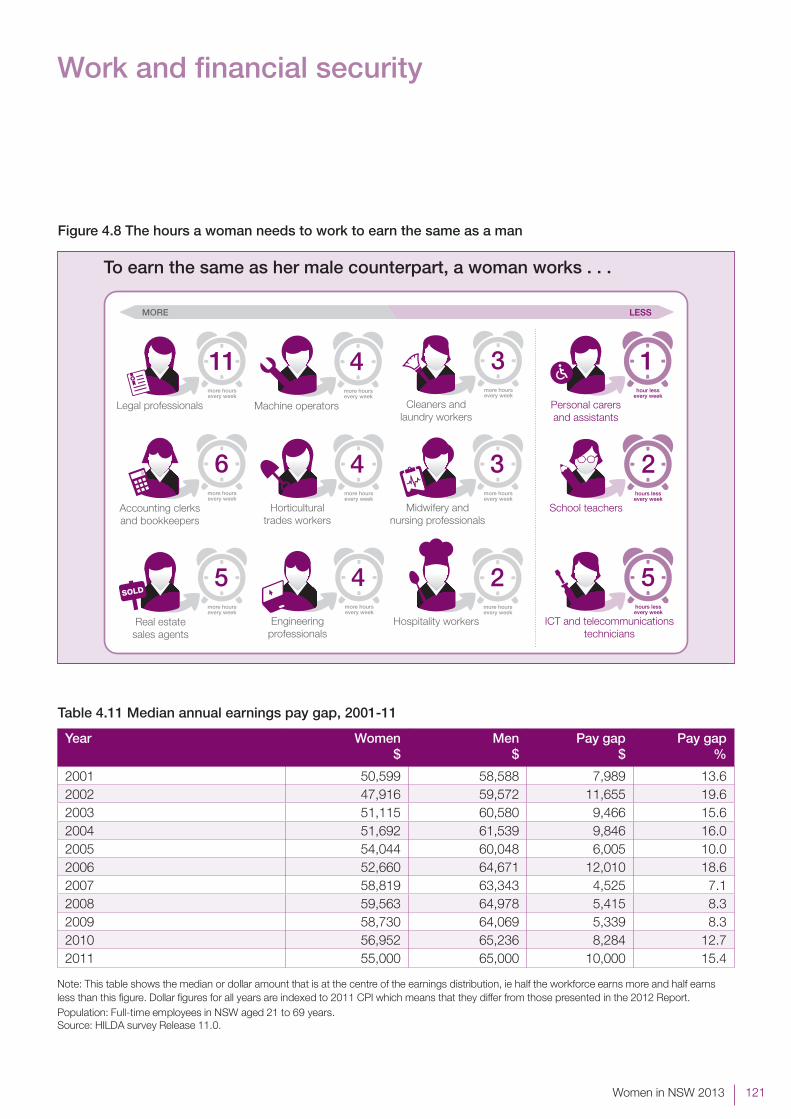
The different ways to measure the gender pay gap all indicate that women continue to earn less than men in NSW. The hours women in a range of occupations would need to work to earn as much men are shown in Figure 4.8. Most strikingly, a female legal professional would need to work 11 additional hours per week. A female ICT telecommunication technician (an occupation that we saw above has become more common among women in recent years) needs to work five fewer hours to equal the earnings of her male counterpart.
Indicator 5.2 describes average total hourly cash earnings (ie excluding other employment benefits such as shares or in-kind financial benefits) for non-managerial women and men in all industries except defence, and agriculture, forestry and fishing. Overtime and salary sacrifice amounts are included. The survey from which it is drawn is an employer survey considered by the ABS to be methodologically the most suited to measuring the gender pay gap.
Year collected: 2012. Data source: ABS (2013) Employee Earnings and Hours, Australia, May 2012. Cat no. 6306. More information is available at www.abs.gov.au
5.2 Average hourly earningsAverage total hourly cash earnings for non-managerial employees
Women in NSW 2013 121
Work and financial security
To earn the same as her male counterpart, a woman works . . .
more hoursevery week
Midwifery and nursing professionals
3
School teachers
Hospitality workers
Cleaners and laundry workers
Real estatesales agents
Accounting clerks and bookkeepers
Machine operatorsLegal professionals
Horticultural trades workers
Personal carers and assistants
Engineeringprofessionals
ICT and telecommunications technicians
hours lessevery week
2
more hoursevery week
2
more hoursevery week
3
more hoursevery week
5
more hoursevery week
6
more hoursevery week
4more hoursevery week
11
more hoursevery week
4
hour lessevery week
1
more hoursevery week
4hours lessevery week
5
Notes: XXXXXX.Source: XXXXXX.
LESSMORE
Figure 4.8 The hours a woman needs to work to earn the same as a man
Year Women $
Men $
Pay gap $
Pay gap %
2001 50,599 58,588 7,989 13.62002 47,916 59,572 11,655 19.62003 51,115 60,580 9,466 15.62004 51,692 61,539 9,846 16.02005 54,044 60,048 6,005 10.02006 52,660 64,671 12,010 18.62007 58,819 63,343 4,525 7.12008 59,563 64,978 5,415 8.32009 58,730 64,069 5,339 8.32010 56,952 65,236 8,284 12.72011 55,000 65,000 10,000 15.4
Note: This table shows the median or dollar amount that is at the centre of the earnings distribution, ie half the workforce earns more and half earns less than this figure. Dollar figures for all years are indexed to 2011 CPI which means that they differ from those presented in the 2012 Report. Population: Full-time employees in NSW aged 21 to 69 years. Source: HILDA survey Release 11.0.
Table 4.11 Median annual earnings pay gap, 2001-11

Women in NSW 2013 122
Work and financial security
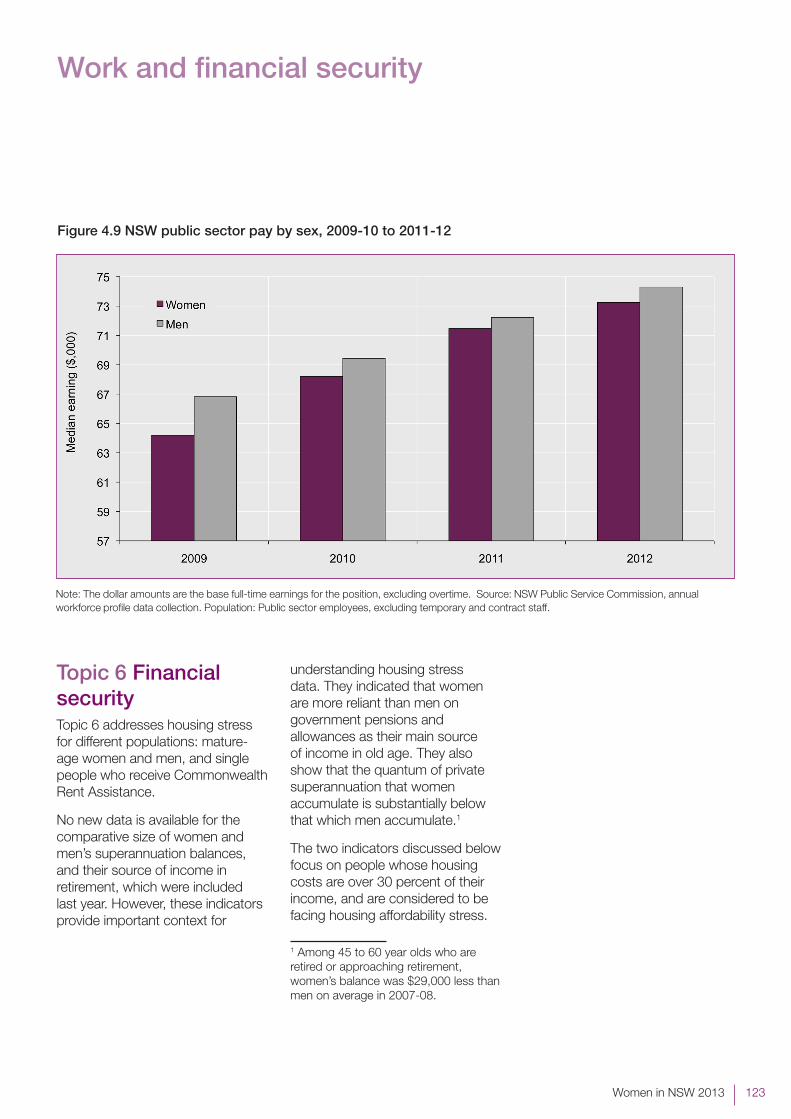
Current position In 2011-12, the median salary for full-time women public sector employees was $73,256 which was 99 percent of the equivalent male salary ($74,302).
However, the gap in actual take-home pay is 27 percentage points when gross earnings (taking into account part-time work) is calculated.
Gender gap
• Therewasa$1,046or1percentgapbetweenfull-timewomenandmeninthepublicsector in 2012.
The direction of change over time
Data from the NSW Pay Equity Audit was used in last year’s Report and is not comparable with this year’s data which is for the public sector as a whole, not just the public service (see below).
Historical data comparable to this year’s data is available for 2009-10. At that time, the gender pay gap was 4 percent, three percentage points greater than in 2011-12.
Discussion The gender pay gap in the NSW public sector appears to be disappearing when the base salary for positions held by women and men is considered.
However, as with the NSW workforce as a whole, the gender pay gap is much larger if actual take-home pay is considered as opposed to full-time base salary. The Women in NSW 2012 Report noted that the actual take-home pay gap was 28 percent, similar to the 27 percent reported in the public sector.
Indicator 5.3 measures the median rate for annual full-time base earnings reported by NSW public sector agencies as part of the annual NSW public sector workforce profile data collection. Temporary or contract workers are not included, and the earnings do not include overtime or take into account part-time work. The collection covers all agencies, including state-owned corporations and government trading enterprises. Some 332,600 full-time equivalent positions were included in 2011-12. By comparison, the 2010 data reported in last year’s Report was for the 20 percent of the workforce who work in the public service. Year collected: 2011-12. Data source: NSW Public Service Commission (2012) Workforce profile 2012 report. More information is available at www.psc.nsw.gov.au
5.3 Public sector annual earningsMedian full-time annual earnings for women and men in the NSW public sector
Women in NSW 2013 123
Work and financial security
Figure 4.9 NSW public sector pay by sex, 2009-10 to 2011-12
Note: The dollar amounts are the base full-time earnings for the position, excluding overtime. Source: NSW Public Service Commission, annual workforce profile data collection. Population: Public sector employees, excluding temporary and contract staff.
Topic 6 Financial securityTopic 6 addresses housing stress for different populations: mature-age women and men, and single people who receive Commonwealth Rent Assistance.
No new data is available for the comparative size of women and men’s superannuation balances, and their source of income in retirement, which were included last year. However, these indicators provide important context for
understanding housing stress data. They indicated that women are more reliant than men on government pensions and allowances as their main source of income in old age. They also show that the quantum of private superannuation that women accumulate is substantially below that which men accumulate.1
The two indicators discussed below focus on people whose housing costs are over 30 percent of their income, and are considered to be facing housing affordability stress.
1 Among 45 to 60 year olds who are retired or approaching retirement, women’s balance was $29,000 less than men on average in 2007-08.
Women in NSW 2013 124
Work and financial security
6.1 Housing stressRental and mortgage stress, people 45 years and over
Current position In the over 45 age group, single women are the group most affected by housing stress.
Out of the total over 45 population paying rent and mortgage, single women made up 60 percent of people experiencing rental stress and 55 percent of those experiencing mortgage stress.
The direction of change over time
The percentages are similar to 2010 for rental stress, and slightly lower for mortgage stress (55 percent compared to 63 percent in 2010).
Discussion Mature age people are a key focus of concern when considering housing because the level of stress is an indicator of whether they will own a home during their retirement. Home ownership, in turn, is a major factor in whether older people will be comfortably able to live on fixed incomes, whether superannuation or pensions.
The HILDA data further shows that the single women are a slightly larger percentage of people under housing stress in the bottom two socio-economic quintiles, or most disadvantaged social groups of the population. Women are 63 percent of people experiencing rental stress and 60 percent of people under mortgage stress in this population.
Housing stress is defined in the indicator as those households where mortgage or rental payments equal 30 percent of more of household gross income. This group is measured as a percentage of all households where rent or mortgage is being paid. Housing stress is reported for women and men aged 45 years and over in those households.
Year collected: 2011.Data source: HILDA Release 11. Data is weighted based on person weights, but for socio-economic data is based on household weights. Australian data is used to avoid sampling errors. More information is available at www.melbourneinsitute.com/hilda

Women in NSW 2013 125
Work and financial security
6.2 Commonwealth Rent Assistance and rental affordabilityRental stress, people 45 years and over
Current position Commonwealth Rent Assistance (CRA) was received by around 397,000 single people or families in NSW in 2012, of whom single people and sole parents made up approximately three-quarters of recipients (73.5 percent).
CRA is paid to alleviate rental stress, but the percentages of women receiving CRA and still experiencing rental stress are significant.
They are shown in Table 4.12 but the following are noteworthy:
• 46percentofsinglewomenwithnochildrenreceivingCRAexperiencedrentalaffordability stress in 2012
• 45percentofsinglewomenwithchildrenlivinginSydneyreceivingCRAexperiencedrental affordability stress in 2012
• Thegendergapwashighestatover7percentamongtwogroups.ThesearesingleAboriginal people (where it was in women’s favour) and single people on the Disability Support Pension (where it was in men’s favour).
The direction of change over time
The percentages of single women in rental affordability stress after receipt of the Commonwealth Rental Assistance supplement are similar to the 2011 data provided in last year’s Report and shown below in Table 4.12.
Discussion More NSW women than men meet the eligibility criteria for Commonwealth Rental Assistance, and women make up 91 percent of sole parents on CRA. The data shows that for most subgroups of single people, women are disproportionately likely to still experience rental affordability stress.
Commonwealth Rent Assistance (CRA) is a non-taxable income supplement paid to individuals and families who rent in the private rental market. Renting households who receive a Centrelink pension, allowance or Family Tax Benefit may be eligible for this fortnightly payment. Sydney is the Sydney Statistical Division.
Year collected: 2012 and preceding years. Data source: Australian Government Housing Data Set (Centrelink data for June 2011 and June 2012).More information is available at www.centrelink.gov.au

Women in NSW 2013 126
Work and financial security
Table 4.12 Single women in rental affordability stress, 2011 and 2012, and gender gap
2011 %
2012 %
Gender gap in 2012 %
Single women without children 49 46 1.4
Sole female parent families living in Sydney 44 45 4.4
Sole female parent families living in rest of NSW 25 27 0.8
Sole female parents (all) 38 39 4.3
Single women (with and without children) over 45+ years 38 38 3.4
Single women (with and without children) on the Disability Support Pension 34 34 7.1
Single Aboriginal women (with and without children) 24 26 -7.3
Note: This table shows the percentages of single women CRA recipients who experience rental affordability stress which is defined as having housing costs equal to 30 percent or more of their household income. Source: Australian Government Housing Data Set (Centrelink data for June 2011 and June 2012).

Women in NSW 2013 127
Work and financial security
The ABS publishes the Gender Indicators, Australia series every six months. It sets out a range of indicators against which it is possible to examine how women in NSW are faring compared with all women in Australia.
As reported in last year’s Report, women’s labour force participation rates are lower than those for women in Australia generally. In
How does NSW compare?
2011-12, the reporting year used in the series, the gap for women is 4 percent for women 20 to 74 years of age. The likely reason is NSW women’s higher rates of participation in full-time education.
While unemployment has fallen for NSW women, it remains slightly higher at 5.1 percent than Australian women’s unemployment rate (4.6 percent).