characterization of particulate matter emissions from on ... · characterization of particulate...
TRANSCRIPT

Atmos. Chem. Phys., 14, 7585–7599, 2014www.atmos-chem-phys.net/14/7585/2014/doi:10.5194/acp-14-7585-2014© Author(s) 2014. CC Attribution 3.0 License.
Characterization of particulate matter emissions from on-roadgasoline and diesel vehicles using a soot particle aerosol massspectrometer
T. R. Dallmann1,*, T. B. Onasch2, T. W. Kirchstetter 1,3, D. R. Worton4,5, E. C. Fortner2, S. C. Herndon2, E. C. Wood6,J. P. Franklin2,** , D. R. Worsnop2, A. H. Goldstein1,4, and R. A. Harley1
1Department of Civil and Environmental Engineering, University of California, Berkeley, CA 94720-1710, USA2Aerodyne Research, Inc., Billerica, MA 01821, USA3Environmental Energy Technologies Division, Lawrence Berkeley National Laboratory, Berkeley, CA 94720, USA4Department of Environmental Science, Policy and Management, University of California, Berkeley, CA 94720-1710, USA5Aerosol Dynamics, Inc., Berkeley, CA 94710, USA6Department of Public Health, University of Massachusetts, Amherst, MA 01003-9303, USA* now at: Center for Atmospheric Particle Studies, Carnegie Mellon University, Pittsburgh, PA 15213-3890, USA** now at: Department of Civil and Environmental Engineering, Massachusetts Institute of Technology,Cambridge, MA 02139, USA
Correspondence to:R. A. Harley ([email protected])
Received: 17 December 2013 – Published in Atmos. Chem. Phys. Discuss.: 14 February 2014Revised: 24 May 2014 – Accepted: 10 June 2014 – Published: 29 July 2014
Abstract. Particulate matter (PM) emissions were measuredin July 2010 from on-road motor vehicles driving through ahighway tunnel in the San Francisco Bay area. A soot parti-cle aerosol mass spectrometer (SP-AMS) was used to mea-sure the chemical composition of PM emitted by gasolineand diesel vehicles at high time resolution. Organic aerosol(OA) and black carbon (BC) concentrations were measuredduring various time periods that had different levels of dieselinfluence, as well as directly in the exhaust plumes of individ-ual heavy-duty (HD) diesel trucks. BC emission factor distri-butions for HD trucks were more skewed than OA distribu-tions (N = 293), with the highest 10 % of trucks accountingfor 56 and 42 % of total measured BC and OA emissions, re-spectively. OA mass spectra measured for HD truck exhaustplumes show cycloalkanes are predominate in exhaust OAemissions relative to saturated alkanes (i.e., normal and iso-paraffins), suggesting that lubricating oil rather than fuel isthe dominant source of primary organic aerosol (POA) emis-sions in diesel vehicle exhaust. This finding is supported bythe detection of trace elements such as zinc and phosphorusin the exhaust plumes of individual trucks. Trace elementswere emitted relative to total OA at levels that are consistent
with typical weight fractions of commonly used additivespresent in lubricating oil. A comparison of measured OA andBC mass spectra across various sampling periods revealed ahigh degree of similarity in OA and BC emitted by gasolineand diesel engines. This finding indicates a large fraction ofOA in gasoline exhaust is lubricant-derived as well. The sim-ilarity in OA and BC mass spectra for gasoline and dieselengine exhaust is likely to confound ambient source appor-tionment efforts to determine contributions to air pollutionfrom these two important sources.
1 Introduction
On-road motor vehicles, especially those with diesel engines,are important sources of fine particulate matter (PM2.5) emis-sions (Dallmann et al., 2010). Exposure to PM2.5 has beenlinked to various negative health effects (Pope and Dockery,2006; Brook et al., 2010). PM2.5 emissions from motor vehi-cles are of particular importance in urban areas where emis-sions occur in close proximity to exposed populations (Jerrettet al., 2005; Brugge et al., 2007). For example, the fraction of
Published by Copernicus Publications on behalf of the European Geosciences Union.
7586 Characterization of particulate matter emissions: T. R. Dallmann et al.
primary emissions that is inhaled by people is approximatelyan order of magnitude greater for vehicles operating in ur-ban areas compared to coal-fired power plants that have tallstacks and tend to be in more remote locations (Evans et al.,2002; Marshall et al., 2005). Motor vehicle exhaust PM2.5is primarily composed of carbonaceous species, includingblack carbon (BC) and organic aerosol (OA). The relativeabundance of BC depends on various factors, including en-gine type, engine operating conditions, and the presence ofemission control equipment (Chow et al., 2011). In general,diesel engines tend to have higher BC emission rates relativeto OA, and conversely for gasoline engines (Ban-Weiss et al.,2008; Chow et al., 2011).
Exhaust OA emissions consist of low volatility organiccompounds derived from fuel and lubricating oil. Recentstudies of emissions from combustion sources have shownthat exhaust OA is semi-volatile, and undergoes gas-particlephase partitioning (Robinson et al., 2007; Grieshop etal., 2009). Partitioning of semi-volatile organic compounds(SVOC) between the condensed and gas phases is thoughtto be governed by absorptive partitioning in the atmosphere(Pankow, 1994) and therefore depends on temperature, con-centrations of the condensed organic phase, and the SVOCvolatility distribution (Donahue et al., 2006; Robinson et al.,2010). In the case of motor vehicle emissions, where BC / OAratios are typically higher than observed in the atmosphere,sorption of organic compounds to BC particle surfaces mayalso influence gas-particle partitioning (Roth et al., 2005).Upon emission, rapid cooling of motor vehicle exhaust pro-motes condensation of organic vapors and partitioning isshifted towards the particle phase. As exhaust is diluted withambient air, concentrations of gaseous SVOC are reduced,leading to evaporation of SVOC to maintain phase equilib-rium (Robinson et al., 2010). Measurements of OA emissionfactors for motor vehicles are thus dependent on dilution andtemperature conditions of the sampled exhaust (Lipsky andRobinson, 2006; Grieshop et al., 2009).
The relative contributions of diesel fuel and lubricating oilto OA emissions depend on fuel and lubricating oil proper-ties, temperature, engine operating speed, engine load, andengine age and condition (Kweon et al., 2003; Lapuerta et al.,2003; Sakurai et al., 2003; Brandenberger et al., 2005; Mar-icq, 2007). Several laboratory and on-road investigations ofdiesel exhaust using aerosol mass spectrometers and similarinstruments have concluded that lubricating oil is the dom-inant source of exhaust OA, based on comparisons of OAmass spectra for diesel exhaust, diesel fuel, and lubricatingoil (Tobias et al., 2001; Sakurai et al., 2003; Canagaratna etal., 2004, Worton et al., 2014). Other researchers employingapportionment methods utilizing molecular markers to dis-tinguish between fuel and lubricant-derived OA report largercontributions from fuel (Kleeman et al., 2008; Sonntag et al.,2012). The divergent findings reported in the literature onthe nature and sources of primary organic aerosol emissionsin motor vehicle exhaust are not easily reconciled.
Minor components of motor vehicle exhaust PM includeinorganic species such as sulfate and other trace elements(Kittelson et al., 2006; Maricq, 2007). Sulfur is present as animpurity in fuel and is also used in additives found in lubri-cating oil. Trace elements, including zinc, phosphorus, cal-cium, and magnesium are commonly used in lubricating oiladditives (Cadle, 1997; Spikes, 2004; Maricq, 2007). Emis-sion rates of these trace elements in exhaust PM are low rel-ative to carbonaceous species. However, trace metals mayenhance the toxicity of particles emitted by motor vehicles(Gerlofs-Nijland et al., 2007; Bell et al., 2009). Also, fordiesel engines, emissions of lubricant-derived elements arethe focus of increasing scrutiny due to their potential nega-tive effects on the performance of advanced emission con-trol systems such as diesel particle filters. Lubricant-derivedtrace elements are not effectively removed during normal fil-ter regeneration processes and thus have a tendency to formincombustible ash deposits on particle filters, which may de-grade the performance and durability of these new controltechnologies (Sappok and Wong, 2011; Cross et al., 2012).
The primary objective of this study is to characterize thechemical composition of motor vehicle exhaust particulatematter emissions using a soot particle aerosol mass spec-trometer. Individual chemical components of the exhaustPM emitted by large numbers of in-use gasoline and diesel-powered vehicles were measured to determine the compo-sition of vehicular PM emissions, and to investigate theorigins of OA emitted in diesel exhaust. This study alsopresents novel measurements made at high time resolutionof lubricant-derived trace elements in the exhaust plumes ofindividual diesel trucks.
2 Methods
2.1 Field measurement site
Motor vehicle emissions were measured in July 2010 at theCaldecott tunnel in Oakland, CA. These measurements weremade as a part of a study that also quantified gas and particlephase pollutant emission factors for heavy-duty (HD) dieseltrucks (Dallmann et al., 2012) and light-duty (LD) gasolinevehicles (Dallmann et al., 2013). All measurements of theexhaust particle emissions described here were made in bore1 of the tunnel, which carries a mix of gasoline-powered pas-senger vehicles as well as medium-duty (MD) and HD dieseltrucks. MD trucks are defined in this study as those with twoaxles and six tires (i.e., four tires on the rear axle). HD trucksare defined as those having three or more axles. Further infor-mation on the vehicle classification system used here can befound in Dallmann et al. (2013). The tunnel is 1 km long andbore 1 contains two lanes of eastbound traffic, with vehiclesdriving uphill on a 4 % roadway grade. Sampling was con-ducted on 4 weekdays (22, 23, 26, 27 July) and 2 weekend
Atmos. Chem. Phys., 14, 7585–7599, 2014 www.atmos-chem-phys.net/14/7585/2014/

Characterization of particulate matter emissions: T. R. Dallmann et al. 7587
days (24, 25 July), with analytical instrumentation operatingfrom 10 a.m.–6 p.m. each day.
As described in Dallmann et al. (2012), measurements ofindividual diesel exhaust plumes were made throughout theday on each of the 4 weekdays. In addition, 2 hr intensiveoperating periods (IOPs) were specified for each day of sam-pling, during which vehicles were counted and classified, andfilter samples of particulate matter were collected. Samplingdates and times were chosen to study the impact of vary-ing levels of diesel truck traffic on tunnel pollutant concen-trations and emission factors. Two IOPs were conducted oneach weekday, from 12–2 p.m. and 4–6 p.m. On the weekend,there was only one IOP per day, from 2–4 p.m. The midday(12–2 p.m.) IOPs on weekdays corresponded to the highestlevels of diesel truck traffic in bore 1, measured both by ab-solute numbers of trucks and as a fraction of total vehiclecounts. LD vehicle activity was highest during the week-day late afternoon (4–6 p.m.) IOPs, which led to a relativelylow diesel truck fraction during these times. While LD vehi-cle traffic volumes during the weekend IOPs were similar toweekday levels, diesel truck traffic activity was much loweron the weekend.
2.2 Measurement methods
A new soot particle aerosol mass spectrometer (SP-AMS)described by Onasch et al. (2012) was used in this studyto measure PM mass concentrations and chemical composi-tion. The SP-AMS adds a 1064 nm continuous wave intra-cavity laser vaporizer to an existing Aerodyne high reso-lution aerosol mass spectrometer (HR-AMS). In the stan-dard HR-AMS configuration, sampled particles are focusedinto a narrow beam using an aerodynamic lens. This parti-cle beam is transmitted through a vacuum system to a resis-tively heated tungsten vaporizer at 600◦C, on which parti-cles impact and vaporize. Neutral molecules formed by thevaporization of non-refractory particle components (e.g., or-ganic compounds, ammonium, sulfate, nitrate) are subse-quently ionized by 70 eV electron impact ionization and de-tected by high resolution time-of-flight mass spectrometry(Jayne et al., 2000; DeCarlo et al., 2006). In the standardHR-AMS, lower volatility refractory materials such as blackcarbon (BC) are not vaporized at the operating temperaturesof the tungsten vaporizer and, thus, are not detected by theinstrument.
The inclusion of a laser vaporization source in the SP-AMS enables the characterization of refractory particles inaddition to the standard components (e.g., organics, sulfate,nitrate, ammonium). The laser cavity is incorporated into theAMS vacuum chamber perpendicular to the incident particlebeam. As particles cross the laser beam, absorbing BC parti-cles heat up to several thousand kelvin before vaporizing intoneutral carbon clusters (Onasch et al., 2012). As the BC com-ponent of sampled particles is heated by IR absorption, bothBC and any coatings associated with these particles are va-
porized and detected. Coating species may include organics,inorganics, and refractory metals. Transit times for particlespassing through the laser beam are on the order of 5–20 µs.Due to the high vacuum in the ionizer chamber and shorttime scales for vaporization, the likelihood of significant ox-idation of particulate material is low. Particles that either donot intersect with the laser beam or that pass through the laserbeam without vaporizing will impact on the tungsten vapor-izer, where non-refractory components are vaporized. Ioniza-tion and detection of vapor molecules in the SP-AMS followsstandard HR-AMS methods.
For the measurements presented here, both the tungstenand laser vaporizer of the SP-AMS were turned on, enablingthe characterization of non-refractory PM species and re-fractory BC along with associated coatings. A focus of thisproject was to characterize the chemical composition of par-ticles in individual diesel truck exhaust plumes. These truckplume events occur over short (typically < 30 s) time inter-vals and thus, fast sampling modes for the SP-AMS wereprioritized. In general, the SP-AMS was operated in the massspectrum (MS) data acquisition mode, whereby the particlebeam is alternatively transmitted and blocked using a chop-per wheel. Mass spectra measured while the particle beamis blocked correspond to the instrument background and aresubtracted from the mass spectra measured while the particlebeam is transmitted to isolate the signal for each ensemble ofsampled particles (DeCarlo et al., 2006; Kimmel et al., 2011).This operating mode enabled the characterization of particlemass spectra with a nominal time resolution of 1 s. Instru-ment background measurements (i.e. particle beam blocked)were conducted for 20 s of every 120 s sampling cycle. Thetime-of-flight mass spectrometer was operated with ion op-tics in the V-mode setting, which provided a mass resolvingpower of 2500 at 200 amu. This resolution enabled the sepa-ration of individual chemical ions at the same nominal mass-to-charge (m/z) ratio in particle mass spectra.
The SP-AMS was set up in the Aerodyne mobile labo-ratory, which was parked at the east end of the tunnel. Asdescribed in Dallmann et al. (2012), additional instrumentsto characterize gas and particle-phase pollutants were set upin the mobile lab and in a ventilation duct directly above thetunnel traffic. Tunnel air samples were drawn from a posi-tion approximately 0.1 m below the ceiling of the traffic borethrough a ventilation plenum on the floor of the ventilationduct approximately 50 m from the tunnel exit. Air sampleswere delivered continuously to instruments set up in the mo-bile lab through 35 m of 1.4 cm inner diameter copper tubingat a flow rate of 16.7 l min−1. A URG (Chapel Hill, NC) cy-clone was installed upstream of the aerosol instrumentationto remove particles with aerodynamic diameters larger than2.5 µm.
Use of the long sampling line to deliver tunnel air sam-ples to instruments located in the mobile lab led to signif-icant diffusive losses of small particles. The particle trans-mission efficiency as a function of particle diameter for the
www.atmos-chem-phys.net/14/7585/2014/ Atmos. Chem. Phys., 14, 7585–7599, 2014

7588 Characterization of particulate matter emissions: T. R. Dallmann et al.
extractive sampling technique used here was quantified usinga combination of experimental measurements and theoreticalcalculations. A more detailed description of these methods isincluded in the Supplemental Information. Results indicatedthat there was 50 % particle transmission through the sam-pling line for 50 nm diameter particles. Smaller (i.e., nucleimode) particles were not efficiently transported through thesampling line. Sampling losses of larger particles (> 100 nmin diameter) are estimated to be less than 10 %. Previousmeasurements of particle size distributions at the Caldecotttunnel show that while sub-50 nm particles account for themajority (> 75 %) of total particle number emissions in mo-tor vehicle exhaust, the contribution of these ultra-fine par-ticles to total particle volume and mass is relatively minor(< 10 %) (Ban-Weiss et al., 2010). Thus, while the long sam-pling line used here is not well suited for describing total par-ticle number concentrations or ultra-fine particle size distri-butions, characterization of particle mass concentrations andchemical composition is not expected to be significantly im-pacted by sampling line losses.
Additional instrumentation deployed at the Caldecott tun-nel provided supporting data for the interpretation and anal-ysis of the SP-AMS data. A full description of gas and par-ticle phase species measured at the tunnel and correspond-ing instrumentation is presented in companion publications(Dallmann et al., 2012, 2013). Supporting data utilized inthis study include non-dispersive infrared absorption mea-surements of CO2 concentration (LI-COR model LI-6262,Lincoln, NE), and BC mass concentrations measured witha multi-angle absorption photometer (MAAP, ThermoFisherScientific model 5012, Waltham, MA). Additionally, aver-age mass concentrations of OA, BC, and PM2.5 were quan-tified for each 2 hr sampling period using thermal-opticaland gravimetric analyses of collected quartz and Teflon fil-ter samples, respectively.
2.3 Data analysis
The SP-AMS data were processed using standard HR-AMSsoftware toolkits SQUIRREL (Sequential Igor Data Re-trieval, version 1.52C) and PIKA (Peak Integration by KeyAnalysis, version 1.11C). The direct measurement providedby the SP-AMS is a summed ion rate for individual chem-ical species (Is , units of Hz = ions s−1). This ion rate canbe converted into a mass concentration (Cs , µg m−3) uti-lizing instrument calibrations and known sample flow rate(Q = 1.4 cm3 s−1) (Jimenez et al., 2003; Allan et al., 2004;Onasch et al., 2012):
Cs =
∑i Is,i
CEs × RIEs × mIENO3 × Q,(1)
where mIENO3 is the mass specific ionization efficiency fornitrate (ions measured per picogram of nitrate sampled), CEs
is the SP-AMS collection efficiency for species S, and RIEs
is the relative ionization efficiency of species S, and is de-
fined as the ratio of the mass specific ionization efficiencyof particulate species S to mIENO3. mIENO3 was determinedto be 600± 120 ions picogram−1 based on standard AMSammonium nitrate instrument calibrations performed duringthe field sampling campaign. RIEs values for nonrefractoryspecies typically measured by HR-AMS instruments havebeen characterized through laboratory calibrations (Alfarraet al., 2004; Canagaratna et al., 2007). Similarly, RIEBC wasexperimentally determined to be 0.2± 0.1 based on labo-ratory calibrations using aerosolized Regal black particles(Onasch et al., 2012).
The laser vaporization source utilized in the SP-AMS ex-tends the range of chemical species detected by the instru-ment to include refractory species associated with BC con-taining particles, such as metals derived from lubricating oiladditives. Experimentally derived RIEs values are not avail-able for these species. For ions generated by electron impactionization, RIEs values can be estimated from electron im-pact ionization cross sections and number of electrons forthe species of interest (Jimenez et al., 2003; Salcedo et al.,2012). Based on literature-reported electron impact ioniza-tion cross sections, RIEs values for lubricant-derived tracespecies considered in this study are estimated as 1± 0.3 (Pot-tie, 1966; Tawara and Kato, 1987; Freund et al., 1990; Moze-jko and Sanche, 2005). Calcium and magnesium ions mayalso be generated through thermal ionization mechanisms,which would result in higher than expected ion signals forthese species and an overestimate of their sampled mass.
The collection efficiency in the denominator of Eq. (1) rep-resents the fraction of sampled particles that are detected bythe SP-AMS and is dependent on the chemical and physi-cal properties of sampled particles and their interactions withthe laser and tungsten vaporizers (Matthew et al., 2008). TheCE for non-refractory species, which can be vaporized byboth the laser and tungsten vaporizers, is governed by lossesdue to particle bounce effects at the tungsten vaporizer, andis assumed to be equal to 1 (i.e., negligible losses) for themotor vehicle exhaust emissions considered here (Slowik etal., 2004; Matthew et al., 2008; Onasch et al., 2012). TheCE value for refractive BC is largely dependent on the de-gree of overlap in the particle and laser beams, and was esti-mated through comparison with a collocated MAAP instru-ment, as discussed below. SP-AMS collection efficienciesfor lubricant-derived trace species have not yet been empir-ically characterized. CE values will depend on the interac-tions of these species with the laser and tungsten vaporizers.Species with boiling points below the operating temperatureof the tungsten vaporizer (e.g., phosphoric acid, boiling (de-composition) point = 158◦C) are likely readily vaporized atboth vaporizers and have similar CE values to non-refractoryspecies. Species with boiling points above the operating tem-perature of the tungsten vaporizer may still generate ion sig-nals from both vaporizers and thus have CE values betweenrefractory BC (laser only) and non-refractory species. Sal-cedo et al. (2012) demonstrated the capability of a tungsten
Atmos. Chem. Phys., 14, 7585–7599, 2014 www.atmos-chem-phys.net/14/7585/2014/

Characterization of particulate matter emissions: T. R. Dallmann et al. 7589
vaporizer operated at 600◦C to vaporize zinc (boiling point =907◦C) in ambient air samples, though time scales for evap-oration were slower than for non-refractory species. Morerefractory species such as calcium and magnesium (boilingpoint = 1484 and 1090◦C, respectively) are likely vaporizedmore readily through the heating of BC particles at the laservaporizer. Based on these considerations, CE values for thelubricant-derived trace species are estimated as unity withthe same uncertainty as non-refractory species (20 %) forphosphorus/phosphate and with greater uncertainty (50 %)for zinc. Due to the higher level of uncertainty in the vapor-ization and ionization mechanisms for calcium and magne-sium, ion signals were not converted to mass concentrationsfor these species.
2.4 Diesel truck exhaust plume analysis
The fast time response SP-AMS operating mode used forthis project enabled the characterization of average massspectra and chemical species emission factors for individ-ual diesel truck exhaust plumes. Video recordings of vehi-cle activity at the tunnel on each day of sampling (weekdaysonly; 10 a.m.–6 p.m.) were analyzed to determine the timesat which individual HD trucks passed beneath air samplinginlets. Instances where an individual truck passage resultedin a rise and fall (peak) in the measured CO2 concentrationdiscernible above background tunnel levels were identifiedin previous work (Dallmann et al., 2012), and are used as thebasis for further data analysis including SP-AMS results pre-sented here. Observed CO2 concentration peaks were used todelineate the time period of exhaust plume capture for eachpassing truck. Corresponding peaks in measured concentra-tions of other pollutants are indicative of their presence in theexhaust plume, and provide information on the emission pro-file of each truck. In this study, mass spectra for individualtrucks were obtained by subtracting the tunnel backgroundmass spectrum measured immediately prior to sampling of atruck plume from the average mass spectrum measured dur-ing the truck plume event. Fuel-based emission factors forparticulate species were calculated following the carbon bal-ance method (Dallmann et al., 2011; 2012):
EFS =
∫ t2t1
([S]t − [S]t1
)dt∫ t2
t1
([CO2]t − [CO2]t1
)dt
wc, (2)
where EFS is the emission factor for particulate species S(g kg fuel−1) andwc = 0.87 is the weight fraction of carbonin diesel fuel. The period of exhaust plume measurement isrepresented by the time intervalt1 ≤ t ≤ t2. ([S]t − [S]t1) isthe tunnel background-subtracted concentration of species Sat timet (µg m−3), and similarly for [CO2] (mg C m−3). Car-bon dioxide concentrations are typically much larger thanthose of other carbon-containing species in diesel exhaustand thus, CO2 is used here to estimate total fuel-derived car-bon associated with the exhaust plume.
Figure 1. Comparison of 10 s average BC concentrations measuredby SP-AMS and MAAP instruments. The slope of the linear fit de-scribes the SP-AMS collection efficiency for BC as 0.27.
3 Results and discussion
3.1 Instrument intercomparisons and IOP averageconcentrations
The ability of the SP-AMS to measure BC emitted by mo-tor vehicles was evaluated through a comparison with a col-located MAAP absorption photometer. Black carbon con-centrations measured with the MAAP were in good agree-ment with other approaches (e.g., aethalometer, photoacous-tic spectrometer, thermal-optical analysis of quartz filters)used to characterize BC during this field campaign (Dall-mann et al., 2012). Figure 1 shows a comparison of 10 s av-erage BC concentrations measured by SP-AMS and MAAPfor 4 of the 6 days of sampling considered here. This com-parison does not include 23 or 24 July, as the MAAP was of-fline on those days. In general, BC concentrations measuredby the two instruments are well correlated, withR2
= 0.92based on a linear least squares fit of the data. On average,MAAP BC concentrations are approximately 4 times largerthan SP-AMS BC concentrations. In a previous applicationof the SP-AMS to measure particulate matter emitted by mo-tor vehicles, Massoli et al. (2012) report an underestimate ofa factor of 9 in BC concentrations measured by SP-AMS rel-ative to the MAAP. The authors attribute this disparity to par-ticle losses within the SP-AMS resulting from sub-optimalalignment of the laser vaporizer and particle beams. In caseswhere regions of the particle beam do not overlap with thelaser beam, BC particles are not vaporized and thus are notdetected (Onasch et al., 2012). The slope of the linear fitto the data shown in Fig. 1 therefore defines the effective
www.atmos-chem-phys.net/14/7585/2014/ Atmos. Chem. Phys., 14, 7585–7599, 2014

7590 Characterization of particulate matter emissions: T. R. Dallmann et al.
Figure 2.Comparison of average PM2.5 concentrations and compo-sition measured during each 2 hr sampling period. Three measuresof PM2.5 mass are shown for each period, derived (reading left toright) from analysis of Teflon filters, quartz filters, and SP-AMSdata. Sampling periods are identified using codes of the form ddhh,where dd indicates the day during July 2010, and hh is the start-ing hour of sampling. In the middle of the figure, 24 and 25 Julywere weekend days with lower diesel truck traffic volumes. Q-QBTOA concentrations correspond to quartz filter-derived OA measure-ments adjusted to account for organics measured on separate quartz-behind-Teflon (QBT) filter samples collected in parallel. QBT or-ganic concentrations are also shown here as unshaded green bars.
collection efficiency of the SP-AMS with respect to the BCcomponent of sampled PM, CE = 0.27. Based on this anal-ysis, SP-AMS BC mass concentrations presented here aremultiplied by a factor of 3.7 (i.e., 1/CE).
SP-AMS measurements of carbonaceous aerosol massconcentrations for each IOP are shown in Fig. 2, togetherwith corresponding measurements of BC and OA derivedfrom thermal-optical analysis of quartz filter samples, andPM2.5 mass concentrations from gravimetric analysis ofTeflon filter samples. In this figure, tunnel PM2.5, OA, andBC mass concentrations are shown in blue, green and black,respectively. For quartz filter OA measurements presentedin Fig. 2, quartz filters located behind (i.e., downstream of)teflon filters (QBT) were used to correct for a positive sam-pling artifact in determining tunnel OA concentrations fromfront quartz filters. The positive artifact results from the ad-sorption of low volatility organic vapors to the quartz filters.Volatilization of collected OA from the front quartz filtermay result in a negative sampling artifact, though this effecthas been found to be small relative to the adsorption of or-ganic vapors for emissions from gasoline and diesel engines(Schauer et al., 2002; Shah et al., 2004; Lipsky and Robin-son, 2006; May et al., 2013). Tunnel OA concentrations wereestimated by subtracting organic mass measured on QBT fil-ters from bare quartz filters collected in parallel. ResultingOA concentrations for each IOP are shown in Fig. 2 as solid
green bars (Q-QBT). The measured organic concentrationderived from QBT filter samples (corresponding to adsorbedorganic vapors) is shown as unshaded bars above the cor-rected front quartz filter OA estimates. Organic carbon massloadings determined from the quartz filters were converted toequivalent OA mass by multiplying by a factor of 1.25. Thisfactor represents the organic aerosol to organic carbon massratio (OA / OC) and accounts for additional mass, mainly hy-drogen, associated with organic carbon present in the particlephase. The OA / OC ratio for PM in the Caldecott tunnel wascalculated using SP-AMS data following methods developedby Aiken et al. (2007, 2008). Throughout the field study, SP-AMS OA concentrations were approximately 40 % higherthan OA concentrations derived from the corrected quartz fil-ter samples (Q-QBT). Uncertainties in the quantification ofthese sampling artifacts likely contribute to the discrepanciesobserved in filter and SP-AMS OA measurements. For ex-ample if the volatilization of particulate organic compoundscollected on front quartz filters is non-negligible, treatmentof the back quartz filter OA measurements followed here mayunderestimate actual tunnel OA concentrations.
As shown in Fig. 2, fine particulate matter measured in thetunnel is composed primarily of carbonaceous species. Thesum of OA and BC contributions estimated from quartz filtersamples and the SP-AMS accounted for 87± 8 and 99± 8 %of Teflon filter-derived PM2.5 mass, respectively. This findingis consistent with the knowledge that motor vehicle exhaustPM2.5 is mainly composed of carbonaceous species, with mi-nor contributions from inorganic species such as sulfate andmetallic ash (Fujita et al., 2007; Maricq, 2007; Ban-Weisset al., 2008). The largest difference between PM2.5 and car-bonaceous aerosol mass concentrations was observed for the22 July, 12–2 p.m. sampling period shown at the left of Fig. 2.During this time period, tunnel maintenance staff carried outstreet sweeping of the traffic lanes, which is expected to haveenhanced contributions to PM2.5 from non-tailpipe sources(e.g., resuspended road dust).
Total PM2.5 mass measurements provided by the SP-AMS, including carbonaceous species and inorganic ions(e.g., sulfate, nitrate, ammonium, chloride), are further com-pared with Teflon filter derived PM2.5 mass concentrationsin Fig. 3. Excluding anomalous data from one sampling pe-riod with street sweeping activity, PM2.5 mass concentrationsdetermined by the two methods are generally in good agree-ment, with a slope near one and a correlation coefficient of0.82. Inorganic ions accounted for less than 5 % of total par-ticle mass measured by the SP-AMS during weekday IOPs,and 8 and 14 % of total mass on Saturday and Sunday sam-pling periods, respectively, when tunnel concentrations werelower. Ammonium concentrations were well correlated withthe sum of the nitrate molar concentration and the sulfatemolar concentration multiplied by a factor of 2 (R2
= 0.98),suggesting the main source of these species was likely am-monium nitrate and ammonium sulfate present in the ambi-ent background air drawn inside the tunnel. Motor vehicle
Atmos. Chem. Phys., 14, 7585–7599, 2014 www.atmos-chem-phys.net/14/7585/2014/

Characterization of particulate matter emissions: T. R. Dallmann et al. 7591
Figure 3. Comparison of gravimetrically determined PM2.5 massconcentrations and (blue triangles) SP-AMS total mass includingcarbonaceous species (OA, BC) as well as inorganic ions (sul-fate, nitrate, ammonium, chloride), and (red circles) carbonaceousspecies (OA, BC) determined from thermal-optical analysis ofquartz filter samples. Boxed points at the right of the figure wereexcluded from the regression analysis due to an anomalous streetsweeping event that occurred during the IOP2212 sampling period.
contributions to inorganic ions measured in the tunnel mayalso result from the presence of trace impurities and addi-tives in fuel and lubricating oil, particularly in the case ofsulfate (Maricq, 2007).
3.2 Chemical composition of diesel exhaust PM
The concentration time-series response of the SP-AMS to apassing HD truck is shown in Fig. 4 for BC, OA, and sev-eral elements. A clear peak in the measured CO2 concentra-tion above background levels is visible and defines the pe-riod of exhaust plume measurement (∼15 s). Correspondingpeaks in the measured OA and BC concentrations are simi-larly well-defined, indicating the presence of these species inthe exhaust plume. Fig. 4 also shows clear peaks in severaltrace elements associated with diesel fuel and lubricating oiladditives (Cross et al., 2012).
A prior analysis of data collected during∼30 h of sam-pling over the 4 weekdays considered here identified 809candidate HD trucks for which individual truck exhaustplume contributions of CO2 were discernible above back-ground levels inside the tunnel (Dallmann et al., 2012). Dueto a lower duty cycle relative to CO2 analyzers (i.e., fre-quent background checking) and more frequent instrumentcalibrations, SP-AMS data were only available for 293 ofthe 809 successful plume captures. As discussed below, thissub-sample was used to calculate emission factors for OA,
Figure 4. Species concentrations measured during individual dieseltruck plume event. Clear peaks are visible for trace elements, indi-cating presence in truck exhaust plume.
BC, and various trace elements from individual trucks. Forthe mass spectral analysis discussed here, additional crite-ria were defined to identify trucks for which exhaust plumePM mass spectra were sufficiently distinct from tunnel back-ground mass spectra. In this case, only trucks with OA andBC emission factors greater than 0.05 g kg−1, as calculatedusing Eq. (2), and peak exhaust plume CO2 concentrationsat minimum 100 ppm higher than tunnel background levels(corresponding to an approximately 10 % increase for typicaltunnel CO2 concentrations of 1000 ppm) were considered formass spectral analysis. These criteria excluded trucks withlow particle mass emission rates and truck plumes that werehighly dispersed in the tunnel prior to their measurement. Ofthe 293 trucks for which SP-AMS data were available, 145met these acceptance criteria.
The average SP-AMS mass spectrum for this populationof trucks is shown in Fig. 5, with mass spectra for carbonand organic ions shown in the lower panel and ions asso-ciated with trace elements shown in the top panel. Tunnelbackground-subtracted mass spectra for each truck were nor-malized to the total ion signal and then averaged to obtainthe results shown in Fig. 5. In the average diesel PM massspectrum, the height of each bar indicates the relative per-cent of the total ion signal for a given mass-to-charge ratio(m/z), and uncertainty bars show the 95 % confidence inter-val. The use of a high-resolution mass spectrometer enabledidentification of individual chemical ion contributions at thesame nominalm/zand the separation of spectra according tochemical families. Ion fragments of the family C+
x indicateclusters of carbon atoms and represent the BC signal, shownin black in Fig. 5. On average, the BC signal accounted forapproximately 9 % of the total ion signal measured for dieselexhaust PM. The largest carbon ion signals are from the frag-ments C+1 (m/z= 12) and C+3 (m/z= 36), which together ac-count for 77 % of the total carbon ion signal form/z in the
www.atmos-chem-phys.net/14/7585/2014/ Atmos. Chem. Phys., 14, 7585–7599, 2014

7592 Characterization of particulate matter emissions: T. R. Dallmann et al.
Figure 5. Average relative ion signal for 145 diesel truck exhaustplumes. Error bars show 95 % confidence interval. Legend includescorrelation of signal from each ion group with the total OA signal.
range 10–360. Likewise, small carbon clusters of 1–5 car-bon atoms (C+1 –C+
5 ) account for greater than 97 % of the to-tal carbon ion signal in this mass range. These findings areconsistent with previous measurements of BC mass spectrafor individual diesel buses in New York City (Massoli et al.,2012).
The OA component of the diesel truck mass spectrum isdominated by hydrocarbon ion fragments of the CxH+
y fam-ily. The largest observed signals in the OA mass spectrumare from the ion fragments C3H+
5 (m/z = 41), C3H+
7 (m/z= 43), C4H+
7 (m/z = 55), and C4H+
9 (m/z = 57), which to-gether account for 27 and 30 % of the total ion and OA ionsignals, respectively. In sum, ions of the CxH+
y family con-tributed 91 % of the measured OA signal and 79 % of the to-tal ion signal. The predominance of the CxH+
y family in theOA mass spectrum is expected for primary exhaust OA fromdiesel engines and is consistent with previous characteriza-tions of the chemical composition of PM emitted by in-usevehicles (Canagaratna et al., 2004; Chirico et al., 2011; Mas-soli et al., 2012). Organic aerosol emitted by diesel trucks islargely unoxidized, with oxidized organic ion fragments ofthe families CHO and CHO>1 contributing less than 10 %of the total organic signal. Atomic ratios (O / C, H / C) andthe organic aerosol mass to organic carbon ratio (OA / OC)of the diesel truck OA were evaluated following methodsdeveloped by Aiken et al. (2007, 2008). Average values ofO / C, H / C, and OA / OC for the diesel trucks consideredhere are 0.06± 0.02, 1.90± 0.05, and 1.24± 0.03, respec-tively. These values agree with other ratios measured in lab-oratory investigations of diesel engine exhaust (Mohr et al.,2009; Chirico et al., 2010).
Sources of OA in diesel exhaust include unburned fuel andlubricating oil and their partially oxidized products (Maricq,2007). Though both fuel and oil are derived from petroleum
sources, different processing techniques lead to large differ-ences in the molecular weights and chemical structures. Forexample, diesel fuel is typically composed of hydrocarbonswith carbon numbers ranging from C10–C25, while lubricat-ing oils consist of less volatile hydrocarbons with carbonnumbers ranging from C14–C45 (Tobias et al., 2001; Kweonet al., 2003; Isaacman et al., 2012). Additionally, while dieselfuels have high concentrations ofn alkanes, lubricating oilstend to be dominated by cycloalkanes, due to the deliberateremoval ofn alkanes during a dewaxing process (Tobias etal., 2001; Isaacman et al., 2012).
Previous studies of diesel PM using AMS and similar in-struments have investigated the relative contributions of fueland lubricating oil to diesel exhaust OA (Tobias et al., 2001;Sakurai et al., 2003; Canagaratna et al., 2004). Three mainhydrocarbon ion series were identified in both fuel and lu-bricating oil: (1) CnH+
2n+1 (m/z 29, 43, 57, 71, 85, 99. . . )typical of saturated alkyl compounds (n alkanes, branchedalkanes), (2) CnH+
2n−1 (m/z 27, 41, 55, 69, 83, 97. . . ) typicalof unsaturated aliphatic compounds (cycloalkanes, alkenes)and (3) CnH+
2n−3 (m/z 67, 81, 95, 109. . . ) ion fragments de-rived from bicycloalkanes (McLafferty and Turecek, 1993;Tobias et al., 2001; Canagaratna et al., 2004). Also, previ-ous investigations found that saturated alkane ion signals arelarger than neighboring cycloalkane-derived ion signals inthe rangesm/z= 67–71 and 81–85 for diesel fuel, while theopposite is true for lubricating oil (Tobias et al., 2001; Saku-rai et al., 2003; Canagaratna et al., 2004). In each of theseprior studies, the predominance ofm/z= 69 versus 71, andm/z= 83 versus 85, in diesel OA mass spectra indicates thatthe lubricating oil contribution to diesel OA dominates overcontributions attributable to diesel fuel.
All three of the main hydrocarbon series noted above areapparent in the diesel truck plume OA mass spectrum mea-sured in this study (shown in Fig. 5). Average diesel PMion signal ratios atm/z = 69 to 71 andm/z = 83 to 85were 1.51± 0.08 and 1.66± 0.08, respectively. Sakurai etal. (2003) measured particle mass spectra for diesel exhaustparticles and for mixtures of varying ratios of lubricating oilto diesel fuel. Results from these experiments show ion sig-nals atm/z71 and 85 were larger than signals atm/z69 and83, respectively, for mixtures containing 20 % fuel: 80 % oiland 10 % fuel: 90 % oil. Cycloalkane signals in these massranges were only clearly dominant over saturated alkane sig-nals for a mixture of 5 % fuel: 95 % oil. Based on these re-sults, the authors concluded that measured diesel exhaust par-ticles, whose spectra had ratios atm/z= 69 to 71, andm/z=83 to 85 greater than unity, are comprised of at least 95 %unburned lubricating oil. While the lack of measurements ofpure fuel and lubricating oil samples preclude a similar anal-ysis in the present study, ion ratios greater than one atm/z=69 to 71 andm/z= 83 to 85 support a similar conclusion thatlubricating oil was the predominant source of OA measuredin the exhaust of diesel trucks operating in the Caldecott tun-nel. Alkenes formed from incomplete combustion of diesel
Atmos. Chem. Phys., 14, 7585–7599, 2014 www.atmos-chem-phys.net/14/7585/2014/
Characterization of particulate matter emissions: T. R. Dallmann et al. 7593
fuel may contribute to the signal measured atm/z= 69 andm/z= 83, though this contribution is expected to be minorrelative to the cycloalkane signal (Worton et al., 2014).
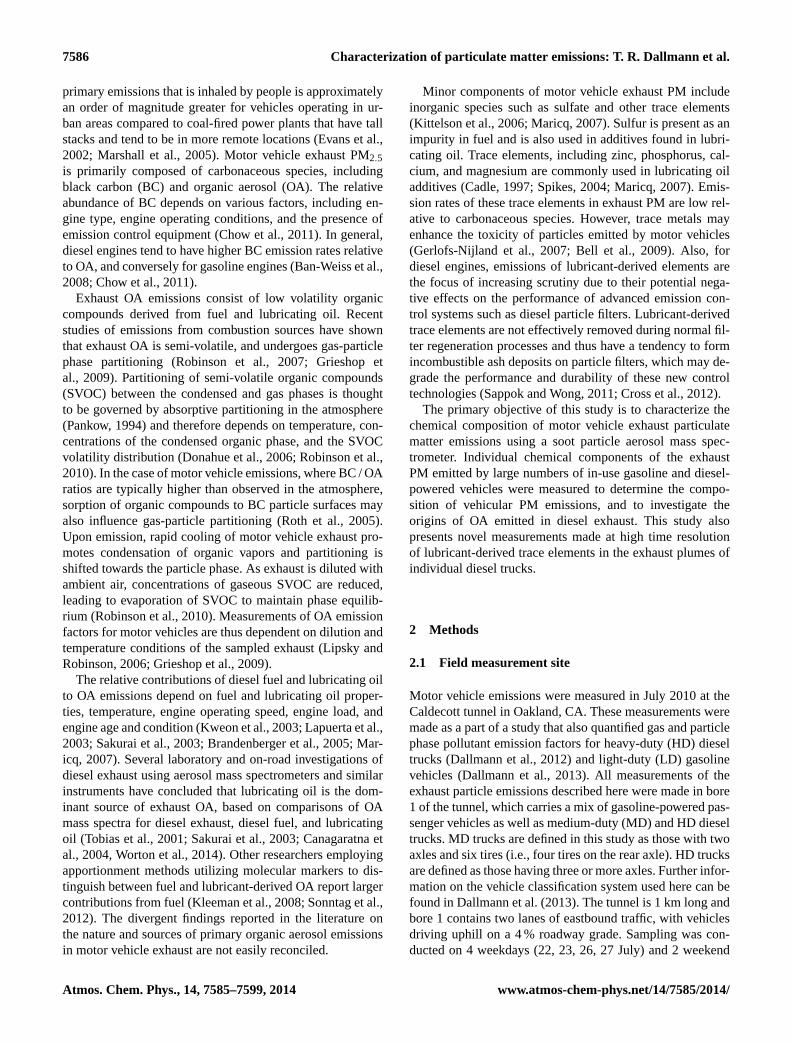
Further information concerning the origin of OA in the ex-haust of the 145 HD diesel trucks considered here is derivedthrough an analysis of other trace elements measured in indi-vidual exhaust plumes. Trace elements included in this anal-ysis were selected based on their inclusion in lubricating oiland on their prior identification in diesel exhaust PM in alaboratory study that used the SP-AMS (Cross et al., 2012).These trace species are typically present as additives or im-purities in diesel fuel and lubricating oil. For example, zincand phosphorus are present in zinc dialkyl dithiophosphate(ZDDP), a widely used lubricating oil additive that enhancesanti-wear and antioxidant properties of the oil (Spikes, 2004).Similarly, calcium and magnesium are components of deter-gent additives in lubricating oils (Cadle et al., 1997). Lubri-cating oil additives such as calcium, zinc, and phosphorus aretypically not present at detectable levels in diesel fuel, andcan thus be used as tracers for lubricant-derived OA in dieselexhaust (Spencer et al., 2006; Shields et al., 2007). Sulfur ispresent both as a trace species in diesel fuel, as well as inlubricating oil additives. Other species considered here in-clude potassium and sodium associated with diesel fuel, andlead associated with engine wear (Cross et al., 2012). Whilethese trace elements typically account for a small fraction ofthe total PM mass emitted by diesel engines, trace elementemissions may accumulate over time and negatively affectthe performance of diesel particle filters, as ash deposits re-lated to these species are not readily removed from exhaustfilters by oxidative regeneration schemes that are used to re-move accumulated BC and OA (Maricq, 2007; Sappok andWong, 2011).
The top panel of Fig. 5 shows the average relative ionsignal measured for trace elements in the exhaust of dieseltrucks operating at the Caldecott tunnel. The mass resolvingpower of the high resolution time-of-flight mass spectrome-ter used in the SP-AMS enabled the simultaneous identifica-tion of these trace elements and hydrocarbon fragments at thesame nominalm/z. Included in the legend are the correlationcoefficients for a comparison of the summed ion signal foreach ion group with the total OA signal across the sampledpopulation of trucks. For trace elements, the highest correla-tion with OA was observed for lubricant-derived species, in-cluding phosphorus containing ions (phosphorus/phosphate),zinc, and magnesium. Figure 4 shows an example of atruck plume where signals for these species were particularlystrong and readily discernible above both background signalsand SP-AMS instrument noise. Emission mechanisms for lu-bricating oil include volatilization of oil components at hightemperatures and liquid oil emissions (Tornehed and Olof-sson, 2011). In Fig. 4, the correspondingly large BC signalsuggests these elements were likely associated with BC par-ticles and vaporized as a result of the heating of laser-lightabsorbing BC particles. Across the sampled truck population,
Figure 6. Average BC mass spectrum for 145 diesel truck plumes.Ion signals for each carbon ion (C+
x ) are normalized to total carbonion signal. Note13C isotopes are excluded here for sake of visualclarity.
the identification of lubricant-derived species in exhaust PMis further supported by a positive correlation (R2
= 0.71) be-tween the average plume phosphorus/phosphate and zinc sig-nals, suggesting a common source for both of these trace ele-ments. The presence of lubricant-derived trace metal speciesin diesel exhaust plumes and their positive correlation withOA further suggests lubricating oil as a major contributor todiesel OA emissions.
In Fig. 5, a clear signal for calcium, another common lu-bricating oil additive, is visible atm/z= 40, though the cor-relation with OA is weaker than for other lubricant-derivedelements. Uncertainties arose in the definition of the exhaustplume calcium (40Ca) signals due to interferences from thegas phase argon (Ar) signal at the samem/z. The mass re-solving power of the SP-AMS was not sufficient to differen-tiate40Ca from40Ar. Argon levels in tunnel air are expectedto be relatively stable, thus for this analysis signals for40Caand 40Ar were summed and any increase in the combinedsignal above baseline levels was assumed to represent a con-tribution from40Ca. Uncertainties due to the higher baselinesignal in this approach may explain the larger diesel truckexhaust signal for calcium relative to other lubricant-derivedspecies, as well as the weaker correlation with OA.
The average diesel truck BC mass spectrum, normalizedto total carbon ion signal, is shown in Fig. 6. A key featureof this spectrum is the low variability in the distribution ofcarbon ion signals across the sampled truck population, asevidenced by the relatively small uncertainty in contributionsto the total signal associated with each carbon ion. This lowvariability suggests that the distribution shown in Fig. 6 coulddefine a BC emissions source “fingerprint” for in-use diesel
www.atmos-chem-phys.net/14/7585/2014/ Atmos. Chem. Phys., 14, 7585–7599, 2014
7594 Characterization of particulate matter emissions: T. R. Dallmann et al.
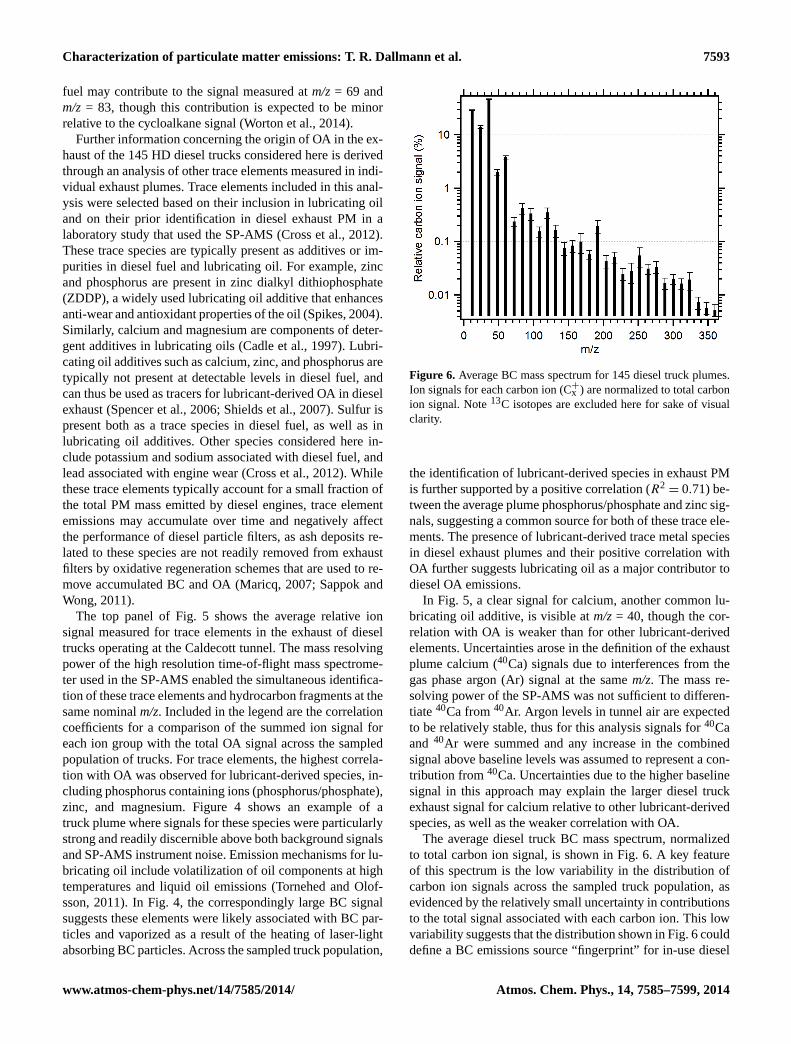
Figure 7. Emission factor log-probability plots (top) and distribu-tions (bottom) for OA, BC, zinc, and phosphorus/phosphate.
trucks that may be useful in future applications of the SP-AMS to source apportionment of ambient BC (Onasch et al.,2012).
3.3 HD diesel truck emission factors
Emission factors for individual chemical components of PMemitted by diesel trucks were evaluated for the entire popu-lation of trucks for which SP-AMS data were available, in-cluding low-emitting trucks not included in the mass spec-tral analysis presented above. Emission factors were calcu-lated using Eq. (2), and species considered here include OA,BC, zinc, and phosphorus/phosphate. Fleet-average emissionfactors for a sample of 293 HD diesel trucks are presentedin Table 1, and emission factor distributions are shown inFig. 7. Note that trucks with zero or negative emission fac-tors calculated using Eq. 2 are not included in this figure.For each of the emitted species considered here, between
Figure 8. OA (green) and BC (black) mass spectra for high (toppanel) to low (bottom panel) levels of diesel truck influence. Piecharts show relative contributions of OA and BC to total carbona-ceous mass.
5 and 11 % of the total measurements were for trucks withno detectable emissions. Both the OA and BC distributionsare lognormal, though the BC distribution is more skewedthan OA: 10 % of BC and OA measurements accounted for56 and 42 % of total emissions of the respective pollutants.The fleet-average BC emission factor from the SP-AMS is2.6± 0.8 times the value of the corresponding OA emissionfactor. Resulting OA to BC (OA/BC) and OC to BC (OC/BC)mass emission ratios for diesel trucks are 0.38± 0.12 and0.31± 0.10, respectively. A prior vehicle emission study atthe Caldecott tunnel estimated an OC/BC ratio for dieseltrucks of 0.34, which is in good agreement with the ratioreported here (Ban-Weiss et al., 2008). Because diesel PMis predominantly carbonaceous, the sum of the OA and BCemission factors, 0.86± 0.17 g kg−1, should provide a rea-sonable estimate of the PM2.5 emission factor for HD dieseltrucks. Note that OA emission factors reported here are repre-sentative of the dilution conditions of the individual exhaustplumes sampled. Further dilution of exhaust to atmosphericlevels may lead to volatilization of SVOC and a reductionin primary OA mass (Lipsky and Robinson, 2006; Robin-son et al., 2007). Dilution ratios for the exhaust plume mea-surements reported here ranged from 60–3600, with an aver-age (±95 % confidence interval) of 650± 60. HD truck BCand OA emission factors presented here are approximately 3times the values measured during a recent dynamometer testof an uncontrolled HD diesel truck operating on an urban dy-namometer driving cycle, though similar OC/BC ratios weremeasured in both studies (May et al., 2014).
The ability of the SP-AMS to detect refractory PMcomponents enabled the quantification of lubricant-derivedtrace element emission factors for individual HD trucks.
Atmos. Chem. Phys., 14, 7585–7599, 2014 www.atmos-chem-phys.net/14/7585/2014/

Characterization of particulate matter emissions: T. R. Dallmann et al. 7595
Table 1.Fleet-average emission factors for HD diesel trucks (N = 293).
Species Emission factor±95 % Emission Emission factor Lubricating oilconfidence interval factor units ratio to OA elemental
emission factor weight fraction(ppm) (ppm)a
BC 0.62± 0.17 g kg−1
OA 0.24± 0.04 g kg−1
Zinc 0.26± 0.04 mg kg−1 1100± 250 1226Phosphorus/ 0.18± 0.02 mg kg−1 760± 160 985phosphate
a Lubricating oil elemental composition reported for an SAE 15W-40 CJ-4 diesel engine oil (Sappok and Wong, 2011).
Fleet-average emission factors for zinc and phospho-rus/phosphate are reported in Table 1. Fleet-average emis-sion factors for lubricant-derived elements are on the orderof 0.1–1 mg kg−1 and are nearly 3 orders of magnitude lowerthan OA and BC emission factors. Emission factors reportedhere agree to within a factor of 4 with emission factors de-rived from a near-roadway study at a freeway in Los Angeleswith high HD diesel truck activity (Ning et al., 2008). Emis-sion factor distributions for zinc and phosphorus/phosphate,shown in Fig. 7, were lognormal and similar to OA in theirdegree of skewness.
The ratio of each trace element emission factor to the fleet-average OA emission factor is presented in Table 1, alongwith the weight fraction of each element in a CJ-4 diesel en-gine oil as reported by Sappok and Wong (2011). Ratios de-fine the emission factor for a given species to the emissionfactor for OA, and reported units of ppm are equivalent tounits of ppm used for bulk lubricating oil weight fractions.In general, the measured emission factors for these elements,when normalized to the OA emission factor, correspond wellwith their bulk oil concentrations. For both zinc and phos-phorus/phosphate, OA normalized emissions are within 25 %of lubricant concentrations. Furthermore, the relative magni-tudes of emission factors for these trace species follow theirabundances in lubricating oil. These findings further supportthe conclusion that lubricating oil, rather than diesel fuel, wasthe dominant source of exhaust OA emissions for trucks op-erating in the Caldecott tunnel. If a large fraction of OA emis-sions were derived from unburned or partially oxidized fuel,emission factors for these trace elements would be expectedto be significantly lower when normalized to OA emissions.
3.4 Comparison of diesel and gasoline exhaust PM
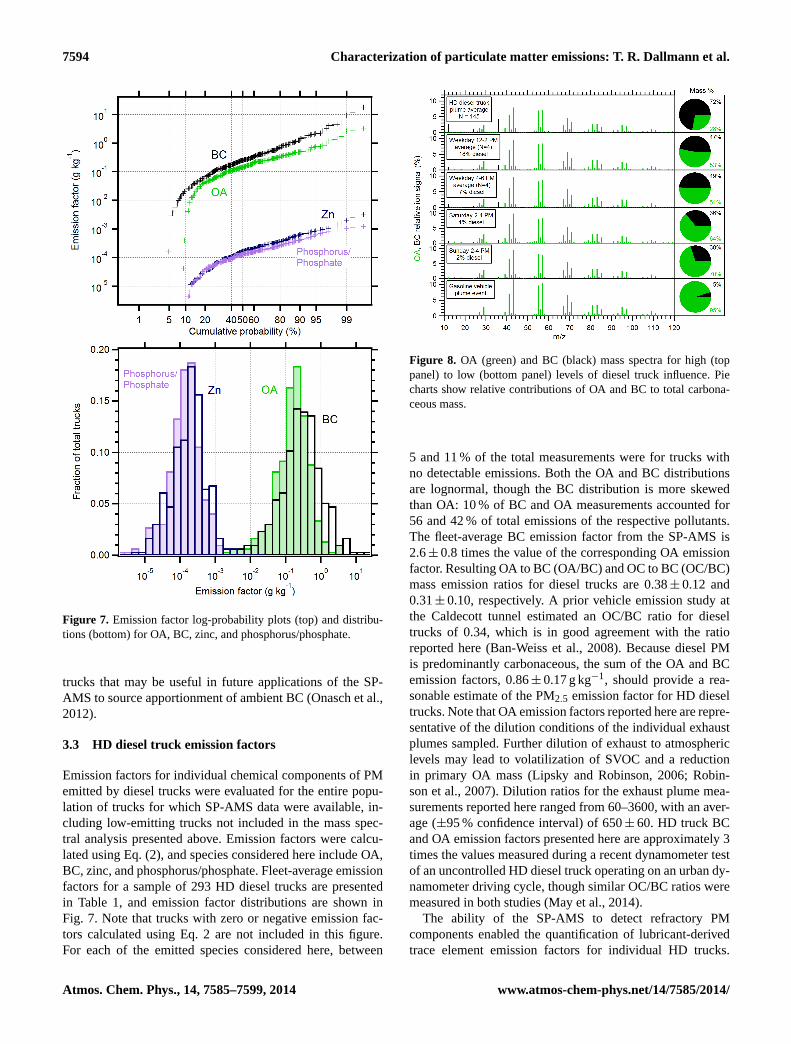
Differences in PM emitted by gasoline and diesel motor ve-hicles were studied through a comparison of the chemicalcomposition of carbonaceous aerosols measured in the tun-nel during periods of varying diesel truck influence. Fig-ure 8 shows the average BC and OA mass spectra and rel-ative mass concentrations for six different sampling peri-
ods/vehicle emission event types: individual diesel exhaustplume measurements (sample of 145 trucks considered formass spectral analysis, top panel); 4 weekday 12–2 p.m. and4–6 p.m. IOPs (second and third panels); the Saturday andSunday 2–4 p.m. IOPs (fourth and fifth panels); and a highPM-emitting gasoline vehicle (bottom panel). The panels arethus arranged from top to bottom in order of decreasingdiesel engine influence. The relative contribution of dieselengines to vehicle-derived carbon for each IOP was calcu-lated using measured CO2 concentrations and vehicle countdata, and is included in the label for each IOP in Fig. 8. Ingeneral, PM contributions from individual gasoline vehicleswere not discernible above tunnel background levels, and thedirect characterization of PM composition for a representa-tive sample ofindividual gasoline vehicle exhaust plumeswas not possible. In the case of the gasoline vehicle plumeevent shown in Fig. 8, a clear OA signal was associated withthe passing of a small truck. Concurrent time-resolved mea-surements of carbon monoxide, benzene, and toluene emis-sions support the conclusion that this high-emitting vehiclewas equipped with a gasoline engine.
A main feature of Fig. 8 is the increasing trend in theOA to BC mass ratio with decreasing diesel influence. Onaverage, diesel trucks were found to emit 2.6± 0.8 timesmore BC than OA, with a corresponding OA/BC ratio of0.38± 0.12. For weekday 12–2 p.m. and 2–4 p.m. samplingperiods, when diesel trucks accounted for between 7 and18 % of total vehicle-derived carbon dioxide emissions, con-centrations of OA and BC were similar (OA/BC = 1.1). TheOA/BC ratio further increased to 2.3 during the Sunday af-ternoon sampling period, when diesel trucks accounted for2 % of vehicle-derived carbon dioxide. For the high-emittinggasoline vehicle, PM emissions consisted primarily of OA.Fleet-average OA and BC emission factors for light-duty ve-hicles have been evaluated separately for this field campaign,and the corresponding OA/BC emission ratio was 1.7± 0.6(Dallmann et al., 2013). Thus, the increasing influence ofgasoline vehicles on the measured OA/BC ratio was observedin this study for weekend sampling periods when the influ-ence of diesel trucks was lower.
www.atmos-chem-phys.net/14/7585/2014/ Atmos. Chem. Phys., 14, 7585–7599, 2014

7596 Characterization of particulate matter emissions: T. R. Dallmann et al.
Table 2.Molar element ratios and OA/ OC mass ratios for on-road motor vehicle emissions.
Sampling period O/ C H/ C OA/ OC
HD Diesel truck plume average 0.06± 0.02 1.90± 0.05 1.24± 0.03(N = 145)Weekday 12–2 p.m. average 0.07± 0.04 1.89± 0.05 1.25± 0.05(N = 4)Weekday 4–6 p.m. average 0.06± 0.03 1.91± 0.04 1.24± 0.03(N = 4)Saturday 2–4 p.m. 0.09± 0.04 1.87± 0.07 1.28± 0.06Sunday 2–4 p.m. 0.10± 0.05 1.86± 0.08 1.30± 0.07High-emission gasoline vehicle 0.020± 0.003 1.99± 0.01 1.192± 0.004
Though relative contributions of BC and OA varied signif-icantly, there was very little difference in the correspondingmass spectra among sampling periods, as shown in Fig. 8.Here, the diesel truck BC and OA mass spectra are selectedas reference mass spectra. Black carbon mass spectra shownin Fig. 8 all have similar distributions of carbon ions, with theBC signal dominated by C+1 –C+
3 carbon ions in each case.Black carbon mass spectra across all sampling periods werehighly correlated (R2 > 0.99 in all cases) with the referencediesel truck spectrum shown in the top panel of Fig. 8. Re-sults from this study indicate that fuel-specific BC emissionfactors for diesel trucks are approximately 50 times greaterthan for LD gasoline vehicles (Dallmann et al., 2013). Con-sequently, diesel trucks contributed the majority of BC mea-sured during the weekday 12–2 p.m. and 4–6 p.m. samplingperiods, though HD trucks accounted for only 7–18 % ofvehicle-derived carbon dioxide. Thus, the high degree of cor-relation observed between the weekday IOPs and diesel truckBC mass spectra is expected. Even small numbers of dieseltrucks observed in the tunnel during the Sunday IOP stillmay have contributed significantly to measured BC, thoughin this case light-duty vehicles are expected to be the domi-nant source of BC in the tunnel. The correspondence of theBC mass spectra for the Sunday sampling period and high-emitting gasoline vehicle with the diesel truck mass spectrumtherefore suggests carbon ion distributions measured with theSP-AMS are similar for gasoline and diesel vehicle-derivedBC. This in turn suggests that apportionment of gasoline ver-sus diesel contributions to BC using SP-AMS carbon ionspectra may be difficult to achieve due to the similarity ofthe source profiles.
Similar to what was found for BC, varying levels of dieseltruck traffic did not produce discernible differences in OAmass spectra measured with the SP-AMS. All OA spectraare dominated by ion fragments of the CxH+
y family, withprominent peaks atm/z= 41, 43, 55, and 57. Organic aerosolmass spectra for the 2 hr weekday and weekend sampling pe-riods and the high-emitting gasoline vehicle were all well-correlated (R2 > 0.98) with the diesel truck OA mass spec-trum.
Average O / C, H / C, and OA / OC ratios are reported inTable 2, and were generally in good agreement across sam-pling periods considered here. The OA / OC and O / C ratioswere slightly higher during the Sunday IOP, possibly due toa higher relative contribution from more oxidized ambientPM during this sampling period. However, these differenceswere not significant and values are in line with prior charac-terizations of motor vehicle OA (Aiken et al., 2008). Theseresults show, for the fleet of in-use vehicles measured at theCaldecott tunnel, OA emitted by gasoline and diesel vehiclesproduces similar mass spectra when characterized using theSP-AMS. As discussed previously, several lines of evidenceindicate that lubricating oil was the dominant source of OAemitted by diesel trucks operating in the tunnel. Althoughthere are differences in lubricating oil formulations used ingasoline and diesel engines, the chemical composition of theoils is similar, and distinct from both gasoline and diesel fuel(Rogge et al., 1993; Fujita et al., 2007). The similarity of OAmass spectra for gasoline vehicle-dominated sampling peri-ods therefore suggests that a large fraction of OA emitted bygasoline vehicles is lubricant-derived as well. The high de-gree of similarity in the chemical composition of OA fromboth gasoline and diesel engines will again make it difficultto conduct ambient source apportionment studies to deter-mine contributions to air pollution from these two importantsources.
The Supplement related to this article is available onlineat doi:10.5194/acp-14-7585-2014-supplement.
Atmos. Chem. Phys., 14, 7585–7599, 2014 www.atmos-chem-phys.net/14/7585/2014/

Characterization of particulate matter emissions: T. R. Dallmann et al. 7597
Acknowledgements.The authors thank Drew Gentner, GabrielIsaacman, Berk Knighton, Steven DeMartini, and the Caltrans staffat the Caldecott tunnel for their assistance. This publication wasmade possible by EPA grant RD834553. Its contents are solely theresponsibility of the grantee and do not necessarily represent theofficial views of the EPA. Further, EPA does not endorse purchaseof commercial products or services mentioned herein.
Edited by: N. Riemer
References
Aiken, A. C., DeCarlo, P. F., and Jimenez, J. L.: Elemental analysisof organic species with electron ionization high-resolution massspectrometry, Anal. Chem., 79, 8350–8358, 2007.
Aiken, A. C., DeCarlo, P. F., Kroll, J. H., Worsnop, D. R., Huff-man, J. A., Docherty, K. S., Ulbrich, I. M., Mohr, C., Kim-mel, J. R., Sueper, D., Sun, Y., Zhang, Q., Trimborn, A., North-way, M., Ziemann, P. J., Canagaratna, M. R., Onasch, T. B., Al-farra, M. R., Prevot, A. S. H., Dommen, J., Duplissy, J., Met-zger, A., Baltensperger, U., and Jimenez, J. L.: O/ C and OM/OCratios of primary, secondary, and ambient organic aerosols withhigh-resolution time-of-flight aerosol mass spectrometry, Envi-ron. Sci. Technol., 42, 4478–4485, 2008.
Alfarra, M. R., Coe, H., Allan, J. D., Bower, K. N., Boudries, H.,Canagaratna, M. R., Jimenez, J. L., Jayne, J. T., Garforth, A. A.,Li, S.-M., and Worsnop, D. R.: Characterization of urban andrural organic particulate in the Lower Fraser Valley using twoAerodyne Aerosol Mass Spectrometers, Atmos. Environ., 38,5745–5758, 2004.
Allan, J. D., Delia, A. E., Coe, H., Bower, K. N., Alfarra, M. R.,Jimenez, J. L., Middlebrook, A. M., Drewnick, F., Onasch, T. B.,Canagaratna, M. R., Jayne, J. T., and Worsnop, D. R.: A gen-eralised method for the extraction of chemically resolved massspectra from Aerodyne aerosol mass spectrometer data, J.Aerosol Sci., 35, 909–922, 2004.
Ban-Weiss, G. A., McLaughlin, J. P., Harley, R. A., Lunden, M. M.,Kirchstetter, T. W., Kean, A. J., Strawa, A. W., Steven-son, E. D., and Kendall, G. R.: Long-term changes in emis-sions of nitrogen oxides and particulate matter from on-roadgasoline and diesel vehicles, Atmos. Environ., 42, 220–232,doi:10.1016/j.atmosenv.2007.09.049, 2008.
Ban-Weiss, G. A., Lunden, M. M., Kirchstetter, T. W., andHarley, R. A.: Size-resolved particle number and volumeemission factors for on-road gasoline and diesel motor vehi-cles, Aerosol Sci., 41, 5–12, doi:10.1016/j.jaerosci.2009.08.001,2010.
Bell, M. L., Ebisu, K., Peng, R. D., Samet, J. M., and Dominici, F.:Hospital admissions abd chemical composition of fine particleair pollution, Am. J. Respir. Crit. Care Med., 179, 1115–1120,doi:10.1164/rccm.200808-1240OC, 2009.
Brandenberger, S., Mohr, M., Grob, K., and Neukom, H. P.: Contri-bution of unburned lubricating oil and diesel fuel to particulateemission from passenger cars, Atmos. Environ., 39, 6985–6994,doi:10.1016/j.atmosenv.2005.07.042, 2005.
Brook, R. D., Rajagopalan, S., Pope III, C. A., Brook, J. R., Bhatna-gar, A., Diez-Roux, A. V., Holguin, F., Hong, Y., Luepker, R. V.,Mittleman, M. A., Peters, A., Siscovick, D., Smith, S. C., Whit-
sel, L., and Kaufman, J. D.: Particulate matter air pollution andcardiovascular disease. An update to the scientific statement fromthe American Heart Association, Circulation, 121, 2331–2378,doi:10.1161/CIR.0b013e3181dbece1, 2010.
Brugge, D., Durant, J. L., and Rioux, C.: Near-highway pollutantsin motor vehicle exhaust: a review of epidemiologic evidenceof cardiac and pulmonary health risks, Environ. Health, 6, 23,doi:10.1186/1476-069X-6-23, 2007.
Cadle, S. H., Mulawa, P. A., Ball, J., Donase, C., Weibel, A., Sage-biel, J. C., Knapp, K. T., and Snow, R.: Particulate emission ratesfrom in-use high-emitting vehicles recruited in Orange County,California, Environ. Sci. Technol., 31, 3405–3412, 1997.
Canagaratna, M. R., Jayne, J. T., Ghertner, D. A., Herndon, S., Shi,Q., Jimenez, J. L., Silva, P. J., Williams, P., Lanni, T., Drewnick,F., Demerjian, K. L., Kolb, C. E., and Worsnop, D. R.: Chasestudies of particulate emissions from in-use New York City vehi-cles, Aerosol Sci. Tech., 38, 555–573, 2004.
Canagaratna, M. R., Jayne, J. T., Jimenez, J. L., Allan, J. D., Al-farra, M. R., Zhang, Q., Onasch, T. B., Drewnick, F., Coe, H.,Middlebrook, A., Delia, A., Williams, L. R., Trimborn, A. M.,Northway, M. J., DeCarlo, P. F., Kolb, C. E., Davidovits, P., andWorsnop, D. R.: Chemical and microphysical characterization ofambient aerosols with the Aerodyne Aerosol Mass Spectrometer,Mass Spectrom. Rev., 26, 185–222, 2007.
Chirico, R., DeCarlo, P. F., Heringa, M. F., Tritscher, T., Richter, R.,Prévôt, A. S. H., Dommen, J., Weingartner, E., Wehrle, G.,Gysel, M., Laborde, M., and Baltensperger, U.: Impact of af-tertreatment devices on primary emissions and secondary or-ganic aerosol formation potential from in-use diesel vehicles: re-sults from smog chamber experiments, Atmos. Chem. Phys., 10,11545–11563, doi:10.5194/acp-10-11545-2010, 2010.
Chirico, R., Prevot, A. S. H., DeCarlo, P. F., Heringa, M. F.,Richter, R., Weingartner, E., and Baltensperger, U.: Aerosoland trace gas vehicle emission factors measured in a tun-nel using an Aerosol Mass Spectrometer and other on-line instrumentation, Atmos. Environ., 45, 2182–2192,doi:10.1016/j.atmosenv.2011.01.069, 2011.
Chow, J. C., Watson, J. G., Lowenthal, D. H., Chen, L. W. A., andMotallebl, N.: PM2.5 source profiles for black and organic carbonemission inventories, Atmos. Environ., 45, 5407–5414, 2011.
Cross, E. S., Sappok, A., Fortner, E. C., Hunter, J. F., Jayne, J. T.,Brooks, W. A., Onach, T. B., Wong, V. W., Trimborn, A.,Worsnop, D. R., and Kroll, J. H.: Real-time measurements ofengine-out trace elements: application of a novel soot particleaerosol mass spectrometer for emissions characterization, J. Eng.Gas Turb. Power, 134, 072801, doi:10.1115/1.4005992, 2012.
Dallmann, T. R. and Harley, R. A.: Evaluation of mobile sourceemission trends in the United States, J. Geophys. Res., 115,D14305, doi:10.1029/2010JD013862, 2010.
Dallmann, T. R., Harley, R. A., and Kirchstetter, T. W.: Effects ofdiesel particle filter retrofits and accelerated fleet turnover ondrayage truck emissions at the Port of Oakland, Environ. Sci.Technol., 45, 10773–10779, doi:10.1021/es202609q, 2011.
Dallmann, T. R., DeMartini, S. J., Kirchstetter, T. W., Hern-don, S. C., Onasch, T. B., Wood, E. C., and Harley, R. A.:On-road measurement of gas and particle phase pollutant emis-sion factors for individual heavy-duty diesel trucks, Environ. Sci.Technol., 46, 8511–8518, doi:10.1021/es301936c, 2012.
www.atmos-chem-phys.net/14/7585/2014/ Atmos. Chem. Phys., 14, 7585–7599, 2014
7598 Characterization of particulate matter emissions: T. R. Dallmann et al.
Dallmann, T. R., Kirchstetter, T. W., DeMartini, S. J., andHarley, R. A.: Quantifying on-road emissions from gasoline-powered motor vehicles: accounting for the presence of mediumand heavy-duty diesel trucks, Environ. Sci. Technol., 47, 13873–13881, doi:10.1021/es402875u, 2013.
DeCarlo, P. F., Kimmel, J. R., Trimborn, A., Northway, M. J.,Jayne, J. T., Aiken, A. C., Gonin, M., Fuhrer, K., Horvath, T.,Docherty, K. S., Worsnop, D. R., and Jimenez, J. L.: Field-deployable, high-resolution, time-of-flight aerosol mass spec-trometer, Anal. Chem., 78, 8281–8289, 2006.
Donahue, N. M., Robinson, A. L., Stanier, C. O., and Pan-dis, S. N.: Coupled partitioning, dilution, and chemical agingof semivolatile organics, Environ. Sci. Technol., 40, 2635–2643,2006.
Evans, J. S., Wolff, S. K., Phonboon, K., Levy, J. I., andSmith, K. R.: Exposure efficiency: an idea whose time has come,Chemosphere, 49, 1075–1091, 2002.
Freund, R., Wetzel, R., Shul, R., and Hayes, T.: Cross-section mea-surements for electron-impact ionization of atoms, Phys. Rev. A,41, 3575–3595, 1990.
Fujita, E. M., Zielinska, B., Campbell, D. E., Arnott, W. P., Sage-biel, J. C., Gabele, P. A., Crews, W., Snow, R., Clark, N. N.,Wayne, W. C., and Lawson, D. R.: Variations in speciated emis-sions from spark-ignition and compression-ignition motor vehi-cles in California’s South Coast Air Basin, J. Air Waste Manage.,57, 705–720, 2007.
Gerlofs-Nijland, M. E., Dormans, J. A. M. A., Bloemen, H. J. T.,Leseman, D. L. A. C., Boere, A. J. F., Kelley, F. J., Mud-way, I. S., Jimenez, A. A., Donaldson, K., Guastadisegni, C.,Janssen, N. A. H., Brunekreef, B., Sandstrom, T., van Bree, L.,and Cassee, F. R.: Toxicity of coarse and fine particulate matterfrom sites with contrasting traffic profiles, Inhal. Technol., 19,1055–1069, 2007.
Grieshop, A. P., Miracolo, M. A., Donahue, N. M., and Robin-son, A. L.: Constraining the volatility distribution and gas-particle partitioning of combustion aerosols using isothermal di-lution and thermodenuder methods, Environ. Sci. Technol., 43,4750–4756, 2009.
Isaacman, G., Wilson, K. R., Chan, A. W. H., Worton, D. R.,Kimmel, J. R., Nah, T., Hohaus, T., Gonin, M., Kroll, J. H.,Worsnop, D. R., and Goldstein, A. H.: Improved resolution of hy-drocarbon structures and constitutional isomers in complex mix-tures using gas chromatography-vacuum ultraviolet-mass spec-trometry, Anal. Chem., 84, 2335–2342, doi:10.1021/ac2030464,2012.
Jayne, J. T., Leard, D. C., Zhang, X., Davidovits, P., Smith, K. A.,Kolb, C. E., and Worsnop, D. R.: Development of an aerosolmass spectrometer for size and composition analysis of submi-cron particles, Aerosol Sci. Tech., 33, 49–70, 2000.
Jerrett, M., Burnett, R. T., Ma, R., Pope III, C. A., Krewski, D.,Newbold, K. B., Thurston, G., Shi, Y., Finkelstein, N., Calle, E.E., and Thun, M. J.: Spatial analysis of air pollution and mortalityin Los Angeles, Epidemiology, 16, 727–736, 2005.
Jimenez, J. L., Jayne, J. T., Shi, Q., Kolb, C. E., Worsnop, D. R.,Yourshaw, I., Seinfeld, J. H., Flagan, R. C., Zhang, X., Smith, K.A., Morris, J. W., and Davidovits, P.: Ambient aerosol samplingusing the Aerodyne aerosol mass spectrometer, J. Geophys. Res.,108, 8425, doi:10.1029/2001JD001213, 2003.
Kimmel, J. R., Farmer, D. K., Cubison, M. J., Sueper, D., Tanner,C., Nemitz, E., Worsnop, D. R., Gonin, M., and Jimenez, J. L.:Real-time aerosol mass spectrometry with millisecond resolu-tion, Int. J. Mass Spectrom., 303, 15–26, 2011.
Kittelson, D. B., Watts, W. F., and Johnson, J. P.: On-road and lab-oratory evaluation of combustion aerosols – Part 1: Summary ofdiesel engine results, Aerosol Sci., 37, 913–930, 2006.
Kleeman, M. J., Riddle, S. G., Robert, M. A., and Jakober, C. A.:Lubricating oil and fuel contributions to particulate matter emis-sions from light-duty gasoline and heavy-duty diesel vehicles,Environ. Sci. Technol., 42, 235–242, 2008.
Kweon, C. B., Okada, S., Foster, D. E., Bae, M. S., andSchauer, J. J.: Effect of engine operating conditions on particle-phase organic compounds in engine exhaust of a heavy-duty,direct-injection (DI) diesel engine, SAE Technical Paper Series,2003-01-0342, 73–89, 2003.
Lapuerta, M., Hernandez, J. J., Ballesteros, R., and Duran, A.: Com-position and size of disel particulate emissions from a commer-cial European engine tested with present and future fuels, P. I.Mech. Eng. D.-J. Aut., 217, 907–919, 2003.
Lipsky, E. M. and Robinson, A. L.: Effects of dilution on fine parti-cle mass and partitioning of semivolatile organics in diesel ex-haust and wood smoke, Environ. Sci. Technol., 40, 155–162,2006.
Maricq, M. M.: Chemical characterization of particulate emissionsfrom diesel engines: a review, Aerosol Sci., 38, 1079–1118,2007.
Marshall, J. D., Teoh, S., and Nazaroff, W. W.: Intake fraction ofnonreactive vehicle emissions in US urban areas, Atmos. Envi-ron., 39, 1363–1371, 2005.
Massoli, P., Fortner, E. C., Canagaratna, M. R., Williams, L. R.,Zhang, Z., Sun, Y., Schwab, J. J., Trimborn, A., Onasch, T. B.,Demerjian, K. L., Kolb, C. E., Worsnop, D. R., and Jayne, J. T.:Pollution gradients and chemical characterization of particulatematter from vehicular traffic near major roadways: results fromthe 2009 Queens College Air Quality Study in NYC, AerosolSci. Tech., 46, 1201–1218, 2012.
Matthew, B. M., Middlebrook, A. M., and Onasch, T. B.: Collectionefficiencies in an Aerodyne aerosol mass spectrometer as a func-tion of particle phase for laboratory generated aerosols, AerosolSci. Tech., 42, 884–898, 2008.
May, A. A., Presto, A. A., Hennigan, C. J., Nguyen, N. T., Gordon,T. D., and Robinson, A. L.: Gas-particle partitioning of primaryorganic aerosol emissions: (1) gasoline vehicle exhaust, Atmos.Environ, 77, 128–139, doi:10.1016/j.atmosenv.2013.04.060,2013.
May, A. A., Nguyen, N. T., Presto, A. A., Gordon, T. D., Lip-sky, E. M., Karve, M., Guitierrez, A., Robertson, W. H., Zhang,M., Chang, O., Chen, S., Cicero-Fernandez, P., Fuentes, M.,Huang, S.-M., Ling, R., Long, J., Maddox, C., Massetti, J.,McCauley, E., Na, K., Pang, Y., Rieger, P., Sax, T., Truong,T., Vo, T., Chattopadhyay, S., Maldonado, H., Maricq, M. M.,and Robinson, A. L.: Primary gas and PM emissions fromlight and heavy duty vehicles, Atmos. Environ., 88, 247–260,doi:10.1016/j.atmosenv.2014.01.046, 2014.
McLafferty, F. W. and Turecek, F.: Interpretation of Mass Spectra,University Science Books, Mill Valley, CA, 1993.
Mohr, C., Huffman, J. A., Cubison, M. J., Aiken, A. C.,Docherty, K. S., Kimmel, J. R., Ulbrich, I. M., Hannigan, M.,
Atmos. Chem. Phys., 14, 7585–7599, 2014 www.atmos-chem-phys.net/14/7585/2014/
Characterization of particulate matter emissions: T. R. Dallmann et al. 7599
and Jimenez, J. L.: Characterization of primary organic aerosolemissions from meat cooking, trash burning, and motor vehicleswith high-resolution aerosol mass spectrometry and comparisonwith ambient and chamber observations, Environ Sci. Technol.,43, 2443–2449, 2009.
Mozejko, P. and Sanche, L.: Cross sections for electron scatter-ing from selected components of DNA and RNA, Radiat. Phys.Chem., 73, 77–84, doi:10.1016/j.radphyschem.2004.10.001,2005.
Ning, Z., Polidori, A., Schauer, J. J., and Sioutas, C.: Emission fac-tors of PM species based on freeway measurements and compar-ison with tunnel and dynamometer studies, Atmos. Environ., 42,3099–3114, doi:10.1016/j.atmosenv.2007.12.039, 2008.
Onasch, T. B., Trimborn, A., Fortner, E. C., Jayne, J. T., Kok, G. L.,Williams, L. R., Davidovits, P., and Worsnop, D. R.: Soot particleaerosol mass spectrometer: development, validation, and initialapplication, Aerosol Sci. Tech., 46, 804–817, 2012.
Pankow, J. F.: An absorption model of gas/particle partitioningof organic compounds in the atmosphere, Atmos. Environ., 28,185–188, 1994.
Pope, C. A. and Dockery, D. W.: Health effects of fine particulate airpollution: lines that connect, J. Air Waste Manage., 56, 709–742,2006.
Pottie, R. F.: Cross sections for ionization by electrons. I. Absoluteionization cross sections of Zn, Cd, and Te2. II. Comparison oftheoretical with experimental values for atoms and molecules, J.Chem. Phys., 44, 916–922, doi:10.1063/1.1726842, 1966.
Robinson, A. L., Donahue, N. M., Shrivastava, M. K.,Weitkamp, E. A., Sage, A. M., Grieshop, A. P., Lane, T. E.,Pierce, J. R., and Pandis, S. N.: Rethinking organic aerosols:semivolatile emissions and photochemical aging, Science, 315,1259–1262, 2007.
Robinson, A. L., Grieshop, A. P., Donahue, N. M., and Hunt, S. W.:Updating the conceptual model for fine particle mass emissionsfrom combustion systems, J. Air Waste Manage., 60, 1204–1222,2010.
Rogge, W. F., Hildemann, L. M., Mazurek, M. A., and Cass, G. R.:Sources of fine aerosol. 2. Noncatalyst and catalyst-equipped au-tomobiles and heavy-duty diesel trucks, Environ. Sci. Technol.,27, 636–651, 1993.
Roth, C. M., Goss, K., and Schwarzenbach, R. P.: Sorption ofa diverse set of organic vapors to diesel soot and road tunnelaerosols, Environ. Sci. Technol., 39, 6632–6637, 2005.
Sakurai, H., Tobias, H. J., Park, K., Zarling, D., Docherty, K. S.,Kittelson, D., McMurry, P., and Ziemann, P. J.: On-line measure-ments of diesel nanoparticle composition and volatility, Atmos.Environ., 37, 1199–1210, 2003.
Salcedo, D., Laskin, A., Shutthanandan, V., and Jimenez, J. L.: Fea-sibility of the detection of trace elements in particulate matterusing online high-resolution aerosol mass spectrometry. AerosolSci. Tech., 46, 1187–1200, doi:10.1080/02786826.2012.701354,2012.
Sappok, A. and Wong, V.: Lubricant-derived ash proper-ties and their effects on diesel particulate filter pressuredrop performance, J. Eng. Gas Turb. Power, 133, 032805,doi:10.1115/1.4001944, 2011.
Schauer, J. J., Kleeman, M. J., Cass, G. R., and Simoneit, B. R.T.: Measurement of emissions from air pollutant sources 5, C1-C32 organic compounds from gasoline-powered motor vehicles,Environ. Sci. Technol.,36, 1169–1180, doi:10.1021/es0108077,2002.
Shah, S. D., Cocker, D. R., Miller, J. W., and Norbeck, J. M.: Emis-sion rates of particulate matter and elemental and organic car-bon from in-use diesel engines, Environ. Sci. Technol., 38, 2544–2550, doi:10.1021/es0350583, 2004.
Shields, L. G., Suess, D. T., and Prather, K. A.: Determination ofsingle particle mass spectral signatures from heavy-duty dieselvehicle emissions for PM2.5 source apportionment, Atmos. Env-iron., 41, 3841–3852, 2007.
Slowik, J. G., Stainken, K., Davidovits, P., Williams, L. R.,Jayne, J. T., Kolb, C. E., Worsnop, D. R., Rudich, Y., De-Carlo, P. F., and Jimenez, J. L.: Particle morphology and densitycharacterization by combined mobility and aerodynamic diame-ter measurements. Part 2: Application to combustion-generatedsoot aerosols as a function of fuel equivalence ratio, Aerosol Sci.Tech., 38, 1206–1222, doi:10.1080/027868290903916, 2004.
Sonntag, D. B., Bailey, C. R., Fulper, C. R., and Baldauf, R. W.:Contribution of lubricating oil to particulate matter emissionsfrom light-duty gasoline vehicles in Kansas City, Environ. Sci.Technol., 46, 4191–4199, 2012.
Spencer, M. T., Shields, L. G., Sodeman, D. A., Toner, S. M., andPrather, K. A.: Comparison of oil and fuel particle chemical sig-natures with particle emissions from heavy and light duty vehi-cles, Atmos. Environ., 40, 5224–5235, 2006.
Spikes, H.: The history and mechanisms of ZDDP, Tribol. Lett., 17,469–489, 2004.
Tawara, H. and Kato, T.: Total and partial ionization cross sectionsof atoms and ions by electron impact, Atom. Data Nucl. Data, 36,167–353, 1987.
Tobias, H. J., Beving, D. E., Ziemann, P. J., Sakurai, H., Zuk, M.,McMurry, P., Zarling, D., Waytulonis, R., and Kittleson, D. B.:Chemical analysis of diesel engine nanoparticles using a nano-DMA/thermal desorption particle beam mass spectrometer, Env-iron. Sci. Technol., 35, 2233–2243, 2001.
Tornehed, P. and Olofsson, U.: Lubricant ash particles in diesel en-gine exhaust. Literature review and modeling study, P. I. Mech.Eng. D.-J. Aut., 255, 1055–1066, 2011.
Worton, D. R., Isaacman, G., Gentner, D. R., Dallmann, T. R.,Chan, A. W. H., Kirchstetter, T. W., Wilson, K. R., Harley, R. A.,and Goldstein, A. H.: Lubricating oil dominates primary organicaerosol emissions from motor vehicles, Environ. Sci. Technol.,48, 3698–3706, doi:10.1021/es405375j, 2014.
www.atmos-chem-phys.net/14/7585/2014/ Atmos. Chem. Phys., 14, 7585–7599, 2014