characterizing the biochemical and toxicological effects ... · (oncorhynchus mykiss) aux agnps ou...
TRANSCRIPT
Characterizing the biochemical and toxicological effects of nanosilver
in vivo using zebrafish (Danio rerio) and
in vitro using rainbow trout (Oncorhynchus mykiss)
by
Andrey Massarsky
Thesis submitted to the
Faculty of Graduate and Postdoctoral Studies
University of Ottawa
In partial fulfillment of the requirements for the
PhD degree in the
Ottawa-Carleton Institute of Biology
Thèse soumise à la
Faculté des Études Supérieurs et Postdoctorales
Université d’Ottawa
En vue de la réalisation partielle du doctorat à
L’Institut de Biologie Ottawa-Carleton
©Andrey Massarsky, Ottawa, Canada, 2014
ii
This dissertation is dedicated in loving memory of my grandmother Valentina Tulina. I
am eternally grateful for her efforts to ensure my academic success from the first day I
started school. I have no doubt that she is smiling from up above as I acquire my PhD.

iii
Acknowledgments
It is hard to believe that five years of graduate studies have passed by so quickly.
There are many people, whom I would like to thank from the bottom of my heart for
everything they have done for me throughout my journey as a graduate student. First and
foremost I would like to thank my supervisor Dr. Thomas W. Moon for ever so patiently
instilling in me the love for scientific research. His outstanding guidance and mentoring
throughout the years have not only opened my eyes to the vast research tools, but also
dramatically improved my abilities to think critically and write and present scientific
knowledge. My accomplishments would have been impossible without Dr. Moon, and for
this I will forever be indebted to him. Secondly, I would like to express my sincere
gratitude to my co-supervisor Dr. Vance L. Trudeau, who despite having multiple
students in his own lab, always found the time to inquire about my progress and make
valuable suggestions pertaining to my experiments. Dr. Trudeau also played a pivotal role
in reviewing all of my manuscripts, often pointing out things that were missed by other
editors, thus ensuring the high quality of the final product.
Furthermore, I would like to extend my thanks to my committee members: Drs. Jules
Blais, William Willmore, and Paul White, for stimulating discussions that helped to
shape this thesis into an interesting narrative. I would also like to recognize the input of
many collaborators and colleagues, including Dr. Chris Metcalfe, Dr. Greg Goss, Dr.
Azam Tayabali, Kathy Nguyen, and Dr. Antoine Morin. Special thanks also go to Bill
Fletcher and Vishal Saxena for taking excellent care of the fish facility and ensuring that
my experiments ran as smoothly as possible.
iv
I would like to express my gratitude to the Department of Biology personnel. Dr.
John Basso always had a great advice when I was in doubt, including his
recommendation to pursue an Honors project with Dr. Moon. Moreover, my numerous
teaching assistantships with Dr. Basso have not only taught me a great deal of
microbiology and molecular biology techniques, but also improved my skills to instruct
undergraduate students. Lise Belanger and Yves Genest helped tremendously with the
organization of my mini-courses, which were my summer highlights for the past three
years. Finally, Doreen Smith, Isabelle Morissette, and Gita Kangas booked my numerous
committee meetings and processed a myriad of documents and contracts.
I would also like to acknowledge my labmates over the past five years, who shaped
my PhD studies into an unforgettable adventure. These include Dr. Shahram Eisa-Beygi,
Aziz Al-Habsi, Dr. Paul M. Craig, Kim Mitchell, Marilyn Vera Chang, Rand Pasha,
Pamela Stroud, and Rance Nault. I was also fortunate to supervise very talented
undergraduate students: Lisa Dupuis, Jessica Taylor, Ren Abraham, Laura Strek, and
Justine Labarre, who contributed to the progress of my research.
Finally, I would like to thank my family: my parents Elena and Michael, for their
spiritual and generous financial support during my studies; my brother Alexey, for all the
encouragement and great stress-relieving squash matches; my grandparents Lyudmila and
Rudolf, who showed a lot of support from Germany; my in laws Pier and Letty, for their
support and great company on Friday-gym evenings. Lastly, I would like thank my
beautiful wife Cintia for putting up with my workaholic tendencies for the past five years
and comforting me on the days when everything seemed hopeless.

v
Abstract
Many consumer and medical products contain engineered nanomaterials (ENMs) due
to their unique properties arising from their small size of <100 nm in at least one
dimension. Although ENMs could greatly improve the quality of daily life, concerns for
their health and environmental safety emerged in recent years because the same
properties that make ENMs beneficial may also render them toxic. The small size allows
ENMs’ entrance into the cell where they may attach to biological molecules and
membranes, disrupting their function and/or leading to oxidative stress and/or damage.
This thesis focused on silver nanoparticles (AgNPs). Several articles demonstrated
that during washing AgNPs are released from the AgNP-impregnated fabrics and could
pose a risk to aquatic species. Given that the toxicity mechanisms of AgNPs are yet to be
clearly understood this thesis investigated the effects of AgNPs from ‘oxidative stress’
and ‘endocrine disruption’ points of view, using both in vivo and in vitro model fish
systems.
A 4 d exposure of zebrafish (Danio rerio) embryos to AgNPs increased mortality,
delayed hatching, and increased oxidative stress. The silver ion (Ag+) was more effective
in eliciting these effects at equivalent silver concentrations. Moreover, the Ag-chelator
cysteine reduced the toxicity of both Ag-types. Despite these effects AgNPs or Ag+ did
not affect the ability of zebrafish larvae or adults (raised to adulthood in Ag-free water) to
increase cortisol levels, but there were differential effects on the expression of
corticotropin-releasing factor (CRF)-related genes, suggesting that other physiological
processes regulated by CRF may be impacted.

vi
Furthermore, a 48 h exposure of rainbow trout (Oncorhynchus mykiss) erythrocytes
and hepatocytes to AgNPs or Ag+ increased oxidative stress, but Ag
+ was more potent.
Moreover, AgNPs elevated lipid peroxidation, while Ag+ increased DNA damage,
suggesting different modes of action for the two Ag-types. Cysteine treatment reduced
the toxicity of Ag+ and AgNPs, while buthionine sulfoximine, which inhibits glutathione
synthesis, increased it, suggesting the importance of glutathione in silver toxicity. Finally,
AgNPs increased glycogenolysis in trout hepatocytes independently of the -
adrenoreceptor or the glucocorticoid receptor.

vii
Résumé
Plusieurs produits de consommation et produits médicaux contiennent les
nanomatériaux fabriqués (ENMs) à cause de leur propriétés spéciales attribuées à leur
petite taille de <100 nm dans au moins une dimension. Les ENMs peuvent améliorer la
qualité de la vie courante; cependant, des craintes concernant leur sécurité sont
récemment apparues, car les propriétés rendant les ENMs bénéfiques peuvent aussi les
rendre toxiques. Leur petite taille leur permet d’accéder les cellules où ils peuvent
s’adhérer aux molécules et membranes biologiques, dérangeant leur fonction et/ou
menant au stress oxydant.
Cette dissertation centre sur les nanoparticules d’argent (AgNPs). C’était démontré
que certains produits relâchent les AgNPs pouvant poser des risques aux espèces
aquatiques. Les mécanismes de la toxicité des AgNPs ne sont pas encore bien connus,
donc cette dissertation illustre les effets oxydatifs et endocriniens des AgNPs chez les
poissons en utilisant les modelés in vivo et in vitro.
L’exposition des embryons de poisson zèbre (Danio rerio) aux AgNPs pendant 4
jours a mené à la mortalité, à l’éclosion retardée et au stress oxydant. L’ion d’argent
(Ag+) était plus efficace à provoquer ces effets. En plus, le chélateur d’Ag cystéine a
réduit la toxicité des deux types d’argent. Malgré ces effets, les AgNPs et l’Ag+ n’ont pas
influencé la capacité des larves de poisson zèbre ou les poissons adultes (élevés sans
argent) à augmenter le niveau du cortisol. Cependant, l’expression des gènes associés à la
corticolibérine était affectée, suggérant que d’autres processus physiologiques régulés par
la corticolibérine pourraient être affectés.

viii
De plus, l’exposition des érythrocytes et des hépatocytes de truite arc-en-ciel
(Oncorhynchus mykiss) aux AgNPs ou au Ag+ pendant 48 heures a augmenté le niveau de
stress oxydant, où l’Ag+ était plus efficace. Aussi, les AgNPs ont augmenté la
peroxydation des lipides, tandis que l’Ag+ a augmenté les dommages à l’ADN, suggèrent
que les deux types d’argent ont des mécanismes différents. La cystéine a réduit et le
buthionine sulfoximine (inhibe la synthèse du glutathion) a augmenté la toxicité des
AgNPs et Ag+, suggérant l’importance du glutathion à la toxicité d’argent. Les AgNPs
ont aussi augmenté la glycogénolyse chez les hépatocytes indépendamment du récepteur
adrénergique ou du récepteur des glucocorticoïdes.
ix
Table of Contents
Acknowledgments ............................................................................................................ iii
Abstract ...............................................................................................................................v
Résumé ............................................................................................................................. vii
Table of Contents ............................................................................................................. ix
List of Figures ................................................................................................................. xiii
List of Tables ....................................................................................................................xx
List of Abbreviations .................................................................................................... xxii
Chapter 1: General Introduction .....................................................................................1
1.1. Rationale for the study ..................................................................................................2
1.2. What are nanomaterials? ...............................................................................................2
1.3. Silver nanoparticles (AgNPs) as antimicrobial agent ...................................................4
1.4. AgNP production ..........................................................................................................6
1.5. AgNP release into the environment ..............................................................................7
1.6. Environmental fate of AgNPs .....................................................................................10
1.7. Toxicity of AgNPs in fish ...........................................................................................13
1.8. Proposed mechanisms of ENM toxicity .....................................................................15
1.8.1. Overview ...........................................................................................................15
1.8.2. ROS generation and oxidative stress ................................................................16
1.8.3. Dissolution ........................................................................................................17
1.8.4. Endocrine disruption .........................................................................................18
1.9. Model systems ............................................................................................................19
1.9.1. Zebrafish ...........................................................................................................19
1.9.2. Rainbow trout erythrocytes and hepatocytes ....................................................21
1.10. Thesis hypotheses and objectives .............................................................................22
Chapter 2: Assessment of nanosilver toxicity during zebrafish (Danio rerio)
development ......................................................................................................................29
2.1. Introduction .................................................................................................................30
2.2. Materials and methods ................................................................................................32
2.2.1. Silver nanoparticles (AgNPs) and silver nitrate (AgNO3) ................................32
2.2.2. Characterization of AgNPs ...............................................................................32

x
2.2.3. Zebrafish embryo collection .............................................................................33
2.2.4. Experimental set-up ..........................................................................................34
2.2.5. Embryo toxicity analysis ..................................................................................35
2.2.6. Reactive oxygen species (ROS) generation ......................................................36
2.2.7. Glutathione levels .............................................................................................37
2.2.8. Antioxidant enzymes activities .........................................................................37
2.2.9. Statistical analysis .............................................................................................38
2.3. Results .........................................................................................................................39
2.3.1. Characterization of AgNPs ...............................................................................39
2.3.2. Zebrafish embryo mortality, hatching, heart rate, and abnormalities ...............39
2.3.3. ROS generation and antioxidant levels .............................................................40
2.4. Discussion ...................................................................................................................57
Chapter 3: Acute embryonic exposure to nanosilver or silver ion does not disrupt
the stress response in zebrafish (Danio rerio) larvae and adults .................................62
3.1. Introduction .................................................................................................................63
3.2. Materials and methods ................................................................................................66
3.2.1. Silver nanoparticles (AgNPs) and silver nitrate (AgNO3) ................................66
3.2.2. Experimental set-up ..........................................................................................66
3.2.3. Adult zebrafish tissue collection .......................................................................67
3.2.4. Lipid extraction .................................................................................................68
3.2.5. Cortisol, cholesterol, and triglycerides assays ..................................................69
3.2.6. Total RNA extraction and cDNA synthesis ......................................................69
3.2.7. Quantitative RT-PCR analysis ..........................................................................69
3.2.7.1. Zebrafish larvae ...................................................................................69
3.2.7.2. Zebrafish adults ...................................................................................70
3.2.8. Statistical analysis .............................................................................................71
3.3. Results .........................................................................................................................72
3.3.1. Embryo and adult zebrafish parameters ...........................................................72
3.3.2. Cortisol, cholesterol, and triglycerides .............................................................72
3.3.3. Transcript abundance ........................................................................................73
3.4. Discussion ...................................................................................................................87

xi
Chapter 4: Nanosilver cytotoxicity in rainbow trout (Oncorhynchus mykiss)
erythrocytes and hepatocytes ..........................................................................................93
4.1. Introduction .................................................................................................................94
4.2. Materials and methods ................................................................................................96
4.2.1. Silver nanoparticles (AgNPs) and silver nitrate (AgNO3) ................................96
4.2.2. Characterization of AgNPs ...............................................................................96
4.2.3. Fish ...................................................................................................................98
4.2.4. Erythrocyte and hepatocyte isolation ................................................................98
4.2.5. Experimental set-up ..........................................................................................99
4.2.6. Cell viability analysis .....................................................................................100
4.2.7. Reactive oxygen species (ROS) generation ....................................................101
4.2.8. Glutathione levels ...........................................................................................102
4.2.9. Antioxidant enzymes activities .......................................................................102
4.2.10. Lipid peroxidation (TBARS) ........................................................................103
4.2.11. DNA damage ................................................................................................103
4.2.12. Protein carbonyl ............................................................................................104
4.2.13. Cellular uptake of AgNPs .............................................................................105
4.2.14. Statistical analysis .........................................................................................105
4.3. Results .......................................................................................................................106
4.3.1. Characterization of AgNPs .............................................................................106
4.3.2. Cytotoxicity of AgNP and Ag+ .......................................................................107
4.3.3. ROS generation ...............................................................................................108
4.3.4. Glutathione levels ...........................................................................................108
4.3.5. Antioxidant enzymes activities .......................................................................110
4.3.6. Cellular damage in hepatocytes ......................................................................111
4.3.7. Cellular uptake of AgNPs into hepatocytes ....................................................113
4.4. Discussion .................................................................................................................139
Chapter 5: Silver nanoparticles stimulate glycogenolysis in rainbow trout
(Oncorhynchus mykiss) hepatocytes .............................................................................148
5.1. Introduction ...............................................................................................................149
5.2. Materials and methods ..............................................................................................152
xii
5.2.1. Silver nanoparticles (AgNPs) .........................................................................152
5.2.2. Experimental set-up ........................................................................................153
5.2.3. Cell viability analysis .....................................................................................154
5.2.4. Glucose production .........................................................................................155
5.2.5. Cellular glycogen content ...............................................................................155
5.2.6. Cortisol in the medium ...................................................................................156
5.2.7. Glycogen phosphorylase (GPase) activity (EC 2.4.1.1) .................................156
5.2.8. Phosphoenolpyruvate carboxykinase (PEPCK) activity (EC 4.1.1.49) ..........157
5.2.9. Fructose-1,6-bisphosphatase (FBPase) activity (EC 3.1.3.11) .......................157
5.2.10. Activities of aminotransferases .....................................................................157
5.2.11. Adenosine 3’,5’-cyclic monophosphate (cAMP) content ............................158
5.2.12. Statistical analysis .........................................................................................159
5.3. Results .......................................................................................................................159
5.3.1. Cell viability analysis .....................................................................................159
5.3.2. Glucose production .........................................................................................159
5.3.3. Cellular glycogen content ...............................................................................160
5.3.4. Cortisol in the medium ...................................................................................160
5.3.5. Glycogen phosphorylase (GPase) activity ......................................................161
5.3.6. Activities of gluconeogenic enzymes .............................................................161
5.3.7. cAMP content .................................................................................................161
5.4. Discussion .................................................................................................................174
Chapter 6: General discussion and conclusions ..........................................................180
6.1. Evidence for silver nanoparticle toxicity in fish .......................................................181
6.2. Exposure to AgNPs results in toxicity and oxidative stress .....................................182
6.3. AgNPs do not disrupt the stress response in zebrafish .............................................186
6.4. AgNPs impact hormone-regulated cell signaling in hepatocytes .............................188
6.5. Contributions this work has made to the literature ...................................................189
6.6. Summary ...................................................................................................................191
References .......................................................................................................................199
Appendix .........................................................................................................................218
xiii
List of Figures
Chapter 1: General Introduction .....................................................................................1
Figure 1.1. Number of reported consumer products that contain ENMs between
2005 and 2013. ‘Total’ refers to the number of consumer products that contain any
ENMs (y = 200.13x – 401,093; r2 = 0.97). ‘AgNPs’ refers to the number of
consumer products that contain only AgNPs (y = 52.385x – 105,053; r2 = 0.99). The
data are derived from http://www.nanotechproject.org. .............................................25
Figure 1.2. Flow of AgNPs from products into various compartments in Switzerland
(A) and the US (B). The top number is based on the estimated usage of AgNPs in
tons per annum (t/a) and the bottom number in brackets refers to the percentage that
a given amount represents. ‘WIP’ signifies ‘waste incineration plant’. ‘STP’ signifies
‘sewage treatment plant’. ‘Other’ refers to reuse, export, and dissolution. Dashed
arrows were used to clarify the flows if the arrows were crossing each other.
Modified from Mueller et al. (2008) and Gottschalk et al. (2009) .............................27
Figure 1.3. The antioxidant system considered in this thesis. Reactive oxygen
species (ROS) include the superoxide anion (O2˙-), hydrogen peroxide (H2O2), and
hydroxyl radical (OH˙). The antioxidants include the enzymes superoxide dismutase
(SOD), catalase (CAT), glutathione peroxidase (GPx), glutathione reductase (GR),
glutathione-S-transferase (GST), and the tripeptide glutathione (GSH; reduced form),
which is converted to its oxidized form (GSSG) upon reaction with ROS ................28
Chapter 2: Assessment of nanosilver toxicity during zebrafish (Danio rerio)
development ......................................................................................................................29
Figure 2.1. Characterization of Vive Nano AgNPs used in this study. A. Dynamic
Light Scattering (DLS) results of a 10 µg/mL AgNP solution prepared in egg water.
Data are presented as Mean + SD (n = 10). B,C. Scanning Transmission Electron
Microscope (STEM) results of a 10 µg/mL AgNP solution prepared in MilliQ water.
Photos were captured from transmission electron diffraction (TED) (B) and back
scattering of electrons (C) ...........................................................................................46
Figure 2.2. Mortality of zebrafish exposed to various Ag+ or AgNP concentrations in
the presence or absence of cysteine (Cys) until 4 dpf. A. Mortality of zebrafish
embryos after 96 hpf is presented as a percentage of those embryos that died. Data
are presented as Mean + SEM (n = 7-15). Three-way ANOVA with post- hoc Holm-
Sidak method was used to assess statistical differences (see Table 2.1). B. Probit
analysis was used to determine the LC50 values for Ag+ and AgNP based on the
mortality data. The r2 values are 0.96 and 0.75 for Ag
+ and AgNP, respectively..... .48
Figure 2.3. Hatching success and heart rate of zebrafish exposed to various Ag+ or
AgNP concentrations in the presence or absence of cysteine (Cys) until 4 dpf. A.
Hatching success of zebrafish embryos at 48 hpf is presented as a percentage of total
xiv
live embryos (n = 7-15). B. Heart rate of zebrafish embryos at 48 hpf (n = 8-17).
Data are presented as Mean + SEM in both graphs. Three-way ANOVA with post-
hoc Holm-Sidak method was used to assess statistical differences (see Table 2.1) ...50
Figure 2.4. Adsorption of AgNPs to the chorion of the zebrafish embryo at 24 hpf.
The representative images are shown for A. Control embryos; B. Embryos exposed
to AgNPs (1.55 μg/mL) in the presence of cysteine (Cys; 8.8 μM); C. Embryos
exposed to AgNPs (1.55 μg/mL) in the presence of Cys (4.4 μM); D. Embryos
exposed to AgNPs (1.55 μg/mL) in the absence of Cys .............................................52
Figure 2.5. Reactive oxygen species (ROS) generation in zebrafish exposed to
various Ag+ or AgNP concentrations until 3 dpf. Bright field images are displayed in
panels A, C, E, G, and I, whereas panels B, D, F, H, and J display the same images
using the GFP filter. The representative images from three different experiments are
shown for (A and B) Control embryo; (C and D) Embryo exposed to 0.03 μg/mL
Ag+; (E and F) Embryo exposed to 0.31 μg/mL Ag
+; (G and H) Embryo exposed to
0.03 μg/mL AgNP; (I and J) Embryo exposed to 0.31 μg/mL AgNP. The percentage
on each of the fluorescent images refers to the percentage of embryos displaying the
phenotype displayed on the image. K. The fluorescence data were quantified using a
scoring system (ROS-score), such that a score of 1 was assigned if the image
resembled the majority of the controls and 2 if it did not. Data are presented as Mean
+ SEM. The asterisk indicates statistical differences between the exposed and the
control embryos. One-way ANOVA was used to assess statistical differences (P ≤
0.050) ..........................................................................................................................54
Figure 2.6. Glutathione levels in zebrafish exposed to various Ag+ or AgNP
concentrations in the presence or absence of cysteine (Cys) until 4 dpf. A. Total
glutathione (TGSH = GSH + 2GSSG) levels. B. Oxidized glutathione (GSSG) levels.
C. Ratio of GSSG to TGSH. Data are presented as Mean + SEM (n = 4-9). Three-
way ANOVA with post-hoc Holm-Sidak method was used to assess statistical
differences (see Table 2.1) ..........................................................................................56
Chapter 3: Acute embryonic exposure to nanosilver or silver ion does not disrupt
the stress response in zebrafish (Danio rerio) larvae and adults .................................62
Figure 3.1. Zebrafish stress response experimental set-up. Embryos were exposed to
Ag+ or AgNPs until 4 dpf. The larvae were then 1) euthanized, or 2) stressed and
euthanized, or 3) raised to adulthood in Ag-free water and then 1) euthanized, or 2)
stressed and euthanized. Whole larvae and adult plasma and brain samples were used
for cortisol and gene expression analyses ...................................................................77
Figure 3.2. Photomicrograph of the zebrafish brain regions: telencephalon (tel),
optic lobe (OL), cerebellum (C), and medulla (M). The excised area is shown by the
red oval. ......................................................................................................................78

xv
Figure 3.3. Mortality and hatching of zebrafish exposed to Ag+ (0.05 µg/mL) or
AgNP (0.5 µg/mL) in the presence or absence of cysteine (Cys) until 4 dpf. A.
Mortality of zebrafish embryos after 96 hpf is presented as a percentage of those
embryos that died. B. Hatching success of zebrafish embryos at 56 hpf is presented
as a percentage of total live embryos. Data are presented as Mean + SEM (n = 5-17
and 4-16 for mortality and hatching, respectively). Capital and small letters indicate
differences within treatments in the absence and presence of cysteine (Cys),
respectively. The asterisks indicate differences between Cys-treated and non-treated
embryos within the same treatment. Two-way ANOVA with post-hoc Holm-Sidak
method was used to assess statistical differences (P ≤ 0.050) ....................................80
Figure 3.4. Adult zebrafish mass at the end of the experiment (10 months) that were
treated with Ag+ or AgNP as embryos until 4 dpf (see Fig. 3.3 for details). Data are
presented as Mean + SEM (n = 4). Capital and small letters indicate differences
within treatments in the absence and presence of cysteine (Cys), respectively. Two-
way ANOVA with post-hoc Holm-Sidak method was used to assess statistical
differences (P ≤ 0.050). Inset: linear regression analysis of the fish mass as a
function of the average number of fish per tank: (1) control, (2) control (+Cys), (3)
AgNPs, (4) AgNPs (+Cys), (5) Ag+, (6) Ag
+ (+Cys). Data are presented as Mean ±
SEM (n = 4). The r2 and P values are 0.81 and 0.015, respectively; the equation of
the line is y = -0.0287x + 1.0382 ................................................................................81
Figure 3.5. Whole-body cortisol levels in unstressed and stressed zebrafish larvae (4
dpf) following exposure to Ag+ or AgNP until 4 dpf (see Fig. 3.3 for details). Data
are presented as Mean + SEM (n = 3-9). Capital and small letters indicate differences
within treatments in unstressed and stressed larvae, respectively. The asterisks
indicate differences between stressed and unstressed larvae within the same
treatment. Two-way ANOVA with post-hoc Holm-Sidak method was used to assess
statistical differences (P ≤ 0.050) ...............................................................................82
Figure 3.6. Plasma cortisol levels in unstressed and stressed male and female adult
zebrafish (10 months) that were treated with Ag+ or AgNP as embryos until 4 dpf
(see Fig. 3.3 for details). Data are presented as Mean + SEM (n = 4). Three-way
ANOVA with post-hoc Holm-Sidak method was used to assess statistical differences
(see Table 3.2) ............................................................................................................83
Figure 3.7. Transcript abundance within the HPI axis in 4 dpf zebrafish larvae
following exposure to Ag+ or AgNP until 4 dpf (see Fig. 3.3 for details): CRF, CRF-
BP, CRF-R2, and POMCb. Transcript abundance was normalized to the control
group (see section 3.2.7 for details). Data are presented as Mean + SEM (n = 7). The
letters indicate differences in transcript abundance between treatments for a specific
gene. One way-ANOVA with post-hoc Holm-Sidak method was used to assess
statistical differences (P ≤ 0.050) ...............................................................................84

xvi
Figure 3.8. Transcript abundance within the HPI axis in 10 month old male (A) and
female (B) zebrafish that were treated with Ag+ or AgNP as embryos until 4 dpf (see
Fig. 3.3 for details): CRF, CRF-BP, and CRF-R1. Transcript abundance was
normalized to the control group (see section 3.2.7 for details). Data are presented as
Mean + SEM (n = 4). The letters indicate differences in transcript abundance
between treatments for a specific gene. One way-ANOVA with post-hoc Holm-
Sidak method was used to assess statistical differences (P ≤ 0.050) ..........................86
Chapter 4: Nanosilver cytotoxicity in rainbow trout (Oncorhynchus mykiss)
erythrocytes and hepatocytes ..........................................................................................93
Figure 4.1. Characterization of Vive Nano AgNPs used in this study (part I).
Dynamic Light Scattering (DLS) was used to determine: (A) size distribution of
AgNPs (31 g/mL) prepared in culture medium (Means + SD; n = 10), and (B) zeta
()-potential of AgNPs prepared in water and culture medium at various
concentrations (Means + SEM; n = 4). Scanning Transmission Electron Microscope
(STEM) was used to confirm DLS results; a 10 g/mL solution of AgNPs was
prepared in water and photos were captured from transmission electron diffraction
(TED) (C) ..................................................................................................................123
Figure 4.2. Characterization of Vive Nano AgNPs used in this study (part II). Light
microscopy images (A-P) of AgNPs (31 g/mL) were taken after a 48 h incubation
period in water or culture medium in the presence or absence of cysteine (Cys)
and/or buthionine sulfoximine (BSO). Images E-H and M-P are 10x magnified
versions of images A-D and I-L, respectively. UV-VIS spectroscopy measurements
of AgNPs (31 g/mL) in different media are presented in Q-R as Means + SEM (n =
5). The absorbance of AgNPs was measured in water after 2 and 48 h (Q and R,
respectively) and in culture medium after 2 and 48 h (S and T, respectively). The
symbols ‘C’ and ‘B’ in the image headings and panel Q legend refer to Cys and
BSO, respectively .....................................................................................................125
Figure 4.3. Cytotoxicity in trout erythrocytes exposed to various Ag+ or AgNP
concentrations in the presence or absence of cysteine (Cys) for 48 h. Cytotoxicity
was assessed by (A) lactate dehydrogenase (LDH) leakage and (B) hemolysis assays.
Positive control (C+) was a combination of H2O2 and CuSO4 both at 1 mM. The
results are expressed as fold-change above control (no Ag) values. Data are
presented as Mean + SEM (n = 11-13). Three-way ANOVA with post-hoc Holm-
Sidak method was used to assess statistical differences (see Table 4.1 and the results
section) ......................................................................................................................127
Figure 4.4. Cytotoxicity in trout hepatocytes exposed to various Ag+ or AgNP
concentrations in the presence or absence of cysteine (Cys) and in the absence (A)
and presence (B) of buthionine sulfoximine (BSO). Cytotoxicity was assessed using
LDH leakage assay. Positive control (C+) was a combination of H2O2 and CuSO4

xvii
both at 1 mM and was only used in absence of BSO. Negative control (C-) refers to
BSO non-treated cells. The results are expressed as fold-change above control
values. Data are presented as Mean + SEM (n = 5-13). Three-way ANOVA with
post-hoc Holm-Sidak method was used to assess statistical differences (see Table 4.2
and the results section) ..............................................................................................129
Figure 4.5. Generation of reactive oxygen species in trout hepatocytes exposed to
various Ag+ or AgNP concentrations in the presence or absence of cysteine (Cys)
and in the absence (A) and presence (B) of buthionine sulfoximine (BSO). Positive
control (C+) was a combination of H2O2 and CuSO4 at 1 mM and was only used in
absence of BSO. Negative control (C-) refers to BSO non-treated cells. The results
are expressed as fold-change above control values. Data are presented as Mean +
SEM (n = 5-7). Three-way ANOVA with post-hoc Holm-Sidak method was used to
assess statistical differences (see Table 4.2 and the results section). .......................131
Figure 4.6. Glutathione levels in trout erythrocytes exposed to various Ag+ or AgNP
concentrations in the presence or absence of cysteine (Cys) for 48 h. A. Total
glutathione (TGSH) levels. B. Oxidized glutathione (GSSG) levels. C. GSSG:TGSH
ratio. Positive control (C+) was a combination of H2O2 and CuSO4 both at 1 mM.
Data are presented as Mean + SEM (n = 4-8). Three-way ANOVA with post-hoc
Holm-Sidak method was used to assess statistical differences (see Table 4.1 and the
results section) ..........................................................................................................133
Figure 4.7. Glutathione levels in trout hepatocytes exposed to various Ag+ or AgNP
concentrations in the presence or absence of cysteine (Cys) and/or buthionine
sulfoximine (BSO) for 48 h. (A and D) Total glutathione (TGSH) levels. (B and E)
Oxidized glutathione (GSSG) levels. (C and F) GSSG:TGSH ratio. Positive control
(C+) was a combination of H2O2 and CuSO4 both at 1 mM and was only used in
absence of BSO. Negative control (C-) refers to BSO non-treated cells. Data are
presented as Mean + SEM (n = 4-9). Three-way ANOVA with post-hoc Holm-Sidak
method was used to assess statistical differences (see Table 4.2 and the results
section) ......................................................................................................................135
Figure 4.8. Cellular damage in trout hepatocytes exposed to various Ag+ or AgNPs
concentrations in the presence or absence of cysteine (Cys) and/or buthionine
sulfoximine (BSO) for 48 h. (A and D) Lipid peroxidation (TBARS). (B and E)
DNA damage (Soluble DNA). (C and F) Protein carbonyl. The positive control (C+)
was a combination of H2O2 and CuSO4 at 1 mM and was only used in the absence of
BSO. Negative control (C-) refers to BSO non-treated cells. Data are presented as
Mean + SEM (n = 4-7). Three-way ANOVA with post-hoc Holm-Sidak method was
used to assess statistical differences (see Table 4.2 and the results section) ............137
Figure 4.9. Transmission Electron Microscope (TEM) micrographs of trout
hepatocytes exposed to Ag+ or AgNPs for 48 h: control (A, E, I, M), AgNPs at
xviii
3.1μg/mL (B, F, J, N), AgNPs at 23.3 μg/mL (C, G, K, O), and Ag+ at 15.5 μg/mL
(D, H, L, P) in the absence (A-H) or presence (I-P) of cysteine. See section 4.2.13 for
details. Differences are indicated with arrows ..........................................................138
Chapter 5: Silver nanoparticles stimulate glycogenolysis in rainbow trout
(Oncorhynchus mykiss) hepatocytes .............................................................................148
Figure 5.1. Cytotoxicity in trout hepatocytes exposed to AgNPs for 48 h in the
presence or absence of agonists/antagonists: (A) propranolol (PROP), isoproterenol
(ISO) and a combination of both, or (B) mifepristone (MIFE), cortisol (CORT) and a
combination of both. Cytotoxicity was assessed using lactate dehydrogenase (LDH)
leakage. The results are expressed as fold-change relative to the control values. Data
are presented as Mean + SEM (n = 5-13). No statistical differences exist ...............165
Figure 5.2. Glucose levels in the medium of trout hepatocytes exposed to AgNPs for
48 h in the presence or absence of agonists/antagonists: (A) propranolol (PROP) and
isoproterenol (ISO), or (B) mifepristone (MIFE) and cortisol (CORT). Data are
presented as Mean + SEM (n = 5-13). The letters indicate significant differences
within the same AgNP concentration; the asterisk (*) indicates significant
differences between the 10 g/mL AgNP and control (0 AgNPs) groups within the
same treatment; and, the pound sign (#) indicates overall significant differences
between the 10 g/mL AgNP and control (0 AgNPs) groups. Two-way ANOVA
with post-hoc Holm-Sidak method was used to assess statistical differences (P ≤
0.050) ........................................................................................................................167
Figure 5.3. Glycogen levels in trout hepatocytes exposed to AgNPs for 48 h in
presence of (A) propranolol (PROP) and isoproterenol (ISO), or (B) mifepristone
(MIFE) and cortisol (CORT). Data are presented as Mean + SEM (n = 5-14). See
legend to Figure 5.2 for details pertaining to statistical differences .........................169
Figure 5.4. Cortisol levels in the medium of trout hepatocytes exposed to AgNPs for
48 h in the presence or absence of mifepristone (MIFE) and/or cortisol (CORT).
Data are presented as Mean + SEM (n = 5-14). The letters indicate significant
differences within the same AgNP concentration. Two-way ANOVA with post-hoc
Holm-Sidak method was used to assess statistical differences (P ≤ 0.050) .............170
Figure 5.5. Glycogen phosphorylase (GPase) activities in trout hepatocytes exposed
to AgNPs for 48 h: (A) total GPase activity, (B) GPase a activity, and (C) percentage
activation of GPase a in absence or presence of propranolol (PROP) or isoproterenol
(ISO). Data are presented as Mean + SEM (n = 4-9). See legend to Figure 5.2 for
details pertaining to statistical differences ................................................................172
Figure 5.6. cAMP levels in trout hepatocytes exposed to AgNPs for 48 h in the
presence of propranolol (PROP) and isoproterenol (ISO). Data are presented as
Mean + SEM (n = 3). The letters indicate significant differences within the same
AgNP concentration and an asterisk indicates significant differences compared to the

xix
same treatment in the control (0 AgNPs) group. Two-way ANOVA with post-hoc
Holm-Sidak method was used to assess statistical differences (P ≤ 0.050) .............173
Chapter 6: General discussion and conclusions ..........................................................180
Figure 6.1. Total number of publications including the keywords ‘nanomat*’ and
‘toxic*’ and ‘silver’ published between 2001 and 2013. The search was performed
using the Web of Science database on January 8th
, 2014 .........................................193
Figure 6.2. One possible mechanism for AgNP- and Ag+-mediated cytotoxicity is
through generation of reactive oxygen species (ROS). This thesis suggests that in
trout hepatocytes AgNP generates ROS extracellularly (or in close proximity to the
cell membrane) while Ag+ does so intracellularly (near or inside the nucleus),
leading to lipid peroxidation and DNA damage, respectively. The antioxidant system
of trout erythrocytes (ery) and hepatocytes (hep) was affected as summarized in
green boxes (see Chapter 4). The antioxidants include reduced glutathione (GSH),
glutathione-S-transferase (GST), glutathione reductase (GR), glutathione peroxidase
(GPx), catalase (CAT), and superoxide dismutase (SOD). Parameters that were not
affected are signified as ‘na’. ....................................................................................195
Figure 6.3. The increase in AgNP-mediated glucose production in trout hepatocytes
could be mediated by the -adrenergic receptor (-AR) and the glucocorticoid
receptor (GCR) through glycogenolysis and gluconeogenesis, respectively. AgNPs
(10 g/mL) increased glucose release, decreased glycogen content, and increased
glycogen phosphorylase (GPase) a activity, but did not affect the levels of the second
messenger cAMP and did not increase the activities of gluconeogenic enzymes,
suggesting that the effects are independent of -AR or GCR (see Chapter 5). Another
mechanism to increase GPase a activity would be through Ca2+
-calmodulin
signaling, which could be mediated by 1-AR and possibly increased Ca2+
influx into
the cell; this should be addressed in future experiments ..........................................197
Figure 6.4. AgNPs could reach the sewage treatment plant (STP) after being
released from various consumer products. Most AgNPs in the STP accumulate in the
sludge (bold arrows), which can be used in agriculture and possibly pose a risk to
organisms in the soil. The remaining AgNPs will be released into aquatic
environment, where most AgNPs will accumulate in the sediment with a small
percentage being present in the water column, suggesting that benthic organisms
may be at a greater risk than pelagic organisms (most studies to date, including the
ones described herein, focused on pelagic fish species). Future studies should
consider both the ingestion and waterborne chronic exposure scenarios using both in
vivo and in vitro approaches. Note: the images used to generate this figure were
obtained from ClipArt Word 2010 ...........................................................................198

xx
List of Tables
Chapter 1: General Introduction .....................................................................................1
Table 1.1. Predicted environmental concentrations (PECs) of AgNPs. The PECs in
surface water, sediment, and sludge-treated soil are presented by year based on the
increase in AgNP-containing consumer products and AgNP production. See
footnotes as well as sections 1.4 and 1.5 for more details ..........................................24
Chapter 2: Assessment of nanosilver toxicity during zebrafish (Danio rerio)
development ......................................................................................................................29
Table 2.1. Summary of statistical analysis (P-values). Three-way ANOVA with
post-hoc Holm-Sidak method was used to assess statistical differences (P ≤ 0.050) on
data found in Figures 2.2, 2.3, 2.6 and Table 2.2. The three factors were Ag-type, Ag
concentration, and cysteine (Cys). ‘NS’ denotes ‘not significant’. ............................42
Table 2.2. Activities of antioxidant enzymes in zebrafish exposed to various Ag+ or
AgNP concentrations in the presence or absence of cysteine (Cys) until 4 dpf. The
activities of catalase (CAT), glutathione reductase (GR), glutathione peroxidase
(GPx), and superoxide dismutase (SOD) were assessed in 96 hpf larvae. Data are
presented as Mean ± SEM (n = 8-13 for Cys non-treated embryos and 3-4 for Cys-
treated embryos). Three-way ANOVA with post-hoc Holm-Sidak method was used
to assess statistical differences (see Table 2.1) ...........................................................44
Chapter 3: Acute embryonic exposure to nanosilver or silver ion does not disrupt
the stress response in zebrafish (Danio rerio) larvae and adults .................................62
Table 3.1. Primer sequences and amplicon sizes for the genes of interest used for
larval and adult zebrafish gene expression analysis ...................................................74
Table 3.2. Summary of statistical analysis (P-values). Three-way ANOVA with
post-hoc Holm-Sidak method was used to assess statistical differences (P ≤ 0.050) on
data found in Figure 3.6. The three factors were treatment (control, AgNP, Ag+), sex,
and stress. ‘NS’ denotes not significant ......................................................................75
Chapter 4: Nanosilver cytotoxicity in rainbow trout (Oncorhynchus mykiss)
erythrocytes and hepatocytes ..........................................................................................93
Table 4.1. Summary of statistical analysis (P-values) in erythrocytes. Three-way
ANOVA with post-hoc Holm-Sidak method was used to assess statistical differences
(P ≤ 0.050) on data found in Figures 4.3, 4.6 and Table 4.3. The three factors were
Ag-type, Ag concentration, and cysteine (Cys). ‘NS’ denotes ‘not significant’ .....114
Table 4.2. Summary of statistical analysis (P-values) in hepatocytes. Three-way
ANOVA with post-hoc Holm-Sidak method was used to assess statistical differences
(P ≤ 0.050) on data found in Figures 4.4, 4.5, 4.7, 4.8 and Table 4.4. The three

xxi
factors were Ag-type, Ag concentration, and cysteine (Cys). ‘NS’ denotes ‘not
significant’ ................................................................................................................116
Table 4.3. Activities of antioxidant enzymes in rainbow trout erythrocytes after a 48
h exposure to various Ag+ or AgNP concentrations in the presence or absence of
cysteine (Cys). The activities of glutathione-S-transferase (GST), glutathione
reductase (GR), glutathione peroxidase (GPx), catalase (CAT), and superoxide
dismutase (SOD) were assessed. Data are presented as Mean ± SEM (n = 3-6).
Three-way ANOVA with post-hoc Holm-Sidak method was used to assess statistical
differences (see Table 4.1 and the results section) ...................................................118
Table 4.4. Activities of antioxidant enzymes in rainbow trout hepatocytes after a 48
h exposure to various Ag+ or AgNP concentrations in the presence or absence of
cysteine (Cys) and/or buthionine sulfoximine (BSO). The activities of glutathione-S-
transferase (GST), glutathione reductase (GR), glutathione peroxidase (GPx),
catalase (CAT), and superoxide dismutase (SOD) were assessed. Silver
concentrations that were not assessed in BSO experiments are signified by ‘n/a’.
Data are presented as Mean ± SEM (n = 5-7). Three-way ANOVA with post-hoc
Holm-Sidak method was used to assess statistical differences (see Table 4.2 and the
results section) ..........................................................................................................120
Chapter 5: Silver nanoparticles stimulate glycogenolysis in rainbow trout
(Oncorhynchus mykiss) hepatocytes .............................................................................148
Table 5.1. Activities of gluconeogenic enzymes: phosphoenolpyruvate
carboxykinase (PEPCK), fructose-1,6-bisphosphatase (FBPase), alanine
aminotransferase (ALT), aspartate aminotransferase (AST), and tyrosine
aminotransferase (TYT), in trout hepatocytes exposed to AgNPs for 48 h. The
agonists/antagonists of the -adrenergic and glucocorticoid receptors included
propranolol (PROP), isoproterenol (ISO), mifepristone (MIFE), and cortisol
(CORT); control cells are indicated as ‘None’. The activities are expressed in
nmol/min/mg protein. Data are presented as Mean ± SEM (n = 3-4). Statistical
differences are indicated with letters. Two-way ANOVA with post-hoc Holm-Sidak
method was used to assess statistical differences (P ≤ 0.050) ..................................163

xxii
List of Abbreviations
ACTH Adrenocorticotropic hormone
Ag+
Silver ion
AgNO3 Silver nitrate
AgNPs Silver nanoparticles
-KG -ketoglutarate
ALT Alanine aminotransferase
ANOVA Analysis of variance
AST Aspartate aminotransferase
-AR -adrenoreceptor
BCA Bicinchoninic acid
BSA Bovine serum albumin
BSO Buthionine sulfoximine
C Cerebellum
cAMP Adenosine 3’,5’-cyclic monophosphate
CAT Catalase
CORT Cortisol
CRF Corticotropin-releasing factor
CRF-BP Corticotropin-releasing factor binding protein
CRF-R1 and R2 Corticotropin-releasing factor receptors 1 and 2
Cys Cysteine
DAG Diacylglycerol
DCHF-DA 2’7’-dichlorodihydrofluorescin diacetate
DLS Dynamic Light Scattering
DNPH 2,4-dinitrophenylhydrazine
dpf Days post fertilization
DTNB 5,5’-dithiobis(2-nitrobenzoic acid)
Eh Redox state
ENMs Engineered nanomaterials
ETC Electron-transport chain
FA Fulvic acid
FBPase Fructose-1,6-bisphosphatase
GCR Glucocorticoid receptor
GFP Green fluorescent protein
GPase Glycogen phosphorylase
GPx Glutathione peroxidase
GR Glutathione reductase
GSH Reduced glutathione
GSSG Oxidized glutathione

xxiii
GST Glutathione-S-transferase
H2O2 Hydrogen peroxide
HA Humic acid
HEK Human epidermal keratinocyte
hpf Hours post fertilization
HPI Hypothalamic-pituitary-interrenal
HPT Hypothalamic-pituitary-thyroid
IP3 Inositol-1,4,5-triphosphate
ISO Isoproterenol
LDH Lactate dehydrogenase
M Medulla
MIFE Mifepristone
NMs Nanomaterials
NOM Natural organic matter
NP Nanoparticle
NS Not significant
O2·- Superoxide anion
OH· Hydroxyl radical
OL Optic lobe
PBDE Polybrominated diphenyl ether
PCA Perchloric acid
PDI Polydispersity index
PECs Predicted environmental concentrations
PEPCK Phosphoenolpyruvate carboxykinase
PIP2 Phosphatidylinositol-4,5-bisphosphate
PKA Protein kinase A
PLC Phospholipase-C
PLP Pyridoxal phosphate
POMC Pro-opiomelanocortin
PROP Propranolol
PVP Polyvinylpyrrolidone
RFU Relative fluorescence unit
RIA Radioimmunoassay
ROS Reactive oxygen species
SD Standard deviation
SEM Standard error of the mean
SOD Superoxide dismutase
STEM Scanning Transmission Electron Microscope
STP Sewage treatment plant
t/a Tons per annum

xxiv
TBARS Thiobarbituric acid reactive substance
TCA Trichloroacetic acid
TED Transmission electron diffraction
tel Telencephalon
TEM Transmission Electron Microscope
TGSH Total glutathione
TiO2NPs Titanium dioxide nanoparticles
TYT Tyrosine aminotransferase
WIP Waste incineration plant
WWTP Wastewater treatment plant
-potential Zeta-potential

1
CHAPTER 1
General Introduction
2
1.1. Rationale for the study
Silver nanoparticles (AgNPs) are incorporated into many consumer and medical
products due to their antimicrobial properties. The potential environmental risk of AgNPs
is yet to be fully understood. The aquatic organisms are of particular concern since water
bodies often serve as sinks for anthropogenic activities. Oxidative stress has been
proposed by the scientific literature as one of the toxicity mechanisms for engineered
nanomaterials (ENMs) including AgNPs. On the other hand, ENM-mediated endocrine
disruption as a potential toxicity mechanism received much less attention despite the
demonstrated ability of ENMs to attach to cell membranes and other cellular components,
thus disrupting their physiological function. Therefore, this thesis aimed to investigate the
toxicity mechanisms of AgNPs in fish using both in vivo (zebrafish) and in vitro (rainbow
trout erythrocytes and hepatocytes) models with the ultimate goal of improving the
understanding of the toxic potential of AgNPs. To set up the stage for the studies
described in this thesis the literature on ENMs is summarized in the following sections
and the final section specifies the hypotheses and objectives.
1.2. What are nanomaterials?
‘Nanomaterials’ (NMs) are small particles with at least one dimension of less than
100 nm (Oberdörster et al., 2005; Seetharam and Sridhar, 2007) or nanostructures
embedded within larger materials (CCA, 2008). Anthropogenic NMs include (1)
incidental NMs, such as diesel/gasoline by-products (carbon black, soot) of power-
generating plants and petroleum-powered engines, and (2) ENMs, which are designed for
a specific function (Oberdörster et al., 2007) and are the focus of this thesis. There are

3
also natural NMs, such as viruses and materials generated in forest fires and volcanic
eruptions (Oberdörster et al., 2005).
Engineered nanomaterials possess unique properties attributed to their size, shape,
chemical composition, surface structure and charge, solubility, and coating (Nel et al.,
2006; Oberdörster et al., 2007). The two main characteristics that make ENMs unique,
are their small size and high surface area to volume ratio; their small size allows for
increased uptake and interaction with biological systems (Oberdörster et al., 2005, 2007;
Nel et al., 2006, 2009; Fischer and Chan, 2007), whereas the high surface area to volume
ratio permits unique catalytic and oxidative reactions on the ENM surface (Nel et al.,
2006, 2009; Fischer and Chan, 2007; Auffan et al., 2009). Other properties of ENMs,
especially coating, are important determinants of their behavior and toxicity potential
(Scown et al., 2010a).
The unique properties of ENMs are applicable in many domains, including optics,
engineering, electronics, alternative energy, soil and water remediation, and consumer
products (Oberdörster et al., 2007; Handy et al., 2008). In fact, as of October 2013 there
were 1628 reported consumer products that contained ENMs, including cosmetics, tooth-
pastes, antimicrobial and anti-stain coatings, clothing, children toys, and sporting goods
(Nanotechproject, 2013). Nanotechnology can also be applied in medicine (i.e.
nanomedicine), where ENMs could be used for drug-delivery and diagnostic purposes, as
well as investigation and understanding of molecular processes and structures
(Oberdörster et al., 2005; Nel et al., 2006). For example, a sensitive nanosensor chip for
the detection of early cancer biomarkers was recently developed (Nanotech News, 2009),
and hybrids of biomaterials (e.g. enzymes, antigens, antibodies, receptors) and ENMs
4
could be designed to regulate biochemical pathways by DNA binding and
inhibition/activation of transcription/translation, and even detect single-mismatches in
DNA sequences (Schmid, 2004).
Nanotechnology is rapidly gaining popularity and its global market was valued at
$20.1 billion in 2011 and is expected to double by 2017 (BCC, 2012). Recent studies
reporting adverse effects of ENMs in various organisms (as discussed in this thesis), have
raised safety concerns for the general public and governments around the world. The
investigation of biochemical and toxicological effects of AgNPs described in this thesis
arises from the decision in 2006 by the Organization for Economic Co-operation and
Development to coordinate research on the toxicity of ENMs. As part of this international
initiative Canada agreed to research the toxicity of titanium dioxide and silver
nanoparticles. More specifically, Dr. Chris Metcalfe from Trent University,
Peterborough, ON, Canada, received a grant and collaborated with my supervisors (and
other researchers) to carry out research on nanotoxicity (see section 6.5 for more details).
1.3. Silver nanoparticles (AgNPs) as antimicrobial agent
Silver nanoparticles are the most commonly used ENM and as of October 2013 were
incorporated into 383 reported consumer and medical products, including clothing,
appliances, wound dressings, and utensils (Nanotechproject, 2013). Their prevalent use is
due to the antimicrobial properties of silver that have been known since the ancient times
when silver vessels were used to disinfect water and wine (Yu et al., 2013). Similarly,
early Americans (European immigrants) used silver coins to disinfect stored water. Prior
to the 1800s silver was used to treat several infections, wounds, and ulcers (Chernousova
5
and Epple, 2013). The use of silver nitrate (AgNO3) emerged in the late 19th
century to
treat eye infections, and in the mid-20th
century AgNO3 was discovered as an effective
treatment for burn wounds (Fong and Wood, 2006). More recently, nanotechnology has
improved the efficacy of silver as an antimicrobial agent through the synthesis and the
subsequent incorporation of the AgNPs into various products (Kim et al., 2007;
Chernousova and Epple, 2013).
The bactericidal activity of AgNPs is attributed to the release of silver ion (Ag+) and
nano-specific effects of AgNPs. It is known that AgNPs in wound dressings allow a
controlled release of Ag+ into the wound (Fong and Wood, 2006). Ag
+ interacts strongly
with thiol groups, thus inactivating important enzymes, including the ones involved with
electron-transport chain and DNA replication (Morones, et al., 2005; Gordon et al.,
2010). In addition, Ag+ denatures DNA and RNA (Fong and Wood, 2006) and leads to
DNA condensation (Feng et al., 2000), ultimately affecting DNA replication and RNA
translation. Ag+ can also bind to electron donor groups, especially phosphorus and
sulphur, in DNA and proteins, making them unavailable for various cellular processes
(Clement and Jarrett, 1994). Furthermore, the Ag+-mediated generation of reactive
oxygen species (ROS) has also been reported (Foldbjerg et al., 2009; Gordon et al.,
2010). In addition to the release of Ag+, AgNPs damage the bacterial cell by attaching to
the cell membrane, disrupting its proper function (Sharma et al., 2009), and generating
ROS, which further damage the cell membrane and intracellular components (Hwang et
al., 2008; Foldbjerg et al., 2009). The broad-spectrum bactericidal action of AgNPs is
effective against Gram negative and Gram positive strains, as well as drug-resistant
bacteria (Lara et al., 2010). The antiviral capacity of AgNPs against human

6
immunodeficiency virus type 1 (Elechiguerra et al., 2005) and hepatitis B virus (Lu et al.,
2008) has also been reported.
1.4. AgNP production
To date only a few articles have estimated the production of AgNPs (and other
ENMs). Such information is essential to predict the environmental concentrations and
thus the risk associated with AgNPs (and other ENMs). Mueller and Nowack (2008)
estimated the global production of AgNPs at 500 tons per annum (t/a). This estimate is
based on the global production of silver (25,620 t/a), of which 95% is used for jewellery,
photography, and industrial applications, suggesting that a maximum of 5% (1230 t/a)
could be directed towards the production of AgNPs.
Schmid and Riediker (2008) estimated the production of AgNPs (and six other
ENMs), but only in industries of Switzerland. The study surveyed 197 Swiss companies.
Forty three companies were identified as ENM producers (or users), of which 15
companies produced (or used) AgNPs. The AgNPs production (or use) was estimated at
3.1 t/a among these surveyed Swiss companies. In comparison, the production (or use)
for titanium dioxide nanoparticles (TiO2NPs) was estimated at 435 t/a based on this
survey.
Hendren et al. (2011) estimated the production of AgNPs (and four other ENMs) in
the US. Ten companies that produced AgNPs were identified within the US, whose lower
and upper limits for AgNP production were estimated at 2.8-20 t/a. In comparison, the
production limits for TiO2NPs in the US were estimated at 7800-38,000 t/a. Similarly,
Piccinno et al. (2012) estimated the production of AgNPs (and nine other ENMs)

7
worldwide and specifically in Europe. Companies and institutions within the
nanomaterial industrial sector were identified and surveyed. The results showed that
AgNPs are produced in moderate quantities of 0.6-55 and 5.5-550 t/a in Europe and
worldwide, respectively. In comparison, TiO2NP production was estimated at 55-3000
and 550-5500 t/a in Europe and worldwide, respectively.
It is noteworthy that although AgNPs accounted for 24% of the total reported
consumer products containing ENMs in 2013 (Nanotechproject, 2013), they are not the
most produced ENMs. This may change, however, as there has been a 15-fold increase in
the number of reported consumer products containing AgNPs between 2006 (~25
products) and 2013 (383 products) (Nanotechproject, 2013). Moreover, the linear
increase in the number of reported consumer products containing AgNPs can be
described by the equation y = 52.385x – 105,053, where y corresponds to the number of
products and x is the year (Fig. 1.1). Assuming that the increase of AgNP-containing
products is maintained at the same rate (~52 products/year), I predict that by 2020 there
would be 765 consumer products with AgNPs (Table 1.1). It is likely that the increase in
AgNP-containing products would lead to a proportional increase in AgNP production.
Therefore, it is possible that 12.2-1216 tons of AgNPs would be produced in 2020 (Table
1.1), assuming the current worldwide production of 5.5-550 t/a estimated by Piccinno et
al. (2012).
1.5. AgNP release into the environment
Only a handful of studies have addressed the release of AgNPs from consumer
products into the environment. A few key factors, including the method of incorporation
8
of ENM into the product and the product’s lifetime and usage, will influence the release
of ENMs from the various consumer products (Mueller and Nowack, 2008). Benn and
Westerhoff (2008) examined several sock brands that contained AgNPs and demonstrated
that some fabrics released as much as 68 μg Ag per g of fabric during a single washing
cycle, whereas other fabrics released no detectable Ag during washing; the total amount
of Ag present in the fabric did not predict how much Ag would be released. A much
higher release of 377 g/g was reported by Geranio et al. (2009), who simulated the
washing of different AgNP-containing textiles; the authors also reported that at least 50%
of Ag in the washing liquid was in the form of particles >450 nm in size. Similarly
Lorenz et al. (2012) reported that 4.5-575 μg/g silver was released into the washing liquid
in the form Ti/Si-AgCl nanocomposites, AgCl and Ag2S nanoparticles, AgCl particles,
and agglomerated AgNPs. A recent study reported that physical activity resulting in
sweating can also release Ag (von Goetz et al., 2013). At this time we remain unaware of
all the factors affecting the release of Ag from AgNP-containing products or how much
Ag is ultimately released and in what form.
The fate of AgNPs released from products containing these NPs has been modeled
by several authors. Mueller and Nowack (2008) reported that the more prominent flows
for AgNPs, at least in Switzerland, are between the products and the sewage treatment
plant (STP), landfill, and waste incineration plant (WIP) (Fig. 1.2A). In a more recent
study Mueller et al. (2013) estimated that 87% of AgNPs that enter WIP will make their
way onto the landfill. Mueller and Nowack (2008) also estimated that 31% of AgNPs will
dissociate into Ag+, especially from textiles and plastics, and will be lost from the system;
however, Blaser et al. (2008) predicted that Ag+ will flow into the STP (Fig 1.2A), where

9
at least 94% will be removed and the remainder, a maximum of 6% Ag+, will be present
in the STP effluent mostly bound to particles, dissolved organic matter, sulfides, etc.
(Wood et al., 1999). Gottschalk et al. (2009) also estimated the flow of AgNPs (and other
ENMs) from commercial products to various compartments. The STP influent, sludge
application to soil, and deposition onto landfill were the predominant flows for AgNPs
(Fig. 1.2B). The efficacy of STP to remove AgNPs was assumed at 90.6-99.5%. It was
predicted that approximately 16% of AgNPs would reach the surface water (Fig. 1.2B).
Furthermore, Gottschalk et al. (2009) estimated the environmental concentration of
AgNPs in surface water at 0.088-2.63 ng/L and the predicted sedimentation rate was
0.153-10.18 µg/kg/a. In contrast, Blaser et al. (2008) predicted much higher
concentrations of 40-320 ng/L and 2-14 mg/kg in surface water and sediment,
respectively; these predicted environmental concentrations (PECs) were similar to the
surface water PEC of 30-80 ng/L estimated by Mueller and Nowack (2008). On the other
hand, the measured titanium concentrations in STP sludge reported by Kiser et al. (2009)
resembled the PEC estimates for TiO2NPs reported by Gottschalk et al. (2009).
Furthermore, the water surface concentrations reported for colloidal and particulate Ag in
various Texas rivers ranged <0.01-148 ng/L (Wen et al., 1997), which covers the range of
both Blaser et al. (2008) and Gottschalk et al. (2009).
Assuming that the production and incorporation of AgNPs into commercial products
increase at the same rate, one may predict that AgNP concentrations in surface water and
sediment would increase proportionally. Therefore, using the information noted above, I
predict that the AgNP concentrations in surface water, sediment, and sludge-treated soil
would increase ~1.7-fold between 2014 and 2020 [see Table 1.1; these estimates are

10
based on the PECs reported by Blaser et al. (2008) and Gottschalk et al. (2009)]. This
would imply that the risk of AgNPs to aquatic environments will increase, as will the
need for ecotoxicological assessments.
1.6. Environmental fate of AgNPs
The fate of AgNPs (and other ENMs) in the aquatic environment remains largely
unknown. Out of all the publications related to environmental health and safety of ENMs
published by 2013 only 10% addressed environmental fate and transport, while 90%
addressed the potential biological effects (Hendren et al., 2013). Furthermore, the
properties of AgNPs, including the shape, size, and coating (also known as capping or
stabilizing agent) will likely impact their fate (and ultimately toxicity) in the aquatic
environment (Scown et al., 2010a; Levard et al., 2012; Yu et al., 2013).
However, before reaching the aquatic environment the AgNPs will have to pass
through the wastewater treatment plant (WWTP). In a recent study, a pilot WWTP was
fed with municipal wastewater containing a Ag background concentration of 1.5 μg/L
(Kaegi et al., 2011). The influent was supplemented with AgNPs (stabilized with
polyoxyethylene fatty acid ester) for 24 d and thereafter the WWTP operation continued
for 17 d without AgNP addition. The mass balance indicated that AgNPs were present in
the sludge (85%), wastewater (10%), and effluent (5%) (Kaegi et al., 2011). These flows
correlated well with the predicted fluxes discussed in the previous section as well as in
Hou et al. (2012), who reported complete removal of citrate-capped AgNPs from
wastewater. As for speciation, the majority of AgNPs were present as Ag2S particles in
both the sludge and effluent and only 8-15% remained as AgNPs (Kaegi et al., 2011).

11
Kaegi et al. (2012) also reported that the transformation of AgNPs into Ag2S occurred
within 2 h; however, this transformation may be affected by the coating of AgNPs.
Similarly Kim et al. (2010) reported that AgNPs in sewage sludge samples from various
US WWTPs were present as 5-20 nm Ag2S particles.
Once the effluent is introduced into the surface water, the AgNPs are likely to
undergo further transformations, including oxidation, dissolution, and/or sulfidation,
depending on the environmental conditions (Levard et al., 2012). The transformation and
fate of AgNPs have been investigated in a recent mesocosm study (Lowry et al., 2012),
which included several plant species, mosquitofish (Gambusia holbrooki), and other
species that colonized the mesocosm over the 18-month study period. The applied
polyvinylpyrrolidone (PVP)-coated AgNPs (16.6 mg/L) rapidly precipitated from the
water column during the first eight days and by the end of the study the Ag concentration
was <0.05% of the initial dose. The AgNPs were found in the sediment (60%), soil (7%),
and plants (0.2%). The mosquitofish and some of the invertebrate species did have Ag
body burdens of 0.5-2.0 μg/g, suggesting that these species do remove at least some of
the Ag from the water. As for speciation, the majority of AgNPs in the sediment were in
the form of Ag2S (55%) and Ag-cysteine (27%), and only 18% remained unchanged.
Despite the extensive sulfidation, the Ag remained bioavailable to the organisms present
in the mesocosm.
The transformation of AgNPs into Ag2S (and AgCl) is thermodynamically favored,
based on the solubility of the products (Ksp) and their stability constants (Kf) (Levard et
al. 2012). The formation of Ag2S, AgCl, and Ag0 as major species was simulated in
freshwater (and seawater) as a function of redox state (Eh) and pH (Levard et al., 2012).

12
AgCl was the favored form under aerobic conditions whereas Ag2S was predicted to form
under anaerobic conditions. The authors also noted that the formation of Ag2S in WWTP
is favorable due to pH and Eh conditions as was demonstrated by others (Kim et al.,
2010; Kaegi et al., 2011).
In addition to sulfidation, AgNPs can also bind to natural organic matter (NOM),
which is abundant in natural waters (Domingos et al., 2009; Liu et al., 2010a; Stankus et
al., 2011; Thio et al., 2011; Kim et al., 2012). A recent study by Furman et al. (2013)
showed that NOM, such as fulvic and humic acids (FA and HA, respectively), reduced
the aggregation of citrate-capped AgNPs (20 mg/L), and that HA increased the mobility
of AgNPs in the aquatic environment, while FA reduced it. Similarly, Gao et al. (2012)
reported that AgNPs (unspecified coating) were stabilized with HA (<10 mg/L), whereas
higher HA concentrations (>10 mg/L) induced aggregation. Other studies that addressed
the behavior of AgNPs in natural waters in the presence and absence of humic materials
and other organic solutes showed condition- and coating-dependent agglomeration or
stabilization of AgNPs (Chappell et al. 2011; Li and Lenhart, 2012; Piccapietra et al.,
2012). Moreover, two recent studies reported that AgNPs can be regenerated through
sunlight-driven reduction of Ag+ by organic matter (Hou et al., 2013; Yu et al., 2014),
emphasizing the importance of environmental factors in determining the fate of AgNPs.
In light of these studies, it is apparent that AgNPs will transform and complex with
other molecules within the aquatic environment, depending on environmental conditions
and the NP capping agent. The transformations include the low solubility Ag2S or AgCl
particles, and complexes with other molecules, such as NOM, which can either aggregate
and precipitate the particles, or render them mobile. These dynamics are important

13
determinants of AgNP toxicity, since the precipitating Ag species would accumulate in
the sediment and potentially affect the bacteria, algae, and bottom feeding organisms
(including some fish species), whereas the soluble AgNP complexes would remain in the
water column, potentially affecting pelagic species.
1.7. Toxicity of AgNPs in fish
A myriad of effects have been reported in fish exposed to AgNPs. Kashiwada et al.
(2012) reported that Japanese medaka (Oryzias latipes) embryos exposed to 0.5-1 mg/L
AgNPs (unspecified capping agent) up to 14 d demonstrated cardiovascular defects,
ischemia, underdeveloped central nervous system, and differential expression of
oxidative stress-, embryogenesis-, and morphogenesis-related genes. Fathead minnow
(Pimephales promelas) embryos exposed to NanoAmor and Sigma AgNPs (0.625-25
mg/L) for 4 d showed increased mortality and developmental abnormalities; the uptake of
AgNPs was also noted (Laban et al., 2010). Chae et al. (2009) reported that an acute
exposure of juvenile medaka to Sigma AgNPs (1-25 μg/L) for up to 10 d influenced the
expression of genes related to cellular and DNA damage/repair, metal detoxification,
metabolic regulation, and oxidative stress. Pham et al. (2012) also reported that AgNP
exposure (Sigma AgNPs at 1g/L for 28 d) induced the expression of genes related to
metal detoxification, oxidative and inflammatory stress, and immune response in the liver
of medaka; there were also signs of estrogenic effects of AgNPs. Furthermore, Bilberg et
al. (2010) showed an increased basal metabolic rate in the Eurasian perch (Perca
fluviatilis) in response to a 3 d exposure to 63-300 μg/L PVP-coated AgNPs. Bilberg et
al. (2011) also demonstrated that a 30 min exposure to PVP-coated AgNPs (0.45-45

14
μg/L) disrupted olfaction in the Eurasian perch and the Crucian carp (Carassius
carassius).
In addition, zebrafish (Danio rerio) embryos were used as a model in a few studies.
Asharani et al. (2008) reported physical deformities in zebrafish embryos, including bent
and twisted notochord, pericardial edema, reduced heart rate, and degeneration of body
parts, in response to a 72 h exposure to BSA- and starch-coated AgNPs at concentrations
of 50-100 mg/L. Similar findings were documented by Bar-Ilan et al. (2009) in zebrafish
embryos exposed to uncoated AgNPs at ~10 mg/L for 5 d and by Lee et al. (2007), who
exposed embryos for 5 d to uncoated AgNPs (~4.3-76.6 ng/L). Griffitt et al. (2009)
demonstrated that 1 mg/L AgNPs (metal oxide coating) exposure in adult zebrafish
altered gill filament morphology and global gene expression. The delay in zebrafish
embryo hatching in response to AgNPs (with various coatings) exposure was a common
finding in a number of studies (Asharani et al., 2008; 2011; Yeo and Kang, 2008; Bar-
Ilan et al., 2009; George et al., 2011; Powers et al., 2011).
AgNP bioaccumulation has also been reported. Gagné et al. (2012) showed that
citrate-stabilized AgNPs (0.06-6 μg/L) accumulated in the liver of rainbow trout
(Oncorhynchus mykiss) after a 4 d exposure, suggesting that some of these particles pass
through the gills into the blood and accumulate in the liver. Farmen et al. (2012) reported
that AgNPs (1-100 μg/L; unspecified coating) accumulated in the gills of Atlantic salmon
(Salmo salar) after a 48 h exposure period; AgNPs also induced the expression of stress
and metal detoxification genes and suppressed the expression of Na+,K
+-ATPase.
Similarly, Scown et al. (2010b) noted detectable levels of Ag in the gills and liver of
rainbow trout exposed to AgNPs (10-100 μg/L; unspecified coating) for 10 d. Since the

15
Ag concentration in the liver was twice that in the gills, the authors suggested that AgNP
uptake may also occur through the gut epithelium (Scown et al., 2010b). Intestinal
absorption is indeed an important route of AgNP uptake as shown by Gaiser et al. (2012),
who reported that significant amounts of Ag were found in various tissues, including
gills, intestine, liver, and bile of the common carp (Cyprinus carpio) exposed to AgNPs
(0.01 and 0.1 μg/L; unspecified coating) for 21 d; the Ag concentration in the intestine
was 2-9-fold higher than in the gills. In contrast, Kwok et al. (2012) showed that the gills
were the main site of AgNP (PVP-coated) uptake in medaka.
The effects of AgNPs reported by the majority of these studies occurred at
concentrations higher than the PECs discussed in section 1.5, suggesting that AgNPs pose
minimal risk to fish; however, the majority of these studies were acute. Prolonged
exposures to more environmentally relevant concentrations of AgNPs did result in
bioaccumulation in common carp (Gaiser et al., 2012) and did affect gene expression in
medaka (Pham et al., 2012), suggesting that AgNPs may negatively impact fish.
Moreover, as mentioned in section 1.5 most of the AgNPs that make their way into the
aquatic environment will be found in the sediment, meaning that demersal fish species
could be at a higher risk than pelagic fish species.
1.8. Proposed mechanisms of ENM toxicity
1.8.1. Overview
As mentioned in the previous section multiple effects are reported in fish exposed to
AgNPs. Nonetheless, the precise toxicity mechanisms of AgNPs (and other ENMs)
remain unclear. It should be noted that the toxicity of ENMs will depend on
16
physicochemical characteristics, including composition, size, surface structure, solubility,
shape, and aggregation (Nel et al., 2006), meaning that not all ENMs would be equally
toxic. Several review papers over the past decade discussed ‘nanotoxicity’ and proposed
a few mechanisms: 1) ROS generation and subsequent oxidative stress and damage to
cellular components (cell membrane, proteins/enzymes, DNA); 2) dissolution and release
of toxic species in the form of metal ions; 3) endocrine disruption [this is mostly based on
Nel et al. (2009), who discussed the potential interactions of ENMs biological surfaces,
including cellular receptors], and 4) inflammation and cell/tissue injury (fibrosis,
granuloma formation, ‘asbestos-like’ effects), which are more pertinent to fibrous ENMs
like carbon nanotubes (Buzea et al., 2007; Oberdörster et al., 2007; Chen and
Schluesener, 2008; Gonzalez et al., 2008; Klaine et al., 2008; Auffan et al., 2009; Møller
et al., 2010; Sharifi et al., 2012). Some of these mechanisms are discussed in the
following sections.
1.8.2. ROS generation and oxidative stress
ROS are naturally generated by all aerobic organisms in what is termed ‘the oxygen
paradox’ to reflect the toxicity of oxygen and the inability of aerobic organisms to
survive in its absence. Oxygen is the final electron acceptor within the mitochondrial
electron-transport chain (ETC) (Davies, 1995). It is estimated that 0.1-0.4% of oxygen is
converted into the oxygen radical superoxide anion (O2·-) due to ‘leaky’ ETC, making the
mitochondria the main contributors of O2·- (Hermes-Lima, 2005). The reductive
environment of the cellular milieu facilitates the conversion of O2·- into other ROS
including hydrogen peroxide (H2O2) and highly reactive hydroxyl radical (OH·) (Figure

17
1.3), which could damage cellular components (Davies, 1995). Cell defense systems
against oxidative stress and damage include 1) antioxidant compounds [e.g. reduced
glutathione (GSH), vitamins C and E] and enzymes [superoxide dismutase (SOD),
catalase (CAT), glutathione peroxidase (GPx)] (Figure 1.3); 2) direct repair systems,
which could repair oxidized amino acids in damaged proteins and DNA hydroperoxides;
and, 3) indirect repair systems, which remove and replace damaged components (Davies,
2000). Consequently, unbalanced generation of ROS (natural and ENM-derived) could
overwhelm the defense systems and result in damage.
The ability of ENMs to generate ROS stems from the unique catalytic redox
reactions that occur on the surface of these particles; this is especially relevant for
particles that are <30 nm in size, which display a high surface area to volume ratio
(Auffan et al., 2009). Previous studies demonstrated the ability of AgNPs to generate
ROS and induce oxidative stress (e.g. Carlson et al., 2008; Choi and Hu, 2008; Neal,
2008; Piao et al., 2011). Therefore, I have studied the effects of AgNPs on the antioxidant
system in order to better understand the involvement of oxidative stress in the toxicity of
AgNPs (see section 1.10).
1.8.3. Dissolution
The dissolution and release of metal ions have also received attention from the
scientific community, especially in relation to metallic ENMs. More specifically, the
debate on whether the toxicity of AgNP is due to its nanoscale properties, the dissolving
Ag+, or both is still ongoing (Lubick, 2008; Beer et al., 2012). Previous studies suggested
that AgNP dissolution is dependent upon coating, size, concentration, and experimental

18
conditions (ionic strength, pH, temperature) (Fabrega et al., 2009; Kittler et al., 2010; Liu
and Hurt, 2010; Zhang et al., 2011; Hadioui et al., 2013; Chambers et al., 2014).
Assessment of AgNP dissolution is an important parameter since the toxicity of AgNPs
has been shown to increase with increased dissolution (Kittler et al., 2010; Chambers et
al., 2013). As mentioned in section 1.3 the antimicrobial properties of Ag+ encouraged
the incorporation of AgNPs into consumer products; however, the toxicity of Ag+ is also
well documented in fish, especially in relation to its ability to disrupt osmoregulation
through the inhibition of gill Na+,K
+-ATPase (Wood et al., 1999). Therefore, I have
assessed the dissolution of AgNPs and compared the toxicity of AgNPs to Ag+ in order to
better understand the importance of Ag-type in Ag toxicity (see section 1.10).
1.8.4. Endocrine disruption
As defined by the World Health Organization’s International Program on Chemical
Safety an endocrine disruptor is “an exogenous substance or mixture that alters the
function(s) of the endocrine system and consequently causes adverse health effects in an
intact organism, or its progeny, or (sub) populations” (IPCS, 2002). Endocrine disruption
is mediated by an interaction of a xenobiotic compound with hormone receptor or
nonreceptor pathways, hormone secretion, and modulation of feedback mechanisms
(Witorsch and Thomas, 2010). Although a significant progress has been made over the
past decade in understanding the endocrine-disrupting potential of common pollutants
(see references in Marty et al., 2011), the potential of ENMs to affect the endocrine
system is still at its infancy even though it has been proposed that ENMs are likely to
interact with cellular membranes, which could impact hormone- and non-hormone-
19
mediated signaling cell signaling (Nel et al., 2009). A recent review emphasized the
importance of investigating endocrine disrupting potential of ENMs, which to date has
only been addressed in a few studies focusing primarily on mammalian systems (Lu et
al., 2013).
The hormone-regulated process that I have investigated is the stress response. Fish
display a typical vertebrate stress response that includes 1) the immediate response
mediated by the sympathetic nervous system (‘fight-or-flight’ response), and 2) the
delayed hypothalamic–pituitary–interrenal (HPI) axis-mediated response. The former
involves the adrenergic system mediated by the catecholamines (epinephrine and/or
norepinephrine). Catecholamines increase cardiac contraction and liberation of fatty acids
by adipose tissue (Van Heeswijk et al., 2006), as well as mobilization of energy reserves
primarily through glycogenolysis and to a lesser extent through gluconeogenesis [both of
these processes are mediated primarily by the hepatic -adrenoreceptors (ARs)]
(Nickerson et al., 2001). On the other hand, the HPI axis involves the synthesis and
release of cortisol, which binds to the cytosolic glucocorticoid receptor (GCR) and
ultimately increases hepatic gluconeogenesis (Mommsen et al., 1999; Vijayan et al.,
2003; To et al., 2007).
1.9. Model systems
1.9.1. Zebrafish
The zebrafish is one of the more effective aquatic models to study the effects of
emerging pollutants including ENMs. It shares with mammals important anatomical
features like the blood-brain barrier, endothelial cells, and immunogenic responses (Fako

20
and Furgeson, 2009), allowing numerous comparisons to be made (Schmale et al., 2007).
Fecundity of zebrafish is high, producing potentially 200-300 embryos in a single day
under laboratory conditions. The clarity of the zebrafish embryos allows for visualization
of in vivo processes such as organogenesis, vasculogenesis, and abnormalities that may
arise during development. Furthermore, the digestive, nervous and cardiovascular
systems are similar to the human systems, making zebrafish potential models for human
disease (Lieschke and Currie, 2007). Moreover, the entire genome has been sequenced,
making zebrafish an attractive model for gene expression studies. Another important
feature of the zebrafish embryo is the chorion that surrounds and protects the organism
during development. Intercrossing layers contain pores between 500 and 700 nm (Fako
and Furgeson, 2009), and this size is sufficient to potentially allow ENMs including
AgNPs to pass through by passive diffusion and target the embryo.
Zebrafish have been mostly used in developmental biology and molecular genetics.
However, more recently zebrafish have also been recognized as a valuable vertebrate
model for toxicology and drug discovery, which is evident from the increased number of
studies using zebrafish as a model, especially in high-throughput, large-scale toxicity
screening studies (Hill et al., 2005; Fako and Furgeson, 2009). As noted in section 1.7,
zebrafish was a common model to study AgNP toxicity and this will be further elucidated
in Chapters 2 and 3 where I have used this species for the study of AgNP effects on
oxidative stress and stress response.
21
1.9.2. Rainbow trout erythrocytes and hepatocytes
Erythrocytes are a sensitive model for oxidative stress resulting from their
susceptibility to peroxidation. Although erythrocytes possess an extensive antioxidant
defense system including antioxidant enzymes and substrates (Fig. 1.4), these cells are
susceptible to peroxidation due to the high content of poly-unsaturated fatty acids in their
cell membrane and high cytoplasmic oxygen and iron concentrations, which continuously
produce ROS (Li et al., 2013). Unlike their mammalian counterparts, fish erythrocytes
are nucleated and contain mitochondria (Thorgaard et al., 2002), providing additional
sources of ROS. As discussed in Chapter 4 erythrocytes have antioxidant enzymes and
relatively large glutathione reserves, which could be easily measured in order to assess
oxidative stress. In addition, the hemolysis assay is a quick and accurate method to
measure cell viability.
Hepatocytes are the other in vitro model used in this thesis. These cells are standard
tools for studies involving the hormonal regulation of metabolism, including
catecholamines and their downstream processes, including glycogen and glucose
metabolism (Mommsen et al., 1988; Moon, 2004). Chapter 5 duscusses receptor-
mediated glucose production as a marker of endocrine disruption. Hepatocytes are also
extensively used in the field of toxicology. Liver is a major organ involved in xenobiotic
metabolism; it possesses a wide range of detoxifying enzymes involved in a variety of
reactions to render xenobiotic compounds more soluble to be eliminated from the
organism (Guillouzo, 1998; Castano et al., 2003). Similarly to erythrocytes, hepatocytes
possess an extensive antioxidant defense system, making them applicable in oxidative
stress studies as discussed in Chapter 4.

22
1.10. Thesis hypotheses and objectives
The overall objective of this thesis was to investigate the toxicity mechanisms of
AgNPs in fish. To this end the following hypotheses were tested:
1. AgNP exposure in zebrafish embryos and trout erythrocytes and hepatocytes results
in oxidative stress; and,
2. Exposure to AgNPs disrupts the HPI axis-mediated stress response in zebrafish and
interferes with the cell signaling associated with the -AR and GCR systems in
rainbow trout hepatocytes.
First, the role of oxidative stress in AgNP toxicity in zebrafish embryos was
investigated (Chapter 2). The embryos were exposed for 4 d to AgNPs or Ag+ at
equivalent silver concentrations; the toxicity of Ag+ in fish is well documented and
AgNPs are known to undergo dissolution releasing Ag+ to the medium. Generation of
ROS and antioxidant levels were assessed after Ag-exposure. These experiments
established a LC50 for AgNPs and Ag+, and identified a single concentration of Ag for
subsequent experiments on the zebrafish stress response (Chapter 3). The role of
oxidative stress in AgNP toxicity was further elucidated in trout erythrocytes and
hepatocytes (Chapter 4). In these experiments the cells were exposed for 48 h and the
uptake of AgNPs, ROS generation, antioxidant levels, and damage to lipids, DNA, and
proteins were assessed. These experiments established the cytotoxic AgNP concentration
range, and identified a set of sub-cytotoxic concentrations that were used in subsequent
experiments investigating the functions of the β-AR and GCR (Chapter 5).

23
Table 1.1. Predicted environmental concentrations (PECs) of AgNPs. The PECs in
surface water, sediment, and sludge-treated soil are presented by year based on the
increase in AgNP-containing consumer products and AgNP production. See footnotes as
well as sections 1.4 and 1.5 for more details.

24
Yea
r
Num
ber
of
pro
duct
sa
AgN
P p
rodu
ctio
n
worl
dw
ide
(t/a
)b
PE
C s
urf
ace
wat
er (
ng/L
)c
PE
C s
edim
ent
(g/k
g/a
)c
PE
C s
urf
ace
wat
er (
ng/L
)d
PE
C s
edim
ent
(mg/k
g/a
)d
Slu
dge-
trea
ted
soil
(
g/k
g/a
)c
2006
25
0.4
-46
0.0
12-0
.35
0.0
20-1
.35
7-5
9
0.4
-2.6
0.0
70-0
.32
2007
84
1.3
-13
3
0.0
39-1
.17
0.0
68-4
.53
25-1
97
1.2
-8.6
0.2
34-1
.06
2008
136
2.2
-21
6
0.0
64-1
.90
0.1
11-7
.37
40-3
20
2.0
-14.0
0.3
81-1
.72
2009
188
3.0
-30
0
0.0
88-2
.63
0.1
53-1
0.1
8
55-4
43
2.8
-19.4
0.5
26-2
.38
2010
241
3.8
-383
0.1
13-3
.37
0.1
96-1
3.0
4
71-5
67
3.5
-24.8
0.6
74-3
.05
2011
313
5.0
-498
0.1
47-4
.38
0.2
55-1
6.9
5
92-7
36
4.6
-32.2
0.8
76-3
.96
2012
346
5.5
-55
0
0.1
62-4
.84
0.2
81-1
8.7
1
102-8
13
5.1
-35.6
0.9
67-4
.38
2013
383
6.1
-60
9
0.1
79-5
.36
0.3
12-2
0.7
4
113-9
01
5.6
-39.4
1.0
72-4
.85
2014
450
7.2
-71
6
0.2
11-6
.30
0.3
67-2
4.3
9
132-1
060
6.6
-46.4
1.2
60-5
.70
2015
503
8.0
-79
9
0.2
35-7
.03
0.4
09-2
7.2
2
148-1
183
7.4
-51.8
1.4
07-6
.36
2016
555
8.8
-88
2
0.2
60-7
.77
0.4
52-3
0.0
6
163-1
306
8.2
-57.1
1.5
53-7
.03
2017
608
9.7
-96
6
0.2
84-8
.50
0.4
52-3
2.9
0
179-1
430
8.9
-62.5
1.7
00-7
.69
2018
660
10.5
-10
49
0.3
09-9
.23
0.5
37-3
5.7
3
194-1
553
9.7
-67.9
1.8
46-8
.35
2019
712
11.3
-11
32
0.3
33-9
.96
0.5
80-3
8.5
7
210-1
676
10.5
-73.3
1.9
93-9
.02
2020
765
12.2
-1216
0.3
58-1
0.7
0
0.6
22-4
1.4
1
225-1
799
11.2
-78.7
2.1
40-9
.68
Sum
e na
94.9
-94
88
na
4.8
57-3
23.1
6
na
87.8
-614.4
16.6
98-7
5.5
5
a N
um
ber
of
report
ed p
roduct
s co
nta
inin
g A
gN
Ps.
The
bold
num
ber
s re
pre
sent
the
num
ber
pro
vided
by
Nanote
chpro
ject
(2
013).
The
rest
of
the
num
ber
s are
calc
ula
ted u
sing
the
equ
ati
on y
= 5
2.3
85
x – 1
05,0
53,
wher
e y
is t
he
num
ber
of
pro
duct
s and x
is
the
year,
gen
erate
d f
rom
the
know
n n
um
ber
of
pro
duct
s.
b P
roduct
ion o
f A
gN
Ps
worl
dw
ide
in t
ons
per
annum
. T
he
bold
num
ber
s re
pre
sent
the
esti
mate
d p
roduct
ion r
eport
ed b
y P
icci
nno e
t
al.
(2012
). T
he
pro
du
ctio
n f
or
oth
er y
ears
is
calc
ula
ted p
roport
ionall
y to
the
esti
ma
ted i
ncr
ease
in A
gN
P-c
onta
inin
g p
roduct
s.
c,d P
redic
ted e
nvi
ronm
enta
l co
nce
ntr
ati
ons
for
surf
ace
wate
r and s
edim
ent.
The
bold
num
ber
s re
pre
sent
the
esti
mate
d P
EC
as
rep
ort
ed b
y G
ott
schalk
et
al.
(2009
)c and B
lase
r et
al.
(2008
)d.
The
PE
C f
or
oth
er y
ears
is
calc
ula
ted
pro
port
ion
all
y to
th
e in
crea
se
in A
gN
Ps
pro
duct
ion.
e The
Sum
ref
ers
to t
he
tota
l am
ount
of
AgN
Ps
pro
duce
d a
nd a
ccum
ula
ted
in s
edim
ent
or
the
sludge-t
reate
d s
oil
by
2020.
The
unit
s
are
in t
, μ
g/k
g o
r m
g/k
g,
dep
endin
g o
n t
he
unit
s of
the
colu
mn’s
hea
din
g;
‘na’
den
ote
s ‘n
ot
appli
cable
’.

25
Figure 1.1. Number of reported consumer products that contain ENMs between 2005 and
2013. ‘Total’ refers to the number of consumer products that contain any ENMs (y =
200.13x – 401,093; r2 = 0.97). ‘AgNPs’ refers to the number of consumer products that
contain only AgNPs (y = 52.385x – 105,053; r2 = 0.99). The data are derived from
http://www.nanotechproject.org.
Year
2005 2006 2007 2008 2009 2010 2011 2012 2013
Nu
mb
er
of
pro
du
cts
0
500
1000
1500
2000Total
AgNPs
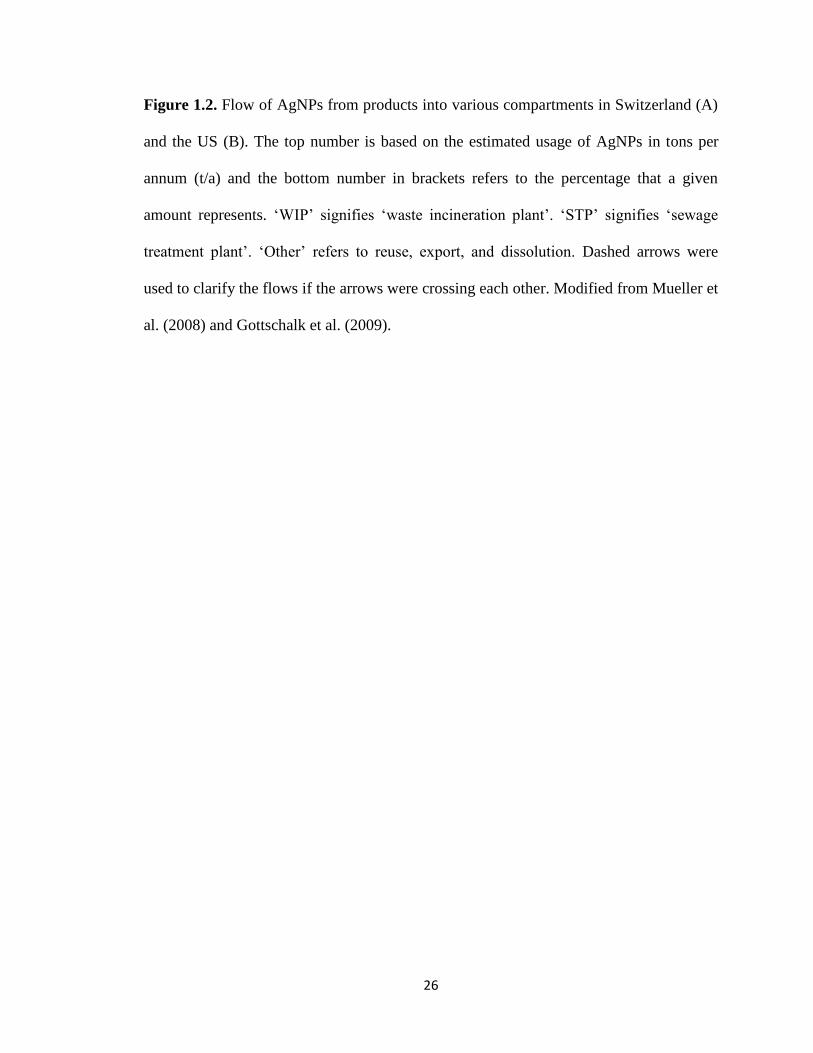
26
Figure 1.2. Flow of AgNPs from products into various compartments in Switzerland (A)
and the US (B). The top number is based on the estimated usage of AgNPs in tons per
annum (t/a) and the bottom number in brackets refers to the percentage that a given
amount represents. ‘WIP’ signifies ‘waste incineration plant’. ‘STP’ signifies ‘sewage
treatment plant’. ‘Other’ refers to reuse, export, and dissolution. Dashed arrows were
used to clarify the flows if the arrows were crossing each other. Modified from Mueller et
al. (2008) and Gottschalk et al. (2009).
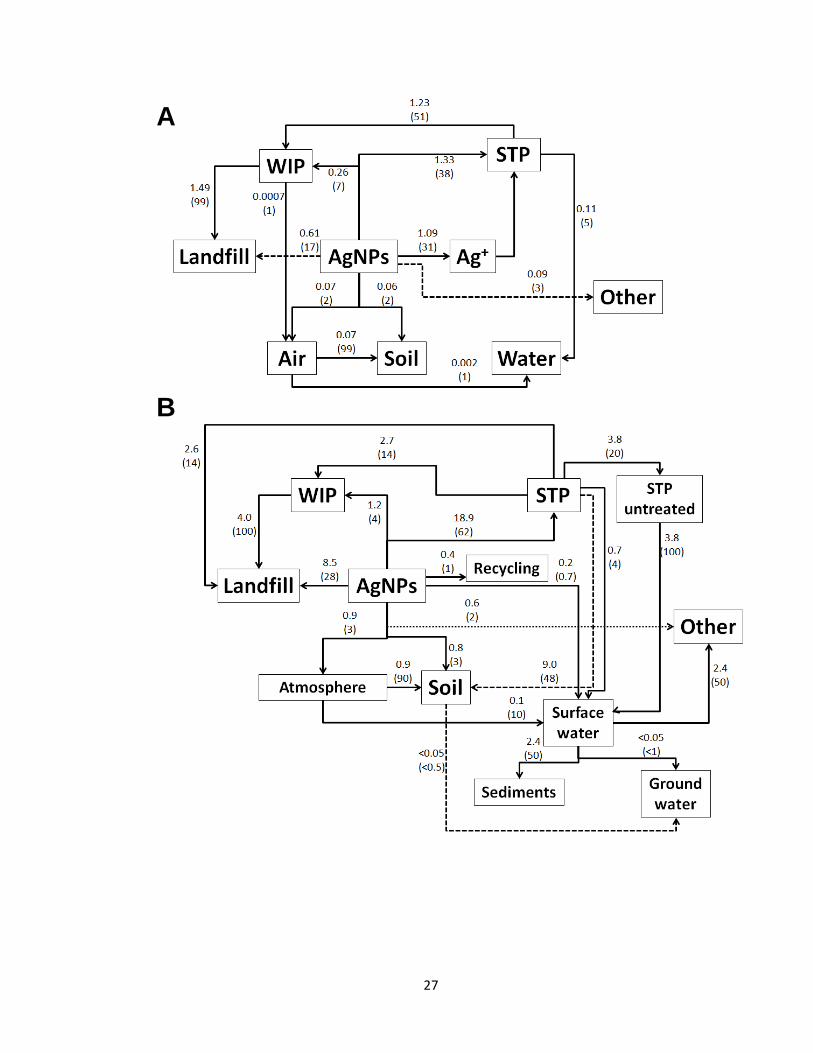
27
A
B
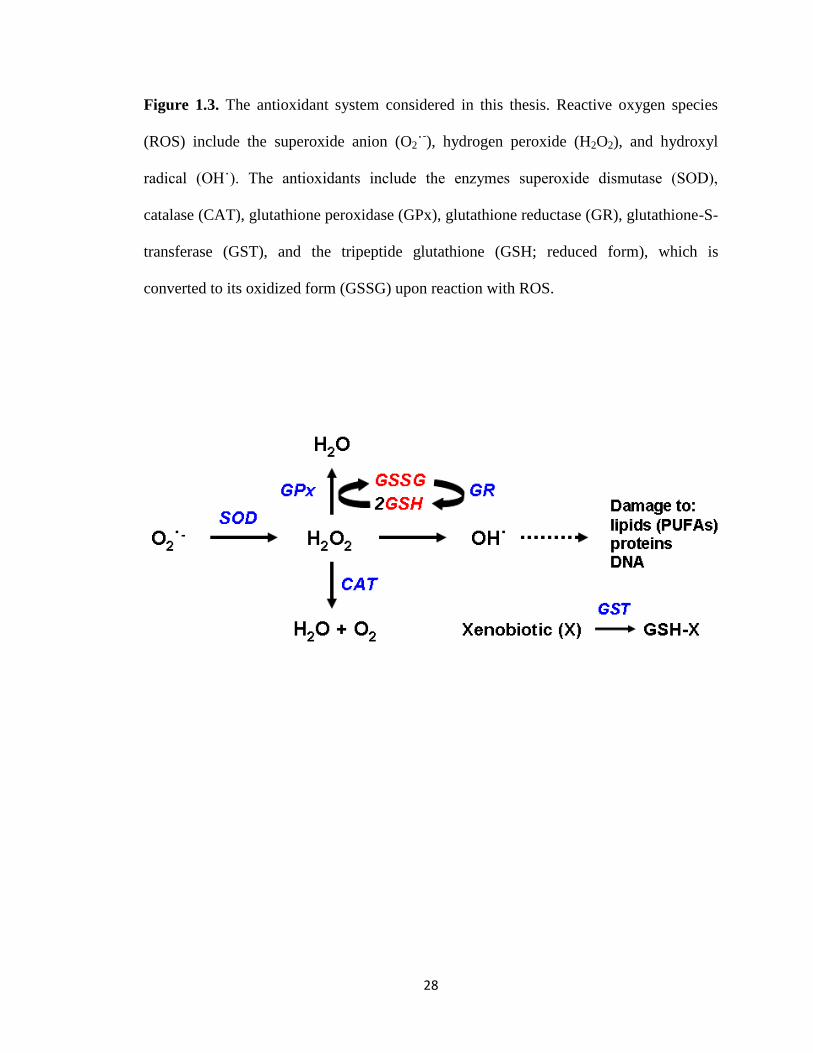
28
Figure 1.3. The antioxidant system considered in this thesis. Reactive oxygen species
(ROS) include the superoxide anion (O2˙-), hydrogen peroxide (H2O2), and hydroxyl
radical (OH˙). The antioxidants include the enzymes superoxide dismutase (SOD),
catalase (CAT), glutathione peroxidase (GPx), glutathione reductase (GR), glutathione-S-
transferase (GST), and the tripeptide glutathione (GSH; reduced form), which is
converted to its oxidized form (GSSG) upon reaction with ROS.

29
CHAPTER 2
Assessment of nanosilver toxicity during zebrafish (Danio rerio)
development
This chapter is based upon the following article: Massarsky, A., Dupuis, L., Taylor, J.,
Eisa-Beygi, S., Strek, L., Trudeau, V.L., Moon, T.W., 2013. Assessment of nanosilver
toxicity during zebrafish (Danio rerio) development. Chemosphere 92, 59-66.
Permission was obtained from the journal for incorporation of this article into this thesis.
The article is based on the work that was conducted with the assistance of the
undergraduate students Lisa Dupuis, Jessica Taylor, and Laura Strek, whom I directly
supervised, as well as my colleague Dr. Shahram Eisa-Beygi, who shared his expertise on
the ROS assay and microscopic imaging. I designed and conducted these experiments,
and wrote the manuscript. Drs. Vance Trudeau and Thomas Moon provided input into the
preparation of the manuscript and funding for the project.
30
2.1. Introduction
Nanotechnology is rapidly expanding with applications in engineering, electronics,
medicine, and environmental remediation (Oberdörster et al., 2007). Engineered
nanomaterials (ENMs) have at least one dimension of less than 100 nm and are more
reactive than bulk materials of the same composition (Horie et al., 2012). As of October
2013 more than 1600 reported consumer products contained ENMs, with silver
nanoparticles (AgNPs) representing the most prevalent ENM (Nanotechproject, 2013).
Silver is known to have antiseptic properties, and nanotechnology enables the
incorporation of AgNPs into various products, including wound dressings (Kim et al.,
2007), clothing, kitchenware, children toys, and many more (Nanotechproject, 2013).
Moistened AgNPs release Ag ions (Ag+), which inactivate bacterial cell electron
transport and DNA replication (Fong and Wood, 2006). Silver ions can also interact with
thiol groups, which are found in antioxidants, thus contributing to oxidative stress
(Morones et al., 2005; Chen and Schluesener, 2008). Moreover, AgNPs can attach to cell
membranes, disturbing permeability and respiration (Morones et al., 2005), and generate
reactive oxygen species (ROS) (Jones et al., 2011), which could damage lipids, proteins,
and DNA.
Increased usage of AgNPs will lead to their emergence in the aquatic environment;
e.g. AgNP-impregnated socks can release as much as 650 μg Ag after washing (Benn and
Westerhoff, 2008). However, the fate and behavior of AgNPs in the aquatic environment
are largely unknown. A recent study of a pilot wastewater treatment plant (WWTP)
showed that AgNPs sorbed to wastewater biosolids and were mostly present as the less
toxic Ag2S (Kaegi et al., 2011). A mesocosm study showed that despite significant
31
sulfidation, AgNPs remained bioavailable in the water column and accumulated in some
of the organisms (Lowry et al., 2012). Furthermore, multiple effects are reported in fish
exposed to silver. In Japanese medaka (Oryzias latipes) embryos exposure to AgNPs
induced cardiovascular defects, ischemia, underdeveloped central nervous system, and
expression of oxidative stress-, embryogenesis-, and morphogenesis-related genes
(Kashiwada et al., 2012). In juvenile medaka AgNPs affected cellular and DNA
damage/repair while Ag+ altered the inflammatory response (Chae et al., 2009). AgNPs
also altered the gill filament morphology and global gene expression in zebrafish (Danio
rerio) (Griffitt et al., 2009), increased basal metabolic rate in the Eurasian perch (Perca
fluviatilis), and disrupted olfaction in the Eurasian perch and the Crucian carp (Carassius
carassius) (Bilberg et al., 2010; 2011). Silver ion also leads to osmoregulatory failure in
fish, including a decrease in the Na+,K
+-ATPase activity in rainbow trout gill at Ag
+
concentrations as low as 1.7 ng/mL (Wood et al., 1999).
There remains limited knowledge concerning mechanisms of uptake, biological fate
and effects, and modes of action of ENMs including AgNPs in waterborne exposure
scenarios (Stone et al., 2010). This study examined the effects of AgNPs on the
developing zebrafish embryo and oxidative stress as a potential toxicity mechanism for
Ag toxicity. It was hypothesized that exposure to AgNPs will generate ROS and elicit
oxidative stress in the developing embryos. Thus, in addition to the heart rate and
hatching success, the antioxidant levels were assessed. The toxicity of AgNPs was
compared to Ag+ (as AgNO3) as Ag
+ is known to be toxic to fish (Wood et al., 1999).
Finally, the effects of AgNPs and Ag+ were assessed in the presence of the Ag
+ chelator

32
cysteine that may also bind to and induce aggregation of AgNPs (Hajizadeh et al., 2012).
This was done to assess whether the observed effects are silver specific.
2.2. Materials and methods
2.2.1. Silver nanoparticles (AgNPs) and silver nitrate (AgNO3)
The AgNPs used in this study were carboxy-functionalized, stabilized by sodium
polyacrylate (31% total Ag), and dispersed in water (Vive Nano, 13010L). Aqueous stock
solution of 1500 µg/mL was diluted to working concentrations in zebrafish egg water
[containing an anti-fungal (3 mL/L 0.01% methylene blue) and salts (16 mL/L 60X E3
embryo media – in g/L: 17.2 NaCl, 0.76 KCl, 4.9 MgSO4•H2O, 2.9 CaCl2)]. Silver nitrate
(AgNO3; source of Ag+) was purchased from Sigma-Aldrich (204390) (63.5% total Ag)
and a 100 µg/mL stock solution was prepared in ultrapure water. Total Ag concentrations
noted on the Figures are based on the Ag contents of each Ag-type.
2.2.2. Characterization of AgNPs
AgNP size and polydispersity index (PDI) were assessed using Dynamic Light
Scattering (DLS; Zetasizer Nano, Malvern Instruments Ltd). Briefly, a 10 µg/mL AgNP
solution was prepared in zebrafish egg water for DLS, and the measurements were
repeated ten times to obtain the mean particle size and PDI. Scanning Transmission
Electron Microscope (STEM; JEOL JSM-7500F Field Emission Scanning Electron
Microscope) was used to visualize and confirm the DLS results. Briefly, a 10 µg/mL
AgNP solution was prepared in MilliQ water, applied to a carbon-coated grid, and left to

33
dry overnight prior to visualization; photos were captured from transmission electron
diffraction (TED) and back scattering of electrons.
The dissolution of AgNPs was assessed using the Amicon Ultra Centrifugal Filters (3
kDa; UFC800324) following the manufacturer’s protocol. Briefly, 3.5 mL of the AgNP
solution was applied to the device and centrifuged for 40 min at 8000 rpm (Sorvall RC
centrifuge with SS-34 rotor) at room temperature. The flow through was then collected
and analyzed using a Varian Atomic Absorption Spectrometer (AA240) fitted with a Ag
1.5” hollow cathode lamp (Perkin Elmer Atomax, N2025300). This method was used to
assess the dissolution of the Vive Nano AgNPs used here; however, ICP-MS was used to
analyze the flow through and a value of 0.04% Ag+ was obtained (personal
communication, Dr. Chris Metcalfe, Trent University).
2.2.3. Zebrafish embryo collection
Adult wild type zebrafish obtained from a local supplier (Big Al’s Aquarium,
Ottawa, ON) were maintained in holding tanks at 28°C on a 14:10 h light-dark cycle in a
flow-through system (Aquatic Habitats, Apopka, FL) using aerated, dechloraminated City
of Ottawa tap water. Plastic embryo collection traps were set between 4 and 6 PM and
collected the following morning within 1 h of spawning between 9 and 10 AM. Collected
embryos were placed in Petri dishes containing egg water and incubated at 28°C until
separated into experimental groups. All experiments were performed on embryo batches
generated from at least three (n ≥ 3) separate ‘mating events’ with each treatment having
two replicate Petri dishes. All procedures used were approved by the University of

34
Ottawa Animal Care Protocol Review Committee and conform to the guidelines of the
Canadian Council for Animal Care for the use of animals in research and teaching.
2.2.4. Experimental set-up
At 3 h post fertilization (hpf), 10-20 embryos were randomly assigned to 5.3 cm
plastic Petri dishes, containing a total volume of 14 mL egg water supplemented with 1
ml of AgNPs, AgNO3 (Ag+), or MilliQ water (for control embryos). Each treatment was
performed in duplicate. Total Ag concentrations used were 0.03, 0.16, 0.31, 0.78, and
1.55 µg/mL, which are similar to concentrations of AgNPs used in previous studies with
zebrafish embryos (Asharani et al., 2008; 2011; Bar-Ilan et al., 2009; George et al., 2011;
Powers et al., 2011). These concentrations are higher than the predicted environmental
concentrations of 0.088-2.63 ng/L AgNPs in surface water (Gottschalk et al., 2009). Our
preliminary exposures to predicted environmental levels did not impact embryo survival
or hatching success; hence, higher concentrations were chosen for the remainder of the
study. For ‘rescue’ experiments, cysteine (Cys; 8.8 μM final concentration) was prepared
in water and added to the egg water prior to the addition of the aforementioned Ag
treatments. Although Cys complexes with Ag at 1:1 (Liu and Sun, 1981), its
concentration in this study was ~1.6 times lower than the highest Ag+ concentration in
order to maintain neutral pH of the embryo medium.
All exposures were carried out in an incubator (Heraeus D-6450) at 28°C until 4 d
post fertilization (dpf) without medium change. Embryos were not fed as the yolk sac
provides sufficient nutrients until depleted at approximately 6 dpf (Westerfield, 2000). At
4 dpf the zebrafish larvae were euthanized with an overdose of tricaine methanesulfonate

35
(0.016%), rinsed with ice-cold distilled water to remove excess AgNPs, Ag+, and Cys,
and preserved in an appropriate medium: for enzyme assays, ice-cold 50 mM potassium
phosphate buffer (KPB-50; pH 7.0), and for glutathione assays, ice-cold 5% sulfosalicylic
acid (previously bubbled with nitrogen gas for 20 min). The samples were frozen in
liquid nitrogen and stored at -80°C until analyzed.
Note: Embryos that were used for the detection of reactive oxygen species were pre-
treated with 0.003% 1-phenyl-2-thiourea to supress pigmentation in developing embryos
(Elsalini and Rohr, 2003). This was done to ensure that the pigmentation did not interfere
with the fluorescent signal during microscopic observations of the larvae as described in
section 2.2.6.
2.2.5. Embryo toxicity analysis
Zebrafish embryos were observed daily using a Nikon NBZ 1500 light dissecting
microscope. Abnormalities, including non-depleted or malformed yolk sac,
malformations of the spine and tail, formations around the pericardial or yolk sac regions,
stunted growth, degraded and opaque tissues, and edema in the body cavity, pericardial or
yolk sac regions, were noted. In addition, embryo heart rate was assessed at 48 hpf using
direct microscopic observation for 15 s for a minimum of 5 embryos at each
concentration. Embryonic heart beat in zebrafish is first detectable at 24 hpf and is an
important indicator of health (Asharani et al., 2008). Hatching success was assessed at 48
hpf, which is the average time when zebrafish embryos hatch (Westerfield, 2000); thus,
any impact of Ag on hatching should be maximized at this time.

36
2.2.6. Reactive oxygen species (ROS) generation
The relative levels of ROS were estimated as previously described (Wu et al., 2011).
Briefly, 72 hpf embryos were incubated in 1 µg/mL of the cell-permeable chloromethyl-
2’7’-dichlorodihydrofluorescin diacetate (CM-H2DCFDA; Invitrogen, Carlsbad, CA) for
2 h in the dark at room temperature. Upon a series of washes in zebrafish egg medium,
embryos were examined on a Nikon NBZ 1500 dissecting microscope with the green
fluorescent protein (GFP) filter, equipped with a Nikon DXM 1200 C digital camera. The
lowest and the middle Ag concentrations (0.03 and 0.31 μg/mL) were chosen for the
assay to ensure sufficient embryo survival for the assay. The experiment was repeated
three times with ten replicate larvae per treatment. The fluorescence data were quantified
by using a scoring system, such that the embryos that resembled the majority of the
controls received a score of 1, and those that displayed higher fluorescence received a
score of 2. The average scores (ROS-score) from the three separate experiments were
then subjected to statistical analysis.
We attempted to validate this technique using the method described in Deng et al.
(2009), which involves the centrifugation of larval homogenate and the assessment of the
resulting supernatant using 2’7’-dichlorodihydrofluorescin diacetate (DCHF-DA).
However, it appears that silver (both AgNPs and Ag+) interferes with this assay possibly
by inhibiting the esterases that cleave the diacetate group, thus lowering the generation of
fluorescent product. Lower fluorescence has been consistently observed with embryos
exposed to AgNPs and Ag+ despite a series of rinsing with phosphate buffered saline
(PBS) prior to homogenization, suggesting silver uptake by the larvae. Similar

37
observations were made with silver (AgNPs or Ag+) added to the supernatant from
control embryos. The decrease in fluorescence was dependent on silver concentration.
2.2.7. Glutathione levels
Glutathione levels were estimated as previously described (Hermes-Lima and Storey,
1996). Whole frozen zebrafish larvae (in 5% sulfosalicylic acid) were thawed and
homogenized using a Kontes Micro Ultrasonic Cell Disruptor for 10 s, followed by a 5
min centrifugation at 5000 g (4°C) in a Beckman Coulter Microfuge® R centrifuge. The
supernatant was used to assess total glutathione (TGSH) and oxidized glutathione
(GSSG). TGSH was estimated by the rate of reduction of 5,5’-dithiobis(2-nitrobenzoic
acid) (DTNB) at 412 nm by TGSH compared to a standard GSH curve. The reaction
media contained 1 U/mL GR, 100 mM KPB (KPB-100), 0.25 mM NADPH, and 0.6 mM
DTNB (prepared in KPB-100) and 10 µL sample supernatant. To estimate GSSG, the
supernatant was treated with 24 mM 2-vinylpyridine in 500 mM KPB (KPB-500) for 90
min at room temperature to derivatize any reduced glutathione (GSH). GSSG was then
estimated as described above but with GSSG standards. The GSH was then calculated
using the equation TGSH = GSH + 2GSSG.
2.2.8. Antioxidant enzymes activities
Whole frozen zebrafish larvae (in KPB-50) were thawed and homogenized as above,
followed by a 15 min centrifugation at 15,000 g (4°C) as above. The activities of the
enzymes were assessed using a SpectraMax Plus Spectrophotometer (Molecular Devices,
Sunnyvale, CA) and SOFTmax Pro software. The following assays were adapted from

38
Lushchak et al. (2001): Glutathione reductase (GR; EC 1.8.1.7) was assessed by
following the oxidation of NADPH at 340 nm in a reaction medium containing 0.25 mM
NADPH and 1 mM GSSG in KPB-50; Glutathione peroxidase (GPx; EC 1.11.1.9) was
assessed by a coupled assay measuring the oxidation of NADPH catalyzed by GR at 340
nm in a reaction medium containing 1 U/mL yeast GR, 15 mM GSH, 4 mM sodium
azide, 0.25 mM NADPH, and 0.2 mM H2O2 in KPB-50; Catalase (CAT; EC 1.11.1.6)
was assessed by following the decomposition rate of 10 mM H2O2 at 240 nm in KPB-50.
Superoxide dismutase (SOD; EC 1.15.1.1) was assessed with the SOD Assay Kit (Sigma,
19160), which is an indirect assay method based on xanthine oxidase and a color reagent
that absorbs at 450 nm. All enzyme activities are reported based on protein
concentrations assessed using the bicinchoninic acid (BCA) assay method (Sigma) and
bovine serum albumin (BSA) as a standard.
2.2.9. Statistical analysis
Statistical analyses were conducted using SigmaPlot (SPW 11; Systat Software, Inc.,
San Jose, CA). Three-way analysis of variance (ANOVA) with a post-hoc Holm-Sidak
method was used to test for significance in all measured endpoints. The three independent
variables were Ag-type (AgNP or Ag+), Ag concentration, and presence/absence of Cys.
The ANOVA results are summarized in Table 2.1. A one-way ANOVA was used twice
to determine the differences in ROS-score between the control and Ag+ and between the
control and the AgNP groups (see Fig. 2.5K). In all cases P ≤ 0.050 was considered
significant. The data are presented as means and standard deviation (SD) or standard
error of the mean (SEM).

39
2.3. Results
2.3.1. Characterization of AgNPs
The average size of AgNPs used in this study in zebrafish egg water was 8.39 ± 0.98
nm based upon DLS estimates (Fig. 2.1A), with an average PDI of 0.156 ± 0.025,
suggesting that the particles were relatively monodisperse. STEM analysis using TED
showed dispersed AgNP particles of ~10-20 nm with some small aggregates (Fig. 2.1B).
Back scattering STEM confirmed that particles seen in TED were indeed AgNPs seen as
white dots (Fig. 2.1C).
As for dissolution, the stock AgNP solution was found to contain 0.5% silver ions.
Ultrafiltration of lower concentrations (0.31-100 μg/mL) yielded Ag concentrations that
were below the detection limit of the instrument (0.02 μg/mL), suggesting that at these
lower concentrations the dissolution is less than 0.5%.
2.3.2. Zebrafish embryo mortality, hatching, heart rate, and abnormalities
Both forms of Ag were toxic to zebrafish embryos in a dose-dependent manner (Fig.
2.2A). There was a significant effect of Ag-type and concentration on total mortalities at
96 hpf. The Ag+ was more toxic than AgNPs as the calculated LC50s at 96 hpf were 0.07
and 1.18 µg/mL, respectively (Fig. 2.2B). Cys treatment significantly (Table 2.1) reduced
mortality for both Ag-types (Fig. 2.2A); even at the highest Ag+ concentration the
mortality dropped from 77% to 37%. Hatching success declined at 48 hpf for both Ag-
types in a dose-dependent manner (Fig. 2.3A). There was a significant effect of Ag-type
and concentration; however, Ag+ was more potent than AgNP in delaying hatching. Cys
treatment significantly (Table 2.1) improved the hatching success; even at the highest

40
Ag+ concentration, the hatching improved from 16% to 42%. Moreover, both Ag-types
significantly reduced embryo heart rate at 48 hpf, but not in a dose-dependent manner
(Fig. 2.3B). Cys treatment generally restored the normal heart rate of most groups but this
Cys-effect was less clear than for mortality and hatching. Furthermore, AgNPs appeared
to adsorb to the embryo chorion as evident from the orange coloration, which was absent
in presence of 8.8 M Cys (Fig. 2.4).
The incidence of abnormalities generally increased with both Ag-types especially at
the higher concentrations and included non-depleted yolk, bent tail, malformed spine, and
edema (data not shown). It is important to note that even though both Ag-types resulted
in embryonic abnormalities, there were no consistent trends (i.e. embryos exposed to the
higher concentrations of Ag+/AgNP did not always develop abnormalities).
In a separate experiment embryos were exposed to UV light (intensity of 2500
µW/cm2 UV-B, 85 µW/cm
2 UV-A for 4 h at 3 hpf) together with Ag
+ or AgNP to test the
photocatalytic properties of AgNPs. UV-treatment had no additional effects on mortality,
hatching, or abnormalities (data not shown). The UV, however, reduced the heart rate by
15% regardless of treatment (data not shown).
2.3.3. ROS generation and antioxidant levels
Both Ag-types appeared to elevate ROS (Fig. 2.5). Overall, the exposed embryos
were more likely to display a higher fluorescence and had a higher ROS-score. This was
especially evident with the embryos exposed to 0.31 μg/mL Ag+ (Fig. 2.5F) with 75% of
the embryos displaying the higher fluorescence phenotype, these embryos also had a
significantly (Table 2.1) higher ROS-score (Fig. 2.5K). Despite the increased ROS

41
generation, the exposed embryos appeared normal on the bright field images (Fig 2.5).
The generation of ROS is supported by the glutathione results as both Ag-types
significantly reduced TGSH levels and Ag+ was more potent than AgNPs (Fig. 2.6A).
This decrease in TGSH was a result of a dose-dependent depletion of GSH, which was
most potent in the case of Ag+ treatment. Cys treatment significantly improved the levels
of TGSH and even at the highest Ag+ concentration the TGSH doubled. Levels of GSSG
generally increased with increasing concentrations of both Ag-types, but none of these
changes were statistically significant (Fig. 2.6B). Embryos treated with Cys showed
equivalent GSSG levels, which were lower than the GSSG levels in control embryos not
treated with Cys; this effect was independent of Ag treatment. The ratio of GSSG to
TGSH was calculated as a measure of oxidative stress (Fig. 2.6C), and increased with Ag
concentration independent of Ag-type. This trend was absent with Cys treatment.
Antioxidant enzymes activities are summarized in Table 2.2. GR activities were not
statistically different between any Ag treatments nor did the addition of Cys have any
effect on activities. GPx activities also were not significantly different between Ag
treatments, although a trend for lower GPx activities with increasing Ag+ concentrations
was apparent and most replicates at the highest Ag+ concentration had below background
activities. This tendency was eliminated by Cys treatment. Interestingly, Cys-treated
control embryos had higher GPx activities than their Cys-free counterparts. CAT
activities showed no significant differences between any Ag treatments; however, Cys
significantly increased CAT activities. Finally, SOD activities did not show significant
differences between any Ag treatments, while Cys significantly decreased SOD activity.

42
Table 2.1. Summary of statistical analysis (P-values). Three-way ANOVA with post-hoc
Holm-Sidak method was used to assess statistical differences (P ≤ 0.050) on data found
in Figures 2.2, 2.3, 2.6 and Table 2.2. The three factors were Ag-type, Ag concentration,
and cysteine (Cys). ‘NS’ denotes ‘not significant’.
Endpoint Ag-type
(A)
Cys +/-
(B)
Ag conc
(C)
Interactions
AxB AxC BxC AxBxC
Mortality < 0.001 < 0.001 < 0.001 < 0.001 NS < 0.001 0.028
Hatching < 0.001 < 0.001 < 0.001 < 0.001 NS NS < 0.001
Heart rate < 0.001 < 0.001 NS NS NS NS < 0.001
TGSH < 0.001 < 0.001 < 0.001 0.011 NS < 0.001 < 0.001
GSSG NS < 0.001 NS NS NS NS NS
GSSG/TGSH NS < 0.001 0.050 NS NS NS NS
GR NS NS NS NS NS NS NS
CAT NS 0.004 NS NS NS NS NS
SOD NS < 0.001 NS NS NS NS NS
GPx NS 0.011 NS NS NS NS NS

43
Table 2.2. Activities of antioxidant enzymes in zebrafish exposed to various Ag+ or
AgNP concentrations in the presence or absence of cysteine (Cys) until 4 dpf. The
activities of catalase (CAT), glutathione reductase (GR), glutathione peroxidase (GPx),
and superoxide dismutase (SOD) were assessed in 96 hpf larvae. Data are presented as
Mean ± SEM (n = 8-13 for Cys non-treated embryos and 3-4 for Cys-treated embryos).
Three-way ANOVA with post-hoc Holm-Sidak method was used to assess statistical
differences (see Table 2.1).

44
CA
T1
GR
2
GP
x2
SO
D1
A
g c
onc
(g/m
L)
No C
ys
Cys
No C
ys
Cys
No C
ys
Cys
No C
ys
Cys
C
25.0
±2.5
28.6
±6.4
8.6
±0.7
10.6
±0.3
24.0
±3.6
37.7
±2.3
2.9
±0.4
2.1
±0.1
0.0
3
Ag
+
20.5
±2.9
20.8
±3.0
8.3
±1.0
9.5
±0.5
18.4
±4.6
26.5
±5.3
3.0
±0.4
1.9
±0.1
AgN
P
21.3
±3.6
32.6
±6.5
8.5
±1.2
9.2
±1.7
20.1
±4.5
19.9
±7.0
3.9
±0.8
2.0
±0.3
0.1
6
Ag
+
24.5
±2.9
22.6
±0.8
8.1
±1.5
10.0
±0.2
19.3
±6.7
25.5
±10.0
3.5
±0.5
1.8
±0.1
AgN
P
24.4
±2.7
29.4
±3.3
8.7
±1.0
8.8
±0.4
12.4
±4.2
19.4
±4.2
3.8
±0.6
1.7
±0.1
0.3
1
Ag
+
22.7
±3.8
26.5
±2.3
9.9
±2.6
10.3
±0.9
17.0
±6.2
21.4
±4.6
3.8
±0.6
2.0
±0.2
AgN
P
25.2
±2.5
32.2
±3.2
8.4
±1.1
9.9
±0.4
13.6
±4.8
24.2
±3.7
7.3
±1.8
1.9
±0.1
0.7
8
Ag
+
22.4
±2.7
26.7
±6.3
8.2
±1.7
9.8
±0.6
10.4
±3.8
23.6
±4.2
3.1
±0.6
1.9
±0.1
AgN
P
25.8
±2.4
28.7
±2.5
9.3
±1.2
8.8
±0.4
12.5
±4.4
18.6
±1.8
3.6
±0.5
1.9
±0.1
1.5
5
Ag
+
22.2
±3.1
33.0
±6.9
8.4
±1.8
8.1
±1.2
3.5
±3.5
*
19.9
±4.6
3.2
±0.6
2.0
±0.2
AgN
P
18.3
±1.7
26.6
±2.4
8.0
±1.4
8.7
±0.2
14.6
±5.2
19.2
±2.6
3.5
±0.4
1.7
±0.1
1
mol/
min
/mg
2 n
mol/
min
/mg
* m
ost
of
the
repli
cate
s in
this
gro
up w
ere
bel
ow
the
det
ecti
on l
imit

45
Figure 2.1. Characterization of Vive Nano AgNPs used in this study. A. Dynamic Light
Scattering (DLS) results of a 10 µg/mL AgNP solution prepared in egg water. Data are
presented as Mean + SD (n = 10). B,C. Scanning Transmission Electron Microscope
(STEM) results of a 10 µg/mL AgNP solution prepared in MilliQ water. Photos were
captured from transmission electron diffraction (TED) (B) and back scattering of
electrons (C).

46

47
Figure 2.2. Mortality of zebrafish exposed to various Ag+ or AgNP concentrations in the
presence or absence of cysteine (Cys) until 4 dpf. A. Mortality of zebrafish embryos after
96 hpf is presented as a percentage of those embryos that died. Data are presented as
Mean + SEM (n = 7-15). Three-way ANOVA with post-hoc Holm-Sidak method was
used to assess statistical differences (see Table 2.1). B. Probit analysis was used to
determine the LC50 values for Ag+ and AgNP based on the mortality data. The r
2 values
are 0.96 and 0.75 for Ag+ and AgNP, respectively.

48
Total silver (g/mL)
0.01 0.1 1 10
Pro
bit
s o
f m
ort
ality
2
3
4
5
6
C 0.03 0.16 0.31 0.78 1.55
Mo
rtality
(%
)
0
20
40
60
80
100A
AgAgNP
+
B
ControlAgAgNPControl (cys)Ag (cys)AgNP (cys)
+
+
49
Figure 2.3. Hatching success and heart rate of zebrafish exposed to various Ag+ or AgNP
concentrations in the presence or absence of cysteine (Cys) until 4 dpf. A. Hatching
success of zebrafish embryos at 48 hpf is presented as a percentage of total live embryos
(n = 7-15). B. Heart rate of zebrafish embryos at 48 hpf (n = 8-17). Data are presented as
Mean + SEM in both graphs. Three-way ANOVA with post-hoc Holm-Sidak method was
used to assess statistical differences (see Table 2.1).

50
Ha
tch
ing
at
48
hp
f (%
)
0
20
40
60
80
100
120 ControlAgAgNPControl (cys)Ag (cys)AgNP (cys)
+
+
A
Total silver (g/ml)
C 0.03 0.16 0.31 0.78 1.55
He
art
ra
te a
t 4
8 h
pf
(be
ats
/min
)
100
120
140
160
180B

51
Figure 2.4. Adsorption of AgNPs to the chorion of the zebrafish embryo at 24 hpf. The
representative images are shown for A. Control embryos; B. Embryos exposed to AgNPs
(1.55 μg/mL) in the presence of cysteine (Cys; 8.8 μM); C. Embryos exposed to AgNPs
(1.55 μg/mL) in the presence of Cys (4.4 μM); D. Embryos exposed to AgNPs (1.55
μg/mL) in the absence of Cys.

52

53
Figure 2.5. Reactive oxygen species (ROS) generation in zebrafish exposed to various
Ag+ or AgNP concentrations until 3 dpf. Bright field images are displayed in panels A, C,
E, G, and I, whereas panels B, D, F, H, and J display the same images using the GFP
filter. The representative images from three different experiments are shown for (A and
B) Control embryo; (C and D) Embryo exposed to 0.03 μg/mL Ag+; (E and F) Embryo
exposed to 0.31 μg/mL Ag+; (G and H) Embryo exposed to 0.03 μg/mL AgNP; (I and J).
The percentage on each of the fluorescent images refers to the percentage of embryos
displaying the phenotype displayed on the image. K. The fluorescence data were
quantified using a scoring system (ROS-score), such that a score of 1 was assigned if the
image resembled the majority of the controls and 2 if it did not. Data are presented as
Mean + SEM. The asterisk indicates statistical differences between the exposed and the
control embryos. One-way ANOVA was used to assess statistical differences (P ≤ 0.050).

54

55
Figure 2.6. Glutathione levels in zebrafish exposed to various Ag+ or AgNP
concentrations in the presence or absence of cysteine (Cys) until 4 dpf. A. Total
glutathione (TGSH = GSH + 2GSSG) levels. B. Oxidized glutathione (GSSG) levels. C.
Ratio of GSSG to TGSH. Data are presented as Mean + SEM (n = 4-9). Three-way
ANOVA with post-hoc Holm-Sidak method was used to assess statistical differences (see
Table 2.1).
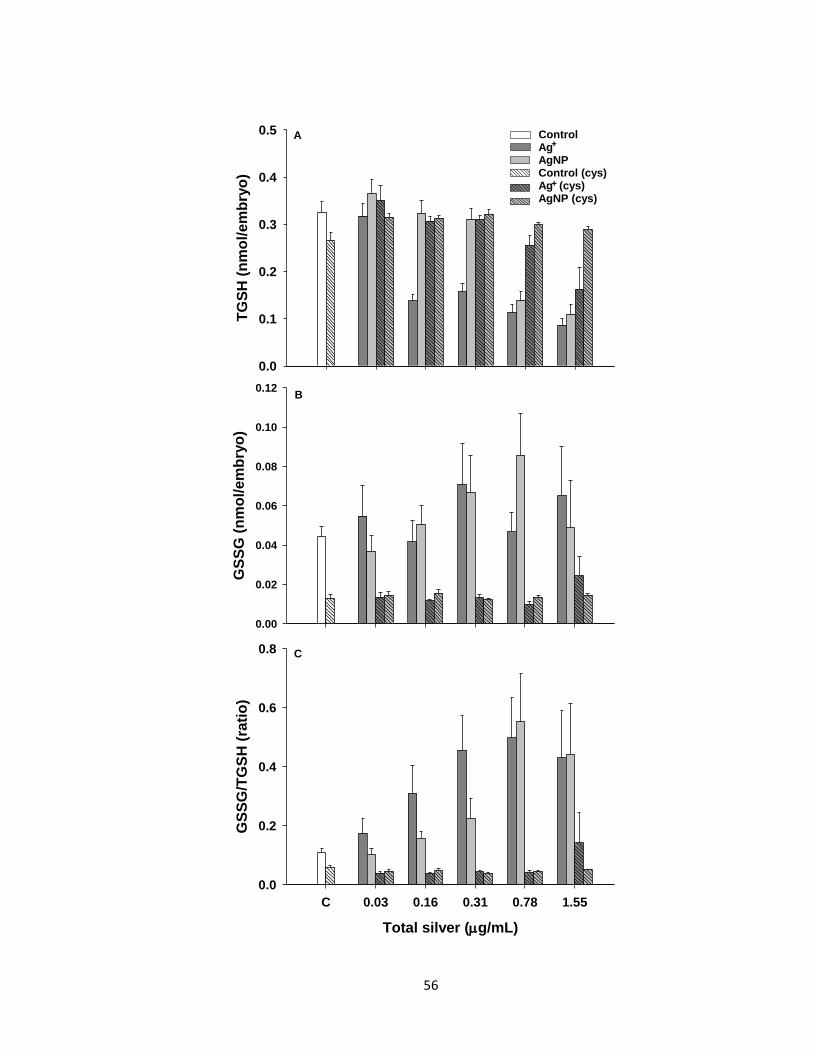
56
GS
SG
(n
mo
l/e
mb
ryo
)
0.00
0.02
0.04
0.06
0.08
0.10
0.12
TG
SH
(n
mo
l/e
mb
ryo
)
0.0
0.1
0.2
0.3
0.4
0.5
Total silver (g/mL)
C 0.03 0.16 0.31 0.78 1.55
GS
SG
/TG
SH
(ra
tio
)
0.0
0.2
0.4
0.6
0.8
A
B
C
ControlAgAgNPControl (cys)Ag (cys)AgNP (cys)
+
+

57
2.4. Discussion
We demonstrate that Ag+ had greater effects than AgNP on zebrafish embryos. The
amount of dissolved Ag+ from AgNPs was low and estimated at less than 0.5%.
Assuming 0.5% dissolution, the exposure concentrations of 0.03-1.55 μg/mL AgNPs
would have contributed amounts of Ag+ between 0.15 and 7.8 ng/mL, which were less
than the lowest Ag+ concentration used in this study. However, these low Ag
+
concentrations originating from the dissolution of AgNPs are in the same range as those
that inhibit the trout gill Na+,K
+-ATPase (Wood et al., 1999). Nonetheless, our study
suggests that the effects seen for AgNPs are not simply due to Ag+ dissolution. This may
explain why Ag+ was a more potent form of silver at the lower concentrations. However,
at the higher concentrations the toxicity of AgNPs was similar to that of Ag+, suggesting
that AgNPs are also toxic.
The LC50 at 96 hpf for AgNPs was reported at 1.18 µg/mL. This LC50 is much
lower than previously reported LC50s, which ranged 10-100 μg/mL (Asharani et al.,
2008; 2011; Bar-Ilan et al., 2009). These discrepancies may be due to the differences in
AgNPs size and capping agent. There was less difference for Ag+ LC50 reported here
(0.07 μg/mL) and elsewhere (0.03 μg/mL; Bar-Ilan et al., 2009). Moreover, several
physical deformities were observed at all concentrations of both Ag+ and AgNPs, but
without a consistent trend. Physical deformities in zebrafish embryos, including bent and
twisted notochord, pericardial edema, and degeneration of body parts, were noted
previously using concentrations of 50-100 µg/mL of BSA- and starch-coated AgNPs (5-
20 nm) (Asharani et al., 2008) and 100 µM (roughly 10 µg/mL) of synthesized colloidal
nanosilver (3-100 nm) (Bar-Ilan et al., 2009). The mortality and higher incidence of

58
physical deformities could be at least partially attributed to the depressed heart rate
observed in this study. AgNPs have been previously shown to interfere with normal
activity of cardiac muscles. Improper blood flow to the brain and the spinal cord could
starve the cells of essential nutrients and gases leading to decomposition (Asharani et al.,
2008).
Furthermore, the hatching of embryos at 48 hpf was significantly delayed by both
forms of silver. The Ag+ was more effective and delayed the hatching even at the lowest
concentration. However, at the higher concentrations the delay was similar for both types
of silver, suggesting that AgNPs toxicity is not solely due to Ag+ dissolution. Delay in
hatching in response to AgNPs exposure was documented previously (Asharani et al.,
2008; 2011; Yeo and Kang, 2008; Bar-Ilan et al., 2009; George et al., 2011; Powers et al.,
2011) and could be attributed to the adsorption of AgNPs to the embryo chorion evident
from the orange coloration. This was not expected because the pores of the chorion are
500-700 nm in diameter (Fako and Furgeson, 2009) and the AgNPs used here are 10-20
nm and non-aggregating. The adsorption of AgNPs to the chorion must be related to
interactions between the AgNPs and components of the chorion, which could impact the
transport of molecules between the internal and the external environments and delay
hatching and/or decrease survival. In addition, AgNPs have been shown to inhibit the
protease enzymes responsible for hatching (personal communication Drs. Kimberly Ong
and Greg Goss, University of Alberta). Future studies should investigate whether the
AgNPs are passing through the chorion.
The effects on hatching, heart rate, and survival were abolished by Cys, a non-
essential amino acid, which contains a reactive thiol group. It has been previously shown

59
that silver ions have a high affinity for thiol-containing molecules including Cys (Liu and
Sun, 1981; Liau et al., 1997; Kramer et al., 2009) and that Cys can protect from silver
ions toxicity (Hussain et al., 1992; Liau et al., 1997; Yin et al., 2011). Cysteine also
adsorbs to the surface of AgNPs, an effect that can be used to detect Cys since the Cys-
AgNP complex results in a shift of surface absorption (Wu et al., 2009; Hajizadeh et al.,
2012). Our study clearly demonstrates the ability of Cys to reduce the toxicity of both
types of silver, possibly due to the formation of these Cys-Ag complexes. Furthermore,
the adsorption of AgNPs noted above was prevented by Cys treatment as the embryos
exposed concurrently to AgNPs and Cys had chorion similar in color to the control
embryos. The effects of Cys on AgNP toxicity in this study contrast those of Navarro et
al. (2008) and Yin et al. (2011), who both used Cys to differentiate the AgNP from Ag+
dissolution from AgNPs effects. The former study suggested that the toxicity of AgNPs
in algae (Chlamydomonas reinhardtii) was due to Ag+ dissolution since Cys reduced
AgNP toxicity; whereas the latter study reported that Cys did not affect the toxicity of
AgNPs in common grass (Lolium multiflorum). These discrepancies suggest that the
effect of Cys on AgNPs should be examined more closely in future studies.
Although the mechanisms for AgNP toxicity remain speculative, oxidative stress
may be involved (Yeo and Kang, 2008; Chae et al., 2009; Wise et al., 2010). Our data
supports this view as both types of silver generated ROS, reduced glutathione levels, and
increased GSSG/TGSH ratios. The Ag+ was more potent than the AgNPs in elevating
ROS and reducing the GSH levels even at the lowest concentrations used. The depletion
of GSH is indicative of oxidative stress since GSH acts as an electron donor to neutralize
ROS (Park, et al., 2009; Tuncer, et al., 2010). This is consistent with Hussain et al. (2005)

60
and Piao et al. (2011), showing that in rat and human liver cells AgNP exposure resulted
in GSH depletion, reduced mitochondrial potential, and increased ROS levels; Ag+-
mediated generation of ROS is also reported (Park et al., 2009). Alternatively, AgNPs
were reported to interfere with the activity of GSH-synthesizing enzymes, reducing GSH
levels (Piao et al., 2011). Activities of these enzymes were not measured in this study.
Furthermore, Ag+ has a strong affinity for redox-reactive and protective SH groups, like
those found in GSH, that could be responsible for the observed GSH depletion (Carlson,
et al. 2008; Kramer et al., 2009). It is unclear as to which mechanism is responsible for
the observed depletion of GSH, perhaps all three are involved but it is certain that
decreased GSH levels would increase the embryo susceptibility to oxidative damage.
Moreover, it would be expected that as GSH reacts with ROS the levels of GSSG would
increase; however, this study showed only a slight, insignificant trend for increased levels
of GSSG upon exposure to both types of Ag.
The glutathione levels improved with Cys addition, such that only the highest Ag+
concentration showed a reduction while the rest of the Ag-treated embryos displayed
TGSH levels that were similar to the control group. It is possible, however, that in
addition to the formation of Cys-Ag complexes Cys may also act as an antioxidant
(Rayburn and Friedman, 2010; Tuncer et al., 2010). Importantly, it is the cysteine residue
that confers antioxidant activity to GSH. Furthermore, Cys treatment reduced the GSSG
levels in comparison with Cys-free embryos, which is also observed for the control
groups. This could be explained by the ability of Cys to act as an antioxidant, thus
reducing the usage of GSH and its conversion into GSSG. This would be also true of the
control embryos since minimal oxidative stress naturally occurs in all aerobic organisms.
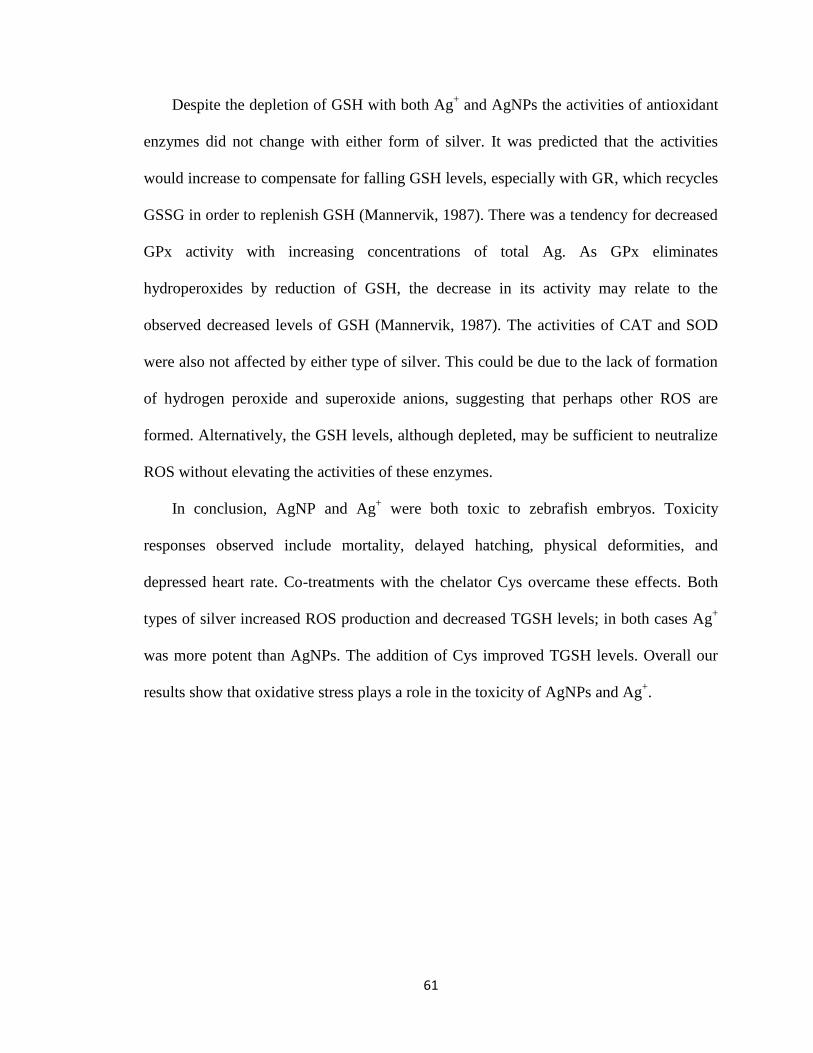
61
Despite the depletion of GSH with both Ag+ and AgNPs the activities of antioxidant
enzymes did not change with either form of silver. It was predicted that the activities
would increase to compensate for falling GSH levels, especially with GR, which recycles
GSSG in order to replenish GSH (Mannervik, 1987). There was a tendency for decreased
GPx activity with increasing concentrations of total Ag. As GPx eliminates
hydroperoxides by reduction of GSH, the decrease in its activity may relate to the
observed decreased levels of GSH (Mannervik, 1987). The activities of CAT and SOD
were also not affected by either type of silver. This could be due to the lack of formation
of hydrogen peroxide and superoxide anions, suggesting that perhaps other ROS are
formed. Alternatively, the GSH levels, although depleted, may be sufficient to neutralize
ROS without elevating the activities of these enzymes.
In conclusion, AgNP and Ag+ were both toxic to zebrafish embryos. Toxicity
responses observed include mortality, delayed hatching, physical deformities, and
depressed heart rate. Co-treatments with the chelator Cys overcame these effects. Both
types of silver increased ROS production and decreased TGSH levels; in both cases Ag+
was more potent than AgNPs. The addition of Cys improved TGSH levels. Overall our
results show that oxidative stress plays a role in the toxicity of AgNPs and Ag+.
62
CHAPTER 3
Acute embryonic exposure to nanosilver or silver ion does not disrupt
the stress response in zebrafish (Danio rerio) larvae and adults
This chapter is based upon the following article: Massarsky, A., Strek, L., Craig, P.M.,
Eisa-Beygi, S., Trudeau, V.L., Moon, T.W., 2014. Acute embryonic exposure to
nanosilver or silver ion does not disrupt the stress response in zebrafish (Danio rerio)
larvae and adults. Sci. Total Environ. 478, 133-140.
Permission was obtained from the journal for incorporation of this article into this thesis.
The article is based on the work that was conducted with the assistance of the
undergraduate student Laura Strek (summer 2012; internship student from Université
Nice Sophia Antipolis, France), whom I directly supervised, as well as my lab colleagues
Drs. Paul Craig (RT-PCR work) and Shahram Eisa-Beygi (zebrafish spawning,
husbandry, and dissections). I designed and conducted these experiments, and wrote the
manuscript. Drs. Vance Trudeau and Thomas Moon provided input into the preparation
of the manuscript and funding for the project.
63
3.1. Introduction
The advent of nanotechnology is considered the largest engineering innovation since
the Industrial Revolution (Roco, 2005). Engineered nanomaterials (ENMs) are particles,
tubes, rods, or fibers of less than 100 nm in at least one dimension (Niemeyer, 2001).
ENMs are applicable in many fields, including healthcare, electronics, cosmetics, and
clothing due to their unique physicochemical properties (Niemeyer, 2001). However, the
same properties that make ENMs beneficial may also contribute to their toxicity,
especially in relation to their ability to generate reactive oxygen species (ROS) and
induce oxidative stress (Oberdörster et al., 2005; Lynch et al., 2007; Aillon et al., 2009;
Prencipe et al., 2009).
The most common ENM in consumer products is silver nanoparticles (AgNPs)
(Nanotechproject, 2013). The antimicrobial properties of silver (Ag) have been exploited
since the 1800s (Chernousova and Epple, 2013), and in the mid-20th
century Ag was
introduced to treat burn wounds (Fong and Wood, 2006). Today Ag is commonly used in
wound dressings and coatings of medical products. In recent years nanotechnology has
improved the use of Ag for antimicrobial purposes through the synthesis and the
subsequent incorporation of the AgNPs into various household and consumer products,
including clothing, children toys, air and water purifiers (Nanotechproject, 2013).
ENMs have the potential to improve the quality of life, but they also raise health and
safety concerns, especially in relation to the aquatic environment (Moore, 2006). Their
application in clothing and personal care and household products may lead to their
introduction into sewage treatment plants and ultimately into the aquatic environment.
For example, studies demonstrated that various AgNP-textiles released 4.5-575 μg Ag/g

64
textile under various washing conditions (Benn and Westerhoff, 2008; Geranio et al.,
2009; Lorenz et al., 2012), and a recent study reported that physical activity resulting in
sweating can release even more Ag than normal washing (von Goetz et al., 2013).
Although the environmental concentrations of AgNPs are unknown, Blaser et al. (2008)
predicted concentrations of 40-320 ng/L, whereas Gottschalk et al. (2009) estimated
0.088-2.63 ng/L AgNPs in surface water.
A number of studies investigated the toxicity of AgNPs (concentrations ranged from
0.004 ng/mL to 0.1 mg/mL) in zebrafish (Danio rerio). These studies demonstrated that
exposure to AgNPs altered gill filament morphology and global gene expression in adult
zebrafish (Griffitt et al., 2009) and increased physical deformities in zebrafish embryos,
including bent and twisted notochord, pericardial edema, reduced heart rate, and
degeneration of body parts (Lee et al., 2007; Asharani et al., 2008; Bar-Ilan et al., 2009).
Moreover, AgNPs delayed zebrafish embryo hatching (Yeo and Kang, 2008; George et
al., 2011; Asharani et al., 2011; Powers et al., 2011) and led to oxidative stress (Chapter
2; Massarsky et al., 2013).
Although a variety of effects are reported, the potential of AgNPs to act as endocrine
disruptors has not been sufficiently addressed. To the best of our knowledge this is the
first study that attempted to examine the potential of AgNPs to disrupt zebrafish
endocrine function, specifically the ability to elevate cortisol levels in response to stress.
Cortisol is the principal corticosteroid in teleost fish secreted in response to stress and
plays a key role in the regulation of the endocrine stress response (Mommsen et al.,
1999), and pioneering studies by Hontela and colleagues demonstrated that

65
environmental contaminants including metals could disrupt the ability of fish to elevate
cortisol levels when stressed (e.g. Hontela et al., 1995).
Fish display a typical vertebrate stress response, including an immediate response
mediated by the sympathetic nervous system and specifically epinephrine/norepinephrine
(‘fight-or-flight’ response), and a delayed hypothalamic–pituitary–interrenal (HPI) axis-
mediated response. The HPI axis involves the corticotropin-releasing factor (CRF), which
is produced in the preoptic area of the teleost brain located within the telencephalic stalk
region (Folgueira et al., 2004) in response to hypothalamic stimulation (Alderman and
Vijayan, 2012). In turn, CRF stimulates the release of the adrenocorticotropic hormone
(ACTH) from the pituitary by specific G-protein coupled receptors (CRF-R1 and CRF-
R2) and its further regulation by a shared binding protein (CRF-BP). Consequently,
ACTH, which is synthesized from pre-pro-opiomelanocortin (pre-POMC), stimulates
cortisol synthesis and release by interrenal cells of the fish head kidney (To et al., 2007).
The HPI axis in zebrafish is fully developed by 4 d post fertilization (dpf) (Alsop and
Vijayan, 2009); potentially, exposure to a toxicant during these early stages may impede
its proper development. Therefore, this study aimed to investigate whether the early life
exposure to AgNPs or Ag+ can disrupt the formation of the HPI axis, thus affecting the
ability of zebrafish larvae and/or adults to respond to a standardized stressor. To this end
we examined whole-body (larvae) and plasma (adults) cortisol levels, as well as the
abundance of CRF-related transcripts in larvae and in the adult brain. Cholesterol
(cortisol precursor) and triglycerides (potential energy source) were also assessed in
zebrafish larvae.

66
3.2. Materials and methods
3.2.1. Silver nanoparticles (AgNPs) and silver nitrate (AgNO3)
The AgNPs used in this study were carboxy-functionalized, stabilized by sodium
polyacrylate (31% total Ag) (Vive Nano, 13010L), and dispersed in water. These AgNPs
were prepared in egg water and were characterized previously (Chapter 2; Massarsky et
al., 2013) using Dynamic Light Scattering (8.39 ± 0.98 nm; average polydispersity index
of 0.156 ± 0.025) and Scanning Transmission Electron Microscope (~10-20 nm). The
amount of dissolved silver in the stock solution was estimated at 0.5% (Chapter 2;
Massarsky et al., 2013). AgNO3 (63.5% total Ag; source of Ag+) was purchased from
Sigma-Aldrich (204390) and a 100 g/mL stock solution was prepared in MilliQ water.
All Ag concentrations presented here are total Ag concentrations based upon the % Ag
content of both AgNPs and AgNO3.
3.2.2. Experimental set-up
See Chapter 2 (section 2.2.3) for details on zebrafish husbandry and embryo
collection procedures. At 2 h post fertilization (hpf), 20 embryos were randomly assigned
to 5.3 cm plastic Petri dishes, containing a total volume of 14 mL egg water
supplemented with 1 mL of AgNPs, AgNO3 (Ag+), or MilliQ water (for control
embryos). The nominal exposure concentrations were 0.5 and 0.05 µg/mL total Ag for
AgNPs and Ag+, respectively. These concentrations were used here as they led to similar
mortality rates in our previous study (Chapter 2; Massarsky et al., 2013). The Ag+
chelator cysteine (Cys) that also binds to and induces aggreagtion of AgNPs (Hajizadeh
et al., 2012) was used in rescue experiments. Cysteine (8.8 μM final concentration) was

67
prepared in water and added to the egg water prior to the addition of each Ag treatment.
Static exposures were conducted in an incubator at 28°C until 4 dpf, similarly to our
previous study (Chapter 2; Massarsky et al., 2013). The embryos were not fed as the yolk
sac provides sufficient nutrients until depleted at approximately 6 dpf (Westerfield,
2000). Throughout the exposure period heart rate (at 48 hpf), hatching success (at 56
hpf), and survival (every 24 h) were evaluated. At 4 dpf the surviving larvae from control
and treatment groups were either 1) stressed using swirling as per Alsop and Vijayan
(2008), left for 5 min, then euthanized on ice, rinsed with ice-cold distilled water, frozen
on dry ice, and stored at -80°C until further analysis, or 2) raised to adulthood (10
months) in clean water without Ag to assess the adult stress response (the experimental
set-up is summarized in Figure 3.1). These fish were housed at a maximum density of 5
fish/L in 3 L tanks and fed approximately 1% body weight twice a day; the food
consisted of 2:1:1 mixture of Adult Zebrafish Complete Diet (Zeigler®), Spirulina
Aquarium Flake Food (Ocean Star International), and Golden Pearls 300-500 m
(Artemia International LLC). All experiments were performed on embryo batches
generated from at least four (n ≥ 4) separate ‘mating events’ with each treatment having
two replicate Petri dishes. Embryos from four batches (n = 4) were raised to adulthood.
3.2.3. Adult zebrafish tissue collection
Ten months old adult zebrafish were stressed using the standard netting stress of
Ramsay et al. (2009) and euthanized in ice-cold water. The fish were weighed and blood
(5-15 L) from the amputated-tail region was carefully collected into a 0.2 mL PCR tube
using a heparinized capillary tube. The blood was centrifuged at 7000 g for 2 min and the

68
resulting plasma was collected into a fresh 0.2 mL PCR tube (plasma from two fish of
same sex was pooled to ensure sufficient volume for cortisol analysis). The cranial cap
was removed and the telencephalon (Fig. 3.2) was carefully excised, placed into a 1.5 mL
tube, and frozen on dry ice; at least two telencephalons were combined to ensure
sufficient RNA. Both CRF and CRF-BP genes are primarily expressed in the zebrafish
telencephalon (Alderman and Bernier, 2007), and to minimize the sampling time only the
telencephalon was collected. All samples were frozen as quickly as possible and stored at
-80°C until analyzed. Fish were euthanized between 10 am and 1 pm.
3.2.4. Lipid extraction
Total lipid extraction was performed using a modification of the Folch method
(Folch et al., 1957). Briefly, frozen zebrafish larvae were transferred to 15 mL Falcon
tubes to which 7.5 mL 2:1 chloroform-methanol (v/v) was added. The contents were
homogenized for 10 s with a tissue homogenizer (Polytron, Kinematica GmbH Kriens,
Luzern Brinkmann Instruments). The samples were incubated for 15 min at room
temperature to ensure an optimal extraction, and extracts were washed with 2 M KCl
containing 5 mM EDTA (1 part KCl to 5 parts extract). The tubes were shaken for 10 s
and incubated at room temperature for 30 min to ensure layer separation. The bottom
organic layer was collected into glass tubes and evaporated to dryness under a stream of
nitrogen gas. Following drying, 0.2 mL 2-methoxy-ethanol was added to each tube to
dissolve the lipid fraction. The tubes were vortexed for 10 s and contents were transferred
to fresh 1.5 mL conical centrifuge tubes.

69
3.2.5. Cortisol, cholesterol, and triglycerides assays
Cortisol content in larval lipid extracts and adult plasma was assessed using a
radioimmunoassay (RIA) 125
I kit as per the manufacturer’s protocol (MP Biomedicals,
Orangeburg, NY). Cholesterol and triglycerides contents were assessed in larval lipid
extracts using the cholesterol and triglycerides liquid reagent kits (TECO Diagnostic,
Anaheim, CA) following manufacturer’s protocols.
3.2.6. Total RNA extraction and cDNA synthesis
Total RNA from frozen zebrafish larvae was extracted using TRIzol Reagent
(Invitrogen, Carlsbad, CA) according to the manufacturer’s protocol. Total RNA from the
zebrafish telencephalon was isolated using a commercially available RNeasy mini-prep
kit (Qiagen) following manufacturer’s protocol. Total RNA concentration and purity
were determined using a NanoDrop 2000 Spectrophotometer (Thermo Scientific). The
RNA quality was further confirmed using gel electrophoresis. Samples were stored at -
80°C until cDNA synthesis using a QuantiTect Reverse Transcription kit (Qiagen)
following manufacturer’s protocol.
3.2.7. Quantitative RT-PCR analysis
3.2.7.1. Zebrafish larvae
Primers for CRF, CRF-BP, CRF-R2, POMCb, and β-actin (see Alderman and
Bernier, 2009) were acquired from Invitrogen (Table 3.1). Amplicon sizes were
confirmed using PCR and gel electrophoresis. Quantitative RT-PCR was performed using
a CFX96 Real-Time PCR detection system (BIORAD) with Brilliant III SYBR Green

70
Master Mix (Agilent Technologies, Santa Clara, CA). Each reaction contained 10 L
SYBR Green Master Mix, 0.3 L of diluted (1:500) reference dye, 1 L of each the
forward and reverse gene-specific primers (0.25 M), 6.7 L RNase/DNase-free purified
water (Roche), and 1 L diluted cDNA. The PCR cycling conditions were as follows:
initial denaturation at 95°C for 3 min, 40 cycles of 95°C for 20 s, 60°C for 20 s, and 72°C
for 30 s. A melt curve analysis was used at the end of each run to validate the
amplification of only one product. Standard curves were constructed for each target gene
using serial dilutions of a reference pool of representative cDNA from all experiments.
Both RNase/DNase-free H2O and non-reverse transcribed RNA control samples were
assayed to ensure no contamination was present in the
reagents or in the primers used. To
account for cDNA production and loading differences, all samples were normalized to the
abundance of the housekeeping gene -actin, which did not change significantly between
experimental treatments. The abundance of each transcript was further normalized to the
control group.
3.2.7.2. Zebrafish adults
The mRNA abundance in adult zebrafish telencephalon was quantified using a
Rotor-Gene Q Real-Time PCR machine (Qiagen). An additional set of primers was
designed using Integrated DNA Technology software (www.idtdna.com; Table 3.1) to
generate smaller amplicon sizes to account for the shorter cycling durations. Each
reaction contained 5 L Rotor-Gene SYBR Green PCR Master Mix (Qiagen), 1 L of
each the forward and reverse gene-specific primers (1 M), 2 L RNase/DNase-free
purified water (Roche), and 1 L diluted cDNA. The PCR Cycling conditions were as

71
follows: initial denaturation at 95°C for 3 min, 40 cycles of 95°C for 10 s, and 60°C for
15 s. Relative quantification of target transcript abundance was determined using the
Rotor-Gene Q software package (Qiagen). Standard curve analysis and contamination
controls were performed as above, and transcript abundance was normalized to -actin as
above. The abundance of each transcript was further normalized to the control group.
3.2.8. Statistical analysis
Statistical analyses were conducted using SigmaPlot (SPW 11; Systat Software, Inc.,
San Jose, CA). One-way analysis of variance (ANOVA) with a post-hoc Holm-Sidak
method was used to assess the effect of treatment (i.e. control, AgNPs, or Ag+) on gene
expression in larval and adult zebrafish. Two-way ANOVA with a post-hoc Holm-Sidak
method was used to assess the effects of treatment and Cys on mortality, hatching,
cortisol, cholesterol, and triglycerides levels in zebrafish larvae. Three-way ANOVA
with a post-hoc Holm-Sidak method was used to assess the effects of treatment, sex, and
stress on plasma cortisol levels in adult zebrafish. Significant differences from one- and
two-way ANOVA tests are indicated as letters and asterisks on the corresponding graphs,
whereas the results from the three-way ANOVA are summarized in Table 3.2. Linear
regression analysis was used to assess the relationship between fish mass and tank
density. In all cases P ≤ 0.050 was considered significant. The data are presented as
means and standard error of the mean (SEM).

72
3.3. Results
3.3.1. Embryo and adult zebrafish parameters
Both AgNPs (0.5 µg/mL) and Ag+ (0.05 µg/mL) significantly increased embryo
mortality. The average mortalities at 96 hpf for AgNPs and Ag+ were 40% and 30%,
respectively (Fig. 3.3A); most mortalities occurred by 24 hpf. Hatching at 56 hpf was
also significantly delayed by both Ag-types, with only 40-50% of the embryos hatching
by 56 hpf (Fig. 3.4B). Cys treatment significantly reduced mortality and increased
hatching success in Ag-treated embryos. There was no effect of treatment on heart rate at
48 hpf between the treated and control embryos, and with or without Cys; zebrafish
larvae had heart rates of ~110 beats/min (data not shown).
Interestingly, adult zebrafish mass at 10 months was significantly increased in fish
exposed to AgNPs as embryos (Fig. 3.4); however, this may reflect the number of fish in
a tank as there was a significant relationship between fish mass and the average number
of fish per tank (Fig. 3.4, inset), with the least populated tanks containing the bigger fish.
Housing the same number of fish per tank was not possible due to space limitations.
3.3.2. Cortisol, cholesterol, and triglycerides
The cortisol levels in zebrafish larvae were not affected by Ag-type. Stressed larvae
(4 dpf) had significantly higher cortisol levels by 2-3 times than the unstressed larvae
(Fig. 3.5). Similarly adult zebrafish exposed to Ag as embryos/larvae and raised in Ag-
free water for 10 months, responded to a netting stress by significantly increasing plasma
cortisol levels (Fig. 3.6). In fact stressed fish had 20-40 times higher levels than their
unstressed counterparts regardless of treatment (Table 3.2). Moreover, the unstressed

73
female fish had significantly higher cortisol levels than the males, but the males had
higher cortisol levels than the females when stressed (Fig. 3.6); there were significant
effects of sex and a significant interaction between sex and stress (Table 3.2). There was
no effect of Cys on cortisol levels in any treatment (data not shown). The cholesterol and
triglycerides levels were not significantly affected by Ag-type or Cys in zebrafish larvae
(data not shown); adults were not assessed.
3.3.3. Transcript abundance
As Cys did not impact cortisol levels, transcript abundance was assessed only in non-
Cys treated larvae/adults. Moreover, we did not predict that stress would induce
differences in transcript abundance given the short timeframe of the stressor (30 s for
larvae and 6 min for adults), so only the non-stressed larvae/adults were assessed. All
four transcripts (CRF, CRF-BP, CRF-R2, and POMCb) assessed were significantly
down-regulated by Ag+ in zebrafish larvae (Fig. 3.7). CRF-R1 transcripts were not
detected in zebrafish larvae (data not shown). Abundance of these transcripts in the adult
zebrafish telencephalon was differentially affected by Ag+ and sex of the fish. The
abundance of CRF-BP and CRF-R1 transcripts in males was down- and up-regulated,
respectively (Fig. 3.8A), whereas the abundance of CRF and CRF-R1 in females was
down-regulated (Fig. 3.8B). Transcripts for CRF-R2 and POMCb were not detected in
the telencephalon region. Abundance of CRF and CRF-related transcripts was not
significantly affected by AgNPs; however, there were trends for decreased abundance of
CRF-BP and increased abundance of CRF-R1 in males, while in females the abundance
of CRF and CRF-R1 was decreased.

74
Table 3.1. Primer sequences and amplicon sizes for the genes of interest used for larval
and adult zebrafish gene expression analysis.
Gene Accession No. Sequence 5’-3’ Size (bp)
CRF BC085458 F1: CGAGACATCCCAGTATCCAA
R1: GATGACAGTGTTGCGCTTCT
F2: GCCGATTTCCCTAGATCTGAC
R2: TCTTTGGCTGATGGGTTCG
465
147
CRF-BP NM001003459 F1: GCTGTGCTTCCTCCTGTTG
R1: CCTGATTGGTGGAGCCTGA
F2: CTAAAGCGAGAGTTACCAGAGG
R2: GATAACGTCAGTAGGTTCGCC
483
150
CRF-R1 XM691254.2
F2: CTGGGCTAAGAAAGGGAACTAC
R2: TGAAGAGGATGAATGCGACC
152
CRF-R2 XM681362 F1: GAATCGCTTACAGAGAGTGT
R1: ACCATCCAATGAAGAGGAAG
465
POMCb NM001083051 F1: GTTCTGTCCGTCTTGGCTTT
R1: GTGAACTGCTGTCCATTGCC
639
β-actin AF057040 F1: GGTATTGTGATGGACTCTGG
R1: AGCCACCGATCCAGACGGA
F2: TGAATCCCAAAGCCAACAGAG
R2: CCAGAGTCCATCACAATACCAG
583
139
1 Sequences used for zebrafish larvae Quantitative RT-PCR analysis
2 Sequences used for zebrafish adult Quantitative RT-PCR analysis

75
Table 3.2. Summary of statistical analysis (P-values). Three-way ANOVA with post-hoc
Holm-Sidak method was used to assess statistical differences (P ≤ 0.050) on data found
in Figure 3.6. The three factors were treatment (control, AgNP, Ag+), sex, and stress.
‘NS’ denotes not significant.
Factor/interaction P-value
Treatment (A) NS
Sex (B) 0.047
Stress (C) < 0.001
AxB NS
AxC NS
BxC 0.037
AxBxC NS
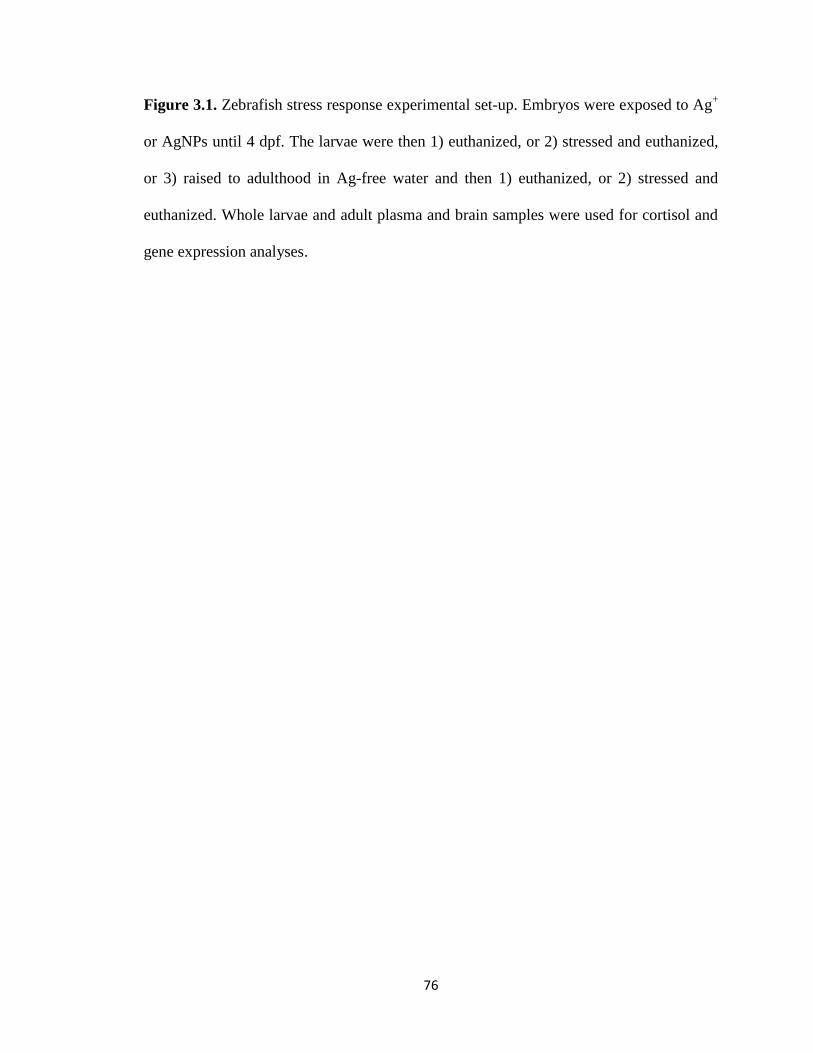
76
Figure 3.1. Zebrafish stress response experimental set-up. Embryos were exposed to Ag+
or AgNPs until 4 dpf. The larvae were then 1) euthanized, or 2) stressed and euthanized,
or 3) raised to adulthood in Ag-free water and then 1) euthanized, or 2) stressed and
euthanized. Whole larvae and adult plasma and brain samples were used for cortisol and
gene expression analyses.

77

78
Figure 3.2. Photomicrograph of the zebrafish brain regions: telencephalon (tel), optic
lobe (OL), cerebellum (C), and medulla (M). The excised area is shown by the red oval.

79
Figure 3.3. Mortality and hatching of zebrafish exposed to Ag+ (0.05 µg/mL) or AgNP
(0.5 µg/mL) in the presence or absence of cysteine (Cys) until 4 dpf. A. Mortality of
zebrafish embryos after 96 hpf is presented as a percentage of those embryos that died. B.
Hatching success of zebrafish embryos at 56 hpf is presented as a percentage of total live
embryos. Data are presented as Mean + SEM (n = 5-17 and 4-16 for mortality and
hatching, respectively). Capital and small letters indicate differences within treatments in
the absence and presence of cysteine (Cys), respectively. The asterisks indicate
differences between Cys-treated and non-treated embryos within the same treatment.
Two-way ANOVA with post-hoc Holm-Sidak method was used to assess statistical
differences (P ≤ 0.050).

80
Mo
rtality
(%
)
0
20
40
60
80
100No Cys
Cys
A
C
B
a
aa
Control AgNP Ag+
Hatc
hin
g (
%)
0
20
40
60
80
100
A
BB
a
a
a
A
B
*
**

81
Figure 3.4. Adult zebrafish mass at the end of the experiment (10 months) that were
treated with Ag+ or AgNP as embryos until 4 dpf (see Fig. 3.3 for details). Data are
presented as Mean + SEM (n = 4). Capital and small letters indicate differences within
treatments in the absence and presence of cysteine (Cys), respectively. Two-way
ANOVA with post-hoc Holm-Sidak method was used to assess statistical differences (P ≤
0.050). Inset: linear regression analysis of the fish mass as a function of the average
number of fish per tank: (1) control, (2) control (+Cys), (3) AgNPs, (4) AgNPs (+Cys),
(5) Ag+, (6) Ag
+ (+Cys). Data are presented as Mean ± SEM (n = 4). The r
2 and P values
are 0.81 and 0.015, respectively; the equation of the line is y = -0.0287x + 1.0382.
Control AgNP Ag+
Fis
h m
ass (
g)
0.0
0.5
1.0
1.5no cys
cys
A a
B
a
A
a
Average number
of fish per tank
4 8 12 16
Fis
h m
ass (
g)
0.4
0.6
0.8
1.0
1
2
34
6
5
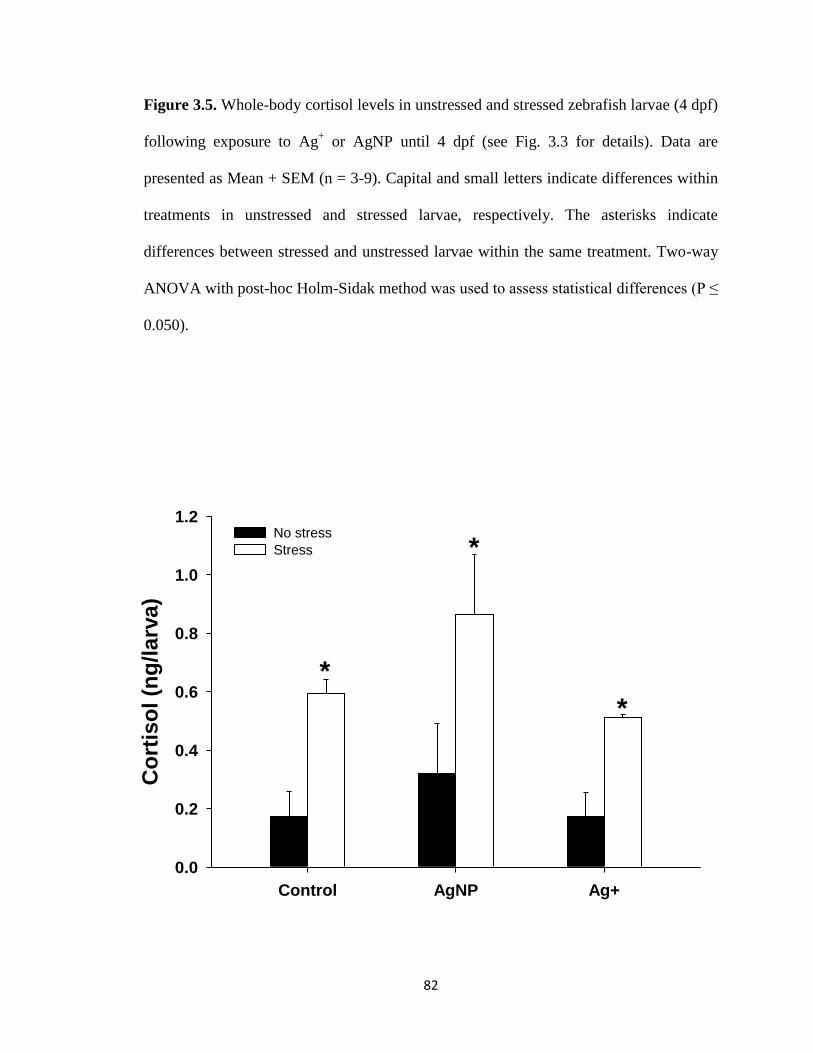
82
Figure 3.5. Whole-body cortisol levels in unstressed and stressed zebrafish larvae (4 dpf)
following exposure to Ag+ or AgNP until 4 dpf (see Fig. 3.3 for details). Data are
presented as Mean + SEM (n = 3-9). Capital and small letters indicate differences within
treatments in unstressed and stressed larvae, respectively. The asterisks indicate
differences between stressed and unstressed larvae within the same treatment. Two-way
ANOVA with post-hoc Holm-Sidak method was used to assess statistical differences (P ≤
0.050).
Control AgNP Ag+
Co
rtis
ol (n
g/larv
a)
0.0
0.2
0.4
0.6
0.8
1.0
1.2No stress
Stress
*
*
*

83
Figure 3.6. Plasma cortisol levels in unstressed and stressed male and female adult
zebrafish (10 months) that were treated with Ag+ or AgNP as embryos until 4 dpf (see
Fig. 3.3 for details). Data are presented as Mean + SEM (n = 4). Three-way ANOVA
with post-hoc Holm-Sidak method was used to assess statistical differences (see Table
3.2).
Control AgNP Ag+
Co
rtis
ol (n
g/m
L)
0
10
20
30
40
400
800
1200
1600 Males
Females
Males stress
Females stress

84
Figure 3.7. Transcript abundance within the HPI axis in 4 dpf zebrafish larvae following
exposure to Ag+ or AgNP until 4 dpf (see Fig. 3.3 for details): CRF, CRF-BP, CRF-R2,
and POMCb. Transcript abundance was normalized to the control group (see section
3.2.7 for details). Data are presented as Mean + SEM (n = 7). The letters indicate
differences in transcript abundance between treatments for a specific gene. One way-
ANOVA with post-hoc Holm-Sidak method was used to assess statistical differences (P ≤
0.050).
Control AgNP Ag+
Ex
pre
ssio
n/
-Ac
tin
0.0
0.5
1.0
1.5
2.0CRF
CRF-BP
CRF-R2
POMCb
AA A
A
A A
AAB
B
B
B
B

85
Figure 3.8. Transcript abundance within the HPI axis in 10 month old male (A) and
female (B) zebrafish that were treated with Ag+ or AgNP as embryos until 4 dpf (see Fig.
3.3 for details): CRF, CRF-BP, and CRF-R1. Transcript abundance was normalized to the
control group (see section 3.2.7 for details). Data are presented as Mean + SEM (n = 4).
The letters indicate differences in transcript abundance between treatments for a specific
gene. One way-ANOVA with post-hoc Holm-Sidak method was used to assess statistical
differences (P ≤ 0.050).

86
Ex
pre
ss
ion
/ -A
cti
n
0.0
0.5
1.0
1.5
2.0CRF
CRF-BP
CRF-R1
AA
AB
B
AB
B
Control AgNP Ag+
Ex
pre
ss
ion
/ -A
cti
n
0.0
0.5
1.0
1.5
2.0
A A
ABBAB
B
A
B

87
3.4. Discussion
This study for the first time demonstrated that an acute exposure to AgNPs or Ag+
during the early life stages did not impede the ability of larval and adult zebrafish to
elevate cortisol levels in response to a stressor, at least under the conditions described in
this study. The nominal concentrations used here were 0.5 and 0.05 μg/mL total Ag for
AgNPs and Ag+, respectively. These concentrations were chosen since the relatively low
mortality ensured sufficient larval survival, and the viability and hatching values at these
concentrations were similar to our previous study (Chapter 2; Massarsky et al., 2013). It
is important to note that the AgNP concentration used in this study is similar to previous
studies, although higher than the environmental concentrations of 0.088-2.63 and 40-320
ng/L in surface water predicted by Gottschalk et al. (2009) and Blaser et al. (2008),
respectively. As reported previously (Chapter 2; Massarsky et al., 2013), environmentally
relevant concentrations of AgNPs did not affect zebrafish embryos, at least with respect
to mortality, hatching, or oxidative stress.
The ability of environmental pollutants, especially metals, to impact the HPI axis
and/or cortisol levels in fish was addressed in several studies with variable results.
Cadmium disrupted the biosynthesis of cortisol through the suppression of
corticosteroidogenic gene transcripts in rainbow trout (Oncorhynchus mykiss) without
affecting cortisol production (Sandhu and Vijayan, 2011). Basal cortisol levels were not
affected in the sabalo (Prochilus lineatus) exposed to aluminum (Camargo et al., 2009) or
in the round goby (Neogobius melanostomus) from contaminated areas (Marentette et al.,
2013). In contrast, basal cortisol levels were increased in zebrafish exposed to copper
(Craig et al., 2009) and selenomethionine (Thomas and Janz, 2011), Nile tilapia
88
(Oreochromis niloticus) exposed to mercury (Cogun et al., 2011) and heavy metals (Firat
and Kargin, 2011), and carp (Cyprinus carpio) exposed to a variety of pollutants (Firat
and Alici, 2012). Lastly, chromium exposure in snakehead (Channa punctatus) decreased
basal cortisol levels (Mishra and Mohanty, 2009). Overall, these studies indicate the
importance of pollutant-type and fish species in eliciting a cortisol-mediated stress
response.
In contrast, in this study we hypothesized that an acute exposure to AgNPs or Ag+
during the early stages of zebrafish development would alter the proper formation and
functioning of the HPI axis in zebrafish embryos, and that these changes would persist in
the adult fish. This hypothesis was not supported by the cortisol data, which clearly
showed that both the larvae and the adult zebrafish were able to elevate cortisol levels in
response to a stressor equal to that of the control fish. Two issues should be raised with
respect to plasma cortisol levels in adult zebrafish. First, it is feasible to obtain enough
plasma to assess cortisol levels when combining 2-3 fish and perhaps future studies
should assess plasma cortisol instead of whole-body cortisol as generally done. Only a
few studies report plasma cortisol levels for zebrafish. Filby et al. (2010) reported that
subordinate (or ‘naturally’ stressed) zebrafish had higher cortisol levels than their
dominant counterparts (50-100 vs 75-175 ng/mL); this difference was especially apparent
in males. Félix et al. (2013) reported similar plasma cortisol levels in unstressed
zebrafish, such that males had slightly higher concentrations than females (57 vs 46
ng/mL). In contrast, the plasma cortisol levels for unstressed zebrafish adults reported
here ranged from 15 to 25 ng/mL and were similar to the 20 ng/mL levels reported by Ziv
et al. (2013) for unstressed male zebrafish. The cortisol levels for stressed fish reported

89
here ranged from 400 to 800 ng/mL, which probably reflects the maximal cortisol levels
elicited by the netting stress since the acute confinement method mentioned in Ziv et al.
(2013) elevated cortisol levels by only 1.5-fold.
Second, female fish had higher cortisol levels when unstressed while males had
higher levels when stressed. These differences could have been potentially missed if
whole-body cortisol levels were assessed. For example, Fuzzen et al. (2011) found no sex
differences in whole-body cortisol levels in unstressed or stressed (vortex stress) adult
zebrafish. In contrast, Filby et al. (2010) reported higher plasma cortisol levels in
subordinate (and supposedly stressed) males and to a lesser extent in females. Other
studies reporting sex differences in plasma cortisol levels in zebrafish were not found.
Sex differences in cortisol levels and their physiological importance should be
investigated further (using more natural stressors) since it appears that the ability to cope
with stress may be affected by sex.
Although Ag treatments did not affect larval cortisol levels, whole-body transcript
levels of CRF, CRF-R2, CRF-BP, and POMCb were significantly down-regulated in
Ag+-exposed larvae, suggesting that the HPI axis-mediated stress response could be
impaired. This was unexpected since no changes in cortisol levels were observed in Ag+-
exposed larvae. Also, Ag+ (0.05 µg/mL) was less toxic than AgNPs (0.5 µg/mL) based on
the mortality data and one would have predicted that changes should be observed in the
AgNPs-exposed larvae; given this did not happen, the toxicity mechanisms of AgNPs and
Ag+ may be quite different. Although CRF and CRF-related genes are most commonly
known to be involved with the regulation of the HPI axis-mediate stress response, these
genes also influence most if not all physiological functions in vertebrates, including
90
nervous, cardiovascular, immune, muscular, and reproductive systems, as well as
behavior and food intake (Yao and Denver, 2007; Alderman and Bernier, 2009).
Additionally, the CRF system is thought to play an important role during early
development of zebrafish embryos (Alderman and Bernier, 2009). Thus, it is possible that
other systems, which were not considered here, could be affected in zebrafish larvae in
response to Ag+ exposure. This is especially important since the whole-body transcript
levels were measured in the larvae, which may have masked even larger changes.
The transcript abundance for CRF, CRF-R1, and CRF-BP was also affected in the
adult zebrafish telencephalon. Significant changes were only observed in fish that were
exposed to Ag+ as embryos. In males the abundance of CRF transcripts was unaffected,
while that of CRF-BP and CRF-R1 was down- and up-regulated, respectively. In females
the abundance of CRF-BP transcripts was unaffected, while that of CRF and CRF-R1
was down-regulated. Precisely what these changes indicate is not clear, but these changes
did not affect the ability of fish to elevate cortisol levels in response to a stressor.
Alternatively, CRF-related peptides such as urotensin I could also elevate cortisol levels
during stress (Alderman and Bernier, 2009); therefore, if the function of HPI axis was
impaired, the urotensin I system could potentially compensate and increase cortisol
levels. This could explain why differences were observed for CRF-related transcript
levels but not cortisol levels. Finally, transcript abundance differed between males and
females, which could lead to the observed sex differences in cortisol levels in unstressed
and stressed fish.
Previous studies investigating the effects on the transcript levels of CRF and CRF-
related genes in larval and adult zebrafish emphasize the complexity of CRF regulation

91
and how it is impacted under various conditions. Embryos exposed to perfluorooctane
sulfonate (Shi et al., 2009), polybrominated diphenyl ethers (PBDE; Yu et al., 2010;
Chen et al., 2012), and microcystin (Yan et al., 2012) increased CRF transcript levels.
These studies, however, focused on the hypothalamic-pituitary-thyroid (HPT) axis, which
emphasizes the important role of CRF outside the HPI axis. In zebrafish adults,
prochloraz exposure down-regulated the transcript levels of brain CRF, CRF-BP, and
CRF-R2, and decreased plasma cortisol levels (Liu et al., 2011), while PBDE exposure
down-regulated brain CRF transcript levels (Yu et al., 2011). Moreover, adult zebrafish
subjected to a restraint stress decreased the transcript levels of brain CRF and CRF-
related genes and increased whole-body cortisol levels (Ghisleni et al., 2012). In contrast,
unpredictable chronic stress elevated brain CRF transcript levels (Piato et al., 2011;
Chakravarty et al., 2013) and increased whole-body cortisol levels (Piato et al., 2011).
Lastly, transport stress did not change the transcript levels of brain CRF, but increased
whole-body cortisol levels (Dhanasiri et al., 2013). This further supports the complexity
of the CRF and its involvement in physiological processes.
In conclusion, we demonstrate that even though the acute exposure to AgNPs and
Ag+ until 4 dpf influenced embryo viability and hatching, these Ag compounds did not
impact the ability of zebrafish larvae or adults to elevate cortisol when stressed.
Furthermore, we demonstrate that embryonic exposure to Ag+ down-regulated CRF and
CRF-related genes in larvae, and although these changes did not impair the cortisol-
mediated stress response, other systems not considered in this study, could have been
affected. The abundance of these transcripts was also differentially affected in the
telencephalon of the male and female adults exposed to Ag+ as embryos, suggesting
92
potential sex-differences in response to Ag+. Currently there are no studies on the impact
of either AgNPs or Ag+ on the fish HPI axis; our transcript results suggest that Ag
+ may
influence the CRF signaling, which should be pursued in future studies.

93
CHAPTER 4
Nanosilver cytotoxicity in rainbow trout (Oncorhynchus mykiss)
erythrocytes and hepatocytes
This chapter is based upon the following article: Massarsky, A., Abraham, R., Nguyen,
K.C., Rippstein, P., Tayabali, A.F., Trudeau, V.L., Moon, T.W., 2014. Nanosilver
cytotoxicity in rainbow trout (Oncorhynchus mykiss) erythrocytes and hepatocytes.
Comp. Biochem. Physiol. C 159, 10-21.
Permission was obtained from the journal for incorporation of this paper into this thesis.
The article is based on the work that was conducted with the assistance of the
undergraduate student Ren Abraham (2012), whom I directly supervised, as well as my
colleagues Kathy Nguyen (PhD student, Carleton University) and Dr. Azam Tayabali
(Health Canada, Ottawa), who financed the Transmission Electron Microscope work
carried out by Peter Rippstein (The Heart Institute, uOttawa). I designed and conducted
these experiments, and wrote the manuscript. Drs. Vance Trudeau and Thomas Moon
provided input into the preparation of the manuscript and funding for the project.

94
4.1. Introduction
As of October 2013 more than 1600 reported consumer products contained
engineered nanomaterials (ENMs) with silver nanoparticles (AgNPs) being the most
common (Nanotechproject, 2013). The increased interest in nanotechnology over recent
years has raised safety concerns. ENMs have at least one dimension of less than 100 nm
(Oberdörster et al., 2007; Handy et al., 2008). Particles of such size have a high surface
area to volume ratio and thus are more reactive, especially in relation to free radical
chemistry and formation of reactive oxygen species (ROS) (Lynch et al., 2007; Auffan et
al., 2009; Prencipe et al., 2009), which in turn could damage cellular components
(Oberdörster et al., 2005; Aillon et al., 2009).
Silver ions (Ag+) are well known to be toxic to fish through the inhibition of gill
Na+,K
+-ATPase and carbonic anhydrase and subsequent disruption of ionoregulation,
which ultimately may lead to fish death (Morgan and Wood, 2004). Silver ions also
accumulate in the blood, kidney, and liver of exposed fish (Wood et al., 1999). As an
antimicrobial agent, Ag+ has been applied extensively in medicine and advancements in
nanotechnology enabled the incorporation of AgNPs into many products as mentioned in
Chapter 1.
The widespread usage of AgNPs will lead to their appearance in the aquatic
environment; e.g., clothing items impregnated with AgNPs were reported to release 68-
377 μg/g Ag in simulated washing experiments (Benn and Westerhoff, 2008; Geranio et
al., 2009). However, the fate and behavior of AgNPs in the aquatic environment remain
unknown. Although Kaegi et al. (2011) reported that most AgNPs sorbed to wastewater
biosolids and were transformed into Ag2S, these findings could depend on the AgNP

95
coatings. A recent mesocosm study reported that AgNPs remained bioavailable in the
water column and accumulated in some organisms despite significant sulfidation (Lowry
et al., 2012). Also, AgNPs have been shown to disrupt ionoregulation in rainbow trout
(Oncorhynchus mykiss) by inhibiting the gill Na+,K
+-ATPase (Schultz et al., 2012) and to
accumulate in the liver of rainbow trout (Gagné et al., 2012), suggesting that some of
these particles pass through the gills into blood and accumulate in the liver. Moreover, we
have demonstrated the ability of AgNPs to elicit oxidative stress in zebrafish (Danio
rerio) embryos (Chapter 2; Massarsky et al., 2013) without affecting the cortisol-
mediated stress response (Chapter 3; Massarsky et al., 2014a).
Although several studies have previously addressed the cytotoxicity of AgNPs (see
section 4.4), this study emphasizes the relationship between AgNP toxicity and oxidative
stress and cellular damage to lipids, DNA, and proteins by examining the various
components of the antioxidant pathway in rainbow trout erythrocytes and hepatocytes, as
both of these cell types may be affected by AgNPs. It needs to be noted that erythrocytes
are a sensitive in vitro model for oxidative stress due to their susceptibility to
peroxidation arising from the high content of poly-unsaturated fatty acid in their cell
membranes and high cytoplasmic oxygen and iron concentrations, which continuously
produce ROS (Li et al., 2013). On the other hand, hepatocytes are extensively used in the
field of toxicology since liver is a major organ involved in xenobiotic metabolism
(Guillouzo, 1998; Castano et al., 2003). The well-studied toxicant Ag+ (as AgNO3) serves
as a ‘reference point’ for the toxicity of AgNPs. In addition to decreased cell viability, it
was predicted that AgNPs and Ag+ would generate ROS, which in turn would decrease
glutathione levels, increase damage to lipids, DNA, and proteins, and increase the

96
activities of cellular antioxidant enzymes. The enzymes assessed in this study were:
glutathione-S-transferase (GST), glutathione reductase (GR), glutathione peroxidase
(GPx), catalase (CAT), and superoxide dismutase (SOD). Moreover, the effects of
AgNPs and Ag+ were assessed in the presence and absence of cysteine (Cys) (see Chapter
2 for details). Finally, buthionine sulfoximine (BSO) co-exposure was used to reveal the
importance of reduced glutathione (GSH) in silver toxicity as BSO is known to inhibit γ-
glutamylcysteine synthetase thereby reducing GSH levels.
4.2. Materials and methods
4.2.1. Silver nanoparticles (AgNPs) and silver nitrate (AgNO3)
An aqueous solution of carboxy-functionalized AgNPs stabilized with sodium
polyacrylate (31% Ag) (Vive Nano, 13010L) was used in this study. The stock solution
of 1500 µg/mL was stored in dry and dark cabinet at room temperature as per
manufacturer’s recommendation, and was diluted to working concentrations in culture
medium on the day of each experiment. Silver nitrate (AgNO3; 63.5% Ag) was purchased
from Sigma Chemical Co. (product 204390) and a 750 µg/mL stock solution was
prepared in ultrapure water and diluted to working concentrations in culture medium.
Total nominal Ag concentrations noted on the figures were based on the Ag content of
each Ag-type used.
4.2.2. Characterization of AgNPs
The size, polydispersity index (PDI), and zeta-potential (-potential) of the AgNPs
were obtained using Dynamic Light Scattering (DLS; Zetasizer Nano, Malvern

97
Instruments Ltd). The size measurements (n=10) were performed on a freshly prepared
31 µg/mL AgNP solution in either MilliQ water or culture medium (see section 4.2.4 for
details). The Zetasizer automatically calculated the PDI for each measurement. The -
potential measurements (n=4) were performed on freshly prepared AgNP solutions of
various concentrations in either MilliQ water or culture medium. Scanning Transmission
Electron Microscope (STEM; JEOL JSM-7500F Field Emission Scanning Electron
Microscope) was used to visualize and confirm the DLS results; a 10 g/mL AgNP
solution was prepared in MilliQ water and applied to a carbon-coated grid, air-dried
overnight, and photos were captured from transmission electron diffraction (TED). The
dissolution of AgNPs was reported at 0.5% (Chapter 2; Massarsky et al., 2013).
Furthermore, light microscopy and UV-visible spectroscopy were used to determine
the effect of culture medium, BSO, and/or Cys on AgNPs. Briefly, culture medium or
MilliQ water (0.2 mL) were distributed among the wells on a 96-well plate; some wells
also received BSO [1 mM]final and/or Cys [0.35 mM]final. The AgNPs [31 μg/mL]final were
then added to the wells. Digital pictures were taken using a Nikon NBZ 1500 dissecting
microscope, equipped with a Nikon DXM 1200 C digital camera, to capture changes in
color and precipitate formation. Spectrophotometric measurements were then taken at
350-500 nm to estimate the absorption maximum, which typically peaks at ~400 nm
depending upon the nanoparticle size (Thomas et al., 2008; Ahamed et al., 2011; Song et
al., 2012). The plate was incubated at 13°C with gentle rotation. The microscopic
observations and spectrophotometric measurements were repeated at 24 and 48 h. Also, a
12-well plate was set up in a similar fashion (the volumes were adjusted accordingly) for
DLS measurements that were performed at 24 and 48 h.

98
4.2.3. Fish
Hatchery-reared female rainbow trout (250 g) were obtained from Linwood Acres
(Campellcroft, ON, Canada). The fish were housed at the University of Ottawa Aquatic
Care Facility in 3 m3 tanks supplied with 13°C dechloraminated City of Ottawa tap water
and acclimated for at least one month. The fish were kept under 12:12 h light-dark cycle
and were fed a commercial diet (3 PT classic floating grower feed; Martin Mills, Elmira,
ON, Canada) at 1% body weight once per day. All experiments were conducted under a
protocol approved by the University of Ottawa Animal Care Protocol Review Committee
in accordance with institutional animal care guidelines as defined by the Canadian
Council on Animal Care.
4.2.4. Erythrocyte and hepatocyte isolation
Rainbow trout were euthanized with an overdose of benzocaine and blood was
collected from the caudal vein using a heparinized syringe into a 50 mL Falcon tube
containing 15 mL culture medium [in mM: 136.9 NaCl, 5.4 KCl, 0.8 MgSO4, 5 NaHCO3,
0.33 Na2HPO4, 0.44 KH2PO4, 5 Hepes, 5 Na-Hepes, 1.5 CaCl2, 1X essential and non-
essential amino acids (Sigma M7145, M5550), 1X antibiotics (Invitrogen 15240), and 1%
bovine serum albumin (BSA); pH 7.63] supplemented with 50 U/mL heparin. The tube
with medium-diluted blood was centrifuged, the medium was discarded, and the cells
were resuspended in fresh culture medium. The procedure was repeated once more and
the cells were kept on ice during hepatocyte isolation. Hepatocytes were isolated
according to Mommsen et al. (1994). Briefly, Hanks’ medium was prepared (in mM:
136.9 NaCl, 5.4 KCl, 0.8 MgSO4, 5 NaHCO3, 0.33 Na2HPO4, 0.44 KH2PO4, 5 Hepes, 5
99
Na-Hepes) and used to prepare the rinsing, collagenase, resuspension, and culture
medium solutions all adjusted to pH 7.63 at room temperature. A mid-ventral incision
was made in the trout and a cannula was inserted into the hepatic portal vein. Using a
perfusion pump, the liver was perfused (2 mL/min) with rinsing solution containing 1
mM EGTA (the heart was cut to prevent pressure build-up in liver). Once the liver was
cleared of blood it was perfused with collagenase solution containing 0.15 mg/mL
collagenase (Sigma type IV). Once the liver had expanded and 'felt' soft, it was removed
and all adhering vessels/tissues (including the gall bladder) were carefully removed. It
was then diced with a razor blade in a glass Petri dish and sequentially filtered using 250
and 75 m nylon mesh. The collected hepatocytes were poured into 50 mL Falcon tubes
and centrifuged for 2 min at 1000 rpm (Sorvall RC centrifuge with SS-34 rotor) and 4°C.
Cells were resuspended in resuspension solution containing 1% BSA and centrifuged as
above. This was repeated twice more and finally cells were resuspended in culture
medium. Cell viability of both the erythrocytes and hepatocytes was determined using the
Trypan Blue exclusion method (Mommsen et al., 1994). Only cell suspensions with more
than 90% live cells were used in the experiments. Both cell types were then weighed and
the concentration was adjusted to 25 mg/mL (~5x10⁶ cells/mL). The cells were then
plated (0.4 mL/well) in 48-well plates (Corning 3338) and allowed to settle overnight at
13°C with gentle shaking.
4.2.5. Experimental set-up
Both cell types were exposed to AgNP or Ag+ solutions at equivalent total silver
contents; the concentrations were 3.1, 7.8, 15.5, 23.3, and 31 μg/mL. Control cells

100
received an equal volume of water. A combination of H2O2 and CuSO4 at 1 mM was used
as a positive control since individually 10 mM H2O2 and 1 mM CuSO4 were not
cytotoxic to cells after 48 h (data not shown); the combination of CuSO4 and H2O2
generates the highly oxidizing hydroxyl radical and was used previously by Mireles et al.
(1999) to induce lipid peroxidation in human neonatal erythrocytes. To evaluate the
protective effect of Cys, an aqueous solution was prepared (66 mM) and added to the
wells at a final concentration of 0.35 mM. After a 48 h incubation the medium and the
cells were collected, frozen on dry ice, and kept at -80°C until analyzed.
In a separate set of experiments the cells were co-exposed to BSO. Hepatocytes were
exposed to 1 mM BSO as this concentration in preliminary experiments was shown to
reduce glutathione levels by 50% without increasing cytotoxicity. Erythrocytes were not
sensitive to BSO; even at 20 mM BSO the glutathione levels did not differ from the
control group (data not shown). The positive control was not included in BSO
experiments.
Note: Hepatocytes that were used to measure the production of reactive oxygen
species were pre-treated with DCHF-DA and then exposed to Ag treatments as outlined
in section 4.2.7.
4.2.6. Cell viability analysis
Cell viability of both the erythrocytes and hepatocytes was determined by the lactate
dehydrogenase (LDH; EC 1.1.1.27) leakage assay modified from Feng et al. (2003).
Briefly, after a 48 h exposure, the cell medium was collected and LDH activity was
estimated by NADH consumption measured spectrophotometrically (SpectraMax Plus;
101
Molecular Devices) at 340 nm in the presence of NADH (0.35 mM) and pyruvate (4.5
mM) in imidazole buffer (50 mM; pH 7.5). The reaction was monitored over 15 min. The
activity was normalized to the control samples. Hemolysis was used as a secondary
viability method for erythrocytes by measuring the hemoglobin absorbance of the
collected medium at 540 nm; the absorbance was normalized to the control samples.
4.2.7. Reactive oxygen species (ROS) generation
Intracellular generation of ROS was estimated in hepatocytes using a fluorescence
assay as described previously (Limbach et al., 2007). Briefly, cells were incubated for 30
min in the presence of 10 μM 2’,7’-dichlorodihydrofluorescein diacetate (DCHF-DA).
After incubation the cells were rinsed with fresh culture medium and exposed as above.
The fluorescence (485ex/530em; SpectraMax Gemini XS, Molecular Devices) was
measured immediately after the addition of exposure solutions and 48 h later. The
adjusted relative fluorescence unit (RFU) values were normalized to the control group.
This assay was not appropriate for erythrocytes, because hemolysis interfered with
fluorescent readings.
Note: In Chapter 2 (section 2.2.6) it was mentioned that Ag interfered with the
DCHF-DA assay in zebrafish larvae, although the same compound was used to detect
ROS in hepatocytes, no problems were detected. This contradiction is probably due to
differences in sample preparation and incubation. The larvae were first exposed to Ag,
then collected, rinsed, and sonicated; the homogenates were then incubated in the
presence of DCHF-DA and fluorescence was monitored. In contrast, hepatocytes were

102
pre-incubated with DCHF-DA to allow its internalization and esterase action; the cells
were then carefully rinsed and exposed to Ag, while monitoring the fluorescence.
4.2.8. Glutathione levels
Cells were thawed and homogenized in 5% sulfosalicylic acid (1:20 w/v) using a
Kontes Micro Ultrasonic Cell Disruptor for 5-10 s. The homogenates were then
centrifuged for 5 min at 5000 g (4°C) in a Beckman Coulter Microfuge® R centrifuge.
The supernatant was used to measure total glutathione (TGSH) and oxidized glutathione
(GSSG) [TGSH = GSH + 2GSSG] using the method of Hermes-Lima and Storey (1996)
with modifications noted in Chapter 2 (section 2.2.7).
4.2.9. Antioxidant enzymes activities
The cells were sonicated in 50 mM potassium phosphate buffer (1:20 w/v; KPB-50;
pH 7.0) for 10 s, followed by a 15 min centrifugation at 15,000 g (4°C) as above. All
enzyme assays were read on a SpectraMax Plus spectrophotometer. The following assays
were adapted from Lushchak et al. (2001) as outlined in Chapter 2 (section 2.2.8):
glutathione S-transferase (GST; EC 2.5.1.18); glutathione reductase (GR; EC 1.8.1.7),
glutathione peroxidase (GPx; EC 1.11.1.9), and catalase (CAT; EC 1.11.1.6). The total
activity of superoxide dismutase (SOD; EC 1.15.1.1) was measured using the SOD Assay
Kit (Sigma, 19160). The enzymes activities were normalized to protein content assessed
using the BCA assay (Sigma) with BSA standards.

103
4.2.10. Lipid peroxidation (TBARS)
Lipid peroxidation in hepatocytes was estimated using the thiobarbituric acid
reactive substance (TBARS) assay as previously described (Hermes-Lima et al., 1995)
with slight modifications. Briefly, cells were resuspended in ice-cold 1.1% phosphoric
acid (1:20 w/v) and a 0.2 mL aliquot was mixed with 0.2 mL reaction mix (containing 50
mM NaOH, 0.1 mM butylated hydroxytoluene solution, and 1% thiobarbituric acid), and
0.1 mL 7% phosphoric acid. After boiling for 15 min the samples were cooled on ice for
10 min. Ice-cold butanol (0.5 mL) was then added and the samples were thoroughly
mixed and centrifuged for 5 min at 10,000 g. The top butanol layer was then used for
spectrophotometric measurements (532 nm). Malondealdehyde standards were prepared
in 1.1% phosphoric acid and treated as samples.
4.2.11. DNA damage
DNA damage in hepatocytes was assessed using the alkaline precipitation assay
(Olive, 1988) with fluorescent detection of DNA strands (Gagné and Blaise, 1995; Gagné
et al., 2011). Briefly, the cells were resuspended in KPB-50 (1:20 w/v) and a 25 µL
aliquot was transferred to a clean 1.5 mL conical tube. Then 250 µL alkaline lysis buffer
(containing 10 mM EDTA-tetrasodium, 10 mM Tris-base, 50 mM NaOH, and 2% SDS)
was added. After thorough mixing 250 µL 1% KCl was added to the tube and the mixture
was incubated for 10 min at 60°C. After incubation, the mixture was centrifuged for 5
min at 8000 g and the supernatant was used for DNA determination as follows: 50 µL
sample and 150 µL Hoechst dye (1 μg/mL) were combined in a 96-well plate and
fluorescence (350ex/460em) was assessed as above. The concentration of soluble DNA in

104
the supernatant was inferred from DNA standards (calf thymus) prepared in the same
way as the samples.
4.2.12. Protein carbonyl
Protein carbonyl content in hepatocytes was measured using a protein carbonyl assay
kit (Cayman Chemical, 10005020). The suggested protocol was modified to account for
sample size. Briefly the cells were sonicated in KPB-50 (1:20 w/v). The samples were
then centrifuged 15 min at 10,000 g. Streptomycin sulfate (10%) was then added and the
samples were incubated 15 min at room temperature to eliminate nucleic acids from the
supernatant. The samples were centrifuged for 5 min at 6000 g and 0.1 mL supernatant
was transferred to 2 fresh tubes (Control and Sample). Tubes labeled Control were treated
with 0.3 mL 2 M HCl and those labeled Sample received an equal volume of 10 mM 2,4-
dinitrophenylhydrazine (DNPH) prepared in 2 M HCl. The tubes were incubated in the
dark for 1 h at room temperature with vortexing every 15 min. Then 0.4 mL 20%
trichloroacetic acid (TCA) was added to the tubes that were vortexed and cooled on ice
for 5 min. This was followed by a 15 min centrifugation at 10,000 g. The resulting pellets
were washed with 0.4 mL 10% TCA and re-centrifuged. The pellets were then washed
three times with 0.5 mL ethyl acetate:ethanol mixture. After the final wash the tubes were
dried on paper towel to remove excess ethyl acetate:ethanol mixture. The resulting pellets
were dissolved in 0.5 mL 6 M guanidine hydrochloride and centrifuged to remove
insoluble materials; BSA standards were also prepared in 6 M guanidine hydrochloride.
The absorbance was measured at 370 and 280 nm using a quartz 96-well plate to
determine the amount of protein carbonyl per mg protein.
105
4.2.13. Cellular uptake of AgNPs
Cellular uptake of AgNPs into hepatocytes was examined using Transmission
Electron Microscope (TEM) after Nguyen et al. (2013). Briefly, hepatocytes were fixed
with 2.5% glutaraldehyde in 66.7 mM cacodylate buffer (pH 7.4) for 1 h and then washed
twice with 100 mM cacodylate buffer (pH 7.4) for 10 min. The cells were post-fixed with
1% osmium tetroxide in 100 mM cacodylate buffer. The cells were dried through a series
of alcohols, infiltrated with Epoxy resin, and embedded into resin-filled Beem capsule
molds. The blocks were sectioned and stained with uranyl acetate and lead citrate. The
sections (70 nm) were placed on carbon grids and analyzed with a Joel 1230
Transmission Electron Microscope at magnifications of 1200x and 2500x.
4.2.14. Statistical analysis
Statistical analyses were conducted using SigmaPlot 11.0 software (SPW 11; Systat
Software, Inc., San Jose, CA). Three-way analysis of variance (ANOVA) with post-hoc
Holm-Sidak method was used to test for significance between Ag-type, Ag concentration,
and presence/absence of Cys. The results of the three-way ANOVA analyses are
summarized in Tables 4.1 and 4.2. Additional three-way ANOVA analyses were
conducted to test for significance between concentration, presence/absence of cysteine,
and presence/absence of BSO within each Ag-type (the results of these analyses are
incorporated into the text). In all cases P ≤ 0.050 was considered significant. Data are
presented as means and standard deviation (SD) or standard error of the mean (SEM).

106
4.3. Results
4.3.1. Characterization of AgNPs
Measurements from DLS showed that the mean diameter ± SD of AgNPs used in this
study was 8.95 ± 0.41 nm in culture medium (Fig. 4.1A). The average PDI ± SD was
0.162 ± 0.025, suggesting that the particles were relatively monodisperse. The mean
diameter of AgNPs dispersed in MilliQ water was 7.24 ± 0.34 nm, with an average PDI
of 0.145 ± 0.022, suggesting that AgNPs in culture medium may either be aggregating or
possibly binding to medium components such as BSA. The -potential of AgNPs in water
ranged from -47 to -77 mV, whereas in culture medium it ranged from -13 to -16 mV,
depending on the concentration, providing support for the AgNPs potentially attaching to
components of the culture medium (Fig. 4.1B). Moreover, the -potential values for
water and culture medium in the absence of AgNPs (i.e. 0.0 g/mL AgNPs) were -0.6
and -12 mV, respectively; these values are consistent with the fact that MilliQ water is
devoid of molecules/ions, whereas culture medium contains amino acids, proteins (BSA),
ions, etc. Furthermore, STEM analysis showed dispersed AgNPs ranging from 4 to 16 nm
(Fig. 4.1C), which are larger than the 1-10 nm indicated by Vive Nano.
Light microscopy demonstrated that the culture medium impacted the properties of
the AgNPs: when in water, the AgNPs had a brighter yellow color compared with AgNPs
prepared in culture medium (Fig. 4.2A, E, I, M). The AgNPs color was also affected by
Cys in both water (Fig. 4.2C, G) and culture medium (Fig. 4.2K, O); BSO had no effect
on color in either media (Fig. 4.2B, F and Fig. 4.2J, N). Wells containing both BSO and
Cys resembled those containing only Cys (Fig. 4.2D, H, L, P). Furthermore, Cys
apparently induced AgNPs aggregation and precipitation in both water (Fig. 4.2G, H) and

107
culture medium (Fig. 4.2O, P), as evidenced by precipitate formation at the bottom of the
well (Fig. 4.2G, H, O, P). This precipitate was noticeable after 24 h of incubation and
increased further at 48 h. The changes in color altered the absorption maxima, which
were lower for AgNPs prepared in culture medium (Fig. 4.2S, T) than those in water
(Fig. 4.2Q, R). Cysteine further reduced the absorption maxima, especially after a 48 h
incubation period. Addition of BSO did not have any impact on absorption maxima. The
DLS measurements under these conditions showed that the particle size increased slightly
over time in response to Cys, such that at 48 h the mean diameters were 9.52 ± 0.22 and
10.09 ± 0.19 nm in the absence and presence of Cys, respectively. Similarly, with BSO
the mean diameters were 9.49 ± 0.18 and 10.03 ± 0.12 nm in the absence and presence of
Cys. It needs to be noted that the medium samples collected for these measurement
excluded the precipitates formed in some wells.
4.3.2. Cytotoxicity of AgNP and Ag+
Both Ag-types were toxic to the erythrocytes and hepatocytes. LDH leakage and
hemolysis assays showed similar trends in erythrocytes (Fig. 4.3). However, the
hemolysis assay was more sensitive (greater fold-change) than the LDH assay, perhaps
due to the relatively low activities of erythrocyte LDH. Hepatocytes displayed similar
trends in cytotoxicity (Fig. 4.4A); however, higher concentrations of Ag were required to
elicit a response compared to erythrocytes. Overall, the cytotoxicity of both Ag-types was
dose-dependent in both cell models (P < 0.001). Ag+ was more toxic than the AgNPs (P <
0.001), and Cys significantly reduced the toxicity of both Ag-types (P < 0.001). The

108
positive control (H2O2 and CuSO4 at 1 mM) was effective in eliciting cytotoxicity in both
cell models regardless of the presence or absence of Cys.
BSO treatment of hepatocytes significantly (P < 0.001) increased the cytotoxicity of
both Ag+ and AgNPs (Fig. 4.4B); there was a significant effect of Ag-concentration, Ag-
type, and Cys (P < 0.001). At the highest Ag concentration, BSO treatment increased the
cytotoxicity of Ag+ and AgNPs by 20% and 45%, respectively. Interestingly, Cys was
able to reduce the toxicity of Ag+, but not that of AgNPs.
4.3.3. ROS generation
Both Ag-types increased ROS generation in trout hepatocytes in a dose-dependent
manner (Fig. 4.5A; P = 0.007). At the highest concentration Ag+ and AgNPs elevated
ROS by 3- and 2-fold, respectively. Cysteine did not significantly affect the ability of
Ag+ to generate ROS, but did significantly elevate ROS generation with AgNPs at the
highest concentration (P = 0.008). There was a significant difference between Ag-types in
the presence of Cys (P = 0.048), but not in its absence. The positive control was effective
in generating ROS independent of Cys treatment, and BSO treatment did not result in
higher generation of ROS (Fig. 4.5B).
4.3.4. Glutathione levels
Both Ag-types significantly reduced TGSH levels in trout erythrocytes and
hepatocytes in a dose-dependent manner (P < 0.001) (Fig. 4.6A, 4.7A). The presence of
Cys significantly improved TGSH levels in both cell models (P < 0.001). Ag+ was more
effective in reducing TGSH levels and there was a significant effect of Ag-type in both

109
cell models (P < 0.001). It should be noted that the control TGSH levels in erythrocytes
were nearly twice that in the hepatocytes. Both Ag+ and AgNPs decreased GSSG levels
(Fig. 4.6B, 4.7B) with the effect greatest in erythrocytes, where Ag-type, Ag
concentration, and Cys all had significant effects (P < 0.001) (see Tables 4.1 and 4.2).
Furthermore, there was a non-significant increase in the GSSG:TGSH ratio in both
erythrocytes and hepatocytes (Fig. 4.6C, 4.7C). Although Ag+ appeared to elevate the
GSSG:TGSH ratio more than AgNP, there was a significant effect of Ag-type only in the
erythrocytes. Cysteine did reduce the GSSG:TGSH ratio but this effect was only
significant in hepatocytes (P = 0.028). The positive control demonstrated a reduction in
TGSH levels and an increase in the GSSG:TGSH ratio in both models.
Trout hepatocytes treated with BSO displayed significantly (P < 0.001) lower TGSH
levels with both Ag-types (Fig. 4.7D); there was a significant effect of Ag concentration
(P < 0.001) (see Table 4.2), but not Ag-type even though Ag+ seemed slightly more
effective. At the highest silver concentration, BSO treatment decreased the TGSH levels
in Ag+- and AgNP-treated cells by 67% and 40%, respectively, compared to BSO non-
treated cells. Interestingly, Cys was unable to modify these changes in TGSH levels. The
GSSG levels were also significantly reduced (P < 0.050; Fig. 4.7E); there was a
significant effect of Ag concentration (P = 0.032) but not Ag-type or Cys. The
GSSG:TGSH ratio was significantly (P < 0.001) higher with Ag+ but not AgNPs (Fig.
4.7F), which is due to the noticeable reduction in both GSSG and TGSH levels.
110
4.3.5. Antioxidant enzymes activities
The activities of the antioxidant enzymes in both trout hepatocytes and erythrocytes
were differentially affected by Ag. Generally, the glutathione-related enzymes showed a
decrease in activities in both cell-types. The activities of CAT and SOD were affected in
erythrocytes but not in hepatocytes. The positive control treatment decreased the activity
of the antioxidant enzymes, with the exception of CAT, whose activity was unchanged.
The activity of GST decreased in a dose-dependent manner in both trout
erythrocytes (P < 0.001) (Table 4.3) and hepatocytes (P = 0.001) (Table 4.4). There was
also a significant effect of Ag-type in erythrocytes (P < 0.001) and hepatocytes (P =
0.011) (see Tables 4.1 and 4.2), such that Ag+ was more effective in reducing the GST
activity. Cysteine generally reduced the effects of Ag on GST activity, but this effect was
significant only in erythrocytes (P < 0.001). Hepatocytes treated with BSO displayed
significantly (P < 0.050) reduced GST activity; the Ag-type and concentration had a
significant effect (P < 0.001), but Cys treatment was only effective (P < 0.001) with Ag+.
The GST activity was higher in trout hepatocytes than in erythrocytes.
The activity of GR decreased in a dose-dependent manner in both erythrocytes (P =
0.041) (Table 4.3) and hepatocytes (P < 0.001) (Table 4.4). There was a significant effect
of Ag-type in hepatocytes (P < 0.001) (see Tables 4.1 and 4.2) but not erythrocytes,
although in both models Ag+ generally was more effective in decreasing GR activity.
Cysteine significantly improved the activity of GR in hepatocytes (P = 0.003) but not
erythrocytes. BSO treatment in hepatocytes significantly (P < 0.050) reduced GR
activity; Ag-type and concentration had a significant effect (P = 0.002 and P < 0.001,

111
respectively), but Cys treatment was only effective (P = 0.029) with Ag+. Again, GR
activity was higher in hepatocytes than in erythrocytes.
The activity of GPx was not affected by either Ag treatment or Cys and was much
higher in erythrocytes than in hepatocytes. BSO treatment in hepatocytes did reduce GPx
activity, especially at the highest Ag+ concentration; there was no significant effect of Ag
concentration, but there were significant effects of 1) Ag-type in the absence of Cys (P =
0.005), and 2) Cys (P < 0.001) within the Ag+
treatment group.
There was a dose-dependent reduction in CAT activity in erythrocytes exposed to
Ag+ (P = 0.045) but not AgNPs; Cys had no effect on CAT activity. In contrast, there
were no effects of either Ag-type on CAT activity in hepatocytes even with BSO
treatment. Hepatocytes had lower CAT activity than erythrocytes.
The activity of SOD in erythrocytes was increased by both Ag-types in a dose-
dependent manner (P = 0.010), with Ag+ being more effective in increasing SOD activity
(P = 0.003); Cys did not affect SOD activity. In contrast, the activity of SOD in
hepatocytes was only affected in the BSO-treated cells, where there was a reduction in
activity with Ag+ and although there were no significant effects of Ag-type or
concentration, there was a significant effect of Cys (P < 0.001) at the highest Ag+
concentration. The activity of SOD was higher in hepatocytes compared to erythrocytes.
4.3.6. Cellular damage in hepatocytes
Generally, Ag treatment was not as effective as the positive control (H2O2 and
CuSO4 at 1 mM) in increasing cellular damage within hepatocytes. Nonetheless, there
were differences between Ag-types, reflecting perhaps their cellular uptake potential.

112
AgNP treatment elevated TBARS levels by ~30% at the highest concentration (Fig.
4.8A); there was a significant effect of Ag-type at the highest concentration (P < 0.001)
(see Table 4.2). Cys treatment in combination with AgNPs significantly elevated lipid
peroxidation (P = 0.041) by ~87% at the highest concentration. Lipid peroxidation was
not affected by Ag+ with or without Cys (Fig. 4.8A). The same trends were observed with
the BSO treatment (Fig. 4.8D); there were significant effects of concentration (P <
0.001), Ag-type (P = 0.004), and Cys (P = 0.035). BSO-treated hepatocytes exposed to
the highest AgNP concentration and Cys had TBARS levels 400% higher than the control
cells (Fig. 4.8D). BSO-treated cells exposed to AgNPs in the absence of Cys displayed
TBARS levels that were similar to BSO non-treated cells. BSO treatment did increase
TBARS at the highest Ag+ concentration by 56%, but this was not statistically
significant. Overall TBARS levels were significantly higher (P < 0.050) in presence of
BSO within both the AgNP- and Ag+-treated cells.
DNA damage unlike lipid peroxidation was much more apparent with Ag+ treatment
(Fig. 4.8B); there was a significant effect of Ag-type (P < 0.001), Ag concentration (P =
0.013) and Cys (P = 0.001) (Table 4.2). AgNP treatment did not impact DNA damage
with or without Cys. BSO treatment did not further affect DNA damage and similar
trends as before were noted (Fig. 4.8E).
Finally, protein carbonyl levels were not affected by either Ag-type with or without
Cys. Treatment with BSO also did not affect protein carbonyl levels (Fig. 4.8C, F).

113
4.3.7. Cellular uptake of AgNPs into hepatocytes
Cellular uptake of AgNPs was assessed in hepatocytes by TEM. In general
hepatocytes exposed to AgNPs regardless of the concentration (Fig. 4.9B, C, F, G)
displayed cellular morphologies that were very similar to control cells (Fig. 9A, E)
without any signs of structural damage to the cell membrane, mitochondria, nucleus, or
endoplasmic reticulum. However, hepatocytes exposed to 23.3 μg/mL AgNPs had higher
abundance of cytoplasmic inclusion bodies or vesicles, but these vesicles did not appear
to contain AgNPs. There were no indications of AgNPs in the cytoplasm or within the
cell membrane. In contrast, cellular morphologies of Ag+-treated hepatocytes (15.5
g/mL) were noticeably different from the control cells, including an enlarged and
marginalized nucleus, distended endoplasmic reticulum, and fewer intact organelles (Fig.
4.9D, H). In the presence of Cys all cells had similar morphologies, including the Ag+-
treated hepatocytes (Fig. 4.9I-P).
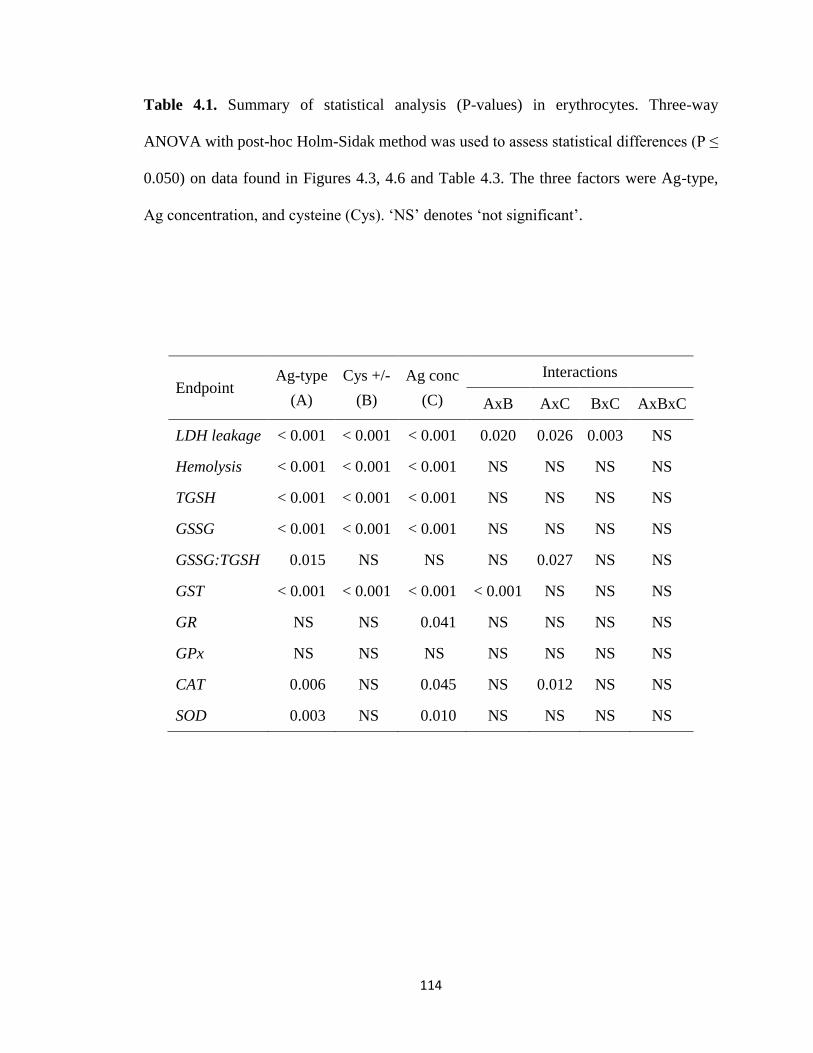
114
Table 4.1. Summary of statistical analysis (P-values) in erythrocytes. Three-way
ANOVA with post-hoc Holm-Sidak method was used to assess statistical differences (P ≤
0.050) on data found in Figures 4.3, 4.6 and Table 4.3. The three factors were Ag-type,
Ag concentration, and cysteine (Cys). ‘NS’ denotes ‘not significant’.
Endpoint Ag-type
(A)
Cys +/-
(B)
Ag conc
(C)
Interactions
AxB AxC BxC AxBxC
LDH leakage < 0.001 < 0.001 < 0.001 0.020 0.026 0.003 NS
Hemolysis < 0.001 < 0.001 < 0.001 NS NS NS NS
TGSH < 0.001 < 0.001 < 0.001 NS NS NS NS
GSSG < 0.001 < 0.001 < 0.001 NS NS NS NS
GSSG:TGSH 0.015 NS NS NS 0.027 NS NS
GST < 0.001 < 0.001 < 0.001 < 0.001 NS NS NS
GR NS NS 0.041 NS NS NS NS
GPx NS NS NS NS NS NS NS
CAT 0.006 NS 0.045 NS 0.012 NS NS
SOD 0.003 NS 0.010 NS NS NS NS
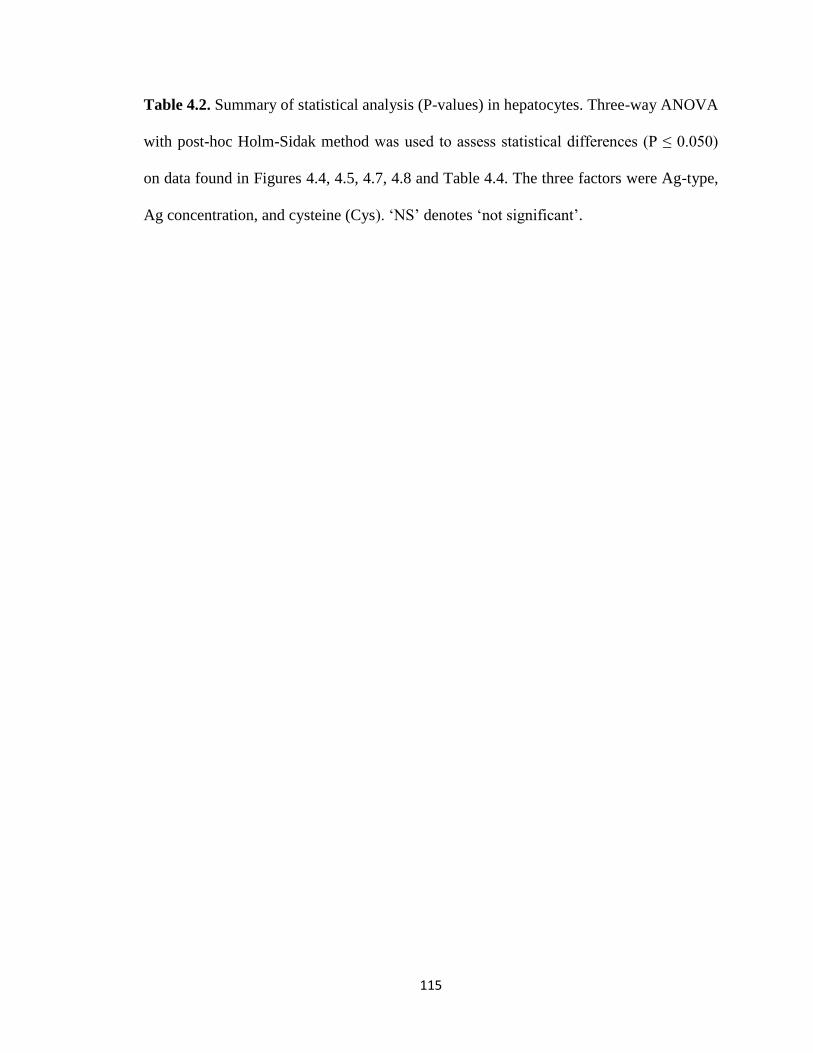
115
Table 4.2. Summary of statistical analysis (P-values) in hepatocytes. Three-way ANOVA
with post-hoc Holm-Sidak method was used to assess statistical differences (P ≤ 0.050)
on data found in Figures 4.4, 4.5, 4.7, 4.8 and Table 4.4. The three factors were Ag-type,
Ag concentration, and cysteine (Cys). ‘NS’ denotes ‘not significant’.

116
Endpoint Ag-type
(A)
Cys +/-
(B)
Ag
conc
(C)
Interactions
AxB AxC BxC AxBxC
Hepatocytes
LDH leakage < 0.001 < 0.001 < 0.001 < 0.001 < 0.001 < 0.001 < 0.001
ROS NS 0.011 0.007 NS NS NS NS
TGSH < 0.001 < 0.001 < 0.001 NS NS NS NS
GSSG NS NS NS NS NS NS NS
GSSG:TGSH NS 0.028 NS NS NS NS NS
GST < 0.001 NS < 0.001 0.003 NS NS NS
GR < 0.001 NS < 0.001 NS NS NS NS
GPx NS NS NS NS NS NS NS
CAT NS NS NS NS NS NS NS
SOD NS NS NS NS NS NS NS
TBARS 0.002 NS NS NS NS NS NS
DNA damage < 0.001 0.001 0.013 0.025 NS NS NS
Protein carbonyl NS NS NS NS NS NS NS
Hepatocytes (BSO)
LDH leakage < 0.001 < 0.001 < 0.001 < 0.001 < 0.001 < 0.001 < 0.001
ROS NS NS NS NS NS NS NS
TGSH NS NS < 0.001 NS NS NS NS
GSSG NS NS 0.032 NS NS NS NS
GSSG:TGSH 0.001 < 0.001 0.039 < 0.001 0.017 0.024 0.017
GST < 0.001 < 0.001 < 0.001 < 0.001 NS 0.025 < 0.001
GR 0.002 NS < 0.001 0.043 NS NS NS
GPx NS 0.008 NS 0.012 NS NS NS
CAT NS NS NS NS NS NS NS
SOD NS 0.008 NS 0.027 NS NS 0.021
TBARS 0.004 0.035 < 0.001 0.002 0.010 0.022 0.002
DNA damage < 0.001 NS NS 0.010 NS NS NS
Protein carbonyl NS NS NS NS NS NS NS
117
Table 4.3. Activities of antioxidant enzymes in rainbow trout erythrocytes after a 48 h
exposure to various Ag+ or AgNP concentrations in the presence or absence of cysteine
(Cys). The activities of glutathione-S-transferase (GST), glutathione reductase (GR),
glutathione peroxidase (GPx), catalase (CAT), and superoxide dismutase (SOD) were
assessed. Data are presented as Mean ± SEM (n = 3-6). Three-way ANOVA with post-
hoc Holm-Sidak method was used to assess statistical differences (see Table 4.1 and the
results section).

118
+C
C
A
g+ (
μg/m
L)
A
gN
P (
μg/m
L)
3
.1
7.8
15.5
23
.3
31
3.1
7
.8
15
.5
23
.3
31
GS
T1
-c3
1.4
±0
.1
12
.7±
0.6
9
.9±
0.8
8.1
±0.6
5.7
±0.6
5.1
±0.8
3.2
±0.4
11.9
±0.9
1
0.6
±0.3
9
.0±
0.4
8
.1±
0.4
7
.0±
0.3
+c
1.0
±0
.1
11
.4±
0.9
9
.5±
1.7
10.0
±0.3
8.7
±0.7
7.9
±0.6
6.7
±0.0
11.3
±0.5
1
0.8
±0.5
8
.4±
0.3
8
.4±
0.3
7
.8±
0.7
GR
1
-c
3.0
±1
.0
5.6
±1
.2
6.5
±1.3
6.1
±1.1
5.0
±1.2
3.6
±1.7
2.6
±1.3
7.1
±2
.0
5.7
±0
.9
6.4
±1
.5
5.4
±1
.0
4.5
±1
.1
+c
2.7
±0
.7
5.6
±0
.7
6.0
±0.5
6.0
±0.9
5.3
±1.1
4.5
±1.1
3.6
±1.1
6.0
±0
.7
5.6
±0
.6
6.4
±0
.9
5.9
±0
.8
5.9
±1
.2
GP
x1
-c
38
±8
16
9±
33
23
1±
45
172±
40
150±
39
147±
38
130±
32
190±
31
20
9±
44
19
9±
39
20
3±
41
19
2±
45
+c
51
±1
1
15
2±
50
15
7±
47
172±
52
139±
41
128±
31
127±
41
127±
41
14
9±
48
14
7±
48
17
3±
49
15
5±
45
CA
T2
-c
28
0±
22
84
2±
85
92
2±
109
833±
107
726±
143
584±
104
390±
117
853±
68
81
3±
11
4
74
5±
62
84
5±
86
85
3±
10
2
+c
45
8±
12
8
66
0±
76
69
1±
91
793±
85
668±
117
639±
65
446±
75
746±
72
69
8±
83
79
7±
93
78
7±
99
74
6±
81
SO
D2
-c
2.8
±0
.5
1.8
±0
.2
2.2
±0.3
2.7
±0.3
2.9
±0.5
3.3
±0.6
3.2
±0.6
1.8
±0
.2
2.1
±0
.3
2.3
±0
.3
2.5
±0
.4
2.7
±0
.4
+c
2.5
±0
.6
2.1
±0
.3
2.2
±0.3
2.2
±0.4
3.0
±0.5
3.2
±0.5
3.4
±0.6
2.0
±0
.3
2.1
±0
.3
2.3
±0
.3
2.3
±0
.4
2.6
±0
.4
1 n
mol/
min
/mg
2
mol/
min
/mg
3 P
rese
nce
(+
c) o
r a
bse
nce
(-c
) o
f C
ys

119
Table 4.4. Activities of antioxidant enzymes in rainbow trout hepatocytes after a 48 h
exposure to various Ag+ or AgNP concentrations in the presence or absence of cysteine
(Cys) and/or buthionine sulfoximine (BSO). The activities of glutathione-S-transferase
(GST), glutathione reductase (GR), glutathione peroxidase (GPx), catalase (CAT), and
superoxide dismutase (SOD) were assessed. Silver concentrations that were not assessed
in BSO experiments are signified by ‘n/a’. Data are presented as Mean ± SEM (n = 5-7).
Three-way ANOVA with post-hoc Holm-Sidak method was used to assess statistical
differences (see Table 4.2 and the results section).

120
+
C
C
Ag
+ (
μg/m
L)
A
gN
P (
μg/m
L)
3.1
7.8
15.5
23.3
31
3.1
7
.8
15
.5
23
.3
31
GS
T1
-c3
-b4
1
6±
10
62
0±
47
581±
28
476±
39
385±
44
295±
59
187±
67
73
5±
75
59
0±
49
48
5±
29
50
0±
30
47
0±
19
+c
-b
1
8±
4
65
6±
53
603±
69
517±
25
469±
17
458±
15
369±
16
62
9±
40
58
8±
48
47
3±
48
46
2±
29
51
3±
41
-c
+
b
n/a
6
46
±29
511±
25
n/a
2
38±
50
n/a
24±
21
60
4±
9
n/a
5
00
±37
n
/a
38
9±
15
+
c +
b
n/a
6
29
±26
555±
37
n/a
4
89±
25
n/a
3
63±
41
66
7±
40
n/a
4
83
±28
n/a
4
07
±23
GR
1
-c
-b
7.4
±1.7
13.1
±1.5
12.8
±0.8
1
1.7
±0.6
9
.6±
1.3
7
.8±
0.9
6
.2±
1.0
1
4.5
±1.4
12.6
±1.0
11.6
±0.7
11.7
±0.7
11.6
±1.3
+c
-b
7
.1±
1.2
1
3.9
±1.2
1
2.9
±1.1
11.7
±1.4
10.8
±1.3
9.0
±2.3
4.6
±1.8
14.5
±1.3
1
3.6
±0.8
1
4.9
±2.2
1
2.4
±1.0
1
2.6
±1.0
-c
+
b
n/a
1
3.9
±1.8
1
1.2
±1.4
n/a
8.2
±1.5
n/a
3.1
±0.6
12.6
±1.4
n
/a
12
.9±
1.5
n
/a
10
.2±
1.3
+
c +
b
n/a
1
3.0
±1.4
1
1.7
±1.4
n/a
11.2
±1.8
n/a
7.6
±1.3
13.1
±1.4
n
/a
10
.9±
1.7
n
/a
9
.5±
1.6
GP
x1
-c
-b
10
.6±
1.7
2
4.1
±1.9
2
1.1
±3.5
21.2
±2.8
22.5
±3.7
25.3
±2.5
21.5
±1.8
23.5
±3.4
2
1.1
±3.6
2
2.7
±3.2
2
1.8
±3.1
2
2.1
±2.5
+c
-b
13
.0±
5.0
2
4.2
±1.2
1
8.4
±3.2
19.2
±4.3
19.4
±3.3
21.9
±3.2
19.1
±3.9
21.3
±2.3
1
6.7
±5.9
2
0.9
±3.3
1
9.9
±3.1
2
0.1
±2.7
-c
+
b
n/a
2
2.4
±1.6
1
7.0
±2.1
n/a
16.2
±2.5
n/a
11.5
±2.7
20.7
±1.2
n
/a
24
.2±
2.3
n
/a
16
.9±
1.2
+
c +
b
n/a
1
9.7
±1.5
2
1.4
±2.4
n/a
23.3
±2.6
n/a
21.9
±2.7
21.2
±2.4
n
/a
19
.9±
2.9
n
/a
21
.1±
2.3

121
CA
T2
-c
-b
46
9±
11
7
45
4±
50
453±
73
482±
64
453±
61
696±
124
678±
118
50
3±
73
42
5±
60
47
7±
79
47
9±
69
50
8±
78
+
c -b
4
38
±11
0
47
0±
55
479±
59
503±
48
536±
56
545±
55
553±
86
51
8±
81
51
7±
49
59
4±
70
57
9±
49
60
5±
63
-c
+
b
n/a
4
55
±46
499±
58
n/a
7
79±
142
n/a
7
80±
249
47
1±
69
n/a
5
45
±45
n/a
5
06
±72
+
c +
b
n/a
4
29
±71
499±
89
n/a
5
44±
93
n/a
5
31±
101
46
0±
75
n/a
5
53
±95
n/a
5
79
±12
4
SO
D2
-c
-b
16
.3±
2.2
2
0.4
±1.4
24.1
±2.1
23.3
±1.2
21.9
±2.7
23.9
±3.2
23.1
±4.7
2
4.8
±1.9
2
3.3
±1.5
2
0.9
±2.1
2
3.9
±1.3
2
4.3
±2.2
+
c -b
8.2
±1.7
2
2.7
±2.4
20.4
±1.5
19.9
±1.3
22.3
±1.6
20.0
±2.4
23.3
±3.0
1
9.9
±1.2
2
1.5
±1.7
2
4.2
±2.3
2
2.2
±1.7
2
6.6
±2.7
-c
+
b
n/a
1
9.7
±0.6
19.9
±0.9
n/a
18.3
±2.6
n/a
11.2
±2.8
1
9.7
±0.8
n
/a
19
.5±
1.0
n
/a
19
.3±
1.0
+
c +
b
n/a
2
0.6
±1.0
20.5
±1.2
n/a
20.7
±1.3
n/a
22.5
±2.4
2
0.7
±1.3
n
/a
20
.6±
1.3
n
/a
18
.6±
1.5
1 n
mol/
min
/mg
2
mol/
min
/mg
3 P
rese
nce
(+
c) o
r a
bse
nce
(-c
) o
f C
ys
4 P
rese
nce
(+
b)
or
abse
nce
(-b
) o
f B
SO

122
Figure 4.1. Characterization of Vive Nano AgNPs used in this study (part I). Dynamic
Light Scattering (DLS) was used to determine: (A) size distribution of AgNPs (31
g/mL) prepared in culture medium (Means + SD; n = 10), and (B) zeta ()-potential of
AgNPs prepared in water and culture medium at various concentrations (Means + SEM;
n = 4). Scanning Transmission Electron Microscope (STEM) was used to confirm DLS
results; a 10 g/mL solution of AgNPs was prepared in water and photos were captured
from transmission electron diffraction (TED) (C).

123
Total silver (g/mL)
0.0 3.1 7.8 15.5 31.0
-p
ote
nti
al
(-m
V)
0
20
40
60
80
100
Water
Culture medium
Particle size (nm)
1 10 100
Nu
mb
er
(%)
0
5
10
15
20
25
30
35 A C
A
B
C
D
E
a ab ab bc c
B
124
Figure 4.2. Characterization of Vive Nano AgNPs used in this study (part II). Light
microscopy images (A-P) of AgNPs (31 g/mL) were taken after a 48 h incubation
period in water or culture medium in the presence or absence of cysteine (Cys) and/or
buthionine sulfoximine (BSO). Images E-H and M-P are 10x magnified versions of
images A-D and I-L, respectively. UV-VIS spectroscopy measurements of AgNPs (31
g/mL) in different media are presented in Q-R as Means + SEM (n = 5). The absorbance
of AgNPs was measured in water after 2 and 48 h (Q and R, respectively) and in culture
medium after 2 and 48 h (S and T, respectively). The symbols ‘C’ and ‘B’ in the image
headings and panel Q legend refer to Cys and BSO, respectively.

125

126
Figure 4.3. Cytotoxicity in trout erythrocytes exposed to various Ag+ or AgNP
concentrations in the presence or absence of cysteine (Cys) for 48 h. Cytotoxicity was
assessed by (A) lactate dehydrogenase (LDH) leakage and (B) hemolysis assays. Positive
control (C+) was a combination of H2O2 and CuSO4 both at 1 mM. The results are
expressed as fold-change above control (no Ag) values. Data are presented as Mean +
SEM (n = 11-13). Three-way ANOVA with post-hoc Holm-Sidak method was used to
assess statistical differences (see Table 4.1 and the results section).
127
LD
H l
ea
ka
ge
(fo
ld c
ha
ng
e)
0
2
4
6
8
Total silver (g/mL)
C C+ 3.1 7.8 15.5 23.3 31.0
He
mo
lys
is (
fold
ch
an
ge
)
0
5
10
15
20
25
Control + cys
+Control + cys
Ag+ + cys
AgNP + cys
Control
+Control
Ag+
AgNP
A
B

128
Figure 4.4. Cytotoxicity in trout hepatocytes exposed to various Ag+ or AgNP
concentrations in the presence or absence of cysteine (Cys) and in the absence (A) and
presence (B) of buthionine sulfoximine (BSO). Cytotoxicity was assessed using LDH
leakage assay. Positive control (C+) was a combination of H2O2 and CuSO4 both at 1
mM and was only used in absence of BSO. Negative control (C-) refers to BSO non-
treated cells. The results are expressed as fold-change above control values. Data are
presented as Mean + SEM (n = 5-13). Three-way ANOVA with post-hoc Holm-Sidak
method was used to assess statistical differences (see Table 4.2 and the results section).
129
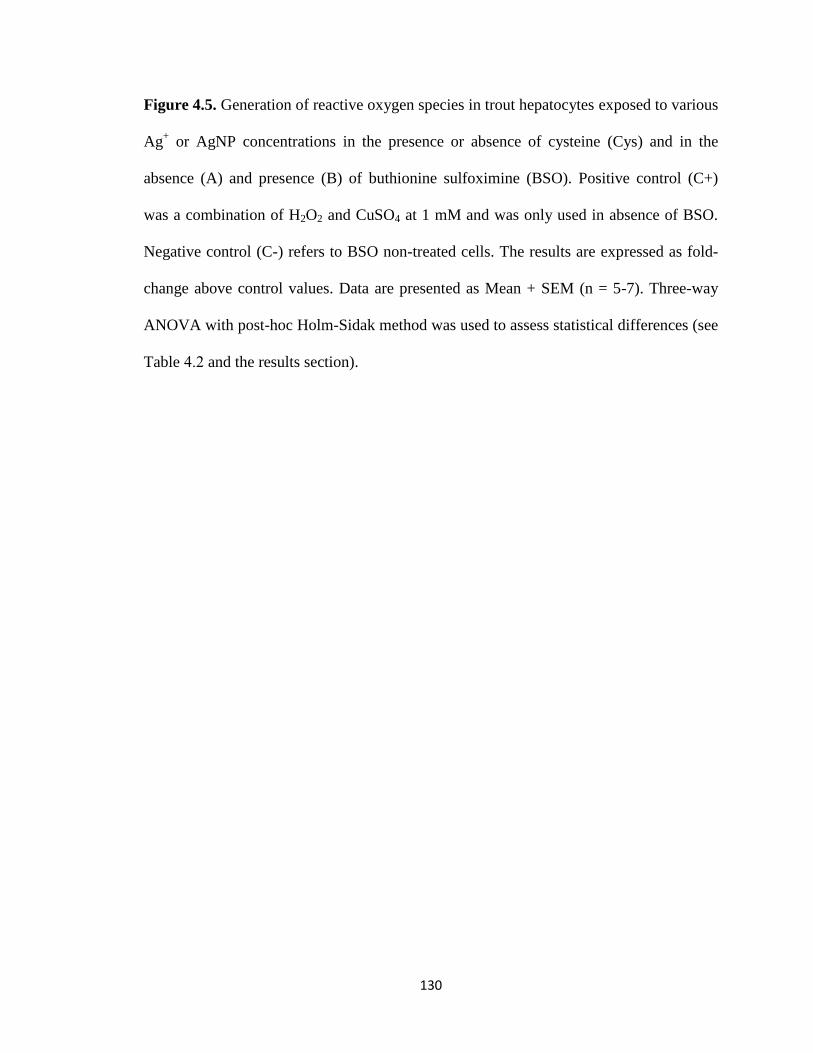
130
Figure 4.5. Generation of reactive oxygen species in trout hepatocytes exposed to various
Ag+ or AgNP concentrations in the presence or absence of cysteine (Cys) and in the
absence (A) and presence (B) of buthionine sulfoximine (BSO). Positive control (C+)
was a combination of H2O2 and CuSO4 at 1 mM and was only used in absence of BSO.
Negative control (C-) refers to BSO non-treated cells. The results are expressed as fold-
change above control values. Data are presented as Mean + SEM (n = 5-7). Three-way
ANOVA with post-hoc Holm-Sidak method was used to assess statistical differences (see
Table 4.2 and the results section).

131

132
Figure 4.6. Glutathione levels in trout erythrocytes exposed to various Ag+ or AgNP
concentrations in the presence or absence of cysteine (Cys) for 48 h. A. Total glutathione
(TGSH) levels. B. Oxidized glutathione (GSSG) levels. C. GSSG:TGSH ratio. Positive
control (C+) was a combination of H2O2 and CuSO4 both at 1 mM. Data are presented as
Mean + SEM (n = 4-8). Three-way ANOVA with post-hoc Holm-Sidak method was used
to assess statistical differences (see Table 4.1 and the results section).

133
TG
SH
(n
mo
l/g
)
0
500
1000
1500
2000
GS
SG
(n
mo
l/g
)
0
200
400
600
800
Total silver (g/mL)
C C+ 3.1 7.8 15.5 23.3 31.0
GS
SG
/TG
SH
rati
o
0.0
0.4
0.8
1.2
Control + cys
+Control + cys
Ag+ + cys
AgNP + cys
Control
+Control
Ag+
AgNP
A
B
C

134
Figure 4.7. Glutathione levels in trout hepatocytes exposed to various Ag+ or AgNP
concentrations in the presence or absence of cysteine (Cys) and/or buthionine
sulfoximine (BSO) for 48 h. (A and D) Total glutathione (TGSH) levels. (B and E)
Oxidized glutathione (GSSG) levels. (C and F) GSSG:TGSH ratio. Positive control (C+)
was a combination of H2O2 and CuSO4 both at 1 mM and was only used in absence of
BSO. Negative control (C-) refers to BSO non-treated cells. Data are presented as Mean
+ SEM (n = 4-9). Three-way ANOVA with post-hoc Holm-Sidak method was used to
assess statistical differences (see Table 4.2 and the results section).
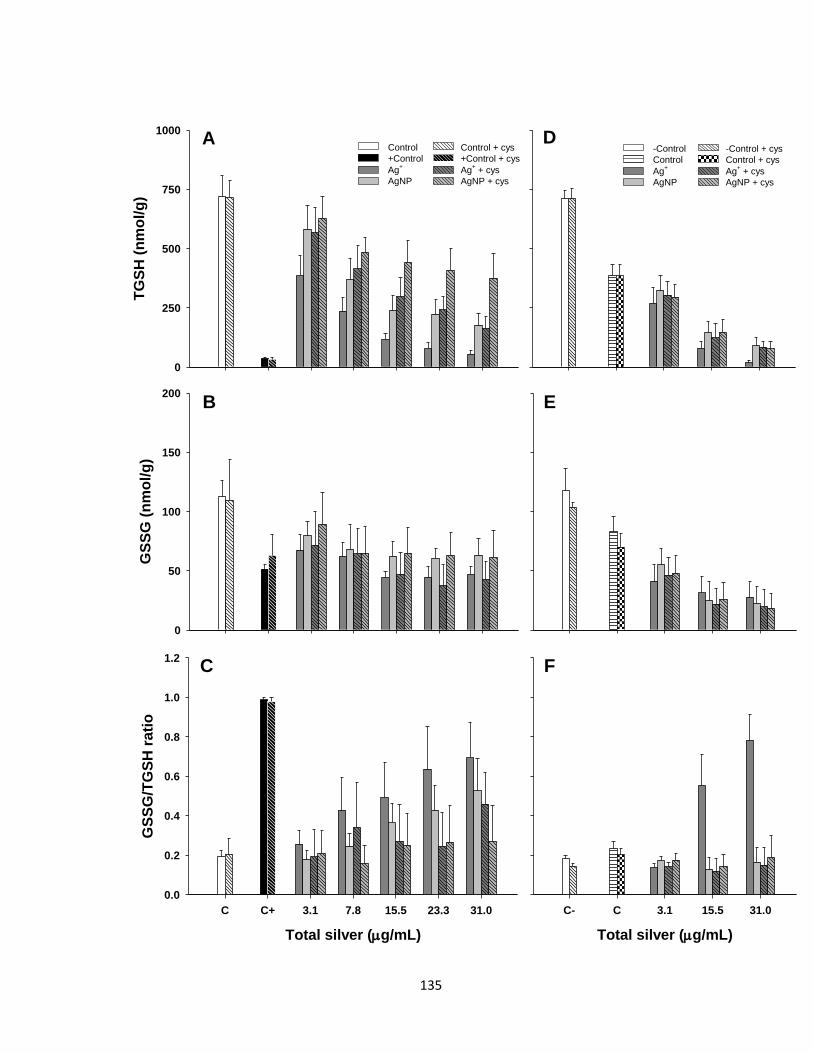
135
TG
SH
(n
mo
l/g
)
0
250
500
750
1000
Total silver (g/mL)
C C+ 3.1 7.8 15.5 23.3 31.0
GS
SG
/TG
SH
rati
o
0.0
0.2
0.4
0.6
0.8
1.0
1.2
GS
SG
(n
mo
l/g
)
0
50
100
150
200
Total silver (g/mL)
C- C 3.1 15.5 31.0
Control + cys
+Control + cys
Ag+ + cys
AgNP + cys
Control
+Control
Ag+
AgNP
A
B
D
E
C F
-Control + cys
Control + cys
Ag+ + cys
AgNP + cys
-Control
Control
Ag+
AgNP

136
Figure 4.8. Cellular damage in trout hepatocytes exposed to various Ag+ or AgNPs
concentrations in the presence or absence of cysteine (Cys) and/or buthionine
sulfoximine (BSO) for 48 h. (A and D) Lipid peroxidation (TBARS). (B and E) DNA
damage (Soluble DNA). (C and F) Protein carbonyl. The positive control (C+) was a
combination of H2O2 and CuSO4 at 1 mM and was only used in the absence of BSO.
Negative control (C-) refers to BSO non-treated cells. Data are presented as Mean + SEM
(n = 4-7). Three-way ANOVA with post-hoc Holm-Sidak method was used to assess
statistical differences (see Table 4.2 and the results section).

137
TB
AR
S (
nm
ol/
g)
0
10
20
30
80
120
160
200
Total silver (g/mL)
C C+ 3.1 7.8 15.5 23.3 31.0
Pro
tein
carb
on
yl
(nm
ol/
mg
)
0
2
4
6
8
10
12
Control + cys
+Control + cys
Ag+ + cys
AgNP + cys
Control
+Control
Ag+
AgNP
So
lub
le D
NA
(
g/m
g)
0
10
20
30
40
50
Total silver (g/mL)
C- C 3.1 15.5 31.0
-Control + cys
Control + cys
Ag+ + cys
AgNP + cys
-Control
Control
Ag+
AgNP
A
B
D
E
FC
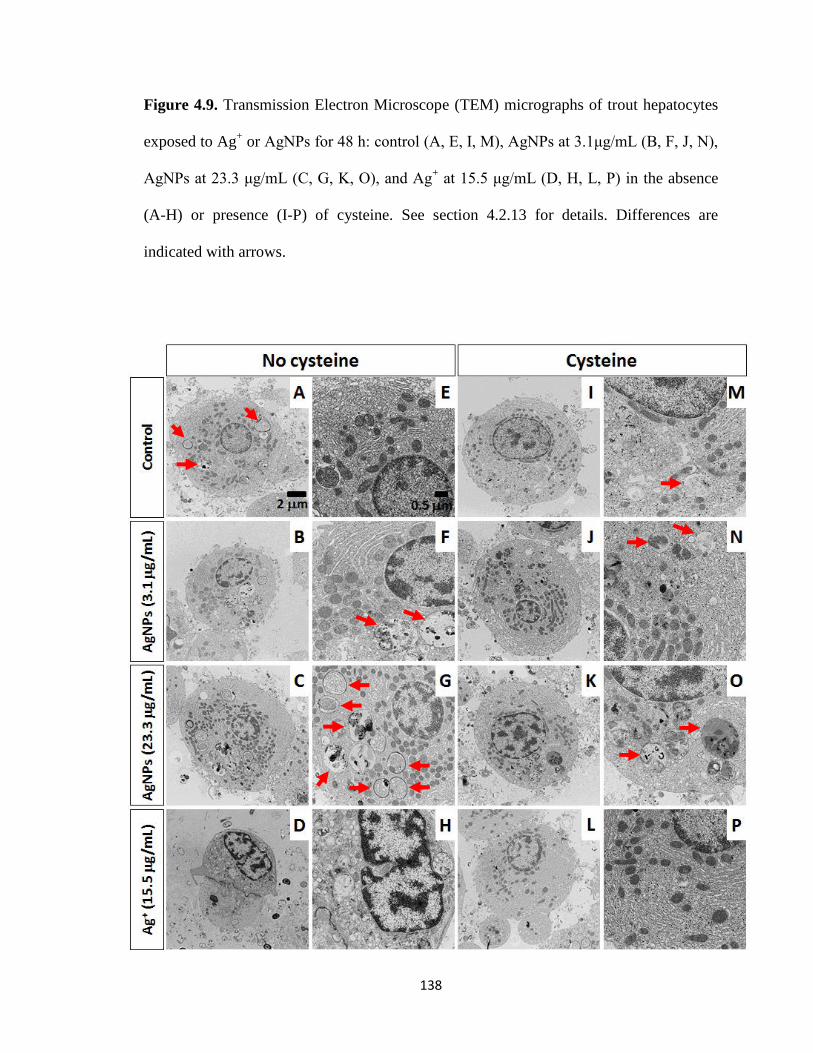
138
Figure 4.9. Transmission Electron Microscope (TEM) micrographs of trout hepatocytes
exposed to Ag+ or AgNPs for 48 h: control (A, E, I, M), AgNPs at 3.1μg/mL (B, F, J, N),
AgNPs at 23.3 μg/mL (C, G, K, O), and Ag+ at 15.5 μg/mL (D, H, L, P) in the absence
(A-H) or presence (I-P) of cysteine. See section 4.2.13 for details. Differences are
indicated with arrows.

139
4.4. Discussion
The environmental concentrations and the impacts of AgNPs on aquatic organisms
remain unknown, so it is important to further investigate their potential effects to provide
regulators and environmental protection agencies with data to assess whether or not
AgNPs may pose a risk to aquatic species. Given the ability of Ag+ and AgNPs to
accumulate in exposed fish, this study aimed to elucidate the relationship between Ag
toxicity and oxidative stress and damage in vitro using rainbow trout erythrocytes and
hepatocytes, two tissues that potentially could be impacted by AgNPs. This study used
AgNPs from Vive Nano that averaged 9 nm in diameter, with low aggregation (except in
presence of Cys) and with a low percentage dissolved Ag+ (0.5%).
It is important to note that the AgNP concentrations used here are similar to those
used in previous in vitro studies and are higher than the predicted environmental
concentrations of 0.088-2.63 ng/L (Gottschalk et al., 2009) or 40-320 ng/L (Blaser et al.,
2008) in surface water. In fact the concentrations used here are twenty times higher than
those used in our zebrafish studies (Chapter 2 and 3; Massarsky et al., 2013; 2014a).
Moreover, the concentrations of free AgNPs and Ag+ are most likely much lower than the
nominal concentrations due to the presence of salts and especially proteins in the culture
medium. Unfortunately, primary hepatocytes survive poorly in media lacking bovine
serum albumin so the effective Ag concentrations reported here are probably
overestimated.
We demonstrate that both Ag+ and AgNPs are cytotoxic to trout erythrocytes and
hepatocytes, but have different cellular targets as discussed below. Cells in our study
were exposed to concentrations of 3.1-31 μg/mL for 48 h since at lower concentrations
140
AgNPs were not cytotoxic, especially in hepatocytes. Based on our cell viability data,
AgNPs were less toxic than Ag+ at equivalent Ag concentrations to both cell models.
Silver toxicity was demonstrated previously in fish cell models. Farkas et al. (2010)
compared AgNP and Ag+ toxicity in rainbow trout hepatocytes and found that AgNPs
were more toxic than Ag+ at concentrations of 0.063-19 μg/mL after a 48 h exposure.
However, their more recent paper (Farkas et al., 2011) reported a similar cytotoxic
potential for AgNPs and Ag+ in rainbow trout gill cells exposed to 0.1-10 μg/mL Ag for
48 h. However, while comparing studies, it is important to consider cell culture
conditions. Our study used culture medium supplemented with 1% BSA, which would
decrease the amount of free Ag+ and likely bind to AgNPs, thus decreasing Ag toxicity as
previously reported (Grade et al., 2012). Also, the AgNPs used in our study were
carboxy-functionalized and stabilized with sodium polyacrylate compared to the sodium
citrate- and PVP-capped AgNPs used in Farkas et al. 2010 and 2011, respectively; the
particle size was similar however. The toxicity of Ag+ was also demonstrated previously
in several mammalian cell models (Hollinger, 1996). Baldi et al. (1988) showed a
reduction in rat hepatocytes viability after a 4 h exposure to 30 μM AgNO3 (~2 μg/mL
Ag+). Similarly, Sopjani et al. (2009) showed an increased hemolysis of human
erythrocytes exposed to Ag+ for 48 h even at 50 nM Ag
+ (5 ng/mL).
Furthermore, erythrocytes were more sensitive than hepatocytes to Ag exposure as
even the lower doses of silver increased cytotoxicity. This is likely due to the higher
susceptibility of erythrocytes to lipid peroxidation arising from the high content of poly-
unsaturated fatty acid in their cell membrane and high cytoplasmic oxygen and iron
concentrations, which continuously produce ROS (Li et al., 2013), making erythrocytes

141
an appropriate in vitro model to study oxidative stress (Reddy et al., 2007; Trenzado et
al., 2009). Our study also found that the LDH leakage assay in erythrocytes may actually
underestimate toxicity and that the hemolysis test may in fact be the more accurate
method of the two. It should be noted that the applicability of the LDH leakage assay
(and other assays) to test for cytotoxicity of ENMs was called into question in recent
studies. For example, MacCormack et al. (2012) investigated the activity of LDH in
presence of silicon, Au, or CdSe nanoparticles. The authors reported that all ENMs
inhibited the activity of purified rabbit muscle LDH; however, in the presence of 1%
BSA LDH activities were not affected. The activity of LDH in goldfish (Carassius
auratus) white muscle homogenates was also not affected by the ENMs. We too noticed
similar effects of AgNPs (unpublished data); AgNPs inhibited the LDH activity of the
purified rabbit muscle, but not of the rainbow trout (Oncorhynchus mykiss) white muscle
homogenates incubated under similar culture conditions as mentioned herein.
Furthermore, the similarity between the hemolysis and LDH leakage data for erythrocytes
provide additional assurance that LDH activity was not affected.
Previous studies have demonstrated that both types of Ag are able to generate ROS
leading to oxidative stress (Park et al. 2009; Piao et al. 2011; Mukherjee et al., 2012). In
our study both Ag-types generated ROS to similar extent. These findings contrast with
those of Farkas et al. (2010), who reported that Ag+, but not AgNPs, generated ROS in
trout hepatocytes after a 2 h exposure. This difference with our study may be related to
different exposure periods, but it may also be attributed to the different AgNPs used. The
observed increase in ROS could explain the decrease in TGSH in the hepatocytes but also
erythrocytes, which are presumably more susceptible to oxidative stress. Although there

142
were no apparent differences in the ability of Ag+ and AgNP to generate ROS in
hepatocytes, Ag+ was more effective in reducing TGSH levels in both cell models.
Reductions in TGSH levels imply the utilization of GSH to neutralize the generated ROS,
which is commonly used as a marker of oxidative stress (Park, et al., 2009; Tuncer, et al.,
2010). It is also possible that some of the GSH directly binds to the free Ag+ inside the
cell as it has been shown that Ag+ has a high affinity for thiol compounds such as GSH
(Carlson, et al. 2008; Kramer et al., 2009; Khan et al., 2011). Moreover, AgNPs were
shown to inhibit the activity of GSH-synthesizing enzymes, reducing the GSH production
(Piao et al., 2011). Activities of these enzymes, however, were not measured in this
study. The decrease in intracellular GSSG could be attributed to its transport out of the
cells (Deneke and Fanburg, 1989; Toborek et al., 1995; Keppler, 1999) and subsequent
degradation by glutamyltransferase and peptidases (Hultberg et al., 2001). The cleavage
of GSSG disulfide bonds in relation to Ag+ has also been mentioned (Khan et al., 2011),
which could also contribute to GSSG decrease. Lastly, it is important to note the higher
levels of TGSH and GSSG in erythrocytes, which is probably due to their role in oxygen
transport and higher susceptibility for oxidative damage. This observation was previously
reported for rainbow trout (Otto and Moon, 1996).
The depletion of GSH may explain the decreased GST activity as it conjugates GSH
to harmful products of lipid peroxidation (and xenobiotic compounds) (Lushchak et al.,
2001); GST activity was further reduced when GSH levels were chemically reduced in
BSO-treated hepatocytes. However, the activity of GPx, which also utilizes GSH to
eliminate lipid peroxides (and H2O2) (Lushchak et al., 2001) was only slightly reduced in
BSO-treated hepatocytes. Reduction in GPx activity has been reported previously in the

143
human liver cell line HL-7702 exposed to AgNPs for 24 h; however, glutathione levels
were not measured in this study (Song et al., 2012). The activity of GR was also reduced,
perhaps in response to the decreased GSSG levels as it recycles GSSG to replenish GSH
(Mannervik, 1987). The activities of CAT decreased and SOD increased in erythrocytes,
but not in hepatocytes, reflecting perhaps the levels of H2O2 and superoxide anions in
these cells. The activity of SOD has been shown to decrease after a 24 h exposure to
AgNPs in the human liver cell line HL-7702 (Song et al., 2012) similarly to the decreased
SOD activity in Ag+-exposed and BSO-treated trout hepatocytes in this study. In contrast,
Misra et al. (2012) reported increased activities for GPx, CAT, and SOD, decreased GSH
levels, and increased TBARS in trout hepatocytes exposed to the oxidative stress inducer
selenomethionine. Overall, these data indicate that the link between antioxidant enzymes
activities, ROS generation, and antioxidants, such as GSH, should be examined in more
detail, especially in response to AgNP/Ag+ exposure.
There was also evidence for cellular damage in addition to oxidative stress in
hepatocytes in response to Ag. We showed that AgNPs induced lipid peroxidation,
suggesting that AgNPs, at least under the conditions of this study, may generate ROS
extracellularly and/or within close proximity to the cell membrane. This is further
supported by the increased lipid peroxidation in hepatocytes that were treated with Cys
where some AgNPs precipitated (as discussed below). On the other hand, Ag+ induced
DNA damage in hepatocytes, suggesting that Ag+ penetrates the cell membrane and may
generate ROS intracellularly, damaging the DNA. The ability of AgNPs (coated with
methoxy-polyethylene glycol mercapto) to induce lipid peroxidation was demonstrated
previously in human liver cell line HL-7702 after a 24 h exposure to 12.5-100 μg/mL

144
AgNPs (Song et al., 2012). The idea of extracellular ROS generation suggested here is
circumstantially supported by the minimal evidence for AgNPs uptake in the hepatocytes.
The morphology of the AgNP-exposed cells appeared similar to the control cells. The
only apparent difference was the higher abundance of cytoplasmic inclusion bodies or
vesicles in AgNP-exposed cells. Similar results were reported for gold nanoparticles,
which accumulated inside the vesicles of mouse fibroblasts (Coradeghini et al., 2013).
However, unlike in mouse fibroblasts, there were no visible nanoparticles inside the
vesicles, suggesting that if in fact the AgNPs are taken up, they probably dissociate.
Furthermore, there was no sign of AgNPs in the cytoplasm, unlike the recent study by
Nguyen et al. (2013) that reported intracellular AgNPs in mouse macrophage. These
differences in AgNP uptake could be attributed to cell type and AgNPs coatings used. It
should be noted that the coating or surface functionalization is an important factor that is
likely to affect the behavior and toxicity of AgNPs (and other ENMs) as recently
reviewed (Scown et al., 2010a; Chernousova and Epple, 2013; Yu et al., 2013). It was
also reported that the extent of AgNPs uptake could be modified by the protein-AgNP
complexes in human epidermal keratinocyte (HEK) cells (Monteiro-Riviere et al., 2013);
however, AgNPs were taken up in all cases and formed cytoplasmic vacuoles similar to
Coradeghini et al. (2013). Furthermore, there was no sign of AgNPs lodged in cell
membranes, but this can be a result of washing performed during sample preparation for
TEM imaging (Liu et al., 2010b).
Cysteine treatment generally reduced the toxicity of both Ag-types in the two cell
preparations used. This effect was evident from the decreased cytotoxicity and higher
TGSH levels in Cys-treated cells. Similar effects of Cys and other thiol-containing
145
molecules on AgNP toxicity were reported in macrophages exposed to 100 μg/mL of
AgNPs for 72 h (Singh and Ramarao, 2012). It is also possible that in addition to the
chelating effect, Cys acts as an antioxidant as reported elsewhere (Rayburn and
Friedman, 2010; Tuncer et al., 2010); this is especially relevant for the lower Ag
concentrations since Cys binds Ag+ in 1:1 ratio (Liu and Sun, 1981), meaning that at
these lower doses there was excess Cys available to be taken up by the cells to act as an
antioxidant and/or promote GSH synthesis. Although plausible, the antioxidant action of
Cys has limited support in this study since control cells treated with Cys did not display
higher glutathione levels and Cys treatment did not suppress the prooxidant action of
BSO. Moreover, Cys treatment did not decrease Ag+/AgNP-mediated ROS generation in
hepatocytes. Cys treatment also increased the lipid peroxidation in hepatocytes in the
presence of AgNPs; however; this effect may be related to the ability of Cys to
precipitate AgNPs as noted from the microscopy and spectroscopy results. One could
speculate that the precipitated AgNPs would come into direct contact with the cells and
induce lipid peroxidation more effectively. Although AgNPs in the presence of Cys
increased lipid peroxidation, the cell viability was not affected, suggesting that the
extensive lipid peroxidation was not sufficient to induce cytotoxicity; this emphasizes
that the relation between oxidative damage and cytotoxicity is not absolute.
Treatment with BSO in hepatocytes increased the toxicity of both Ag-types as
evidenced from the increased cytotoxicity in both Ag+- and AgNPs-exposed cells.
Interestingly, Cys co-treatment reduced the cytotoxicity of Ag+ similarly to BSO non-
treated cells, but not in AgNPs-exposed cells. Furthermore, Cys co-treatment was unable
to return TGSH levels in both Ag+- and AgNPs-exposed cells to those observed in BSO

146
non-treated cells. The lipid peroxidation in BSO-treated hepatocytes was also increased,
especially with AgNPs in presence of Cys. This could be explained by the precipitation
of AgNPs as mentioned above. In addition, given that there was no additional increase in
ROS in BSO-treated hepatocytes, it is plausible that the increased lipid peroxidation was
due to the decreased GSH levels. Glutathione is used by GPx to eliminate not only H2O2
but also lipid peroxides that promote lipid peroxidation (Lushchak et al., 2001). Although
BSO treatment did not seem to affect other endpoints of oxidative damage, our results
suggest that glutathione plays an important role in protection against AgNP and Ag+
toxicity. A similar conclusion was reported previously by Khan et al. (2011) for Ag+
toxicity in human blood.
In summary, previous studies addressing the toxicity of AgNPs in vitro have
suggested oxidative stress as a potential mechanism, and this study examined this
mechanism in more detail using trout erythrocytes and hepatocytes. Generally, Ag+ was
more toxic than AgNPs, although both types increased cytotoxicity, generated ROS, and
depleted GSH levels in both hepatocytes and erythrocytes. Moreover, GSH appeared to
play an important role in protecting hepatocytes from Ag toxicity, since the cytotoxicity
of both silver types increased in cells that had lower GSH levels due to BSO treatment.
The activities of antioxidant enzymes were also measured; however, generally few
changes were observed with SOD, CAT, and GPx, whereas the activities of GR and GST
were decreased, revealing the complex relationship between oxidative stress and
antioxidant enzymes. Furthermore, whereas Ag+ induced DNA damage, AgNPs increased
lipid peroxidation in hepatocytes, suggesting that AgNPs and Ag+ generate ROS
extracellularly and intracellularly, respectively, and act through different mechanisms,

147
which should be further elucidated in future studies. Finally, this study demonstrated that
not all cell types are equally sensitive to Ag+ and/or AgNPs and any generalizations
pertaining to in vitro toxicity of silver should be avoided.
148
CHAPTER 5
Silver nanoparticles stimulate glycogenolysis in rainbow trout
(Oncorhynchus mykiss) hepatocytes
This chapter is based upon the following article: Massarsky, A., Labarre, J., Trudeau,
V.L., Moon, T.W., 2014. Silver nanoparticles stimulate glycogenolysis in rainbow trout
(Oncorhynchus mykiss) hepatocytes. Aquat. Toxicol. 147, 68-75.
Permission was obtained from the journal for incorporation of this article into this thesis.
This article is based on the work that was conducted with the assistance of the
undergraduate student Justine Labarre (summer 2013; internship student from Université
Nice Sophia Antipolis, France), whom I directly supervised. I designed and conducted
these experiments, and wrote the manuscript. Drs. Vance Trudeau and Thomas Moon
provided input into the preparation of the manuscript and funding for the project.
149
5.1. Introduction
Silver nanoparticles (AgNPs) are commonly found in a number of consumer
products, but their biological effects on non-target aquatic organisms are yet to be fully
understood. A review by Nel et al. (2009) addressed the potential interactions of
engineered nanomaterials (ENMs) with biological interfaces, including cells, membranes,
organelles, proteins, and DNA. According to this review, these interactions depend on the
biophysicochemical dynamics and lead primarily to the formation of protein coronas,
which in turn influence the movement of the ENM onto or into cells. The kinetics of
ENM-protein association and dissociation will determine the interaction of the particle
with biological surfaces and receptors, and therefore its fate. ENM interactions with the
membrane and its ligands and receptors will influence the cellular uptake and are
especially important in drug delivery applications (Nel et al., 2009).
The ability of ENMs to interact with proteins has been reported in several studies.
For example, MacCormack et al. (2012) reported that the activity of purified lactate
dehydrogenase (LDH; E.C. 1.1.1.2.7) from rabbit muscle was inhibited in the presence of
silicon, Au, or CdSe nanoparticles; however, this effect was abolished in the presence of
1% bovine serum albumin (BSA). The activity of LDH in goldfish (Carassius auratus)
white muscle homogenates was not affected by these ENMs (MacCormack et al., 2012).
Similarly, we observed that AgNPs inhibited LDH activity of purified rabbit muscle, but
not of rainbow trout (Oncorhynchus mykiss) white muscle homogenates (unpublished
data). These studies suggest that the ENMs bind to proteins such as the BSA and those
found in tissue homogenates.

150
Despite the aforementioned interactions of ENMs with cellular components, their
potential to disrupt cell signaling pathways has yet to be addressed. Therefore, we
hypothesized that AgNPs could interfere with proper receptor signaling by binding to
receptors and/or cell membranes of target cells. In a pilot experiment we determined that
AgNPs were able to stimulate glucose release from isolated trout hepatocytes; thus, we
felt this could be a good model to study the interaction between AgNPs and membrane
function. Trout hepatocytes are standard tools for studies involving the hormonal
regulation of metabolism, including catecholamines and their downstream processes such
as glycogen and glucose metabolism (Mommsen et al., 1988; Moon, 2004). Hepatocytes
are also extensively used in the field of toxicology since liver is a major organ involved
in xenobiotic metabolism (Guillouzo, 1998; Castano et al., 2003).
Metabolically hepatocyte glucose can be derived from glycogen by glycogenolysis
and by glucose conversion from 3-carbon compounds by gluconeogenesis. Both
processes are driven by hormone receptor systems, one initiated at the membrane and the
second cytosolic. Therefore, this study focused on the membrane-bound β-adrenoreceptor
(-AR), which is the predominant AR in trout hepatocytes (Gilmour et al., 2012), and the
cytosolic glucocorticoid receptor (GCR). These receptor systems play important roles in
mediating the catecholamine and cortisol-dependent stress responses, respectively, in
vertebrates.
The β-AR plays a central role within the adrenergic system that regulates many
aspects of vertebrate metabolism and function, including the ‘fight-or-flight’ response.
Adrenoreceptors, members of the G-protein coupled receptor superfamily and the targets
of catecholamines, are present on most fish tissue membranes and mediate a variety of

151
responses (Massarsky et al., 2011), including an immediate response to a stressor
mediated by the β-AR signal transduction pathway, which leads to increased cardiac
contraction and liberation of fatty acids by adipose tissue (Van Heeswijk et al., 2006).
Catecholamines are also critical to the mobilization of energy reserves primarily through
glycogenolysis and to a lesser extent through gluconeogenesis and are mediated primarily
by the hepatic AR, which may be either the β2- or the 1-AR depending upon species
(Nickerson et al., 2001). As expressed in the pioneering studies of Cannon et al. (1929),
the role of catecholamines on the various tissues enable the organism to organize the
‘fight-or-flight’ response and ultimately allow the animal to survive a stressful event.
On the other hand, the GCR plays an important role during the stress response
mediated by the hypothalamic-pituitary-interrenal (HPI) axis. Unlike the -AR, the GCR
is located in the cytosol and upon binding cortisol (CORT) regulates the transcription of
genes involved in maintenance of energy balance, immunoregulation, growth, and
reproduction, among others (Mommsen et al., 1999; Alderman et al., 2012). More
specifically, during stress CORT increases gluconeogenesis in the liver, providing fuel to
tissues, thus allowing them to cope with the metabolic demands imposed by a stressor
(Vijayan et al., 2003).
This study aimed to explain the observed increase in glucose release noted in our
pilot experiment (unpublished data) by using agonists/antagonists of the -AR and GCR
systems. To this end, following hepatocyte exposures the medium and cells were
collected and glucose, glycogen, adenosine 3’,5’-cyclic monophosphate (cAMP; second
messenger within the -AR signaling pathway) contents, as well as the activities of
glycogen phosphorylase (GPase), phosphoenolpyruvate carboxykinase (PEPCK),

152
fructose-1,6-bisphosphatase (FBPase), and several aminotransferases (alanine, aspartate,
and tyrosine) were assessed.
5.2. Materials and methods
5.2.1. Silver nanoparticles (AgNPs)
An aqueous solution of carboxy-functionalized AgNPs, stabilized with sodium
polyacrylate (31% Ag) (Vive Nano, 13010L) was used in this study as described in
Chapters 2 and 4. Total nominal Ag concentrations noted on the figures were based on
the manufacturer’s determined silver content. The size, polydispersity index (PDI), and
zeta ()-potential of AgNPs were previously characterized using Dynamic Light
Scattering (DLS; Zetasizer Nano, Malvern Instruments Ltd). The particle size and
stability were confirmed, using Scanning Transmission Electron Microscope (STEM;
JEOL JSM-7500F Field Emission Scanning Electron Microscope) and UV-visible
spectroscopy, respectively. The average particle size was ~9 nm (Chapter 4; Massarsky et
al., 2014b). Moreover, the dissolution of AgNPs was assessed using the Amicon Ultra
Centrifugal Filters (3 kDa; UFC800324) following the manufacturer’s protocol and the
flow through was collected and analyzed using a Varian Atomic Absorption
Spectrometer (AA240) fitted with a Ag 1.5” hollow cathode lamp (Perkin Elmer Atomax,
N2025300). The dissolution was estimated at 0.5% (Chapter 2; Massarsky et al., 2013).
Moreover, the size and stability of AgNPs were verified in the presence of
agonists/antagonists used here using DLS and spectroscopy approaches, and no
agonist/antagonist effects were observed.

153
5.2.2. Experimental set-up
See Chapter 4 for details on rainbow trout husbandry (section 4.2.3) and hepatocyte
isolation procedures (section 4.2.4). Hepatocytes were exposed to AgNP solutions at
concentrations of 0 (control), 1, and 10 μg/mL; as these concentrations were not expected
to increase cytotoxicity based on our previous study (Chapter 4; Massarsky et al., 2014b).
In addition, the cells were exposed to agonists/antagonists of the -AR and GCR systems.
The experimental groups were as follows:
1) None: cells were exposed for 48 h to only AgNPs (0, 1, 10 g/mL)
2) PROP: cells were exposed for 48 h to AgNPs in the presence of the non-selective -
blocker propranolol (PROP, 0.1 mM; higher concentrations significantly increased
cytotoxicity) to verify whether the AgNP-mediated glucose release was -AR-
dependent. PROP (Sigma P0884) was used in previous studies to block the -AR in
trout (e.g. Reid et al., 1991; Dugan et al., 2003; Lortie and Moon, 2003).
3) ISO: cells were exposed for 48 h to AgNPs and then treated with the non-selective -
AR agonist isoproterenol (ISO, 0.1 mM; lower concentrations did not significantly
increase medium glucose content in 3 h) for an additional 3 h in the presence of
AgNPs. This was done to check whether AgNP-exposed cells would respond to an
agonist. ISO (Sigma I2760) was used in previous studies involving the trout -AR
(e.g. Reid et al., 1991; Dugan et al., 2003).
4) PROP/ISO: cells were exposed for 48 h to AgNPs and then treated with a
combination of PROP and ISO (the concentration of antagonist should be ten times
higher than that of the agonist, but this was not possible as 1 mM PROP was

154
cytotoxic) for an additional 3 h in the presence of AgNPs. This was done to check
whether the antagonist would modify the agonist response.
5) MIFE: cells were exposed for 48 h to AgNPs in the presence of the GCR antagonist
mifepristone (MIFE, 1000 ng/mL). This MIFE (Roussel-Uclaf 7A4087B)
concentration was effective in blocking the cortisol-mediated metabolic effects in
trout hepatocytes previously (Sathiyaa and Vijayan, 2003).
6) CORT: cells were exposed for 48 h to AgNPs in the presence of the GCR agonist
cortisol (CORT, 100 ng/mL). This CORT (Sigma H4881) concentration is typical of
levels found in stressed trout in vivo and was used previously in trout hepatocyte
experiments (Aluru and Vijayan, 2007).
7) MIFE/CORT: cells were exposed for 48 h to AgNPs in the presence of MIFE and
CORT. This was done to check whether the antagonist would modify the agonist
response.
The experimental groups 2-4 and 5-7 were used to deduce the effects of AgNPs within
the β-AR and GCR signaling systems, respectively. At the end of the experiment the
medium and the cells were collected into 1.5 mL tubes and frozen at -80°C until
analyzed.
5.2.3. Cell viability analysis
Cell viability was determined by the lactate dehydrogenase (LDH; EC 1.1.1.27)
leakage assay as outlined in Chapter 4 (section 4.2.6). The LDH activity was normalized
to the control (none or no addition) group.

155
5.2.4. Glucose production
The glucose content in the medium was assessed enzymatically according to Wright
et al. (1989). Briefly, a 10 µL sample was incubated with 200 µL assay medium (in mM:
60 trizma-base, 40 trizma-HCl, 1 MgSO4, 2 NAD+, 1 ATP, and 0.1 U/mL G6PD) in a 96-
well plate with shaking for 5 min at room temperature followed by the addition of 10 µL
hexokinase solution (0.3 U/mL). The plate was incubated for 30 min at room temperature
and the absorbance at 340 nm was assessed. The concentration of glucose was assessed
using a standard curve.
5.2.5. Cellular glycogen content
The cellular glycogen content was determined according to Wright et al. (1989).
Briefly, cells were homogenized in 20 vol (w/v) 6% perchloric acid (PCA) using a
Kontes Micro Ultrasonic Cell Disruptor. The samples were incubated on ice for 20 min,
followed by a 5 min centrifugation at 4000 g (4°C) in a Beckman Coulter Microfuge® R
centrifuge. The supernatant was used for the assay as follows: to 50 µL supernatant were
added 25 µL 1 M NaHCO3 and 0.5 mL amyloglucosidase solution (containing 120 mM
sodium-acetate, 12 U/mL amyloglucosidase, 80 mM glacial acetic-acid). After a 2 h
incubation at 35-40°C, the reaction was terminated by the addition of 70% PCA followed
by a 2 min centrifugation at 4000 g (4°C). The glycogen concentration was calculated
from glycogen standards based on the generated glucose using the glucose assay as
above.

156
5.2.6. Cortisol in the medium
The CORT levels in the culture medium were estimated to verify the extent of
uptake/degradation of CORT throughout the exposure period. Cortisol content was
assessed at the end of the experiment using a radioimmunoassay (RIA) 125
I kit as per the
manufacturer’s instructions (MP Biomedicals, 07221102, Orangeburg, NY).
5.2.7. Glycogen phosphorylase (GPase) activity (EC 2.4.1.1)
The activity of GPase was determined according to Moon et al. (1999). Briefly,
hepatocytes were sonicated for 5 s in 0.1 mL of ice-cold stopping buffer (in mM: 50
imidazole-HCl, 25 β-mercaptoethanol, 5 EDTA, 5 EGTA, 100 KF, 0.5 mg/mL bovine
glycogen, and 10 g/mL aprotinin; pH 7.4) to ensure that the phosphorylation status of
the enzyme was unchanged from the end of the experiment. The total GPase activity was
assessed by adding 100 L of medium (3 mM NAD+, 15 mM MgSO4, 8 M glucose-1,6-
bisphosphate, 2 mM AMP, 2 mg/mL glycogen, 0.6 mM EDTA, with excess of
phosphoglucomutase and G6PD, prepared in 67 mM phosphate buffer; pH 7.1) and 10
L sample into a 96-well plate and monitoring the absorbance at 340 nm for 30 min. The
activity of GPase a was assessed in a similar fashion, but the medium also contained
caffeine (10 mM) to inactivate the dephosphorylated or b form of GPase. The activity
was expressed per unit protein, where homogenate protein content was assessed using the
Bio-Rad protein assay following manufacturer’s protocol with bovine serum albumin
standards. Percentage activation was calculated as GPase a activity/total GPase activity x
100.

157
5.2.8. Phosphoenolpyruvate carboxykinase (PEPCK) activity (EC 4.1.1.49)
The activity of PEPCK was assessed according to Petrescu et al. (1979) with slight
modifications. Briefly, cells (10 mg) were sonicated as above for 5 s in 20 vol (w/v) ice-
cold 50 mM imidazole buffer (pH 7.4). The homogenates were centrifuged for 15 min at
15,000 g (4°C) and the supernatant was collected and used for the assay. The samples (50
l) were added into a 96-well plate followed by 100 l of assay mix (50 mM NaHCO3, 1
mM phosphoenolpyruvate, 1 mM MnCl2, 0.25 mM NADH, 0.2 mM deoxyguanosine
diphosphate, and 2 U malate dehydrogenase, prepared in 50 mM imidazole; pH 7.4). The
decrease in absorbance was monitored at 340 nm for 30 min spectrophotometrically as
above and adjusted to substrate and enzyme blanks.
5.2.9. Fructose-1,6-bisphosphatase (FBPase) activity (EC 3.1.3.11)
The activity of FBPase was assessed as modified from Mommsen et al. (1980).
Briefly, samples were prepared as above. The samples (50 L) were added into a 96-well
plate followed by 100 L of assay medium (15 mM MgCl2, 0.1 mM fructose-1,6-
bisphosphate, 0.2 mM NAD+, 10 U phosphoglucose isomerase, and 2 U G6PD, prepared
in 50 mM imidazole; pH 7.4). The increase in absorbance was monitored at 340 nm for
30 min as above and adjusted to substrate and enzyme blanks.
5.2.10. Activities of aminotransferases
Samples were prepared by sonicating hepatocytes for 5 s in 0.2 mL homogenization
buffer (in mM: 20 Tris-HCl, 5 EDTA, 5 MgCl2, 150 KCl, and 5 -mercaptoethanol; pH
7.4). The activity of alanine aminotransferase (ALT; EC 2.6.1.2) was assessed according

158
to Mommsen et al. (1980) by monitoring the disappearance of NADH (0.12 mM) in 50
mM imidazole containing 200 mM L-alanine, 0.025 mM pyridoxal phosphate (PLP), 12
U LDH, and 10 L homogenate; the reaction was initiated by the addition of 10 mM -
ketoglutarate (-KG). The activity of aspartate aminotransferase (AST; EC 2.6.1.1) was
assessed according to Mommsen et al. (1980) by monitoring the disappearance of NADH
(0.12 mM) in 50 mM imidazole containing 40 mM aspartic acid, 0.025 mM PLP, 8 U
malic dehydrogenase, and 5 L homogenate; the reaction was initiated by the addition of
7 mM -KG. The activity of tyrosine aminotransferase (TYT; EC 2.6.1.5) was assessed
by the formation of p-hydroxybenzaldehyde at 331 nm as modified from Peragón et al.
(2008). Briefly, 10 L homogenate was incubated for 20 min at room temperature in 50
mM imidazole containing 3 mM L-tyrosine and 0.5 mM PLP; the reaction was started by
the addition of 10 L 0.3 M -KG and stopped after 2 min with 10 L 10 N NaOH;
blanks received 10 N NaOH prior to the addition of -KG. The activity was calculated
from the amount of p-hydroxybenzaldehyde formed during the 2 min reaction. The
activities of all three enzymes were normalized to protein concentration assessed with the
Bio-Rad protein assay.
5.2.11. Adenosine 3’,5’-cyclic monophosphate (cAMP) content
The amount of intracellular cAMP was assessed using the cAMP Direct
Immunoassay Kit (BioVision, K371-100) following the manufacturer’s protocol. The
frozen cell samples were prepared in 0.1 M HCl (1:15 w/v) according to the protocol.
159
5.2.12. Statistical analysis
Statistical analyses were conducted using SigmaPlot (SPW 11; Systat Software, Inc.,
San Jose, CA). A two-way analysis of variance (ANOVA) with a post-hoc Holm-Sidak
method was used throughout these experiments to assess the effect of treatment (i.e.
agonists/antagonists) and AgNPs concentration (0, 1, and 10 µg/mL). Significant
differences (P ≤ 0.050) are indicated as letters and asterisks on the graphs. The data are
presented as means and standard error of the mean (SEM).
5.3. Results
5.3.1. Cell viability analysis
The fold-change in LDH leakage was not significantly affected by treatment with
AgNPs (0, 1, and 10 µg/mL), PROP (0.1 mM), ISO (0.1 mM), CORT (100 ng/mL), or
MIFE (1 µg/mL) (Fig. 5.1). It is worth noting that cells exposed to 1 mM PROP (data not
shown) demonstrated a 2- and 6-fold increase in cytotoxicity after 3 and 48 h exposures,
respectively.
5.3.2. Glucose production
Medium glucose content was significantly increased as predicted in the presence of
ISO (a β-AR agonist). PROP treatment (a β-AR antagonist) did not significantly affect
either control or ISO-treated glucose levels (Fig. 5.2A) in control hepatocytes not treated
with AgNPs. As expected, CORT (a GCR-agonist) treatment increased medium glucose.
The MIFE treatment had no effect in the absence of CORT, but it did significantly block
the CORT effect in the absence of AgNPs (Fig. 5.2B). The patterns of glucose release

160
were generally similar for both ISO and CORT treated hepatocytes exposed to no
(control) or 1 g/mL AgNPs. However, at 10 g/mL AgNPs, medium glucose was higher
for all groups compared with the control or no AgNPs and any significant effects of the
agonists and antagonists were eliminated.
5.3.3. Cellular glycogen content
The glycogen content in ISO- and/or PROP-treated hepatocytes displayed the reverse
pattern of that seen for medium glucose (Fig. 5.3A). Isoproterenol significantly reduced
the glycogen content in both the control and 1 µg/mL AgNPs groups, whereas at 10
µg/mL AgNPs the glycogen content was significantly lower than the control even
without ISO. Propranolol treatment resulted in slightly higher glycogen levels, but this
was not significant although cells treated with both ISO and PROP had glycogen levels
similar to control cells. Glycogen content was not affected by CORT and/or MIFE
treatments; only the cells exposed to 10 µg/mL AgNPs had lower glycogen levels
irrespective of CORT/MIFE treatments (Fig. 5.3B).
5.3.4. Cortisol in the medium
CORT was initially added to the hepatocyte incubates at 100 ng/mL and the medium
CORT concentrations after the 48 h exposure were approximately 30 ng/mL (Fig. 5.4).
Generally, hepatocytes treated with 10 g/mL AgNPs had higher, but not significantly,
medium cortisol concentrations. The combinations of MIFE+CORT treatments were
significantly lower than cells treated only with CORT; this was independent of AgNP
treatment (Fig. 5.4).

161
5.3.5. Glycogen phosphorylase (GPase) activity
The activities of both total GPase and GPase a were significantly increased in
hepatocytes treated with ISO (β-agonist) in the control (0 AgNPs) and 1 µg/mL AgNP
(Fig. 5.5A and B) groups. Treatment with PROP did not affect either the total GPase or
GPase a activities in the presence or absence of ISO. At 10 µg/mL AgNPs both the no
agonist and PROP only activities increased while there was no change in either the
agonist or agonist + PROP groups. There were no significant effects on % GPase a
activities regardless of treatment (Fig 5.5C). Treatments with CORT and/or MIFE did not
affect the activity of GPase; however, exposure to 10 µg/mL AgNPs resulted in
significantly higher total GPase activity and the activity of GPase a as noted for ISO
(data not shown).
5.3.6. Activities of gluconeogenic enzymes
The activities of the gluconeogenic enzymes were generally not affected by any of
the treatments with the exception of PEPCK, whose activity was significantly lower in
the 10 g/mL AgNP-treated cells. These activities are summarized in Table 5.1.
5.3.7. cAMP content
cAMP levels were generally higher in ISO-treated cells although this value was
significant only in the control (0 AgNP) group (Fig. 5.6). Hepatocytes treated with 10
g/mL AgNPs and ISO had significantly lower cAMP levels than the cells treated with
ISO but no AgNPs. Other treatments, including MIFE and CORT, were not expected to
affect cAMP levels and they did not (data not shown).

162
Table 5.1. Activities of gluconeogenic enzymes: phosphoenolpyruvate carboxykinase
(PEPCK), fructose-1,6-bisphosphatase (FBPase), alanine aminotransferase (ALT),
aspartate aminotransferase (AST), and tyrosine aminotransferase (TYT), in trout
hepatocytes exposed to AgNPs for 48 h. The agonists/antagonists of the -adrenergic and
glucocorticoid receptors included propranolol (PROP), isoproterenol (ISO), mifepristone
(MIFE), and cortisol (CORT); control cells are indicated as ‘None’. The activities are
expressed in nmol/min/mg protein. Data are presented as Mean ± SEM (n = 3-4).
Statistical differences are indicated with letters. Two-way ANOVA with post-hoc Holm-
Sidak method was used to assess statistical differences (P ≤ 0.050).

163
[AgNP] * PEPCK FBPase ALT AST TYT
None 0 16.9±1.0a 3.2±0.4 191.3±20.4 288.9±20.1 92.4±12.6
1 17.7±0.7a 2.7±0.3 174.1±25.8 302.9±27.3 90.8±5.6
10 14.2±0.6b 3.4±0.3 175.7±24.1 299.8±25.6 72.4±8.5
PROP 0 17.1±0.1a 2.9±0.3 194.9±32.5 321.5±24.4 93.6±10.3
1 17.6±0.8a 2.5±0.3 185.1±29.2 303.0±35.0 100.8±15.6
10 13.7±0.9b 3.0±0.1 160.0±17.7 305.5±32.8 80.9±6.0
ISO 0 16.4±0.7a 3.9±0.6 186.2±25.3 319.7±29.8 91.4±6.9
1 16.4±0.4a 3.6±0.8 195.6±17.9 323.2±29.3 88.6±11.2
10 12.9±0.5b 4.1±0.9 171.8±11.9 296.7±16.4 78.0±5.8
PROP+ISO 0 16.2±1.1a 3.3±0.6 184.6±29.7 302.9±16.5 103.6±24.7
1 16.5±0.3a 3.7±0.8 186.0±27.5 307.0±18.2 104.9±11.1
10 12.9±0.1b 3.6±0.8 174.5±20.9 307.3±18.2 105.7±14.3
MIFE 0 16.2±0.9 2.7±0.2 194.4±31.5 274.4±9.6 108.6±10.2
1 15.7±1.4 3.1±0.1 188.6±26.1 272.8±3.7 92.6±4.1
10 14.1±0.8 3.8±0.5 173.4±17.5 276.0±13.1 79.2±6.6
CORT 0 15.9±0.9a 3.2±0.3 195.9±35.0 298.1±23.2 126.1±13.8
1 19.1±2.6ab
4.1±0.7 196.3±25.3 292.5±18.8 128.0±10.8
10 13.3±1.0b 3.4±0.4 161.7±12.7 258.0±28.2 76.0±29.1
MIFE+CORT 0 15.6±1.0 3.1±0.3 191.3±44.2 276.6±15.2 121.9±26.2
1 16.7±2.1 3.3±0.3 183.6±8.7 293.5±34.5 120.7±16.5
10 14.2±1.5 3.9±0.7 185.9±20.7 291.0±3.0 114.0±21.1
* Total silver concentration in g/mL
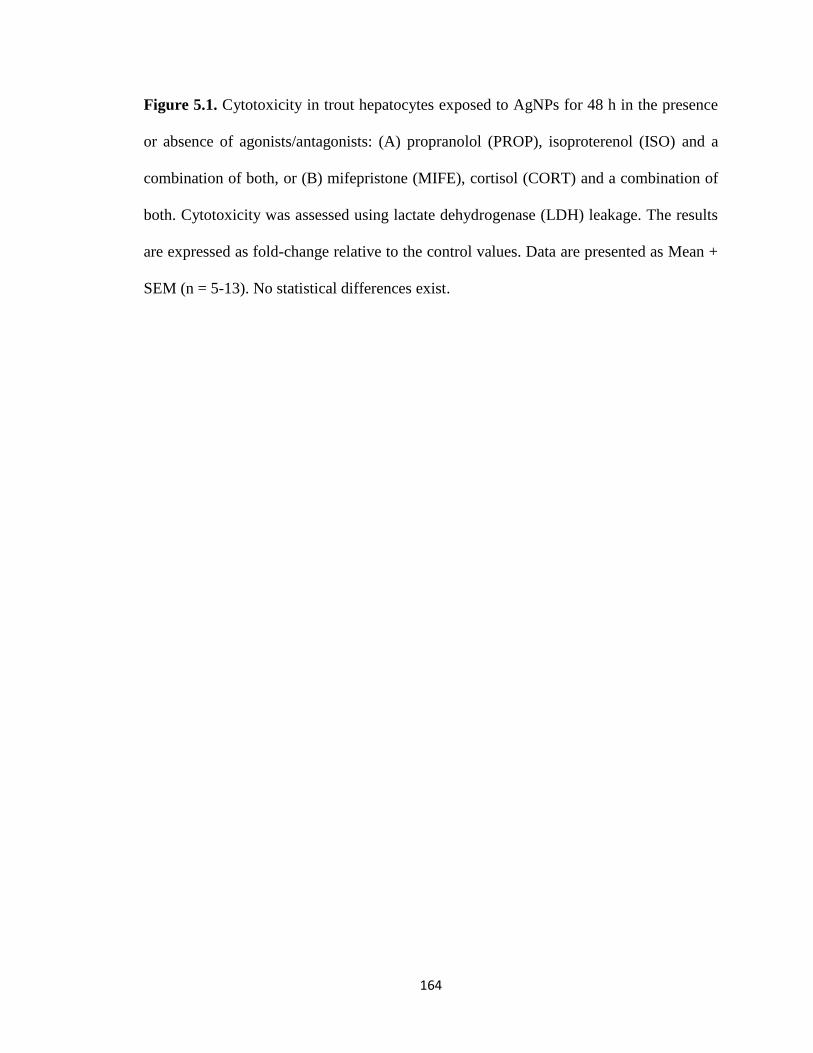
164
Figure 5.1. Cytotoxicity in trout hepatocytes exposed to AgNPs for 48 h in the presence
or absence of agonists/antagonists: (A) propranolol (PROP), isoproterenol (ISO) and a
combination of both, or (B) mifepristone (MIFE), cortisol (CORT) and a combination of
both. Cytotoxicity was assessed using lactate dehydrogenase (LDH) leakage. The results
are expressed as fold-change relative to the control values. Data are presented as Mean +
SEM (n = 5-13). No statistical differences exist.

165
LD
H l
eak
ag
e (
fold
ch
an
ge)
0.0
0.5
1.0
1.5
2.0 None
PROP (48 h)
ISO (3 h)
PROP+ISO (3 h)
Total silver (g/mL)
0 1 10
LD
H l
eak
ag
e (
fold
ch
an
ge)
0.0
0.5
1.0
1.5
2.0None
MIFE
CORT
MIFE+CORT
A
B
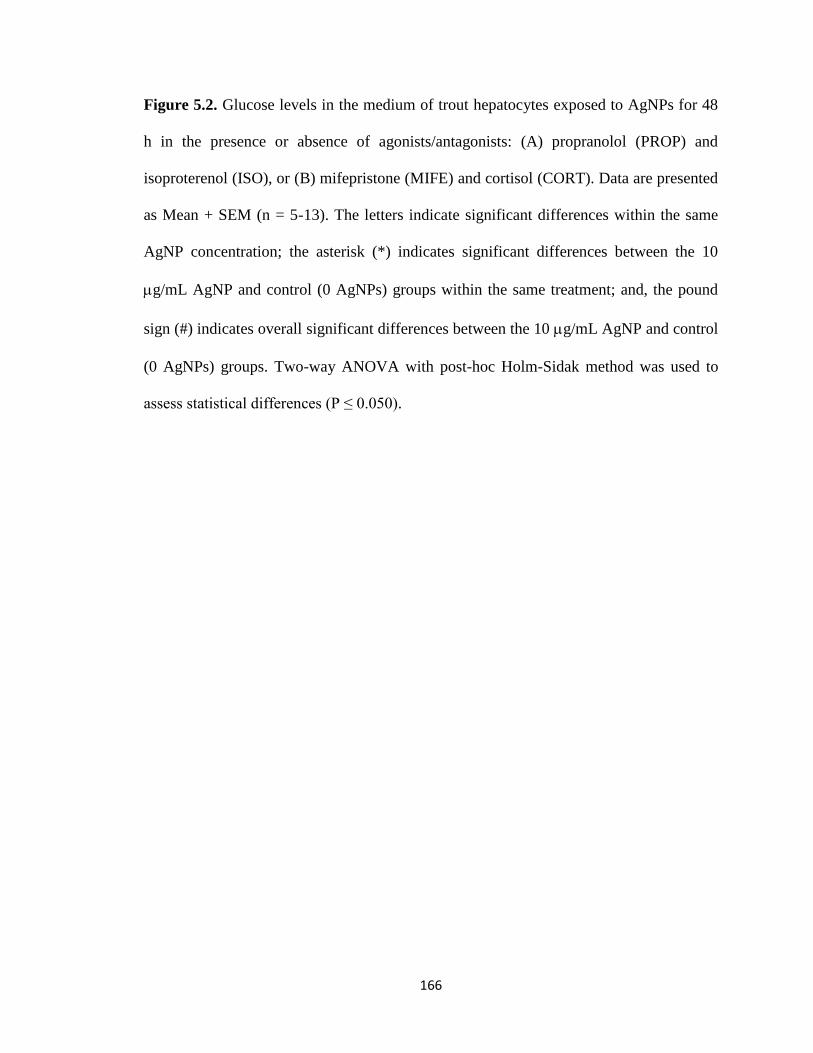
166
Figure 5.2. Glucose levels in the medium of trout hepatocytes exposed to AgNPs for 48
h in the presence or absence of agonists/antagonists: (A) propranolol (PROP) and
isoproterenol (ISO), or (B) mifepristone (MIFE) and cortisol (CORT). Data are presented
as Mean + SEM (n = 5-13). The letters indicate significant differences within the same
AgNP concentration; the asterisk (*) indicates significant differences between the 10
g/mL AgNP and control (0 AgNPs) groups within the same treatment; and, the pound
sign (#) indicates overall significant differences between the 10 g/mL AgNP and control
(0 AgNPs) groups. Two-way ANOVA with post-hoc Holm-Sidak method was used to
assess statistical differences (P ≤ 0.050).

167
Me
diu
m g
luco
se
(m
M)
0.0
0.5
1.0
1.5
2.0
2.5
3.0None
PROP (48 h)
ISO (3 h)
PROP+ISO (3 h)
a
a
b b
ac
ab
a
bc
b
ab
ab
a
*
*
Total silver (g/mL)
0 1 10
Me
diu
m g
luco
se
(m
M)
0.0
0.5
1.0
1.5
2.0
2.5
3.0None
MIFE
CORT
MIFE+CORT
b
b
a a aa
aab
**
A
B
#
#
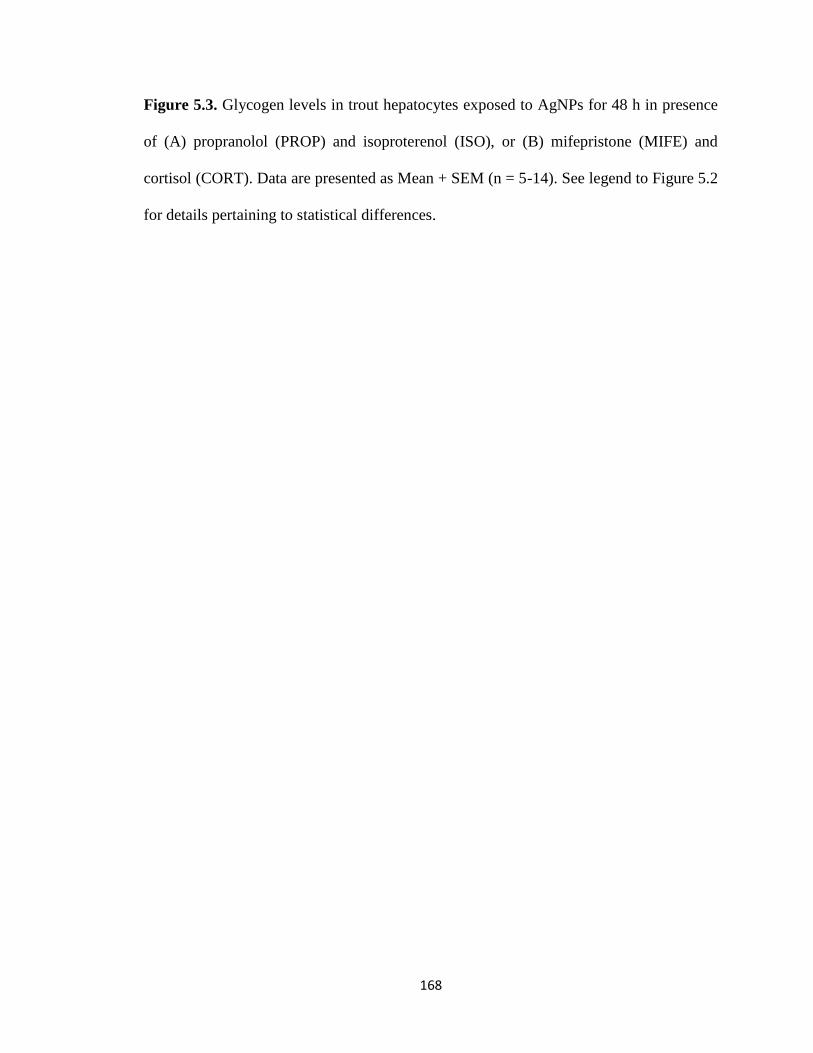
168
Figure 5.3. Glycogen levels in trout hepatocytes exposed to AgNPs for 48 h in presence
of (A) propranolol (PROP) and isoproterenol (ISO), or (B) mifepristone (MIFE) and
cortisol (CORT). Data are presented as Mean + SEM (n = 5-14). See legend to Figure 5.2
for details pertaining to statistical differences.

169
Gly
co
gen
(
mo
l/g
)
0
20
40
60
80
100None
PROP (48 h)
ISO (3 h)
PROP+ISO (3 h)
a a
a
b
a
b
a a
Total silver (g/mL)
0 1 10
Gly
co
gen
(
mo
l/g
)
0
20
40
60
80
100
None
MIFE
CORT
MIFE+CORT
A
B
*
#
#

170
Figure 5.4. Cortisol levels in the medium of trout hepatocytes exposed to AgNPs for 48 h
in the presence or absence of mifepristone (MIFE) and/or cortisol (CORT). Data are
presented as Mean + SEM (n = 5-14). The letters indicate significant differences within
the same AgNP concentration. Two-way ANOVA with post-hoc Holm-Sidak method
was used to assess statistical differences (P ≤ 0.050).
Total silver (g/mL)
0 1 10
Co
rtis
ol (n
g/m
L)
0
10
20
30
40
50None
MIFE
CORT
MIFE+CORT
a a a a a a
b b
b
cc
c

171
Figure 5.5. Glycogen phosphorylase (GPase) activities in trout hepatocytes exposed to
AgNPs for 48 h: (A) total GPase activity, (B) GPase a activity, and (C) percentage
activation of GPase a in absence or presence of propranolol (PROP) or isoproterenol
(ISO). Data are presented as Mean + SEM (n = 4-9). See legend to Figure 5.2 for details
pertaining to statistical differences.

172
To
tal G
Pase a
cti
vit
y
(nm
ol/m
in/m
g p
rote
in)
0
10
20
30
40
50
60 None
PROP (48 h)
ISO (3 h)
PROP+ISO (3 h)
a
a
b
b
aa
b b*
GP
ase a
acti
vit
y
(nm
ol/m
in/m
g p
rote
in)
0
5
10
15
20
a
ab
b ab
a
ab
b ab
*
Total silver (g/mL)
0 1 10
GP
ase a
(%
of
tota
l G
Pase)
0
20
40
60
A
B
C
#
#

173
Figure 5.6. cAMP levels in trout hepatocytes exposed to AgNPs for 48 h in the presence
of propranolol (PROP) and isoproterenol (ISO). Data are presented as Mean + SEM (n =
3). The letters indicate significant differences within the same AgNP concentration and
an asterisk indicates significant differences compared to the same treatment in the control
(0 AgNPs) group. Two-way ANOVA with post-hoc Holm-Sidak method was used to
assess statistical differences (P ≤ 0.050).
Total silver (g/mL)
0 10
cA
MP
(fm
ol/
mg
)
0
20
40
60
80None
PROP
ISO
PROP+ISO
a
*
a
a
b

174
5.4. Discussion
Several studies have addressed AgNP toxicity in fish, including Scown et al. (2010b)
and Gagné et al. (2012), who reported accumulation of AgNPs in the liver of juvenile
rainbow trout after a 4-10 d waterborne exposure. However, as noted from several review
papers (Scown et al., 2010a; Shaw and Handy, 2011; Chernousova and Epple, 2013; Yu
et al., 2013), very little is known about the potential of AgNPs to disrupt hormone-
regulated cell signaling pathways. Therefore, this study aimed to determine the effects of
AgNPs on the function of the -adrenoreceptor (β-AR) and glucocorticoid receptor
(GCR) pathways in rainbow trout hepatocytes, since the former regulates glycogenolysis
and the latter regulates gluconeogenesis, and both receptor systems increase glucose
availability during stress.
The nominal concentrations of AgNPs used in this study (0, 1, and 10 g/mL) were
based on our previous study, which showed that the viability of hepatocytes was
significantly affected by AgNPs at concentrations >15 g/mL (Chapter 4; Massarsky et
al., 2014b). It is also important to note that the concentrations chosen are similar to those
used in other in vitro studies (e.g. Farkas et al., 2010) and are well above the predicted
environmental concentrations that range from 0.088 to 2.63 ng/L (Gottschalk et al., 2009)
or 40 to 320 ng/L (Blaser et al., 2008) in surface water. At these environmentally relevant
AgNP concentrations, we have observed no overt effects in acute cell or embryo studies
(Chapters 2 and 4; Massarsky et al., 2013; 2014b).
This study clearly demonstrates that AgNPs do not interfere with the function of
the-AR and GCR systems at a concentration of 1 g/mL or below; however, at a
concentration of 10 g/mL, AgNPs do increase glycogenolysis. Whether this effect was
175
dependent upon either the β-AR or GCR systems is unclear. The β-AR agonist ISO and
the GCR agonist CORT both increased glucose release in the control (no AgNPs) and 1
g/mL AgNP-treated cells, suggesting that even at 1 g/mL, AgNPs do not affect either
receptor system. The relationship between glucose production and these two receptor
systems has been demonstrated in fish hepatocytes by previous authors (e.g. Brighenti et
al., 1991; Mommsen et al., 1999; Moon et al., 1999; Hallgren et al., 2003). In particular,
the binding of the agonist ISO to the hepatocyte membrane β-ARs initiates a signaling
process that initially activates adenylyl cyclase, increasing cAMP, which activates protein
kinase A (PKA), ultimately leading to the phosphorylation of GPase b (inactive)
converting it to the active GPase a form that ultimately converts glycogen into glucose
(Massarsky et al., 2011). This β-AR system is similar in fish as in mammals as reviewed
by Massarsky et al. (2011). On the other hand, CORT binds to its cytosolic receptor that
acts as a transcription factor to bind to glucocorticoid response elements in promoter
regions to increase transcription of glucocorticoid-sensitive genes (Mommsen et al.,
1999). One group of such genes are those that regulate gluconeogenesis or the production
of glucose from 3-carbon compounds such as lactate or amino acids (Mommsen et al.,
1999).
The results presented in this study support these previous studies showing ISO
increases glucose production from glycogen, increases cAMP content, and increases
GPase a activities. Treatment with PROP did block the ISO-stimulated decrease in
glycogen and the increase in cAMP, but not the increase in medium glucose or GPase a
changes. The absence of a PROP effect on these latter two processes is difficult to
explain given that it was effective against cAMP and glycogen. It does suggest that full

176
blockage was not achieved. As noted, PROP concentrations were limited by a cytotoxic
effect of this antagonist on the trout hepatocytes, which may account for the limited
effects seen.
On the other hand, CORT affected the hepatocytes by increasing glucose production
without affecting glycogen contents. This was predicted as CORT as noted above affects
the transcription of glucocorticoid-sensitive genes including the aminotransferases and
PEPCK. Although the activities of gluconeogenic enzymes were not increased by CORT
(or any other treatment), these results are consistent with Mommsen et al. (1999) who
were unsuccessful in showing changes in the activities of enzymes involved in
glucocorticoid stimulation of fish liver metabolism, including PEPCK, AST, ALT, with
CORT. The lack of a significant increase in enzymes activities in our study, despite
higher PEPCK mRNA and plasma glucose levels in the CORT group in the study of
Vijayan et al. (2003), suggests that enzyme activity may not be a sensitive or reliable
indicator of CORT-mediated gluconeogenesis. The GCR antagonist MIFE effectively
blocked the glucose changes as predicted and as reported previously in trout hepatocytes
(Sathiyaa and Vijayan, 2003).
It should also be noted that although glycogenolysis in rainbow trout hepatocytes is
mediated primarily by the -AR (Van Heeswijk et al., 2006), the 1-AR can also increase
glycogenolysis and at concentrations of catecholamines found in resting fish (<10 nM
epinephrine) the 1-AR may contribute significantly to changes in glycogenolysis (see
Fabbri et al., 1998). Unlike the β-AR signaling, which is mediated by the activation of
adenylyl cyclase and a resulting increase in cAMP, 1-AR signaling is mediated by
phospholipase-Cγ (PLCγ) (Fabbri et al., 1998). Activation of PLCγ leads to increased

177
hydrolysis of membrane phosphatidylinositol-4,5-bisphosphate (PIP2), the products of
which are inositol-1,4,5-trisphosphate (IP3) and diacylglycerol (DAG). The former binds
to receptors on the surface of the endoplasmic reticulum leading to the release of Ca2+
ions. The Ca2+
ions then interact with the calmodulin subunits of phosphorylase kinase
resulting in its activation (Fabbri et al., 1998). The absence of PROP completely blocking
ISO-mediated increases in medium glucose may suggest that the 1-AR is active in this
tissue even though ISO concentrations (0.1 mM) used here are well above epinephrine
concentrations at rest in fish. Although the 1-AR-mediated glycogenolysis in trout
hepatocytes was not supported by Fabbri et al. (1995), 1-AR transcripts were identified
in trout liver using qPCR (Chen et al., 2007), but their physiological role remains
unknown. Therefore, the potential ability of AgNPs to impact the 1-AR function should
be tested in future studies.
Furthermore, Michelsen and Sheridan (1990) demonstrated the ability of a Ca2+
ionophore (A23187) to increase glucose release, suggesting that Ca2+
may impact
glycogenolysis. It is noteworthy that a recent study demonstrated the ability of AgNPs to
increase cytosolic Ca2+
levels in primary rat cerebellum cells and suggested that these
changes in Ca2+
may have contributed to the observed oxidative stress in these cells (Yin
et al., 2013). Moreover, it has been reported that heavy metals can increase cytosolic Ca2+
levels by impairing Ca2+
homeostasis (Verbost et al., 1989; Viarengo and Nicotera,
1991), stimulating the entry of Ca2+
into cells via verapamil-sensitive channels (Burlando
et al., 2003), or increasing the release of Ca2+
from intracellular stores (McNulty and
Taylor, 1991; Burlando et al., 2003). Whether AgNPs act through similar mechanisms to
affect cytosolic Ca2+
levels is yet to be determined, but it has been suggested that Ag+ can

178
block the Ca2+
pump, stimulating Ca2+
release from intracellular stores at least in human
HL-60 cells (promyelocytic cell line; Taguchi et al., 1991). Therefore, the impact of
AgNPs on Ca2+
homeostasis in trout hepatocytes should be considered in future studies.
The most interesting result reported in this study was the ability of 10 g/mL AgNPs
to stimulate glycogenolysis in rainbow trout hepatocytes. At this AgNP concentration
medium glucose was higher than the control and the 1 g/mL AgNP groups even in the
absence of ISO (Fig. 5.2). Although there was a significant increase in ISO-stimulated
medium glucose release compared with the control group, the largest change was in terms
of the two controls (none and PROP alone). This effect was also noted for CORT,
although at this concentration of AgNPs the CORT effect was totally removed. The
increased medium glucose release was also reflected in the cellular glycogen content
(Fig. 5.3), which was significantly reduced in the 10 g/mL AgNPs group irrespective of
agonists/antagonists. Moreover, as noted in Figure 5.5, total and GPase a activities
paralleled the effects on glucose release. Interestingly, the ISO-mediated cAMP increase
observed in the control group was actually blocked at 10 g/mL AgNPs (Fig. 5.6). The
explanation for these changes requires further studies, but at the moment these results
suggest a generalized rather than a specific receptor-mediated phenomenon, which is
supported to some extent by the lack of evidence for the presence of intracellular or
membrane-bound AgNPs as reported in our previous study with trout hepatocytes
(Chapter 4; Massarsky et al., 2014b).
It has been suggested that medium osmolarity may affect GPase activities. Hallgren
et al. (2003) reported a linear relationship between medium osmolarity and GPase a
activities in hepatocytes isolated from the brown bullhead (Ameiurus nebulosus), copper

179
rockfish (Sebastes caurinus), and the walking catfish (Clarias batrachus). This activation
of GPase a by hepatocyte cell shrinkage is also reported in mammals (Weiergräber and
Häussinger, 2000). This would be a general mechanism that would be independent of
hormones; however, in this study there was no difference in cell medium osmolarity,
which was consistent across treatments ~300 mOsmol/L (data not shown).
In summary, we demonstrated that AgNPs could affect hormone-regulated cell
signaling pathways at a concentration of 10 µg/mL. On the other hand, AgNPs at 1
g/mL did not interfere with the function of either the -AR or GCR systems in rainbow
trout hepatocytes, but at the concentration of 10 g/mL AgNPs stimulated
glycogenolysis, which was apparently receptor-independent. If confirmed in vivo, the
glycogenolytic potential of AgNPs would be an important endocrine disrupting
mechanism that could impede the ‘fight-or-flight’ response in fish and ultimately affect
their survival.
180
CHAPTER 6
General discussion and conclusions

181
6.1. Evidence for silver nanoparticle toxicity in fish
Silver nanoparticles (AgNPs) are the most common engineered nanomaterial (ENM)
in consumer products due to their antimicrobial properties (Nanotechproject, 2013).
However, in recent years concerns have been raised regarding their safety and a few
studies have demonstrated the ability of AgNPs to detach from impregnated fabrics
during washing (Benn and Westerhoff, 2008; Geranio et al., 2009), which could allow
their access to the aquatic environment and potentially pose a risk to aquatic life. The
toxicity of AgNPs in fish was also addressed in several studies, using both in vivo (e.g.
Asharani et al., 2008; 2011) and in vitro (e.g. Farkas et al., 2010; 2011) approaches.
Nevertheless, many questions regarding the mechanism of AgNP toxicity remain
unanswered. My thesis aimed to investigate the toxicity mechanisms of AgNPs from the
perspectives of oxidative stress, which has been proposed as the principle mode of
toxicity for ENMs (Nel et al., 2006; Auffan et al., 2009), and endocrine disruption, more
specifically the ability of AgNPs to disrupt physiological function since ENMs could
attach to cell membranes and other intracellular and extracellular components (Nel et al.,
2009).
Additionally, one ongoing debate related to AgNP toxicity is whether its toxicity is
mediated by the NP per se or by silver ion (Ag+) dissolving from the AgNP surface (Beer
et al., 2012); support for both sides of this argument can be found in the literature. The
toxicity of Ag+ is well known, especially as related to the inhibition of Na
+,K
+-ATPase
activity and the ensuing disruption of ionoregulation in fish (Wood et al., 1999).
Therefore, it is important to characterize not only the size and aggregation kinetics of
AgNPs, which could influence the toxicity in their own right (Scown et al., 2010a), but

182
also Ag+ dissolution. The Ag
+ content in the AgNP solution used in the studies described
here was assessed and estimated at 0.5%. This low Ag+ content suggested that the
observed effects are likely nano-specific. Nonetheless, the AgNP and Ag+ toxicity
potentials were compared to verify the importance of Ag-type. Consequently, the
nominal concentrations in the toxicity studies [zebrafish embryos (Chapter 2; Massarsky
et al., 2013) and rainbow trout erythrocytes and hepatocytes (Chapter 4; Massarsky et al.,
2014b)] were set such that the Ag content was the same for both AgNPs and Ag+.
Moreover, a Ag chelator cysteine (Cys) was used in rescue experiments in vivo and in
vitro to show that the effects are Ag-specific, and buthionine sulfoximine (BSO), which
inhibits the synthesis of the antioxidant glutathione (GSH, reduced form) and should lead
to reduced GSH levels, was used in vitro to demonstrate the role of oxidative stress in
Ag-mediated toxicity. The ability of AgNPs to disrupt the development of the stress
response in zebrafish embryos (Chapter 3; Massarsky et al., 2014a) and the cellular
signaling in trout hepatocytes (Chapter 5; Massarsky et al., 2014c) was also assessed to
evaluate additional important impacts of AgNPs on fish physiology. This chapter
summarizes the key evidence for the toxic potential of AgNPs in zebrafish embryos and
rainbow trout erythrocytes and hepatocytes. Wider implications of these results as well as
suggestions for future work are also discussed.
6.2. Exposure to AgNPs results in toxicity and oxidative stress
The ability of ENMs including AgNPs to generate reactive oxygen species (ROS)
due to particle surface chemistry has been suggested as one of the toxic mechanisms (Nel
et al., 2006; Yeo and Kang, 2008; Auffan et al., 2009; Chae et al., 2009; Wise et al.,

183
2010). As mentioned in Chapter 1 ROS are naturally generated by all aerobic organisms
in what is termed ‘the oxygen paradox’, which reflects the toxicity of oxygen and the
inability of aerobic organisms to survive in its absence (Davies, 1995). The main
contributor of ROS is the mitochondrial electron-transport chain, which generates the
oxygen radical superoxide anion (O2·-) (Hermes-Lima, 2005). The conversion of O2
·- into
other ROS, including hydrogen peroxide (H2O2) and highly damaging hydroxyl radical
(OH·), is facilitated by the cellular milieu (Davies, 1995). There are several defense
systems protecting the cell from oxidative damage exist (Davies, 2000), including GSH
and the antioxidant enzymes superoxide dismutase (SOD), catalase (CAT), glutathione
peroxidase (GPx), glutathione reductase (GR), and glutathione-S-transferase (GST).
Consequently, unbalanced generation of ROS (natural and ENM-derived) could
overwhelm the defense systems and result in damage. Therefore, the toxicity of AgNPs
through ROS was investigated in this thesis.
The oxidative stress paradigm is supported in this thesis by both in vivo and in vitro
experiments. Exposure of zebrafish embryos to AgNPs or Ag+ until 4 d post fertilization
(dpf) not only increased mortality and delayed hatching, but also generated ROS, reduced
total glutathione (TGSH) levels, and increased the oxidized glutathione (GSSG)/TGSH
ratios without affecting antioxidant enzymes activities (Chapter 2). For all assessed
endpoints Ag+ had greater effects than AgNPs; this may be due to the ability of Ag
+ to
pass through the chorion pores that are 500-700 nm (Fako and Furgeson, 2009). AgNPs
although of a size that should pass through these same pores, were shown to attach to the
chorion; whether they accessed the embryo is unclear. As predicted Cys co-treatment
184
reduced the toxicity of both Ag-types and improved the GSH levels, suggesting that the
observed effects were due to the Ag exposure.
Similar results were obtained with in vitro experiments, which again demonstrated
that the Ag+ was more cytotoxic than AgNPs in both trout erythrocytes and hepatocytes
after a 48 h exposure (Chapter 4). Both silver types reduced TGSH levels, increased
GSSG/TGSH ratios, and affected antioxidant enzymes activities. Formation of ROS was
also increased in hepatocytes. The most interesting result from this study was the ability
of AgNPs to increase lipid peroxidation (without microscopic indication of cellular
uptake) in hepatocytes, suggesting that AgNPs induce oxidative damage extracellularly.
In contrast, Ag+ increased DNA damage, suggesting that Ag
+ damage the cells
intracellularly. As predicted Cys reduced the toxicity of both Ag-types in erythrocytes
and hepatocytes, whereas BSO increased the toxicity of Ag in hepatocytes (erythrocytes
were not sensitive to BSO).
Both the in vivo and in vitro experiments suggest that 1) the toxicity of AgNPs used
in this study although similar to the toxicity of Ag+, which was the more toxic Ag-type, is
independent of Ag+ dissolution; 2) the AgNP exposure results in oxidative stress; and, 3)
AgNPs increased lipid peroxidation in hepatocytes by acting extracellularly. However, it
is important to note that the Ag concentrations that were necessary to achieve these
effects (in g/mL: 0.03-1.55 in vivo and 3.1-31 in vitro) are several orders of magnitude
higher than the predicted environmental concentrations (PECs) in surface water of 0.088-
2.63 or 40-320 ng/L as estimated by Gottschalk et al. (2009) and Blaser et al. (2008),
respectively, even if we consider the estimated ~1.7-fold increase between 2014 and 2020
as discussed in Chapter 1.
185
Although the discrepancy between the PECs and the observed effective
concentrations would generally suggest that AgNPs are likely not to be an environmental
concern, such conclusions should be made cautiously since considerable uncertainty
remains. This is why future studies should consider the following:
1) As discussed in Chapter 1, most of the AgNPs in the aquatic environment are
predicted to accumulate in the sediment (in the g-mg/kg range), suggesting that
AgNPs could potentially pose a risk to benthic invertebrate and vertebrate species.
This in turn implies that ingestion of AgNP-sediment complexes is the more likely
route of uptake for aquatic species. Consequently, future studies on AgNP toxicity in
aquatic organisms should consider this route of exposure. In vitro experiments should
include cell types relevant to the gastrointestinal tract and examine the
aforementioned cellular defenses in more detail.
2) It is also noteworthy that most of the AgNPs are predicted to be transformed into
Ag2S as they pass through the sewage treatment plant (STP) and to bind to natural
organic matter (NOM) once in the aquatic environment (Chapter 1). Therefore, future
studies should further characterize the transformation of AgNPs (with various
coating/surface functionalizations, different particle sizes and shapes) into Ag2S and
subsequently investigate the toxicity of Ag2S particles in vivo in the presence of
NOM. An ideal experiment would involve isolating Ag2S complexes from STP
sludge samples and testing the toxicity of such complexes in natural water samples.
3) Furthermore, it is important to consider the presence of other toxic contaminants,
including other ENMs, pharmaceuticals, and polycyclic aromatic hydrocarbons,
which are likely to influence the toxicity of AgNPs. It is, therefore, important to

186
include contaminant mixtures in future experiments to provide a more realistic
exposure scenario.
4) Finally, it is crucial to start moving away from acute in vivo exposure (as used in this
thesis) and towards more chronic in vivo exposure scenarios. Obviously fish and other
aquatic organisms will be exposed to these potential contaminants throughout their
life. Such studies should examine the aforementioned endpoints in a more realistic
exposure scenario.
6.3. AgNPs do not disrupt the stress response in zebrafish
Chapter 3 examined the ability of AgNP and Ag+ to impact the hypothalamic-
pituitary-interrenal (HPI) axis and specifically cortisol levels in fish, which has not been
addressed previously. The HPI axis includes corticotropin-releasing factor (CRF), which
is released in response to hypothalamic stimulation (Alderman and Vijayan, 2012), acting
on the pituitary to release the adrenocorticotropic hormone (ACTH), which in turn
stimulates cortisol synthesis and release by interrenal cells of the fish head kidney
(Mommsen et al., 1999; To et al., 2007). Cortisol is the principal glucocorticoid in teleost
fish, and is shown to increase hepatic gluconeogenesis, providing fuel to cope with the
increased metabolic demands imposed by stressors (Mommsen et al., 1999; Vijayan et
al., 2003).
The HPI axis in zebrafish is fully developed by 4 dpf (Alsop and Vijayan, 2009) and
we hypothesized that an acute exposure to sub-LC50 concentrations of AgNPs or Ag+
during these critical early stages of zebrafish development would alter the proper
formation and functioning of the HPI axis in zebrafish embryos and that these changes

187
would persist in the adult fish. As discussed in Chapter 3 this hypothesis was not
supported by the cortisol data, which demonstrated that both the larvae and the adult
zebrafish were able to elevate cortisol levels in response to a stressor. Interestingly, there
were changes in the gene expression of CRF-related genes, suggesting that at least Ag+
could affect CRF-related processes other than the HPI axis, including nervous,
cardiovascular, immune, muscular, and reproductive systems, as well as behavior and
food intake (Yao and Denver, 2007; Alderman and Bernier, 2009). Moreover, in adults
sex differences were observed in plasma cortisol levels and the telencephalon transcript
abundance of some of the CRF-related genes, suggesting a sex-specific regulation of the
stress axis. Given that the stress response is essential to survival, sex differences could
imply unequal survival chances for males and females when exposed to Ag.
However, even though there were no effects on cortisol levels in response to AgNP
(or Ag+), this study does not prove that AgNP (or Ag
+) does not affect the zebrafish stress
response. Other scenarios, such as a chronic exposure from early embryonic stage to
adulthood, should be considered. Moreover, a static exposure was used in this study,
meaning that it is likely that the AgNPs may have been bound to the chorion (as
suggested in Chapter 2), meaning that the effective concentration is likely over-estimated.
Future studies should estimate the amount of unadsorbed AgNPs and use renewal
exposures to ensure concentrations remain similar across time. These considerations are
important to verify the impact of AgNPs on essential physiological processes, such as the
stress response.

188
6.4. AgNPs impact hormone-regulated cell signaling in hepatocytes
One of the most novel findings of this thesis is the ability of AgNPs to stimulate
glucose production in trout hepatocytes at sub-cytotoxic concentrations (Chapter 5). I
hypothesized that AgNPs would disrupt proper cell signaling by binding to membrane
receptors and/or impacting membrane properties, thus preventing proper signaling
activities within the cell. This hypothesis reflects the recent review by Nel et al. (2009),
which addressed the potential interactions of ENMs with biological interfaces, including
cells, membranes, organelles, proteins, and DNA. A preliminary experiment using a sub-
toxic dose of AgNPs (10 g/mL; nominal concentration) showed that at this
concentration the particles are able to increase glucose production. Consequently,
experiments involving agonists and antagonists of the -adrenoreceptor (-AR) and
glucocorticoid receptor (GCR) were performed as both receptors could lead to increased
glucose release in hepatocytes through glycogenolysis and gluconeogenesis, respectively.
This study is the first to demonstrate that AgNPs do not interfere with the function of
the -AR and GCR systems at a concentration of 1 g/mL. However, at a concentration
of 10 g/mL, AgNPs increased glucose production, which coincided with a decrease in
cellular glycogen content and an increase in glycogen phosphorylase (GPase) a activity,
suggesting that AgNPs activate GPase a resulting in glycogenolysis. Interestingly, the
levels of the second messenger cAMP were not affected by this concentration (10 g/mL)
as would be expected if AgNPs had agonistic actions mediated by the -AR as was
shown for isoproterenol.
It is noteworthy that although glycogenolysis in rainbow trout hepatocytes is
mediated primarily by the -AR (Van Heeswijk et al., 2006), the 1-AR can also increase

189
glycogenolysis by stimulating the release of Ca2+
ions, which then interact with the
calmodulin subunits of phosphorylase kinase resulting in GPase activation (Fabbri et al.,
1998). In addition it was reported that a Ca2+
ionophore (A23187) increased glucose
release, suggesting that Ca2+
may impact glycogenolysis (Michelsen and Sheridan, 1990).
Therefore, future studies should investigate the potential ability of AgNPs to impact
intracellular Ca2+
levels and the function of the 1-AR.
Furthermore, the glycogenolytic potential of AgNPs reported here should be verified
in vivo since liver glycogenolysis is an essential source of glucose during the ‘fight-or-
flight’ stress response as discussed in Chapter 5. AgNPs were shown to accumulate in
various tissues, including the liver, at least in common carp (Gaiser et al., 2012).
Therefore, AgNPs could come in direct contact with liver cells and potentially stimulate
glycogenolysis in vivo. If confirmed in vivo, the glycogenolytic potential of AgNPs
would be an important endocrine disrupting mechanism that could impede the ‘fight-or-
flight’ response in fish and ultimately affect the survival.
6.5. Contributions this work has made to the literature
The experiments reported in this thesis were initiated as a result of a successful
NSERC Strategic Grant application by Dr. Chris Metcalfe, Trent University. The title of
the proposal was Fate and Effects of Nanomaterials in the Aquatic Environment and six
co-applicants were listed, including Drs. Thomas Moon and Vance Trudeau. Funding
became available as of October 2007 at which point meetings and discussions between
the applicants were held to define the scope of the project. Several international
organizations had expressed the need to examine the potential toxicity of ENMs and the
190
Government of Canada through its OECD partnership agreed to contribute to research in
this area. Little was known regarding ENMs (especially AgNPs), and the toxicology
literature was relatively minimal. Since then a large literature has evolved (see Figure
6.1). My thesis has added to this scientific literature regarding the toxicity of AgNPs with
several important findings:
1. One mechanism of the toxicity of AgNPs both in vivo and in vitro involves oxidative
stress (as defined by increased ROS, decreased GSH). Although both AgNPs and Ag+
lead to oxidative stress, Ag+ at Ag concentrations equivalent to AgNPs is more toxic.
Additionally, my in vitro results suggest that AgNP generates ROS primarily
extracellularly (lack of cellular uptake, as discussed below, further supports this
assertion) while Ag+ does so intracellularly, leading to lipid peroxidation and DNA
damage, respectively. One possible mechanism for AgNP- and Ag+-mediated
cytotoxicity is summarized in Figure 6.2.
2. Moreover, unlike other studies (see Chapter 4 for examples), which used different
formulations of AgNPs and other cell types and reported cellular uptake and
cytotoxicity, our in vitro results suggest that cellular uptake of AgNPs used here is
not a requirement for cytotoxicity. This discrepancy further emphasizes the
importance of physical characteristics of AgNPs (coating, size, shape, etc.) in
determining their fate, behavior, and toxicity.
3. Despite clear indications of oxidative stress, exposure of zebrafish embryos to AgNPs
or Ag+ during the early life stages does not disrupt the ability of larvae or adults to
elevate cortisol levels in response to a stressor. However, exposure to Ag+ does alter
the transcript abundance of CRF-related genes.

191
4. At a low sub-cytotoxic dose (1 g/mL), AgNPs do not disrupt -AR or GCR
signaling in trout hepatocytes, but at high sub-cytotoxic dose (10 g/mL), AgNPs
stimulate glycogenolysis independently of either receptor. These results as well as
possible future experiments pertaining to AgNP-mediated glycogenolysis in
hepatocytes are summarized in Figure 6.3.
5. Lastly, as discussed in section 6.1 dissolution of AgNPs is an important determinant
of toxicity. The low dissolution of AgNPs reported here suggests that the observed
effects are likely nano-specific and emphasizes that AgNP dissolution is specific to
the NP and likely governed by other physical characteristics (e.g. coating) and
experimental conditions (e.g. presence of proteins in culture medium). Thus, the
studies described here contribute to the ongoing debate of ‘AgNP vs Ag+
toxicity’,
supporting that the toxicity of AgNPs is not solely due to dissolving Ag+ and that
nano-specific effects are possible.
6.6. Summary
The introduction of AgNPs into the environment is inevitable. Flow models for
AgNPs (Chapter 1) showed that most of the AgNPs will be removed by the STP into the
sludge, which could be used for agriculture, making soil the main AgNP deposition site.
Nonetheless, a smaller percentage of AgNPs will be present in the STP effluent. Once in
the aquatic environment most of the AgNPs will sediment and a smaller percentage will
remain in the water column. Therefore, AgNPs could potentially pose a risk to aquatic
organisms as summarized in Figure 6.4.
192
The results presented in this thesis demonstrate the ability of AgNPs to elicit toxicity
both in vivo and in vitro, resulting in oxidative stress and cellular damage, and to disrupt
hormone-dependent cell signaling in vitro, as well as the inability of AgNPs to affect the
development of the stress response. Whether the observed effects could be applicable in a
more environmentally realistic exposure setting remains to be answered, but these
findings do offer several directions for future research. From an in vivo perspective it is
important to investigate the ability of chronic exposure to AgNPs to impact fish
physiology, including not only the stress response, but also reproductive success, and
swimming performance. It is also important to consider ingestion exposures, since most
of the AgNPs in the aquatic environment would be found in the sediment and could pose
a risk to the bottom feeding fish. From an in vitro perspective future experiments should
focus more on cell physiology, such as the glycogenolytic potential demonstrated herein,
and verify whether similar effects could be observed in vivo and how such changes may
impact fish physiology and ultimately survival.
Future experiments are necessary in order to clarify and better define the
environmental risks associated with AgNPs (and other ENMs). This is especially
important considering the continuous increase in nanotechnological advances, including
the large number of consumer products containing ENMs, and the large knowledge gap
in the field of nanotoxicology pertaining to the fate, behavior, and toxicity of ENMs.
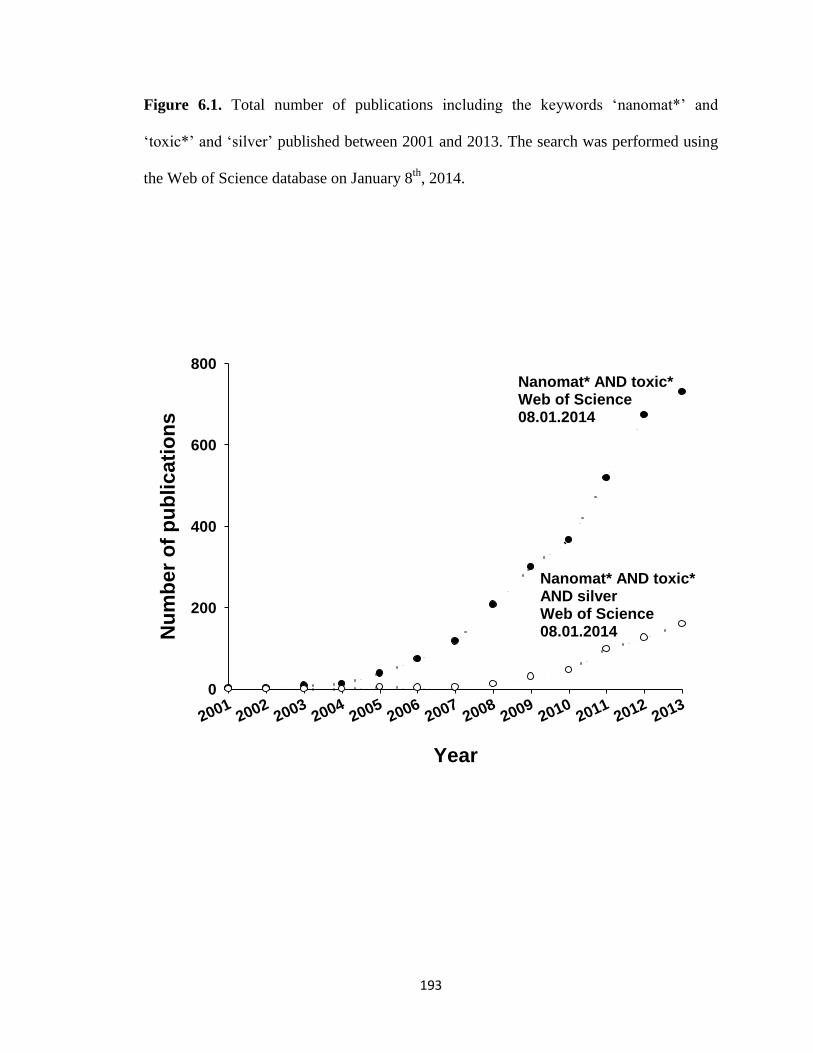
193
Figure 6.1. Total number of publications including the keywords ‘nanomat*’ and
‘toxic*’ and ‘silver’ published between 2001 and 2013. The search was performed using
the Web of Science database on January 8th
, 2014.
Year
20012002
20032004
20052006
20072008
20092010
20112012
2013
Nu
mb
er
of
pu
blicati
on
s
0
200
400
600
800Nanomat* AND toxic*Web of Science 08.01.2014
Nanomat* AND toxic* AND silverWeb of Science 08.01.2014

194
Figure 6.2. One possible mechanism for AgNP- and Ag+-mediated cytotoxicity is
through generation of reactive oxygen species (ROS). This thesis suggests that in trout
hepatocytes AgNP generates ROS extracellularly (or in close proximity to the cell
membrane) while Ag+ does so intracellularly (near or inside the nucleus), leading to lipid
peroxidation and DNA damage, respectively. The antioxidant system of trout
erythrocytes (ery) and hepatocytes (hep) was affected as summarized in green boxes (see
Chapter 4). The antioxidants include reduced glutathione (GSH), glutathione-S-
transferase (GST), glutathione reductase (GR), glutathione peroxidase (GPx), catalase
(CAT), and superoxide dismutase (SOD). Parameters that were not affected are signified
as ‘na’.

195
196
Figure 6.3. The increase in AgNP-mediated glucose production in trout hepatocytes
could be mediated by the -adrenergic receptor (-AR) and the glucocorticoid receptor
(GCR) through glycogenolysis and gluconeogenesis, respectively. AgNPs (10 g/mL)
increased glucose release, decreased glycogen content, and increased glycogen
phosphorylase (GPase) a activity, but did not affect the levels of the second messenger
cAMP and did not increase the activities of gluconeogenic enzymes, suggesting that the
effects are independent of -AR or GCR (see Chapter 5). Another mechanism to increase
GPase a activity would be through Ca2+
-calmodulin signaling, which could be mediated
by 1-AR and possibly increased Ca2+
influx into the cell; this should be addressed in
future experiments.
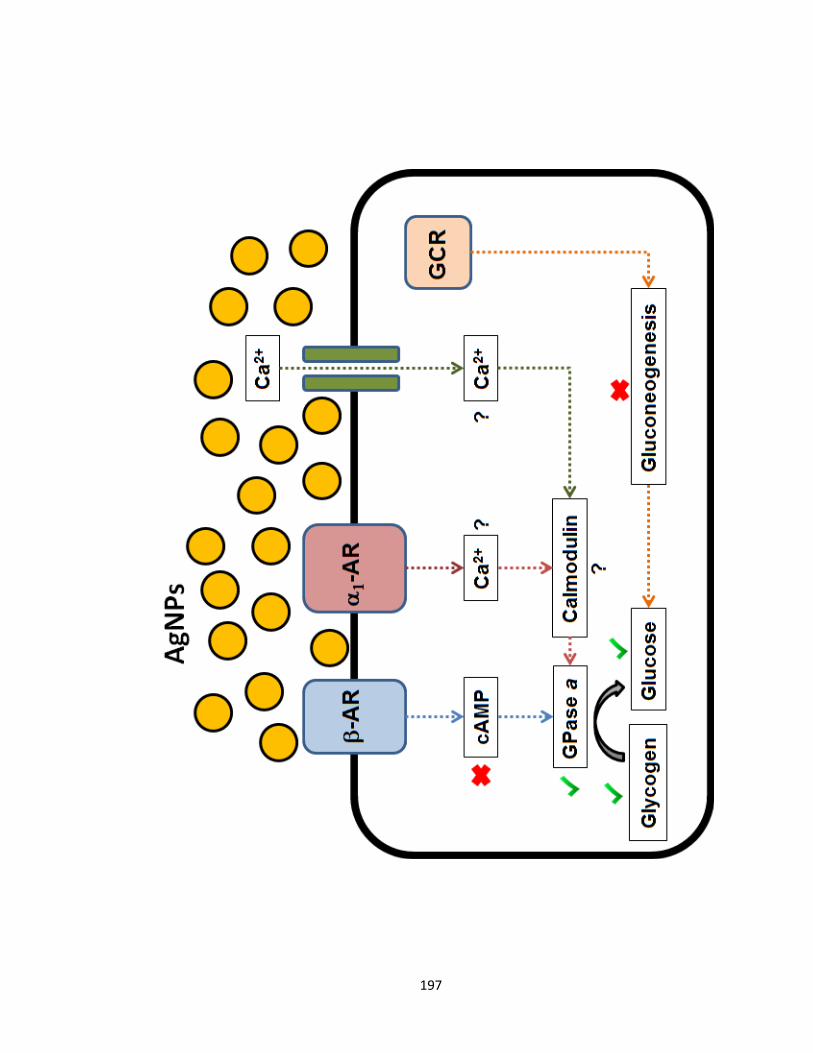
197
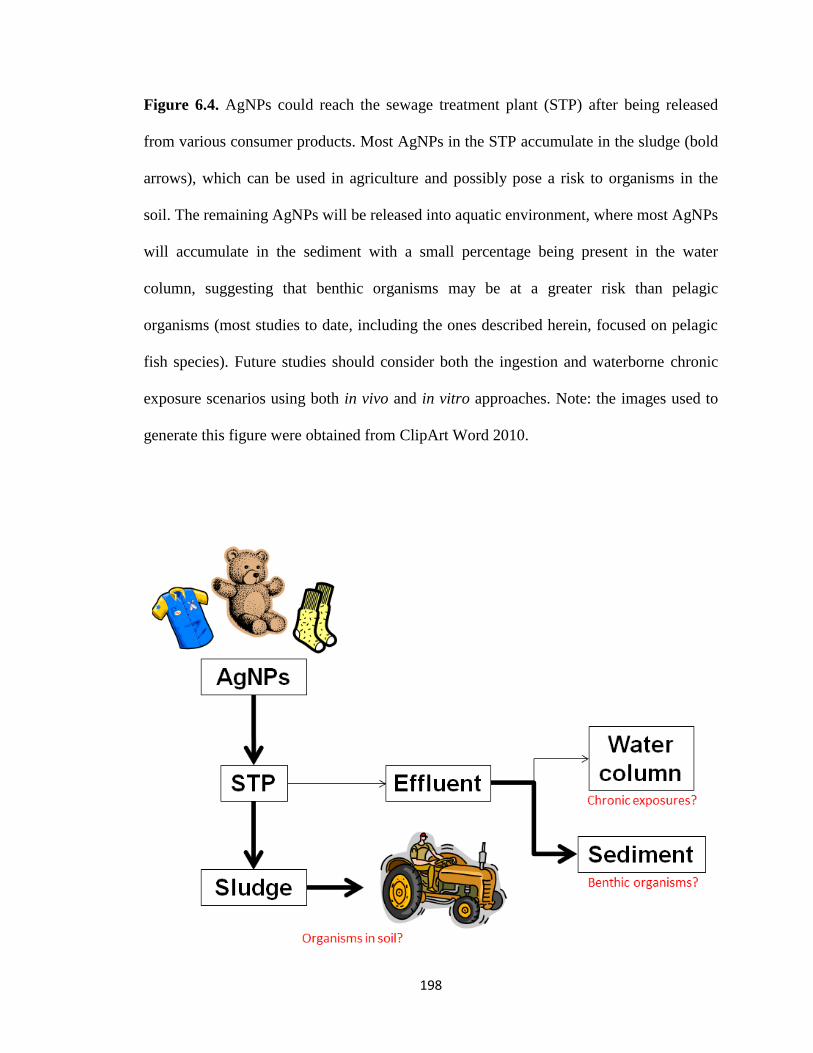
198
Figure 6.4. AgNPs could reach the sewage treatment plant (STP) after being released
from various consumer products. Most AgNPs in the STP accumulate in the sludge (bold
arrows), which can be used in agriculture and possibly pose a risk to organisms in the
soil. The remaining AgNPs will be released into aquatic environment, where most AgNPs
will accumulate in the sediment with a small percentage being present in the water
column, suggesting that benthic organisms may be at a greater risk than pelagic
organisms (most studies to date, including the ones described herein, focused on pelagic
fish species). Future studies should consider both the ingestion and waterborne chronic
exposure scenarios using both in vivo and in vitro approaches. Note: the images used to
generate this figure were obtained from ClipArt Word 2010.
199
References
Ahamed, M., Khan, M.A.M., Siddiqui, M.K.J., AlSalhi, M.S., Alrokayan, S.A., 2011.
Green synthesis, characterization and evaluation of biocompatibility of silver
nanoparticles. Physica E. 43, 1266-1271.
Aillon, K.L., Xie, Y., El-Gendy, N., Berkland, C.J., Forrest ML., 2009. Effects of
nanomaterial physicochemical properties on in vivo toxicity. Adv. Drug Deliv. Rev.
61, 457-466.
Alderman, S.L., Bernier, N.J., 2007. Localization of corticotropin-releasing factor,
urotensin I, and CRF-binding protein gene expression in the brain of the zebrafish,
Danio rerio. J. Comp. Neurol. 502, 783-793.
Alderman, S.L., Bernier, N.J., 2009. Ontogeny of the corticotropin-releasing factor
system in zebrafish. Gen. Comp. Endocr. 164, 61-69.
Alderman, S.L., McGuire, A., Bernier N.J., Vijayan, M.M., 2012. Central and peripheral
glucocorticoid receptors are involved in the plasma cortisol response to an acute
stressor in rainbow trout. Gen. Comp. Endocr. 176, 79-85.
Alderman, S.L., Vijayan, M.M., 2012. 11 β-Hydroxysteroid dehydrogenase type 2 in
zebrafish brain: a functional role in HPI axis regulation. J. Endocrinol. 215, 1-11.
Alsop, D., Vijayan, M.M., 2008. Development of the corticosteroid stress axis and
receptor expression in zebrafish. Am. J. Physiol. Integr. Comp. Physiol. 294, R711-
719.
Alsop, D., Vijayan, M.M., 2009. Molecular programming of the corticosteroid stress axis
during zebrafish development. Comp. Biochem. Physiol. A 153, 49-54.
Aluru, N., Vijayan, M.M., 2007. Hepatic transcriptome response to glucocorticoid
receptor activation in rainbow trout. Physiol. Genomics 31, 483-491.
Asharani, P.V., Lianwu, Y., Gong, Z., Valiyaveettil, S., 2011. Comparison of the toxicity
of silver, gold, and platinum nanoparticles in developing zebrafish embryo.
Nanotoxicology 5, 43-54.
Asharani, P., Wu, Y., Gong, Z., Valiyaveettil, S., 2008. Toxicity of silver nanoparticles in
zebrafish models. Nanotechnology 19, 255102-255109.
Auffan, M., Rose, J., Bottero, J.Y., Lowry, G.V., Jolivet, J.P., Wiesner, M.R., 2009.
Towards a definition of inorganic nanoparticles from an environmental, health and
safety perspective. Nat. Nanotechnol. 4, 634-641.
Baldi, C., Minoia, C., Di Nucci, A., Capodaglio, E., Manzo, L., 1988. Effects of silver in
isolated rat hepatocytes. Toxicol. Lett. 41, 261-268.
Bar-Ilan, O., Albrecht, R., Fako, V., Furgeson, D., 2009. Toxicity assessments of
multisized gold and silver nanoparticles in zebrafish embryos. Small 17, 897-910.
BCC, 2012. BCC Research LLC. Retrieved on July 25th
, 2013, from
http://www.bccresearch.com/market-research/nanotechnology/nanotechnology-
market-applications-products-nan031e.html.

200
Beer, C., Foldbjerg, R., Hayashi, Y., Sutherland D.S., Autrup, H., 2012. Toxicity of silver
nanoparticles-nanoparticle or silver ion? Toxicol. Lett. 208, 286-292.
Benn, T.M., Westerhoff, P., 2008. Nanoparticle silver released into water from
commercially available sock fabrics. Environ. Sci. Technol. 42, 4133-4139.
Bilberg, K., Døving, K.B., Beedholm, K., Baatrup, E., 2011. Silver nanoparticles disrupt
olfaction in Crucian carp (Carassius carassius) and Eurasian perch (Perca
fluviatilis). Aquat. Toxicol. 104, 145-152.
Bilberg, K., Malte, H., Wang, T., Baatrup, E., 2010. Silver nanoparticles and silver nitrate
cause respiratory stress in Eurasian perch (Perca fluviatilis). Aquat. Toxicol. 96,
159-165.
Blaser, S.A., Scheringer, M., MacLeod, M., Hungerbühler, K., 2008. Estimation of
cumulative aquatic exposure and risk due to silver: contribution of nano-
functionalized plastics and textiles. Sci. Total Environ. 390, 396-409.
Brighenti, L., Puviani, A.C., Gavioli, M.E., Fabbri, E., Ottolenghi, C., 1991. Interaction
of salmon glucagon, glucagon-like peptide, and epinephrine in the stimulation of
phosphorylase a activity in fish isolated hepatocytes. Gen. Comp. Endocr. 82, 131-
130.
Burlando, B., Bonomo, M., Fabbri, E., Dondero, F., Viarengo, A., 2003. Hg2+
signaling
in trout hepatoma (RTH-149) cells: involvement of Ca2+
-induced Ca2+
release. Cell
Calcium 34, 285–293.
Buzea, C., Pacheco, I.I., Robbie, K., 2007. Nanomaterials and nanoparticles: sources and
toxicity. Biointerphases 2, MR17-MR71.
Camargo, M.M.P., Fernandes, M.N., Martinez, C.B.R., 2009. How aluminium exposure
promotes osmoregulatory disturbances in the neotropical freshwater fish Prochilus
lineatus. Aquat. Toxicol. 94, 40-46.
Cannon, W.B., 1929. Organization for physiological homeostasis. Physiol. Rev. 9, 399-
431.
Carlson, C., Hussain, S., Schrand, A., 2008. Unique cellular interaction of silver
nanoparticles: size-dependent generation of reactive oxygen species. J. Phys. Chem.
112, 13608-13619.
Castano, A., Bols, N., Braunbeck, T., Dierickx, P., Halder, M., Isomaa, B., Kawahara, K.,
Lee, L.E.J., Mothersill, C., Part, P., Repetto, G., Sintes, J.R., Rufli, H., Smith, R.,
Wood, C., Segner, H., 2003. The use of fish cells in ecotoxicology – the report and
recommendation of ECVAM workshop 47. Altern. Lab. Anim. 31, 317-351.
CCA (Council of Canadian Academies), 2008. Small is different: a science perspective
on the regulatory challenges of the nanoscale. Expert panel Sinervo, P., Boily, S.,
Brunk, C., Castle, D., Chan, W.C.W., Cheng, M.-D., Gold, R., Grütter, P.,
Haarmann, C., Maynard, A.D., Oberdörster, G., Shatkin, J.A., Sheremeta, L.
Science Advice, Ottawa, Ontario, Canada.

201
Chae, Y.J., Pham, C.H., Lee, J.W., Bae, E.J., Yi, J.H., 2009. Evaluation of the toxic
impact of silver nanoparticles on Japanese medaka (Oryzias latipes). Aquat.
Toxicol. 94, 320-327.
Chakravarty, S., Reddy, B.R., Sudhakar, S.R., Saxena, S., Das, T., Meghah, V., Swamy,
C.V.B., Kumar, A., Idris, M.M., 2013. Chronic unpredictable stress (CUS)-induced
anxiety and related mood disorders in a zebrafish model: altered brain proteome
profile implicates mitochondrial dysfunction. PLOS One 8, e63302.
Chambers, B.A., Afrooz, A.R., Bae, S., Aich, N., Katz, L., Saleh, N.B., Kirisits, M.J.,
2014. Effects of chloride and ionic strength on physical morphology, dissolution,
and bacterial toxicity of silver nanoparticles. Environ. Sci. Technol. 48, 761-769.
Chappell, M.A., Miller, L.F., George, A.J., Pettway, B.A., Price, C.L., Porter, B.E.,
Bednar, A.J., Seiter, J.M., Kennedy, A.J., Steevens, J.A., 2011. Simultaneous
dispersion-dissolution behavior of concentrated silver nanoparticle suspensions in
the presence of model organic solutes. Chemosphere 84, 1108-1116.
Chen, Q., Yu, L., Yang, L., Zhou, B., 2012. Bioconcentration and metabolism of
decabromodiphenyl ether (BDE-209) result in thyroid endocrine disruption in
zebrafish larvae. Aquat. Toxicol. 110, 141-148.
Chen, X., Perry, S.F., Aris-Brosou, S., Selva, C., Moon, T.W., 2007. Characterization and
functional divergence of 1-adrenoceptor gene family: insights from the rainbow
trout (Oncorhynchus mykiss). Physiol. Genomics 32, 142-153.
Chen, X., Schluesener. H., 2008. Nanosilver: a nanoproduct in medical application.
Toxicol. Lett. 176, 1-12.
Chernousova, S., Epple, M., 2013. Silver as antibacterial agent: ion, nanoparticle, and
metal. Angew. Chem. Int. Ed. 52, 1636-1653.
Choi, O., Hu, Z.Q., 2008. Size dependent and reactive oxygen species related nanosilver
toxicity to nitrifying bacteria. Environ. Sci. Technol. 42, 4583–4588.
Clement, J.L., Jarrett, P.S., 1994. Antibacterial silver. Met. Based Drugs 1, 467-482.
Cogun, H.Y., Firat, Ö., Firat, Ö., Yüzereroğlu, T.A., Gök, G., Kargin, F., Kotemen, Y.,
2011. Protective effect of selenium against mercury-induced toxicity on
hematological and biochemical parameters of Oreochromis niloticus. J. Biochem.
Mol. Toxicol. 26, 117-122.
Coradeghini, R., Gioria, S., García, C.P., Nativo, P., Franchini, F., Gilliland, D., Ponti, J.,
Rossi, F., 2013. Size-dependent toxicity and cell interaction mechanisms of gold
nanoparticles on mouse fibroblasts. Toxicol. Lett. 217, 205-216.
Craig, P.M., Hogstrand, C., Wood, C.M., McClelland, G.B., 2009. Gene expression
endpoints following chronic waterborne copper exposure in a genomic model
organism, the zebrafish, Danio rerio. Physiol. Genomics 40, 23-33.
Davies, K.J., 1995. Oxidative stress: the paradox of aerobic life. Biochem. Soc. Symp.
61, 1-31.

202
Davies, K.J., 2000. Oxidative stress, antioxidant defenses, and damage removal, repair,
and replacement systems. IUBMB Life 50, 279-289.
Deneke, S.M., Fanburg, B.L., 1989. Regulation of cellular glutathione. Am. J. Physiol.
257, L163–L173.
Deng, J., Yu, L., Liu, C., Yu, K., Shi, X., Yeung, L.W.Y, Lam, P.K.S., Wu, R.S.S., Zhou,
B., 2009. Hexabromocyclododecane-induced developmental toxicity and apoptosis
in zebrafish embryos. Aquat. Toxicol. 93, 29-36.
Dhanasiri, A.K.S., Fernandes, J.M.O., Kiron, V., 2013. Acclimation of zebrafish to
transport stress. Zebrafish 10, 87-98.
Domingos, R.F., Baalousha, M.A., Ju-Nam, Y., Reid, M.M., Tufenkji, N., Lead, J.R.,
Leppard, G.G., Wilkinson, K.J., 2009. Characterizing manufactured nanoparticles
in the environment: multimethod determination of particle size. Environ. Sci.
Technol. 43, 7277-7284.
Dugan, S.G., Lortie, M.B., Nickerson, J.G., Moon, T.W., 2003. Regulation of the hepatic
b2-adrenoceptor in rainbow trout (Oncorhynchus mykiss). Comp. Biochem.
Physiol. B 136, 331-342.
Elechiguerra, J.L., Burt, J.L., Morones, J.R., Camacho-Bragado, A., Gao, X., Lara, H.H.,
Yacaman, M.J., 2005. Interaction of silver nanoparticles with HIV-1. J.
Nanobiotechnology 3, 6-15.
Elsalini, O.A., Rohr, K.B., 2003. Phenylthiourea disrupts thyroid function in developing
zebrafish. Dev. Genes Evol. 212, 593-598.
Fabbri, E., Capuzzo, A., Moon, T.W., 1998. The role of circulating catecholamines in the
regulation of fish metabolism: an overview. Comp. Biochem. Physiol. C 120, 177-
192.
Fabbri, E., Gambarotta, A., Moon, T.W., 1995. Adrenergic signaling and second
messenger production in hepatocytes of two fish species. Gen. Comp. Endocr. 99,
114-124.
Fabrega, J., Fawcett, S.R., Renshaw, J.C., Lead, J.R., 2009. Silver nanoparticle impact on
bacterial growth: effect of pH, concentration, and organic matter. Environ. Sci.
Technol. 43, 7285-7290.
Fako, V., Furgeson, D., 2009. Zebrafish as a correlative and predictive model for
assessing biomaterial nanotoxicity. Adv. Drug Deliver. Rev. 61, 478-486.
Farkas, J., Christian, P., Urrea, J.A.G., Roos, N., Hassellöv, M., Tollefsen, K.E., Thomas,
K.V., 2010. Effects of silver and gold nanoparticles on rainbow trout
(Oncorhynchus mykiss) hepatocytes. Aquat. Toxicol. 96, 44-52.
Farkas, J., Christian, P., Urrea, J.A.G., Roos, N., Hassellöv, M., Tollefsen, K.E., Thomas,
K.V., 2011. Uptake and effects of manufactured silver nanoparticles in rainbow
trout (Oncorhynchus mykiss) gill cells. Aquat. Toxicol. 101, 117-125.
Farmen, E., Mikkelsen, H.N., Evensen, Ø., Einset, J., Heier, L.S., Rosseland, B.O., Salbu,
B., Tollefsen, K.E., Oughton, D.H., 2012. Acute and sub-lethal effects in juvenile

203
Atlantic salmon exposed to low μg/L concentrations of Ag nanoparticles. Aquat.
Toxicol. 108, 78-84.
Félix, A.S., Faustino, A.I., Cabral, E.M., Oliveira, R.F., 2013. Noninvasive measurement
of steroid hormones in zebrafish holding-water. Zebrafish 10, 110-115.
Feng, Q., Boone, A.N., Vijayan, M.M., 2003. Copper impact on heat shock protein 70
expression and apoptosis in rainbow trout hepatocytes. Comp. Biochem. Physiol. C
135, 345–355.
Feng, Q.L., Wu, J., Chen, G.Q., Cui, F.Z., Kim, T.N., Kim, J.O., 2000. A mechanistic
study of the antibacterial effect of silver ions on Escherichia coli and
Staphylococcus aureus. J. Biomed. Mater. Res. 52, 662-668.
Filby, A.L., Paull, G.C., Bartlett, E.J., Van Look, K.J.W., Tyler, C.R., 2010.
Physiological and health consequences of social status in zebrafish (Danio rerio).
Physiol. Behav. 101, 576-587.
Firat, Ö., Alici, M.F., 2012. Assessment of pollution in Ataturk dam lake (Adiyaman,
Turkey) using several biochemical parameters in common carp, Cyprinus carpio L.
Bull. Environ. Contam. Toxicol. 89, 474-478.
Firat, Ö., Kargin, F., 2011. Individual and combined effects of heavy metals on serum
biochemistry of Nile tilapia Oreochromis niloticus. Arch. Environ. Contam.
Toxicol. 58, 151-157.
Fischer, H.C., Chan, W.C.W., 2007. Nanotoxicity: the growing need for in vivo study.
Curr. Opin. Biotech. 18, 565-571.
Folch, J., Lees, M., Stanley, G.H.S., 1957. A simple method for the isolation and
purification of total lipids from animal tissues. J. Biol. Chem. 226, 497-509.
Foldbjerg, R., Olesen, P., Hougaard, M., Dang, D.A., Hoffmann, H.J., Autrup, H., 2009.
PVP-coated silver nanoparticles and silver ions induce reactive oxygen species,
apoptosis and necrosis in THP-1 monocytes. Toxicol. Lett. 190, 156-162.
Folgueira, M., Anadón, R., Yáñez, J., 2004. Experimental study of the connections of the
telencephalon in the rainbow trout (Oncorhynchus mykiss). II: Dorsal area and
preoptic region. J. Comp. Neurol. 480, 204-233.
Fong, J., Wood, F., 2006. Nanocrystalline silver dressings in wound management: a
review. Int. J. Nanomed. 1, 441-449.
Furman, O., Usenko, S., Lau, B.L.T., 2013. Relative importance of the humic and fulvic
fractions of natural organic matter in the aggregation and deposition of silver
nanoparticles. Environ. Sci. Technol. 47, 1349-1356.
Fuzzen, M.L.M., Bernier, N.J., Van Der Kraak, G., 2011. Differential effects of 17β-
estradiol and 11-ketotestosterone on the endocrine stress response in zebrafish
(Danio rerio). Gen. Comp. Endocr. 170, 365-373.
Gagné, F., André, C., Cejka, P., Hausler, R., Fournier, M., 2011. Alterations in DNA
metabolism in Elliptio complanata mussels after exposure to municipal effluents.
Comp. Biochem. Physiol. C 154, 100-107.

204
Gagné, F., André, C., Skirrow, R., Gélinas, M., Auclair, J., van Aggelen, G., Turcotte, P.,
Gagnon, C., 2012. Toxicity of silver nanoparticles to rainbow trout: a
toxicogenomic approach. Chemosphere 89, 615-622.
Gagné, F., Blaise, C., 1995. Evaluation of the genotoxicity of environmental
contaminants in sediments to rainbow trout hepatocytes. Environ. Toxicol. Wat.
Qual. 10, 217-229.
Gaiser, B.K., Fernandes, T.F., Jepson, M.A., Lead, J.R., Tyler, C.R., Baalousha, M.,
Biswas, A., Britton, G.J., Cole, P.A., Johnston, B.D., Ju-Nam, Y., Rosenkranz, P.,
Scown, T.M., Stone, V., 2012. Interspecies comparisons on the uptake and toxicity
of silver and cerium dioxide nanoparticles. Environ. Toxicol. Chem. 31, 144-154.
Gao, J., Powers, K., Wang, Y., Zhou, H., Roberts, S.M., Moudgil, B.M., Koopman, B.,
Barber, D.S., 2012. Influence of Suwannee River humic acid on particle properties
and toxicity of silver nanoparticles. Chemosphere 89, 96-101.
George, S., Xia, T., Rallo, R., Zhao, Y., Ji, Z., Lin, S., Wang, X., Zhang, H., France, B.,
Schoenfeld, D., Damoiseaux, R., Liu, R., Lin, S., Bradley, K.A., Cohen, Y., Nel,
A.E., 2011. Use of a high-throughput screening approach coupled with in vivo
zebrafish embryo screening to develop hazard ranking for engineered
nanomaterials. ACS Nano 5, 1805-1817.
Geranio, L., Heuberger, M., Nowack, B., 2009. The behavior of silver nanotextiles during
washing. Environ. Sci. Technol. 43, 8113-8118.
Ghisleni, G., Capiotti, K.M., Da Silva, R.S., Oses, J.P., Piato, Â.L., Soares, V., Bogo,
M.R., Bonan, C.D., 2012. The role of CRH in behavioral responses to acute
restraint stress in zebrafish. Prog. Neuro-Psychoph. 36, 176-182.
Gilmour, K.M., Kirkpatrick, S., Massarsky, A., Pearce, B., Saliba, S., Stephany, C.É.,
Moon, T.W., 2012. The influence of social status on hepatic glucose metabolism in
rainbow trout Oncorhynchus mykiss. Physiol. Biochem. Zool. 85, 309-20.
Gonzalez, L., Lison, D., Kirsch-Volders, M., 2008. Genotoxicity of engineered
nanomaterials: a critical review. Nanotoxicology 2, 252-273.
Gordon, O., Slenters, T.V., Brunetto, P.S., Villaruz, A.E., Sturdevant, D.E., Otto, M.,
Landmann, R., Fromm, K.M., 2010. Silver coordination polymers for prevention of
implant infection: thiol interaction, impact on respiratory chain enzymes, and
hydroxyl radical induction. Antimicrob. Agents Ch. 54, 4208-4218.
Gottschalk, F., Sonderer, T., Scholz, R.W., Nowack, B., 2009. Modeled environmental
concentrations of engineered nanomaterials (TiO2, ZnO, Ag, CNT, Fullerenes) for
different regions. Environ. Sci. Technol. 43, 9216-9222.
Grade, S., Eberhard, J., Neumeister, A., Wagener, P., Winkel, A., Stiesch, M.,
Barcikowski, S., 2012. Serum albumin reduces the antibacterial and cytotoxic
effects of hydrogel-embedded colloidal silver nanoparticles. RSC Adv. 2, 7190-
7196.

205
Griffitt, R., Hyndman, K., Denslow, N.D., Barber, D.S., 2009. Comparison of molecular
and histological changes in zebrafish gills exposed to metallic nanoparticles.
Toxicol. Sci. 107, 404-415.
Guillouzo, A., 1998. Liver cell models in in vitro toxicology. Environ. Health Perspect.
106, 511-532.
Hadioui, M., Leclerc, S., Wilkinson, K.J., 2013. Multimethod quantification of Ag+
release from nanosilver. Talanta 105, 15-19.
Hajizadeh, S., Farhadi, K., Forough, M., Molaei, R., 2012. Silver nanoparticles in the
presence of Ca2+
as a selective and sensitive probe for the colorimetric detection of
cysteine. Anal. Methods 4, 1747-1752.
Hallgren, N.K., Busby, E.R., Mommsen, T.P., 2003. Cell volume affects glycogen
phosphorylase activity in fish hepatocytes. J. Comp. Physiol. B 173, 591-599.
Handy, R.D., von der Kammer, F., Lead, J., Hassellöv, M., Owen, R., Crane, M., 2008.
The ecotoxicology and chemistry of manufactured nanoparticles. Ecotoxicology 17,
287-314.
Hendren, C.O., Lowry, M., Grieger, K.D., Money, E.S., Johnston, J.M., Wiesner, M.R.,
Beaulieu, S.M., 2013. Modeling approaches for characterizing and evaluating
environmental exposure to engineered nanomaterials in support of risk-based
decision making. Environ. Sci. Technol. 47, 1190-1205.
Hendren, C.O., Mesnard, X., Dröge, J., Wiesner, M.R., 2011. Estimating production data
for five engineered nanomaterials as a basis for exposure assessment. Environ. Sci.
Technol. 45, 2562-2569.
Hermes-Lima, M., 2005. Oxygen in biology and biochemistry: role of free radicals. Pp.
319-368. Ed. Storey, K.B. Functional Metabolism: Regulation Adaptation. John
Wiley & Sons, Inc., Hoboken, NJ, USA. doi: 10.1002/047167558X.ch12.
Hermes-Lima, M., Storey, K.B., 1996. Relationship between anoxia exposure and
antioxidant status in the frog Rana pipiens. Am. J. Physiol. 217, 918-925.
Hermes-Lima, M., Willmore, W.G., Storey, K.B., 1995. Quantification of lipid
peroxidation in tissue extracts based on Fe(III)xylenol orange complex formation.
Free Radic. Biol. Med. 19, 271-280.
Hill, A.J., Teraoka, H., Heidman, W., Peterson, R.E., 2005. Zebrafish as a model
vertebrate for investigating chemical toxicity. Toxicol. Sci. 86, 6-19.
Hollinger, M.A., 1996. Toxicological aspects of topical silver pharmaceuticals. Crit. Rev.
Toxicol. 26, 255-260.
Hontela, A., Dumont, P., Duclos, D., Fortin, R., 1995. Endocrine and metabolic
dysfunction in yellow perch, Perca flavescens, exposed to organic contaminants
and heavy metals in the St. Lawrence River. Environ. Toxicol. Chem. 14, 725-731.
Horie, M., Kato, H., Fujita, K., Endoh, S., Iwahashi, H., 2012. In vitro evaluation of
cellular response induced by manufactured nanoparticles. Chem. Res. Toxicol. 25,
605-619.

206
Hou, L., Li, K., Ding, Y., Li, Y., Chen, J., Wu, X., Li, X., 2012. Removal of silver
nanoparticles in simulated wastewater treatment processes and its impact on COD
and NH4 reduction. Chemosphere 87, 248-252.
Hou, W.-C., Stuart, B., Howes, R., Zepp, R.G., 2013. Sunlight-driven reduction of silver
ions by natural organic matter: formation and transformation of silver
nanoparticles. Environ. Sci. Technol. 47, 7713-7721.
Hultberg, B., Andersson, A., Isaksson, A., 2001. Interaction of metals and thiols in cell
damage and glutathione distribution: potentiation of mercury toxicity by
dithiothreitol. Toxicology 156, 93-100.
Hussain, S., Anner, R.M., Anner, B.M., 1992. Cysteine protects Na,K-ATPase and
isolated human lymphocytes from silver toxicity. Biochem. Biophys. Res.
Commun. 189, 1444-1449.
Hussain, S.M., Hess, K.L., Gearhart, J.M., Geiss, K.T., Schlager, J.J., 2005. In vitro
toxicity of nanoparticles in BRL 3A rat liver cells. Toxicol. In Vitro 19, 975-983.
Hwang, E.T., Lee, J.H., Chae, Y.J., Kim, Y.S., Kim, B.C., Sang, B.-I., Gu, M.B., 2008.
Analysis of the toxic mode of action of silver nanoparticles using stress-specific
bioluminescent bacteria. Small 4, 746-750.
IPCS (International Programme on Chemical Safety), 2002. Chapter 1: Executive
summary. Pp. 1-3. Eds. Damstra, T., Barlow, S., Bergman, A., Kavlock, R., Van
Der Kraak, G. Global assessment of the state-of-the-science of endocrine disruptors
– An assessment prepared by an expert group on behalf of the World Health
Organization, the International Labour Organization, and The United Nations
Environment Programme. http://www.who.int/ipcs/publications/en/ch1.pdf?ua=1.
Jones, A.M., Garg, S., He, D., Pham, A.N., Waite, T.D., 2011. Superoxide-mediated
formation and charging of silver nanoparticles. Environ. Sci. Technol. 45, 1428-
1434.
Kaegi, R., Voegelin, A., Sinnet, B., Zuleeg, S., Hagendorfer, H., Burkhardt, M., Siegrist,
H., 2011. Behavior of metallic silver nanoparticles in a pilot wastewater treatment
plant. Environ. Sci. Technol. 45, 3902-3908.
Kashiwada, S., Ariza, M.E., Kawaguchi, T., Nakagame, Y., Jayasinghe, B.S., Gärtner,
K., Nakamura, H., Kagami, Y., Sabo-Attwood, T., Ferguson, P.L., Chandler, G.T.,
2012. Silver nanocolloids disrupt medaka embryogenesis through vital gene
expressions. Environ. Sci. Technol. 46, 6278-6287.
Keppler, D., 1999. Export pumps for glutathione S-conjugates. Free Radic. Biol. Med.
27, 985–991.
Khan, H., Khan, M.F., Rehman, A.U., Jan, S.U., Ullah, N., 2011. The protective role of
glutathione in silver induced toxicity in blood components. Pak. J. Pharm. Sci. 24,
123-128.

207
Kim, B., Park, C.-S., Murayama, M., Hochella, M.F., 2010. Discovery and
characterization of silver sulfide nanoparticles in final sewage sludge products.
Environ. Sci. Technol. 44, 7509-7514.
Kim, J.S., Kuk, E., Yu, K.N., Kim, J.-H., Park, S.J., Lee, H.J., Kim, S.H., Park, Y.K.,
Park, Y.H., Hwang, C.-Y., Kim, Y.-K., Lee, Y.-S., Jeong, D.H., Cho, M.-H., 2007.
Antimicrobial effects of silver nanoparticles. Nanomedicine 3, 95-101.
Kim, K.-T., Jang, M.-H., Kim, J.-Y., Xing, B., Tanguay, R.L., Lee, B.-G., Kim, S.D.,
2012. Embryonic toxicity changes of organic nanomaterials in the presence of
natural organic matter. Sci. Total Environ. 426, 423-429.
Kiser, M.A., Westerhoff, P., Benn, T., 2009. Titanium nanomaterial removal and release
from wastewater treatment plants. Environ. Sci. Technol. 43, 6757-6763.
Kittler, S., Greulich, C., Gebauer, J.S., Diendorf, J., Treuel, L., Ruiz, L., Gonzalez-
Calbet, J.M., Vallet-Regi, M., Zellner, R., Köller, M., Epple, M., 2010. The
influence of proteins on the dispersability and cell-biological activity of silver
nanoparticles. J. Mater. Chem. 20, 512-518.
Klaine, S.J., Alvarez, P.J.J., Batley, G.E., Fernandes, T.F., Handy, R.D., Lyon, D.Y.,
Mahendra, S., McLaughlin, M.J., Lead, J.R., 2008. Nanomaterials in the
environment: behavior, fate, bioavailability, and effects. Environ. Toxicol. Chem.
27, 1825-1851.
Kramer, J., Bell, R., Smith, S., Gorsuch, J., 2009. Silver nanoparticle toxicity and
biocides: need for chemical speciation. Integr. Environ. Assess. Manag. 5, 720-722.
Kwok, K.W.H., Auffan, M., Badireddy, A.R., Nelson, C.M., Wiesner, M.R., Chilkoti, A.,
Liu, J., Marinakos, S.M., Hinton, D.E., 2012. Uptake of silver nanoparticles and
toxicity to early life stages of Japanese medaka (Oryzias latipes): effect of coating
materials. Aquat. Toxicol. 120-121, 59-66.
Laban, G., Nies, L.F., Turco, R.F., Bickham, J.W., Sepúlveda, M.S., 2010. The effects of
silver nanoparticles on fathead minnow (Pimephales promelas) embryos.
Ecotoxicology 19, 185-195.
Lara, H.H., Ayala-Núñez, N.V., Turrent, L.D.I., Padilla, C.R., 2010. Bactericidal effect
of silver nanoparticles against multidrug-resistant bacteria. World J. Microbiol.
Biotechnol. 26, 615-621.
Lee, K.J., Nallathamby, P.D., Browning, L.M., Osgood, C.J., Xu, X.-H.N., 2007. In vivo
imaging of transport and biocompatibility of single silver nanoparticles in early
development of zebrafish embryos. ACS NANO 1, 133-143.
Levard, C., Hotze, E.M., Lowry, G.V., Brown, G.E., 2012. Environmental
transformations of silver nanoparticles: impact on stability and toxicity. Environ.
Sci. Technol. 46, 6900-6914.
Li, H.T., Feng, L., Jiang, W.D., Liu, Y., Jiang, J., Li, S.H., Zhou, Z.Q., 2013. Oxidative
stress parameters and anti-apoptotic response to hydroxyl radicals in fish
208
erythrocytes: protective effects of glutamine, alanine, citrulline and proline. Aquat.
Toxicol. 126, 169-179.
Li, X., Lenhart, J.J., 2012. Aggregation and dissolution of silver nanoparticles in natural
surface water. Environ. Sci. Technol. 46, 5378-5386.
Liau, S.Y., Read, D.C., Pugh, W.J., Furr, J.R., Russell, A.D., 1997. Interaction of silver
nitrate with readily identifiable groups: relationship to the antibacterial action of
silver ions. Lett. Appl. Microbiol. 25, 279-283.
Lieschke, G.J., Currie, P.D., 2007. Animal models of human disease: zebrafish swim into
view. Nature 8, 353-367.
Limbach, L.K., Wick, P., Manser, P., Grass, R.N., Bruinink, A., Stark, W.J., 2007.
Exposure of engineered nanoparticles to human lung epithelial cells: influence of
chemical composition and catalytic activity on oxidative stress. Environ. Sci.
Technol. 41, 4158-4163.
Liu, C., Zhang, X., Deng, J., Hecker, M., Al-Khedhairy, A., Giesy, J.P., Zhou, B.S.,
2011. Effects of prochloraz or propylthiouracil on the cross-talk between the HPG,
HPA, and HPT axes in zebrafish. Environ. Sci. Technol. 45, 769-775.
Liu, C.-Y., Sun, P.-J., 1981. Preparation and analytical properties of a chelating resin
containing cysteine groups. Anal. Chim. Acta 132, 187-193.
Liu, J., Hurt, R.H., 2010. Ion release kinetics and particle persistence in aqueous nano-
silver colloids. Environ. Sci. Technol. 44, 2169-2175.
Liu, W., Wu, Y., Wang, C., Li, H.C., Wang, T., Liao, C.Y., Cui, L., Zhou, Q.F., Yan, B.,
Jiang, G.B., 2010b. Impact of silver nanoparticles on human cells: effect of particle
size. Nanotoxicology 4, 319-330.
Liu, X.Y., Wazne, M., Han, Y., Christodoulatos, C., Jasinkiewicz, K.L., 2010a. Effects of
natural organic matter on aggregation kinetics of boron nanoparticles in
monovalent and divalent electrolytes. J. Colloid Interface Sci. 348, 101−107.
Lorenz, C., Windler, L., von Goetz, N., Lehmann, R.P., Schuppler, M., Hungerbühler, K.,
Heuberger, M., Nowack, B., 2012. Characterization of silver release from
commercially available functional (nano)textiles. Chemosphere 89, 817-824.
Lortie, M.B., Moon, T.W., 2003. The rainbow trout skeletal muscle -adrenergic system:
characterization and signaling. Am. J. Physiol. Regul. Integr. Comp. Physiol. 284,
R689-R6897.
Lowry, G.V., Espinasse, B.P., Badireddy, A.R., Richardson, C.J., Reinsch, B.C., Bryant,
L.D., Bone, A.J., Deonarine, A., Chae, S., Therezien, M., Colman, B.P., Hsu-Kim,
H., Bernhardt, E.S., Matson, C.W., Wiesner, M.R., 2012. Long-term transformation
and fate of manufactured Ag nanoparticles in a simulated large scale freshwater
emergent wetland. Environ. Sci. Technol. 46, 7027-7036.
Lu, L., Sun, R.W., Chen, R., Hui, C.K., Ho, C.M., Luk, J.M., Lau, G.K., Che, C.M.,
2008. Silver nanoparticles inhibit hepatitis B virus replication. Antivir. Ther. 13,
253–262.
209
Lu, X., Liu, Y., Kong, X., Lobie, P.E., Chen, C., Zhu, T., 2013. Nanotoxicity: a growing
need for study in the endocrine system. Small 9, 1654-1671.
Lubick, N., 2008. Nanosilver toxicity: ions, nanoparticles-or both? Environ. Sci. Technol.
42, 8617-8617.
Lushchak, V.I., Lushchak, L.P., Mota, A.A., Hermes-Lima, M., 2001. Oxidative stress
and antioxidant defenses in goldfish Carassius auratus during anoxia and
reoxygenation. Am. J. Physiol. Regul. Integr. Comp. Physiol. 280, R100-R107.
Lynch, R.M., Voy, B.H., Glass, D.F., Mahurin, S.M., Zhao, B., Hu, H., Saxton, A.M.,
Donnell, R.L., Cheng, M.D., 2007. Assessing the pulmonary toxicity of single-
walled carbon nanohorns. Nanotoxicology 1, 157-166.
MacCormack, T.J., Clark, R.J., Dang, M.K.M., Ma, G.B., Kelly, J.A., Veinot, J.G.C.,
Goss, G.G., 2012. Inhibition of enzyme activity by nanomaterials: potential
mechanisms and implications for nanotoxicity testing. Nanotoxicology 6, 514-525.
Mannervik, B., 1987. The enzymes of glutathione metabolism: an overview. Biochem.
Soc. Trans. 15, 717-718.
Marentette, J.R., Tong, S., Balshine, S., 2013. The cortisol stress response in male round
goby (Neogobius melanostomus): effects of living in polluted environments?
Environ. Biol. Fishes 96, 723-733.
Marty, M.S., Carney, E.W., Rowlands, J.C., 2011. Endocrine disruption: historical
perspectives and its impact on the future of toxicology testing. Toxicol. Sci. 120,
S93-S108.
Massarsky. A., Abraham, R., Nguyen, K.C., Rippstein, P., Tayabali, A.F., Trudeau, V.L.,
Moon, T.W., 2014b. Nanosilver cytotoxicity in rainbow trout (Oncorhynchus
mykiss) erythrocytes and hepatocytes. Comp. Biochem. Physiol. C 159, 10-21.
Massarsky, A., Dupuis, L., Taylor, J., Eisa-Beygi, S., Strek, L., Trudeau, V.L., Moon,
T.W., 2013. Assessment of nanosilver toxicity during zebrafish (Danio rerio)
development. Chemosphere 92, 59-66.
Massarsky. A., Labarre, J., Trudeau, V.L., Moon, T.W., 2014c. Silver nanoparticles
stimulate glycogenolysis in rainbow trout (Oncorhynchus mykiss) hepatocytes.
Submitted to Aquat. Toxicol.147, 68-75.
Massarsky, A., Trudeau, V.L., Moon, T.W., 2011. β-Blockers as endocrine disruptors:
the potential effects of human β-blockers on aquatic organisms. J. Exp. Zool. A
315, 251-265.
Massarsky, A., Strek, L., Craig, P.M., Eisa-Beygi, S., Trudeau, V.L., Moon, T.W., 2014a.
Acute embryonic exposure to nanosilver or silver ion does not disrupt the stress
response in zebrafish (Danio rerio) larvae and adults. Sci. Total Environ. 478, 133-
140.
McNulty, T.J., Taylor, C.W., 1999. Extracellular heavy-metal ions stimulate Ca2+
mobilization in hepatocytes. Biochem. J. 339, 555–561.
210
Michelsen, K., Sheridan, M.A., 1990. Influence of cAMP and calcium on epinephrine-
mediated hepatic glycogenolysis in rainbow trout, Oncorhynchus mykiss. Comp.
Biochem. Physiol. C 97, 329-332.
Mireles, L.C., Lum, M.A., Dennery, P.A., 1999. Antioxidant and cytotoxic effects of
bilirubin on neonatal erythrocytes. Pediatr. Res. 45, 355-362.
Mishra, A.K., Mohanty, B., 2009. Chronic exposure to sublethal hexavalent chromium
affects organ histopathology and serum cortisol profile of a teleost, Channa
punctatus (Bloch). Sci. Total Environ. 407, 5031-5038.
Misra, S., Hamilton, C., Niyogi, S., 2012. Induction of oxidative stress by
selenomethionine in isolated hepatocytes of rainbow trout (Oncorhynchus mykiss).
Toxicol. In Vitro 26, 621-629.
Møller, P., Jacobsen, N.R., Folkmann, J.K., Danielsen, P.H., Mikkelsen, L.,
Hemmingsen, J.G., Vesterdal, L.K., Forchhammer, L., Wallin, H., Loft, S., 2010.
Role of oxidative damage in toxicity of particulates. Free Radic. Res. 44, 1-46.
Mommsen, T.P., French, C.J., Hochachka, P.W., 1980. Sites and patterns of protein and
amino acid utilization during the spawning migration of salmon. Can. J. Zool. 58,
1785-1799.
Mommsen, T.P., Moon, T.W., Walsh, P.J., 1994. Hepatocytes: isolation, maintenance
and utilization. Pp. 355–373. Eds. Hochachka, P.W., Mommsen T.P. Biochemistry
and Molecular Biology of Fishes. Vol. 3. Analytical Techniques. Elsevier
Biomedical, Amsterdam. doi: 10.1016/B978-0-444-82033-4.50036-2.
Mommsen, T.P., Vijayan, M.M., Moon, T.W., 1999. Cortisol in teleosts: dynamics,
mechanisms of action, and metabolic regulation. Rev. Fish Biol. Fisheries 9, 211-
268.
Mommsen, T.P., Walsh, P.J., Perry, S.F., Moon, T.W., 1988. Interactive effects of
catecholamines and hypercapnia on glucose production in isolated trout
hepatocytes. Gen. Comp. Endocr. 70, 63-73.
Monteiro-Riviere, N.A., Samberg, M.E., Oldenburg, S.J., Riviere, J.E., 2013. Protein
binding modulates the cellular uptake of silver nanoparticles into human cells:
implications for in vitro to in vivo extrapolations? Toxicol. Lett. 220, 286-293.
Moon, T.W., 2004. Hormones and fish hepatocyte metabolism: “the good, the bad, and
the ugly!” Comp. Biochem. Physiol. B 139, 335-345.
Moon, T.W., Busby, E.R., Cooper, G.A., Mommsen, T.P., 1999. Fish hepatocyte
glycogen phosphorylase – a sensitive indicator of hormonal activation. Fish
Physiol. Biochem. 21, 15-24.
Moore, M.N., 2006. Do nanoparticles present ecotoxicological risks for the health of the
aquatic environment? Environ. Int. 32, 967–976.
Morgan, T.P., Wood, C.M., 2004. A relationship between gill silver accumulation and
acute silver toxicity in the freshwater rainbow trout: support for the acute silver
biotic ligand model. Environ. Toxicol. Chem. 23, 1261-1267.
211
Morones, J.R., Elechiguerra, J.L., Camacho, A., Holt, K., Kouri, J.B., Ramirez, J.T.,
Yacaman, M.J., 2005. The bactericidal effect of silver nanoparticles.
Nanotechnology 16, 2346-2353.
Mueller, N.C., Buha, J., Wang, J., Ulrich, A., Nowack, B., 2013. Modeling the flows of
engineered nanomaterials during waste handling. Environ. Sci. Process. Impacts 15,
251-259.
Mueller, N.C., Nowack, B., 2008. Exposure modeling of engineered nanoparticles in the
environment. Environ. Sci. Technol. 42, 4447-4453.
Mukherjee, S.G., O’Claonadh, N., Casey, A., Chambers, G., 2012. Comparative in vitro
cytotoxicity study of silver nanoparticle on two mammalian cell lines. Toxicol. In
Vitro 26, 238-251.
Nanotech News, 2009. National Cancer Institute. Retrieved on November 19th
, 2009,
from http://nano.cancer.gov/action/news/2009/nov/nanotech_news_2009-11-
16a.asp.
Nanotechproject, 2013. Project on emerging nanotechnologies. Consumer products
inventory. Retrieved on December 20th
, 2013, from
http://www.nanotechproject.org/cpi.
Navarro, E., Piccapietra, F., Wagner, B., Marconi, F., Kaegi, R., Odzak, N., Sigg, L.,
Behra, R., 2008. Toxicity of silver nanoparticles to Chlamydomonas reinhardtii.
Environ. Sci. Technol. 42, 8959-8964.
Neal, A.L., 2008. What can be inferred from bacterium-nanoparticle interactions about
the potential consequences of environmental exposure to nanoparticles?
Ecotoxicology 17, 362–371.
Nel, A.E., Mädler, L.,Velegol, D., Xia, T., Hoek, E., Somasundaran, P., Klaessig, F.,
Castranova, V., Thompson, M., 2009. Understanding biophysicochemical
interactions at the nano–bio interface. Nat. Mater. 8, 543-57.
Nel, A.E., Xia, T., Mädler, L., Li, N., 2006. Toxic potential of materials at the nanolevel.
Science 311, 622-627.
Nguyen, K.C., Seligy, V.L., Massarsky, A., Moon, T.W., Rippstein, P., Tan, J., Tayabali,
A.F., 2013. Comparison of toxicity of uncoated and coated silver nanoparticles. J.
Phys. Conf. Ser. 429, 012025.
Nickerson, J.G., Dugan, S.G., Drouin, G., Moon, T.W., 2001. A putative β2-
adrenoreceptor from rainbow trout (Oncorhynchus mykiss). Eur. J. Biochem. 268,
6465-6472.
Niemeyer, C.M., 2001. Nanoparticles, proteins, and nucleic acids: biotechnology meets
materials science. Angew. Chem. Int. Ed. 40, 4128–4158.
Oberdörster, G., Oberdörster, E., Oberdörster, J., 2005. An emerging discipline evolving
from studies of ultrafine particles. Environ. Health Perspect. 113, 823-839.
Oberdörster, G., Stone, V., Donaldson, K., 2007. Toxicology of nanoparticles: a
historical perspective. Nanotoxicology 1, 2-25.
212
Olive, P.L., 1988. DNA precipitation assay: a rapid and simple method for detecting
DNA damage in mammalian cells. Environ. Mol. Mutagen. 11, 487-495.
Otto, D.M.E., Moon, T.W., 1996. Endogenous antioxidant systems of two teleost fish, the
rainbow trout and the black bullhead, and the effect of age. Fish Physiol. Biochem.
15, 349-358.
Park, H.-J., Kim, J.Y., Kim, J., Lee, J.-H., Hahn, J.-S., Gu, M.B., Yoon, J., 2009. Silver-
ion-mediated reactive oxygen species generation affecting bacterial activity. Water
Res. 43, 1027-1032.
Peragón, J., Barroso, J.B., De la Higuera, M., Lupiáñez J.A., 2008. Serine dehydratase
and tyrosine aminotransferase activities increased by long-term starvation and
recovery by refeeding in rainbow trout (Oncorhynchus mykiss). J. Exp. Zool. A
309, 25-34.
Petrescu, I., Bojan, O., Saied, M., Bârzu, O., Schmidt, F., Kuhnle, H.F., 1979.
Determination of phosphoenolpyruvate carboxykinase activity with
deoxyguanosine 5’-diphosphate as nucleotide substrate. Anal. Biochem. 96, 279-
281.
Pham, C.H., Yi, J., Gu, M.B., 2012. Biomarker gene response in male medaka (Oryzias
latipes) chronically exposed to silver nanoparticle. Ecotoxicol. Environ. Saf. 78,
239-245.
Piao, M.J., Kang, K.A., Lee, I.K., Kim, H.S., Kim, S., Choi, J.Y., Choi, J., Hyun, J.W.,
2011. Silver nanoparticles induce oxidative cell damage in human liver cells
through inhibition of reduced glutathione and induction of mitochondrial-involved
apoptosis. Toxicol. Lett. 201, 92-100.
Piato, Â.L., Capiotti, K.M., Tamborski, A.R., Oses, J.P., Barcellos, L.J.G., Bogo, M.R.,
Lara, D.R., Vianna, M.R., Bonan, C.D., 2011. Unpredictable chronic stress model
in zebrafish (Danio rerio): behavioral and physiological responses. Prog. Neuro-
Psychoph. 35, 561-567.
Piccapietra, F., Sigg, L., Behra, R., 2012. Colloidal stability of carbonate-coated silver
nanoparticles in synthetic and natural freshwater. Environ. Sci. Technol. 46, 818-
825.
Piccinno, F., Gottschalk, F., Seeger, S., Nowack, B., 2012. Industrial production
quantities and uses of ten engineered nanomaterials in Europe and the world. J.
Nanopart. Res. 14, 1109-1119.
Powers, C.M., Slotkin, T.A., Seidler, F.J., Badireddy, A.R., Padilla, S., 2011. Silver
nanoparticles alter zebrafish development and larval behavior: distinct roles for
particle size, coating and composition. Neurotoxicol. Teratol. 33, 708-714.
Prencipe, G., Tabakman, S.M., Welsher, K., Liu, Z., Goodwin, A.P., Zhang, L., Henry, J.,
Dai, H., 2009. PEG branched polymer for functionalization of nanomaterials with
ultralong blood circulation. J. Am. Chem. Soc. 131, 4783-4787.

213
Ramsay, J.M., Feist, G.W., Varga, Z.M., Westerfield, M., Kent, M.L., Schreck, C.B.,
2009. Whole-body cortisol response of zebrafish to acute net handling stress.
Aquaculture 297, 157-162.
Rayburn, J.R., Friedman, M., 2010. L-cysteine, N-acetyl-L-cysteine, and glutathione
protect Xenopus laevis embryos against acrylamide-induced malformations and
mortality in the frog embryo teratogenesis assay. J. Agric. Food Chem. 58, 11172-
11178.
Reddy, C.S.S.S., Subramanyam, M.V.V., Vani, R., Devi, A., 2007. In vitro models of
oxidative stress in rat erythrocytes: effect of antioxidant supplements. Toxicol. In
Vitro 21, 1355–1364.
Reid, S.D., Moon, T.W., Perry, S.F., 1991. Characterization of -adrenoreceptors of
rainbow trout (Oncorhynchus mykiss) erythrocytes. J. Exp. Biol. 158, 199-216.
Roco, M.C., 2005. Environmentally responsible development of nanotechnology.
Environ. Sci. Technol. 39, 106A-112A.
Sandhu, N., Vijayan, M.M., 2011. Cadmium-mediated disruption of cortisol biosynthesis
involves suppression of corticosteroid genes in rainbow trout. Aquat. Toxicol. 103,
92-100.
Sathiyaa, R., Vijayan, M.M., 2003. Autoregulation of glucocorticoid receptor by cortisol
in rainbow trout hepatocytes. Am. J. Cell Physiol. 284, C1508-1515.
Schmale, M.C., Nairn, R.S., Winn, R.N., 2007. Aquatic animal models of human disease.
Comp. Biochem. Physiol. C 145, 1-4.
Schmid, G., 2004. Nanoparticles: from theory to application. Wiley-VCH verlag GmbH
& Co.KGaA. Weinheim.
Schmid, K., Riediker, M., 2008. Use of nanoparticles in Swiss industry: a targeted
survey. Environ. Sci. Technol. 42, 2253-2260.
Schultz, A.G., Ong, K.J., MacCormack, T., Ma, G.B., Veinot, J.G.C., Goss, G.G., 2012.
Silver nanoparticles inhibit sodium uptake in juvenile rainbow trout (Oncorhynchus
mykiss). Environ. Sci. Technol. 46, 10295-10301.
Scown, T.M., Santos, E.M., Johnston, B.D., Gaiser, B., Baalousha, M., Mitov, S., Lead,
J.R., Stone, V., Fernandes, T.F., Jepson, M., van Aerle, R., Tyler, C.R., 2010b.
Effects of aqueous exposure to silver nanoparticles of different sizes in rainbow
trout. Toxicol. Sci. 115, 521-534.
Scown, T.M., van Aerle, R., Tyler, C.R., 2010a. Review: do engineered nanoparticles
pose a significant threat to the aquatic environment? Crit. Rev. Toxicol. 40, 653-
670.
Seetharam, R.N., Sridhar, K.R., 2007. Nanotoxicity: threat posed by nanoparticles. Curr.
Sci. 93, 769-770.
Sharifi, S., Behzadi, S., Laurent, S., Forrest, M.L., Stroeve, P., Mahmoudi, M., 2012.
Toxicity of nanomaterials. Chem. Soc. Rev. 41, 2323-2343.

214
Sharma, V.K., Yngard, R.A., Lin, Y., 2009. Silver nanoparticles: green synthesis and
their antimicrobial activities. Adv. Colloid Interface Sci. 145, 83-96.
Shaw, B.J., Handy, R.D., 2011. Physiological effects of nanoparticles in fish: a
comparison of nanometals versus metal ions. Environ. Int. 37, 1083-1097.
Shi, X., Liu, C., Wu, G., Zhou, B., 2009. Waterborne exposure to PFOS causes disruption
of the hypothalamus-pituitary-thyroid axis in zebrafish larvae. Chemosphere 77,
1010-1018.
Singh, R.P., Ramarao, P., 2012. Cellular uptake, intracellular trafficking and cytotoxicity
of silver nanoparticles. Toxicol. Lett. 213, 249-259.
Song, X.-l., Li, B., Xu, K., Liu, J., Ju, W., Wang, J., Liu, X.-d., Li, J., Qi, Y.-F., 2012.
Cytotoxicity of water-soluble mPEG-SH-coated silver nanoparticles in HL-7702
cells. Cell Biol. Toxicol. 28, 225-237.
Sopjani, M., Föller, M., Haendeler, J., Götz, F., Lang, F., 2009. Silver ion-induced
suicidal erythrocyte death. J. Appl. Toxicol. 29, 531-536.
Stankus, D.P., Lohse, S.E., Hutchison, J.E., Nason, J.A., 2011. Interactions between
natural organic matter and gold nanoparticles stabilized with different organic
capping agents. Environ. Sci. Technol. 45, 3238-3244.
Stone, V., Nowack, B., Baun, A., Brink, N., Kammer, F., Dusinka, M., Handy, R.,
Hankin, S., Hassellöv, M., Joner, E., Fernandes, T., 2010. Nanomaterials for
environmental studies: classification, reference material issues, and strategies for
physico-chemical characterisation. Sci. Total Environ. 408, 1745-1754.
Taguchi, F., Suematsu, E., Nishimura, J., Nawata, H., 1991. Silver ion triggers Ca2+
release from intracellular store sites in saponin-treated HL-60 cells. P. Soc. Exp.
Biol. Med. 197, 201-207.
Thio, B.J.R., Zhou, D.X., Keller, A.A., 2011. Influence of natural organic matter on the
aggregation and deposition of titanium dioxide nanoparticles. J. Hazard. Mater.
189, 556−563.
Thomas, J.K., Janz, D.M., 2011. Dietary selenomethionine exposure in adult zebrafish
alters swimming performance, energetics and the physiological stress response.
Aquat. Toxicol. 102, 79-86.
Thomas, S., Nair, S.K., Jamal, E.M.A., Al-Harthi, S.H., Varma, M.R., Anantharaman,
M.R., 2008. Size-dependent surface plasmon resonance in silver silica
nanocomposites. Nanotechnology 19, 1-7.
Thorgaard, G.H., Bailey, G.S., Williams, D., Buhler, D.R., Kaattari, S.L., Ristow, S.S.,
Hansen, J.D., Winton, J.R., Bartholomew, J.L., Nagler, J.J., Walsh, P.J., Vijayan,
M.M., Devlin, R.H., Hardy, R.W., Overturf, K.E., Young, W.P., Robison, B.D.,
Rexroad, C., Palti, Y., 2002. Status and opportunities for genomics research with
rainbow trout. Comp. Biochem. Physiol. B 133, 609-646.

215
To, T.T., Hahner, S., Nica, G., Rohr, K.B., Hammerschmidt, M., Winkler, C., Allolio, B.,
2007. Pituitary-interrenal interaction in zebrafish interrenal organ development.
Mol. Endocrinol. 21, 472-485.
Toborek, M., Barger, S.W., Mattson, M.P., McClain, C.J., Henning, B., 1995. Role of
glutathione redox cycle in TNF--mediated endothelial cell dysfunction.
Atherosclerosis 117, 179–188.
Trenzado, C.E., Morales, A.E., Palma, J.M., De la Higuera, M., 2009. Blood antioxidant
defenses and hematological adjustments in crowded/uncrowded rainbow trout
(Oncorhynchus mykiss) fed on diets with different levels of antioxidant vitamins
and HUFA. Comp. Biochem. Physiol. C 149, 440-447.
Tuncer, P.B., Bucak, M.N., Büyükleblebici, S., Sarıözkan, S., Yeni, D., Eken, A., Akalın,
P.P., Kinet, H., Avdatek, F., Fidan, A.F., Gündog, M., 2010. The effect of cysteine
and glutathione on sperm and oxidative stress parameters of post-thawed bull
semen. Cryobiology 61, 303-307.
Van Heeswijk, J.C.F., Vianen, G.J., van den Thillart, G.E.E.J.M., 2006. The adrenergic
control of hepatic glucose and FFA metabolism in rainbow trout (Oncorhynchus
mykiss): increased sensitivity to adrenergic stimulation with fasting. Gen. Comp.
Endocr. 145, 51-61.
Verbost, P.M., Flik, G., Pang, P.K., Lock, R.A., Wendelaar Bonga, S.E., 1989. Cadmium
inhibition of the erythrocyte Ca2+
pump - a molecular interpretation. J. Biol. Chem.
264, 5613–5615.
Viarengo, A., Nicotera, P., 1991. Possible role of Ca2+
in heavy metal cytotoxicity.
Comp. Biochem. Physiol. C 100, 81–84.
Vijayan, M., Raptis, S., Sathiyaa, R., 2003. Cortisol treatment affects glucocorticoid
receptor and glucocorticoid-responsive genes in the liver of rainbow trout. Gen.
Comp. Endocr. 132, 256–263.
von Goetz, N., Lorenz, C., Windler, L., Nowack, B., Heuberger, M.P., Hungerbühler, K.,
2013. Migration of Ag- and TiO2-(nano)particles from textiles into artificial sweat
under physical stress: experiments and exposure modeling. Environ. Sci. Technol.
47, 9979-9987.
Weiergräber, O., Häussinger, D., 2000. Hepatocellular hydration: signal transduction and
functional implications. Cell. Physiol. Biochem. 10, 409-416.
Wen, L.-S., Santschi, P.H., Gill, G.A., Paternostro, C.L., Lehman, R.D., 1997. Colloidal
and particulate silver in river and estuarine waters of Texas. Environ. Sci. Technol.
31, 723-731.
Westerfield, M., 2000. The Zebrafish Book. A Guide for the Laboratory Use of Zebrafish
(Danio rerio), 4th edn. Eugene: University of Oregon Press.
Wise, J., Goodale, B., Wise, S., Craig, G., Pongan, A., Walter, R., Thompson, D., Ng, A.,
Aboueissa, A., Mitani, H., Spalding, M., Mason, M., 2010. Silver nanospheres are
cytotoxic and genotoxic to fish cells. Aquat. Toxicol. 97, 34-41.

216
Witorsch, R.J., Thomas, J.A., 2010. Personal care products and endocrine disruption: a
critical review of the literature. Crit. Rev. Toxicol. 40, 1-30.
Wood, C., Playle, R., Hogstrand, C., 1999. Physiology and modeling of mechanisms of
silver uptake and toxicity in fish. Environ. Toxicol. Chem. 18, 71-83.
Wright, P.A., Perry, S.F., Moon, T.W., 1989. Regulation of hepatic gluconeogenesis and
glycogenolysis by catecholamines in rainbow trout during environmental hypoxia.
J. Exp. Biol. 147, 169-188.
Wu, T., Li, Y.F., Huang, C.Z., 2009. Selectively colorimetric detection of cysteine with
triangular silver nanoprisms. Chin. Chem. Lett. 20, 611-614.
Wu, Y.-T., Lin, C.H., Tsai, M.-Y., Chen, Y.-H., Lu, Y.-F., Huang, C.-J., Cheng, C.-M.,
Hwang, S.-P.L., 2011. β-Lapachone induces heart morphogenetic and functional
defects by promoting the death of erythrocytes and the endocardium in zebrafish
embryos. J. Biomed. Sci. 18, 70-82.
Yan, W., Zhou, Y., Yang, J., Li, S., Hu, D., Wang, J., Chen, J., Li, G., 2012. Waterborne
exposure to microcystin-LR alters thyroid hormone levels and gene transcription in
the hypothalamic-pituitary-thyroid axis in zebrafish larvae. Chemosphere 87, 1301-
1307.
Yao, M., Denver, R.J., 2007. Regulation of vertebrate corticotropin-releasing factor
genes. Gen. Comp. Endocr. 153, 200-216.
Yeo, M., Kang, M., 2008. Effects of nanometer sized silver materials on biological
toxicity during zebrafish embryogenesis. B. Korean Chem. Soc. 29, 1179-1184.
Yin, L., Cheng, Y., Espinasse, B., Colman, B.P., Auffan, M., Wiesner, M., Rose, J., Liu,
J., Bernhardt, E.S., 2011. More than the ions: the effects of silver nanoparticles on
Lolium multiflorum. Environ. Sci. Technol. 45, 2360-2367.
Yin, N., Liu, Q., Liu, J., He, B., Cui, L., Li, Z., Yun, Z., Qu, G., Liu, S., Zhou, Q., Jiang,
G., 2013. Silver nanoparticle exposure attenuates the viability of rat cerebellum
granule cells through apoptosis coupled to oxidative stress. Small 9, 1831-1841.
Yu, L., Deng, J., Shi, X., Liu, C., Yu, K., Zhou, B., 2010. Exposure to DE-71 alters
thyroid hormone levels and gene transcription in the hypothalamic-pituitary-thyroid
axis of zebrafish larvae. Aquat. Toxicol. 97, 226-233.
Yu, L., Lam, J.C.W., Guo, Y., Wu, R.S.S., Lam, P.K.S., Zhou, B., 2011. Parental transfer
of polybrominated diphenyl ethers (PBDEs) and thyroid endocrine disruption in
zebrafish. Environ. Sci. Technol. 45, 10652-10659.
Yu, S.-j., Yin, Y.-g., Chao, J.-b., Shen, M.-h., Liu, J.-f., 2014. Highly dynamic PVP-
coated silver nanoparticles in aquatic environments: chemical and morphology
change induced by oxidation of Ag0 and reduction of Ag
+. Environ. Sci. Technol.
48, 403-411.
Yu, S.-j., Yin, Y.-g., Liu, J.-f., 2013. Silver nanoparticles in the environment. Environ.
Sci. Process. Impacts 15, 78-92.

217
Zhang, W., Yao, Y., Sullivan, N., Chen, Y., 2011. Modeling the primary size effects of
citrate-coated silver nanoparticles on their ion release kinetics. Environ. Sci.
Technol. 45, 4422-4428.
Ziv, L., Muto, A., Schoonheim, P.J., Meijsing, S.H., Strasser, D., Ingraham, H.A.,
Schaaf, M.J., Yamamoto, K.R., Baier, H., 2013. An effective disorder in zebrafish
with mutation of the glucocorticoid receptor. Mol. Psychiatr. 18, 681-691.

218
Appendix
ANDREY MASSARSKY - CURRICULUM VITAE
Education
2008-2014 Ph.D. Biology (Chemical and Environmental Toxicology) –
University of Ottawa
Thesis: Characterizing the biochemical and toxicological effects of
nanosilver in vivo using zebrafish (Danio rerio) and in vitro using
rainbow trout (Oncorhynchus mykiss).
Supervisors: Drs. Thomas W. Moon and Vance L. Trudeau
2004-2008 H.B.Sc. Biomedical science – University of Ottawa
Thesis: 3,3’,4,4’- Tetrachlorobiphenyl (PCB 77) impact on the
binding of adrenergic ligands to the liver β-adrenoceptors (β-AR)
and the fuel supplies in rainbow trout (Oncorhynchus mykiss).
Supervisor: Dr. Thomas W. Moon
Awards and Scholarships
2010-2013 University of Ottawa Admission Scholarship - Graduate
2011 Heather Glendinning McMurter Award
2004-2005 University of Ottawa Admission Scholarship - Undergraduate
List of Publications
Published Articles:
- Massarsky, A., Strek, L., Craig, P.M., Eisa-Beygi, S., Trudeau, V.L., Moon, T.W.,
2014. Acute embryonic exposure to nanosilver or silver ion does not disrupt the stress
response in zebrafish (Danio rerio) larvae and adults. Sci Total Environ. 478, 133-
140.
- Massarsky, A., Labarre, J., Trudeau, V.L., Moon, T.W., 2014. Silver nanoparticles
stimulate glycogenolysis in rainbow trout (Oncorhynchus mykiss) hepatocytes. Aquat.
Toxicol. 147, 68-75.
- Massarsky, A., Abraham, R., Nguyen, K.C., Rippstein, P., Tayabali, A.F., Trudeau,
V.L., Moon, T.W., 2014. Nanosilver cytotoxicity in rainbow trout (Oncorhynchus
mykiss) erythrocytes and hepatocytes. Comp. Biochem. Physiol. C 159, 10-21.
- Massarsky, A., Dupuis, L., Taylor, J., Eisa-Beygi, S., Strek, L., Trudeau, V.L., Moon,
T.W., 2013. Assessment of nanosilver toxicity during zebrafish (Danio rerio)
development. Chemosphere 92, 59-66.

219
- Massarsky, A., Trudeau, V.L., Moon, T.W., 2011. β-Blockers as endocrine
disruptors: the potential effects of human β-blockers on aquatic organisms. J. Exp.
Zool. A 315, 251-265.
Published Articles from Collaborative Research:
- Craig, P.M., Massarsky, A., Moon, T.W., 2013. Understanding glucose uptake during
methionine deprivation in incubated rainbow trout (Oncorhynchus mykiss)
hepatocytes using a non-radioactive method. Comp. Biochem. Physiol. B 166, 23-29.
- Nguyen, K.C., Seligy, V.L., Massarsky, A., Moon, T.W., Rippstein, P., Tan, J.,
Tayabali, A.F., 2013. Comparison of toxicity of uncoated and coated silver
nanoparticles. J. Phys. Conf. Ser. 429, 012025.
- Gilmour, K.M., Berthelot, C.-E., Kirkpatrick, S., Massarsky, A., Pearce, B., Saliba,
S., Stephany, C.-E., Moon, T.W., 2012. The influence of social status on hepatic
glucose metabolism in rainbow trout, Oncorhynchus mykiss. Physiol. Biochem. Zool.
85, 309-320.
Submitted or in Progress Manuscripts:
- Khosravi Katuli, K., Massarsky, A., Pourmehran, Z., 2014. Silver nanoparticles
inhibit the gill Na+/K
+-ATPase and erythrocyte AChE activities and induce the stress
response in adult zebrafish (Danio rerio). Ecotoxicol. Environ. Saf. Submitted.
- Khosravi Katuli, K., Mojazi Amiri, B., Massarsky, A., Yelghi, S., 2014. Impact of a
short-term diazinon exposure on the osmoregulation potentiality of Caspian roach.
Chemosphere. Submitted.
- Grand River caging study. Collaboration with Drs. Chris Metcalfe (Trent University)
and Mark Servos (University of Waterloo). In prep.
- North Saskatchewan caging study. Collaboration with Dr. Greg Goss (University of
Alberta). In prep.
Selected Conference Presentations
2013 Canadian Society of Zoologists – Guelph, ON, Canada. May 13-17
Using in vitro systems to assess the toxicity of nanosilver (oral)
Perkin Elmer Nano Symposium – Gatineau, QE, Canada. Feb 7
Hepatocytes - a useful in vitro model to study nanotoxicity (poster)
2012 International Congress on the Biology of Fish – Madison, WI, USA. July 15-17
Characterizing toxicity of nano silver in rainbow trout (Oncorhynchus
mykiss) hepatocytes and zebrafish (Danio rerio) embryos (oral)
International Conference on the Environmental Effects of Nanoparticles and
Nanomaterials – Banff, AL, Canada. September 12-15
In vitro characterization of nanosilver toxicity in rainbow trout
(Oncorhynchus mykiss) hepatocytes and erythrocytes (poster)
Perkin Elmer Nano Symposium – Gatineau, QE, Canada. Feb 2.
Effects of nanosilver in fish (oral)

220
2011 Canadian Society of Zoologists – Ottawa, ON, Canada. May 16-20
Silver (nano and ionic) toxicity in rainbow trout hepatocytes (Oral)
Comparative Physiology and Biochemistry Workshop - Keene, ON, Feb. 4-6
Effects of nanosilver on antioxidant levels in trout hepatocytes (poster)
Ottawa-Carleton Institute of Biology Symposium - Carleton University, Ottawa,
ON, Apr. 13-14
Nanosilver toxicity in rainbow trout hepatocytes (oral)
2010 Ottawa-Carleton Chemistry Institute Symposium - University of Ottawa, Ottawa,
ON, Mar. 26
Biochemical effects of nanomaterials on rainbow trout hepatocyte function
(oral)
2009 Canadian Society of Zoologists - Toronto, Scarborough, ON, May 12-16
Biochemical effects of TiO2 on rainbow trout hepatocyte function (oral)
Teaching Experience
Winter 2012-2014 Molecular Biology (Lab demo)
Fall 2011-2013 Microbiology/Microbiologie (Lab demo)
Winter 2011 Animal Adaptations (TA)
Introduction à la Biologie Cellulaire (Lab demo)
Fall 2010 Introduction à la Biologie des Organismes (Lab demo)
Winter 2010 Biologie Moléculaire (Lab demo)
Fall 2009 Introduction to Organismal Biology (Corrector)
Fall 2008 Génomique (Corrector)
Other Teaching Experience
2013 Objet d’Apprentisage Interactif (OAI)
Collaboration with TFO
http://www.enrichirsonsavoir.com/nanotechnologie/
2011-2013 Enrichment mini-courses
Nanomatériaux : le monde de l’infiniment petit
Skills
Enzyme Assays Glutathione reductase, glutathione peroxidase, glutathione-
S-transferase, catalase, superoxide dismutase, glycogen
phosphorylase, lactate dehydrogenase, aminotransferases
(alanine, aspartate).
Substrate Assays Glucose, glycogen, glutathione, lipid peroxidation, protein
carbonyl, cAMP, cortisol, protein
Molecular Techniques DNA/RNA extractions, PCR, qPCR.

221
Miscellaneous AA graphite furnace for Ag, Dynamic Light Scattering
(DLS), hepatocyte and erythrocyte isolation and primary
culture.
Animal Husbandry Rainbow trout, zebrafish embryos and adults.
Languages Russian, Hebrew, English, French.
Referees
Drs. Thomas W. Moon, Vance L. Trudeau, John Basso
Department of Biology, University of Ottawa