charging an electric vehicle-sharing fleet
TRANSCRIPT

This article was downloaded by: [146.151.118.30] On: 31 August 2020, At: 07:14Publisher: Institute for Operations Research and the Management Sciences (INFORMS)INFORMS is located in Maryland, USA
Manufacturing & Service Operations Management
Publication details, including instructions for authors and subscription information:http://pubsonline.informs.org
Charging an Electric Vehicle-Sharing FleetLong He, Guangrui Ma, Wei Qi, Xin Wang
To cite this article:Long He, Guangrui Ma, Wei Qi, Xin Wang (2020) Charging an Electric Vehicle-Sharing Fleet. Manufacturing & ServiceOperations Management
Published online in Articles in Advance 03 Apr 2020
. https://doi.org/10.1287/msom.2019.0851
Full terms and conditions of use: https://pubsonline.informs.org/Publications/Librarians-Portal/PubsOnLine-Terms-and-Conditions
This article may be used only for the purposes of research, teaching, and/or private study. Commercial useor systematic downloading (by robots or other automatic processes) is prohibited without explicit Publisherapproval, unless otherwise noted. For more information, contact [email protected].
The Publisher does not warrant or guarantee the article’s accuracy, completeness, merchantability, fitnessfor a particular purpose, or non-infringement. Descriptions of, or references to, products or publications, orinclusion of an advertisement in this article, neither constitutes nor implies a guarantee, endorsement, orsupport of claims made of that product, publication, or service.
Copyright © 2020, INFORMS
Please scroll down for article—it is on subsequent pages
With 12,500 members from nearly 90 countries, INFORMS is the largest international association of operations research (O.R.)and analytics professionals and students. INFORMS provides unique networking and learning opportunities for individualprofessionals, and organizations of all types and sizes, to better understand and use O.R. and analytics tools and methods totransform strategic visions and achieve better outcomes.For more information on INFORMS, its publications, membership, or meetings visit http://www.informs.org

MANUFACTURING & SERVICE OPERATIONS MANAGEMENTArticles in Advance, pp. 1–17
http://pubsonline.informs.org/journal/msom ISSN 1523-4614 (print), ISSN 1526-5498 (online)
Charging an Electric Vehicle-Sharing FleetLong He,a Guangrui Ma,b Wei Qi,c Xin Wangd
aNUSBusiness School, National University of Singapore (NUS), Singapore 119245; bAntai Collage of Economics andManagement, ShanghaiJiao Tong University, 200030 Shanghai, China; cDesautels Faculty of Management, McGill University, Montreal, Quebec H3A 1G5, Canada;dDepartment of Industrial and Systems Engineering and Grainger Institute for Engineering, College of Engineering, University ofWisconsin–Madison, Madison, Wisconsin 53706Contact: [email protected], http://orcid.org/0000-0002-9951-7450 (LH); [email protected],
http://orcid.org/0000-0002-2286-2571 (GM); [email protected], http://orcid.org/0000-0003-3948-835X (WQ); [email protected],http://orcid.org/0000-0002-0260-5535 (XW)
Received: August 14, 2018Revised: June 13, 2019; August 24, 2019Accepted: September 7, 2019Published Online in Articles in Advance:April 3, 2020
https://doi.org/10.1287/msom.2019.0851
Copyright: © 2020 INFORMS
Abstract. Problem definition: Many cities worldwide are embracing electric vehicle (EV)sharing as a flexible and sustainable means of urban transit. However, it remains chal-lenging for the operators to charge the fleet because of limited or costly access to chargingfacilities. In this paper, we focus on answering the core question—how to charge the fleet tomake EV sharing viable and profitable. Academic/practical relevance: Our work is mo-tivated by the setback that struck San Diego, California, where car rental company car2goceased its EV-sharing operations. We integrate charging infrastructure planning andvehicle repositioning operations that were often considered separately. More interestingly,our modeling emphasizes the operator-controlled charging operations and customers’EV-picking behavior, which are both central to EV sharing but were largely overlooked.Methodology: Supported by the real data of car2go, we develop a queuing network modelthat characterizes how customers endogenously pick EVs based on energy levels and howthe operator implements a charging-up-to policy. The integrated queuing-location modelleads to a nonlinear optimization program. We then propose both lower and upper boundformulations as mixed-integer second-order cone programs, which are computationallytractable and result in a small optimality gap when the fleet size is adequate. Results: Welearn lessons from the setback of car2go in San Diego. We find that the viability of EVsharing can be enhanced by concentrating limited charger resources at selected locations.Charging EVs either in a proactive fashion or at the 40% recharge threshold (rather thancar2go’s policy of charging EVs only when their energy level drops below 20%) can boostthe profit by more than 15%. Moreover, sufficient charger availability is crucial whencollaborating with a public charger network. Increasing the charging power relieves thecharger resource constraint, whereas extending per-charge range or adopting unmannedrepositioning improves profitability. Finally, we discuss how EV sharing operations de-pend on the urban spatial structure, compared with conventional car sharing.Managerialimplications: We demonstrate a data-verified and high-granularity modeling approach.Both the high-level planning guidelines and operational policies can be useful forpractitioners. We also highlight the value of jointly managing demand fulfillment andEV charging.
Funding: This work was supported by the National Science Foundation [CNS Award 1637772], Fondsde Recherche du Québec-Société et Culture [Grant 267792], the National Natural Science Foun-dation of China [Grants 71602142, 91646118, and 91746210], the National University of Singapore[Start-Up Grant R-314-000-106-133], and the Natural Sciences and Engineering Research Council ofCanada [NSERC Grant RGPIN-2019-04769].
Supplemental Material: The online appendices are available at https://doi.org/10.1287/msom.2019.0851.
Keywords: smart city operations • electric vehicles • car sharing • charging infrastructure
1. IntroductionOne of the building blocks for a smart city future is anelectrified and shared mobility system. Such a systemprovides flexible on-demand transit services using apool of electric vehicles (EVs). One representativebusiness practice is the car-sharing service of car2go, acar rental company that runs Smart Fortwo EV fleetsin cities such as Amsterdam and Madrid. Car2gomembers can pick up an available EV nearby, drive it
for a trip, and drop it off anywhere with signage onthe street within its service region. This EV-sharingbusiness model is gaining momentum worldwide,attracting market entrants including Volkswagen inEurope, Shouqi in China, and Communauto in Canada.Meanwhile, local governments, such as those of Singa-pore, Amsterdam, and Columbus, Ohio, also highlightthe promotion of electrified and shared mobility intheir race to launch smart city initiatives.1
1

Electrified and shared mobility is widely expectedto prevail because of two driving forces. First, economicrestructuring, in the form of the booming sharingeconomy along with online/offline service integra-tion, has its largest impact on the transportation sector.Global Market Insights (2018) projects that the globalrevenue of the car sharing industry will rise to$12 billion by 2024. Second, stringent environmentalregulations on emissions spur vehicle electrificationby phasing out fossil-fuel vehicles. For example, theUnited Kingdom and France will prohibit the sale ofnew internal-combustion cars by 2040, India has setits deadline to 2030, and China is working on itstimetable for a similar mandate (Condliffe 2017).
Nonetheless, a smart EV-sharing system cannot bebuilt in one day. A recent setback occurred in SanDiego, where car2go ceased operations of its EV-sharing fleet in 2016. The San Diego Union-Tribunereported the EV-sharing operator’s reason:
We’re just not able to keep the cars charged, andpeople aren’t able to charge them on their own. . . . Wejust don’t have the infrastructurewe need here tomakeit work now. (Dacyl Armendariz, car2go spokesper-son, quoted in Garrick 2016)
Indeed, insufficient charging causes low batteryenergy levels and thus limited availability of EVs tofulfill travel demands, which can ultimately throttlethe operation. To tackle this issue, EV-sharing oper-ators face grand challenges:
• At the strategic level, unlike sharing conven-tional fossil-fuel vehicles, EV sharing crucially de-pends on the infrastructure for battery charging.Unfortunately, such infrastructure is often scarce. Forexample, in 2011, a federally subsidized nonprofit,ECOtality, promised itwould install 1,000Blink chargersin San Diego. However, only about 400 were installedwhen car2go finally stopped doing business (Garrick2016). Moreover, those 400 public chargers were onlypartially available to car2go while accommodatingcompeting charging demands from other EV owners.Given the high construction cost of charging infra-structure and its scarcity, it is imperative to care-fully decide the locations and quantities of chargersto install.
• At the operational level, the EV-sharing operatorhas to conduct intertwined repositioning and batterycharging operations to meet travel demand. Un-balanced customer trips often lead to either too few orexcessive EVs at some locations. It is thus importantfor the operator to reposition EVs to improve vehicleutilization by meeting more demands at more loca-tions. However, the repositioning of EVs is muchmore challenging than that of fossil-fuel vehicles—EVstake significantly longer charge time yet with shorterper-charge range. The energy remaining in the battery,
hereafter referred to as the energy level, is critical todemand fulfillment and the feasibility of reposition-ing. A salient feature of EV sharing is that the energylevels of vehicle flows should be closely tracked toensure charging EVs timely, as well as to improvedemand fulfillment.We try to address these challenges by proposing
models, analytics, and insights for designing a betterEV-sharing system. The objective is to satisfy urbanmobility demands in a shared and electrified fashionwhile maximizing the revenue net of the infrastruc-ture investment and operating cost. Our paper presentsan integrated model to jointly determine the locationsand sizes of battery charging sites, along with thecoupled fleet charging and repositioning operations.Through a case study based on real data, we aim tounderstand whether car2go could have performedbetter. More important, we provide managerial in-sights into the future development of EV sharing forcities and companies that pursue this mobility para-digm. We briefly summarize the contributions of thispaper as follows:1. To the best of our knowledge, this work is the
first attempt to provide models to jointly plan andoperate an EV-sharing system, with an emphasis onhigh-granularitymodeling of energy-level-indexed EVflows, endogenous customers’ EV-picking behavior,and the operator’s charging operations. These oper-ational aspects are central to EV sharing but have beenoverlooked at the network scope in the literature.2. Our work also demonstrates a data-verified mod-
eling approach. We rely on real data and empiricalevidence to guide our modeling process (e.g., EV arrivaland departure processes, customers’ EV-picking be-havior, and the operator’s charging policy). Our de-mand recovery method helps correct observationalbias from the censored data. Collectively, our modeland managerial insights can be of practical value toEV-sharing practitioners.3. We propose a new solution technique to tackle
the resulting optimization model—a nonlinear pro-gramwith fractional constraints (involving quadraticdenominators). Our lower and upper bound solutionscan be obtained by solving mixed-integer second-order cone programs (MISOCPs). The bounds re-sult in small optimality gaps (for cases with adequatefleets), allowing efficient computation and signifi-cantlymore straightforward implementation than thebranch-and-bound solution techniques in the literature.4. By examining car2go operations from compu-
tational studies on real data, we provide managerialinsights to help launch future EV-sharing programs:
• Contrary to car2go’s practice of charging EVsonly at energy levels below 20%, car2go should,ideally, proactively charge EVs from varying energylevels contingent on the operational status of the entire
He et al.: Charging an Electric Vehicle-Sharing Fleet2 Manufacturing & Service Operations Management, Articles in Advance, pp. 1–17, © 2020 INFORMS

system. Alternatively, a more implementable adjust-ment is to increase the charging activation thresholdto 40% (with reoptimized charging infrastructure). Fur-thermore, its fleet size may be reduced by up to 20%without incurring significant profit loss.
• Ensuring sufficient charger availability is crucialwhen collaboratingwith a public charger network.Whenthe availability of the public chargers is low, the EV-sharing service provider should consider installingprivate chargers to ensure timely access to energy atoptimal locations.
• Various EV technological advancements leadto different performance improvements. Elevatingcharging power relieves the charger resource con-straint, thus enhancing the business viability in theearly stage. By contrast, extending the per-chargerange or adopting unmanned repositioning improvesprofitability, thus being favorable in the long run.
• Finally, EV sharing also differs from conven-tional car sharing in how its profitability and oper-ations depend on the urban spatial structure. A morecentralized customer trip pattern (into and out of acentral business district) can be favorable to EVsharing because the savings from charging operationsand investment may dominate the expenditure onrebalancing supply/demand.
The remainder of this paper is organized as follows.Section 2 reviews the related literature. Section 3describes the optimization model of planning andoperating an EV-sharing system. Section 4 developstractable formulations to obtain lower and upperbounds for the optimal profit. Section 5 presents thecase study and managerial insights into the futuredevelopment of EV sharing. Finally, Section 6 con-cludes the paper. A summary of notations, additionalproofs, formulations, and results are available in theonline appendices.
Throughout the paper, we denote sets by calli-graphic uppercase English letters, system parametersby lowercase English letters, vehicle flow decisionvariables and service levels by lowercase Greek let-ters, and other decision variables by uppercase En-glish letters.
2. Literature ReviewInfrastructure planning for shared and electrifiedmobility is essential to the development of smart citiesbut has drawn little attention in the literature. Themajority of the literature on vehicle-sharing servicesystems considers vehicles without battery chargingconcerns (e.g., fossil-fuel cars and bikes). For one-waymobility sharing, a main operational challenge is thatthe operators have to proactively reposition theirfleets to maintain a certain service level in the pres-ence of spatially asymmetric trip demands. Recentstudies have made some progress in this direction. At
the strategic level, Kabra et al. (2018) develop astructural choice model to empirically analyze theimpacts of accessibility of stations and the availabilityof vehicles in a bike-sharing system. Lu et al. (2017)consider the problem of allocating parking lots orpermits in joint with fleet repositioning operations.Similarly, Kaspi et al. (2014, 2016) study parkingreservation policies and regulations. At the opera-tional level,Adelman (2007) develop a queuingnetworkto study the rail equipment repositioning problem. Nairand Miller-Hooks (2011) consider a vehicle reposi-tioning problem with service-level constraints. Shuet al. (2013) solve a bike redistribution network flowproblem. Benjaafar et al. (2018) and He et al. (2020)propose different approaches to solving the stochasticdynamic rental product or vehicle repositioning prob-lems. However, those one-waymobility-sharingmodelscannot be directly applied to EV-sharing fleets be-cause the battery charging operations are absent. Asimplied by the failure of car2go in San Diego, managingcharging operations is critical to the success of the EV-sharing business.Our paper aims to address several obstacles that
arise from electrifying car-sharing systems, includ-ing planning battery charging infrastructure, man-aging coupled charging and repositioning opera-tions, and estimating travel demand. Among fewrelated studies, Boyacı et al. (2015) build a planningmodel to analyze station-based EV sharing, consid-ering station location, parking space allocation, fleetsize management, and vehicle relocation. He et al.(2017) propose a mathematical programming modelto solve for the optimal service region planning forEV sharing, incorporating customer subscription de-cisions and fleet operations. By considering an aggre-gated market without heterogeneities across locationsand EVs, Abouee Mehrizi et al. (2018) develop ananalytical model to discuss the viability of using EVsin a car-sharing system. However, those papers ab-stract away detailed operations that are critical to EVsharing such as, for example, endogenized cus-tomers’ EV-picking behavior and the operator’s EVcharging management.Among those papers, He et al. (2017) is the closest to
ours. Nevertheless, they do not consider heteroge-neous energy levels of EVs and simply assume that20% of all EVs arriving at each location enter thecharging process and that all EVs available for cus-tomers are fully charged. Moreover, they considerdemand fulfillment as a centralized decision by theoperator. By contrast, ourmodel incorporates energy-level tracking, heterogeneous and stochastic chargingdurations of EVs, and how customers pick EVs basedon available energy levels under the range anxietystudied in Lim et al. (2015) and observed empiricallyin Kim et al. (2018). These considerations are realistic
He et al.: Charging an Electric Vehicle-Sharing FleetManufacturing & Service Operations Management, Articles in Advance, pp. 1–17, © 2020 INFORMS 3

but novel to the literature, resulting in a high-granularitycharacterization of EV-sharing operations. Moreover,those papers implicitly assume that charging facilitiesare available at all locations. In reality, charging facilitiesare scarce and costly to build in the early stage of thisbusiness, which our model explicitly addresses.
Finally, our paper also relates to the literature onEV-related service planning and operations man-agement in the conventional nonsharing contexts. Forinstance, Mak et al. (2013) apply robust optimizationto solve for battery-swapping locations along high-ways to accommodate exogenous EV flows. Ourmodeling of the plug-in battery-charging process isnovel and fundamentally different from that of bat-tery swapping, which requires negligible time. Limet al. (2015) compare potential mass EV adoptionunder different business settings (e.g., selling andleasing) with consumer anxieties about the range andresale of EVs. Jiang and Powell (2016) propose a risk-averse Markov decision process model for dynami-cally charging EVs in the presence of electricity spotpricevariations.Zhanget al. (2018) address the couplingbetween transportation and electrical grid networkswhen planning EV charging facilities. The chargingrequirement also brings new challenges to freight lo-gistics services when employing EVs. Schneider et al.(2014) and Desaulniers et al. (2016) formulate EVrouting problems with charging schemes under time-window constraints and propose-optimization al-gorithms. The key distinction of our work from thosepapers is the explicit characterization of the coupledcharging and repositioning operations as well as thedistributions of EV energy levels, which are central inthe EV-sharing context.
3. EV-Sharing System Planningand Operations
We model the fleet operations in the EV-sharingsystem using a queuing network. Planning charg-ing infrastructure includes charging site selection andcharger installation, which configures the network.We use binary decision variable Xi to denote whetherthe operator deploys any charger in zone i ∈ (, where( is the set of zones that form the service region. Atselected site i (i.e., Xi � 1), the operator further spec-ifies the number of chargers Yi.
We consider a multiclass open queuing networkconsisting of single-server nodes for the demandzones, infinite-server nodes for the roads, and mul-tiserver nodes for the charging sites. Constructedfrom a vehicle’s perspective, EVs are viewed as theentities in the queuing network. We briefly explaineach type of node and its connections before thedetailed discussions in the following subsections.
• Each demand zone is considered as a single“server.” An “arrival” event indicates that an EV is
droppedoff inazone,anda“departure” event indicatesthat an EV leaves a zone. The available EVs that waitin zone iwill be picked up by customers at the servicerate that is endogenously determined by the de-mand rate and customers’EV-picking behavior. Notethat EVs are differentiated by their energy levels,and customers tend to pick available EVs with thehighest energy. Thus, each demand node is mod-eled as a multiclass M/M/1 queue with preemptive-repeat priority and class-dependent service rates inSection 3.2.• The roads are modeled as M/G/∞ nodes with
generally distributed travel times, because EVs leavinga demand zone can immediately get on the road (enter“service”). We choose to model the transit trafficusing an infinite-server queue because it has beendiscussed in various settings for traffic on a long roadwith free overtaking (Daley 1976) and also commonlyused in vehicle sharing studies (e.g., George and Xia2011, He et al. 2017).• The charging node in zone i, if available, is
represented by an M/G/Yi queue where Yi specifiesthe number of chargers. Its service time distributiondepends on the specific charging policy, which wewill analyze in Section 3.3 under a charging-up-topolicy motivated by the data.• Nodes in the network interact with each other
through themovements of vehicles. Instead of using aclosed queuing network, our model “loosely” con-nects all nodes by the mean flow balance in each nodeand the expected total fleet size in the system for thepracticality and tractability reasons. First, in reality,the number of EVs in the system is not always con-stant. We characterize the expected total fleet size asthe system’s capacity. Second, although the closedqueuing networks in George and Xia (2011) and Heet al. (2017) preserve product-form solutions, it is notthe case in our problem. In those papers, all vehiclesare homogeneous, and thus their networks only consistof infinite-server nodes with generally distributed ser-vice times and single-server nodes with exponentialservice times, which fall into the class of BCMP (Baskett,Chandy, Muntz and Palacios) networks (Baskett et al.1975). Our challenge here is that EVs are nonidenticalby their energy levels, which prohibits use of theBCMP network. Nonetheless, it is realistic and im-portant to explicitly differentiate EVs by energy levelin this study. In Section 3.4, we discuss the interactionamong nodes and the integration of all modelingcomponents into an optimization model.The key assumption underlying the queuing net-
work is the Poisson vehicle arrivals and departures,which have been widely adopted to model vehicularflows (e.g., Freund et al. 2019 in bike sharing). In whatfollows, we first examine this assumption using anoperational data set from car2go in San Diego.
He et al.: Charging an Electric Vehicle-Sharing Fleet4 Manufacturing & Service Operations Management, Articles in Advance, pp. 1–17, © 2020 INFORMS
3.1. Poisson Vehicle Arrivals and DeparturesWe collected one-month records of EVs within theentire service region of 16 zip code areas (as zones)every five minutes from car2go in March 2014. Theattributes recorded include time stamps, locationcoordinates, battery energy levels, and charging status(i.e., being charged or not) for each idle EV. For thepurpose of this study, we translate the time-stampeddata into trip-level data. We identify 19,380 trips (withtravel times longer than 10 minutes) with origins anddestinations, energy consumption, and travel times.
We conduct statistical testing for the Poisson ve-hicle arrival and departure assumption for the entiresystem instead of individual zones because the samplesizes become too small for each zone at the hourlylevel. We set up the tests following Kim and Whitt(2014), who examine the classical conditional uniformproperty of Poisson process. That is, conditional onthe number of arrivals (departures) n in any interval,the n-ordered arrival (departure) times are indepen-dently and identically distributed random variableswith uniform distribution along the interval. Becausethe trip records are time stamped at every five minutes,the recorded customer arrival (departure) time (i.e., thetrip start (end) time) is not continuous. Therefore, weconstruct tests for the discrete uniform distribution.
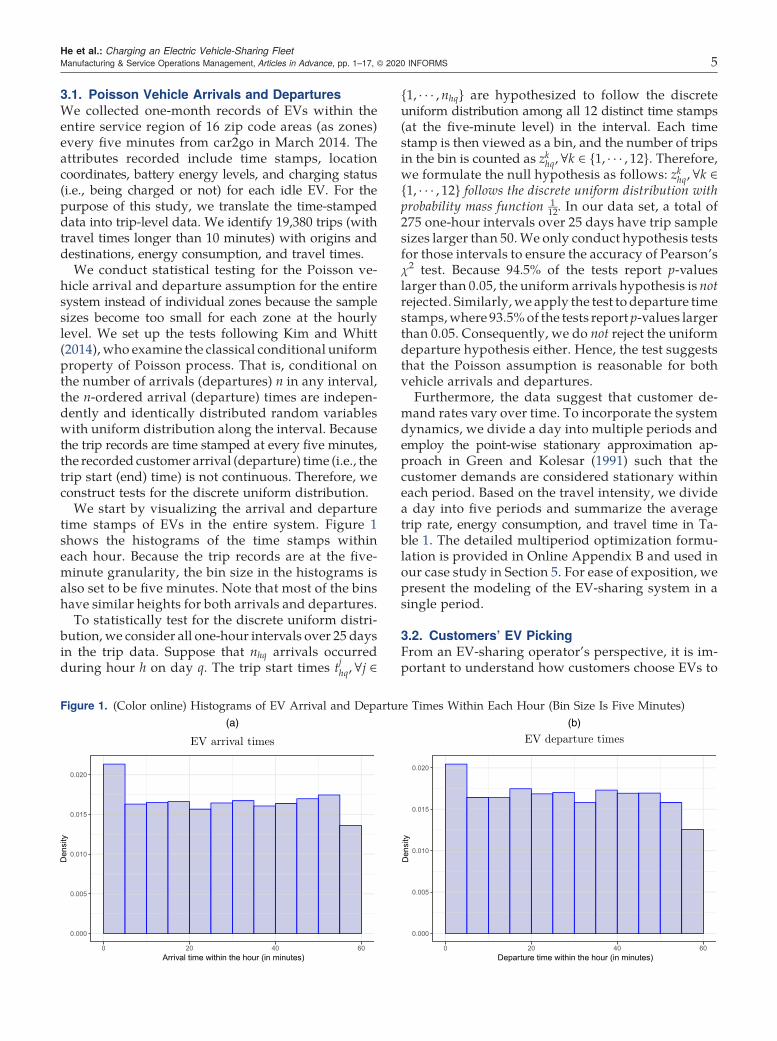
We start by visualizing the arrival and departuretime stamps of EVs in the entire system. Figure 1shows the histograms of the time stamps withineach hour. Because the trip records are at the five-minute granularity, the bin size in the histograms isalso set to be five minutes. Note that most of the binshave similar heights for both arrivals and departures.
To statistically test for the discrete uniform distri-bution, we consider all one-hour intervals over 25 daysin the trip data. Suppose that nhq arrivals occurredduring hour h on day q. The trip start times tjhq,∀j ∈
{1, · · · ,nhq} are hypothesized to follow the discreteuniform distribution among all 12 distinct time stamps(at the five-minute level) in the interval. Each timestamp is then viewed as a bin, and the number of tripsin the bin is counted as zkhq,∀k ∈ {1, · · · , 12}. Therefore,we formulate the null hypothesis as follows: zkhq,∀k ∈{1, · · · , 12} follows the discrete uniform distribution withprobability mass function 1
12. In our data set, a total of275 one-hour intervals over 25 days have trip samplesizes larger than 50.We only conduct hypothesis testsfor those intervals to ensure the accuracy of Pearson’sχ2 test. Because 94.5% of the tests report p-valueslarger than 0.05, the uniform arrivals hypothesis is notrejected. Similarly,we apply the test to departure timestamps,where 93.5%of the tests report p-values largerthan 0.05. Consequently, we do not reject the uniformdeparture hypothesis either. Hence, the test suggeststhat the Poisson assumption is reasonable for bothvehicle arrivals and departures.Furthermore, the data suggest that customer de-
mand rates vary over time. To incorporate the systemdynamics, we divide a day into multiple periods andemploy the point-wise stationary approximation ap-proach in Green and Kolesar (1991) such that thecustomer demands are considered stationary withineach period. Based on the travel intensity, we dividea day into five periods and summarize the averagetrip rate, energy consumption, and travel time in Ta-ble 1. The detailed multiperiod optimization formu-lation is provided in Online Appendix B and used inour case study in Section 5. For ease of exposition, wepresent the modeling of the EV-sharing system in asingle period.
3.2. Customers’ EV PickingFrom an EV-sharing operator’s perspective, it is im-portant to understand how customers choose EVs to
Figure 1. (Color online) Histograms of EV Arrival and Departure Times Within Each Hour (Bin Size Is Five Minutes)
He et al.: Charging an Electric Vehicle-Sharing FleetManufacturing & Service Operations Management, Articles in Advance, pp. 1–17, © 2020 INFORMS 5

fulfill their travel needs. For this purpose, we firstdistinguish EVs by their energy levels. Specifically,we use e to label the energy levels of EVs and dis-cretize the range of energy levels into a finite set% � {0, 1, . . . , e}, where e is the highest energy level.That is, we can map the actual battery levels into thediscretized energy levels. For example, if the batterycapacity is 20 kWh and e � 10, one unit of energy levelrepresents 2 kWh. Online Appendix A provides atable of key notations in this paper.
In EV-sharing systems, customers usually haveaccess to the energy-level information of EVs throughthe website or mobile applications. A customer to travelfrom zone i to zone j will seek in zone i an available EVthat has at least eij amount of energy remaining, where eijis the energy consumed by a customer trip from i to j.If there is no available EV or all available EVs do nothave sufficient energy (i.e., e < eij) in zone i, the de-mandwill be lost. Otherwise, there are three potentialmodes of customer EV-picking behavior:
1. The “indifference” mode assumes that the cus-tomer will randomly pick up an EV among theavailable ones with sufficient energy.
2. The “angel” mode assumes that the customerwill choose the EV with the least (yet sufficient) amountof energy so as to leave EVs with higher energy levelsto other customers.
3. The “risk-averse”modeassumes that the customerwill choose the EV with the highest energy level to min-imize the risk of battery depletion before the trip ends.
We choose to model the customers’ EV-pickingbehavior based on the risk-averse mode. First, therisk-averse mode is empirically verified. Kim et al.(2018) observe that in car2go San Diego, EV rangeanxiety impelled EV-sharing customers to strictly preferhigher energy levels to lower ones. Second, from theoperator’s perspective, the risk-averse mode is moreconservative to assume than the other two modes.The resulting charging and repositioning schemes arereliable even if the realized customers’ EV-picking be-havior may deviate from such an assumption. Third,the assumption of the risk-averse mode admits tractablemodeling of the demand-fulfillment process with highgranularity. By contrast, it is challenging to integrate theother two behavioral modes into our model, which weleave for future research.
With the risk-aversemode of EVpicking, the demand-fulfillment process becomes highest-energy-first-out(HEFO), as shown in Figure 2, which allows us tomodel it asamulticlassM/M/1 queuewith preemptive-repeat priority and class-dependent service rates. Spe-cifically, recall that zone i is a “server,” whose servicerate depends on the energy levels of the available ve-hicles. The service rate for an EV with energy level e isdie � ∑
j∈)iedij, where dij is the demand rate for trips
from zone i to zone j and )ie � { j : eij ≤ e} is the set ofdestinations reachable by energy level e from origin i.Suppose that we divide all EVs into e classes accord-ing to their energy levels (i.e., class e for EVs withenergy level e). Under the risk-averse mode, an EVcan be “served by zone i” only when all EVs of higherclass (i.e., with higher energy levels) have been taken,which clearly suggests the preemptive priority rule—class e has the highest priority and class 0 has thelowest priority.Let ψije be the fulfilled demand rate for customers
traveling from i to j using EVs with energy level e. Theload of class e can be defined as
αie �∑
j∈)ieψije
die(1)
for zone i. Furthermore, because customers are notrequired to inform the operator about their destina-tions, the operator is not able to ration the demand tofulfill by trip destinations. Therefore, the satisfiedcustomer trips follow the proportional rule as
ψije � dijdie
∑j∈)ie
ψije,∀j ∈ )ie. (2)
We next express the expected queue lengths for EVswith different energy levels in zone i in terms of theload αie. We apply the queue-length formula for themulticlassM/G/1 queue with preemptive priority in
Table 1. Average Hourly Customer Trip Rate, Energy Consumption per Trip, and TravelTime per Trip
Period Hourly trip rate Per-trip energy consumption (kWh) Travel time (in minutes)
7 a.m.–9:59 a.m. 38.57 1.19 32.8210 a.m.–12:59 p.m. 39.93 1.20 31.291 p.m.–3:59 p.m. 45.12 1.19 27.154 p.m.–6:59 p.m. 48.74 1.34 27.367 p.m.–6:59 a.m. 17.2 1.28 33.50
Figure 2. (Color online) EV Picking by “Risk-Averse”Customers with Range Anxiety
He et al.: Charging an Electric Vehicle-Sharing Fleet6 Manufacturing & Service Operations Management, Articles in Advance, pp. 1–17, © 2020 INFORMS

Shortle et al. (2018). Note that this formula is derivedunder the assumption that interrupted entities re-sume “service” from the point of interruption. In oursetting, however, the interrupted (lower-energy) EVsstart over the “service” after the interruption in thedemand zone. Nevertheless, given the exponentialservice time, this discrepancy is irrelevant in view ofthe memoryless property (Shortle et al. 2018). Hence,with the mean 1
dieand the second moment 2
d2ieof the
exponential service time of class e, the average number(queue length) of EVs with energy level e in zone i isgiven by
Lie �αie 1 −∑e
e′�e αie′ + die∑e
e′�eαie′die′
[ ]1 − αie − αi e−1( ) − · · · − αi e+1( )( )
1 − αie − αi e−1( ) − · · · − αie( ) , ∀e < e, (3)
Lie � αie
1 − αie. (4)
3.3. Charging ProcessThe operator also needs to closely monitor the EVcharging process, which is central to the availability ofEVs. To focus on a practical charging process, webegin this subsection by analyzing the energy levelsof EVs in the car2go data. In the data set, as describedin Section 3.1, we identify 1,472 trips that wentthrough a charging process with at least a 10% energylevel increase. We present their energy-level dis-tributions(in percent) on entering and leaving a chargingprocess in Figure 3.
Car2go sets a recharge threshold at the 20% energylevel, under which an EV must be moved to charge.Figure 3(a) shows that the energy levels of most EVswhen entering a charging process are around thisthreshold. Occasionally, EVs with an energy levelhigher than 20% can also be sent to charge. We referto car2go’s practice as a threshold-activated chargingpolicy. By contrast, we consider a proactive chargingpolicy where the operator can choose to charge EVswith different energy levels (lower than e).
After discussing when to charge EVs, we examinewhen to finish charging. Figure 3, (b)–(d), shows theenergy levels of EVs departing from a charging process.These histograms suggest that the energy levels aftercharging could depend on location. As implementedby car2go, EVs can be charged to 50% or 100% beforebeing released from the charging sites. These obser-vations motivate us to study a charge-up-to policy toreflect car2go’s practice. That is, the operator chargesall EVs to energy level e. For ease of exposition, weconsider a single parameter e—that is, the highestenergy level. In practice, e can potentially vary by time
or location (which a direct extension of our modelcan capture).Wemodel such a charging process at each site iwith
Yi chargers as an M/G/Yi queue. Under the proactivecharge-up-to policy, the EVs that arrive with energylevel e follow a Poisson process with rate λie (which iscontrolled by the operator), and the charging time ise−eu , where u denotes the charging power. Therefore,the charging time of any EV follows a discrete distri-bution, being e−e
u with probability λie∑e<e λie
, withmean ai �∑e<e
e−eu
λie∑e<e λie
and variance b2i � ∑e<e
(e−e)2u2
λie∑e<e λie
− a2i .
Then we approximate the expected waiting time inthe queue (excluding the charging time)Wq
i by usingthe heavy-traffic formula fromWhitt (1993) as follows:
E Wqi
[ ] � ρiaiYi 1 − ρi
( ) c2a + c2s2
,
where the utilization ratio ρi � ai∑
e<e λie
Yi, c2s � b2i
a2i, and
c2a � 1. The heavy-traffic approximation is asymp-totically accurate as ρi approaches 1. Such approxi-mation is particularly appropriate in our setting,where the charging resources, either constrained incar2go’s practice or optimized in our solution, areheavily utilized. In fact, for all the numerical instancesin Section 5, the values of ρi are sufficiently high(above 0.96) in the peak period (when the fleet sizeconstraint is binding, and this formula is relevant).Note that we choose not to use the alternative heavy-
traffic approximation from Kingman (1965),ai( 1ρi+ρic2s )2Yi(1−ρi) ,
which is more common in the literature (e.g., Shortleet al. 2018). This alternative formula would be struc-turally less tractable in the optimization model inSection 3.4, and it would only negligibly improvethe accuracy given the close-to-one ρi in our setting.Therefore, the expected time an EV spends at site i,
including both the time in the queue and the timebeing charged, is given by
E Wi[ ] �E Wqi
[ ] + ai �∑
e<ee−e( )2u2 λie
2Y2i − 2Yi
∑e<e
e−eu λie
+∑e<e
e − eu
λie∑e<e λie
.
By Little’s law, the expected number of vehicles Qi atcharging site i is given by
Qi �∑e<e
λie
( )E Wi[ ]
�∑
e<e λie( )∑e<ee−e( )2u2 λie
2Y2i − 2Yi
∑e<e
e−eu λie
+∑e<e
e − eu
λie. (5)
He et al.: Charging an Electric Vehicle-Sharing FleetManufacturing & Service Operations Management, Articles in Advance, pp. 1–17, © 2020 INFORMS 7

Because the utilization ratio ρi ≤ 1, we have
Yi ≥∑e<e
e − eu
λie. (6)
3.4. The Optimization ModelHavingdescribed the key features inEVsharing—namely,the customers’EV-picking behavior and the operator’scharging-up-to policy—we develop an integrated op-timization model for the design and operation of asystem with m EVs.
Zooming out the view to the entire service region,the EV-sharing fleet moves across and within zones.EV movements consist of both transit trips by cus-tomers and repositioning trips by the operator, whichwe characterize as aggregated EV flows at differentenergy levels. As suggested by Section 3.1, we model
the transit trips from zone i to j with EVs at energylevel e on departure as a Poisson process with rateψije.Because only those EVs with energy level e ≥ eij arefeasible for such a trip, we have ψije � 0 for e < eij.Moreover, to rebalance the system in the presence ofasymmetric EV flows by customers, the operatorneeds to carry out repositioning trips from zone ito j with rate φije for EVs with energy level e. Sup-pose that an EV consumes erij energy for repositioningfrom zone i to j. We have φije � 0 for e < erij. The op-erator also dispatches workers to move EVs withineach zone: EVs with energy level e < e enter thecharging site in zone i (if open) with rate λie and departfrom the charging process with rate ηi after reachingenergy level e.Under the Poisson assumption, the actual number
of EV movements (e.g., customer and repositioning
Figure 3. (Color online) Histogram of EV Energy Levels in Percent upon Entering and Leaving a Charging Process
Note. (a) Energy levels before charging in the entire system; (b) Energy levels after charging at zones 92105, 92109, and 92115 (by zip code); (c)Energy levels after charging at zones 92102, 92103, 92110, and 92116 (by zip code); (d) Energy levels after charging at zones 92101, 92106, 92107,and 92108 (by zip code).
He et al.: Charging an Electric Vehicle-Sharing Fleet8 Manufacturing & Service Operations Management, Articles in Advance, pp. 1–17, © 2020 INFORMS

trips) is stochastic. In practice, the operator can im-plement the repositioning by splitting Poisson EVflows (e.g., blocking a proportion of arrived EVsfrom customers for repositioning workers). Withnecessary repositioning, the operator maintains thebalance of EVs at various energy levels in the sys-tem. The following energy-flow balance equations char-acterize the EV flows in each zone and in the charg-ing sites:
∑j∈(
ψji e+eji( ) + φji e+erji( )⎛⎜⎜⎜⎜⎜⎜⎜⎜⎝
⎞⎟⎟⎟⎟⎟⎟⎟⎟⎠� ∑
j∈(ψije + φije
( )+ λie, ∀i ∈ (, e ∈ %\e,
(7)
ηi �∑j∈(
ψije + φije
( )+ λie, ∀i ∈ (, (8)
ηi �∑e∈%
λie, ∀i ∈ (. (9)
The balance equations (7) and (8) trace the EV flowswith energy levels e < e and e, respectively, for eachzone i. In Equation (7), the term
∑j∈((ψji(e+eji) + φji(e+erji))
summarizes the total EV inflows into zone i, whoseenergy level on arrival is e. The term on the right-handside (RHS),
∑j∈((ψije + φije) + λie, represents the total
outflow from zone i by transit trips and reposition-ing trips for fleet rebalance and to the charging site atzone i. Note that this equation concerns EV inflowsfrom other zones, and therefore, their energy levelsare less than e. For EVswith energy level e, Equation (8)indicates that the inflow comes only from the charg-ing site in zone iwith rate ηi, and the term on the RHS,∑
j∈((ψije + φije) + λie, is the total EV outflow with en-ergy level e. The last equation (9) shows the flowbalance at charging site i.
The above-mentioned energy-flow balance equa-tions connect the flow variables—namely,ψije,φije, λie,and ηi. We next integrate the two features of EVsharing (i.e., the customers’ EV-picking and operator-controlled charging processes) using a fleet size con-straint. As modeled in Sections 3.2 and 3.3, the ex-pected number of EVs that idle in zone i and stay atchargingsite i is given by Lie andQi in Equations (3)–(5).To derive the expected numbers of EVs in anotherstatus (e.g., in transit by customers and repositioningby the operator), we apply Little’s law. That is, theexpected number of EVs traveling from zone i to jwithinitial energy level e is tijψije for customer transit andsijφije for repositioning, where tij and sij are the ex-pected travel time in transit and repositioning be-tween zones, respectively. Let sii be the expectedtravel time for EVs entering and leaving the chargingsites. The expected number of EVs repositioned toand from the charging sites is given by sii(∑e<e λie + ηi)in zone i. The sum of all these EV quantities is no
larger than the fleet size m, which the following fleetsize constraint imposes:
∑i∈(
Qi +∑e∈%
Lie
( )+∑
i∈(
∑j∈(
∑e∈%
tijψije + sijφije
( )+∑
i∈(sii
∑e<e
λie + ηi
( )≤ m.
(10)
Let p be the revenue from customer usage per unittime per EV, let c be the repositioning cost per unittime per EV, let fi be the fixed setup cost of a chargingsite in zone i, and let g be the installation cost percharger. Suppose that themaximumnumber of chargersallowed is yi in zone i. Recall that Xi ∈ {0, 1} indicateswhether to offer charging service, and Yi ∈ R+ in-dicates the number of chargers installed in zone i. Weformulate the charging infrastructure planning andfleet operations problem for EV sharing as a nonlinearoptimization problem (NLP):
maxX,Y,f,ψ
α,λ,η,L,Q
p∑i∈(
∑j∈(
∑e∈%
tijψije − c∑i∈(
∑j∈(
∑e∈%
sijφije
− c∑i∈(
sii∑e<e
λie + ηi
( )−∑
i∈(fiXi + gYi
( )(s.t.) constraints (1)–(10),
Yi ≤ yiXi, ∀i ∈ (,
φije � 0, ∀i, j ∈ (, e < erij or e > �e,
ψije � 0, ∀i, j ∈ (, e < eij or e > �e,
0 ≤ αie ≤ 1, ∀i ∈ (, e ∈ %,
Yi,φije, ψije, λie, ηi,Lie,Qi ≥ 0,
∀i, j ∈ (, e ∈ %,
Xi ∈ 0, 1{ }, ∀i ∈ (.
In this formulation, the objective is to maximize theoperator’s expected annual profit, which is the reve-nue from transit trips by customers net of the repo-sitioning cost by workers and the investment incharging infrastructure. Vehicle flow rates (ψ,f,λ,η)and fixed costs ( f , g) are all annualized. The addi-tional constraint Yi ≤ yiXi ensures that no charger willbe installed without a charging site. As discussed inSection 3.1, the travel demand rates are time varying.We thus adopt the point-wise stationary approxi-mation approach (Green and Kolesar 1991) to in-corporate system dynamics over multiple periods.The detailed formulation for multiple periods is pro-vided in Online Appendix B.
4. Solution ApproachProblem (NLP) is nonlinear and nonconvex owingto the fractional constraints (3)–(5) with quadraticterms that define queue lengths Lie and Qi. Fractional
He et al.: Charging an Electric Vehicle-Sharing FleetManufacturing & Service Operations Management, Articles in Advance, pp. 1–17, © 2020 INFORMS 9

constraints are common in queuing–location models butknown to be difficult to tackle. In this section, we developalternative formulations that are computationally efficientto solve. The idea is to overestimate (respectively, un-derestimate) Lie andQe to generate a lower (respectively,upper) bound of the optimal (NLP) objective value.
4.1. Lower BoundTo obtain a lower bound for (NLP), we first develop atransformation of Lie into Lie in Lemma 1, and then weconstruct overestimates of Lie in Lemma 2 and those ofQi in Lemma 3 as follows. We relegate the proofs andadditional computational details to Online Appendix C.
Lemma1. The average number of idle EVs waiting in zone iis given by∑
e∈%Lie �
∑e∈%
Lie, where
Lie �0, if e � 0,die−di e−1( )( )∑e
e′�eαie′die′
1−∑ee′�e αie′
, if e � 1, . . . , e. (11)⎧⎪⎪⎪⎪⎨⎪⎪⎪⎪⎩
Although Lie is a ratio of quadratic terms in αie in (3),Lemma 1 shows that
∑e∈% Lie can be effectively sim-
plified as a sum of linear ratios. When solving theoptimization problem, we can safely rewrite the defi-nition of Lie as
Lie ≥0, if e � 0,die−di e−1( )( )∑e
e′�eαie′die′
1−∑ee′�e αie′
, if e � 1, . . . , e. (12)⎧⎪⎪⎪⎨⎪⎪⎪⎩
Lemma 2. For any e > 0 and any constant mie > 0, if Liesatisfies the constraint
Lie + 1 − ∑ee′�e
αie′
( )( )2≥
die − di e−1( )( )( ∑e
e′�eαie′die′
+ mie
)2mie
+ Lie − 1 − ∑ee′�e
αie′
( )( )2,
(13)then Lie also satisfies the constraint (12).Lemma 3. For any constants ni, wi > 0, if Qi satisfies theconstraints
Qi −∑e<e
e − eu
λie + Zi
( )2
≥∑
e<ee−e( )2ni
λie+ni∑
e<e λie
u
( )2+ Qi −
∑e<e
e − eu
λie − Zi
( )2,
2Yi −∑e<e
e − eu
λie
( )2≥ Zi + Xiwi( )2
2wi
+ ∑e<e
e − eu
λie
( )2, (14)
⎧⎪⎪⎪⎪⎪⎪⎪⎪⎪⎪⎪⎪⎪⎪⎪⎪⎪⎪⎪⎪⎪⎪⎪⎪⎪⎪⎪⎪⎪⎪⎪⎪⎪⎪⎪⎪⎪⎪⎪⎪⎪⎪⎪⎪⎪⎪⎪⎨⎪⎪⎪⎪⎪⎪⎪⎪⎪⎪⎪⎪⎪⎪⎪⎪⎪⎪⎪⎪⎪⎪⎪⎪⎪⎪⎪⎪⎪⎪⎪⎪⎪⎪⎪⎪⎪⎪⎪⎪⎪⎪⎪⎪⎪⎪⎪⎩
then Qi also satisfies the modified constraint (5) with areplacement of the “�” sign with the “≥” sign.
Using the constraints from Lemmas 2 and 3, weprovide a lower bound on the optimal objective valueof (NLP) in the following proposition.
Proposition 1. A lower bound problem for (NLP) can beformulated as an MISOCP by replacing
∑e∈% Lie with∑
e∈% Lie in (10) and replacing constraints (3)–(5) in (NLP)with constraints (13) and (14).
We call the resulting formulation (SOCP-LB).The formulation is an MISOCP because (13) and(14) can be converted into second-order cone (SOC)constraints in the standard two-norm form. For ex-ample, (13) is equivalent to
Lie + 1 − ∑ee′�e
αie′
( )≥
die−di(e−1)( )∑e
e′� eαie′die′
+mie
( )/ mie
√
Lie− 1−∑ee′�e αie′( )
2
,
where the left-hand side is ensured to be nonnegative,as discussed in Online Appendix C. Meanwhile, allthe other constraints and the objective function arelinear in the decision variables. State-of-the-art soft-ware such as GUROBI provides standard solvers forMISOCP. For a comprehensive review of MISOCP,please also refer to Alizadeh and Goldfarb (2001).Because the optimal solution from (SOCP-LB) is afeasible solution to (NLP), the optimal objective valueof (SOCP-LB) is no greater than that of (NLP).
4.2. Upper BoundTo obtain an upper bound for (NLP), we underesti-mate
∑e∈% Lie and Qi in this subsection.
Lemma 4. If Lie satisfies constraints (3) and (4) in (NLP), then∀ec ∈ {1, 2, . . . , e}, ∑
e∈% Lie satisfies the SOC-representableconstraint ∑
e∈% Lie + 2 −∑ee�ec αie
2
( )2≥
∑e∈% Lie +∑e
e�ec αie
2
( )2+ dec
de. (15)
Although inequality (15) is valid for all ec ∈ {1, 2, . . . , e},we only need to include a selection of ec to avoid anexcessive number of conic constraints, as discussedin Online Appendix C. We next underestimate Qi bydropping the fractional term in constraint (5) as follows:
Qi ≥∑e<e
e − eu
λie. (16)
We then provide the upper bound for (NLP) inProposition 2.
Proposition 2. The upper bound problem for (NLP) can beformulated as an MISOCP by replacing constraints (3)–(5)in (NLP) with constraints (15) and (16).
He et al.: Charging an Electric Vehicle-Sharing Fleet10 Manufacturing & Service Operations Management, Articles in Advance, pp. 1–17, © 2020 INFORMS

We call the resulting formulation (SOCP-UB).Accordingto Lemma 4 and constraint (16), the optimal solution to(NLP) is a feasible solution to (SOCP-UB). Therefore, theoptimal value of (SOCP-UB) is higher than that of (NLP).
The above-proposed lower bound (LB) and upperbound (UB) solution approach has three merits. First,the optimality gap between (SOCP-LB) and (SOCP-UB) is small, given adequate fleet size m, as tested inour case study. Second, this approach is computa-tionally efficient. All numerical instances in our casestudy can be solved in less than 10minutes (includingparameter tuning for mie, ni, and wi) using a personallaptop. Third, for EV-sharing practitioners, ourMISOCPformulations are relatively straightforward to im-plement by calling a commercial solver. By contrast,state-of-the-art solution algorithms for the quadraticsum-of-ratios fractional programs problem, to which(NLP) reduces, are significantly more intricate. Forexample, the recent algorithm in Jiao and Liu (2017)involves an iterative procedure of linearization, branch-ing, and bounding that can be elusive for tuning. Hence,we solve (SOCP-LB) for the feasible and near-optimalsystem design in our following case study.
5. Case Study andManagerial ImplicationsBased on the above-mentioned optimization modeland the solution approach, this section discusses howto enhance the viability and profitability of EV sharinginpractice.Wefirst describe the settingof our case studyand propose a design of charger deployment. Then wefocus on answering five questions on different practicalaspects of EV sharing:
1. How does the accuracy of our solution approachdepend on fleet size and other system parameters?
2. Is there an economically efficient yet easy-to-implement charging policy?
3. Should EV sharing rely on a public or privatecharging network?
4. What are the implications of technology advance-ments?
5. How does urban spatial structure affect EV-sharing operations?
Finally,we validate ourfindingswith theCaliforniaHousehold Travel Survey for San Diego in OnlineAppendix Section D.4.
5.1. Case Study: Car2go in San DiegoOur case study adopts an urban setting of 16 zip codezones in San Diego, California, where car2go ran anEV-sharing program in 2011–2016; it quit the SanDiego market at the end of 2016. We identify 19,380EV-sharing trips and 379 EVs from the data set, asdescribed in Section 3.1. Additional information aboutthe trips, charging sites, EV specifications, and cost
parameters are available in Online Appendix Sec-tion D.1.One particular challenge in estimating trip demand
is dealing with missing data. There are primarily twocauses of the missing-data issue in our trip records:(1) the observed records were censored by vehicle avail-ability and energy level because the demand was lostwhen there was no vehicle nearby with a sufficient en-ergy level, and (2) occasionally, no information was re-ceived because of unstable application programminginterface connections to the website. Therefore, wedevelop a convex optimization model and a tailoredalgorithm to recover the average demand based onthe framework of tensor completion (e.g., Goldfarband Qin 2014). The detailed procedure of demand es-timation is provided in Online Appendix Section D.2.In addition, we divide a day into five periods with
different demand profiles, as described in Section 3.1.Hence, throughout the case study, we solve the multi-period problem (provided in Online Appendix B) usingour proposed solution approach developed in Section 4.
5.2. Proposed Design and OperationsWe solve the LB problem (SOCP-LB) to obtain thedesired locations of charging sites, the associatednumber of chargers, and the EV flows of transit andrepositioning trips at each energy level. ByProposition 1,the LB solution is a feasible solution to the originalproblem (NLP). Moreover, the LB solution is rea-sonably accurate: the LB profit from (SOCP-LB) is$1.62 × 10⁶, whereas the UB profit from (SOCP-UB) is$1.69 × 10⁶, implying a 4.19% optimality gap.Our result suggests that the operator can serve 95.3%
of the total demand by using only three charging sites withproactive repositioning activities. Figure 4 shows thatour proposed design consists of three charging sites inzones 1, 7, and 14. The selected sites are either in ornext to the zones with high demand flow volume(including both inflows and outflows). By having 40chargers in zone 1, which is downtown SanDiego, theoperator can use the high traffic by customer trips tobring EVs to chargers. Zones 7 and 14 are both rec-ommended to have 16 chargers such that these char-gers are easily accessible fromnearby zones in thewestand east, respectively.
5.3. Fleet Size and Bound PerformanceThe effectiveness of the proposed design and oper-ations motivates us to examine several paths to im-prove EV-sharing-service operations in practice. Firstof all, we need to test the accuracy of the proposedsolution approach for wide ranges of parameter values.As shown previously, with 379 EVs in the car2go
example, our proposed solution approach incurs an
He et al.: Charging an Electric Vehicle-Sharing FleetManufacturing & Service Operations Management, Articles in Advance, pp. 1–17, © 2020 INFORMS 11

optimality gap of 4.19%. To further investigate thesensitivity of the bound performance with respect tofleet size, we vary fleet size and solve for both theLB and UB profits using (SOCP-LB) and (SOCP-UB)formulations. Figure 5 indicates that the optimalitygap becomes reasonably small—less than 8% once thefleet size becomes at least 70% of the baseline level.Figure 5 also suggests that car2go may have oversized itsEV fleet. A fleet size of 300, which is only 79.2% of thebaseline size of car2go’s fleet, is sufficient to generatemore than 98.0% of the baseline LB profit (or 93.6% ofthe baseline UB profit). Both the LB and UB profitsincrease little if further adding EVs. The optimalitygapwidenswhen thefleet size drops below 70%of thebaseline level, making it more difficult to infer theprofitability. However, given the trip demand vol-ume from the data, those scenarios are unrealisticbecause the fleet sizes deviate too much from theactual baseline level. We thus proceed to investigateother factors that affect car2go’s performance. For allthe numerical instances evaluated in Sections 5.4–5.7,the optimality gaps between the LB andUB profits areless than 5%, suggesting that the gap is insensitive tothe variation of the other parameter values within theconsidered ranges. For example, the average opti-mality gaps are 3.7% for perturbing charging power,4.2% for repositioning efficiency, 3.9% for batterycapacity, and 4.5% for charger availability.We believethat this suboptimality is insignificant and does notmask our managerial insights.
5.4. Proactive vs. Threshold-ActivatedCharging-up-to Policies
We next show that car2go could have improved itscharging operations. We examine the charging operations
in the proposed solution by checking the energy levelsofEVs. Figure 6(a) shows the energy-level distributionof EVs entering charging sites—that is,
∑i∈( λie aggre-
gated over all periods and then normalized into pro-portions with respect to each energy level e (here weevenly discretize the battery capacity into 15 energylevelswith the charging-up-to level e � 15). Thefigureindicates that it is optimal to proactively charge EVs fromvarying energy levels. Such a proactive charging policydiffers from car2go’s practice of a threshold-activatedcharging policy—that is, charging EVs simply whentheir energy levels drop below the 20% threshold (recallFigure 3).Despite its optimality, the proactive charging policy
may be challenging for practitioners to implement.The threshold-activated charging policy, by contrast,is more implementable given its “single-parameter”simplicity. Therefore, we are interested in whetherthe EV-sharing service provider can keep employ-ing a threshold-activated charging policy yet earn a
Figure 4. (Color online) Charging Sites and Daily Demand Flow Volume of Each Zone in San Diego
Figure 5. (Color online) LB and UB Profits in Fleet Size
He et al.: Charging an Electric Vehicle-Sharing Fleet12 Manufacturing & Service Operations Management, Articles in Advance, pp. 1–17, © 2020 INFORMS

higher profit simply by adjusting the charging acti-vation threshold.
Interestingly, Figure 6(b) shows that the profit isremarkably sensitive to the threshold, peaking at 40%level. In other words, the operator may recover asmuch as 98.1% of the optimal profit with the proactivecharging policy by raising the charging activationthreshold from 20% to 40% (with the charging infra-structure reoptimized). In fact, both the 40% threshold-activated charging policy and the proactive chargingpolicy outperform the 20% threshold-activated charg-ing policy because of two effects: (1) both policies boostthe overall energy level of the fleet, and consequently,both policies increase the trip demands’ fill rate, whichis driven by the customer EV picking behavior, and(2) both policies improve the efficiency of reposi-tioning operations as well as charger utilization; thisis because either too low or too high a charging acti-vation threshold incurs excessive repositioning tripsfor charging at suboptimal locations. Additional dis-cussions on these effects are available in Online Ap-pendix Section D.3. Proactive charging still generatesa slightly higher profit than 40% threshold-activatedcharging because the former saves the repositioningcost by flexibly charging some EVs near a chargingsite before they hit the 40% threshold at farther lo-cations. In sum, the EV-sharing-service provider mayreap a near-optimal profit with a simple threshold-activatedcharging policy by carefully choosing the threshold level.
5.5. Private vs. Public Chargers: Locationand Availability
Clearly, building private charging sites incurs a heavyup-front investment. If the EV-sharing operator shoul-ders this cost, the charging sites should be economically
deployed at optimal locations, as our proposed layoutdesign shows. In reality, however, car2go relied onpublic chargers to power its EVfleet. TheDepartment ofEnergy had promised to install 1,000 Blink chargers inSan Diego through ECOtality. Unfortunately, ECO-tality went bankrupt in 2013. Only about 400 chargershave been installed until recently. We find 386 publicchargers, with their location information obtainedfrom the U.S. Department of Energy (2017).We thus investigate to what extent using public
chargers at nonoptimized locations affects operatingprofits. A key challenge in using public chargers isthat their availability is not guaranteed. This is be-cause public chargers also face charging demandsfrom other EV users. By contrast, the operator canenjoy 100% availability with private chargers. To il-lustrate the impact of charger availability on thetrade-off between using public and private chargers,we consider two cases: (1) when using the publiccharging network, the operator has access to r% of the386 public chargers at given locations, where r% is theaverage charger availability, and (2) when using aprivate charging network, the firm is able to optimizethe allocation of an equivalent 386 × r% number ofchargers. In each case, we solve a modified version of(SOCP-LB) that ignores the fixed and variable chargerinvestment costs and maximizes the operating profit.Figure 7 shows the operating profits at different levelsof charger availability r% for both cases.Figure 7 indicates that charger availability is crucial to
the operating profits when collaborating with a publiccharging network. In particular, when the availabilityof the public charging network (e.g., ECOtality orBlink) is too low (< 25%), the associated operatingprofit is much lower than that from using private
Figure 6. (Color online) Comparison Between the Proactive Charging Policy and Threshold-Activated Charging Policies
Note. (a) Energy level distribution of EV flows (aggregated over all periods) entering charging sites under the proactive charging policy;(b) profits with different charging activation thresholds (dotted line) and the optimal profit with proactive charging (dashed line).
He et al.: Charging an Electric Vehicle-Sharing FleetManufacturing & Service Operations Management, Articles in Advance, pp. 1–17, © 2020 INFORMS 13

chargers because of the suboptimality of the chargerlocations. In that case, car2go should set up its owncharging network (while also taking charger invest-ment costs into account). If the public charging net-work increases the availability for car2go, the gap be-tween the two operating profits narrows and eventuallybecomes insignificant. Therefore, this profit gap indicatesthe value of optimizing charger locations.With sufficientavailability of public chargers, car2go should thenrely on public chargers and focus on effectively reposi-tioning EVs to charge at the right locations.
5.6. Technological AdvancementsEV-sharing operators are witnessing rapid advance-ments in EV technologies: First, the charging tech-nology is maturing. The rated level 2 charging poweris likely to increase tomore than 19 kW,which is aboutsix times the current 3.3 kW for car2go’s Smart ElectricDrive (Yilmaz and Krein 2013). Second, research anddevelopment in the energy density of the lithium-ionbattery are making continuous progress, pointing toan EV future with a longer per-charge range (Blomgren2017). Third, integrating autonomous vehicle tech-nologies into the EV business is another intriguingprospect (Fehrenbacher 2016). Unmanned operationsof EV repositioning and charging are expected to besignificantly cheaper than using human labor.
Seeing the trends, we next examine how thesetechnological advancements will impact EV-sharing-service operations. To this end, we perturb the valuesof charging power u, the battery energy capacity (or,equivalently, the highest energy level) e, and the costefficiency of vehicle repositioning 1
c. Figure 8 showsthe profit and total number of chargers in need inresponse to the parameter variations. We find thatthese technological factors throw impacts in differ-ent ways:
• Increasing the chargingpower significantly shortensthe expected charging time and subsequently reducesthe number of chargers needed. However, the profitincreases only marginally because the main cost com-ponents such as the repositioning cost and site invest-ment remain insignificantly affected.
• Increasing the battery capacity and the EV rangeincreases the profit because doing so not only reducesthe number of charging sites in need but also makescharging sites accessible at remote zones with lowerfixed costs. With a longer range, repositioning tripsfor charging become less frequent and more flexible.Therefore, the repositioning cost also drops. By contrast,the impact on the number of chargers needed is indirectand insignificant. This is because the minimum chargerquantity is determined by the total rate of electricityinjection into the fleet. Given the charging power, this
injection rate depends on the total energy usage bytransit and repositioning trips.• Reducing the per-unit repositioning cost directly
drives down the repositioning cost. Moreover, it al-lows building charging sites at less expensive loca-tions without a significant increase in repositioningcost, although the repositioning trips become longer.We summarize these observations into a twofold
prescription: when chargers are limited in the earlystage, the EV-sharing operator should first considerenhancing the charging power to alleviate its heavydependence on charging infrastructure. When char-gers become increasingly available, the operator shouldconsider expanding battery capacity and reducing therepositioning cost to enhance its profitability.
5.7. Urban Spatial StructureWe finally examine EV-sharing operations undermore generic urban settings. As cities grow, they fillspace naturally from the bottom up and/or by designfrom the top down, driven by a myriad of socioeco-nomic factors (Batty 2013). Consequently, cities differin their centrality of spatial structures: Some cities aremonocentric, where most of the activities are con-centrated in the central business district, resulting inthe outward ebb and inward flow of trips throughouta day. Other cities are more distributed and poly-centric, resulting in tripswithwidespread origins anddestinations (Louf and Barthelemy 2013).To expand EV sharing in cities around the globe, we
are interested in how EV-sharing-service operationsare affected by urban spatial structure, particularly interms of the centrality of the trip pattern. To for-malize the notion of centrality, we adopt the defini-tion of “start-to-complete networks” from the studyby Bimpikis et al. (2019, p. 752) (which investigates aride-sharing platform’s pricing and compensationpolicies). Let matrix Aξ represent the trip pattern of a
Figure 7. (Color online) Operating Profits of Using Publicand Private Chargers
He et al.: Charging an Electric Vehicle-Sharing Fleet14 Manufacturing & Service Operations Management, Articles in Advance, pp. 1–17, © 2020 INFORMS

city with n zones. For a trip originating from zone i,the element aξij inAξ is the probability that this tripwillend at zone j. Moreover, Aξ is parameterized byξ ∈ [0, 1]:
Aξ � 1 − ξ( )AD + ξAC,
where
AD �
0 1/ n − 1( ) · · · 1/ n − 1( )1/ n − 1( ) 0 · · · 1/ n − 1( )
..
. ... . .
. ...
1/ n − 1( ) 1/ n − 1( ) · · · 0
⎡⎢⎢⎢⎢⎢⎢⎢⎢⎢⎢⎢⎢⎢⎢⎢⎢⎢⎢⎢⎢⎢⎢⎢⎢⎢⎢⎢⎢⎢⎢⎢⎢⎢⎢⎢⎢⎢⎢⎢⎢⎢⎢⎢⎢⎣⎤⎥⎥⎥⎥⎥⎥⎥⎥⎥⎥⎥⎥⎥⎥⎥⎥⎥⎥⎥⎥⎥⎥⎥⎥⎥⎥⎥⎥⎥⎥⎥⎥⎥⎥⎥⎥⎥⎥⎥⎥⎥⎥⎥⎥⎦
and
AC �0 1/ n − 1( ) · · · 1/ n − 1( )1 0 · · · 0... ..
. . .. ..
.
1 0 · · · 0
⎡⎢⎢⎢⎢⎢⎢⎢⎢⎢⎢⎢⎢⎢⎢⎢⎢⎢⎢⎢⎢⎢⎢⎢⎢⎢⎢⎢⎢⎢⎢⎢⎢⎢⎣⎤⎥⎥⎥⎥⎥⎥⎥⎥⎥⎥⎥⎥⎥⎥⎥⎥⎥⎥⎥⎥⎥⎥⎥⎥⎥⎥⎥⎥⎥⎥⎥⎥⎥⎦.
That is, Aξ is a convex combination of AD and AC,where AD represents the fully decentralized scenarioin which all destinations are equally likely for a one-way trip from any origin, and AC represents the fullycentralized scenario where zone 1, as the centraldistrict, is the only destination for all trips from otherzones, and all trips from zone 1 are equally likely toend at any other zone. Hence, ξ captures urban spatialcentrality: as ξ increases from 0 to 1, the trip patternbecomes more centralized around zone 1.
We use Aξ to generate numerical instances withdifferent degrees of centrality. Let dki be the rate ofcustomer trip demands originating from zone i inperiod k. We keep dki the same as in our baseline settingbut split dki to each zone j according to dkij � dki a
ξij. Then
we solve (SOCP-LB) for six different values of cen-trality ξ ranging from 0 to 1.
Our results suggest that the EV-sharing operator mayearnmore profits as the urban centrality ξ increases. AsFigure 9 shows, this profit increase is mainly attrib-utable to the declining charging infrastructure costand the declining repositioning cost. A higher degreeof centrality, such as ξ � 1, as Figure 10(b) shows,would allow consolidating charging operations at thecentral district. Consequently, EV charging requiresfewer charging sites and fewer chargers. The repo-sitioning trips for charging are also shortened becausethe charging locations overlap more with customer triporigins anddestinations. Conversely, a lower degree ofcentrality, such as ξ � 0, as Figure 10(a) shows, wouldentail building multiple charging sites at distributedlocations with more chargers yet still incurring extrarepositioning trips for charging at locations that are offcustomer trip routes.The positive correlation between profitability and
urban centrality highlights the importance of charging
Figure 8. (Color online) Impacts of Charging Power, Battery Capacity, and Repositioning Cost Efficiency on (a) the Profit and(b) the Number of Chargers Needed
Figure 9. (Color online) Profit and Cost Components inDemand Pattern Measured by Centrality ξ
He et al.: Charging an Electric Vehicle-Sharing FleetManufacturing & Service Operations Management, Articles in Advance, pp. 1–17, © 2020 INFORMS 15

operations management. Consider, for comparison, ahypothetical vehicle-sharing system that involves nobattery charging but otherwise resembles the systemin our numerical setting. The relationship betweencentrality and the vehicle repositioning cost (only forrebalancing supply/demand) would become less ob-vious, as the black dash-dotted line in Figure 9 illus-trates. As another comparison, for the ride-sharingsystem considered in Bimpikis et al. (2019) with nochargingoperations, the ride-sharingplatform’s profit isfound to be even decreasing in centrality ξ. In theirstylized setting, the demand rates dki are assumed tobe identical. As a result, centrality causes supply/demand imbalances of the ride-sharing network.The platform has to use prices that are off the profit-maximizing level as an instrument to mitigate theimbalances. By contrast, our dki from real data variesacross locations and periods. Hence, the relationshipbetween centrality and the expenditure on rebalancingsupply/demand is less significant.Overall, our numericalresults complement the discussion about trip pattern’simpact on vehicle sharing in the literature—for EVsharing, the savings in charging operations and in-vestment may dominate the expenditure on reba-lancing supply/demand as urban centrality increases.
6. ConclusionThis paper is motivated by a sheer gap: a smart cityfuture where shared and electrified mobility prevailsversus a reality where it may actually fail. To bridgethis gap, we propose models, analytics, and insightsfor deploying a charging network and operating anEV-sharing system. In particular, we explicitly modela customer’s endogenous usage of EVs at heteroge-neous energy levels and the charging process undera charging-up-to policy. To deal with intractabilityin the resulting nonlinear optimization problem, we
develop both computationally efficient lower andupper bound problems as MISOCPs. We conduct aseries of computational experiments using a set of realoperational data.Our case study on car2go’s operations in San Diego
leads to several findings. First, contrary to the practiceof ECOtality, EV-sharing infrastructure planners shouldconcentrate limited charging resources at selected opti-mal locations. If the EV-sharing operator collaborateswith a public charging network, it is crucial to ensurecharger availability to the EV-sharing fleet. Second,contrary to charging EVs only from energy levels ofabout 20%, car2go should either proactively chargeEVs from varying energy levels or adjust the thresholdto 40%. Either policy change can enhance the EVutilization rate, improve the repositioning efficiency,and subsequently significantly boost the profit. Theoperator should also carefully tailor its fleet size.Third, if technology permits, higher charging powercan alleviate the dependence on scarce charging re-sources, whereas larger battery capacity or unmannedrepositioning can improve profitability. Finally, thestudy on urban spatial structure again highlights theimportance of charging planning and operations toEV sharing.To further enhance the viability of shared and
electrified mobility, several research challenges areworth confronting. For example, the infrastructureplanning decisions are made up front in our setting.However, EV sharing is a fast-evolving business. Itwill be desirable to develop adaptive decision-makingschemes for multistage infrastructure planning jointlywith charging and repositioning operations. In addi-tion, the prevalence of shared and electrified mobilitywill mean both burden and asset to the future urbanelectrical grid. Those grid implications also await fur-ther explorations. Finally, a dynamic yet implementable
Figure 10. (Color online) Layouts of Charging Sites Under Different Demand Patterns Measured by Centrality ξ
Note. (a) 83 chargers on 4 sites for centrality ξ = 0; (b) 73 chargers on 1 site for centrality ξ = 1.
He et al.: Charging an Electric Vehicle-Sharing Fleet16 Manufacturing & Service Operations Management, Articles in Advance, pp. 1–17, © 2020 INFORMS
charging policy (e.g., with time-varying charge-up-tolevels) may also be investigated.
AcknowledgmentsThe authors gratefully acknowledge Professor Hau Lee, theassociate editor, and three anonymous referees for theirvaluable comments that significantly improved this paper.
Endnote1 For more details, see https://www.smartnation.sg/ for Smart NationSingapore, https://amsterdamsmartcity.com/ for Amsterdam SmartCity, and https://www.columbus.gov/smartcolumbus/projects/ forSmart City Columbus (all accessed December 1, 2017).
ReferencesAbouee Mehrizi H, Baron O, Berman O, Chen D (2018) Adoption of
electric vehicles in car sharing market. Working paper, Uni-versity of Waterloo, Waterloo, ON, Canada.
Adelman D (2007) Price-directed control of a closed logistics queueingnetwork. Oper. Res. 55(6):1022–1038.
Alizadeh F, Goldfarb D (2001) Second-order cone programming.Math. Programming 95(1):3–51.
Baskett F, Chandy KM, Muntz RR, Palacios FG (1975) Open, closed,and mixed networks of queues with different classes of cus-tomers. J. ACM 22(2):248–260.
Batty M (2013) The New Science of Cities (MIT Press, Cambridge, MA).Benjaafar S, Jiang D, Li X, Li X (2018) Inventory repositioning in on-
demand product rental networks. Working paper, University ofMinnesota, Minneapolis.
Bimpikis K, Candogan O, Saban D (2019) Spatial pricing in ride-sharing networks. Oper. Res. 67(3):744–769.
Blomgren GE (2017) The development and future of lithium ionbatteries. J. Electrochemical Soc. 164(1):A5019–A5025.
Boyacı B, Zografos KG, Geroliminis N (2015) An optimizationframework for the development of efficient one-way car-sharingsystems. Eur. J. Oper. Res. 240(3):718–733.
Condliffe J (2017) China and India want all new cars to be electric.MIT Tech. Rev. (September 11), https://www.technologyreview.com/the-download/608839/china-and-india-want-all-new-cars-to-be-electric/.
Daley DJ (1976) Queueing output processes. Adv. Appl. Probab. 8(2):395–415.
Desaulniers G, Errico F, Irnich S, SchneiderM (2016) Exact algorithmsfor electric vehicle-routing problems with time windows. Oper.Res. 64(6):1388–1405.
Fehrenbacher K (2016) Future cities could run on shared fleets ofelectric self-driving cars. Fortune (October 11), http://fortune.com/2016/10/11/shared-electric-self-driving-cars/.
Freund D, Henderson SG, O’Mahony E, Shmoys DB (2019) Analyticsand bikes: Riding tandem with motivate to improve mobility.INFORMS J. Appl. Analytics 49(5):310–323.
Garrick D (2016) Car2Go switching electric cars to gas. San DiegoUnion-Tribune (March 16), http://www.sandiegouniontribune.com/news/politics/sdut-car-share-car2go-fleet-gas-electric-2016mar16-story.html.
George DK, Xia CH (2011) Fleet-sizing and service availability for avehicle rental system via closed queueing networks. Eur. J. Oper.Res. 211(1):198–207.
Goldfarb D, Qin Z (2014) Robust low-rank tensor recovery: Modelsand algorithms. SIAM J. Matrix Anal. Appl. 35(1):225–253.
Green L, Kolesar P (1991) The pointwise stationary approximation forqueues with nonstationary arrivals.Management Sci. 37(1):84–97.
He L, Hu Z, ZhangM (2020) Robust repositioning for vehicle sharing.Manufacturing Service Oper. Management 22(2):241–256.
He L, Mak H-Y, Rong Y, Shen Z-JM (2017) Service region design forurban electric vehicle sharing systems. Manufacturing ServiceOper. Management 19(2):309–327.
Jiang D, Powell W (2016) Practicality of nested risk measures fordynamic electric vehicle charging. Working paper, University ofPittsburgh, Pittsburgh.
Jiao H, Liu S (2017) An efficient algorithm for quadratic sum-of-ratiosfractional programs problem. Numer. Funct. Anal. Optim. 38(11):1426–1445.
Kabra A, Belavina E, Girotra K (2018) Bike share systems: Accessi-bility and availability. Chicago Booth Research Paper 15-04,Chicago Booth School of Business, Chicago.
Kaspi M, Raviv T, Tzur M (2014) Parking reservation policies in one-way vehicle sharing systems. Transportation Res. Part B: Meth-odological 62(Suppl. C):35–50.
Kaspi M, Raviv T, Tzur M, Galili H (2016) Regulating vehicle sharingsystems through parking reservation policies: Analysis andperformance bounds. Eur. J. Oper. Res. 251(3):969–987.
Kim S-H, Whitt W (2014) Are call center and hospital arrivals wellmodeled by nonhomogeneous Poisson processes?ManufacturingService Oper. Management 16(3):464–480.
Kim SW,MakH-Y, OlivaresM, Rong Y (2018) Empirical investigationon the range anxiety for electric vehicles. Working paper, Chi-nese University of Hong Kong, Hong Kong.
Kingman JFC (1965) The heavy traffic approximation in the theory ofqueues. Smith WL, Wilkinson WE, eds. Proc. Sympos. Conges-tion Theory (University of North Carolina Press, Chapel Hill),137–159.
Lim MK, Mak H-Y, Rong Y (2015) Toward mass adoption of electricvehicles: Impact of the range and resale anxieties.ManufacturingService Oper. Management 17(1):101–119.
Louf R, Barthelemy M (2013) Modeling the polycentric transition ofcities. Phys. Rev. Lett. 111(19):198702-1-198702-5.
Lu M, Chen Z, Shen S (2017) Optimizing the profitability and qualityof service in carshare systems under demand uncertainty.Manufacturing Service Oper. Management 20(2):162–180.
Mak H-Y, Rong Y, Shen Z-JM (2013) Infrastructure planning forelectric vehicles with battery swapping. Management Sci. 59(7):1557–1575.
Nair R, Miller-Hooks E (2011) Fleet management for vehicle sharingoperations. Transportation Sci. 45(4):524–540.
Global Market Insights (2018) Car sharing market size by model(P2P, station-based, free-floating), by business model (roundtrip, one way), by application (business, private), industryanalysis report, regional outlook, growth potential, competitivemarket share & forecast, 2018–2024. Accessed November 27,2019, https://www.gminsights.com/industry-analysis/carsharing-market.
Schneider M, Stenger A, Goeke D (2014) The electric vehicle-routingproblem with time windows and recharging stations. Trans-portation Sci. 48(4):500–520.
Shortle JF, Thompson JM, Gross D, Harris CM (2018) Fundamentals ofQueueing Theory, 5th ed. (John Wiley & Sons, Hoboken, NJ).
Shu J, ChouMC, Liu Q, Teo C-P,Wang I-L (2013)Models for effectivedeployment and redistribution of bicycles within public bicycle-sharing systems. Oper. Res. 61(6):1346–1359.
U.S. Department of Energy (2017) Alternative fuels data center.Accessed December 6, 2018, http://www.afdc.energy.gov/data_download/.
Whitt W (1993) Approximations for the GI/G/m queue. ProductionOper. Management 2(2):114–161.
Yilmaz M, Krein PT (2013) Review of battery charger topologies,charging power levels, and infrastructure for plug-in electric andhybrid vehicles. IEEE Trans. Power Electronics 28(5):2151–2169.
Zhang H, Moura SJ, Hu Z, Qi W, Song Y (2018) A second-order coneprogramming model for PEV fast-charging station planning.IEEE Trans. Power Systems 33(3):2763–2777.
He et al.: Charging an Electric Vehicle-Sharing FleetManufacturing & Service Operations Management, Articles in Advance, pp. 1–17, © 2020 INFORMS 17