chart 1 household net fixed investment, net lending and saving. percentage of disposable income....
TRANSCRIPT
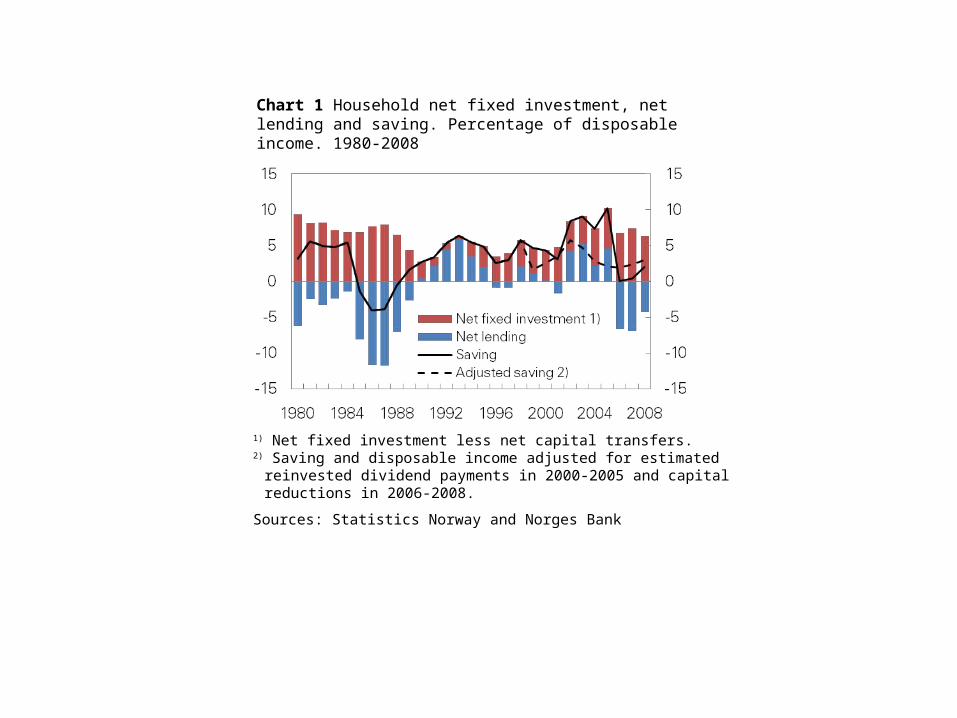
Chart 1 Household net fixed investment, net lending and saving. Percentage of disposable income. 1980-2008
1) Net fixed investment less net capital transfers.2) Saving and disposable income adjusted for estimated
reinvested dividend payments in 2000-2005 and capital reductions in 2006-2008.
Sources: Statistics Norway and Norges Bank
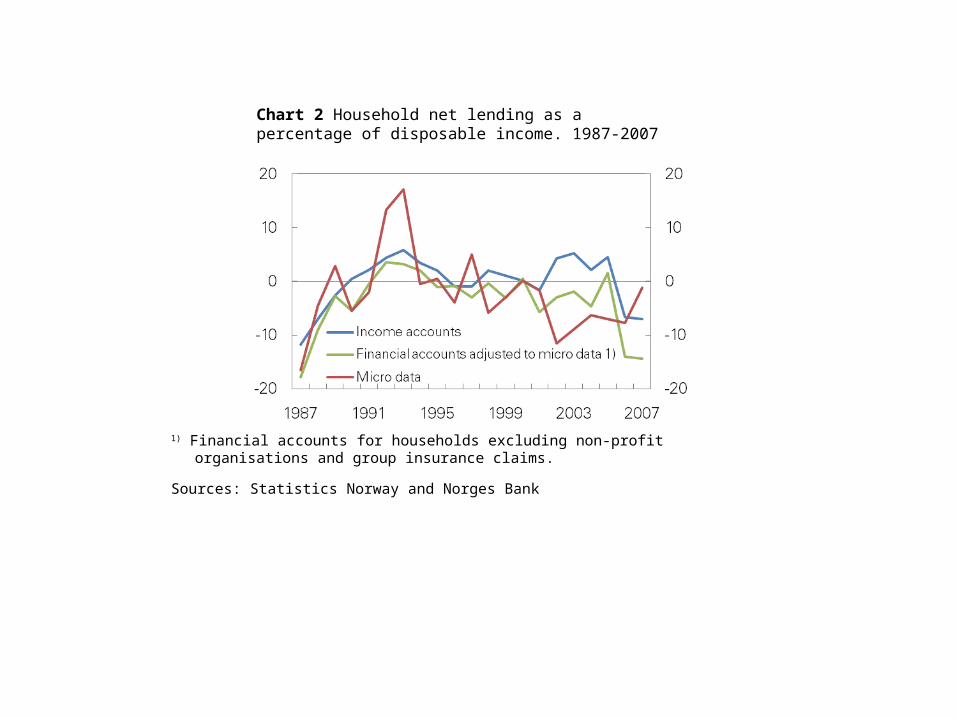
Chart 2 Household net lending as a percentage of disposable income. 1987-2007
1) Financial accounts for households excluding non-profitorganisations and group insurance claims.
Sources: Statistics Norway and Norges Bank
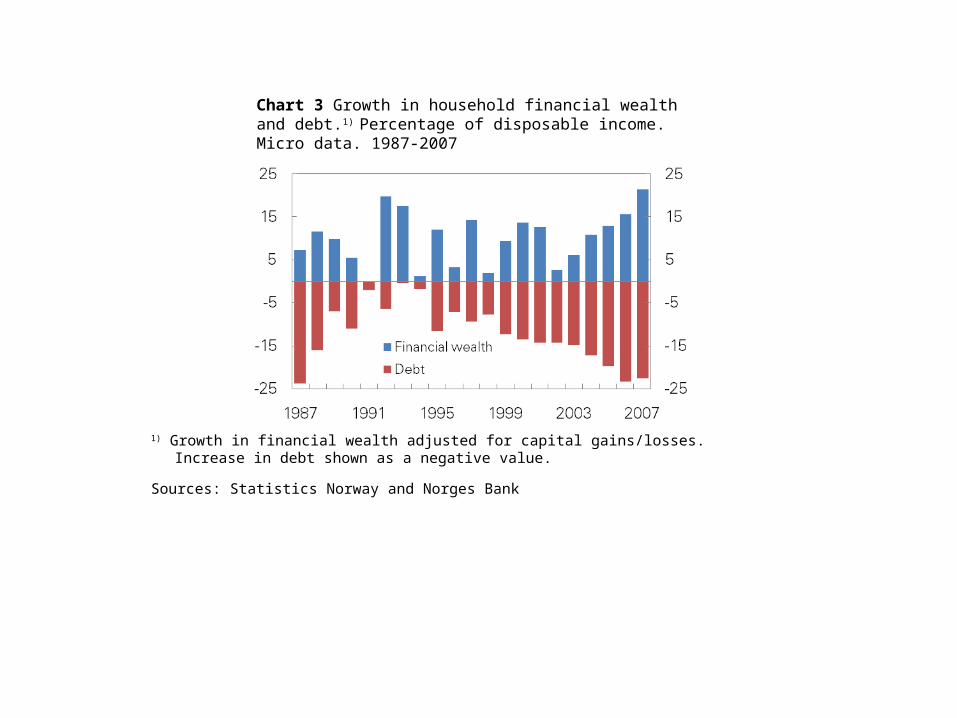
Chart 3 Growth in household financial wealth and debt.1) Percentage of disposable income. Micro data. 1987-2007
1) Growth in financial wealth adjusted for capital gains/losses. Increase in debt shown as a negative value.
Sources: Statistics Norway and Norges Bank
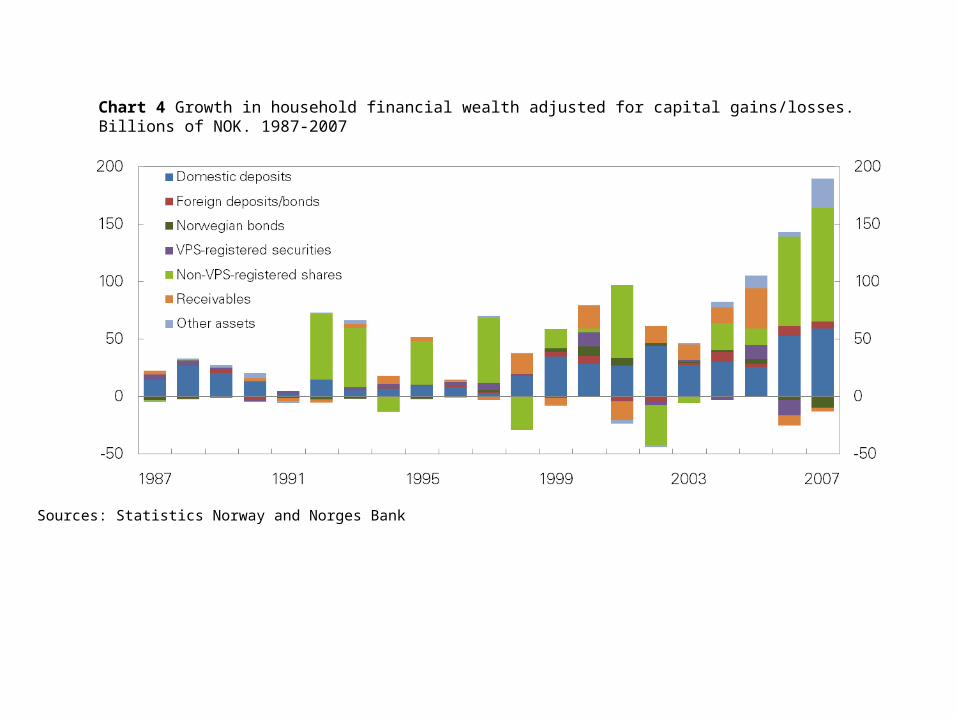
Chart 4 Growth in household financial wealth adjusted for capital gains/losses. Billions of NOK. 1987-2007
Sources: Statistics Norway and Norges Bank
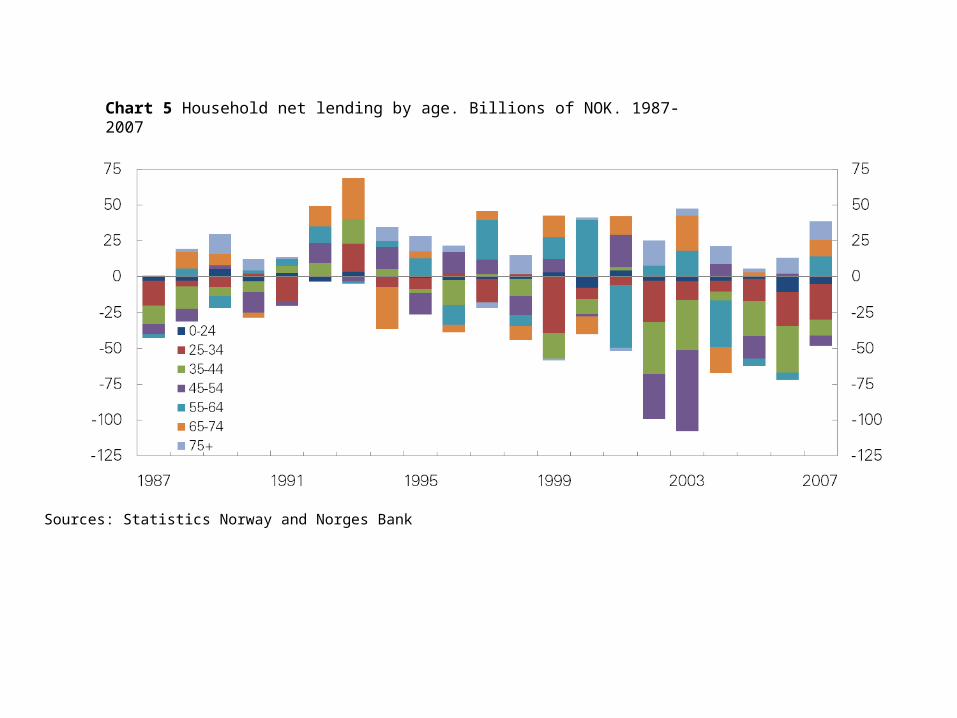
Chart 5 Household net lending by age. Billions of NOK. 1987-2007
Sources: Statistics Norway and Norges Bank
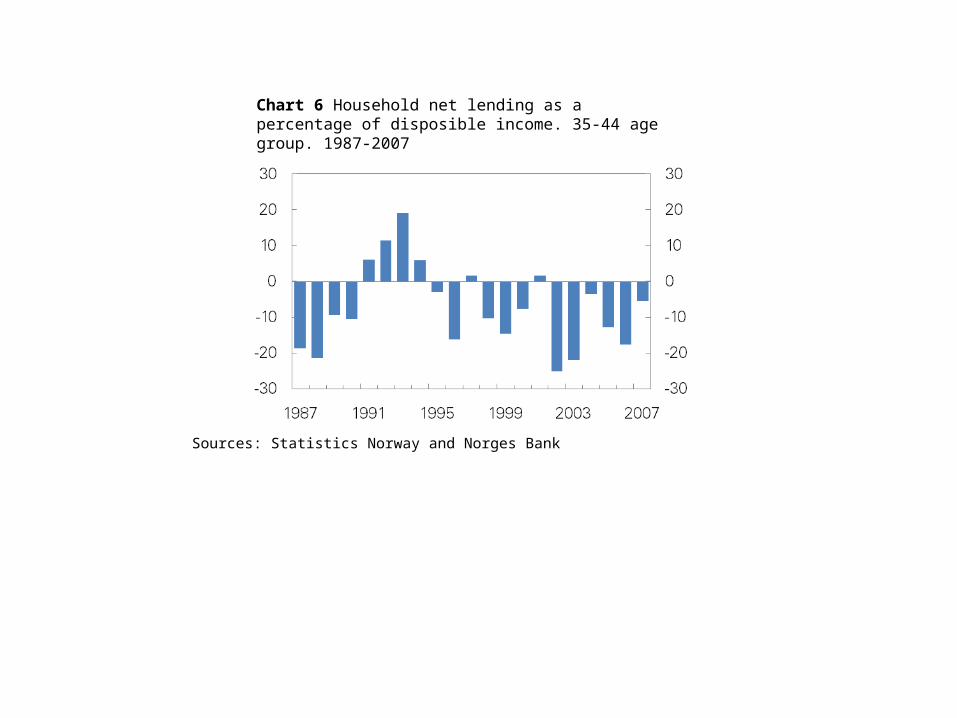
Chart 6 Household net lending as a percentage of disposible income. 35-44 age group. 1987-2007
Sources: Statistics Norway and Norges Bank
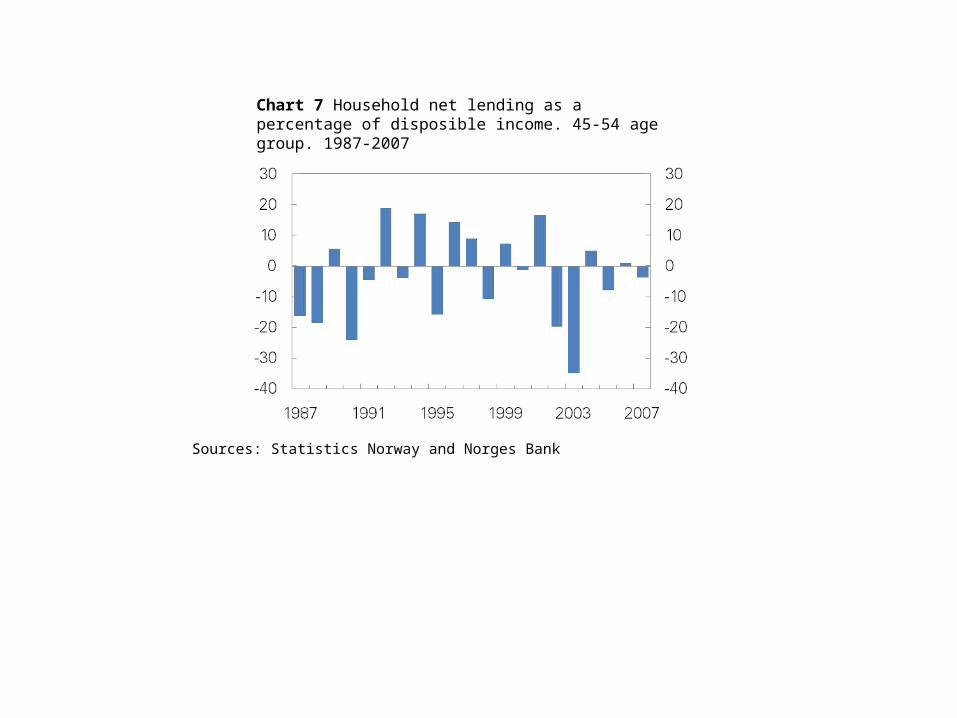
Chart 7 Household net lending as a percentage of disposible income. 45-54 age group. 1987-2007
Sources: Statistics Norway and Norges Bank
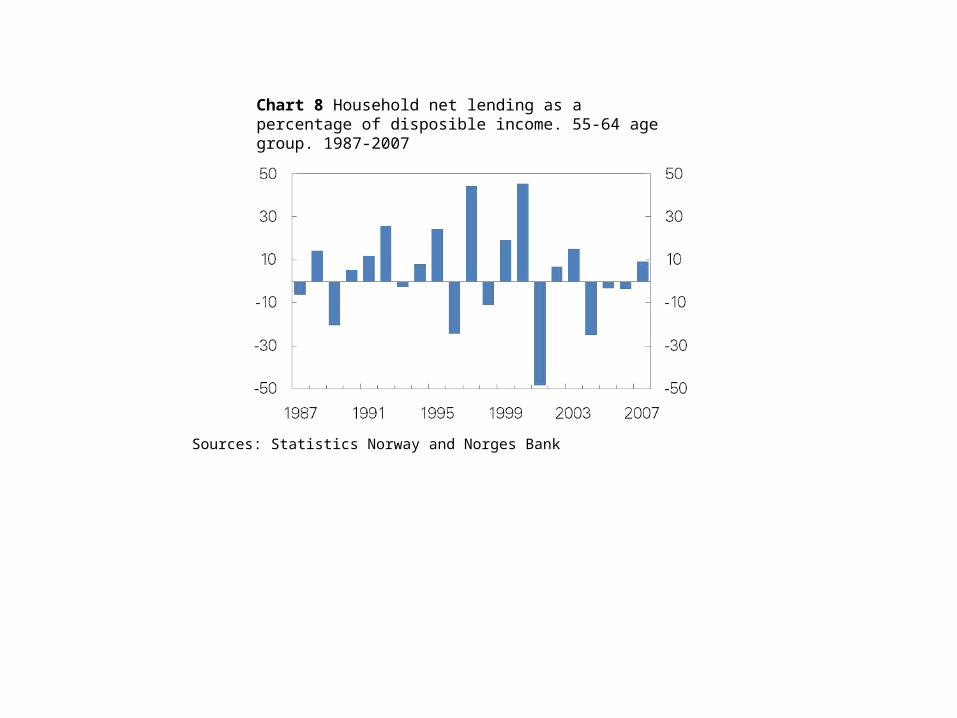
Chart 8 Household net lending as a percentage of disposible income. 55-64 age group. 1987-2007
Sources: Statistics Norway and Norges Bank
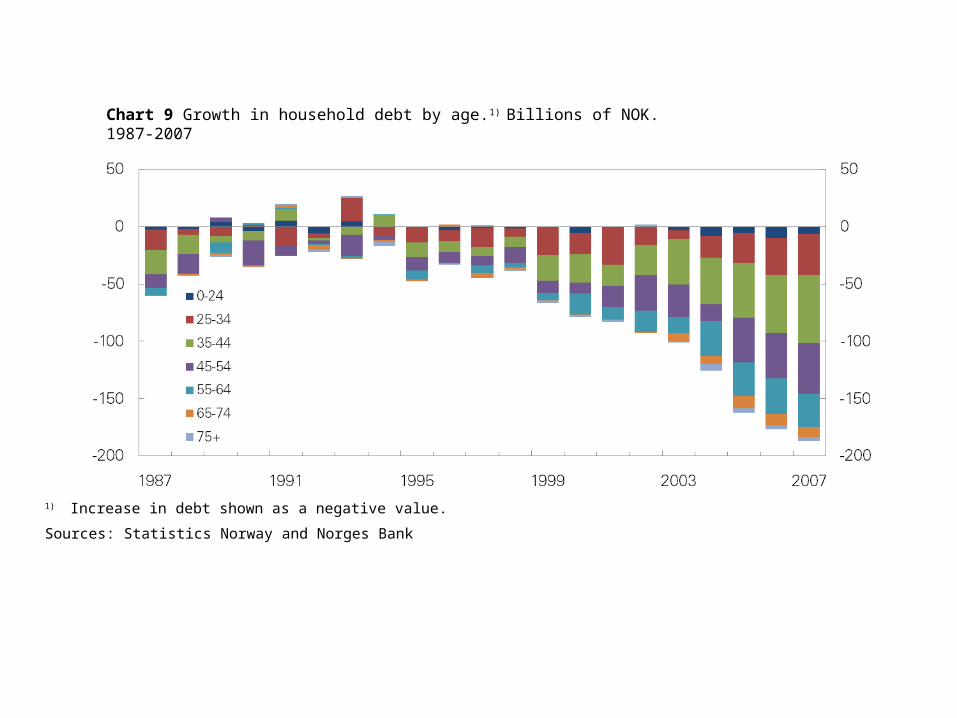
Chart 9 Growth in household debt by age.1) Billions of NOK. 1987-2007
1) Increase in debt shown as a negative value.
Sources: Statistics Norway and Norges Bank
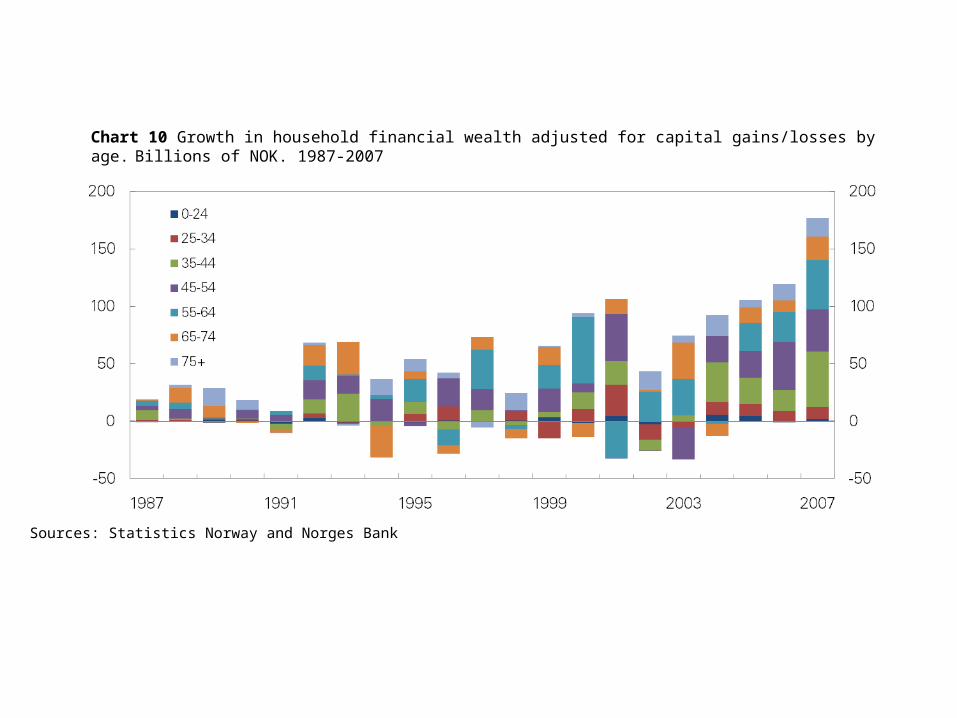
Chart 10 Growth in household financial wealth adjusted for capital gains/losses by age. Billions of NOK. 1987-2007
Sources: Statistics Norway and Norges Bank
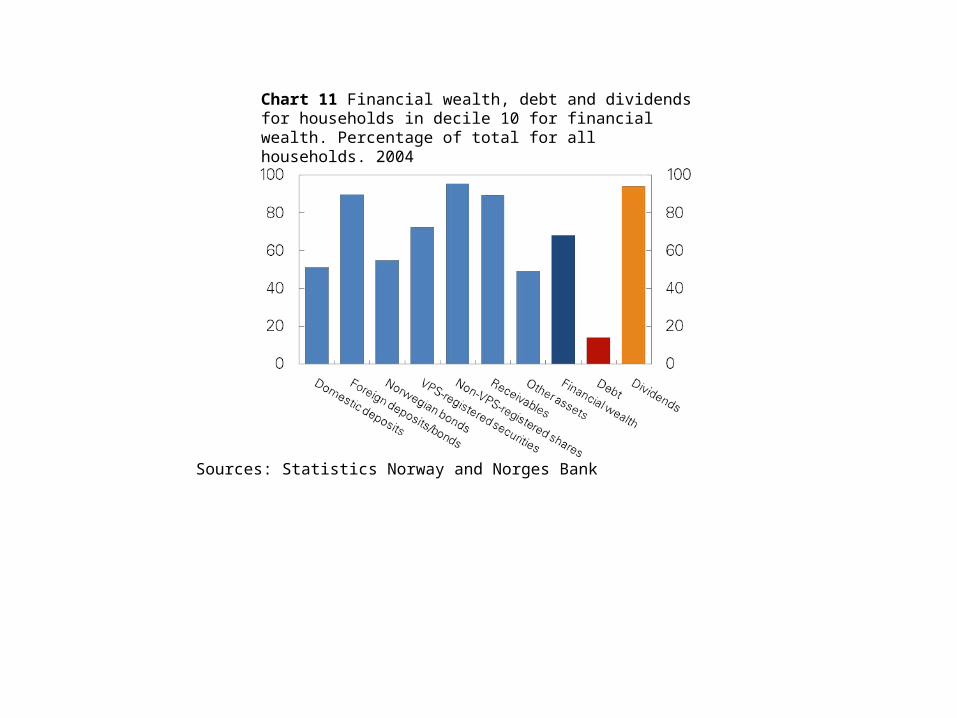
Chart 11 Financial wealth, debt and dividends for households in decile 10 for financial wealth. Percentage of total for all households. 2004
Sources: Statistics Norway and Norges Bank

Chart 12 Composition of financial wealth for households in different deciles for financial wealth. Per cent. 2004
Sources: Statistics Norway and Norges Bank
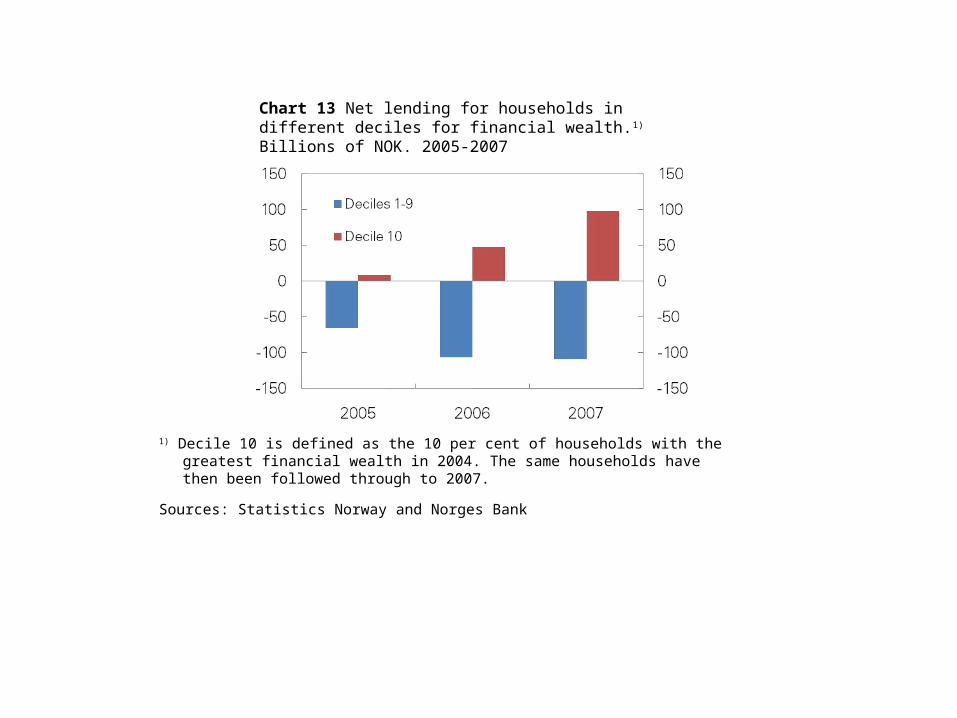
Chart 13 Net lending for households in different deciles for financial wealth.1) Billions of NOK. 2005-2007
1) Decile 10 is defined as the 10 per cent of households with the greatest financial wealth in 2004. The same households have then been followed through to 2007.
Sources: Statistics Norway and Norges Bank

Chart 14 Growth in financial wealth adjusted for capital gains/losses for households in decile 10 for financial wealth.1) Billions of NOK. 2005-2007
1) Decile 10 is defined as the 10 per cent of households with the greatest financial wealth in 2004. The same households have then been followed through to 2007.
Sources: Statistics Norway and Norges Bank