charting multilingualism in singapore: from the … programme... · charting multilingualism in...
TRANSCRIPT

Final Year Project
Charting multilingualism in Singapore: From the nineteenth century to the present
By
TAN LiJia Gloria
Supervised by Professor Kingsley Bolton
2014 Division of
Linguistics and Multilingual Studies

ii
Declaration of Authorship
I declare that this assignment is my own original work, unless otherwise referenced, as defined by the NTU policy on plagiarism. I have read the NTU Honour Code and Pledge.
No part of this Final Year Project has been or is being concurrently submitted for any other qualification at any other university.
I certify that the data collected for this project is authentic. I fully understand that falsification of data will result in the failure of the project and/or failure of the course.
Name: Tan LiJia Gloria Signature: Date: 17th November 2014

iii
Additional information 1. My FYP is an extension of my URECA project. Yes / No
If yes, give details and state how is this project different from your URECA
project:
2. My FYP is a part of or an extension of my supervisor’s project. Yes/No
if yes, answer question 5.
3. My FYP is partially supported by my supervisor’s grant. Yes / No
4. Provide details of funding expenditure, (e.g. payment of participants: $10/hour;
funded by supervisor’s grant…)
5. You are reminded that an FYP is an independent project on an area of your own
interests. Any kind of outsourcing (including, but not limited to, transcription,
statistical analysis, etc.) would have a huge negative impact on your grade. If
your project is a part of or an extension of your supervisor’s project, please state
clearly i) what are your own intellectual contributions, and ii) what components of
your supervisor’s project have been borrowed for your FYP (e.g. software tools,
audio/visual materials, etc.). If you have any doubts, please check with your
supervisor and/or the FYP coordinator before submission.
*Note that failure to declare may be treated as a case of plagiarism and it will
impact negatively on the assessment of your FYP.

iv
Acknowledgement Four years in LMS has come down to this, and I am truly thankful for the opportunity
to have been part of the LMS family.
First and foremost, I am thankful and grateful for my supervising professor,
Professor Kingsley Bolton, for always being a constant support throughout this FYP
journey. Thank you for always taking the time to look through my report no matter
how busy you are, and always giving me such constructive and encouraging feedback.
It has been such a joy to be under your tutelage and I have learnt so much from you.
Secondly, to my predecessor, Liyan, thank you for guiding me throughout this
journey and teaching me the ropes to survive this FYP season.
Thirdly, to my friends from LMS – Andre, Kubo, Firqin and Joan – thank you for
the past seven semesters together. We have survived tonnes of assignments, test,
quizzes, presentations and now, the FYP together! My time in LMS wouldn’t be half
as fun if not for you guys, thanks for the memories. .
Last but not least, to Him who made this possible, Your providence and sustenance
have helped me come this far.
Pa & Ma, I’m done with school! ☺

v
Table of contents 1. Introduction ………………………………………………………………..……… 1 2. Literature review …………………………………………………………...……... 2
2.1 Historical perspectives …………………………………………………... 2
2.2 Sociolinguistic perspectives on the linguistic history of Singapore ……... 3
2.2.1 Language education ………………………………..………...… 4
2.2.2 Educational perspectives and language policies …………...….. 4
2.3 Research on language censuses ………………………………………….. 5 3. Research issues ……………………………………………………………..………7 4. Methodology ……………………………………………………………………… 8 5. Results and data analysis ………………………………………………………… 10 5.1 Colonial censuses (1824-1957) ……………………………………….... 11 5.1.1 1824 to 1836 censuses ………………………………………... 11 5.1.2 The 1871 census …………………………………………….... 12 5.1.3 The 1881 census ……………………………………………… 14 5.1.4 The 1891 census ………………………………………..…….. 15 5.1.5 The 1901 census ……………………………………………… 17 5.1.6 The 1911 census ……………………………………………… 19 5.1.7 The 1921 census ……………………………………………… 21 5.1.8 The 1931 census ……………………………………………… 24 5.1.9 The 1947 census …………………………………..………….. 26 5.1.10 The 1957 census ………………………………………..…… 27 5.2 Post-colonial censuses (1970-2010) ……………………………………. 32 5.2.1 The 1970 census …………………………………………….... 33 5.2.2 The 1980 to 2010 censuses …………………………………… 34
vi
5.2.3 The racial composition of the population …………………… 34 5.2.4 Rise of official languages and literacy rates in Singapore …… 35 5.2.5 Rise in mother tongue literacy rates in each racial group ……. 36 5.2.6 Multi-language literacy in official languages…………………. 37 5.2.7 The shift of languages used in the home domains ………….... 38 6. Commentary ………………………………………………………………..……. 39 7. Conclusion ……………………………………………………………………..… 40 Notes ………………………………………………………………………………... 43 References ………………………………………………………………………….. 45
vii
List of figures Figure 1: Map showing the Jackson 1828 map of Singapore, which outlines Raffles’ vision for Singapore town …………………………………………………………… 3 Figure 2: Map showing the territories of British Malaya …………………………... 11 Figure 3: Chart that shows the distribution of population by race in early Singapore from 1824 to 1836 ………………………………………………………………..… 12 Figure 4: Racial composition of Singapore according to the 1871 census of the Straits Settlements ………………………………………………………………………..... 13 Figure 5: Racial composition of Singapore according to the 1881 census of the Straits Settlements …………………………………………………………………………. 14 Figure 6: Breakdown of the Chinese population according to the 1881 census of the Straits Settlements ……………………………………………………………..…… 15 Figure 7: Racial composition of Singapore according to the 1891 census of the Straits Settlements …………………………………………………………………………. 16 Figure 8: Breakdown of the Chinese population according to the 1891 census of the Straits Settlements ………………………………………………………………..… 17 Figure 9: Breakdown of the Chinese population according to the 1901 census of the Straits Settlements ………………………………………………………………….. 18 Figure 10: Composition of the Chinese population by tribe according to the 1921 census of the Straits Settlements …………………………………………………… 22 Figure 11: Composition of the Malay population by race according to the 1921 census of the Straits Settlements …………………………………………………………… 23 Figure 12: Composition of the Indian population by race according to the 1921 census of the Straits Settlements …………………………………………………………… 23 Figure 13: Percentage of total population of Singapore literate in Malay, by race according to the 1947 census of the Straits Settlements …………………………… 27 Figure 14: Composition of the Chinese population according to the 1957 census of the Straits Settlements ………………………………………………………………..… 28 Figure 15: Composition of the Malay population according to the 1957 census of the Straits Settlements ………………………………………………………………….. 28 Figure 16: Composition of the Indian and Pakistanis population according to the 1957 census of the Straits Settlements ………………………………………………….... 29

viii
Figure 17: Racial composition of the population from 1871 to 2010, based on census data …………………………………………………………………………………. 34 Figure 18: Percentage of population literate in English from 1921 to 2010 according to census data……………………………………………………………………….. 35 Figure 19: Percentage of each racial group literate in their designated mother tongue from 1957 to 2010 according to census data .............................................................. 36 Figure 20: Percentage of each racial group literate in two or more official languages according to census data ……………………………………………………………. 37 Figure 21: Languages spoken most frequently at home in 1980, 1990, 2000 and 2010 ………………………………………………………………………………………. 38

ix
List of tables Table 1: Censuses of Singapore from 1824 to 1870 ……………………………….... 9 Table 2: Official censuses of Singapore from 1871 to 2010 ……………………….. 10 Table 3: Table showing the size of various Chinese speech communities according to the 1911 census of the Straits Settlements …………………………………………. 19 Table 4: Table showing the size of the various Malay speech communities according to the 1911 census of the Straits Settlements ………………………………….…… 20 Table 5: Table showing the size of the various Indian speech communities according to the 1911 census of the Straits Settlements …………………………………….… 21 Table 6: Table showing the percentage of Chinese population whose mother tongue is English or Mandarin according to the 1957 census of the Straits Settlements ………………………………………………………………………………………. 30 Table 7: Table showing the percentage of Malay population whose mother tongue is English or Malay according to the 1957 census of the Straits Settlements ………………………………………………………………………………………. 31 Table 8: Table showing the percentage of Indian population whose mother tongue is English or Tamil according to the 1957 census of the Straits Settlements ………………………………………………………………………………………. 32 Table 9: Literacy rates of population (citizens and non-citizens) according to the 1970 census of Singapore ………………………………………………………………… 33
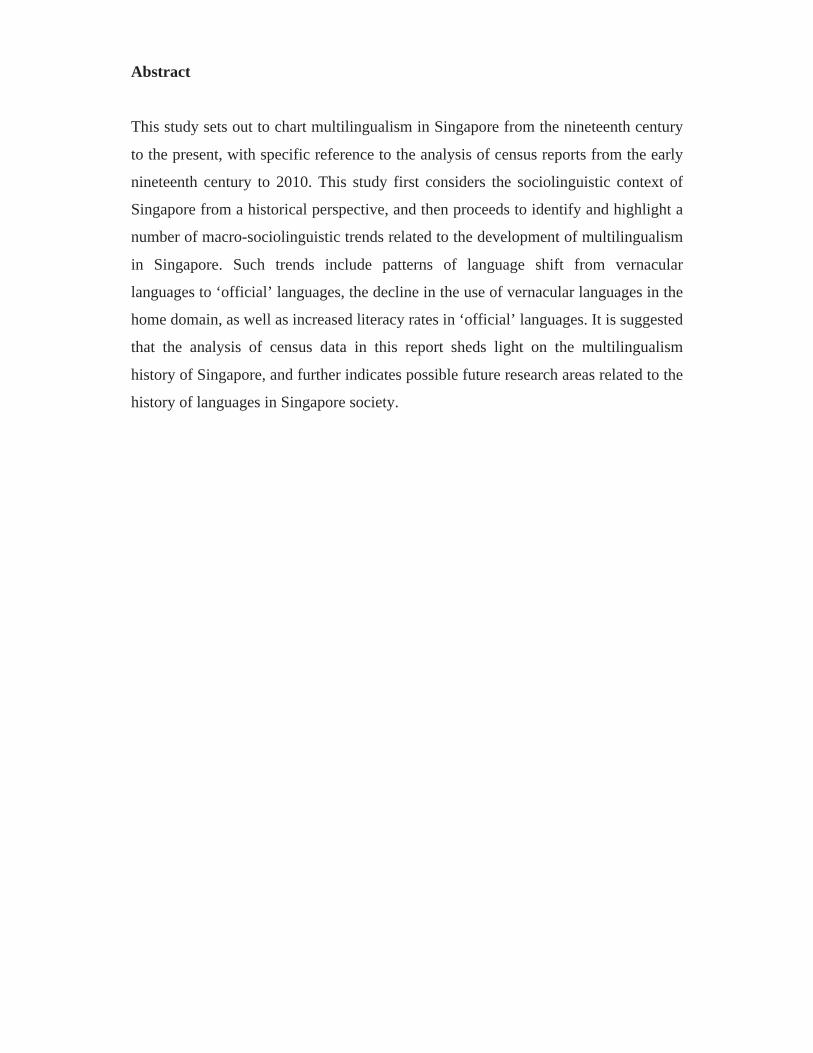
Abstract
This study sets out to chart multilingualism in Singapore from the nineteenth century
to the present, with specific reference to the analysis of census reports from the early
nineteenth century to 2010. This study first considers the sociolinguistic context of
Singapore from a historical perspective, and then proceeds to identify and highlight a
number of macro-sociolinguistic trends related to the development of multilingualism
in Singapore. Such trends include patterns of language shift from vernacular
languages to ‘official’ languages, the decline in the use of vernacular languages in the
home domain, as well as increased literacy rates in ‘official’ languages. It is suggested
that the analysis of census data in this report sheds light on the multilingualism
history of Singapore, and further indicates possible future research areas related to the
history of languages in Singapore society.

Charting Multilingualism in Singapore: From nineteenth century to the present 1. Introduction Singapore is a multilingual nation, where, since the early nineteenth century, there has
been a constant flux in the population, with people coming to settle or work in
Singapore from the Malay Archipelago, Asia and elsewhere. Such historical processes
resulted in the creation of a community that was both multiracial and multilingual.
Singapore, during the colonial era, had a linguistic landscape where a myriad of
languages were spoken on a daily basis. The British colonial authorities did not
mandate that the local population had to learn their language, English, and, in the
nineteenth century, the learning of the language was usually confined to a few
selected elites that helped them in matters related to the government (Koh 2014).
Throughout the colonial era, different races tended to live in segregated areas in
Singapore, each confined to their community that spoke the same language. Even if
there was contact between races that spoke different languages, according to Furnivall
(1967), they tended to do so at the market place only. For much of the colonial period,
the government did not actively pursue an interventionist language policy, and the
community was marked by a very high degree of multilingualism.
Today, Singapore is still a multiracial and multilingual nation with a population of
some 5.4 million people (Department of Statistics Singapore 2014: 4). However, the
Republic of Singapore Independence Act that was drafted in 1965 designated that the
official languages of the nation are English, Malay, Mandarin, and Tamil, while the
national language is Malay (Singapore Government, 1987). As Singapore has
navigated its language policies from colonial beginnings to the post-colonial
modernity of the present, language issues have played an important role in the
development of society. In this present study, I intend to chart the history of
multilingualism in Singapore from the colonial times to modern day Singapore,
through the careful examination of census data from the nineteenth century to the
present. Although official census data do not reveal the full history of multilingualism
in Singapore, this study suggests that (despite certain limitations) the examination of
such data can make a contribution to the profiling of multilingualism in Singapore
society from a diachronic perspective.

2
2. Literature review In order to carry out the review of relevant literature, it was necessary to consult work
from a number of different disciplines, including historical studies, as well as
sociolinguistic and educational research dealing with the languages of Singapore.
2.1 Historical perspectives According to Bloom (1986), prior to the founding of colonial Singapore, Singapore
was a fishing village that was ‘inhabited by a few families of Orang Laut (‘Sea
People’ or Proto-Malays); probably pirates, a settlement of Chinese cultivators of
pepper and gambier, and about a hundred Muslim Malay fisherfolk led by the
Temenggong of Johore, who had moved there in 1811’ (Bloom 1986: 349). In this
narrative, the founding of modern Singapore began in January 1819 when Sir
Stamford Raffles, an agent of the East India Company signed a preliminary treaty
with the Temenggong of Johore, which allowed the British to establish a trading post
in Singapore (although it should be emphasised that a number of historians have
recently challenged this essentially short-sighted view of history, and pointed out that
Singapura had been long established as a key trading base in the Malay Archipelago).
According to Turnbull, the initial population of Singapore in 1819 was very sparse:
Altogether in January 1819 Singapore had perhaps a thousand inhabitants, consisting of
some 500 Orang Kallang, 200 Orang Seletar, 150 Orang Gelam in the Singapore river,
other orang laut in the Keppel Harbour area, twenty to thirty Malays in the
Temenggong’s entourage and a similar number of Chinese. (Turnbull 1977: 5)
Following the establishment of the colony, Singapore grew as an important port of
trade, and people from the Malay Archipelago, China, and elsewhere migrated to
Singapore in search for employment and settlement. The British adopted an open-
door immigration policy which resulted in the burgeoning of the population (Yeoh
2007). In order to maintain the orderliness of the city, Raffles drew up the Jackson
Plan (Figure 1) that allocated areas around the city for each ethnic group. (Turnbull
1977, Buckley 1965) The different ethnic groups were then segregated into
‘campongs’, including the Chinese ‘campong’ which was ‘to the south west of the
Singapore river’ (Buckley 1965: 83) and the Bugis ‘campong’ which occupied ‘the
whole extent from Campong Glam to the mouth of the Rochor River’ (84). This

3
intentional segregation of racial communities allowed for native languages to thrive,
as people from the same background lived together, thus creating an environment for
the continued usage of their languages.
Figure 1: Map showing the Jackson 1828 map of Singapore, which outlines Raffles’ vision for Singapore town (National Archives of Singapore, 2014)
Furthermore, the British colonial rulers allowed each ethnic group to enforce its own
legal system, which was known as the ‘capitan’ system, and typically the British only
interfered in interethnic conflicts (Bloom 1986: 352). Thus, with the Jackson Plan and
the capitan system of governance, Singapore in the early years was ‘[fragmented]
along ethnic, linguistic, religious and occupational lines.’ (352). In the next section,
we will consider sociolinguistic perspectives on this early era of multilingualism in
Singapore.
2.2 Sociolinguistic perspectives on the linguistic history of Singapore
A comprehensive history of the development of multilingualism in Singapore is not
available in the literature, however it is evident that education played a major role in
the maintenance and promotion of various languages in the society. It is therefore
important to consider which languages were taught in schools, as well as the
formulation of language policies throughout history. In the sections that follow, I
4
provide a brief account of some of the major sources in the literature that have dealt
with such issues.
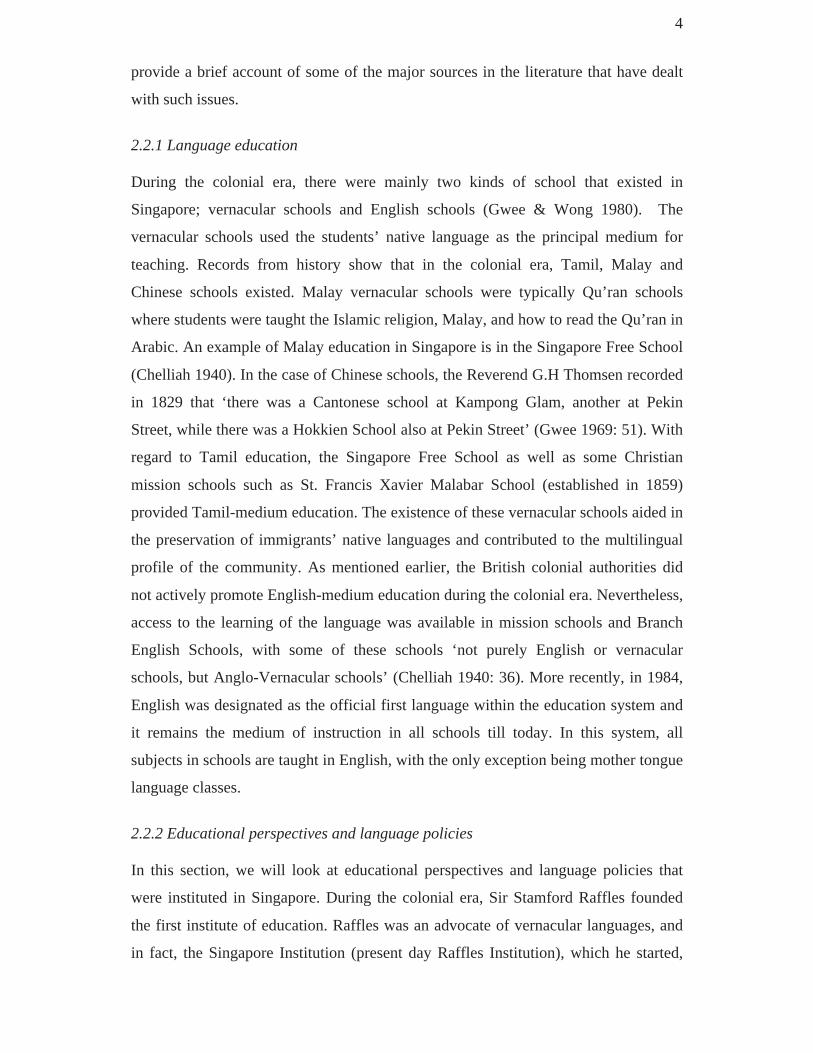
2.2.1 Language education During the colonial era, there were mainly two kinds of school that existed in
Singapore; vernacular schools and English schools (Gwee & Wong 1980). The
vernacular schools used the students’ native language as the principal medium for
teaching. Records from history show that in the colonial era, Tamil, Malay and
Chinese schools existed. Malay vernacular schools were typically Qu’ran schools
where students were taught the Islamic religion, Malay, and how to read the Qu’ran in
Arabic. An example of Malay education in Singapore is in the Singapore Free School
(Chelliah 1940). In the case of Chinese schools, the Reverend G.H Thomsen recorded
in 1829 that ‘there was a Cantonese school at Kampong Glam, another at Pekin
Street, while there was a Hokkien School also at Pekin Street’ (Gwee 1969: 51). With
regard to Tamil education, the Singapore Free School as well as some Christian
mission schools such as St. Francis Xavier Malabar School (established in 1859)
provided Tamil-medium education. The existence of these vernacular schools aided in
the preservation of immigrants’ native languages and contributed to the multilingual
profile of the community. As mentioned earlier, the British colonial authorities did
not actively promote English-medium education during the colonial era. Nevertheless,
access to the learning of the language was available in mission schools and Branch
English Schools, with some of these schools ‘not purely English or vernacular
schools, but Anglo-Vernacular schools’ (Chelliah 1940: 36). More recently, in 1984,
English was designated as the official first language within the education system and
it remains the medium of instruction in all schools till today. In this system, all
subjects in schools are taught in English, with the only exception being mother tongue
language classes.
2.2.2 Educational perspectives and language policies In this section, we will look at educational perspectives and language policies that
were instituted in Singapore. During the colonial era, Sir Stamford Raffles founded
the first institute of education. Raffles was an advocate of vernacular languages, and
in fact, the Singapore Institution (present day Raffles Institution), which he started,

5
‘[had] for its object the cultivation of the languages of China, Siam, and the Malayan
Archipelago; and the improvement of the moral and intellectual condition of the
inhabitants of those countries’ (Raffles 1823: 3). Generally, the educational language
policy adopted by the British colonial rulers was one that allowed for the survival and
even the promotion of so-called ‘vernacular languages’.
If one compares with the present, one obvious example of a language policy that has
been implemented in modern-day Singapore that has affected the survival of various
languages is the ‘Speak Mandarin Campaign’ (SMC). Implemented by then-Prime
Minister Lee Kuan Yew in 1979, the campaign aims to unify the Chinese population
in Singapore by encouraging the use of Mandarin as the common language of the
community. Since the early 1980s, other Chinese languages have been officially
regarded as ‘dialects’, and subsequently have had only limited use in the media.
Another interventionist language policy that has been implemented in recent decades
has been that of promoting ‘English-knowing bilingualism’. This policy was
implemented as part of the education system to ensure that students would be
bilingual in two languages – English and their mother tongue. In Singapore, ‘mother
tongue’ is the ‘superordinate language’ of one’s ethnic group (Gupta 1998: 117).
Therefore, a student who has Chinese heritage is guided to learn Mandarin Chinese,
while a student from an Indian heritage typically learns Tamil. From the review of
some of these languages policies in Singapore, we see that modern-day language
policies have been evidently more restrictive than those that applied in the colonial
era. Such policies have affected many aspects of contemporary Singapore life, it is
been argued, affecting not least notions of identity within the community. For
example, Chew (2013) points out that, in Singapore, languages have been used to
express one’s racial, regional individual and even religious identities since the
colonial days. In this context, one might argue that it is particularly relevant to
examine the historical record in order to construct a historical account of the
development of multilingualism in our society, which also leads on to the
consideration of the value of census data in such research.
2.3 Research on language censuses One study that has investigated multilingualism using census data and results from
sociolinguistics surveys is one that was carried out in Hong Kong by Bacon-Shone

6
and Bolton (1998). Their article states that their research ‘sets out to challenge the
myth of Hong Kong as a monolingual society by reviewing a wide range of empirical
research on multilingualism in the Hong Kong speech community’ (Bacon-Shone &
Bolton 1998: 43). The data that were analysed in this study were Hong Kong
government censuses from 1911 to 1991 and two sociolinguistic surveys that were
carried out in 1983 and 1993. Upon close analysis of the data, they were able to
debunk the myth that Hong Kong was a monolingual society, and to establish that the
society had a long and complex history of multilingualism and linguistic diversity.
Their data shows that other Chinese minority dialects such as Hakka and Hoklo were
spoken other than Cantonese back in the early 1900s of Hong Kong. However, it was
also evident through the comparison of census data that there was a language shift
around the early 1960s from minority Chinese dialects to Cantonese. Furthermore,
their analysis was also able to show the increased use of English over the years. Their
study further demonstrated that the analysis of censuses and sociolinguistics surveys
is able to shed light on the historiography of the languages in a country to give us a
better understanding of the language shift and maintenance that occurred.
The primary aim of a census is to provide accurate and reliable estimates of a
country’s population (Baffour & Valente 2012). Census data may then be used by
government bodies to better understand the population that they govern and
accordingly, tailor suitable policies for the benefit of their people. However, beneath
the practical purposes of censuses, other agendas may apply. According to Anderson
(2006), in his book Imagined communities: Reflections on the origin and spread of
nationalism, three institutions – the census, the map and the museum ‘shaped the way
in which the colonial state imagine[d] its dominion – the nature of the human beings it
ruled, the geography of its domain, and the legitimacy of its ancestry’ (Anderson
2006: 164). This is especially evident in a plural society like British Malaya. The
diversity of its migrants that made up its population, almost unintentionally, led to the
construction of a multi-ethnic territory. British’s attempts to classify the people they
governed were most evident in censuses that were taken under their purview. A study
by Manickam (2014) based on the census categorisations of British Malaya shows
that the racial boundaries that were created by the British were not static, but in fact
constantly changed as they sought to understand the local population. Being classified
in a certain racial category was not solely based on biological factors, but instead in a

7
plural society like British Malaya, on ‘cultural characteristics such as language, dress,
and cuisine’ (Hirschman 1987: 557). In these studies, it is concluded that language
issues were deeply intertwined with issues of race throughout the history of British
Malaya.
In addition to racial issues, other political factors may apply in the administration of
language censuses. Lieberson (1967) proposed a number of question-types that could
be used in such research, but, in his analysis of this issue, Arel (2001) argues that the
design of censuses was often political, as ‘the choice of particular categories derives
from political choices’, further adding that ‘a census language indicator presupposes
an agreement as to what the acceptable “language” categories are’ (115). He also
notes ‘language was meant to be the great decoder of nationality’ and he goes on to
state examples such as in Prussia where the language one spoke is an indicator of
one’s nationalist allegiance (95). Whether language is a tool to express one’s
allegiance in the case of Singapore may be contentious, but nevertheless even here
and elsewhere the claim to speak a particular language may have repercussions.
Thus, according to Arel, the significance of the census as an instrument of the state is
that ‘it is an ultimate register of the “truth”’, adding that, ‘it constitutes the privileged
medium of the state, which, while targeted at individuals, bestows group recognition
and (numerical) proportion’ (Arel 2001: 94, italics in the original).
3. Research issues As has been shown through the literature review, there is an indication that during the
colonial era of Singapore there was a myriad of many languages being spoken by
people coming from different hometowns, cultures and backgrounds. However in
modern-day Singapore, there are only four official languages – English, Mandarin,
Malay and Tamil. Between the founding of Singapore to present day, how the level of
multilingualism and degree of linguistic diversity has changed is one important point
of enquiry in this project. To my knowledge, there have been only two publications
that have studied multilingualism from a historical perspective in Singapore. Tham
(1990), looked at language shift and maintenance in Singapore, but data was limited
to two censuses – 1980 and 1990. Another research project that investigated language
use in Singapore using census data was that of Tan (2003), but the data was limited to
the 1980, 1990 and 2000 censuses. Therefore, there seems to be a dearth of research

8
that analyses the historiography of languages in Singapore from colonial times to
modernity.
Following the review of the literature set out above, the research issues for this
project may now be specified as follows:
(1) What are the macro trends of language maintenance and language shift that are
highlighted through the analysis of census data?
(2) More specifically, what can the analysis of census data tell us about the
multilingual development of Singapore with reference to Chinese dialects,
Indian languages, Malay, Mandarin and English?
(3) To what extent can the analysis of census data increase our understanding of
the multilingual history of Singapore?
4. Methodology Following the methodology that was used by Bacon-Shone and Bolton (1998), census
documents were the primary data source for this project. The earliest census was
recorded in 1824. Though the accuracy and reliability of the censuses that were taken
from 1824 to 1870 were questionable due to methodological concerns, the early
censuses still give us a general idea of the population of Singapore during this period
of time. The table below lists all the available censuses from 1824 to 1870.

9
Table 1: Censuses of Singapore from 1824 to 1870
Year Census 1824 First Census of Singapore 1825 Second Census of Singapore 1826 Third Census of Singapore 1827 Fourth Census of Singapore 1828 Fifth Census of Singapore 1829 Sixth Census of Singapore 1830 Seventh Census of Singapore 1831 Eighth Census of Singapore 1832 Ninth Census of Singapore 1833 Tenth Census of Singapore 1834 Eleventh Census of Singapore 1836 Twelfth Census of Singapore 1840 Thirteenth Census of Singapore 1849 Fourteenth Census of Singapore 1860 Fifteenth Census of Singapore The first official census that was taken in Singapore was in 1871 by the Straits
Settlement of Singapore, and thereafter conducted regularly in 10-years interval with
some interruption during World War II. The first post-independence census taken in
Singapore was in 1970.
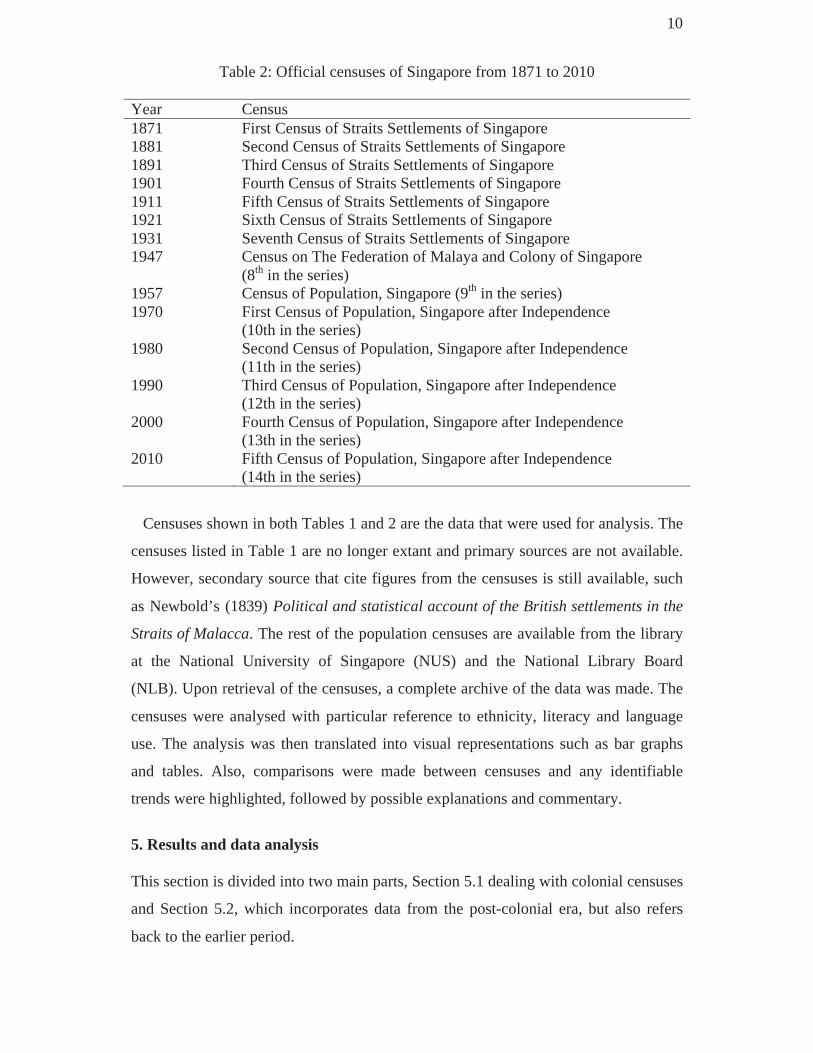
10
Table 2: Official censuses of Singapore from 1871 to 2010 Year Census 1871 First Census of Straits Settlements of Singapore 1881 Second Census of Straits Settlements of Singapore 1891 Third Census of Straits Settlements of Singapore 1901 Fourth Census of Straits Settlements of Singapore 1911 Fifth Census of Straits Settlements of Singapore 1921 Sixth Census of Straits Settlements of Singapore 1931 Seventh Census of Straits Settlements of Singapore 1947 Census on The Federation of Malaya and Colony of Singapore
(8th in the series) 1957 Census of Population, Singapore (9th in the series) 1970 First Census of Population, Singapore after Independence
(10th in the series) 1980 Second Census of Population, Singapore after Independence
(11th in the series) 1990 Third Census of Population, Singapore after Independence
(12th in the series) 2000 Fourth Census of Population, Singapore after Independence
(13th in the series) 2010 Fifth Census of Population, Singapore after Independence
(14th in the series)
Censuses shown in both Tables 1 and 2 are the data that were used for analysis. The
censuses listed in Table 1 are no longer extant and primary sources are not available.
However, secondary source that cite figures from the censuses is still available, such
as Newbold’s (1839) Political and statistical account of the British settlements in the
Straits of Malacca. The rest of the population censuses are available from the library
at the National University of Singapore (NUS) and the National Library Board
(NLB). Upon retrieval of the censuses, a complete archive of the data was made. The
censuses were analysed with particular reference to ethnicity, literacy and language
use. The analysis was then translated into visual representations such as bar graphs
and tables. Also, comparisons were made between censuses and any identifiable
trends were highlighted, followed by possible explanations and commentary.
5. Results and data analysis This section is divided into two main parts, Section 5.1 dealing with colonial censuses
and Section 5.2, which incorporates data from the post-colonial era, but also refers
back to the earlier period.

11
5.1 Colonial censuses (1824-1957) During the British colonial rule, the censuses that were taken covered the Straits
Settlements, which included Penang, Malacca and Singapore. The Straits Settlements
were those parts of British Malaya under direct rule of British colonial officials, and
together with the Federated Malay States and the Unfederated Malay States
constituted what was ‘British Malaya’ from the late nineteenth century until 1957, as
illustrated by Figure 2 below.
Figure 2: Map showing the territories of British Malaya (Malay Factbook 2014)
The first recorded census of Singapore was recorded in January 1824. It was only in
April 1871 when the first systematic census taking of Singapore was administered by
the British colonial government.
5.1.1 1824 to 1836 censuses Early censuses were carried out unofficially by police officers that were not trained in
census taking. Though the accuracy of these early censuses might be questionable, the
12
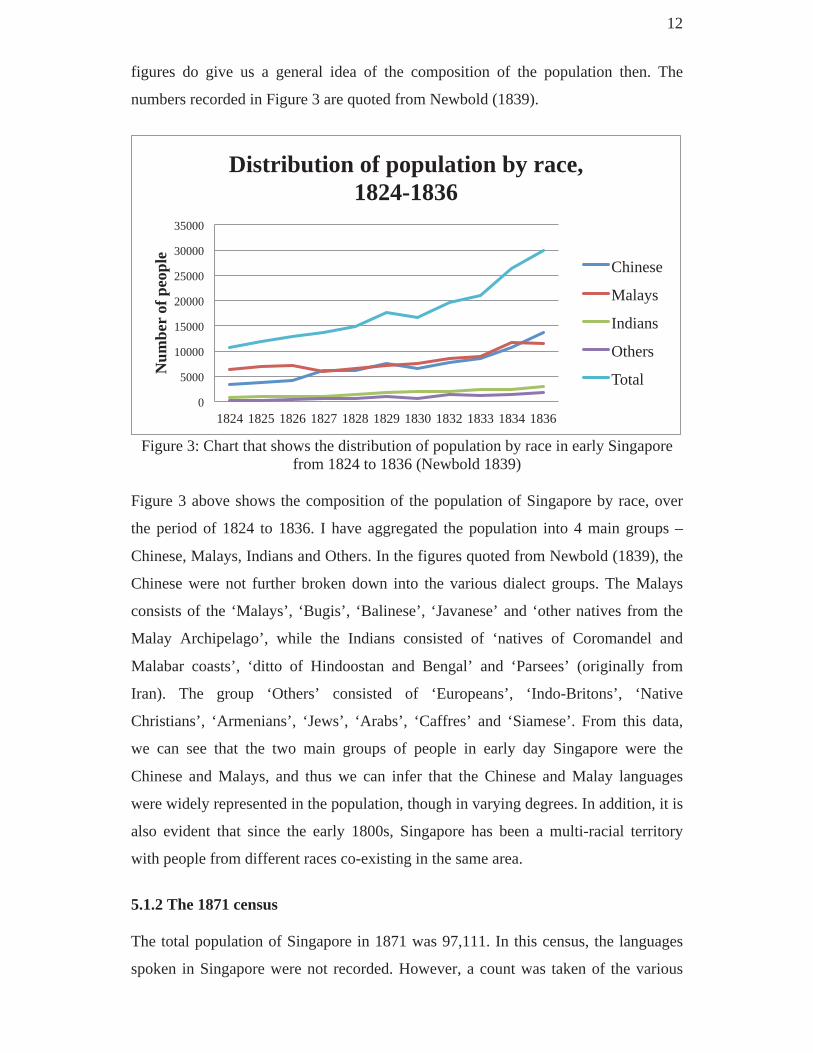
figures do give us a general idea of the composition of the population then. The
numbers recorded in Figure 3 are quoted from Newbold (1839).
Figure 3: Chart that shows the distribution of population by race in early Singapore
from 1824 to 1836 (Newbold 1839) Figure 3 above shows the composition of the population of Singapore by race, over
the period of 1824 to 1836. I have aggregated the population into 4 main groups –
Chinese, Malays, Indians and Others. In the figures quoted from Newbold (1839), the
Chinese were not further broken down into the various dialect groups. The Malays
consists of the ‘Malays’, ‘Bugis’, ‘Balinese’, ‘Javanese’ and ‘other natives from the
Malay Archipelago’, while the Indians consisted of ‘natives of Coromandel and
Malabar coasts’, ‘ditto of Hindoostan and Bengal’ and ‘Parsees’ (originally from
Iran). The group ‘Others’ consisted of ‘Europeans’, ‘Indo-Britons’, ‘Native
Christians’, ‘Armenians’, ‘Jews’, ‘Arabs’, ‘Caffres’ and ‘Siamese’. From this data,
we can see that the two main groups of people in early day Singapore were the
Chinese and Malays, and thus we can infer that the Chinese and Malay languages
were widely represented in the population, though in varying degrees. In addition, it is
also evident that since the early 1800s, Singapore has been a multi-racial territory
with people from different races co-existing in the same area.
5.1.2 The 1871 census The total population of Singapore in 1871 was 97,111. In this census, the languages
spoken in Singapore were not recorded. However, a count was taken of the various
0
5000
10000
15000
20000
25000
30000
35000
1824 1825 1826 1827 1828 1829 1830 1832 1833 1834 1836
Num
ber
of p
eopl
e Distribution of population by race,
1824-1836
Chinese
Malays
Indians
Others
Total

13
ethnic groups that were living in Singapore. It might be a logical assumption that the
various ethnic groups would be speaking their native languages as they were mainly
migrants to Singapore and were living among fellow migrants from the same region,
town or village, thus allowing for the use of their native languages. Looking at the
census, the data includes the numerical breakdown on the number of inhabitants
classified according to their ethnicity. These numerical values are converted into
percentages for the entire population and represented in a bar graph shown below.
Total population: 97,111 Figure 4: Racial composition of Singapore according to the 1871 census of the Straits
Settlements From the bar graph above, it is apparent that the majority of the population of
Singapore in 1871 were the Chinese (56.2%), followed by the Malays (19.8%) then
Indians (11.0%). The Indian population was made up of the ‘Bengalees’1, ‘Klings’2
[Tamils] and the Indian military. Other significant ethnic groups residing in Singapore
then include ‘Eurasians’ (2.2%) and ‘Europeans and Americans’ (2.0%). The ethnic
groups that were represented in the category ‘Others’ (8.8%) included ‘Arabs’,
‘Boyanese’3, ‘Bugis’4, ‘Cochin-Chinese’5, ‘Dyaks’6, ‘Abyssinians’7 and ‘Siamese’
among others.
Based on the above data of ethnic groups that were present in Singapore and
following the assumption that they spoke their native vernacular languages, we can
hypothesise that the languages spoken in Singapore in 1871 included Chinese, South
Asian, Malay, Western and even African languages. Another interesting finding from
the census is the fact that majority of schoolmaster and schoolmistresses are ‘Natives’
56.2%
19.8%
11.0%
2.2% 2.0% 8.8%
Chinese Malays Indians Eurasians Europeans & Americans
Others
1871 census

14
instead of ‘Europeans’ and ‘Eurasian’. According to the 1871 census (15), there were
17 Europeans and Eurasians schoolmasters and schoolmistresses while there were 143
‘Natives’. This is an interesting point to note as these natives make up the majority of
the authority in school. What piques my curiosity is what was/were the language(s)
used by the teachers to teach their students and what language(s) did the students use
to communicate among themselves. However, this line of enquiry falls out of the
scope of this project but might be the focus of a future investigation of early education
in Singapore.
5.1.3 The 1881 census The total population of Singapore in 1881 was 139,208, and again the census included
no questions on languages. Here again, however, the ethnic composition of the
population may serve to provide an indication of the languages that were spoken at
that time.
Total population: 139,208 Figure 5: Racial composition of Singapore according to the 1881 census of the Straits
Settlements From Figure 5 above, we see that the Chinese population maintained its position as
the most populous ethnic group (62.3%) in Singapore, followed by the Malays
(15.9%) and the Indians (8.7%). What differs from the previous census is that we see
an increase in migrants from other parts of the Malay Archipelago, such as the
Javanese (4.2%), Boyanese (1.5%) and the Bugis (1.5%), which might indicate a
greater variety of Malay languages being spoken on the island. The 1881 census was
62.3%
15.9% 8.7%
4.2% 2.2% 2.0% 1.5% 1.5% 1.7%
Chinese Malays Indians Javanese Eurasians Europeans & Americans
Boyanese Bugis Others
1881 census
15
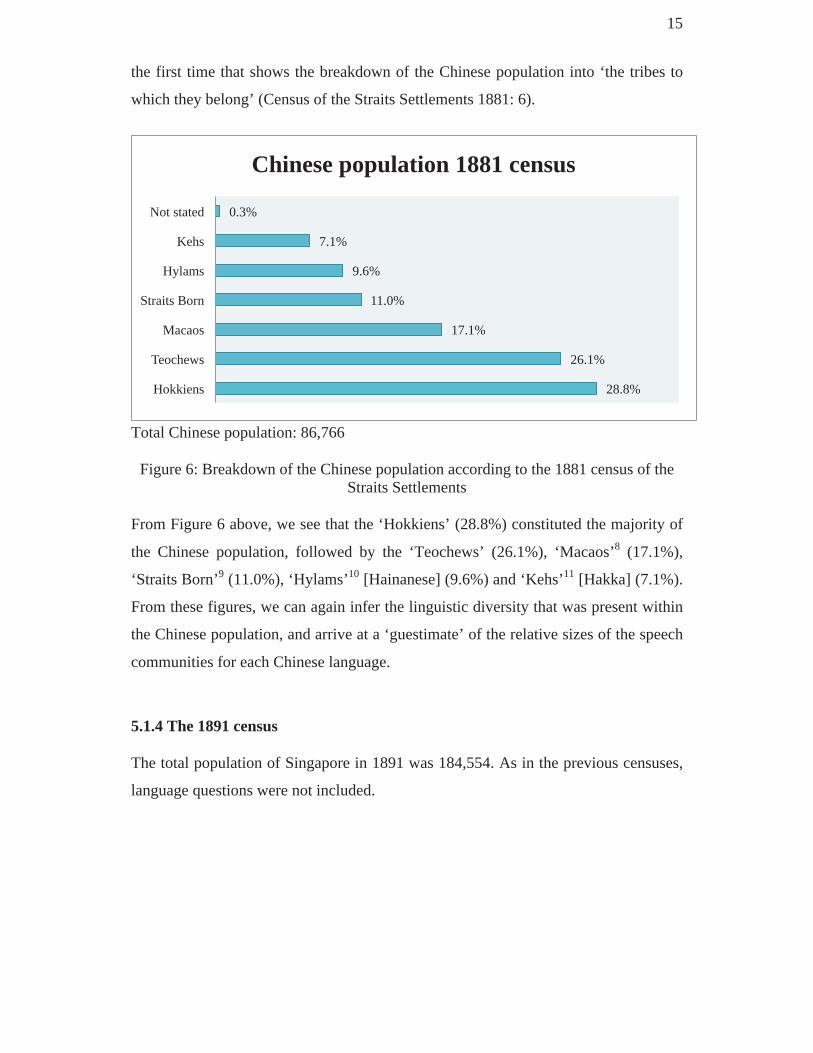
the first time that shows the breakdown of the Chinese population into ‘the tribes to
which they belong’ (Census of the Straits Settlements 1881: 6).
Total Chinese population: 86,766
Figure 6: Breakdown of the Chinese population according to the 1881 census of the Straits Settlements
From Figure 6 above, we see that the ‘Hokkiens’ (28.8%) constituted the majority of
the Chinese population, followed by the ‘Teochews’ (26.1%), ‘Macaos’8 (17.1%),
‘Straits Born’9 (11.0%), ‘Hylams’10 [Hainanese] (9.6%) and ‘Kehs’11 [Hakka] (7.1%).
From these figures, we can again infer the linguistic diversity that was present within
the Chinese population, and arrive at a ‘guestimate’ of the relative sizes of the speech
communities for each Chinese language.
5.1.4 The 1891 census The total population of Singapore in 1891 was 184,554. As in the previous censuses,
language questions were not included.
28.8%
26.1%
17.1%
11.0%
9.6%
7.1%
0.3%
Hokkiens
Teochews
Macaos
Straits Born
Hylams
Kehs
Not stated
Chinese population 1881 census

16
Total population: 184,554 Figure 7: Racial composition of Singapore according to the 1891 census of the Straits
Settlements Looking at the racial composition of the population based on Figure 7 above, it is
similar to that of previous years with the Chinese population being the most populous
(66.1%), followed by the Malays (12.3%) and Indians (8.7%). One interesting point
to note in the 1891 census is the way in which the races were grouped in the census.
As previously, the different groups of Chinese people were categorised under a single
category ‘Chinese’, and general classificatory labels were also extended to Malays
and Indians as well. However (unlike present day censuses), sub-categories for these
larger groupings were also provided. Thus, the category of ‘Malays and other Natives
of the Archipelago’ consisted of ‘Achinese’12, ‘Boyanese’, ‘Bugis’, ‘Dyaks’,
‘Javanese’, ‘Jawi-Pekans’13, ‘Malays’ and ‘Manilamen’14. Another category described
as ‘Tamils and other natives of India’ comprised ‘Bengalis’, ‘Burmese’, ‘Parsees’15
and ‘Tamils’. This amalgamation of the races under single categories no doubt
reflected the way in which British officials viewed the Singapore population, as well
as notions of race and ethnicity in the late nineteenth century. In similar fashion, the
category for ‘Chinese population’ also provided details concerning Chinese ethnicity
and language groupings, as illustrated by Figure 8.
66.1%
12.3% 8.7% 4.6% 3.60% 2.8% 1.9%
Chinese Malays Indians Javanese Others Europeans & Americans
Eurasians
1891 census

17
Total Chinese population: 86,766
Figure 8: Breakdown of the Chinese population according to the 1891 census of the Straits Settlements
Figure 8 above shows the breakdown of the Chinese population into their various
‘tribes’, as they were called in the official census report (Census of the Straits
Settlements 1891: 36) The composition of the Chinese community was similar to that
in earlier reports, with the Hokkiens being the most populous (37.6%), followed by
the Teochews (19.5%) and Cantonese (19.2%). However, one difference in the
terminology is that the Cantonese ‘tribe’, was known was ‘Macaos’ in the 1881
census, but was reclassified as ‘Cantonese’ ten years later.
5.1.5 The 1901 census The total population of Singapore in 1901 was 228,555. The racial composition of
Singapore in 1901 was as follows: Chinese (71.8%), Malays (10.1%), Indians (7.8%),
Others (6.8%), Eurasians (1.8%) and Europeans & Americans (1.7%).
37.6%
19.5%
19.2%
10.5%
7.1%
6.1%
Hokkiens
Teochews
Cantonese
Straits-born
Hylams
Khehs
Chinese population 1891 census

18
Total Chinese population: 86,766
Figure 9: Breakdown of the Chinese population according to the 1901 census of the Straits Settlements
In 1901, the Hokkien tribe was still the most populous ethnic Chinese group.
However, the ‘Cantonese’ (18.8%) now outnumbered the ‘Teo-Chius’ (16.8%) as the
second most populous Chinese ethnic group. The ‘Hok-Chiu’16 group was not
mentioned in previous censuses but was named for the first time in 1901. One very
interesting comment included in this census, related to the selection of enumerators
for the ‘Chinese quarters’ of the city, which mentions the bilingual abilities of Straits-
born Chinese:
So. It was found possible through the agency of Mr Ho Yang Peng, Chinese Sub-
Postmaster, Singapore, to find a sufficient number of Straits-born Chinese to act as
Enumerators throughout the purely Chinese quarter of the town i.e. much of the Town
living between the River, New Bridge Road and the sea. Naturally the filling up of
schedules for illiterate Chinese was down more efficiently by Straits-born lads of fair
education, speaking both Chinese and Malay, then would have been the case if the work
had been entrusted to Malays, as has been the case to some extent at previous Censuses.
(Report of the census of the Straits Settlements 1901: 24)
From this, we learn that the Straits-born Chinese were bilingual in Chinese and
Malay, which may have been due to their mixed heritage, and to the length of
settlement of their families in the city (Frost 2003).
36.0% 18.8%
16.8% 9.4%
7.9% 5.8%
5.2% 0.2%
Hokkien Cantonese Teo-Chiu
Straits Born Hok-Chiu
Hailam Kheh
Not stated
Chinese population 1901 census

19
5.1.6 The 1911 census The total population of Singapore in 1911 was 311,985, and this was the first census
when specific language questions were asked. At this time, the racial composition of
the population was as follows: Chinese (71.4%), Malays (15.0%), Indians (9.0%) and
Others (4.6%). However, what is interesting to note here is that the Chinese were not
classified according to the various ‘tribes’ as in the earlier censuses, but, this time,
they were classified according to their birthplace, whether they were ‘China-born
Chinese’ or ‘Straits-born Chinese’. This indicates that there was now an official
differentiation between these two groups in the eyes of colonial officials, which may
have reflected a distinction growing in the community at the time.
The 1911 census is noteworthy, as mentioned above, because it was the first time
that the languages that were spoken by the population have a specific mention in the
data. The number of people speaking each language was tabulated, which provides
more precise information on the level of multilingualism of Singapore, and the
relative sizes of distinct speech communities in the community at this time. From the
tabulation in the census data, we see that there were a total of 57 languages spoken
within Singapore and there were 20 languages with at least 500 speakers. With 57
languages being spoken in such a small territorial area, one can only imagine the
number of languages one could hear by just walking around colonial Singapore.
Table 3: Table showing the size of the various Chinese speech communities according to the 1911 census of the Straits Settlements
Chinese languages in Singapore (1911)
Language Number of speakers Percentage of population Hok-kien 91,549 29.3% Cantonese 48,739 15.6% Teo-chiu 37,507 12.0% Kheh 12,487 4.0% Hailam 10,775 3.5% Hok-chiu 3,653 1.2% Hok-chhia 3,640 1.2% Hing-hoa 1,925 0.6% Mandarin dialects 252 0.1% Kau-chiu 86 0.03% Lui-chiu 77 0.02% Hai-lo-hong 5 0.002%

20
From Table 3 above, we have an indication of sizes of Chinese language speech
communities in Singapore in 1911. As earlier, the most populous Chinese speech
community were the Hokkiens, followed by the Cantonese and Teo-chiu (Teochew)
communities. What is particularly interesting here is that the speech community of
those speaking the Mandarin dialect is one of the smallest, at only 0.1% of the
population (some 252 speakers of the variety). From being one of the smallest
Chinese speech community, it is interesting to chart the rise of Mandarin speakers
over the years, an important trend which is discussed in later sections of this paper. In
addition to detailed information concerning speakers of Chinese languages, the 1911
census also yields interesting information relating to speakers of Malay languages, as
illustrated in Table 4.
Table 4: Table showing the size of the various Malay speech communities according to the 1911 census of the Straits Settlements
Malay languages in Singapore (1911)
Languages Number of speakers Percentage of population
Malay 49,425 15.8% Javanese 7,353 2.4% Boyanese 3,858 1.2% Bugis 686 0.2% Arabic 665 0.2% Banjarese 24 0.01% Annamese 11 0.004% Aboriginal dialects 8 0.003% Bundu 4 0.001% Achehnese 3 0.001%
From Table 4 above, we see the different languages that are spoken by the Malay
community. The majority spoke Malay (15.8%), followed by Javanese (2.4%). Other
minority Malay languages being spoken were Boyanese (1.2%), Bugis (0.2%),
Banjarese (0.01%), Bundu (0.001%) and Achenese (0.001%). Interestingly, a small
number of speakers of aboriginal dialects were also reported as living in the
community at this time (0.003%, a total of 8).

21
Table 5: Table showing the size of the various Indian speech communities according to the 1911 census of the Straits Settlements
Indian languages in Singapore (1911)
Languages Number of speakers Percentage of population
Tamil 19,378 6.2% Hindustani 2,471 0.8% Bengali 1,486 0.5% Malayalam 1,208 0.4% Punjabi 238 0.1% Gurumuki 222 0.1% Urdu 197 0.1% Singhalese 157 0.1% Gujarati 142 0.05% Telugu 136 0.04% Hindi 70 0.02% Sindi 57 0.02% Kabuli 32 0.01% Canarese 4 0.001% Gurka 3 0.001% Parsi 3 0.001% Pushtu 3 0.001% Marathi 2 0.001% Oriya 2 0.001% Pathani 2 0.001%
From Table 5 above, we have an idea of the many South Asian languages that were
spoken in Singapore at that time. The largest speech community is the Tamils (6.2%),
followed by the Hindustani (0.8%). However, there are so many more Indian
languages that were spoken such as Bengali (0.5%), Punjabi (0.1%) and Singhalese
(0.1%) just to name a few. These figures from the 1911 census show us the extent of
multilingualism that was present in Singapore at that time. As compared to present
day Singapore, the Singapore of the past seems to have a greater degree of
multilingualism.
5.1.7 The 1921 census The total population of Singapore in 1921 was 350,355. The racial composition of the
population was as follows: Chinese (74.5%), Malays (13.7%), Indians (7.6%),
22
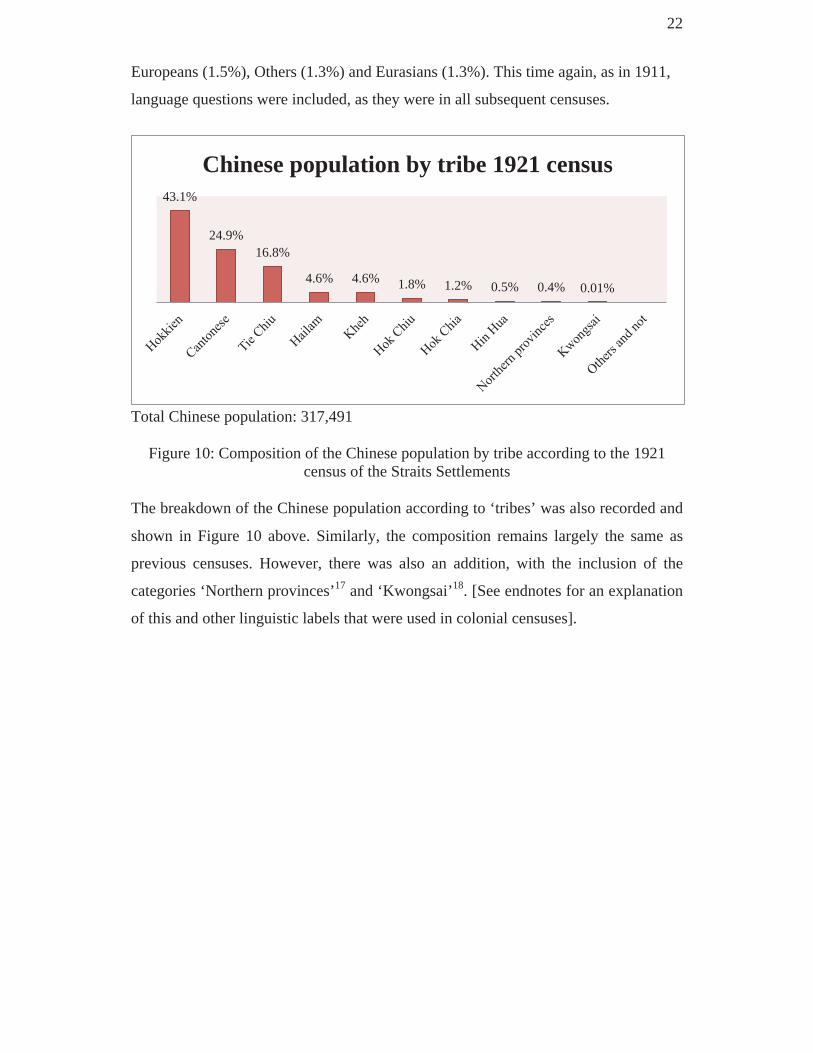
Europeans (1.5%), Others (1.3%) and Eurasians (1.3%). This time again, as in 1911,
language questions were included, as they were in all subsequent censuses.
Total Chinese population: 317,491
Figure 10: Composition of the Chinese population by tribe according to the 1921 census of the Straits Settlements
The breakdown of the Chinese population according to ‘tribes’ was also recorded and
shown in Figure 10 above. Similarly, the composition remains largely the same as
previous censuses. However, there was also an addition, with the inclusion of the
categories ‘Northern provinces’17 and ‘Kwongsai’18. [See endnotes for an explanation
of this and other linguistic labels that were used in colonial censuses].
43.1%
24.9% 16.8%
4.6% 4.6% 1.8% 1.2% 0.5% 0.4% 0.01%
Chinese population by tribe 1921 census

23
Total Malay population: 58,520 Figure 11: Composition of the Malay population by race according to the 1921 census
of the Straits Settlements The 1921 also included, for the first time, a detailed breakdown of the Malay
population by race. From Figure 11 above, it is evident that the Malays constituted the
majority (60.2%), followed by the ‘Javanese’ (23.0%) and the ‘Boyanese’ (11.3%).
There are also other minority groups such as the ‘Bornean races’ (2.9%), ‘Bugis’
(2.0%) and the ‘Banjarese’19 (0.6%).
Total Indian population: 32,456 Figure 12: Composition of the Indian population by race according to the 1921 census
of the Straits Settlements
60.2%
23.0%
11.3% 2.9% 2.0% 0.6%
Malays Javanese Boyanese Bornean races Bugis Banjarese
Malay population by race 1921 census
79.6%
5.6% 4.7% 4.2% 2.7% 0.6% 0.5% 0.4% 0.1% 1.5%
Indian population by race 1921 census

24
The composition of the Indian population by race was also noted for the first time in
1921. From Figure 12 above, the Tamil constituted the majority (79.6%) and there
were also significant proportions of ‘Bengali’ (5.6%) ‘Punjabi’ (4.7%), ‘Malayali’
(4.2%) and ‘Hindustani’ (2.7%).
The 1921 census was the first time in the Straits Settlements that literacy and ability
to speak English were asked, after about one century since Sir Stamford Raffles first
landed on the shores of Singapore. One thing to note, was that the superintendent of
the 1921 census, J.E. Nathan wrote in his commentary, the ‘stupidity and
carelessness’ of the enumerators might have resulted in an unduly high return of the
number of persons that claimed that they were literate. He also noted that the test of
literacy was just a simple ‘yes’ or ‘no’ from the respondents, and this might lead to
some inaccuracy of the results. He even goes on to give suggestions on how this could
be better improved for the 1931 census and that is to formulate two kinds of
questions, ‘Can you read and write?’ and ‘Can you read and write English?’ As of
1921, the test of literacy was determined by the ‘ability to read and write a letter’
(107). Nevertheless, the data collected in 1921, though with its potential flaws, gives
us an idea of the magnitude of those who knew the English language at that time. It
was recorded that 5.6% of the population were literate in English and 31.0% were
literate in other languages, while 60.9% were illiterate. Other than literacy, the ability
to speak English was also noted. 8.3% of the population were able to speak English,
while 91.2% were unable to speak English. From these figures from the 1921 census,
it is evident that only a small minority of the population (including Europeans,
Eurasians and Americans) claimed to be literate in English and able to speak the
language (around 8% for both skills).
5.1.8 The 1931 census The total population of Singapore in 1931 was 567,453. The racial composition of the
population was as follows: Chinese (74.3%), Malaysians (12.5%), Indians (9.0%),
Others (1.5%), Europeans (1.4%) and Eurasians (1.2%). There are a few points of
interest to note in this census. Firstly, the superintendent of the 1931 census, Vlieland,
provided a lengthy definition on the term ‘race’. In his words,
The term “Race” is used, for the purposes of a Malayan census, in a peculiar sense, which
requires explanation. The information, which it is desires to obtain from the results of

25
enquiries under this heading, is of importance for a variety of purposes, and the word
“Race” is used, for lack of a more appropriate term, to cover a complex set of ideas of
which race, in the strict or scientific sense, is only one small element. It would be of little
use to the administrator or the merchant to attempt a classification of the population by
race in the ethnographic sense, to say nothing of the fact that any such tentative
classification would be highly controversial. An attempt at classification by “nationality,”
or, more exactly, by national status or political allegiance, would be almost equally open
to controversy, and of little, if any, greater practical value. It is, in fact impossible to
define the sense in which the term “Race” is used for census purposes; it is, in reality, a
judicious blend, for practical ends, of the ideas of geographic and ethnographic origin,
political allegiance, and racial and social affinities and sympathies. (Vlieland 1931: 73)
Also, there has been a revision in the use of the racial term ‘Malay’ to ‘Malaysians’.
According to Vlieland, ‘the term “Malaysians” is used to include all indigenous
peoples of the Malay Peninsula and Archipelago, and the term “Malay” to include
only those Malaysians (excluding aboriginals) who belong to British Malaya.’ (75)
Furthermore, there were changes in spelling of the terms for some Chinese ethnic
groups. For example, the term ‘Tiu Chiu’ was replaced by ‘Tie Chiu’, and the term
‘Hok Chhia’ is replaced by ‘Hok Chia’.
Secondly, Vlieland noted ‘there is, in fact, no oral medium of communication
between two Chinese of different “tribes,” if each speaks only the language of his
own “tribe”’ (78). He also added that the Communist movement in China that started
in 1921 resulted in the standardisation of Mandarin as the medium of instruction in
schools in China and this had an impact on the Chinese population in Singapore as
well. Mandarin became the medium of education in most Chinese schools in Malaya,
‘of which there are about six hundred [schools] representing between fifty and sixty
thousand pupils’ (78). Thus, we can see the rise of the importance of Mandarin as the
language in the Chinese population since the early 1920s onwards.
The test of literacy used in 1931 was determined by these three questions – ‘Can
you read and write?’, ‘Can you read and write English?’ and ‘Can you speak
English?’ (Vlieland 1931: 91). The census recorded 9.1% of the population being
literate in English and 9.4% of the population being able to speak English.

26
5.1.9 The 1947 census The total population of Singapore in 1947 was 976,839. The racial composition of the
population was as follows: Chinese (74.8%), Malays (11.9%), Indians (7.5%),
Europeans (3.1%), Others (1.7%) and Eurasians (0.9%).
What is interesting to note here is that Del Tufo, the superintendent of the 1947
census, went on to further define the term ‘race’. He notes that ‘race’ is not defined by
one’s nationality and in the case of mixed marriages, ‘race’ was “the name of the
community which accepts the individual and to which he claims to belong” (Del Tufo
1947: 71). Also, in this census, there was a distinction made between ‘Malaysians’
and ‘Other Malaysians’. Del Tufo noted, ‘the distinction between the Malays and the
Other Malaysians is not very great’ (72), and the ‘Other Malaysians’ and
‘Malaysians’ are able to assimilate into a single community. However, Del Tufo
suggested that results should be tabulated separately for Malays and Other Malaysians
to see if there are more distinctions that would emerge.
In the 1947 census, literacy in three languages was asked – Malay, English and any
other language. The questions asked were, ‘Can you read and write Malay?’, ‘Can
you read and write English?’ and ‘Can you read and write any other language?’. A
person was considered as literate if he had the ability ‘to read and write a simple letter
in the language and the reply was restricted to “yes” or “no”’. (90). Del Tufo, also
noted that the first two questions were asked ‘in order that the results might provide
one of the bases for later estimates of the number of non-Malays who would be
affected by the draft constitutional provisions relative to citizenship at that time under
consideration; and the second was inserted not only for the same reason but also to
enable comparisons to be made with the 1931 figures’ (90), and these questions were
‘politically biased’ (90). The tabulation of English literacy rates excluded the
European and Eurasian populations, and even so, a rate of 9.4% was recorded as
literate in English.

27
Figure 13: Percentage of total population of Singapore literate in Malay, by race according to the 1947 census of the Straits Settlements
As mentioned, Malay literacy rates were included in the 1947 census. Figure 12 above
shows the percentage of population (other than ‘Malaysians’ and ‘Other Malaysians’)
who were literate in Malay, by race. It is interesting to note that there is a sizeable
proportion of people from each racial group that were literate in Malay, with the
largest percentage (19.3%) from ‘Others’, followed by Europeans (9.6%), Eurasians
(4.7%), Indians (4.6%) and Chinese (0.9%).
5.1.10 The 1957 census The total population of Singapore in 1957 was 1,479,313. The racial composition of
the population was as follows: Chinese (75.4%), Malaysians (13.6%), Indians &
Pakistanis (8.6%) and Others (2.4%).
19.3%
9.6%
4.7% 4.6% 0.9%
Others Europeans Eurasians Indians Chinese
Percentage of population literate in Malay, by race 1947 census

28
Total Chinese population: 1,090,596 Figure 14: Composition of the Chinese community as according to the 1957 census of
the Straits Settlements Figure 14 above shows the breakdown of the Chinese population into communities.
The most populous group remained to be the ‘Hokkiens’ (40.6%), followed by the
‘Teochews’ (22.5%) and ‘Cantonese’ (18.9%). The ‘Kheh’ community has been
renamed ‘Hakka’ and the ‘Hokchiu’ to ‘Foochow’.
Total Malaysian population: 190,059 Figure 15: Composition of the Malay community according to the 1957 census of the
Straits Settlements
40.6%
22.5% 18.9% 7.2% 6.7%
1.5% 1.0% 0.8% 0.7% 0.1% <0.03%
Chinese population, by community 1957 census
68.8%
18.3% 11.2%
0.7% 0.5% 0.2% 0.1% 0.1%
Malay Javanese Boyanese Malaysians' & 'Indonesians'
Bugis Banjarese Other Malaysians
Menangkabau
Malaysian population, by community 1957 census
29
Figure 15 above shows the breakdown of the Malay population into communities. The
largest community was the ‘Malays’ (68.8%) followed by the ‘Javanese’ (18.3%) and
‘Boyanese’ (11.2%).
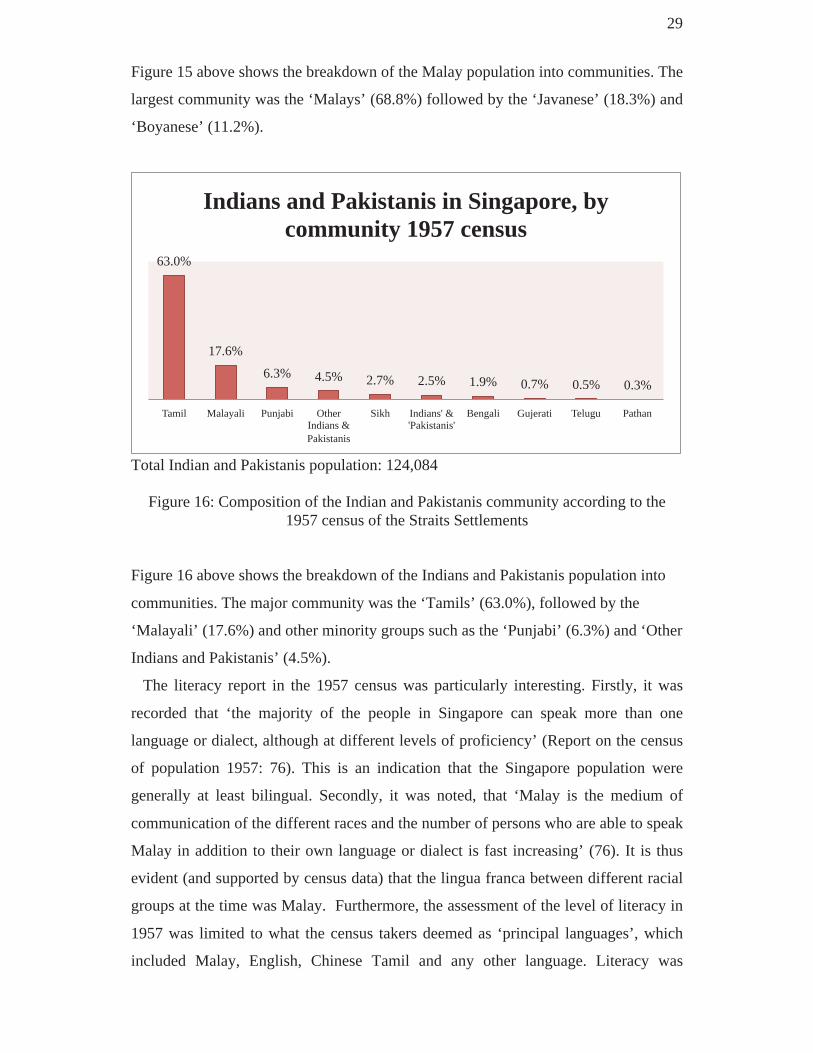
Total Indian and Pakistanis population: 124,084
Figure 16: Composition of the Indian and Pakistanis community according to the 1957 census of the Straits Settlements
Figure 16 above shows the breakdown of the Indians and Pakistanis population into
communities. The major community was the ‘Tamils’ (63.0%), followed by the
‘Malayali’ (17.6%) and other minority groups such as the ‘Punjabi’ (6.3%) and ‘Other
Indians and Pakistanis’ (4.5%).
The literacy report in the 1957 census was particularly interesting. Firstly, it was
recorded that ‘the majority of the people in Singapore can speak more than one
language or dialect, although at different levels of proficiency’ (Report on the census
of population 1957: 76). This is an indication that the Singapore population were
generally at least bilingual. Secondly, it was noted, that ‘Malay is the medium of
communication of the different races and the number of persons who are able to speak
Malay in addition to their own language or dialect is fast increasing’ (76). It is thus
evident (and supported by census data) that the lingua franca between different racial
groups at the time was Malay. Furthermore, the assessment of the level of literacy in
1957 was limited to what the census takers deemed as ‘principal languages’, which
included Malay, English, Chinese Tamil and any other language. Literacy was
63.0%
17.6%
6.3% 4.5% 2.7% 2.5% 1.9% 0.7% 0.5% 0.3%
Tamil Malayali Punjabi Other Indians & Pakistanis
Sikh Indians' & 'Pakistanis'
Bengali Gujerati Telugu Pathan
Indians and Pakistanis in Singapore, by community 1957 census
30
‘defined as the ability to read and write a simple letter’ (76). The fact that only four
‘principal languages’ mattered in the assessment of literacy rates indicates the shifting
stance of the Singapore government towards these languages as important languages
and finally instituting them as official languages in 1965.
The most interesting information from this census is the data that tabulates the
‘mother tongue’ of a person by racial group. According to Chua the superintendent of
the 1957 census, one’s mother tongue is the language or dialect principally spoken in
home in early childhood. He added, ‘from the point of view of information on cultural
and social assimilation and interaction between cultural and social group, mother
tongue may be regarded as a necessary supplement to racial group’ (Chua 1964: 9).
Looking at the figures, a majority of the people professed their mother tongue to be
that of their native ‘tribe’, however, there were also a small percentage of people who
claimed their mother tongue was not a language normally associated with their
particular ethnic group.
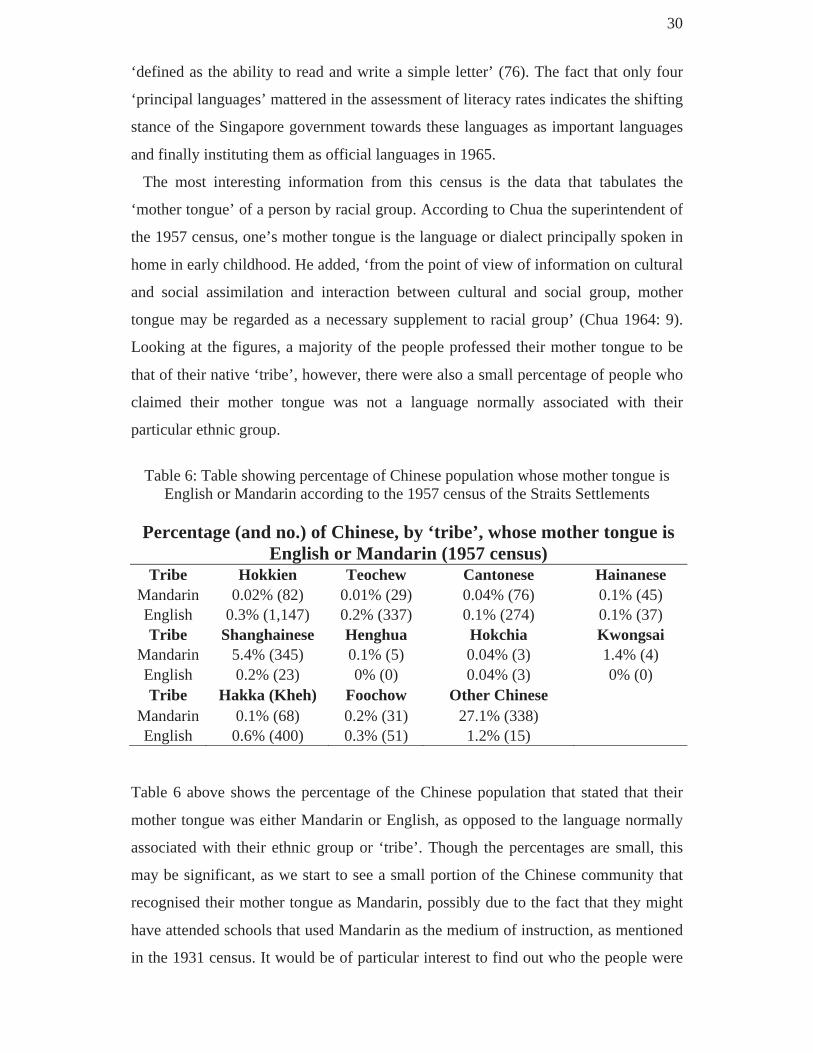
Table 6: Table showing percentage of Chinese population whose mother tongue is
English or Mandarin according to the 1957 census of the Straits Settlements
Percentage (and no.) of Chinese, by ‘tribe’, whose mother tongue is English or Mandarin (1957 census)
Tribe Hokkien Teochew Cantonese Hainanese Mandarin 0.02% (82) 0.01% (29) 0.04% (76) 0.1% (45) English 0.3% (1,147) 0.2% (337) 0.1% (274) 0.1% (37) Tribe Shanghainese Henghua Hokchia Kwongsai
Mandarin 5.4% (345) 0.1% (5) 0.04% (3) 1.4% (4) English 0.2% (23) 0% (0) 0.04% (3) 0% (0) Tribe Hakka (Kheh) Foochow Other Chinese
Mandarin 0.1% (68) 0.2% (31) 27.1% (338) English 0.6% (400) 0.3% (51) 1.2% (15)
Table 6 above shows the percentage of the Chinese population that stated that their
mother tongue was either Mandarin or English, as opposed to the language normally
associated with their ethnic group or ‘tribe’. Though the percentages are small, this
may be significant, as we start to see a small portion of the Chinese community that
recognised their mother tongue as Mandarin, possibly due to the fact that they might
have attended schools that used Mandarin as the medium of instruction, as mentioned
in the 1931 census. It would be of particular interest to find out who the people were

31
that professed English to be their mother tongue, although this information is not
available from the census.
Table 7: Table showing percentage of Malay population whose mother tongue is English or Malay according to the 1957 census of the Straits Settlements
Percentage (of no.) of Malay, by race, whose mother tongue is
Malay or English (1957 census) Race Malay Javanese Boyanese Malay 0.0% (0) 59.5% (21,434) 36.0% (7,977)
English 0.1% (93) 0.03% (10) 0.01% (3) Race Menangkabau Malaysians' & 'Indonesians' Other Malaysians Malay 69.6% (112) 62.4% (837) 66.4% (196)
English 1.2% (2) 3.3% (44) 4.1% (12) Race Bugis Banjarese Malay 70.2% (750) 73.2% (259)
English 0.0% (0) 0.0% (0) Table 7 above shows the percentage of Malay population that stated that their mother
tongue was either English or Malay. One striking observation about this set of data is
that there is large proportion of non-ethnic Malays that professed their mother tongue
as Malay. From the table, we can see that a large number of ‘Banjarese’ (73.2%),
‘Bugis’ (70.2%), ‘Menangkabau’ (69.6%), ‘Other Malaysians’ (66.4%), ‘Malaysians
& Indonesians’ (62.4%), ‘Javanese’ (59.5%) and ‘Boyanese’ (36.0%) professed that
their mother tongue is Malay.

32
Table 8: Table showing percentage of Indian population whose mother tongue is English or Tamil
Percentage of Indians (and no.), by race, whose mother tongue is
Tamil or English (1957 census) Race Tamil Malayali Punjabi Sikh
Tamil N.A 1.6% (342) 0.3% (23) 0.5% (18)
English 0.9% (691) 2.2% (485) 0.7% (57) 1.4% (47)
Race Gujerati Telugu Pathan Bengali Tamil 0.0% (0) 21.2% (123) 2.2% (7) 0.7% (17)
English 0.7% (6) 3.8% (22) 1.9% (6) 3.2% (77)
Race Indians' & 'Pakistanis' Other Indians & Pakistanis
Tamil 2.4% (73) 2.9% (161) English 5.5% (168) 6.5% (368)
Table 8 above shows the percentage of Indian population that stated that their
mother tongue was either English or Tamil. It is evident from this that there were now
numbers of the non-Tamil population that were reporting Tamil as their mother
tongue, and this is most obvious in the ‘Telugu’ community with 21.2% stating that
Tamil is their mother tongue. Thus, the three tables above present very interesting
data, as we can start to see a shift from a person’s ethnic language to the language of
the majority in each racial population.
5.2 Post-colonial censuses (1970-2010)
This section describes and analyses census data from the independence of Singapore
in 1965 up to the present. These results are discussed in two sections: the first dealing
with the 1970 census, and the second dealing with the four censuses between 1980
and 2010. One thing to note in censuses in the post-colonial era is that there is now a
new distinction made between ‘citizens’ and ‘non-citizens’ in the data. Furthermore,
from 1990 onward, data was collected only from the ‘resident population’, which
would have left out the sizeable proportion of foreigners (1.46 million as of 2011)
who live in Singapore (National population and talent division 2013).
33
5.2.1 The 1970 census The criterion used to assess literacy in 1970 was made more stringent as compared to
that of 1957. The reason for the change in criterion was due to the fact that given ‘the
universal primary education as well as a high level of secondary education [in
Singapore]’ (Report on the census of the population 1970: 100), the measure of
literacy should ‘require not only an ability to read and write but also include an
element of comprehension and understanding capability’ (100). Thus, the criterion for
assessing literacy was modified to ‘ability to read with understanding a newspaper in
any of the four official languages or any other language’ (100).
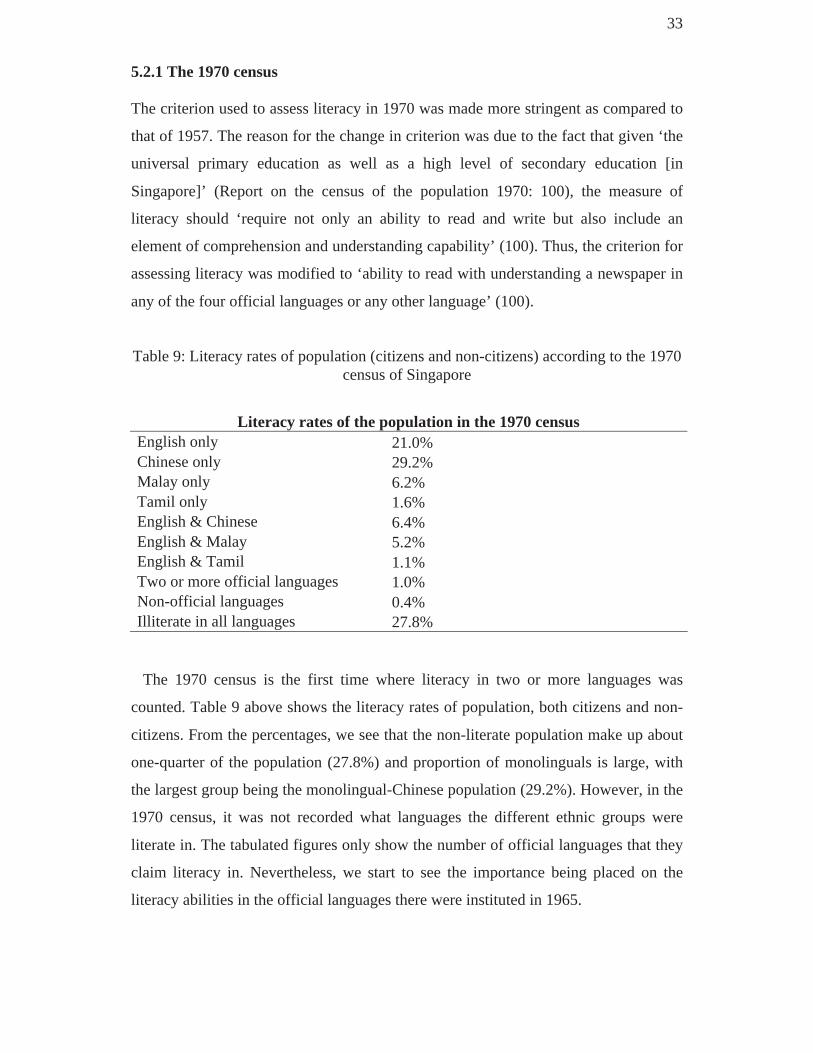
Table 9: Literacy rates of population (citizens and non-citizens) according to the 1970 census of Singapore
Literacy rates of the population in the 1970 census English only 21.0% Chinese only 29.2% Malay only 6.2% Tamil only 1.6% English & Chinese 6.4% English & Malay 5.2% English & Tamil 1.1% Two or more official languages 1.0% Non-official languages 0.4% Illiterate in all languages 27.8%
The 1970 census is the first time where literacy in two or more languages was
counted. Table 9 above shows the literacy rates of population, both citizens and non-
citizens. From the percentages, we see that the non-literate population make up about
one-quarter of the population (27.8%) and proportion of monolinguals is large, with
the largest group being the monolingual-Chinese population (29.2%). However, in the
1970 census, it was not recorded what languages the different ethnic groups were
literate in. The tabulated figures only show the number of official languages that they
claim literacy in. Nevertheless, we start to see the importance being placed on the
literacy abilities in the official languages there were instituted in 1965.

34
5.2.2 The 1980 to 2010 censuses Since the questions asked in the 1980, 1990, 2000 and 2010 censuses are very similar,
I have conflated the discussion of these censuses under a single category. Firstly, the
test of literacy used in these censuses was the one used in 1970, which is the ability to
comprehend a newspaper in that language. Secondly, literacy rates in official
languages were also tabulated. In these sections below, relevant data from the four
censuses in this period are set out in comparative form, in order to provide a concise
illustration of relevant trends in multilingualism that span the colonial to post-colonial
periods. Key issues here include the racial composition of the population, the rise in
English literacy rates, the rise in the literacy rates of ‘mother tongues’, multi-language
literacy in official languages, and the shift in languages used in home domains.
5.2.3 The racial composition of the population
Figure 17: Racial composition of the population from 1871 to 2010, based on census data
Figure 17 above shows the distribution of population in percentages between the
periods of 1871 to 2010. One striking pattern throughout all the census data is that the
proportion of the races in Singapore has been the largely the same. The most populous
racial group had always been the Chinese group, followed by the Malays then Indians.
0.0%
10.0%
20.0%
30.0%
40.0%
50.0%
60.0%
70.0%
80.0%
90.0%
Perc
enta
ge
Racial composition of the population (1871-2010)
Chinese
Malay
Indians
35
The proportion of each racial group over the years will also give us a rough indication
of the size of the various speech communities. In the next section we will chart the
rise and decline of languages in Singapore throughout history.
5.2.4 Rise of official languages and literacy rates in Singapore This section looks at census reports that reveal a rise in the learning of official
languages and a rise in literacy rates in Singapore, with reference to such languages as
English, Mandarin, Malay and Tamil.
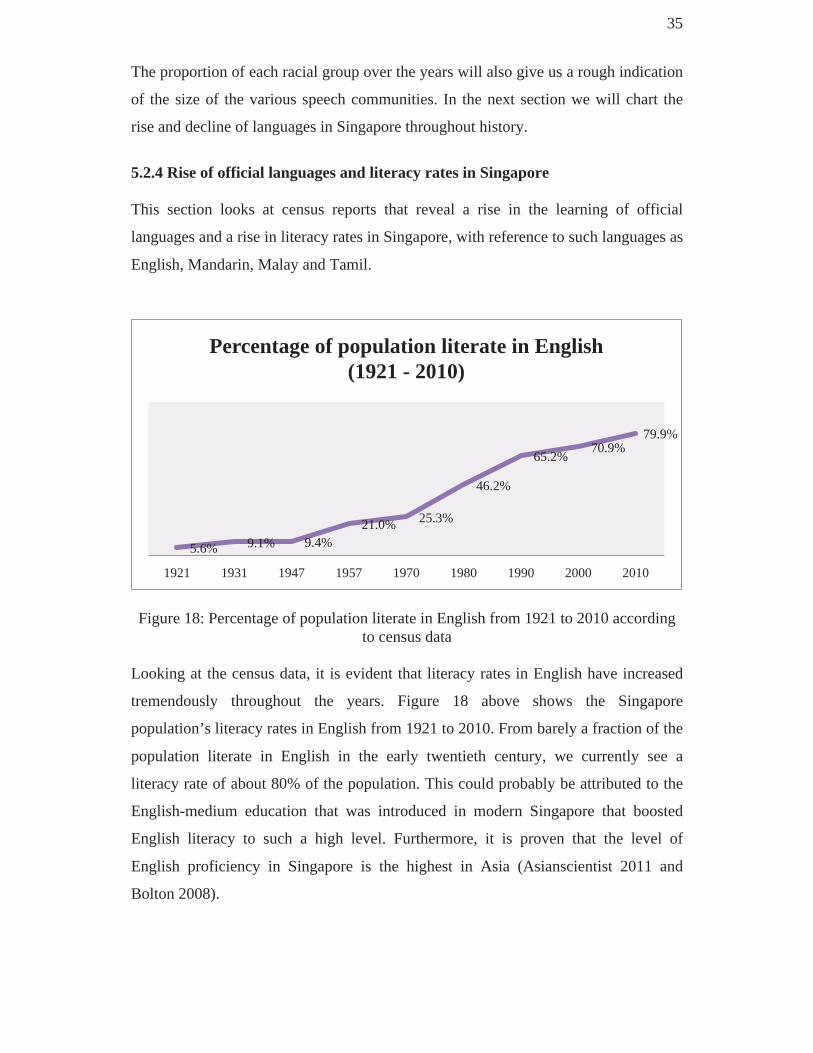
Figure 18: Percentage of population literate in English from 1921 to 2010 according
to census data Looking at the census data, it is evident that literacy rates in English have increased
tremendously throughout the years. Figure 18 above shows the Singapore
population’s literacy rates in English from 1921 to 2010. From barely a fraction of the
population literate in English in the early twentieth century, we currently see a
literacy rate of about 80% of the population. This could probably be attributed to the
English-medium education that was introduced in modern Singapore that boosted
English literacy to such a high level. Furthermore, it is proven that the level of
English proficiency in Singapore is the highest in Asia (Asianscientist 2011 and
Bolton 2008).
5.6% 9.1% 9.4% 21.0% 25.3%
46.2%
65.2% 70.9%
79.9%
1921 1931 1947 1957 1970 1980 1990 2000 2010
Percentage of population literate in English (1921 - 2010)

36
5.2.5 Rise in mother tongue literacy rates in each racial group
Figure 19: Percentage of each racial group literate in their designated mother tongue
from 1957 to 2010 according to census data Figure 19 above shows the literacy rates of each ethnic group in their designated
‘mother tongue’. The term ‘mother tongue’ in the Singapore context differs from
linguists’ definition of a mother tongue. According to Skutnabb-Kangas (1981),
‘mother tongue’ is defined as the language that is first learnt by the individual and the
language that one can identify with. However, in Singapore the official designated
‘mother tongues’ are Mandarin, Malay and Tamil, ‘which are the linguistic varieties
which are officially associated with the official races of the state, namely Chinese,
Malay and Indian, and learnt as second languages in school’ (Lim 2009: 52). As such,
‘mother tongue’ is predetermined by one’s ethnicity and this is officially endorsed by
the public education system in Singapore. From Figure 19, it is evident that there is an
increasing trend of each ethnic group in their designated ‘mother tongue’. The
Chinese community noted a substantial increase in people literate in Chinese, from
35.6% in 1957 to 80.0% in 2010. An increase is also observed among the Malay
community with literacy rates in Malay increasing from 59.7% in 1957 to 88.9% in
2010. In the Indian community, the literacy rate in Tamil has increased minimally
from 1957 to 2010 and this could be due to the Non-Tamil Indian languages (NTILs)
policy in place in the education system. This policy was introduced in the early 1990s,
where five NTILs (Bengali, Gujarati, Hindi, Punjabi and Urdu) were introduced to be
part of the national examinations and Indians from these ethnic groups had the option
35.6%
63.8% 70.2% 75.2% 80.0%
59.7%
82.7% 86.7% 90.5% 88.9%
48.6% 42.5% 42.5% 48.8% 50.0%
1957 1980 1990 2000 2010
Literacy rates of each racial group in their designated mother tongue (1957-2010)
Literate in Chinese Literate in Malay Literate in Tamil

37
to take an NTIL as their mother tongue, instead of Tamil (Ministry of Education
2007).
The overall increase in literacy rates in designated ‘mother tongues’ provides
evidence for the effectiveness of the language education in modern day Singapore,
indicating an obvious shift towards these official ‘mother tongues’.
5.2.6 Multi-language literacy in official languages Bilingualism was an important part of the education system since the 1950s, where
vernacular languages such as Mandarin, Tamil and Malay were regarded as second
languages and English as a first language. Eventually, the bilingual education policy
was revised and what is in place till today is that students have to study their subject
curriculum in English and at the same time, reach a ‘second-language’ proficiency in
their designated mother tongue. (Dixon 2005). Given the importance of being
bilingual in the Singapore education system, it would be interesting to chart the
development of bilingualism in the population over the years.
Figure 20: Percentage of each racial group literate in two or more official languages Figure 20 above charts the literacy rates of each ethnic group, whose members are
literate in two or more official languages. It is evident bilingual literacy has an
upward trend from 1980 to 2010. The increase was most significant in the Chinese
community where bilingual literacy was only 26.4% in 1980 but is at 63.3% as of
2010. Bilingual literacy in the Malay community increased from 52.0% in 1980 to
26.4% 38.0%
47.4% 63.3%
52.0% 64.3%
73.1% 83.8%
51.8% 55.9% 64.1%
80.5%
1980 1990 2000 2010
Literacy in two or more official languages (1980 - 2010)
Chinese Malay Indian

38
83.8% in 2010 and in the Indian community the increase was from 51.8% in 1980 to
80.5% in 2010. Thus, the notion of Singapore being a bilingual population is
supported by census data where we say a large proportion of each ethnic group being
literate in two or more languages.
5.2.7 The shift of languages used in the home domains In 1980, 1990, 2000 and 2010 censuses, data that showed the predominant languages
spoken at home were collected. The 1980 and 1990 census listed the languages that
were spoken most frequently to parents, spouse, siblings and grandparents. The
percentages shown in Figure 21 are a composite based on these categories.
Figure 21: Languages spoken most frequently at home in 1980, 1990, 2000 and 2010
7.9%
10.2%
81.4%
0.5%
1.5%
97.7%
0.8%
21.1%
9.3%
54.0%
15.6%
19.3%
30.1%
50.3%
0.3%
6.1%
93.7%
0.2%
32.3%
14.5%
43.2%
10.0%
23.9%
45.1%
30.7%
0.4%
7.9%
91.6%
0.5%
35.6%
11.6%
42.9%
9.9%
32.6%
47.7%
19.2%
0.4%
17.0%
82.7%
0.3%
41.6%
7.9%
36.7%
13.8%
English
Mandarin
Chinese dialects
Others
English
Malay
Others
English
Malay
Tamil
Others
Chi
nese
M
alay
s In
dian
s
Languages spoken most frequently at home (1980-2010)
2010 2000 1990 1980

39
The impact that Singapore’s language policies has on language use in Singapore
seems to be most pertinent when we analyse the languages spoken most frequently at
home. As can be seen in Figure 21 above, the usage of English as a home language
has increased across three ethnic groups. The most notable increase is seen among
the Chinese Singaporeans, with 7.9% in 1980 claiming to use English at home as
compared to 32.6% in 2010. Similarly, the Malay Singaporeans also recorded a large
increase in English language use at home with 1.5% in 1980 to 17.0% in 2010.
Looking at the Chinese community, we see a sharp decrease in the use of Chinese
dialects as a home language from 81.4% in 1980 to 19.2% in 2010. In contrast, the
use of Mandarin in homes has increased from 10.2% in 1980 to 47.7% in 2010. This
decrease in use of dialects and an increase in the use of Mandarin could be attributed
to the success of the Speak Mandarin Campaign (SMC) that I have mentioned in the
literature review, and this was reiterated in the 1990 census. (Singapore census of
population 1990, Statistical release No. 3.: 5). The Malay community also noted a
slight decrease in the use of Malay from 97.7% in 1980 to 82.7% in 2010, and a
similar decrease was noted in the Indian community with 54.0% speaking Tamil as a
home language in 1980 to 36.7% in 2010. Through this analysis of home languages,
we do notice a language shift away from dialects and in some communities, their
‘mother tongue’, towards an increasing usage in English even in the home domains.
This situation is thus succinctly summarised by Newbrook (1987) when he states,
‘Singapore, is in fact, well on the way towards becoming a largely English-speaking
society’ (12).
The review of recent language censuses provided in this section (Section 5.2) is thus
intended to simultaneously provide an overview of recent trends in multilingualism,
as revealed by censuses as well as linking the sociolinguistic trends of the present to
the record of languages in the colonial past.
6. Commentary As I hope I have demonstrated, the investigation of language data from censuses is
informative in charting the history of multilingualism in Singapore. By looking back
into the past, through the means of censuses, we are able to reimagine the linguistic
landscape of Singapore and to also note its changes throughout the years. Through the
examination of such data, we may also attempt to reconstruct the ‘language worlds’ of

40
Singapore in earlier eras (Bolton 2013). Although we are not able to fully reconstruct
earlier language worlds in the community by looking at census data alone,
nevertheless such data may provide valuable historical evidence of how multilingual
Singapore has changed and developed over time. Furthermore, since census taking
was carried out decennially (except during the World War II period), we are able to
chart the chronological development of language use and literacy in Singapore over
time. Thus, the analysis of censuses enables us to chart the macro language trends and
development of languages in Singapore, giving us an idea of the changes over time.
That is not to argue, however, that censuses can provide a complete picture of
sociolinguistic reality(ies) over time. Studies have shown that languages such as
‘Bazaar Malay’ (Holm 1988, Adelaar & Prentice 1996) and ‘Baba Malay’ (Khin Khin
Aye 2005, Sasi Rekha 2007) served as an interethnic lingua franca (Bloom 1986: 360)
in colonial Singapore. However, it is notable these languages are never mentioned as
‘languages’ in the census documents that have formed the data for this study. This
indicates that the named languages in censuses are typically limited to what are
officially deemed as ‘languages’ at any given point. In a multilingual context like
Singapore where language contact inevitably takes place, one might have to look
beyond censuses to get a better understanding of the languages used by people.
Moreover, as compared to the censuses that were conducted under the administration
of the Straits Settlement government, Singapore’s post-independence censuses limit
language questions to the resident population, which would have left out languages
that are spoken by foreigners in Singapore and are also part of the language ecology.
In addition, the language questions asked in post-independence censuses are largely
skewed towards existing language education policy (e.g. bilingual education policy)
and other language policies (e.g. Speak Mandarin Campaign).
7. Conclusion In Section 3 of this report, the research issues for this research project were specified
as: (1) What are the macro trends of language maintenance and language shift that are
highlighted through the analysis of census data? (2) More specifically, what can the
analysis of census data tell us about the multilingual development of Singapore with
reference to Chinese dialects, Indian languages, Malay, Mandarin and English? and

41
(3) To what extent can the analysis of census data increase our understanding of the
multilingual history of Singapore
With reference to research issue (1), the results of the research indicate that there
has been a shift away from the use of vernacular languages in favour of official
languages such as English, Mandarin, Malay and Tamil. This can be seen through the
increase in literacy rates in these languages over the years. With reference to research
issue (2), the results of the research indicate that the use of Chinese dialects has
declined, as observed by the decrease in usage in the home domains. Literacy rates
and usage of Mandarin as a home language has increased. The literacy in and use of
English have seen an increase since its introduction to Singapore during the colonial
era till today. Literacy rates in English are high, with about 8 in 10 persons being
literate in the language. Furthermore, due to the bilingual language policy adopted in
the education system, bilingual literacy rates have also increased throughout the years.
Finally, with reference to research issue (3), the results of the research indicate that
to some extent at least, census documents do have value in researching the early
sociolinguistic history of Singapore, specifically with reference to the description of
macro-sociolinguistics and patterns of multilingualism over time. Not least with
reference to the identification and description of patterns of language shift in the
Singapore community.
In summary, through the analysis of census data from 1871 to 2010 we are able to
track a number of macro trends in language shift from the colonial times to modern
day Singapore. To a large extent, we are able to find out what were the languages that
were used in Singapore in the early years and the approximate sizes of each speech
community, as with the data presented in the 1911 census. The study of the
consecutive censuses then allows us to track the development of language trends over
time.
This current study is only a preliminary attempt to investigate the history of
multilingualism in Singapore, using only census data as a source of information. What
was surprising for me as researcher in this project was the evident lack of detailed
previous research on this topic. Indeed, in order to carry out this research, I had to
compile a comprehensive database of historical censuses, as these were not readily
available in any particular library in Singapore. While acknowledging the fact that the
research project presented may be seen as somewhat preliminary, it is, to my

42
knowledge, despite its obvious limitations, the first study of its kind that attempts to
comprehensively study all available censuses with particular reference to the history
of multilingualism in Singapore. Future research related to the study on the history of
multilingualism in Singapore could use other primary sources (if available) such as
journals, diaries or recordings of oral history to analyse their use of languages.
43
Notes 1. The Bengali people originate from the region of Bengal, a region that is between
India and Bangladesh. They speak Bengali as their mother tongue.
2. Klings, or Kelings, is what we know as Tamils in the present day. The Klings
originate from South India and speak Tamil as their mother tongue. ‘Klings’ is a
derogatory term to some Tamils and it was not used in subsequent censuses.
http://eresources.nlb.gov.sg/infopedia/articles/SIP_2013-08-12_114422.html
3. The Boyanese, or Baweanese, were originally from the Bawean Island in East Java.
They speak the Bawean dialect.
http://eresources.nlb.gov.sg/infopedia/articles/SIP_1069_2007-06-20.html
4. The Bugis originate from the southwestern peninsula of Celebes, an island located
in between Borneo and the Moluccas. They speak Buginese.
http://eresources.nlb.gov.sg/infopedia/articles/SIP_2013-08-12_113516.html?s=bugis
5. Cochin-Chinese refers to the people that originate from Cochin-China, present day South Vietnam. 6. Dyak, also known as Dayak, originate from the islands of Borneo.
http://global.britannica.com/EBchecked/topic/153116/Dayak
7. Abyssinians refers to the Habesha people that originate from Ethiopia. 8. Macaos, or Cantonese as we now know today, originate from the Guangdong
province of China.
9. Straits-Born are ethnic Chinese people who were born in the Straits Settlements. 10. Hylams are what we now know as the Hainanese. They originate from Hainan
Island in China, speaking the Hainanese dialect.
http://global.britannica.com/EBchecked/topic/251708/Hainan
44
11. Kehs are now known as Hakkas, and they originate from northern China speaking
Hakka Chinese.
http://global.britannica.com/EBchecked/topic/252138/Hakka
12. Achinese are people that originate from the island of Aceh in Indonesia. 13. Jawi-Pekans refers to people of Malay-Indian heritage. 14. Manilamen refers to the people that originate from the Philippines. 15. Parsees were people that originate from Iran. 16. Hok-Chiu and Hok Chia/Hok Chhia are branches from the Hokkien ‘tribe’ (The
census of British Malay 1921: 78)
17. Chinese from Shanghai, Pekin and the more Northern parts of Chin were tabulated
under a single category, ‘Northern provinces’. (The census of British Malaya 1921:
84)
18. Kwongsai, or Kwong Sais, originates from the province that lies between Canton
and Yunnan. (The census of British Malaya 1921: 84)
19. Banjarese originate from Banjermiassin, a district south of Borneo (The census of
British Malaya 1921: 75)

45
References [The World Englishes (WE) Journal style of referencing is used here at the request of
supervisor, Professor Kingsley Bolton]
Census reports Arumainathan, P. Singapore: Report on the census of population, 1970, Volumes 1
and 2. Singapore: Department of Statistics, 1973. Chua, S.C. State of Singapore: Report on the census of population, 1957. Singapore:
Government Press, 1964. Del Tufo, M,V. Malaya: A report on the 1947 census of population. London: Crown
Agents for the Colonies, 1949. Dunlop, S. W.A. Pickering, V. Cousins, H. Hewetson, A. Knight & A.P. Talbot.
Report on the census of Singapore, 1881. Singapore: Straits Settlements Government Press, 1882.
Innes, J.R. Report on the census of the Straits Settlements take on the 1st March 1901. Singapore: Government Printing Press, 1901.
Khoo, Chian Kim. Singapore: Census of population 1980. Singapore: Department of Statistics. Release No. 2. Demographic characteristics, 1981. Release No. 3. Literacy and education, 1981. Release No. 8. Languages spoken at home, 1981.
Lau, Kak En. Singapore: Census of population 1990. Singapore: Department of Statistics. Statistical Release No.1. Demographic characteristics, 1992.
Statistical Release No. 3. Literacy, languages spoken and education, 1993. Leow, Bee Geok. Singapore: Census of population 2000. Singapore: Department of
Statistics. Statistical Release No. 1. Demographic characteristics, 2001.
Statistical release No. 2. Education, language and religion, 2001. Marriott, H. Census report of the Straits Settlements, 1911. Singapore: Government
Printing Press, 1911. McNair, J.F.A., C.B. Waller & A. Knight. Report of the census officers for the Straits
Settlements of Singapore, 1871. Singapore: Straits Settlements Government Press, 1872.
Merewether, E.M. Report on the census of the Straits Settlements taken on the 5th April 1891. Singapore: Government Printing Press, 1892.
Nathan, J.E. The census of British Malaya, 1921. London: Waterlow & Songs, Ltd., 1922.
Wong, Wee Kim. Census of population 2010. Singapore: Department of Statistics. Statistical Release No. 1. Demographic characteristics, education, language and
religion, 2011.
46
Vlieland, C.A. British Malaya: A report on the 1931 census and certain problems of vital statistics. London: Crown Agents for the Colonies 1932.
Other references Adelaar, Karl Alexander & D.J. Prentice. 1996. Malay: Its history, role and spread. In
Stephen A. Wurm, Peter Mühlhäusler and Darrel T. Tryon (ed.), Atlas of languages of intercultural communication in the Pacific, Asia and the Americas, 673-693. Berlin: Mouton de Gruyter.
Anderson, Benedict. 2006. Imagined Communities: Reflections on the origins and spread of nationalism. London: Verso.
Arel, Dominique. 2001. Language categories in censuses: Backward- or forward-looking?. In David I. Kretzer & Dominique Arel (eds.), Census and identity: The politics of race, ethnicity and language in national censuses, 92-120. Cambridge: Cambridge University Press.
Asianscientist. 2011. TOEFL: Singapore third worldwide in English proficiency test, top in Asia. http://www.asianscientist.com/2011/04/academia/toefl-singapore-worldwide-english-proficiency-top-asia/ (11 November, 2014).
Bacon-Shone, John & Kingsley Bolton. 1998. Charting multilingualism: Language censuses and language surveys in Hong Kong. In Martha C. Pennington (ed.), Language in Hong Kong at century’s end, 43-90. Hong Kong: Hong Kong University Press.
Baffour, Bernard & Paolo Valente. 2012. An evaluation of census quality. Statistical Journal of the IOAS 28. 121-135.
Bloom, David. 1986. The English language and Singapore: A critical survey. In Basant K. Kapur (ed.), Singapore Studies, 337-458. Singapore: Singapore University Press.
Bolton, Kingsley. 2008. English in Asia, Asian Englishes, and the issue of proficiency. English Today 24(2). 3-12.
Bolton, Kingsley. 2013. World Englishes, globalisation, and language worlds. In Nils-Lennart Johannesson, Gunnel Melchers & Beyza Björkman (eds.), Of butterflies and birds, of dialects and genres: Essays in honour of Philip Shaw, 227-251. Stockholm: Stockholm University.
Buckley, Charles Burton. 1965. An anecdotal history of old times in Singapore 1819-1967. Kuala Lumpur: University of Malaya Press.
Chelliah, D. D. 1940. A history of the educational policy of the Straits Settlements with recommendations for a new system based on vernaculars. Kuala Lumpur: The Government Press.
Chew, Phyllis Ghim-Lian. 2012. A sociolinguistic history of early identities in Singapore: From colonialism to nationalism. London: Palgrave Macmilian.
Department of Statistics Singapore. 2014. Singapore in figures 2014. http://www.singstat.gov.sg/publications/publications_and_papers/reference/sif2014.pdf. (8 November, 2014).

47
Dixon, L. Quentin. 2005. The bilingual education policy in Singapore: Implications for second language acquisition. In James Cohen, Kara T. McAlister, Kellie Rolstad & Jeff MacSwan (eds.), ISB4: Proceedings of the 4th International Symposium on Bilingualism. 625-635. Somerville: Cascadilla Press.
Frost, Mark Ravinder. 2003. Transcultural diaspora: The Straits Chinese in Singapore, 1819-1918. Asia Research Institute Working Paper Series 10. 1- 44.
Furnivall, J. S. Netherlands India: A study of plural economy. Cambridge: Cambridge University Press.
Gupta, Anthea Fraser. 1998. The situation of English in Singapore. In Foley, Joseph A. et al. (eds.), English in new cultural contexts: Reflections from Singapore. 106-126. Singapore: Oxford University Press.
Gwee, Yee Hean & Francis Hoy Kee Wong. 1980. Official reports on education: Straits Settlements and the Federated Malay States, 1870-1939. Singapore: Pan Pacific Book Distributors (S).
Gwee, Yee Hean, 1969. 150 years of education in Singapore. Singapore: Teacher’s Training College Publications Board.
Hirschman, Charles. 1987. The meaning and measurement of ethnicity in Malaysia: An analysis of census classifications. Journal of Asian Studies 46(3). 555-582.
Holm, John. 1988. Pidgins and creoles. Cambridge: Cambridge University Press. Khin Khin Aye. 2005. Bazaar Malay: History, grammar and contact. Unpublished
PhD dissertation, National University of Singapore. Koh, Adeline. 2014. Education Malayan gentlemen: Establishing an anglicised elite in
colonial Malaya. In National Library Board (ed.), Chapters on Asia, 7-15. Singapore: National Library Board.
Lieberson, Stanley. 1966. Language questions in censuses. Sociological Inquiry 36(2). 262-279.
Lim, Lisa. 2009. Beyond fear and loathing in SG: The real mother tongues and language policies in multilingual Singapore. In Lisa Lim & Ee-Ling Low (eds.), Multilingual, globalizing Asia: Implications for policy and education, AILA Review, Volume 22, 52-71. Amsterdam: John Benjamins Publishing Company.
Malay Factbook. 2014. Unfederated Malay States. http://malaysiafactbook.com /Unfederated_Malay_States. (3 November, 2014).
Manickam, Sandra. 2014. Bridging the race barrier: Between “Sakai” and “Malay” in the census categorisations of British Malaya. Asian Studies Review, Special issue: Focus on Southeast Asia: Malaysia, Singapore, Thailand 38(3). 367-384.
Ministry of Education. 2007. Preparing students for a global future: Enhancing language learning. http://www.moe.gov.sg/media/press/2007/pr20070307.htm (14 November, 2014)
National Archives of Singapore. 2014. William Farquhar’s Pragmatism: Another perspective of Raffles vision for Singapore. http://www.nas.gov.sg/archivesonline/article/william-farquhars-pragmatism. (8 November, 2014)

48
National population and talent division. 2013. Composition of Singapore’s total population. http://population.sg/resources/population-composition/#.VGRR7VOUfGl (13 November, 2014)
Newbold, T.J. 1839. Political and statistical account of the British settlements of the Straits of Malacca. London: John Murray
Newbrook, Mark (ed.). 1987. Aspects of the syntax of educated Singaporean English: Attitudes, beliefs and usage. Frankfurt am Main: Verlag Peter Language GmbH.
Raffles, Stamford. 1823. Formation of the Singapore Institution, A.D. 1823. Singapore: Mission Press.
Sasi Rekha d/o Muthiah. 2007. A description of Singapore Indian Malay: A pidgin’s pidgin. Unpublished MA thesis, National University of Singapore.
Singapore Government. 1987. Republic of Singapore Independence Act. http://statutes.agc.gov.sg. (8 November, 2014)
Skutnabb-Kangas, Tove. 1981. Bilingualism or not: The education of minorities. Clevedon: Multilingual Matters.
Tan, Ying Ying. 2003. Reading the census: Language use in Asia. In Jennifer Lindsay and Ying Ying Tan (eds.), Babel or Behemoth: Language trends in Asia, 175 -210. Singapore: Singapore University Press.
Tham, Seong Chee. 1990. Multi-lingualism in Singapore: Two decades of development. Department of Statistics (1990).
Turnbull, Constance Mary. 1977. A history of Singapore, 1819 - 1975. Singapore: Oxford University Press.
Yeoh, Brenda S.A. 2007. Singapore: Hungry for foreign workers at all skill levels. http://www.migrationpolicy.org/article/singapore-hungry-foreign-workers-all-skill-levels (10 November, 2014).