chemical industry profile july 2000 jocelyne...
TRANSCRIPT

Technical Assistance to Armenia to Prepare for Accession to the World Trade Organisation and Implement Obligations Related to WTO Accession and Partnership and Co-operation Agreement
Armenian-European Policy and Legal Advice Centre. 5 Hanrapetutian Street, Block A (MIT building), 4th floor, Yerevan 10, Republic of Armenia Phone/Fax: ++374 1 564 268, 580 626, 581 736. AT&T: ++374 1 151 833. E-mail: [email protected], Internet: www.aeplac.am The views expressed are those of individual experts and do not necessarily present the views of the European Commission or of the Tacis Programme
CHEMICAL INDUSTRY PROFILE
July 2000
Jocelyne DECAYE
in co-operation with Kristina TERESHCHATOVA and Ashot ISKANDARYAN

2
TABLE OF CONTENTS
EXECUTIVE SUMMARY
3
1. Basic data 2. Location of companies 3. Production range 4. Production trends 5. Source of supplies 6. Domestic market 7. Foreign trade
7.1. Exports 7.2. Imports 7.3. Trade balance
8. Privatisation process 9. Foreign investments and co-operation 10. Scientific and professional support 11. Foreign assistance 12. SWOT analysis 13. Foreign investments and co-operation opportunities
4 4 4 5 6 6 7 7
11 13 13 13 14 14 15 16
Annex 1: Chemical sector: Enterprises list
Annex 2 : Map: Location of chemical industry in Armenia
Annex 3 : Information sources
17
21
22

3
EXECUTIVE SUMMARY Armenian chemical industry started in 1927 with a construction of carbomide production in Yerevan, has been performing generally well during the Soviet period. In 1970’s Armenia became the leading chemical producer in the Caucasian region and some companies were Soviet monopolies producing high quality intermediate products as synthetic rubber, latex, acids, various glues and special films especially for the military sector. At mid 80’s this industry was employing 24 200 persons and represented 6.6 per cent of the industrial production. This industry which was highly dependent on Soviet supplies and markets has been severely affected by the USSR dissolution and thereafter by the energy crisis in 1992-93 and the railways blockade due to the conflict with Azerbaijan. In 1990’s the volume of production has been halved whereas imports were increasing. In 1999 the chemical imports were six times higher than local production and the trade deficit attained 77 million $. Companies are working at a very low level capacity or not operating. Presently chemical exports are concentrated on one product, rubber (82% of total exports in 1999), and one market, the CIS countries (93% in 1999). The exports of plastics, pharmaceuticals and soap have become negligible (1 million $ in 1999). The company Nairit who is the only rubber producer in all CIS countries is developing again its production. They are exporting low priced rubber to traditional markets especially Russia and Ukraine but cannot compete on other markets with the two biggest world producers Du Pont and Bayer. The three strategic complexes - Nairit, Polyvinylacetate, Doghagorts - representing about ninety per cent of the chemical production capacity in Armenia are now waiting for privatisation. The Armenian chemical industry suffers from many weaknesses including high dependence on imported raw materials (especially crude oil and gas), obsolete technologies and old production lines, logistical difficulties related to the Armenia’s location, high costs for transports and electricity and overstaffing. It seems impossible to maintain a production capacity inherited from the Soviet which is over-dimensioned for the country and which would require huge investments for bringing the installations up to standard. According to a recent audit made by UNIDO experts the production capacity for chloroprene rubber (50 000 tones) is nearly equivalent to one third of the current world market (165 000 tones in 1998). The markets have changed due to substitution and new technological process and the key products in which Armenia is specialised do not benefit from an increasing demand. Many productions should be discontinued or decreased. The chemical sector has been assessed by western experts from UNIDO and the Japan International Organisation Co-operation Agency (JICA). At the end of 1999 UNIDO experts proposed to the government a programme for the restructuring of the chemical industries and JICA experts have identified promising products and made proposal for the production of pharmaceutical amino acids. A certain number of measures would also be necessary to make the chemical industry more market oriented particularly the rapid privatisation of the three complexes, the industrial restructuring to increase the export potential, the development of corporate management and corporate governance and also external promotion including the research of foreign partners.

4
Until now foreign investments have been limited and concentrated on pharmaceutical sector. A development of the foreign participation is closely linked to the privatisation process of the major companies. 1. Basic data Companies of the chemical industry are presented in the Annex 1. Table 1: Main indicators of the chemical industry 1985 1995 1997 1998 1999 Number of enterprises 18 28 28 28 28 Number of employees 24 200 12 804 10 281 7 880 NA Nominal wages per month ($) NA 20 28 24 NA Production (current prices) • Million Drams • Million $ (yearly average
exchange rate)
NA
7 236 (17.8)
7 774 (15.9)
6 675 (13.2)
7 913 (14.8)
Share in total industrial production (current prices)
6.6 4.2 3.1 2.5 2.8
National Statistical Service of the Republic of Armenia The chemical sector is made today of 28 enterprises of which three major state owned companies - Nairit (3 147 employees), Polyvinylacetate (800 employees), Doghagorts (1 300) – representing more than two thirds of the production and employment in the sector. The other 25 companies are SMEs. In 1990’s the number of employees in the sector drastically declined (7 880 in 1998 compared to 24 200 in 1985) and this downward trend continues (- 23% in 1998). Despite this reduction, major companies are still overstaffed for their production level and their employees are not fully occupied. The chemical industry share in the total Armenian industry also decreased considerably (from 6.6% in 1985 to 2.8% in 1999). The sector occupies now the fourth rank in the total manufacturing industry (4.4% in 1999). The situation improved in 1999 with a production increase of 18.5% in value terms due essentially to the development of rubber production. Despite this recovery the amount of Armenian chemical production expressed in dollars remains very low (14.8 $mn). The SME-s production can be estimated to about 4 $mn. 2. Location of companies Chemicals industry in Armenia is concentrated in Yerevan region and Lori Marz (see Map in Annex 2). 3. Production range There are five sub-sectors in chemical sector in Armenia: • Basic chemistry • Synthetic and plastic materials • Paints and other liquids for surface treatment

5
• Rubber and latex. • Pharmaceuticals The major chemical products are: chloroprene rubbers, chloroprene latex, caustic sodium, plastic products, synthetic fibres, tires, pharmaceutical products, detergents, soaps, pigments, paintings. Some SME are planning to start the production of new product essentially based on local raw materials. 4. Production trends The chemical industry has been particularly affected by the USSR dissolution but also by the deep energy crisis in Armenia in 1992-1993. During this period part of the production was stopped due to the lack of energy and in 1993 the production level was one third of the level recorded in 1990. Even if the situation has improved somehow since 1994, the production level was still in 1998 less than half (see Table 3) of this of 1990. This negative trend reflected the incapacity of the Armenian chemical industry to face the international competition on the domestic market and also to find new markets to compensate losses on traditional CIS markets. The data by product given in the Table 2 show that in 1997 the production level of rubber and caustic soda was less than 10% of the level registered in 1990. Production of synthetic fibbers, plastics and tyres was discontinued. Since 1999 the situation is gradually improving. Nairit, the unique rubber producer in all the FSU, is now producing 700 tons of rubber per month (8 400 tons per year) and their objective is to attain 25 000 tones in few years. Their production capacity (50 000 tones) is equivalent to 30% of the current world demand (165 000 tones in 1998). The production of vinyl acetate and PVA has been stopped by the company Polyvinylacetate because of the anticipated lack of prospects for these products. The Doghagorts company is not operating since February 1999 and the production of tires has also been stopped. Table 2: Production of chemical industry (volume, 1990=100)
1990 1995 1996 1997 1998 100 50 53 52 46
National Statistical Service of the Republic of Armenia

6
Table 3: Production of major items of chemical industry 1985 1997 Synthetic rubber (‘000 tones)
41.9 3.8
Synthetic tars and plastics (‘000 tones)
20.2 -
Caustic soda (‘000 tones) 46.2 4.3 Chemical filament and micro-fibres (tones)
13 793 -
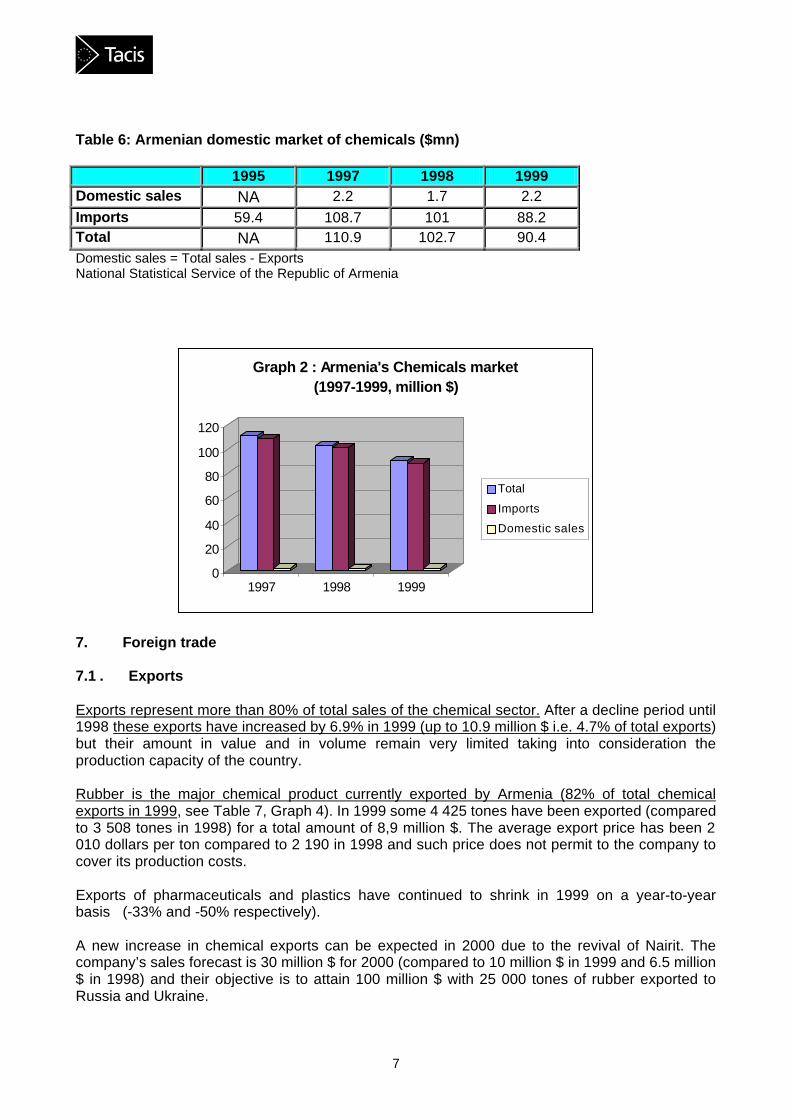
Tire-covers (‘000 pieces) 2 153 0.1 National Statistical Service of the Republic of Armenia 5. Source of supplies The Armenian chemical sector is highly dependent on imports, especially crude oil and gas imports from CIS countries. Some supplies come also from Iran and Turkey. Only few products manufactured by SME are based on local raw materials (extracts from wild fruit and plants, tartaric acid, copper-based chemicals, bentonite). 6. Domestic market The Armenian domestic market for chemicals is evaluated at 90 million US $ for 1999 and depends essentially on imports (97% in 1999) despite a significant increase of local sales in 1999 (+29%). In 1998-1999 the size of the domestic market has been reduced by more than 20 million $ in value (see Graph 2). More than one third of imported chemicals are pharmaceuticals. The other products are mainly plastics, soap and detergents, rubber, cosmetics and fertilisers (see 7.2. Imports).
Graph 1 : Armenia's Chemicals industry growth in 90's in volume (1990= 100)
0
20
40
60
80
100
120
1990 1992 1993 1994 1995 1996 1997 1998
Manufacturingindustry
Chemicals
7
Table 6: Armenian domestic market of chemicals ($mn) 1995 1997 1998 1999 Domestic sales NA 2.2 1.7 2.2 Imports 59.4 108.7 101 88.2 Total NA 110.9 102.7 90.4 Domestic sales = Total sales - Exports National Statistical Service of the Republic of Armenia
7. Foreign trade 7.1 . Exports Exports represent more than 80% of total sales of the chemical sector. After a decline period until 1998 these exports have increased by 6.9% in 1999 (up to 10.9 million $ i.e. 4.7% of total exports) but their amount in value and in volume remain very limited taking into consideration the production capacity of the country. Rubber is the major chemical product currently exported by Armenia (82% of total chemical exports in 1999, see Table 7, Graph 4). In 1999 some 4 425 tones have been exported (compared to 3 508 tones in 1998) for a total amount of 8,9 million $. The average export price has been 2 010 dollars per ton compared to 2 190 in 1998 and such price does not permit to the company to cover its production costs. Exports of pharmaceuticals and plastics have continued to shrink in 1999 on a year-to-year basis (-33% and -50% respectively). A new increase in chemical exports can be expected in 2000 due to the revival of Nairit. The company’s sales forecast is 30 million $ for 2000 (compared to 10 million $ in 1999 and 6.5 million $ in 1998) and their objective is to attain 100 million $ with 25 000 tones of rubber exported to Russia and Ukraine.
0
20
40
60
80
100
120
1997 1998 1999
Graph 2 : Armenia's Chemicals market (1997-1999, million $)
Total
Imports
Domestic sales

8
The chemicals exports are essentially directed to CIS region (93% in 1998) and more particularly to Russia (62%) and Ukraine (20%) (see Table 8, Graph 5). Table 7: Armenia’s exports of chemicals (1995-1999, million $) 1995 1997 1998 1999 TOTAL 25.9 13.5 10.2 10.9
• Rubber (HS 40) 8.9 8.5 7.7 8.9
• Pharmaceuticals products (HS 30)
3.3 1.1 1.2 0.8
• Plastics (HS 40) 3.2 0.7 0.4 0.2
• Soap, washing (HS 34) 1.4 0.3 - -
National Statistical Service of the Republic of Armenia Chemicals = HS Nomenclature VI (chemicals) + VII (Plastic, rubber) Table 8: Main markets for Armenian chemical products in 1998 $mn Foreign markets Rubber 7.7 Russia (69%), Ukraine (27.3%) Pharmaceuticals 1.2 Russia (46.3%), Uzbekistan (27.2%),
Georgia (13%), Belarus (8.9%) Plastics 0.4 Georgia (39.6%), Russia (21.9%),
Turkmenistan (10.0%) National Statistical Service of the Republic of Armenia Major obstacles for export development Armenian companies suffer from many weaknesses (obsolete equipment, old technology, non-compliance with international standards, lack of knowledge on foreign markets, (see SWOT analysis) which limit considerably capacity to develop sales on the Western markets. World chemical production tends to be more and more concentrated in large multinational groups and the competition is very high.

9
Graph 3 : Armenia's chemicals trade growth (1995-1999,million $)
-150
-100
-50
0
50
100
150
1995 1996 1997 1998 1999
Exports
Imports
Balance
0
50
100
150
200
250
300
1995 1996 1997 1998 1999
Graph 3 B : Share of chemicals in total Armenia's exports (1995-1999, million $)
Total Exports
Chemicals exports
0
200
400
600
800
1000
1995 1996 1997 1998 1999
Graph 3 C : Share of chemicals in total Armenia's imports (1995-1999, million$)
Total Imports
Chemicals Imports

10
0%
20%
40%
60%
80%
100%
1995 1997 1998 1999
Graph 4 : Structure of Armenia's chemicals exports by product (1995-1999, %)
Others
Soap, washing
Plastics
Pharmaceuticals products
Rubber
Graph 5 : Main markets for Armenia's chemicals exports (1998, %)
Russia62%
Ukraine21%
Georgia4%
Other CIS6%
EU2%
Others5%

11
7.2. Imports In 1999 the chemical imports reduced by -12.7% compared to 1998, but they still remain six times higher than the local production (88 million $ compared to 15 million $). Products responsible of the decline were mostly rubbers (-65%), soap and washing (-25%) and fertilisers (-37%). Plastic imports continued to increase attaining 20 million dollars compared to 2.2 million in 1995. Imports of perfumes and cosmetics, after a 24 fold increase between 1995 and 1998, stagnated at 7.4 million $ in 1999. Imports of pharmaceuticals also reduced but they remain the major chemical product imported into Armenia (32.4 million $ or 37% of total imports). In 1998 USA was the main foreign supplier chemical product to Armenia (24%) due mainly to pharmaceutical products (see Graph 7, Table 10). Other important suppliers were CIS countries (17%), EU (16%), Iran (16%) and UAE (7%). Table 9: Armenia’s imports of chemical products (1995-1999, $mn) 1995 1997 1998 1999 TOTAL 59.4 108.7 101.0 88.2 Of which:
• Pharmaceuticals (HS 30) 40.1 43.8 34.2 32.4
• Plastics (HS 39) 2.2 13.3 17.3 20.0
• Soap, washing (HS 34) 4.5 10.6 10.4 7.8
• Rubber (HS 40) 1.8 10.2 10.0 3.5
• Essential oils, perfumes, cosmetics (HS 33)
0.3 5.9 7.4 7.4
• Fertilisers (HS 31) 2.7 4.6 5.1 3.2 National Statistical Service of the Republic of Armenia Table 10: Main country suppliers of chemical products in 1998 Products $mn Foreign suppliers Pharmaceuticals 34.2 USA (62.3%), EU (13.7%), Russia (4.8%),
Ukraine (4.3%) Plastics 17.3 Iran (31.5%), EU (20.4%), UAE (13.3%), Soap, washing 10.4 Iran (75.4%) Rubber 10.0 Russia (48.6%), EU (12.7%), Essential oils, perfumes, cosmetics
7.4 EU (51%), UAE (18.5%)
Fertilisers 5.1 Switzerland (33.5%), Georgia (32.5%), Japan (32.3%),
National Statistical Service of the Republic of Armenia

12
0%10%20%30%40%50%60%70%80%90%
100%
1995 1997 1998 1999
Graph 6 : Structure of Armenia's chemicals imports (1995-1999, %)
Others
Cosmetics, perfumery
Fertilisers
Rubber
Soap, washing
Plastics
Pharmaceuticals
Graph 7: Armenia's chemicals imports by main sources (1998,%)
USA24%
EU16%
Iran16%
Russia10%
Other CIS 7%
UAE7%
Others 20%

13
7.3 Trade balance The trade deficit in chemicals has been decreasing for the last two years, but nevertheless it is still important for Armenia (-77 million $ in 1999). This deficit is mostly due to pharmaceuticals, plastics and to a lesser extent soap and washing, cosmetics and fertilisers. Table 11: Trade balance in chemical products in 1998 (in $mn) 1995 1997 1998 1999 TOTAL - 33.5 - 95.2 -90.8 - 77.3
• Pharmaceutical products - 36.8 -42.7 -33.0 -31.6
• Plastics 1.0 - 12.6 - 16.9 - 19.8
• Soap, washing - 3.1 - 10.3 - 10.4 - 7.8
• Essential oils, perfumes, cosmetics
-0.3 -5.9 -7.4 -7.4
• Rubber 7.1 -1.7 - 2.3 5.4
• Fertilisers -2.7 -3.8 -5.1 -3.2 National Statistical Service of the Republic of Armenia 8. Privatisation process The three leading companies - Nairit, Polyvinilatsetat, Doghagorts - representing more than 90% of the production capacity of chemicals in Armenia, remain to be privatised. They are considered strategic companies for privatisation according to the Decree 747 of December 13 1999 and they will be privatised pursuant to a business plan. In case of Nairit a solution will have to be found for the huge accumulated debt (about 55 million $ for tax arrears, unpaid wages and energy/gas debt). This company is one the biggest in terms of employment (3 147 persons) and the social criteria will be a very important issue for the privatisation. Different scenarios are considered including debt swaps and tenders. Most of the other companies, mainly SME, have already been privatised and management and employees have majority of shares when they are not the exclusive owners.
9. Foreign investments and cooperation
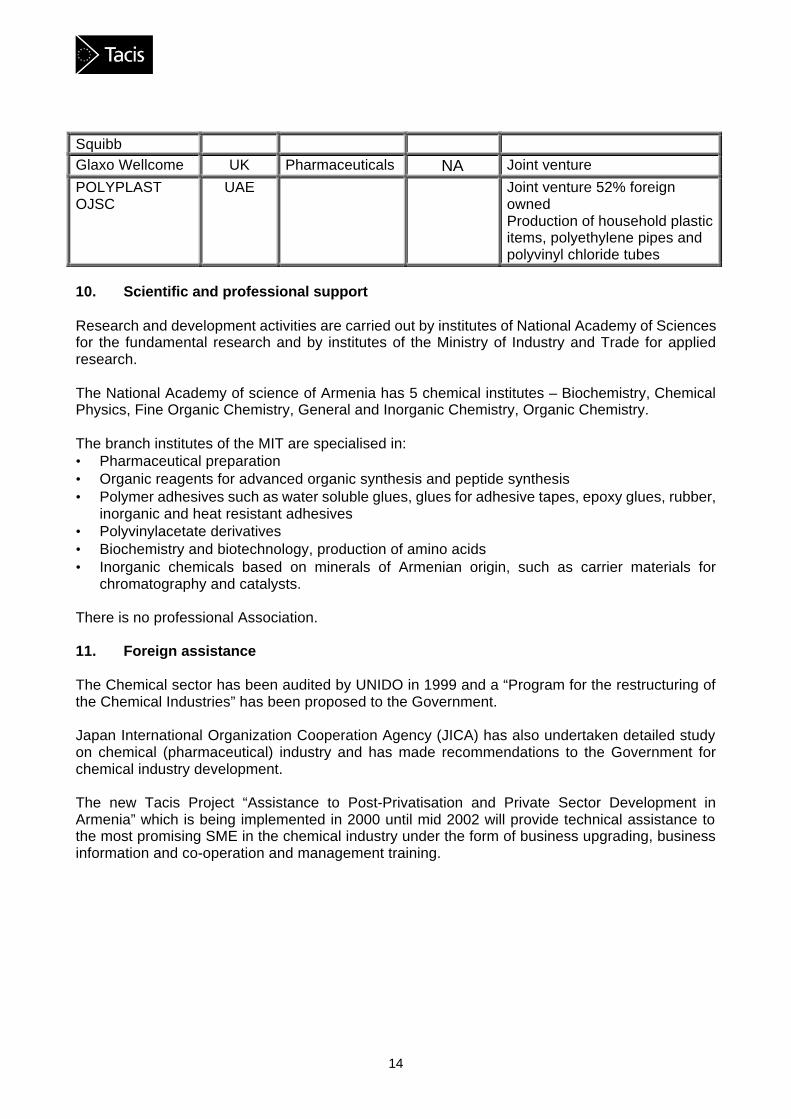
Until now foreign investments in the chemical sector were limited in value, and concentrating on pharmaceuticals sector.
Table 12: Major foreign investments in chemicals in Armenia
Company Country Sector Invest ments $mn
Remarks
PHARMATEC LTD
UK Pharmaceuticals NA Subsidiary of Euro-Cambridge Co. LTD (UK) established in 1998 Production of intravenous solutions
Bristol-Meyers UK Pharmaceuticals NA Joint venture
14
Squibb Glaxo Wellcome UK Pharmaceuticals NA Joint venture
POLYPLAST OJSC
UAE Joint venture 52% foreign owned Production of household plastic items, polyethylene pipes and polyvinyl chloride tubes
10. Scientific and professional support Research and development activities are carried out by institutes of National Academy of Sciences for the fundamental research and by institutes of the Ministry of Industry and Trade for applied research. The National Academy of science of Armenia has 5 chemical institutes – Biochemistry, Chemical Physics, Fine Organic Chemistry, General and Inorganic Chemistry, Organic Chemistry. The branch institutes of the MIT are specialised in: • Pharmaceutical preparation • Organic reagents for advanced organic synthesis and peptide synthesis • Polymer adhesives such as water soluble glues, glues for adhesive tapes, epoxy glues, rubber,
inorganic and heat resistant adhesives • Polyvinylacetate derivatives • Biochemistry and biotechnology, production of amino acids • Inorganic chemicals based on minerals of Armenian origin, such as carrier materials for
chromatography and catalysts. There is no professional Association. 11. Foreign assistance The Chemical sector has been audited by UNIDO in 1999 and a “Program for the restructuring of the Chemical Industries” has been proposed to the Government. Japan International Organization Cooperation Agency (JICA) has also undertaken detailed study on chemical (pharmaceutical) industry and has made recommendations to the Government for chemical industry development. The new Tacis Project “Assistance to Post-Privatisation and Private Sector Development in Armenia” which is being implemented in 2000 until mid 2002 will provide technical assistance to the most promising SME in the chemical industry under the form of business upgrading, business information and co-operation and management training.

15
12. SWOT analysis Strengths Weaknesses • Skilled workers, high standard of
quality and workmanship • Low wages (24 $ in 1998) • Important idle production capacity • Local resources: copper,
molybdenum, iron, gypsum, dolomite, zeolite, barite, bentonite, diatomite, sulphur, quartz, mineral dies, pigments, curative plants
• Production mainly based on imported raw materials
• Outdated production facilities • Obsolete technology • Lack of international standards • Transportation difficult due to blockade • Cost of energy • Lack of financing • Lack of marketing know how • Limited know how about the organisation
of exports • Lack of promotional activities • Traditional and nearest markets as
Russia unstable Opportunities Threats • Co-operation with CIS countries and
Iran
• Emigration and brain drain • Deterioration of skill level and decline of
scientific support • Potential environmental issues • High international competition from
multinationals • World-wide over-capacities for most key
products According to a recent audit led by UNIDO, the overall technological level of Armenian chemical industry is mostly obsolete. Some of the key products are produced in outdated processes with low raw material efficiency, high-energy consumption and inferior environmental compatibility and does not permit high quality products. Most of the equipment is 20 years old and more. Most raw materials have to be imported. Armenia does not have petroleum or natural gas on which most synthesis processes are based. This industry has been developed on the basis of cheap electricity produced by the nuclear plant and subsidised materials and energy from Soviet origin. Now the companies have to pay world prices for these supplies, high rates for local electricity and also high transport costs due to the road and railway blockade of Turkey and Azerbaijan. In addition, the largest chemical enterprises are overstaffed for their current production level. Large investments would be necessary to upgrade the production facilities up to standard but before all it is urgent to make a deep assessment of the competitiveness of the companies taking into account their real production costs, the world competition and markets in view of re-orientating the production towards competitive products with an export potential. Armenia is specialised in few key products, which do not benefit from an increasing world demand and for which the world competition is very hard. In the case of chloroprene rubber, the major chemical product in Armenia (83% of total chemical exports in 1999), the world market is shrinking (165 000 tonnes in 1998). Nairit company has to compete with multinationals Du Pont and Bayer, representing more than 60% of the world production of Polychloroprene.

16
According to the UNIDO experts, much of the production should be discontinued or decreased but such a task will be difficult for the biggest companies because of social constraints and also due to the resistance against changes. SME, which are already privatized, have a more diversified production. They are more flexible to adapt their production to the world market and more open to foreign co-operation. They need to improve their equipment, to introduce new technologies and international standards, and also to improve professional skills in cost accountancy, finance, business planning, management, rational utilization of materials and human resources, marketing. 13. Foreign investments and co-operation opportunities Most of the SME companies of the chemicals sector would be interested in developing co-operation with foreign companies under different forms including investments. The Export Directory Armenia published by ADA in 1999 contains the profiles of 18 companies seeking foreign partners to start new production, enter new markets and most of them have developed a Business or Marketing Plan. The privatisation of the three largest companies – Nairit, Polyvinylacetate, Doghagorts – could also represent opportunities for foreign investors in case of tender procedures. Opportunities by type of chemicals Basic chemistry Extracts from wild fruit and plants, bentonite, chemical
reagents Synthetic and plastic material Plastics, household items Rubber and latex Chloroprene rubber, chloroprene latex, rubber goods, Paints Natural pigments, oil paints, water paints Pharmaceuticals Vitamins, acid milk products, blood substitutions Desired co-operation • Joint ventures • Technical cooperation • Cooperation for sales, distribution and delivery services

17
Annex1 MAJOR COMPANIES OF CHEMICAL INDUSTRY
Name Location (region)
Number of employees
Ownership Type of production Foreign Cooperation
1. NAIRIT CJSC
Yerevan 3.147 • 80% State • 20%
workers
• Chloroprene rubbers (capacity 50 000 tones)
• Chloroprene latex (capacity 10 000 tones)
• Caustic sodium (capacity 66 000
tones) • Cardioplegic
solution • Synthetic acetic
acids (capacity 35 000
tones) • Technical formic
acids (capacity 6000
tones) • Propionic acids
(capacity 4 500 tones) Land surface: 300 hectares
• The main export countries are CIS countries especially Russia and Ukraine
2. DOGHAGORTS CJSC
Yerevan 1 300 • 80% State • 20%
workers
• Tires for cars • Tires for agriculture • Tires for trucks • Tires for forklifts
Not working since Feb. 1999
3. POLYVINYL ACETATE CJSC
Yerevan 800
• 80% State • 20%
workers
• Polyvinyl acetate • PVA-dispersion • Polyvinyl alcohol • Petroleum refining • Fertilisers Land surface: 54 hectares Sales: 0.3 million $ in 1998
The company has stopped its vinyl acetate and PVA production. It is now refining crude petroleum and producing mixed fertilisers from zeolites.

18
COMPANIES OF CHEMICAL SECTOR
RUBBER 4. YEREVA
N RUBBER PRODUCT FACTORY OJSC
Yerevan 150 • 100% private
• Technical/technological plates
• Pressure hoses • Rubber moulds • Bering-bolster for
buildings and bridges
• Hydro insulation products
• Electro-technical ebonite
• Glues for fastening (heat and cold processing)
• The main export countries are Russia, Iran, Syria, Bulgaria
PLASTICS 5. ECHMIA
DZIN PLASTIC GOOD PLANT OJSC
Echmia- dzin
(Armavir)
88 • 100% private
(90% management/ employees)
• General usage plastic goods
• Car batteries
• Domestic sales • Interested in JV
6. PLASTIC OJSC
Yerevan 83 • 100% private
• Polyethylene films • Plastic products
• Domestic sales
7. POLYPLAST OJSC
Yerevan 80 • 100% private (Joint venture)
• Polyethylene pipes and polyvinyl chloride tubes
• Polyethylene film • Vinyl leather • Linoleum • Household plastic
items • Siphones and
shaped parts Plans to purchase new production line to increase production capacity
• 52% UAE participation • main market CIS
countries
PHARMACEUTICALS 8. YEREVA
N VITAMIN PLANT OJSC
Yerevan 167 • 34% State • 66%
Private (63%
management/ employees)
• Oil concentrate of vitamin D3 (veterinary use)
• Powder-like vitamin: Yervit-D3
• Powder-like vitamin: Sorvit-D3
• Vitamin-mineral preparation: Bentovit E-20
• Main export countries are CIS
• Business Plan • Interested in JV
cooperation
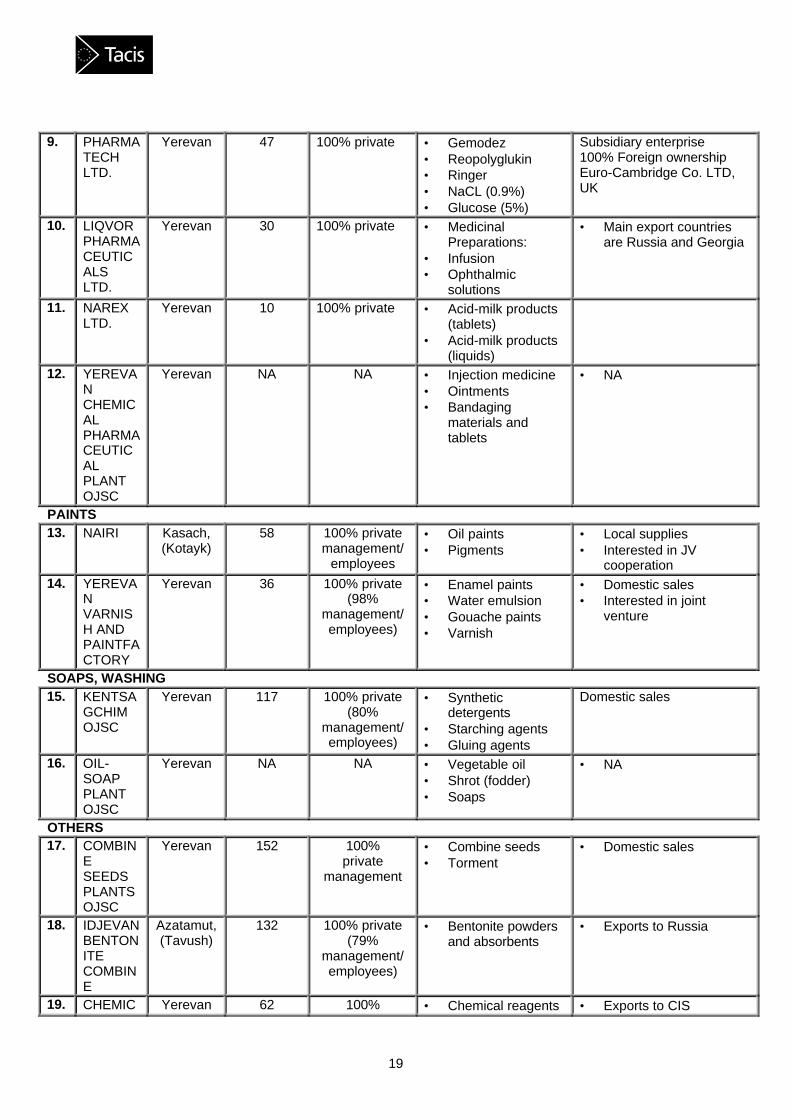
19
9. PHARMATECH LTD.
Yerevan 47 100% private • Gemodez • Reopolyglukin • Ringer • NaCL (0.9%) • Glucose (5%)
Subsidiary enterprise 100% Foreign ownership Euro-Cambridge Co. LTD, UK
10. LIQVOR PHARMACEUTICALS LTD.
Yerevan 30 100% private • Medicinal Preparations:
• Infusion • Ophthalmic
solutions
• Main export countries are Russia and Georgia
11. NAREX LTD.
Yerevan 10 100% private • Acid-milk products (tablets)
• Acid-milk products (liquids)
12. YEREVAN CHEMICAL PHARMACEUTICAL PLANT OJSC
Yerevan NA NA • Injection medicine • Ointments • Bandaging
materials and tablets
• NA
PAINTS 13. NAIRI Kasach,
(Kotayk) 58 100% private
management/ employees
• Oil paints • Pigments
• Local supplies • Interested in JV
cooperation 14. YEREVA
N VARNISH AND PAINTFACTORY
Yerevan 36 100% private (98%
management/ employees)
• Enamel paints • Water emulsion • Gouache paints • Varnish
• Domestic sales • Interested in joint
venture
SOAPS, WASHING 15. KENTSA
GCHIM OJSC
Yerevan 117 100% private (80%
management/ employees)
• Synthetic detergents
• Starching agents • Gluing agents
Domestic sales
16. OIL-SOAP PLANT OJSC
Yerevan NA NA • Vegetable oil • Shrot (fodder) • Soaps
• NA
OTHERS 17. COMBIN
E SEEDS PLANTS OJSC
Yerevan 152 100% private
management
• Combine seeds • Torment
• Domestic sales
18. IDJEVAN BENTONITE COMBINE
Azatamut, (Tavush)
132 100% private (79%
management/ employees)
• Bentonite powders and absorbents
• Exports to Russia
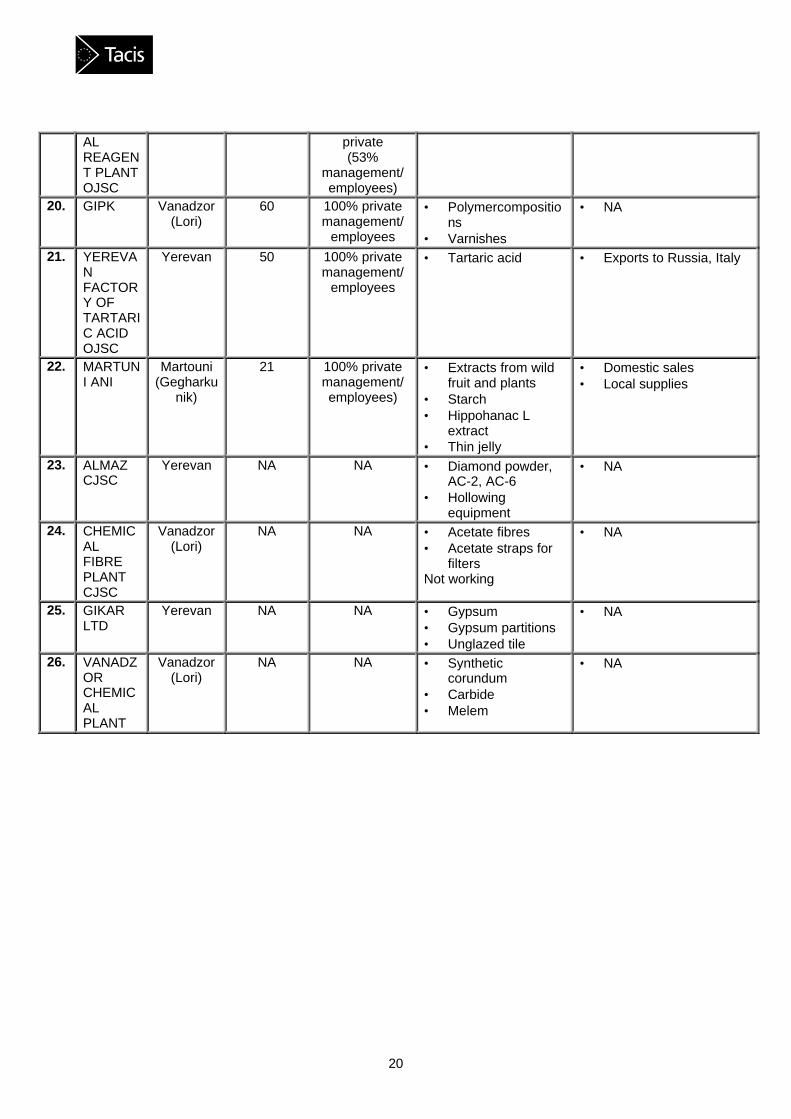
19. CHEMIC Yerevan 62 100% • Chemical reagents • Exports to CIS
20
AL REAGENT PLANT OJSC
private (53%
management/ employees)
20. GIPK Vanadzor (Lori)
60 100% private management/
employees
• Polymercompositions
• Varnishes
• NA
21. YEREVAN FACTORY OF TARTARIC ACID OJSC
Yerevan 50 100% private management/
employees
• Tartaric acid • Exports to Russia, Italy
22. MARTUNI ANI
Martouni (Gegharku
nik)
21 100% private management/ employees)
• Extracts from wild fruit and plants
• Starch • Hippohanac L
extract • Thin jelly
• Domestic sales • Local supplies
23. ALMAZ CJSC
Yerevan NA NA • Diamond powder, AC-2, AC-6
• Hollowing equipment
• NA
24. CHEMICAL FIBRE PLANT CJSC
Vanadzor (Lori)
NA NA • Acetate fibres • Acetate straps for
filters Not working
• NA
25. GIKAR LTD
Yerevan NA NA • Gypsum • Gypsum partitions • Unglazed tile
• NA
26. VANADZOR CHEMICAL PLANT
Vanadzor (Lori)
NA NA • Synthetic corundum
• Carbide • Melem
• NA

21
Annex 2
MAP:
LOCATION OF CHEMICAL INDUSTRY IN ARMENIA
SHIRAK
LORI
TAVUSH
GAVAR
ARARAT
VAYOTS DZOR
SYUNIK
ARMAVIR
YEREVAN
GYUMRI VANADZORIJEVAN
KAPAN
YEG HEG NADZOR
GEGHARKUNIKARTASHAT
ARMAVIR
HRAZDAN
MEGRI
KAJARAN
AGARAK
TATEV
KHNDZORESK
DASTAKERT
SISIAN GORIS
VAYK
JERMUK
ARENI
MARTUNI
VARDENIS
ZODE
TCHANBARAK
BERD
NOYEMBERYAN
AKHTALA
HAGHPAT
SANAHINKOBER
TUMANIAN
ALAVERDI
STEPANAVAN
TASHIR
SPITAK
SEVAN
DILIJAN
TZAGHAKADZOR
APARAN
ABOVIAN
GARNI
GEGHARD
SAGMOSAVANK
ASHTARAKOSHAKAN
BYURAKAN
MASIS
VEDI
ARARAT
TALIN
ARTIK
MARALIK
AMASIA
MARTAKERT
MARTUNI
ASKERAN
STEPANAKERT
SHOUSHI
HADROUT
YeghvardC harentsavan
Azatamut
Kasach
Chemical industry enterprise
19
District centers
Cities
Villages
State
Districts
Capital
ARARATDisticts
BOUNDARIES
COMMUNICATIONS LINES
Rivers
Automobile Roads
Railways
Number of Chemica l industry enterprises in Yerevan
ARAGATZOTN KOTAYK
ECHMIADZIN
YRASKH
GEOGIA
AZERBAIJAN
TURKEY
IRAN
IRAN

22
Annex 3
REFERENCES
Social Economic Situation of the Republic of Armenia in 1999, February 2000, Ministry of Statistics of the Republic of Armenia Industry, 1990-1997, Ministry of Statistics of the Republic of Armenia Economic Trends Armenia, Ministry of Economy/Tacis, August, July-September, September, October 1999 Web site of Ministry of Statistics: http://www.armstat.am Export Supply Survey, Republic of Armenia, International Trade Centre (ITC), 20 May, 1999, Report by ADA (Armenian Development Agency) and David Tunik , Senior Trade Promotion Consultant Export Directory: Armenia 2000, ADA and UNDP, 1999 Investment Projects, Armenia, ADA, September 1999 Programme for the restructuring of the Chemicals Industries, UNIDO/UNDP, Restricted Distribution, Report of Claude Potelle and Richard Temsch UNIDO Consultants, October 1999 Doing business in Armenia, Foreign Direct Investments: Priorities and Trends in the Main Sectors of industry, Tatoul Manasserian, Yerevan 1999, “Noyan Tapan” Armenia, Commercial Guide 1999, Sector Report, “Chemicals in Armenia” British Embassy, Yerevan Web site of Business Support Centre, http://www.bsc.am AEPLAC database incorporating data provided by national sources and companies