iea bioenergy task 40 -...
TRANSCRIPT

IEA Bioenergy Task 40 ‐ Sustainable International Bioenergy Trade‐ Country Report 2009 Italy Etaflorence Renewable Energies
Pag. 1/ 33
IEA Bioenergy Task 40 Sustainable International Bioenergy Trade
COUNTRY REPORT 2009:
ITALY
September 2009
Contacts:
[email protected] Maurizio Cocchi
[email protected] Stefano Capaccioli
[email protected] Filippo Vivarelli
Etaflorence Renewable Energies Piazza Savonarola, 10 • 50132 Firenze • Italy • Tel +39 055 5002174 • Fax +39 055 573425 • [email protected] • www.etaflorence.it

IEA Bioenergy Task 40 ‐ Sustainable International Bioenergy Trade‐ Country Report 2009 Italy Etaflorence Renewable Energies
Pag. 2/ 33
Index
1. EXECUTIVE SUMMARY .................................................................................................... 3
2. GENERAL INTRODUCTION .............................................................................................. 5
2.1 CO2 Requirements................................................................................................... 5 2.2 Energy Balance ....................................................................................................... 6 2.3 Energy from biomass............................................................................................... 9
3 POLICIES AND SUPPORT MEASURES ........................................................................... 11
3.1 GREEN CERTIFICATES ......................................................................................... 11 3.2 Special Feed-In Tariffs for Small Scale Plants ......................................................... 13 3.3 Biofuel Policy ........................................................................................................... 13
4. BIOMASS RESOURCES................................................................................................ 15
4.1 Forest Biomass........................................................................................................ 15 4.2 Energy Crops........................................................................................................... 15
5. PRODUCTION CONSUMPTION AND TRADE OF WOOD PELLETS................................ 17
6. PRODUCTION CONSUMPTION AND TRADE OF BIODIESEL......................................... 20
7. PRODUCTION CONSUMPTION AND TRADE OF BIOETHANOL..................................... 23
8. BARRIERS AND OPPORTUNITIES FOR INTERNATIONAL BIOENERGY TRADE.......... 29
9. REFERENCES ................................................................................................................... 32

IEA Bioenergy Task 40 ‐ Sustainable International Bioenergy Trade‐ Country Report 2009 Italy Etaflorence Renewable Energies
Pag. 3/ 33
Acknowledgements
We would like to thank Eugenio Muraro, for his help and his great contribution to the
development of this country report. Thanks also to Leonardo Nibbi, Department of Energy,
University of Florence for sharing useful information.
1. EXECUTIVE SUMMARY
In 2007 the total energy demand in Italy was 339.9 TWh, the highest value ever registered.
Although traditional thermal electric processes based on fossil fuels are still the primary means
of power production, renewables, particularly wind and photovoltaic power grew significantly,
while hydropower decreased, though still represented the largest source of renewable
electricity.
In this context bioenergy is a growing business for Italy. The use of biomass feedstock from
agriculture (including energy crops) and agro‐industrial residues is increasing; in 2007 the
production of electricity from biomass and biogas increased by +3% and +8% respectively. In
2008, 34 biomass plants and 36 bioliquid plants (essentially running with pure vegetal oils)
were active. The number of biomass plants running on vegetable oils has been growing steadily
in the last few years and has now reached the number of traditional solid biomass plants.
The growth of the Italian bioenergy sector is relying on the establishment of a stable regulatory
framework, that has evolved significantly during the last three years. Among the major
advancements, the financial law 2008 introduced a special support scheme for small scale
projects with a production capacity of up to 1 MWe. As far as energy crops are concerned,
according to various sources, in 2007 the area of oil crops dedicated to biodiesel production
was estimated at around 60.000 ha, whereas over 5.100 ha of land were dedicated to the
cultivation of short rotation plantations of poplar.
Italy is the largest European market for pellet stoves coupled with a pellet market that is
essentially comprised of domestic heating. In 2008 over 1 million tons of pellets were
distributed, but the Italian production capacity was not being fully exploited and significant
imports were observed, one of the biggest trading partners being Austria, exported over
250.000 tons of pellets to Italy.
Despite the large growth in the last few years, the pellet market is facing some critical
challenges that are leading to uncertainty and instability regarding prices and supplies;
however the large and still growing market of pellet stoves for domestic heating will probably
continue to drive the demand for pellets in the coming years.
As far as biodiesel is concerned in 2007 the total production of biodiesel in Italy was 469.707t
but only 202.035t was distributed to national market and in 2008 significant trade flows of
biodiesel were registered, especially with other EU countries. Most of the biodiesel produced in
Italy today derives from imported feedstock, the main part of which is rapeseed oil, whereas
the primary feedstock of national origin is sunflower oil, followed by rapeseed and soybean.

IEA Bioenergy Task 40 ‐ Sustainable International Bioenergy Trade‐ Country Report 2009 Italy Etaflorence Renewable Energies
Pag. 4/ 33
In addition to biodiesel, bioliquids, especially vegetal oils may have an increasingly important
role in the future Italian bioenergy scenario. A significant number of bioenergy projects should
be implemented in the framework of the reconversion of several former sugar plants, now
closed after the European reform of the sugar industry. Though most of the feedstock should
be produced locally, the implementation of these bioenergy projects may provide
opportunities for the trade of vegetal oils and oilseeds.
Bioethanol is another important issue in the Italian bioenergy sector. In 2005 bioethanol for
transport represented only 5% of the ethanol market and was distributed uniquely as an
additive (ETBE), not as substitution fuel in gasoline blends, despite the existence of biofuel
obligations. Due to some bureaucratic and normative gaps, in 2006 and 2007 not a single liter
of bioethanol was used as transport fuel and in 2007, the production of fuel grade ethanol was
entirely exported to Sweden. Without the full introduction and adoption of reduced excise
duties, that has been delayed by the uncertain normative framework of the past few years,
bioethanol blends are uncompetitive with traditional fossil fuels for transports. At present only
a production quota of 1 million hectoliters per year of ethanol is eligible for a reduced excise
duty and it is going to be used mainly for ETBE production.
In the last three years, one of the biggest barriers to the development of bioenergy and biofuel
production in Italy has been the lack of a stable and clear regulatory framework, nevertheless
the interest in this field among operators, is growing fast especially with small and large
investors. However these limitations were overcome thanks to the recent introduction of some
important updates from the National support scheme for renewable energy and in particular
bioenergy. Furthermore the adoption of the EC Directive for the promotion of renewable
energy, requiring member states to prepare National Renewable Energy Action Plans by June
2010, will hopefully represent a great opportunity for the further development of the Italian
bioenergy policy to support the expansion of this growing sector.

IEA Bioenergy Task 40 ‐ Sustainable International Bioenergy Trade‐ Country Report 2009 Italy Etaflorence Renewable Energies
Pag. 5/ 33
2. GENERAL INTRODUCTION The total land area of Italy is 294,020 sq km, the population is 58.145.321 (2008) with a density of 198 people per square km, much higher than the European average of 32. Agricultural land covers 17.800.000 hectares whereas forests cover 10.467.533 hectares. In 2008 the GDP was estimated at 1,814,557 M$, corresponding to a GDP per capita of $31,000. In 2008 the GDP growth was ‐1.0%, +1.5% in 2007 and +1.8% in 2006. Agriculture accounts for 2% of the country’s GDP, producing fruits, vegetables, grapes, durum and soft wheat, olives; meat and dairy products. The industrial sector accounts for 26,7% of GDP; the main industries are tourism, machinery, iron and steel, chemicals, food processing, textiles, motor vehicles, clothing, footwear, ceramics. Finally services account for 71,3% of the GDP. Exports represent an important share of the Italian economy (566 billion $ in 2008, 7th exporting country in the world) with the main exported goods being engineering products, textiles and clothing, production machinery, motor vehicles, transport equipment, chemicals; food and beverages. The Italian economy is driven largely by the manufacture of high‐quality consumer goods produced by small and medium‐sized enterprises. Italy is one of the world’s largest producers of wine and one of the leaders in olive oil, fruits (apples, oranges, lemons, pears, apricots, peaches, cherries, strawberries, and kiwi), flowers and vegetables. The metal‐mechanic industry which represents 41% of the entire manufacturing industry, provides those metallurgic and mechanical processes used for the production of complex machines or machine parts, printing, cutting, painting, laminating, foundry etc., all of which are realized by the manufacturing and transformation process technologies. Italy being a world leader of the Industrial sector has a history which is mainly concentrated in northern Italy.
2.1 CO2 REQUIREMENTS
As a signatory country of the Kyoto Protocol, Italy committed itself to achieving a reduction of GHG emissions of 6,5% compared to 1990 level within the period 2008‐2012. To be more precise, emissions must pass from 521 Mt of 1990 to 483 Mt of CO2 equivalents, so there must be a reduction of 34 Mt. Unfortunately during the last ten years GHG emissions grew up to 580 Mt in 2005 (+12% compared to 1990). Although in the last 4 year there was a stable reduction of emissions, in 2008 the level of GHG emissions was still at +6% compared to 1990. The Italian Ministry for Environment and Territory indicates several ways to reach this target, in particular about the CO2 emission trading quotes, referred to the 2003/87/CE Directive, and elaborated an allocation decision for the period 2005‐2007 as shown below.
2005 2006 2007 Assigned Emission Quota (Million tons CO2)
222,31 225,88 221,15
Table 1: Source: Ministry for Environment and Territory

IEA Bioenergy Task 40 ‐ Sustainable International Bioenergy Trade‐ Country Report 2009 Italy Etaflorence Renewable Energies
Pag. 6/ 33
2.2 ENERGY BALANCE
In 2007 the demand for electric power increased by 0,7% compared to 2006. The total energy demand was 339, 9 TWh, the highest value ever registered. In the decade 1998‐2007 the demand rose by 21, 7%, passing from 279, 8 TWh to 339, 9 TWh. Natural gas is the most used resource for power production (167,9 TWh, 66% of the total amount). In 2007, 86.4% of the electricity demand was covered by domestic production. The share of industry was 48.8%, 28.3% tertiary, 21.1% domestic use and 1.8% agriculture. Table 3 shows the balance of electric power production in 2007; although traditional thermal electric processes based on fossil fuels are still the primary mean of power production, wind and
2007 (Mtoe) Available and Use
Solids Natural Gas
Oil Renewables
Electric Power
Total
1 Production 0,540 8,008 5,860 13,569 27,977
2 Import 16,834 61,009 107,817 0,741 10,765 197,166
3 Export 0,185 0,056 30,759 0,006 0,582 31,588
4 Stock Variation
‐0,023 ‐1,080 0,458 0,000 ‐0,645
5 Gross Internal Consumption (1+2‐3‐4)
17,212 70,041 82,460 14,304 10,183 194,200
6 Loss and Consumption of Energy Sector
‐0,774 ‐1,270 ‐6,085 ‐0,099 ‐42,761 ‐50,989
7 Transformation in Electric Power
‐11,937
‐28,292 ‐7,248 ‐11,703 59,180 0,000
8 Total Final Use (5+6+7)
4,501 40,479 69,127 2,502 26,602 143,211
9 Industry 4,361 15,810 7,145 0,368 11,999 39,683
10 Transports ‐ 0,488 43,385 0,159 0,895 44,927
11 Civil 0,007 23,248 5,111 1,755 13,221 43,342
12 Agriculture 0,158 2,457 0,220 0,487 3,322
13 Non Energetic Use
0,133 0,775 7,471 0,000 ‐ 8,379
14 Bunkering ‐ ‐ 3,558 ‐ ‐ 3,558
Table 2: National energy balance in 2007 Source: Ministry of Economic Development

IEA Bioenergy Task 40 ‐ Sustainable International Bioenergy Trade‐ Country Report 2009 Italy Etaflorence Renewable Energies
Pag. 7/ 33
photovoltaic power grew significantly. The large increase of PV power production in particular is due to the great expansion of the PV market in Italy, as a consequence of the effectiveness of the highly rewarding feed‐in incentive regime introduced in 2007 (Ministerial Decree n. 387 February 19, 2007, enacting the European Renewables Directive, and establishing a program of incentives for photovoltaic power generation).
Year 2007 2006 % variation
Net Production (GWh) 301.299 301.225 0%
Hydro 37.962 42.883 ‐11,5%
Thermal energy 254.022 250.170 +1,5%
Geothermal 5.242 5.208 +0,7%
Wind 4.032 2.964 +36,1%
PV 39 2,3 +1.630,8%
Consumption 293.645 292.474 +0,4
Imported Electric Power 48.930 46.595 +5%
Exported Electric Power 2.648 ‐1.610 +64,4%
DEMAND 339.928 337.458 +0,7%
Grid Loss 20.975 19.925 +5,3%
CONSUMPTION 318.952 317.533 +0,4%
Agriculture 5.659 5.503 +2,8%
Industry 155.804 156.150 ‐0,2%
Tertiary 90.268 88.276 +2,3%
Table 3: Electric Power Production Balance in Italy 2007 ‐Source : TERNA

IEA Bioenergy Task 40 ‐ Sustainable International Bioenergy Trade‐ Country Report 2009 Italy Etaflorence Renewable Energies
Pag. 8/ 33
GWh 2007 2006 2007/2006
Solids ( coal, brown coal ) 40.055 40.196 ‐0,4%
Natural Gas 167.902 153.570 +9,3%
Oil Derivates 20.871 31.297 ‐33,3%
Gas Derivates 5.477 6.018 ‐9,0%
Other Solid Fuels ( waste ) 17.268 16.734 +3,2%
Other Fuels ( biogas ) 1.460 1.358 +7,5%
Table 4: Power Sources Production in Italy 2007 Source: TERNA
Among renewable sources, the major contribution in terms of electricity produced still comes from hydropower. However between 2006 and 2007 a relative reduction of ‐11% of electricity from hydro was observed, whereas wind power marked an increase of +35% (tab. 5).
GWh 2007 2006 2007/2006
Hydro 32.815,2 36.994,4 ‐11,3%
Wind 4.034,4 2.970,7 +35,8%
Solar 39 35 +11,4%
Geothermic 5.569,1 5.527,4 +0,8%
Biomass and Waste 6.744,6 6.953,7 +3,1%
Total 49.411,3 52.272,1 ‐5,5%
Table 5: Gross RES Production in Italy 2007 Source: GSE – Statistics on renewable sources 2007
Figure 1: Gross RES Electric Power by sector. Source: GSE
Despite the increase of energy production from various RES, between 1994 and 2007 the relative share of electricity from renewable energy over the gross electricity production decreased from 20,9% to 15,7%. This seems to point out that the speed of increase of power production from traditional sources was much higher than that of power from RES (Fig. 2).

IEA Bioenergy Task 40 ‐ Sustainable International Bioenergy Trade‐ Country Report 2009 Italy Etaflorence Renewable Energies
Pag. 9/ 33
Figure 2: Gross RES Production/ Gross Electric Power in Italy from 1994 to 2007. Source: GSE
2.3 ENERGY FROM BIOMASS
In 2007 an observed increase of +3% of the energy produced from biomass and +8% from biogas were recorded. The use of biomass feedstock from agriculture (including energy crops) and agro‐industrial residues is increasing for bioenergy as well as biogas production.
GWh 2007 2006 2007/2006
Solids 5.506,4 5.408,3 +1,8%
Municipal solid waste 3.024,9 2.916,6 +3,7%
Agriculture and agro‐industry residues
2.481,5 2.491,7 +6,6%
Biogas 1.447,3 1.336,3 +8,3%
Landfill 1.247,3 1.176,8 +6,0%
Sewage sludge 9,0 3,3 +172,7%
Manure 53,3 44,7 +19,2%
Energy crops and agroindustry residues
137,7 111,5 +23,5%
Total 6.953,7 6.744,6 +3,1%
Table 6: Electricity from biomass in Italy 2007. Source GSE
Most electricity produced from biomass is found in the northern regions located along the alpine chain and in the Po valley such as Lombardia, Emilia‐Romagna, Veneto and Piedmont (tab. 7).

IEA Bioenergy Task 40 ‐ Sustainable International Bioenergy Trade‐ Country Report 2009 Italy Etaflorence Renewable Energies
Pag. 10/ 33
Region GWh
Piedmont 324,2
Valle D’Aosta 4,1
Lombardy 2.239,7
Trentino Alto Adige 79,1
Veneto 437,2
Friuli Venezia Giulia 266,6
Liguria 71,4
Emilia Romagna 936,0
Toscana 270,2
Umbria 145,1
Marche 60,5
Lazio 364,2
Abruzzi 33,5
Molise 92,6
Campania 77,0
Puglia 425,2
Basilicata 21,5
Calabria 790,8
Sicilia 58,7
Sardinia 254,1
TOTAL 6.953,7
Table 7: Electric Power from biomass in Italy 2007 by regions Source: GSE – Statistics on renewable energy 2007
According to the annual statistics published by GSE, (the National Electric Service Management Company) in 2008, 34 biomass plants and 36 bioliquid plants (essentially running with pure vegetal oils) were active, with an overall nominal installed capacity of 1.109 MWe. The number of biomass plants running on vegetable oils has been growing steadily in recent years and has now reached the number of traditional solid biomass plants. For both types, a wide range of installed capacities was observed, ranging between 50 kW and 50 MW, however, more than 80% of solid biomass plants have an installed capacity of over 1MWe whereas 80% of those running on bioliquids are smaller than 1 MWe. These statistics show also a large number of planned plants; even though it is not possible to know how many of these projects will be actually implemented in the next years, these figures give a clear indication regarding an increasing interest for bioenergy that has emerged in recent times among potential investors.
Active Planned
Number Capacity (MW) Number Capacity (MW)
Biomass 34 992 44 463
Bioliquids 36 117 229 1.668
Biomass from waste 6 347 9 28
Biogas from landfill 141 210 31 34
Other biogas 114 57 64 58
Total 331 1.723 377 2.252
Table 8: Active and planned bioenergy plants in 2008. Source GSE
IEA Bioenergy Task 40 ‐ Sustainable International Bioenergy Trade‐ Country Report 2009 Italy Etaflorence Renewable Energies
Pag. 11/ 33
3 POLICIES AND SUPPORT MEASURES
3.1 GREEN CERTIFICATES
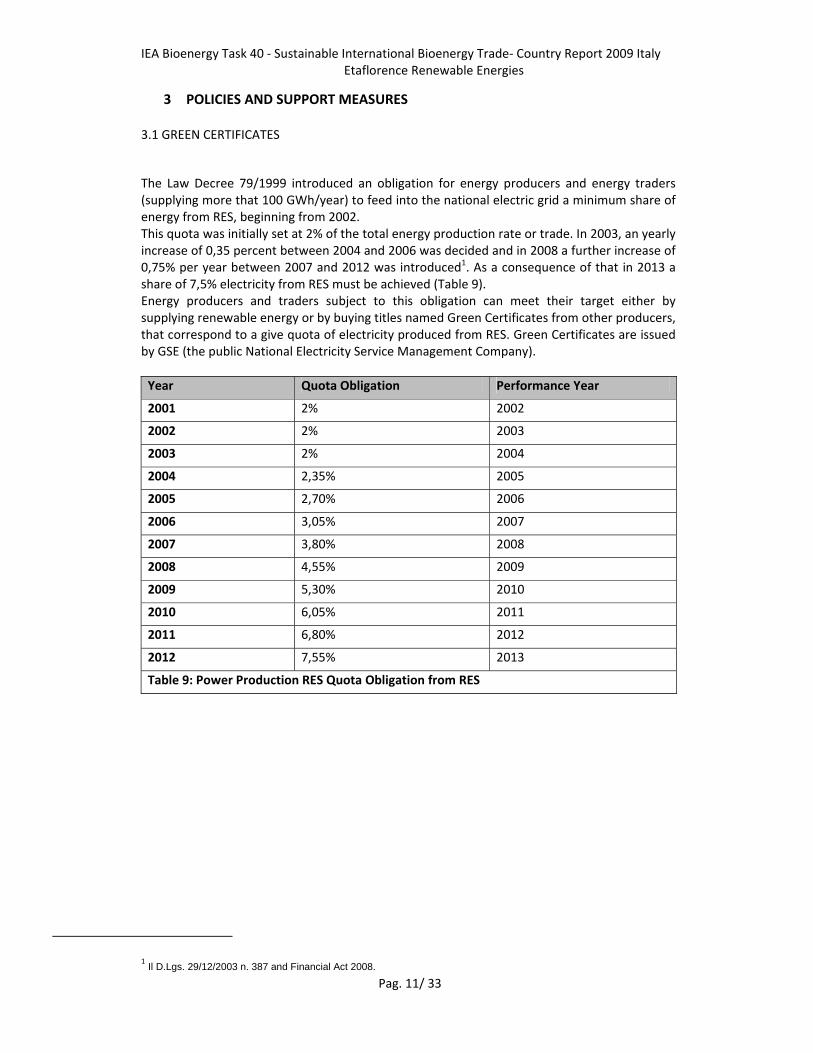
The Law Decree 79/1999 introduced an obligation for energy producers and energy traders (supplying more that 100 GWh/year) to feed into the national electric grid a minimum share of energy from RES, beginning from 2002. This quota was initially set at 2% of the total energy production rate or trade. In 2003, an yearly increase of 0,35 percent between 2004 and 2006 was decided and in 2008 a further increase of 0,75% per year between 2007 and 2012 was introduced1. As a consequence of that in 2013 a share of 7,5% electricity from RES must be achieved (Table 9). Energy producers and traders subject to this obligation can meet their target either by supplying renewable energy or by buying titles named Green Certificates from other producers, that correspond to a give quota of electricity produced from RES. Green Certificates are issued by GSE (the public National Electricity Service Management Company).
Year Quota Obligation Performance Year
2001 2% 2002
2002 2% 2003
2003 2% 2004
2004 2,35% 2005
2005 2,70% 2006
2006 3,05% 2007
2007 3,80% 2008
2008 4,55% 2009
2009 5,30% 2010
2010 6,05% 2011
2011 6,80% 2012
2012 7,55% 2013
Table 9: Power Production RES Quota Obligation from RES
1 Il D.Lgs. 29/12/2003 n. 387 and Financial Act 2008.

IEA Bioenergy Task 40 ‐ Sustainable International Bioenergy Trade‐ Country Report 2009 Italy Etaflorence Renewable Energies
Pag. 12/ 33
Figure 3: Power Production Quota from RES referred to Law Decree 79/99
Initially the minimum size of the green certificates was 50 MWh; this size was progressively reduced until the establishment of a 1 MWh size by the Financial Act of 2008, entered into force in January 2009. Another major advancement introduced by the Financial Law of 2008 is the allocation extension period of green certificates of up to 15 years to all RES plants starting activity after 31.12.07, instead of 8 years as established in 1999. The value of green certificates is market driven, nevertheless, small operators can sign simplified purchase arrangements and net metering (up to an installed capacity of 200 kWe) with GSE. Under the simplified arrangements, producers may sell the electricity injected into the grid to GSE, as an alternative to bilateral contracts or direct trading in the power exchange. GSE purchase bids are based on a “reference price”, that since 2009 is calculated as the difference between 180 €/MWh and the average price of electricity of the previous year. In 2007 and 2008 the reference price was respectively 137,46 €/MWh and 112,88 €/MWh VAT excluded. The value of GC is additional to the traditional feed in tariff paid by the energy buyer to the energy provider. The Financial Law 2008 and a subsequent integration approved in July 20092, introduced a further update regarding the green certificate system for power plants larger than 1MW and a special feed‐in tariff for RES plants with a capacity under 1MW. The revision concerning green certificates introduced a varying “multiplication coefficient” depending on the source of RE. This coefficient is meant to provide different incentives to different technologies and must be applied to the amount of MWh/year produced (for 1 green certificate = 1 MWh). This coefficient is now: 1 for wind farms, 1.5 for offshore wind, 0.9 for geothermal, 1.8 for tidal and wave, 1 for hydroelectric, 1.3 for biomass and organic waste plants. However a debate is still on‐going as to establishing a possible 1.8 coefficient for biomass.
2 (Law No 244/07) and Law. No 99/09

IEA Bioenergy Task 40 ‐ Sustainable International Bioenergy Trade‐ Country Report 2009 Italy Etaflorence Renewable Energies
Pag. 13/ 33
3.2 SPECIAL FEED‐IN TARIFFS FOR SMALL SCALE PLANTS
With the same law, a special feed in tariff for small renewable energy power plants of up to 1 MWe was introduced, a full comprehensive tariff that is an alternative to the green certificate regime. Under this special regime the tariffs are: 0,20 €/kWh for geothermal plants, 0,34€/kWh for tidal and wave, 0,22 €/kWh for hydroelectric, 0.28€/kWh for biogas (other than landfill) , biomass and pure vegetal oil (produced with full traceability guarantee), 0.18€ /kWh for landfill and waste depuration biogas and liquid biofuels including ethanol and biodiesel . Moreover, and only for these type of energy, it’s possible to cumulate the Green Certificates and the contribution of public grants. Another relevant point, due to the Law Decree n. 26/2007, introduces the complete tax exemption for plants producing energy power from non‐chemical modified oil.
3.3 BIOFUEL POLICY
Law Decree n.128 of 30 May 2005, adoption of European Directive 2003/30/EC, set up the following voluntary national targets for biofuel consumption as a percentage of the total transport fossil fuels, to be measured in terms of energy content: 1% by 2005 and 5.75 % by 2010. These values were quite a bit lower than those set by the biofuels directive and an infringement procedure was launched against Italy by the European Commission. In March 2006, the Law n.81/2006 introduced mandatory obligations for diesel and gasoline fuel suppliers to achieve a 1% share, in terms of the low heating value of biofuels within the total amount of fuel they placed on the market in the previous year; this percentage should be increased by 1% each year up to 2010. With the Financial Law 2007 the biofuel obligations set up in Law n.81 were set at a share of 1% for 2006 and 2% for 2007, but at the same time this regulatory advancement introduced again a voluntary National target of 5,75% share by 2010 (both biodiesel and bioethanol), which is still valid. As far as biodiesel is concerned, Law n. 222/2007 introduced a program (running between 2007‐2010) of support measures for biodiesel based on a reduced excise duty, that is 20% of the normal diesel fuel. The reduced duty is limited to an annual quota of 250,000 tons of biodiesel and is distributed to producers according to their production levels, so that only a fraction of each producer's total biodiesel output would benefit from the tax reduction. The biodiesel supply must come partly from national oil crop production and the rest from trade. Any producer of biodiesel in the EU is eligible for this support measure. The scheme includes a mandatory biodiesel supply obligation for fuel producers and suppliers, who are obliged to supply a minimum share of biofuels in the transports fuel market. Since January 2009 a further target of 3% has been introduced (was 2,5% until Dec. 2008). However the excise reduction is a temporary measure to facilitate the transition into a pure supply obligation regime after 2010.
IEA Bioenergy Task 40 ‐ Sustainable International Bioenergy Trade‐ Country Report 2009 Italy Etaflorence Renewable Energies
Pag. 14/ 33
Bioethanol
The targets set by law 81/2006 apply to ethanol as well, the Financial Law of 2007 (Law n. 296/2006) introduced a budget of 73 M€ for reduced excise duty applicable to a quota of bioethanol but ethanol producers could not take advantage of this measure in 2007 due to a series of normative gaps that blocked its application. In April 2008 two new decrees on biofuel obligations ( decree n.100 of 23.04.2008 and n.110 of 29.04.2008) were formed, these helped the definition of the regulatory framework for bioethanol.
Decree n.100 establishing sanctions for fuel producers and suppliers who are not compliant
with the mandatory shares of biofuels set by law 81/2006. Decree n.110 defining the criteria, conditions and modes for the application of the biofuel
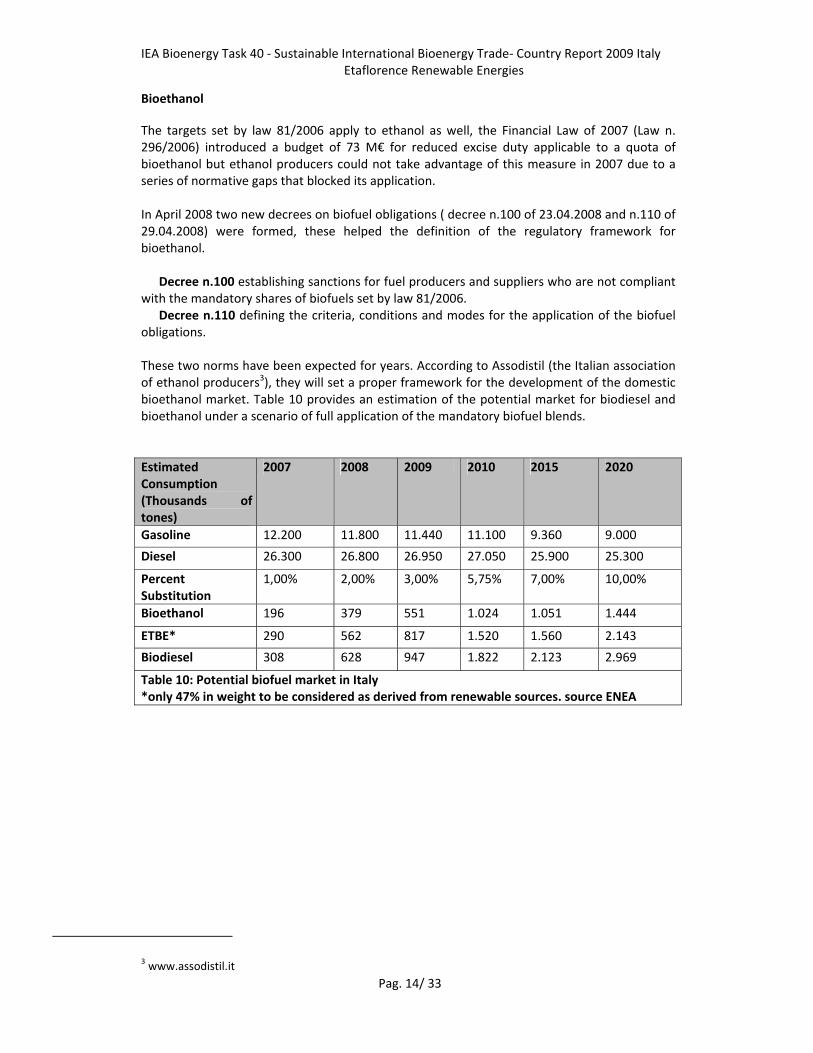
obligations. These two norms have been expected for years. According to Assodistil (the Italian association of ethanol producers3), they will set a proper framework for the development of the domestic bioethanol market. Table 10 provides an estimation of the potential market for biodiesel and bioethanol under a scenario of full application of the mandatory biofuel blends.
Estimated Consumption (Thousands of tones)
2007 2008 2009 2010 2015 2020
Gasoline 12.200 11.800 11.440 11.100 9.360 9.000
Diesel 26.300 26.800 26.950 27.050 25.900 25.300
Percent Substitution
1,00% 2,00% 3,00% 5,75% 7,00% 10,00%
Bioethanol 196 379 551 1.024 1.051 1.444
ETBE* 290 562 817 1.520 1.560 2.143
Biodiesel 308 628 947 1.822 2.123 2.969
Table 10: Potential biofuel market in Italy *only 47% in weight to be considered as derived from renewable sources. source ENEA
3 www.assodistil.it

IEA Bioenergy Task 40 ‐ Sustainable International Bioenergy Trade‐ Country Report 2009 Italy Etaflorence Renewable Energies
Pag. 15/ 33
4. BIOMASS RESOURCES
4.1 FOREST BIOMASS
Assessing the actual consistence of forest biomass resources in Italy is not an easy task, as during the last few years several estimations of the available biomass stock produced from forestry were published by various sources indicating varying results. According to the National Inventory of Forest Carbon Sinks (www.infc.it), the forest area in Italy amounts to 8.8 million ha, and the quantity of woody biomass that is potentially available is 874 million tons (dry basis) or 1.269 millions of cubic meters of wood. According to a recent survey by ARPA Lombardia of 2007, the national consumption of woody biomass for domestic heating is estimated at 19 million tons per year. A study by Ditesaf (University of Padova)4 estimated the consumption of woody biomass for power generation in 1,25 million tons per year and that of district heating plants in 0,4 million tons.
4.2 ENERGY CROPS
Oil crops in Italy have always been an important agricultural production. Table 11 shows the evolution of the harvested area and the average seed yield of the three main oil crops in Italy since 2004; a large increase of production of these crops was observed in 2006 but 2007 and 2008 showed a reduction of surfaces. The main use of oil crops still remains the agro‐food industry. According to various sources5 in 2007 the area of oil crops dedicated to biodiesel production was estimated at around 60.000 ha, therefore a large share of biodiesel production still comes from the import of oils or grains.
Sunflower Soybean Rapeseed year
Harvested area (.000 ha)
Yield (t/ha)
Harvested area (.000 ha)
Yield (t/ha)
Harvested area (.000 ha)
Yield (t/ha)
2004 124.00 2.25 150.39 3.53 2.87 1.85
2005 129.87 2.27 152.33 3.65 3.47 1.78
2006 144.57 2.17 176.13 3.10 3.54 1.72
2007 126.48 2.23 130.34 3.14 7.06 2.16
2008 121.75 2.3 138.96 3.27 12.55 2.63
Table 11: Area and yield of oil crops6
4 D.Pettenella .‐ “Stock e Flussi nel Sistema forestale”. 2009. Sherwood n. 154 5 Agenzia delle Dogane and and supplement to “Informatore Agrario 27/2009” page 32; and “Rivista di Ermesagricotura” n. 28/2007 6 Source: Informatore Agrario
IEA Bioenergy Task 40 ‐ Sustainable International Bioenergy Trade‐ Country Report 2009 Italy Etaflorence Renewable Energies
Pag. 16/ 33
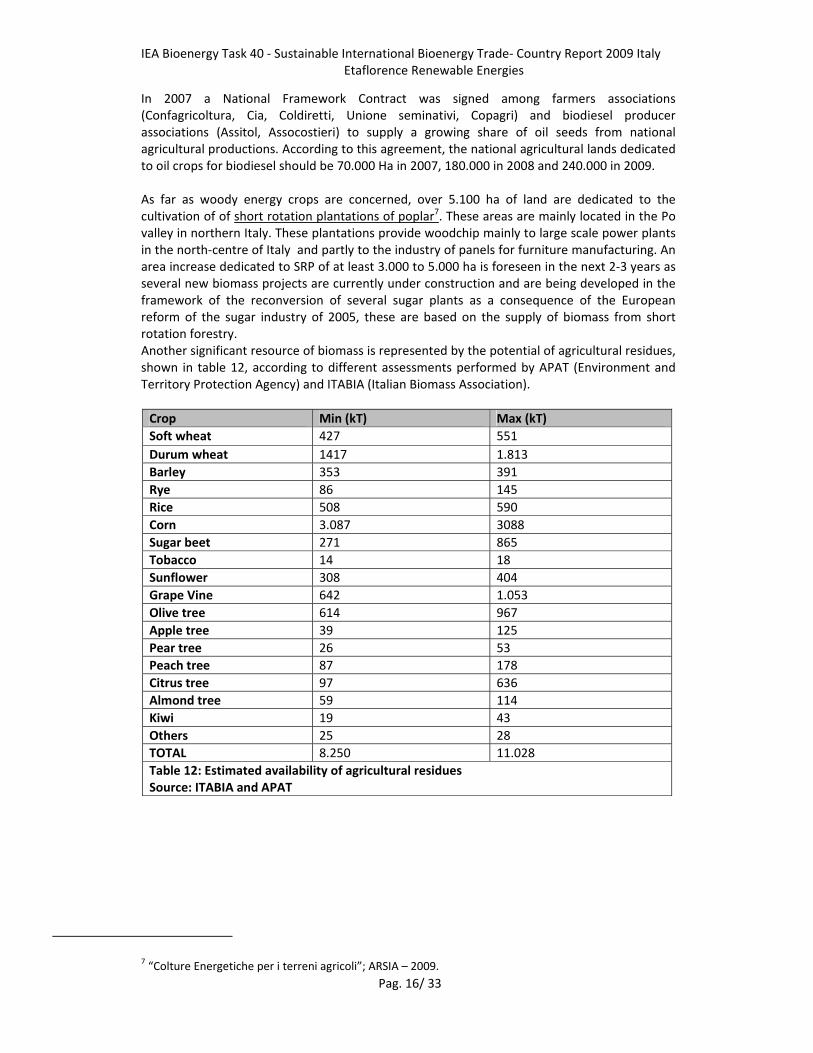
In 2007 a National Framework Contract was signed among farmers associations (Confagricoltura, Cia, Coldiretti, Unione seminativi, Copagri) and biodiesel producer associations (Assitol, Assocostieri) to supply a growing share of oil seeds from national agricultural productions. According to this agreement, the national agricultural lands dedicated to oil crops for biodiesel should be 70.000 Ha in 2007, 180.000 in 2008 and 240.000 in 2009. As far as woody energy crops are concerned, over 5.100 ha of land are dedicated to the cultivation of of short rotation plantations of poplar7. These areas are mainly located in the Po valley in northern Italy. These plantations provide woodchip mainly to large scale power plants in the north‐centre of Italy and partly to the industry of panels for furniture manufacturing. An area increase dedicated to SRP of at least 3.000 to 5.000 ha is foreseen in the next 2‐3 years as several new biomass projects are currently under construction and are being developed in the framework of the reconversion of several sugar plants as a consequence of the European reform of the sugar industry of 2005, these are based on the supply of biomass from short rotation forestry. Another significant resource of biomass is represented by the potential of agricultural residues, shown in table 12, according to different assessments performed by APAT (Environment and Territory Protection Agency) and ITABIA (Italian Biomass Association).
Crop Min (kT) Max (kT)
Soft wheat 427 551
Durum wheat 1417 1.813
Barley 353 391
Rye 86 145
Rice 508 590
Corn 3.087 3088
Sugar beet 271 865
Tobacco 14 18
Sunflower 308 404
Grape Vine 642 1.053
Olive tree 614 967
Apple tree 39 125
Pear tree 26 53
Peach tree 87 178
Citrus tree 97 636
Almond tree 59 114
Kiwi 19 43
Others 25 28
TOTAL 8.250 11.028
Table 12: Estimated availability of agricultural residues Source: ITABIA and APAT
7 “Colture Energetiche per i terreni agricoli”; ARSIA – 2009.

IEA Bioenergy Task 40 ‐ Sustainable International Bioenergy Trade‐ Country Report 2009 Italy Etaflorence Renewable Energies
Pag. 17/ 33
5. PRODUCTION CONSUMPTION AND TRADE OF WOOD PELLETS
The Italian production of pellets started in 1998, but today it shows very strong features. It developed almost exclusively for domestic heating with pellets typically packaged in small bags (15 kg), a comfortable option to feed little stoves of which Italy is the leading producers in Europe. We can state that the pellet market in Italy has gone beyond its initial stage, but on the other hand we can’t consider that it is fully developed. The causes of this lack of maturity are the imbalance between demand and supply, especially in some periods of the year, shortage of raw material, lack of real quality standards and lack of an important national association so far. The production level is starting to be relevant and the consumption level increase constantly, also due to the relevant cost of fossil fuel in Italy and a limited availability of pipe of natural gas in rural/mountainous areas. Usually the pellet price in Italy is very volatile depending on the season: we touched the peak cost in middle to late winter and the lowest level during late spring and summer. The number of pellet producers has grown a lot during the last few years. Today in Italy over 75 producers of pellets are present, even if to know the correct number is very difficult, due to the lack of official documents. Some companies that until the year 2005 were classified as pellet producer stopped their production and started retailing activity. In order to give a clear picture of the Italian market, it must be noticed that in our analysis we considered only the pellets producers that sell their product, the auto producers are not considered in this mentioned figure. Certainly Italy has always been an importer country, as its production capacity has always been lower than the consumption. Most of the production (offer) is concentrated in Northern areas (73.3% of the national production comes from this area). The request (demand) of the product is distributed in a more heterogeneous way between the other regions of Italy. AIEL is the association that declares which companies produces pellets in accordance with the Pellet Gold standard, but AIEL is not an independent certification agency. By now the lack of a real certification for wood pellets manufactured in Italy could generate distrust among users and so hamper the development of the market. At the same time the bigger producer in Italy stopped temporally its production as the raw material used was not 100% pure wood. This fact made a bad advertisements to pellets fuel sector. In June 2009 over 322 t of pellet imported from Lithuania and part of 10.000 tons distributed in 2008 were positively measured during a radioactivity analysis and retired from the market. In June 2009 over 322 t of pellet imported from Lithuania and part of 10.000 tons distributed in 2008 were positively measured during a radioactivity analysis and retired from the market. Italy is the largest European market for pellet stoves and using pellets for domestic heating. In 2008 over 850.000 tons of pellet were distributed, 650.000 to 700.000 of which came from national production and the rest from importation8. No export flows are reported in 2007. During the same year the production of pellets was estimated at 522.000 t and the production capacity limit was 700.000 t. The national production doesn’t seem sufficient to satisfy the
8 Source: Assopellet (association of Italian pellet producers) and the Pellet@tlas project
(www. www.pelletsatlas.info)

IEA Bioenergy Task 40 ‐ Sustainable International Bioenergy Trade‐ Country Report 2009 Italy Etaflorence Renewable Energies
Pag. 18/ 33
domestic demand, therefore opening a large market for trade. One of the biggest trading partners being Austria and Germany exporting over 200.000 tons per year of pellet to Italy. The rapid growth of the pellet market encouraged several producers to start new pellet plants in East Europe, were feedstock is abundant and sometimes much cheaper than in Italy, nevertheless the flow of imports is difficult to quantify as the number of channels through which the pellets are distributed is highly diversified and difficult to monitor. The Italian Association Assopellet, recently published bigger numbers compared to ours and the peak of 1 Milion tons of pellet was declared. In our opinion this figure is a bit overestimated and it considered also the industrial pellet. We prefer to focus on high quality pellets as the Italian market is formed from residential users.
Figure 4: Pellet Production and capacity Source : Pellet@tlas
Sawdust and saw mil residues are the main raw materials used for pellet production (over 80% of the total volume), whereas woodchips represent only 6%. A strong competition exists with other sectors such as that of pulp and paper and that of panels for furniture manufacturing. Discontinuous availability of raw materials seems to be one of the problems that are limiting the full productivity of the Italian pellet industry. The number of pellet stoves installed in Italy is around 750.000 units, 70% of which are located in the North. Over 50% of them are used as a primary heating system. The peak demand of pellet stoves took place in 2006 (over 260.000 units sold), whereas 2007 showed a decrease of the demand of nearly 50%. No official figures are reported concerning the number of pellet boilers installed, but some estimations report it in the range of several thousand units and confirm a sharp increase of the demand in 2007‐2008. The pellet market is facing some critical challenges, mainly related to its relative immaturity and thinness, that lead to great uncertainties and instability of prices and supplies. During the winter of 2005/2006 the increased sale of pellet stoves (+1440%) lead to supply shortages and to a sharp growth of pellet prices (+54%). This variability caused a loss of consumer’s confidence.

IEA Bioenergy Task 40 ‐ Sustainable International Bioenergy Trade‐ Country Report 2009 Italy Etaflorence Renewable Energies
Pag. 19/ 33
Figure 5: Pellet consumption 2006‐2008. Source Pellet@atlas
The following figure express the pellets prices at wholesale level. The average price of pellet in 2008 are 160 to 210 €/t wholesale and 260 to 310 €/t retail, (Fig. 6)
Figure 6 : Average pellet prices. Source Assopellet

IEA Bioenergy Task 40 ‐ Sustainable International Bioenergy Trade‐ Country Report 2009 Italy Etaflorence Renewable Energies
Pag. 20/ 33
6. PRODUCTION CONSUMPTION AND TRADE OF BIODIESEL
According to Assocostieri (the association that groups biodiesel producers) in 2007 the total production of biodiesel in Italy was 469.707t but only 202.035t of them were distributed into the national market. In 2008, 658.370t were produced and 468.197t were distributed. The production capacity of the Italian biodiesel industry still seems underexploited for it was estimated at 1.050.000 t in 2007 and over 2.257.194 t in 2009. Biodiesel is used primarily in blends with traditional diesel for transports (158.000 t in 2007) or with diesel for heating (44.000 t in 2007). Despite the existing obligations biodiesel covers a share of only 0,53% of the consumption of transports fuels (Diesel 26.118.000 t and Gasoline 11.886 .000 t). The 2007 turnover of the biodiesel industry was estimated at 559M€, whereas in 2008 it was over 1.215 M€.
Figure 7: Biodiesel production and consumption (kT)in Italy ( 2002‐2007).
Source : EurObserv’ER
Most of the biodiesel produced in Italy today derives from imported feedstock, the main of which is rapeseed oil (about 70 percent of the total) and soybean oil (20 percent), whereas the primary feedstock of national origin is sunflower, followed by rapeseed and soybean. Rapeseed oil is imported from other EU countries, while soybean oil is either imported from the EU or produced from imported grains. Italian biodiesel operators can be divided in two categories: biodiesel producers and oilseed crushers, the latter producing pure vegetal oil for the biofuel as well as the agro‐food industry (some crushers are biodiesel producers as well).

IEA Bioenergy Task 40 ‐ Sustainable International Bioenergy Trade‐ Country Report 2009 Italy Etaflorence Renewable Energies
Pag. 21/ 33
Company Location prod.capacity
ALCHEMIA ITALIA SRL ROVIGO 50.000
BIO‐VE‐OIL OLIMPO SRL CORATO (BA) 100.000
CAFFARO BIOFUEL SRL TORVISCOSA (UD) 60.000
CAFFARO BIOFUEL SRL TORVISCOSA (UD) 100.000
CEREAL DOCKS SRL VICENZA 150.000
COMLUBE SRL CASTENEDOLO(BS) 120.000
DP LUBRIFICANTI SRL APRILIA(LT) 155.520
ECOIL SRL PRIOLO(SR) 200.000
FOREDBIO SPA NOLA MARIGLIANO(NA) 70.000
FOX PETROLI SPA VASTO(CH) 131.370
ITAL BI OIL SRL MONOPOLI(BA) 120.000
ITAL GREEN OIL SAN PIETRO DI MARUBIO(VR) 360.000
GDR BIOCARBURANTI CERNUSCO SUL NAVIGLIO(MI) 50.000
MYTHEN SPA FERRANDINA(MT) 200.000
NOVAOL SRL LIVORNO 250.000
NOVAOL SRL RAVENNA 200.000
OIL.B SRL SOLBIATE OLONA(VA) 200.000
OXEM MEZZANA BIGLI(PV) 200.000
Table 13: Italian Biodiesel Plants and map – Source Assocostieri
Table 13 lists the Italian biodiesel plants and their production capacity, whereas table 13 reports the main oilseed crushing companies.
Company Feedstock
Bunge Italia Sunflower, Rapeseed, Soybean
Casa Olearia Italiana Sunflower, Soybean
Cereal Docks Soybean
Italcol Sunflower
Oleificio Medio Piave Sunflower, Soybean
Paoil Sunflower
Table 14: Italian oilseed crushing companies – Source assocostieri
In addition to the import of oil feedstock, in 2008 significant trade flows of biodiesel were registered, especially with other EU countries. Table 15 summarizes the trade exchanges of biodiesel in the period January‐October 2008. As shown in figure 9, import flows are quite diversified and particularly relevant with USA, Netherland, Germany and France, whereas export flows are primarily addressed towards France and in much smaller amounts towards Austria and Spain.

IEA Bioenergy Task 40 ‐ Sustainable International Bioenergy Trade‐ Country Report 2009 Italy Etaflorence Renewable Energies
Pag. 22/ 33
In other words, Italy imports from other EU countries large volumes of rapeseed and soybean oil, which are processed into biodiesel and frequently re‐exported within the EU, sometimes to the same countries from where the raw material came.
Imports (t) Exports (t)
Austria 390 Austria 8329
Belgium 226 Belgium 273
France 11576 France 79921
Germany 10681 Germany 774
Greece 12468 Greece 2047
Netherlands 25915 Slovenia 572
EU 61321 Spain 10958
U.S.A. 39653 EU 102905
Argentina 4984 Turkey 104
Indonesia 6959 Other Countries 149
Total 112917 Total 103158
Table 15: Biodiesel trade (Jan‐Oct 2008) Source: F.O. Licht 2008 World Ethanol and Biofuels Report
Figure 8: Major biodiesel trade partner countries
IEA Bioenergy Task 40 ‐ Sustainable International Bioenergy Trade‐ Country Report 2009 Italy Etaflorence Renewable Energies
Pag. 23/ 33
7. PRODUCTION CONSUMPTION AND TRADE OF BIOETHANOL
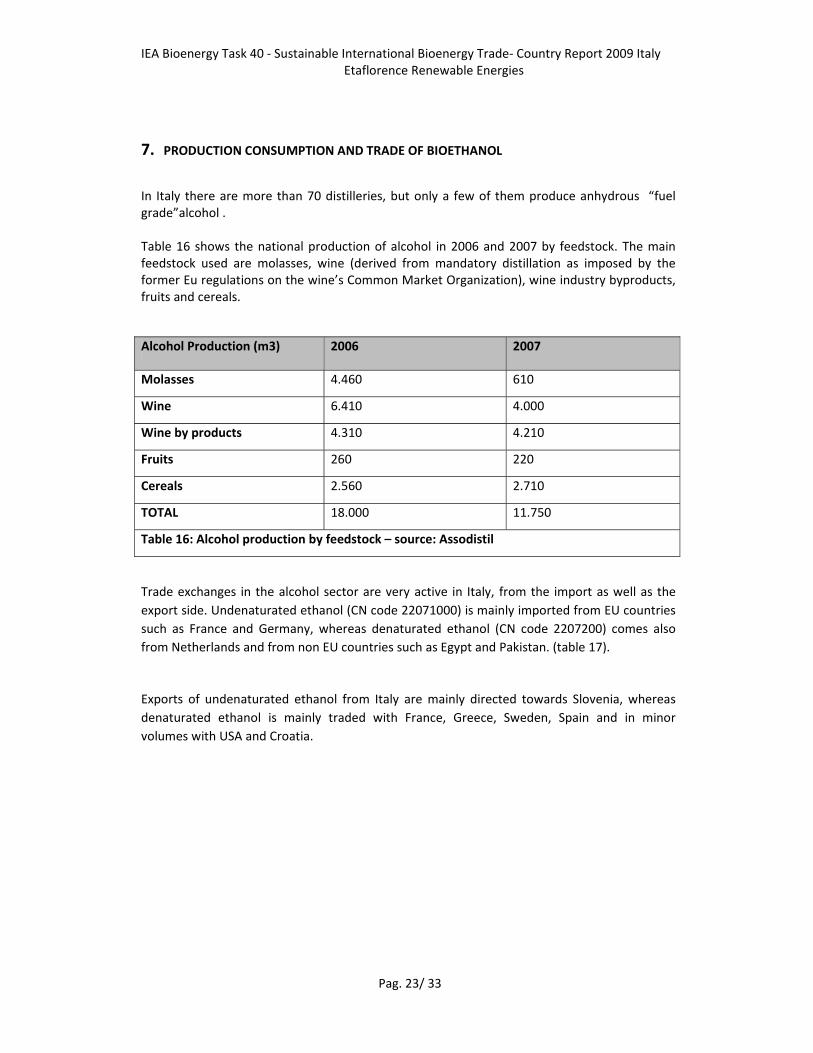
In Italy there are more than 70 distilleries, but only a few of them produce anhydrous “fuel grade”alcohol . Table 16 shows the national production of alcohol in 2006 and 2007 by feedstock. The main feedstock used are molasses, wine (derived from mandatory distillation as imposed by the former Eu regulations on the wine’s Common Market Organization), wine industry byproducts, fruits and cereals.
Alcohol Production (m3) 2006 2007
Molasses 4.460 610
Wine 6.410 4.000
Wine by products 4.310 4.210
Fruits 260 220
Cereals 2.560 2.710
TOTAL 18.000 11.750
Table 16: Alcohol production by feedstock – source: Assodistil
Trade exchanges in the alcohol sector are very active in Italy, from the import as well as the
export side. Undenaturated ethanol (CN code 22071000) is mainly imported from EU countries
such as France and Germany, whereas denaturated ethanol (CN code 2207200) comes also
from Netherlands and from non EU countries such as Egypt and Pakistan. (table 17).
Exports of undenaturated ethanol from Italy are mainly directed towards Slovenia, whereas
denaturated ethanol is mainly traded with France, Greece, Sweden, Spain and in minor
volumes with USA and Croatia.

IEA Bioenergy Task 40 ‐ Sustainable International Bioenergy Trade‐ Country Report 2009 Italy Etaflorence Renewable Energies
Pag. 24/ 33
Imports January‐December 2007 January‐October 2008
Ethyl Alcohol 1414953 204605
Ethyl Alcohol (a) 53838 7722
Belgium 6773 2144
France 31207 3029
Germany 15779 2488
Netherlands 32 51
U.K. 26 0
EU 53832 7721
Pakistan 0 0
Other Countries 6 1
Ethyl Alcohol (b) 1361115 147810
Austria 9349 27
Belgium 10053 8956
Bulgaria 10202 209
France 526118 40658
Germany 64541 4370
Greece 0 0
Hungary 9345 209
Netherlands 79081 15710
Spain 386 150
U.K. 3195 2862
EU 712270 73152
Croatia 74061 1404
Serbia 51862 133
Switzerland 136 3
Turkey 52261 0
Ukraine 104 14
Egypt 294402 26783
Ethiopia 41658 1610
Swaziland 5629 0
Guatemala 9893 14639
U.S.A. 822 17
Argentina 6403 349
Bolivia 0 20913
Brazil 1229 112
Colombia 294 0
Iran 0 0
Pakistan 104765 8682
Other Countries 5326 0
Ethanol in blends 0 49071
France 0 43638

IEA Bioenergy Task 40 ‐ Sustainable International Bioenergy Trade‐ Country Report 2009 Italy Etaflorence Renewable Energies
Pag. 25/ 33
Exports January‐December 2007 January‐October 2008
Ethyl Alcohol 641666 99872
Ethyl Alcohol (a) 11360 1474
France 12 0
Greece 575 0
Hungary 1375 213
Slovenia 7932 1119
EU 9998 1337
Croatia 1343 135
Other Countries 19 2
Ethyl Alcohol (b) 630306 98398
Austria 9512 3097
Belgium 36 6917
Cyprus 475 0
Czech Rep 5595 1759
Finland 0 0
France 170154 21054
Germany 9642 2762
Greece 31813 5177
Hungary 6487 1778
Ireland 51 0
Netherlands 377 65
Poland 0 0
Romania 0 3455
Germany 0 100
Malta 0 1548
Netherlands 0 3785
EU 0 0
Other Countries 0 0
(a) Denaturated, all strenghts (b) Undenaturated, at least 80 degrees strenght Source: F.O.Lichts 2008 Table 17: Italy : ethyl alcohol trade – imports (cubic meters) SOURCE: F.O.Lichts 2008

IEA Bioenergy Task 40 ‐ Sustainable International Bioenergy Trade‐ Country Report 2009 Italy Etaflorence Renewable Energies
Pag. 26/ 33
Slovakia 0 139
Slovenia 8711 657
Spain 25137 4381
Sweden 350686 46150
U.K. 217 25
EU 618905 97419
Albania 490 15
Bosnia 5 0
Croatia 1106 96
Macedonia 0 0
Moldova 232 26
Serbia 0 0
Switzerland 252 120
Turkey 24 0
Vatican City 1384 105
Ivory Coast 0 13
Senegal 673 77
Canada 927 75
Mexico 0 0
Cuba 16
U.S.A. 5545 334
Israel 11 0
Malaysia 323 64
Australia 0 0
Other Countries 429 38
(a) Denaturated, all strenghts (b) Undenaturated, at least 80 degrees strenght Source: F.O.Lichts 2008 Table 18: Italy : ethyl alcohol trade – exports (cubic meters)

IEA Bioenergy Task 40 ‐ Sustainable International Bioenergy Trade‐ Country Report 2009 Italy Etaflorence Renewable Energies
Pag. 27/ 33
It is important to remark that the main markets for the ethanol produced and traded in Italy are that of food and beverages (28%) and distillates (18%). Industrial usage is another important market, around 28%, 10% of which is represented by cleansing products. Cosmetic products represent around 5% of the market. Finally, around 21% of the ethanol market is represented by the mandatory distillation for “public intervention” introduced by Reg. EC 1623/2000 on the application of the Common Market Organization for wine (data referred to 2004). In 2005, bioethanol for transport represented only 5% of the market and was distributed uniquely as an additive (ETBE) but not as substitution fuel in gasoline blends. Due to the bureaucratic and normative gaps mentioned in chap. 3, in 2006 and 2007 not a single litre of bioethanol was used as transport fuel, and according to Assodistil in 2007 the production of fuel grade ethanol was entirely exported to Sweden (60.000.000 liters). Nevertheless a limited import of ethanol in blends, probably used for distribution as transport fuel, has been observed in 2008 from France, Netherlands and Malta (tab. 18). At present only three plants are capable of producing fuel grade ethanol These are Alcolplus, IMA and Silcompa (table 19).
Company
Production Capacity (hl/y anhydrous ethanol)
Alcolplus (Caviro Group) 800.000
IMA (Bertolino Group) 2.000.000
SILCOMPA 600.000
Table 19: Italian producers of anhydrous ethanol – Source: Assodistil
In 2008 “Mossi e Ghisolfi” Group, one of the world’s largest PET producers announced its engagement in the development of the first 2nd generation bioethanol pilot plant in Tortona (Northern Italy) with an initial capacity of 20.000 t/y, that should be ready in 2010. The primary feedstock supplied to this plant should be lignocellulosic biomass from energy crops (Arundo donax and other herbaceous crops). In 2005 Italiazuccheri, one the 4 Italian sugar companies announced its intention to reconvert one sugar plant in Porto Viro (North‐East Italy) into a bioethanol plant. The sugar plant was closed in 2006 as a consequence of the application of the European reform of the sugar sector and subsequent reduction of production quota for Italy9. The plant in Porto Viro should have a nominal capacity of 160.000 t/y of ethanol and 170.000 t/y of distiller’s dried grains and should use cereals as the primary feedstock. This would require the cultivation of around 55.000 Ha of land for the production of cereals (corn and grain sorghum), however this project is still under discussion and debates are ongoing mostly with regard to the critics over the relatively low
9 Reg. CE 318/2006. As a consequence of the restructuring of the sugar sector, in Italy 16 out of 19 sugar plants were closed in 2005‐2006. Many of them should be reconverted with the implementation of various bioenergy projects.

IEA Bioenergy Task 40 ‐ Sustainable International Bioenergy Trade‐ Country Report 2009 Italy Etaflorence Renewable Energies
Pag. 28/ 33
energy balance of corn based ethanol and its actual economic competitiveness at the current price of cereals. Without the full introduction of reduced excise duty bioethanol blends are absolutely uncompetitive with traditional fossil fuels. In June 2008 the first E85 bioethanol filling station started operations in La Spezia, as one of the demonstration projects implemented in the framework of the international BEST project (Bioethanol for Sustainable Transports)10 The bioethanol pump is accessible to the public but supplies E85 blends to flexi fuel engines at a price of 1,77 €/l, a much higher price than that of standard gasoline, for a series of bureaucratic obstacles denied the reduced excise duty to the lot of E85 used at that pump. A big issue is that currently ethanol as a fuel for transport is taxed as the corresponding fossil fuel and the taxation is calculated per liter, not taking into account the lower calorific value of ethanol, with the result of a higher taxation for ethanol per kilometer driven. With regard to incentive measures, at present only a production quota of 1 million hectoliters per year of ethanol is eligible for excise duty reductions and it is going to be used mainly for ETBE production. This represents only a very small fraction of the volume of bioethanol that should be blended in order to achieve the targets set by the European Directive 2003/30, as shown in figure 9.
Figure 9: Bioethanol quota from obligation and quota subject to reduced excise duty Source Assodistil
10 www.best‐europe.org

IEA Bioenergy Task 40 ‐ Sustainable International Bioenergy Trade‐ Country Report 2009 Italy Etaflorence Renewable Energies
Pag. 29/ 33
8. BARRIERS AND OPPORTUNITIES FOR INTERNATIONAL BIOENERGY TRADE
As shown in the previous chapters, in the last three years one of the biggest barriers to the development of bioenergy and biofuel production in Italy has been the lack of a stable and clear regulatory framework, especially with regard to the production of bioethanol and biodiesel. The uncertainty over the actual application of support measures for green electricity and reduced duties for biofuels for transports, together with the economic and financial crisis of 2008‐2009, have limited the investment in the bioenergy sector, nevertheless, the attention and the interest in this field are growing fast among potential investors.The recent adoption of a new and clear feed‐in incentive scheme for bioelectricity that was expected for over 2 years, will probably stimulate the further implementation of many planned projects that have been kept in the pipeline. A remarkable number of bioenergy projects should be implemented in the framework of the reconversion of many former sugar plants, after their closure as a consequence of the European reform of the sugar industry in 2005. Most of these projects rely on the construction of power plants either running on solid biomass or on bioliquids (table 20). Although most of the feedstock is expected to be supplied by local farmers and many of the reconversion projects have already signed a “supply chain agreement” with agricultural counterparts, it is foreseeable that part of this feedstock will also come from trade, particularly in the case of bioliquids. Italy already imports significant volumes of palm oil (tab. 20) and oil seeds; though most of these volumes are not used for power generation but for other traditional uses especially in the food industry. The largest import flows are established with Indonesia and Malaysia, whereas minor quantities are imported from Netherlands and Germany. The implementation of these bioenergy projects may represent a significant opportunity for the trade of vegetal oils and oilseeds. Nevertheless, the introduction of sustainability criteria for biofuels contained in the recent EC directive for the promotion of renewable energy will probably drive the attention of bioenergy producers increasingly towards other oil feedstock. As a matter of fact, since two years ago some large energy producers are financing some ambitious development projects of Jatropha plantations in several African countries, in an attempt to supply large quantities of jatropha oil to their power plants in Italy. With regard to pellet production, there is a large and growing market of pellet stoves for domestic heating will probably continue to drive the demand for pellets in Italy in the forthcoming years. During the last three years, discontinuous and fragmented supplies of feedstock for pellet production and large variations in the consumer’s price have been an obstacle to the steady development of the pellet industry, as demonstrated by the national production that still remains well below the production capacity of the industry itself. The recent discovery of radioactive contaminated pellets coming form Lithuania has reinforced the awareness among operators over the need for a stronger standardization of quality norms . The adoption of quality norms (as those contained in the UNI/TS 11263:2007 norm based on CEN/TS 14961)) and the development of a certification system (as that introduced by the
IEA Bioenergy Task 40 ‐ Sustainable International Bioenergy Trade‐ Country Report 2009 Italy Etaflorence Renewable Energies
Pag. 30/ 33
“Pellet Gold” label11) may create a more favorable environment for pellet trade, that will continue to represent an important resource for producers. As far as biofuels for transports are concerned the scenario still remains quite unclear. The adoption of the Directive for the promotion of renewable energy which set a target of 10% RE in transport, certainly represents an opportunity for the development of biofuels in Italy as well as other member states, nevertheless, the effectiveness of the national support policies of achieving these targets still remain insufficient. As the directive requires member states to prepare National Renewable Energy Action Plans by July 2010, an update and improvement of support measures for biofuel will be hopefully included in that tool.
11 www.pelletgold.net

IEA Bioenergy Task 40 ‐ Sustainable International Bioenergy Trade‐ Country Report 2009 Italy Etaflorence Renewable Energies
Pag. 31/ 33
Table 20 Trade of Palm oil in Italy (2007)* Source Eurostat
COMPANY LOCATION PROJECT
POWERCROP Castiglion Fiorentino
Solid biomass (7 MWe) and vegetable oil (11 MWe) CHP plant. Feedstock from poplar short rotation plantations, forestry residues and oil crops (sunflower)
POWERCROP Celano Biomass CHP power plant (30 MW). Feedstock: forest residues (50%) and short rotation plantations (50%).
POWERCROP Fermo 24,4 MWe vegetal oil power plant; plus biogas plant (2 MWe)
POWERCROP Russi Integrated plant with biomass, biogas and photovoltaic (30 MWe), sunflower seed oil extraction plant.
POWERCROP Villasor 50 MWe combined plant with biomass, biogas (2,4 MWe) and biodiesel production
CO.PRO.B../Italia Zuccheri
Bondeno Vegetal oil power plant (24,4 MWe)
CO.PRO.B../Italia Zuccheri
Finale Emilia 12,5 MWe power plant with solid biomass from energy crops and forestry
CO.PRO.B../Italia Zuccheri
Contarina ‐ Porto Viro
Bioethanol plant 160.000 t/y anhydrous bioethanol and 170.000 t/y DDGs
CO.PRO.B../Italia Zuccheri
Casei Gerola Biomass plant. Possible feedstock fiber sorghum 3.000 ha
Table 21: Planned bioenergy projects related to the reconversion of the sugar industry Source:
Italian Ministry of Agriculture and Forestry
Import Quantity (Kg) Value (€)
Germany 1.308 111.085
Hungary 16 1.040
Indonesia 654.323 24.769.096
Malaysia 5.160 209.205
Netherlands 4.788 355.952
Export Quantity (Kg) Value(€)
France 9 1.063
Greece 279 20.786
Malta 1 115
Romania 3 600
United States 3 36.435
Table 20: Trade of Palm oil in Italy (2007)* Source Eurostat * CN code 15111010 ‐ crude palm oil, for technical or industrial uses (excl. for manufacture of foodstuffs). –source Eurostat

Page 32 of 33
9. REFERENCES D.Pettenella, Ciccarese L., 2009 ‐ “Disponibilità di Biomasse Legnose in Italia e Politiche di
Valorizzazione e Sviluppo”. Sherwood n. 154. www.rivistasherwood.it.
Caserini S. et al., 2006 ‐ “Stima Dei Consumi Di Legna Da Ardere Per Riscaldamento Ed Uso Domestico In Italia”. Agenzia Nazionale per la protezione dell’Ambiente e per i Servizi Tecnici (APAT) Pignatelli V, 2006 ‐ “Le tecnologie per i biocombustibili e i biocarburanti: opportunità e prospettive
per l’Italia”. www.enea.it
Antonini E., Francescato V., 2007 ‐ “Biocombustibili produzione ed uso energetico in agricoltura”,
Aiel –Associazione Italiana Energia dal Legno. www.aiel.it
GSE (Gestore Servizi Elettrici) 2008 – “Statistiche sulle fonti rinnovabili in Italia”.available at
www.gse.it
Castelli S. et al. 2009 – “Olio vegetale e biodiesel opportunità per l’agricoltore”. Informatore
Agrario 27/2009 page 30.
WEB REFERENCES AND USEFUL LINKS
www.cia.gov/library/publications/the‐world‐factbook/geos/IT.html
www.minambiente.it/
www.iea.org
www.sviluppoeconomico.gov.it/
www.gse.it
www.terna.it
www.enea.it
www.istat.it
www.pelletsatlas.info/cms/site.aspx?p=9138
www.itabia.it
www.aper.it
Page 33 of 33
www.fiper.it
www.fas.usda.it
www.assocostieri.it
www.staffettaonline.com
www.assodistil.it
www.energies‐renouvalables.org
www.gsel.it
www.assoelettrica.it
www.uepa.be
www.ebio.org
www.crpa.it
www.assopellet.it
www.aiel.it
www.eea.com
www.eubia.org
www.infc.it
www.mercatoelettrico.org
http://ec.europa.eu/energy/energy_policy/facts_en.htm
www.imaa.cnr.it/
www.biofuels‐platform.ch/en/home
www.worldenergyoutlook.org