children without - unicef.org · children without a study of urban child poverty and deprivation in...
TRANSCRIPT
ChildrenWithoutA study of urban child poverty and
deprivation in low-cost flatsin Kuala Lumpur
Published by the United Nations Childrens' Fund, Malaysia.© UNICEF Malaysia 2018. All rights reserved.First published in February 2018.
ISBN 978-967-12284-7-0
United Nations Childrens' FundMenara PJHLevel 10, No. 2Jalan Tun Abdul RazakPrecinct 2, 62100Putrajaya, Malaysia
www.unicef.org/malaysia
Any part of this publication may be quoted, copied, or translated by indicating the source. No part of this publication may be stored for commercial purposes without prior written permission.
The views expressed in this publication are those of the authors and do not necessarily represent those of the United Nations, including UNICEF, the UN Member States or the Government of Malaysia.
Cover photo of 'Baby Brother' by Ika (15 years old).© UNICEF Malaysia/2017/Ika
Children WithoutA study of urban child poverty and
deprivation in low-cost flatsin Kuala Lumpur
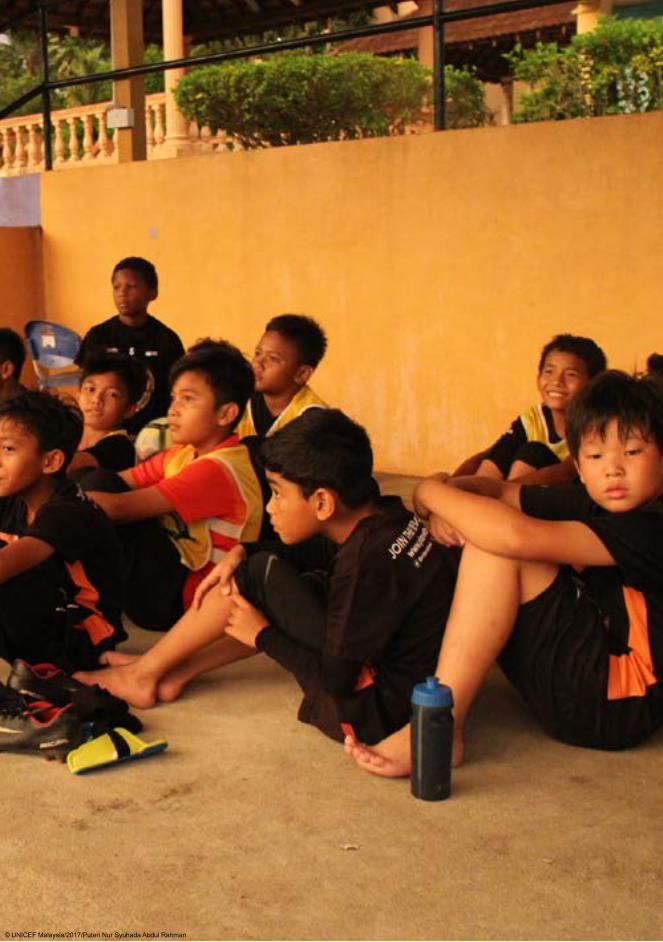
© UNICEF Malaysia/2017/Puteri Nur Syuhada Abdul Rahman
Acknowledgements
We would like to thank the 15 amazing children who participated in the project's photography workshop and provided almost all of the photographs featured in this report: Ika (15 years old), Muhammad Amerol Afiq Mohd Dzon Akhirom (16), Nur Atikah Mohd Shaidi (17), Badrul Amin (16), Kimi (16), Muhammad Haiqal Mohd Hazrari (15), Kisshen Raj R Muthiah (15), Hanisah (16), Erin (16), Nurin Jazlina Mat Ropi (17), Raja Shah Ikhmal Raja Remi (17), Falah Syukran Adenan (17), Muhamad Adam Fitri Azrul Azlam (17), Puteri Nur Syuhada Abdul Rahman (17) and Syahirah (17).
This study benefited tremendously from the expertise and insights of Professor Tan Sri Dr Kamal Salih, Datuk Akbar Ali, Prof Dr Selamah Yusoff, Dr Mohd Ikmal Mohd Said, Dr Shaufique Fahmi Sidique and Dr Ahmad Zaid Fattah Azman. We would like to thank the participants of the roundtable discussion on Urban Child Poverty for their valuable inputs and suggestions, in particular, United Nations Development Programme, Employees Provident Fund, World Bank, Bank Negara Malaysia, Institute of Strategic and International Studies, Ministry of Health, Yayasan Hasanah, the Centre for Poverty and Development Studies Universiti Malaya, Universiti Putra Malaysia, Teach For The Needs, Syed Azmi Al Habshi, Pusat Zakat WP Kuala Lumpur, Ministry of Women, Family and Community Development, Institute of Public Health, Implementation Coordination Unit of the Prime Minister's Department, Ministry of Education and the Economic Planning Unit. The roundtable discussion hosted by UNICEF Malaysia, DM Analytics and ISIS Malaysia was held on 17th January 2018 in Kuala Lumpur.
We would also like to extend our appreciation to the various parties that collaborated with us in this project, in particular Datuk A Kadir Jasin, Zainal Alam Kadir, Haresh Deol, Pearl Lee; Vignesh Balasingam, Ryan Moon, and Mark Joshua Morriss of OBSCURA Festival of Photography; Mereka Makerspace, Yayasan Axiata, Yayasan Khazanah, Chua Choon Hwa from the Ministry of Women, Family, and Community Development, Ilham Gallery and Zaini Zainuddin.
Special thanks to the enumerators led by Dr Mohd Yusof Sa'ari, Umi Zakiah and her team from Universiti Putra Malaysia and our interns: Wan Abdul Rahman, Shazrul Ariff Suhaimi, Mikhail Rosli, Sharifah Sarah Syed Abdul Rahman and Nurliyana Nadhirah Nor Izham.
Our gratitude goes to all our respondents.
This report was written by Dr Muhammed Abdul Khalid, Zouhair Rosli, Siti Nur Fatimahtul Maryam Abdul Halim and Endie Shazlie Akbar. All remaining errors and weaknesses in this report are our responsibility.
UNICEFUrban Child Poverty Report
5
DMAnalytics
UNICEFUrban Child Poverty Report
6
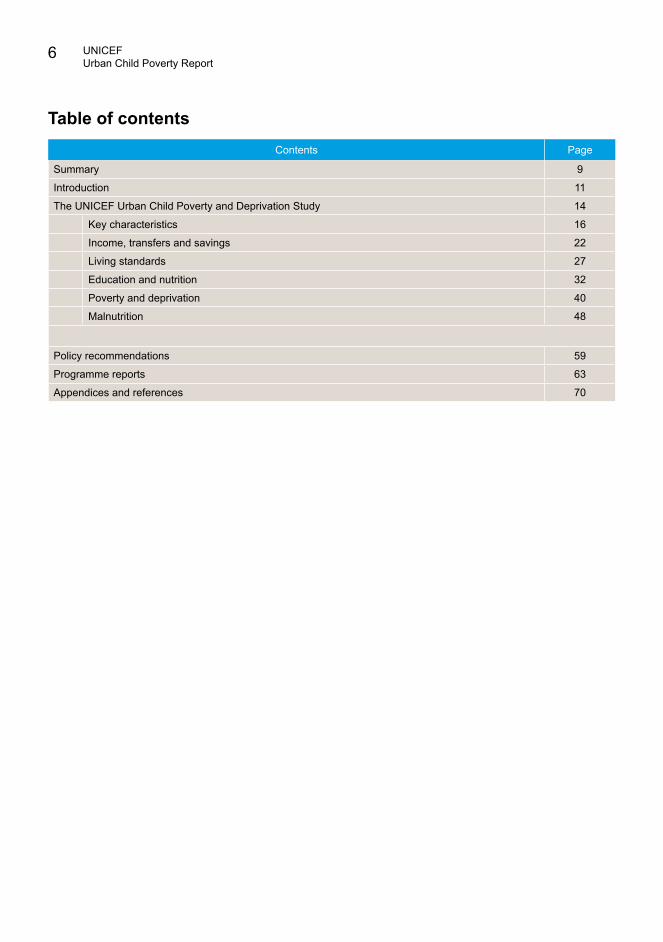
Contents Page
Summary 9
Introduction 11
The UNICEF Urban Child Poverty and Deprivation Study 14
Key characteristics 16
Income, transfers and savings 22
Living standards 27
Education and nutrition 32
Poverty and deprivation 40
Malnutrition 48
Policy recommendations 59
Programme reports 63
Appendices and references 70
Table of contents
UNICEFUrban Child Poverty Report
7
Page
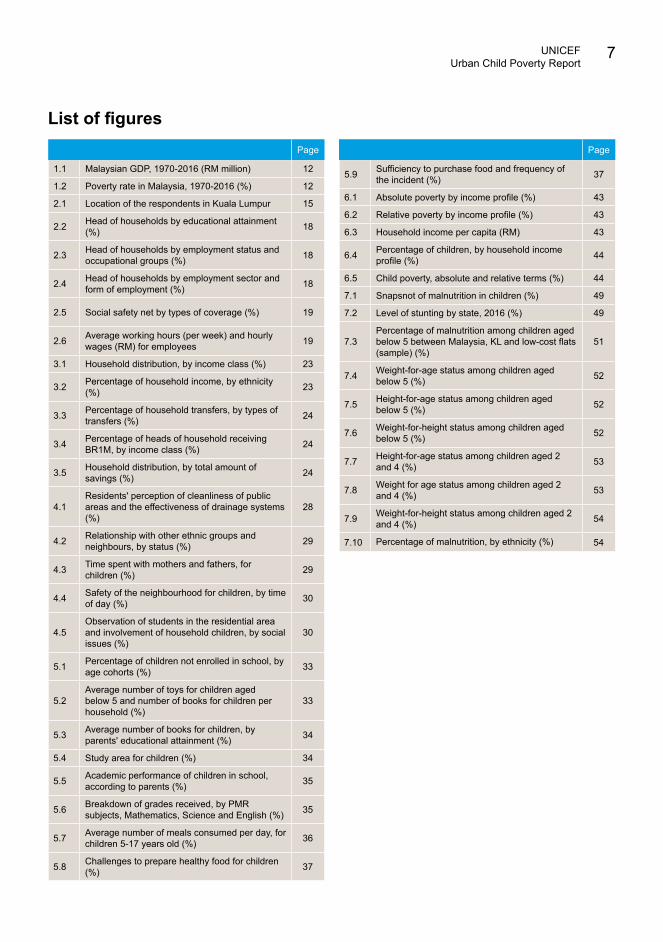
1.1 Malaysian GDP, 1970-2016 (RM million) 12
1.2 Poverty rate in Malaysia, 1970-2016 (%) 12
2.1 Location of the respondents in Kuala Lumpur 15
2.2 Head of households by educational attainment (%) 18
2.3 Head of households by employment status and occupational groups (%) 18
2.4 Head of households by employment sector and form of employment (%) 18
2.5 Social safety net by types of coverage (%) 19
2.6 Average working hours (per week) and hourly wages (RM) for employees 19
3.1 Household distribution, by income class (%) 23
3.2 Percentage of household income, by ethnicity (%) 23
3.3 Percentage of household transfers, by types of transfers (%) 24
3.4 Percentage of heads of household receiving BR1M, by income class (%) 24
3.5 Household distribution, by total amount of savings (%) 24
4.1Residents' perception of cleanliness of public areas and the effectiveness of drainage systems (%)
28
4.2 Relationship with other ethnic groups and neighbours, by status (%) 29
4.3 Time spent with mothers and fathers, for children (%) 29
4.4 Safety of the neighbourhood for children, by time of day (%) 30
4.5Observation of students in the residential area and involvement of household children, by social issues (%)
30
5.1 Percentage of children not enrolled in school, by age cohorts (%) 33
5.2Average number of toys for children aged below 5 and number of books for children per household (%)
33
5.3 Average number of books for children, by parents' educational attainment (%) 34
5.4 Study area for children (%) 34
5.5 Academic performance of children in school, according to parents (%) 35
5.6 Breakdown of grades received, by PMR subjects, Mathematics, Science and English (%) 35
5.7 Average number of meals consumed per day, for children 5-17 years old (%) 36
5.8 Challenges to prepare healthy food for children (%) 37
Page
5.9 Sufficiency to purchase food and frequency of the incident (%) 37
6.1 Absolute poverty by income profile (%) 43
6.2 Relative poverty by income profile (%) 43
6.3 Household income per capita (RM) 43
6.4 Percentage of children, by household income profile (%) 44
6.5 Child poverty, absolute and relative terms (%) 44
7.1 Snapsnot of malnutrition in children (%) 49
7.2 Level of stunting by state, 2016 (%) 49
7.3Percentage of malnutrition among children aged below 5 between Malaysia, KL and low-cost flats (sample) (%)
51
7.4 Weight-for-age status among children aged below 5 (%) 52
7.5 Height-for-age status among children aged below 5 (%) 52
7.6 Weight-for-height status among children aged below 5 (%) 52
7.7 Height-for-age status among children aged 2 and 4 (%) 53
7.8 Weight for age status among children aged 2 and 4 (%) 53
7.9 Weight-for-height status among children aged 2 and 4 (%) 54
7.10 Percentage of malnutrition, by ethnicity (%) 54
List of figures
Page
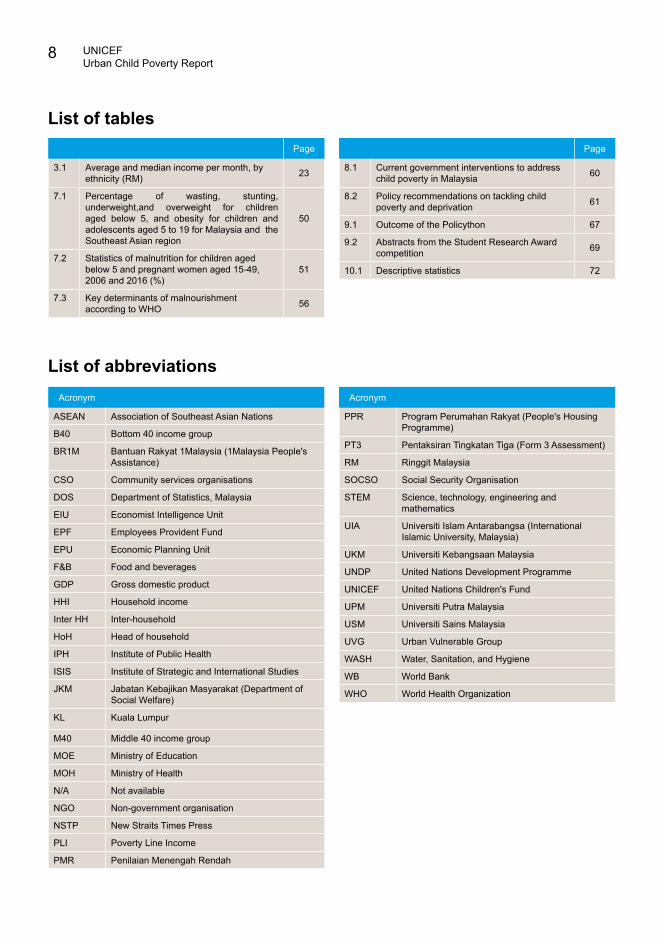
3.1 Average and median income per month, by ethnicity (RM) 23
7.1 Percentage of wasting, stunting, underweight,and overweight for children aged below 5, and obesity for children and adolescents aged 5 to 19 for Malaysia and the Southeast Asian region
50
7.2 Statistics of malnutrition for children aged below 5 and pregnant women aged 15-49, 2006 and 2016 (%)
51
7.3 Key determinants of malnourishment according to WHO 56
Page
8.1 Current government interventions to address child poverty in Malaysia 60
8.2 Policy recommendations on tackling child poverty and deprivation 61
9.1 Outcome of the Policython 67
9.2 Abstracts from the Student Research Award competition 69
10.1 Descriptive statistics 72
UNICEFUrban Child Poverty Report
8
List of tables
List of abbreviationsAcronym
ASEAN Association of Southeast Asian Nations
B40 Bottom 40 income group
BR1M Bantuan Rakyat 1Malaysia (1Malaysia People's Assistance)
CSO Community services organisations
DOS Department of Statistics, Malaysia
EIU Economist Intelligence Unit
EPF Employees Provident Fund
EPU Economic Planning Unit
F&B Food and beverages
GDP Gross domestic product
HHI Household income
Inter HH Inter-household
HoH Head of household
IPH Institute of Public Health
ISIS Institute of Strategic and International Studies
JKM Jabatan Kebajikan Masyarakat (Department of Social Welfare)
KL Kuala Lumpur
M40 Middle 40 income group
MOE Ministry of Education
MOH Ministry of Health
N/A Not available
NGO Non-government organisation
NSTP New Straits Times Press
PLI Poverty Line Income
PMR Penilaian Menengah Rendah
Acronym
PPR Program Perumahan Rakyat (People's Housing Programme)
PT3 Pentaksiran Tingkatan Tiga (Form 3 Assessment)
RM Ringgit Malaysia
SOCSO Social Security Organisation
STEM Science, technology, engineering and mathematics
UIA Universiti Islam Antarabangsa (International Islamic University, Malaysia)
UKM Universiti Kebangsaan Malaysia
UNDP United Nations Development Programme
UNICEF United Nations Children's Fund
UPM Universiti Putra Malaysia
USM Universiti Sains Malaysia
UVG Urban Vulnerable Group
WASH Water, Sanitation, and Hygiene
WB World Bank
WHO World Health Organization
UNICEFUrban Child Poverty Report
9
While Malaysia has done remarkably well in uplifting the standard of living of its citizens, there are emerging areas of concern that require urgent attention, particularly on the wellbeing of the children. The country is facing simultaneous crises of over- and under-nutrition, with some children suffering from undernourishment while their peers are obese or overweight. In fact, while the prevalence of stunting globally has been on the decline, it is rising in Malaysia, even when compared to other countries that have comparable levels of income per capita. Children in Malaysia are also among the most overweight and obese in the region. This study, based on the sample of urban poor in low-cost flats in Kuala Lumpur revealed some findings on multi-dimensional child poverty. In particular, it highlights the impact on malnourishment that needs to be addressed. This study presage an emerging national crisis that has medium and long-term implications for the future well-being and productivity of the economy, as we approach developed status in 2020 and beyond.
While the national poverty rate is less than one percent, and almost eradicated in Kuala Lumpur, these indicators unfortunately mask the rich information content of empirical case studies based on the reality of the situation on the ground. While Kuala Lumpur has an income per capita equal to developed countries, the children residing in its low-cost flats are not doing well. The study finds that about 22 per cent of children below the age of five are stunted, 15 per cent are underweight and 23 per cent are either overweight or obese. They have no conducive place to study and their surrounding environment is unsafe. While almost all children aged 7 to 17 are in school, only 1 in 2 of those aged 5 and 6 are in preschool. Adjusted for household size, the relative poverty rate of these children is almost 100 per cent.
It is hoped that the findings of the study will shed light on living conditions of children in urban cities that otherwise live in a data 'blind spot'. The findings should contribute to focused policy interventions to ensure children in poor urban settings are included in wider urban opportunities. The analysis of factors that contribute to malnutrition among children aged below five highlights the importance of nutritional and preschool education. The elevated proportion of anaemia among pregnant women also suggests the need for some form of nutritional intervention in urban households as this will affect their children at birth.
Moving forward, one of the optimal ways in ensuring that every child in Malaysia has an equal head start is by providing a social protection floor for all. In recent years, social protection has emerged as a major new focus in efforts to reduce poverty around the world. Through income support and programmes designed to increase access to services (such as health, education and nutrition), social protection helps realise the human rights of children and families. Social protection strategies are also a crucial element of effective policy responses to adverse economic conditions, addressing not only vulnerabilities caused by current conditions but also strengthens preparedness to future uncertainty. Child- sensitive social protection systems mitigate the effects of poverty on families, strengthen families in their child care role, and enhance access to basic services for the poorest and most marginalised. Since many at-risk children also live outside family care, child-sensitive social protection systems must be responsive to this vulnerable group, as well as to children facing abuse or discrimination at home.
Possible recommendations to address the issues of urban child poverty arising from this study and to achieve better targeting and impact, include:
1) Providing a universal child care allowance.
2) Ensuring proper exclusive breastfeeding for mothers for at least six months.
3) Implementing taxes on sugar-sweetened beverages (SSB).
4) Providing safe social spaces for school-aged children.
5) Revisiting poverty indicators, namely the Poverty Line Income (PLI) and using multidimensional indicators that include the nutritional status of children and relative income poverty.
Hopefully, the findings of this study can spark a wider national debate and galvanise policy changes on this important issue. It is a clarion call for all stakeholders to accelerate efforts to protect our children, who are the most vulnerable members of the community. The study is a stark reminder that the clock is ticking, and the wellbeing of the children needs to be urgently addressed.
Summary
© U
NIC
EF M
alay
sia/
2017
/ Nur
in J
azlin
a M
at R
opi
Introduction
IntroductionThe Study
Income, Transfers and SavingsLiving Standards
Education and NutritionPoverty and Deprivation
MalnutritionPolicy Recommendations
Programme ReportsAppendices and References
1 DOS (2017).
Orang Asli inPeninsularMalaysia live in poverty3.
© UNICEF Malaysia © UNICEF Malaysia/2014/Pirozzi © UNICEF Malaysia
0
300000
600000
900000
1200000
1500000
20162014
20122010
20082006
20042002
20001998
19961994
19921990
19881986
19841982
19801978
19761974
19721970
0
10
20
30
40
50
20162014
20122009
20072004
20021999
19971995
19921989
19871984
19791976
1970
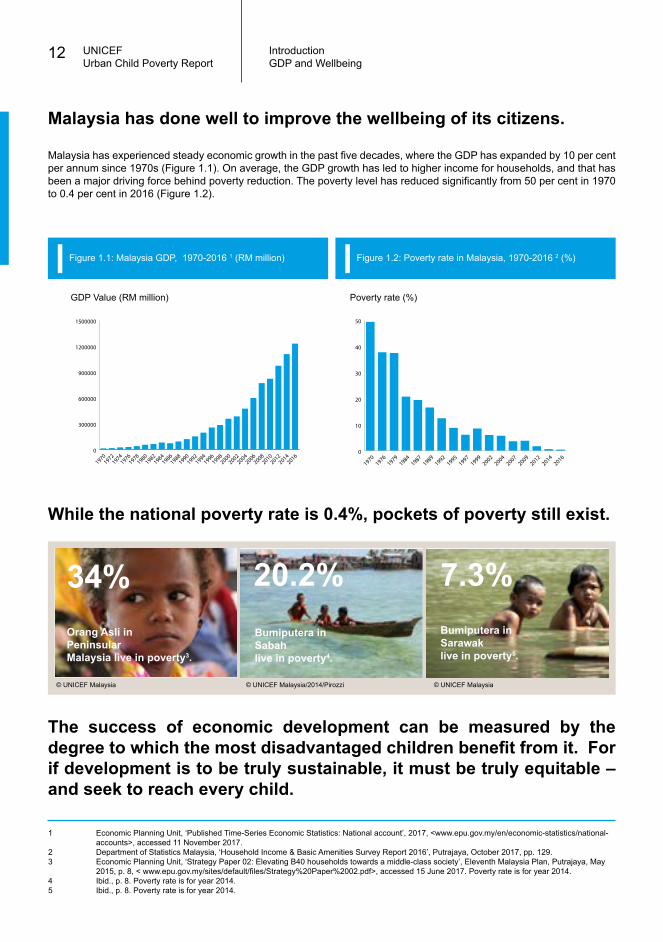
Figure 1.2: Poverty rate in Malaysia, 1970-2016 2 (%)Figure 1.1: Malaysia GDP, 1970-2016 1 (RM million)
GDP Value (RM million) Poverty rate (%)
34% 20.2% 7.3%Bumiputera inSabahlive in poverty4.
Bumiputera inSarawaklive in poverty5.
UNICEFUrban Child Poverty Report
12 Introduction
Malaysia has experienced steady economic growth in the past five decades, where the GDP has expanded by 10 per cent per annum since 1970s (Figure 1.1). On average, the GDP growth has led to higher income for households, and that has been a major driving force behind poverty reduction. The poverty level has reduced significantly from 50 per cent in 1970 to 0.4 per cent in 2016 (Figure 1.2).
GDP and Wellbeing
Malaysia has done well to improve the wellbeing of its citizens.
The success of economic development can be measured by the degree to which the most disadvantaged children benefit from it. For if development is to be truly sustainable, it must be truly equitable – and seek to reach every child.
While the national poverty rate is 0.4%, pockets of poverty still exist.
1 Economic Planning Unit, ‘Published Time-Series Economic Statistics: National account’, 2017, <www.epu.gov.my/en/economic-statistics/national- accounts>, accessed 11 November 2017.2 Department of Statistics Malaysia, ‘Household Income & Basic Amenities Survey Report 2016’, Putrajaya, October 2017, pp. 129.3 Economic Planning Unit, ‘Strategy Paper 02: Elevating B40 households towards a middle-class society’, Eleventh Malaysia Plan, Putrajaya, May 2015, p. 8, < www.epu.gov.my/sites/default/files/Strategy%20Paper%2002.pdf>, accessed 15 June 2017. Poverty rate is for year 2014.4 Ibid., p. 8. Poverty rate is for year 2014.5 Ibid., p. 8. Poverty rate is for year 2014.
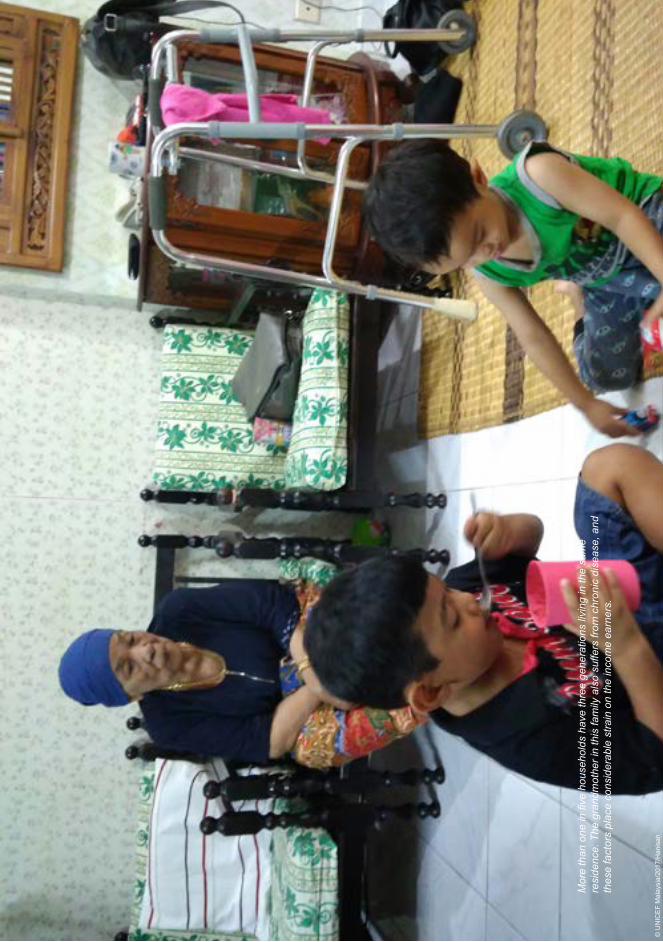
Mor
e th
an o
ne in
five
hou
seho
lds
have
thre
e ge
nera
tions
livi
ng in
the
sam
e re
side
nce.
The
gra
ndm
othe
r in
this
fam
ily a
lso
suffe
rs fr
om c
hron
ic d
isea
se, a
nd
thes
e fa
ctor
s pl
ace
cons
ider
able
stra
in o
n th
e in
com
e ea
rner
s.
© U
NIC
EF M
alay
sia/
2017
/Han
isah
The UNICEF Urban Child Poverty and Deprivation Study
IntroductionThe Study
Income, Transfers and SavingsLiving Standards
Education and NutritionPoverty and Deprivation
MalnutritionPolicy Recommendations
Programme ReportsAppendices and References
0 5(km)
0 3(mi)
PPR Pantai
PPR Kg Muhibbah
PPR Seri Alam
PPR Seri Semarak
PPR Kg Baru Air Panas
PPR Seri Kota
PPR Desa Tun Razak
PPR Taman Wahyu
PPR Beringin
PPR Batu Muda
PPR Intan Baiduri
PA Setapak Jaya
PPR Desa Rejang
PPR Desa Mentari
Flat Sri Johor
PPR Seri Sabah
PPR Pantai Ria
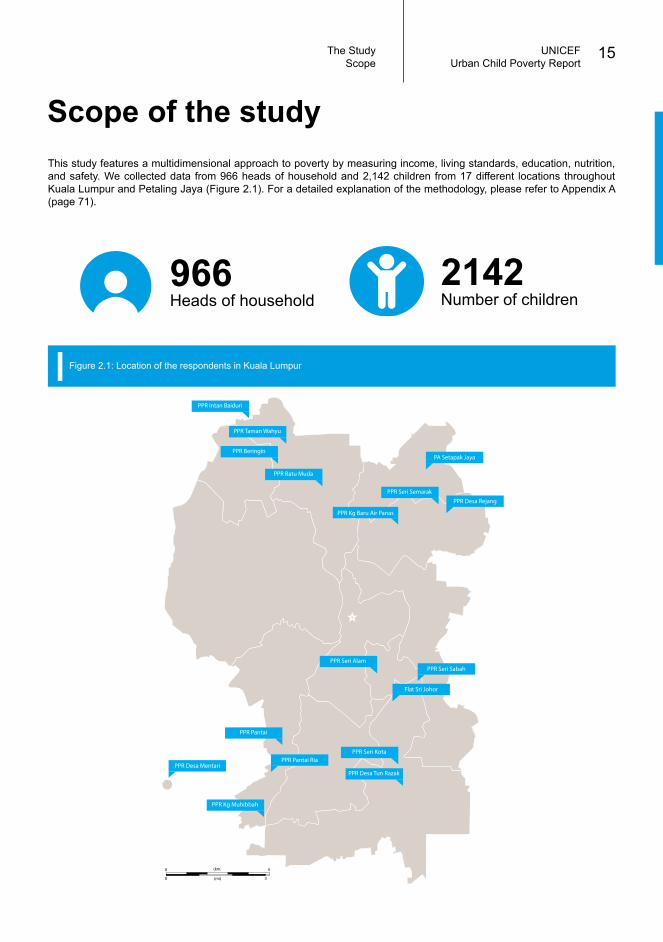
Figure 2.1: Location of the respondents in Kuala Lumpur
UNICEFUrban Child Poverty Report
15The Study
This study features a multidimensional approach to poverty by measuring income, living standards, education, nutrition, and safety. We collected data from 966 heads of household and 2,142 children from 17 different locations throughout Kuala Lumpur and Petaling Jaya (Figure 2.1). For a detailed explanation of the methodology, please refer to Appendix A (page 71).
966Heads of household
2142Number of children
Scope of the study
Scope
The children
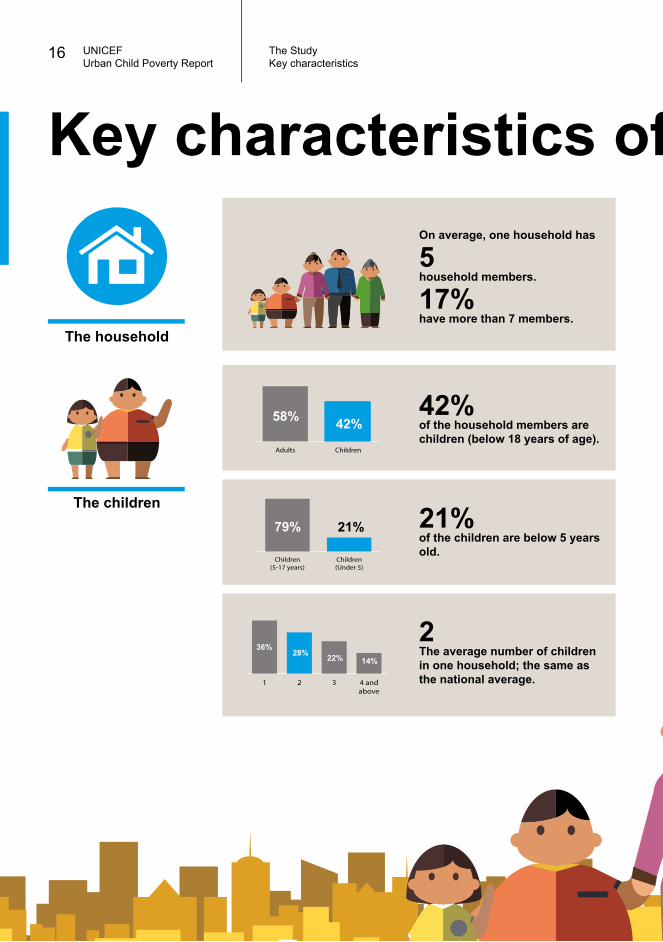
The household
On average, one household has
5household members.
17%have more than 7 members.
42%of the household members are children (below 18 years of age).
21%of the children are below 5 years old.
2The average number of children in one household; the same as the national average.
ChildrenAdults
Children(Under 5)
Children(5-17 years)
4 andabove
321
58% 42%
79% 21%
36%28% 22% 14%
UNICEFUrban Child Poverty Report
16 The StudyKey characteristics
Key characteristics of the respondents
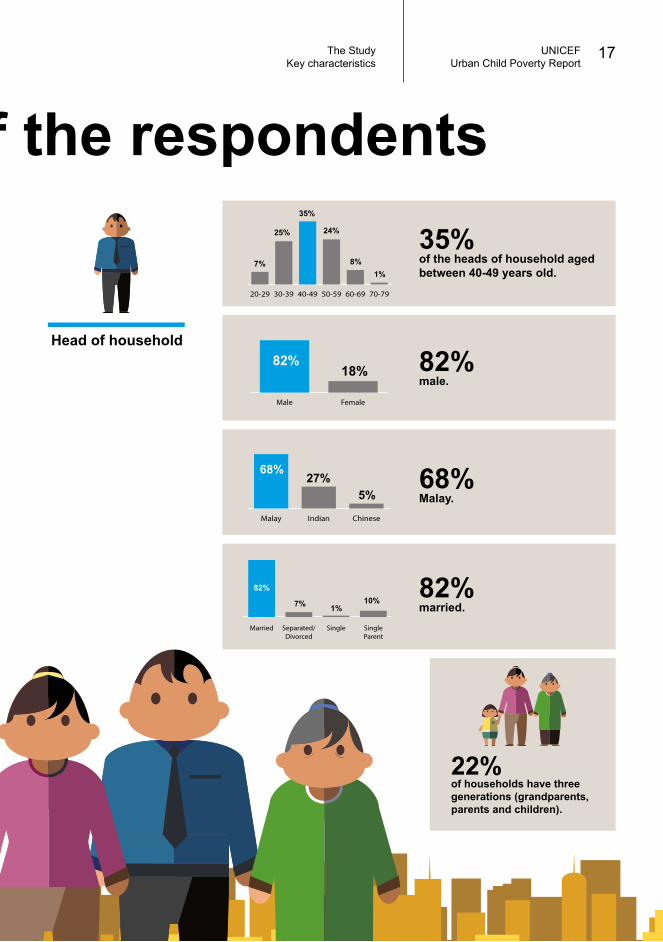
Head of household
35%of the heads of household aged between 40-49 years old.
68%Malay.
82%male.
82%married.
22%of households have three generations (grandparents, parents and children).
70-7960-6950-5940-4930-3920-29
ChineseIndianMalay
27%68%
5%
FemaleMale
SingleParent
SingleSeparated/Divorced
Married
82%18%
82%
7% 1%10%
7%
25%
35%
24%
8%1%
UNICEFUrban Child Poverty Report
17The Study
Key characteristics of the respondentsKey characteristics
No information
Never been to school
Form 6
College
University
Primary school
Secondary school (1-3)
Secondary school (4-5)
0
20
40
60
80
100
RetiredNot workingWorking Low skilledSemi-skilledSkilled
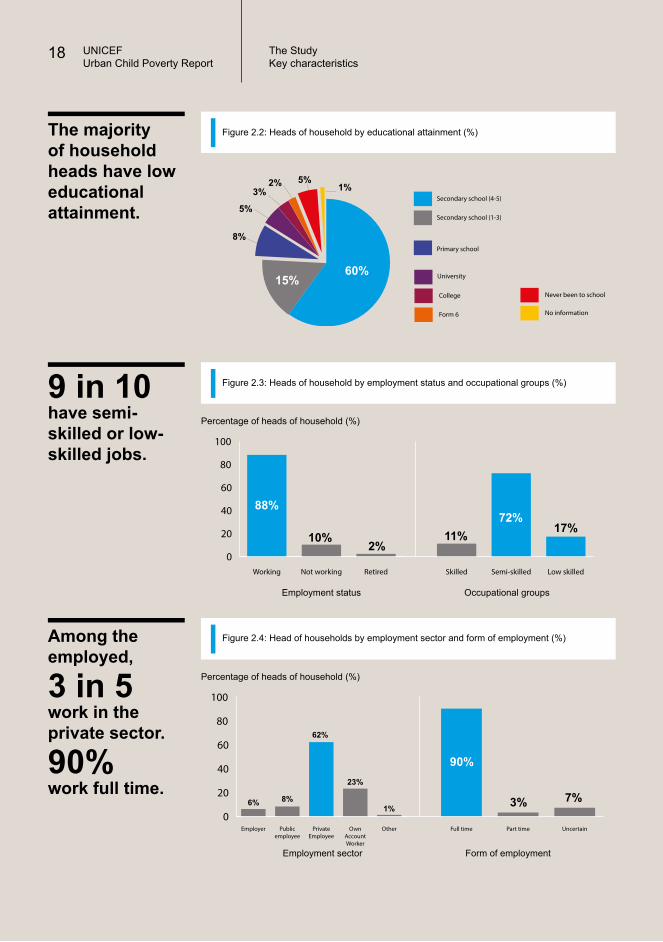
The majority of household heads have low educational attainment.
9 in 10have semi-skilled or low-skilled jobs.
Percentage of heads of household (%)
Employment status
Figure 2.2: Heads of household by educational attainment (%)
Figure 2.3: Heads of household by employment status and occupational groups (%)
0
20
40
60
80
100
OtherOwnAccountWorker
PrivateEmployee
Publicemployee
Employer UncertainPart timeFull time
Among the employed,
3 in 5work in the private sector.
90%work full time.
Percentage of heads of household (%)
Figure 2.4: Head of households by employment sector and form of employment (%)
8%
5%
3%2% 5%
1%
Occupational groups
88%
10%2%
11%
90%
72%
3%
17%
7%
Employment sector Form of employment
6% 8%
62%
23%
1%
UNICEFUrban Child Poverty Report
18 The StudyKey characteristics
60%15%
0
10
20
30
40
50
60
National6Low-cost �ats National7Low-cost �ats
0
10
20
30
40
50
60
Life andMedical
Insurance
Without EPF,SOCSO, Medical,
and Life Insurance
EPF andSOCSO
SOCSOEPF
48
59% 58%33%
9%
479
12
Working hours (per week) Hourly wages (RM)
62%
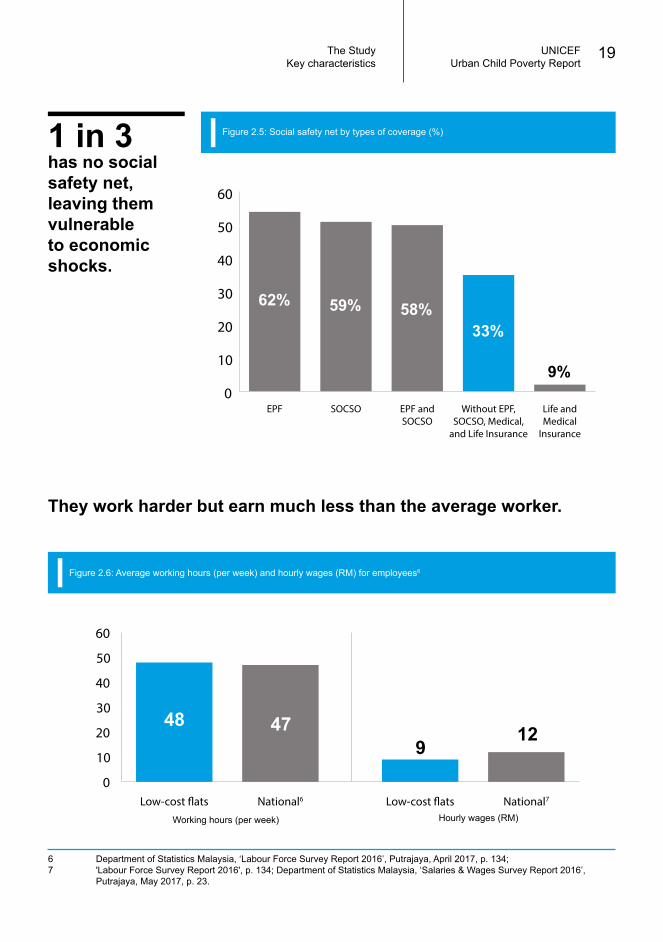
Figure 2.6: Average working hours (per week) and hourly wages (RM) for employees6
1 in 3has no social safety net, leaving them vulnerable to economic shocks.
Figure 2.5: Social safety net by types of coverage (%)
UNICEFUrban Child Poverty Report
19The StudyKey characteristics
They work harder but earn much less than the average worker.
6 Department of Statistics Malaysia, ‘Labour Force Survey Report 2016’, Putrajaya, April 2017, p. 134; 7 'Labour Force Survey Report 2016', p. 134; Department of Statistics Malaysia, ‘Salaries & Wages Survey Report 2016’, Putrajaya, May 2017, p. 23.
UNICEFUrban Child Poverty Report
20 Di Sebalik Tabir
Di Sebalik Tabir
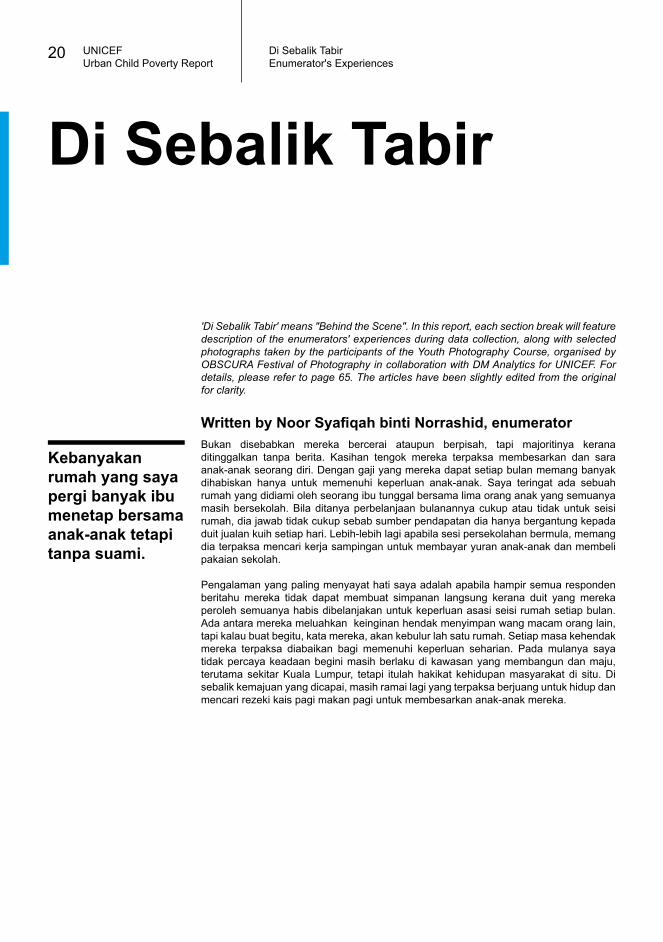
'Di Sebalik Tabir' means "Behind the Scene". In this report, each section break will feature description of the enumerators' experiences during data collection, along with selected photographs taken by the participants of the Youth Photography Course, organised by OBSCURA Festival of Photography in collaboration with DM Analytics for UNICEF. For details, please refer to page 65. The articles have been slightly edited from the original for clarity.
Bukan disebabkan mereka bercerai ataupun berpisah, tapi majoritinya kerana ditinggalkan tanpa berita. Kasihan tengok mereka terpaksa membesarkan dan sara anak-anak seorang diri. Dengan gaji yang mereka dapat setiap bulan memang banyak dihabiskan hanya untuk memenuhi keperluan anak-anak. Saya teringat ada sebuah rumah yang didiami oleh seorang ibu tunggal bersama lima orang anak yang semuanya masih bersekolah. Bila ditanya perbelanjaan bulanannya cukup atau tidak untuk seisi rumah, dia jawab tidak cukup sebab sumber pendapatan dia hanya bergantung kepada duit jualan kuih setiap hari. Lebih-lebih lagi apabila sesi persekolahan bermula, memang dia terpaksa mencari kerja sampingan untuk membayar yuran anak-anak dan membeli pakaian sekolah.
Pengalaman yang paling menyayat hati saya adalah apabila hampir semua responden beritahu mereka tidak dapat membuat simpanan langsung kerana duit yang mereka peroleh semuanya habis dibelanjakan untuk keperluan asasi seisi rumah setiap bulan. Ada antara mereka meluahkan keinginan hendak menyimpan wang macam orang lain, tapi kalau buat begitu, kata mereka, akan kebulur lah satu rumah. Setiap masa kehendak mereka terpaksa diabaikan bagi memenuhi keperluan seharian. Pada mulanya saya tidak percaya keadaan begini masih berlaku di kawasan yang membangun dan maju, terutama sekitar Kuala Lumpur, tetapi itulah hakikat kehidupan masyarakat di situ. Di sebalik kemajuan yang dicapai, masih ramai lagi yang terpaksa berjuang untuk hidup dan mencari rezeki kais pagi makan pagi untuk membesarkan anak-anak mereka.
Kebanyakan rumah yang saya pergi banyak ibu menetap bersama anak-anak tetapi tanpa suami.
Written by Noor Syafiqah binti Norrashid, enumerator
Enumerator's Experiences
UNICEFUrban Child Poverty Report
21Di Sebalik Tabir
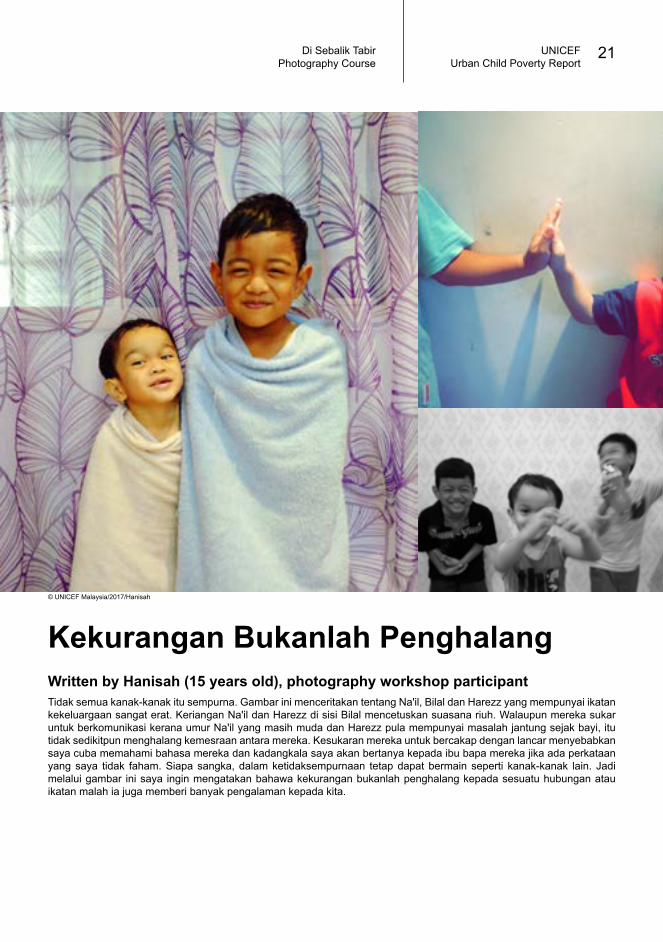
Kekurangan Bukanlah Penghalang
Tidak semua kanak-kanak itu sempurna. Gambar ini menceritakan tentang Na'il, Bilal dan Harezz yang mempunyai ikatan kekeluargaan sangat erat. Keriangan Na'il dan Harezz di sisi Bilal mencetuskan suasana riuh. Walaupun mereka sukar untuk berkomunikasi kerana umur Na'il yang masih muda dan Harezz pula mempunyai masalah jantung sejak bayi, itu tidak sedikitpun menghalang kemesraan antara mereka. Kesukaran mereka untuk bercakap dengan lancar menyebabkan saya cuba memahami bahasa mereka dan kadangkala saya akan bertanya kepada ibu bapa mereka jika ada perkataan yang saya tidak faham. Siapa sangka, dalam ketidaksempurnaan tetap dapat bermain seperti kanak-kanak lain. Jadi melalui gambar ini saya ingin mengatakan bahawa kekurangan bukanlah penghalang kepada sesuatu hubungan atau ikatan malah ia juga memberi banyak pengalaman kepada kita.
Written by Hanisah (15 years old), photography workshop participant
Photography Course
© UNICEF Malaysia/2017/Hanisah
Income, Transfers and Savings
IntroductionThe Study
Income, Transfers and SavingsLiving Standards
Education and NutritionPoverty and Deprivation
MalnutritionPolicy Recommendations
Programme ReportsAppendices and References
0
10
20
30
40
RM5,000& above
RM4,000-4,999
RM3,000-RM3,999
RM2,000-2,999
RM1,000-1,999
Below RM1,000
0
10
20
30
40
RM5,000 & aboveRM4,000-4,999RM3,000-RM3,999RM2,000-2,999RM1,000-1,999Below RM1,000
Malay
Chinese
Indian
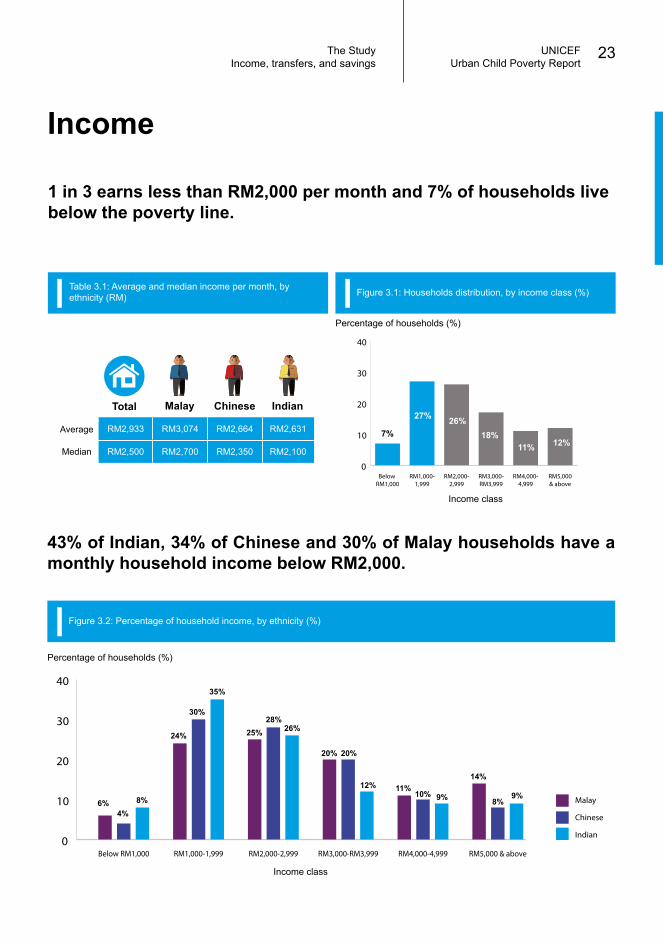
11% 12%Average RM2,933 RM3,074 RM2,664 RM2,631
Median RM2,500 RM2,700 RM2,350 RM2,100
Percentage of households (%)
Income class
6%
24% 25%
20%
11%14%
4%
30%28%
20%
10%8%8%
35%
26%
12%9% 9%
UNICEFUrban Child Poverty Report
23The Study
Total Malay Chinese
Table 3.1: Average and median income per month, by ethnicity (RM) Figure 3.1: Households distribution, by income class (%)
Indian
1 in 3 earns less than RM2,000 per month and 7% of households live below the poverty line.
27% 26%18%7%
43% of Indian, 34% of Chinese and 30% of Malay households have a monthly household income below RM2,000.
Percentage of households (%)
Income class
Figure 3.2: Percentage of household income, by ethnicity (%)
Income
Income, transfers, and savings

0
10
20
30
40
50
60
70
80
OthersJKMZakatInter HHBR1MAt least oneassistancereceived
0
10
20
30
40
50
60
70
80
RM5,000 & above
RM4,000-4,999
RM3,000-RM3,999
RM2,000-2,999
RM1,000-1,999
BelowRM1,000
Less than
4%of households received either zakat or JKM assistance....
... and
34%of those with household incomes below RM4,000 did not receive BR1M.
Figure 3.3: Percentage of household transfers, by type of transfers (%)
Figure 3.4: Percentage of heads of household receiving BR1M, by income class (%)
Income class
Types of transfers
3%
35%
0
20
40
60
80
100
RM5,000 & above
RM4,000-4,999
RM3,000-3,999
RM2,000-2,999
RM1,000-1,999
RM1-RM999
RM0
77%of households have no savings.
Figure 3.5: Household distribution, by total amount of savings (%)
77%
12%1% 0% 1% 0%
9%
UNICEFUrban Child Poverty Report
24 The StudyIncome, transfers, and savings
Transfers and Savings
68%
67%
65%
72%
10%
66%
1%
55%
3%
46%
UNICEFUrban Child Poverty Report
25Di Sebalik TabirEnumerator's Experiences
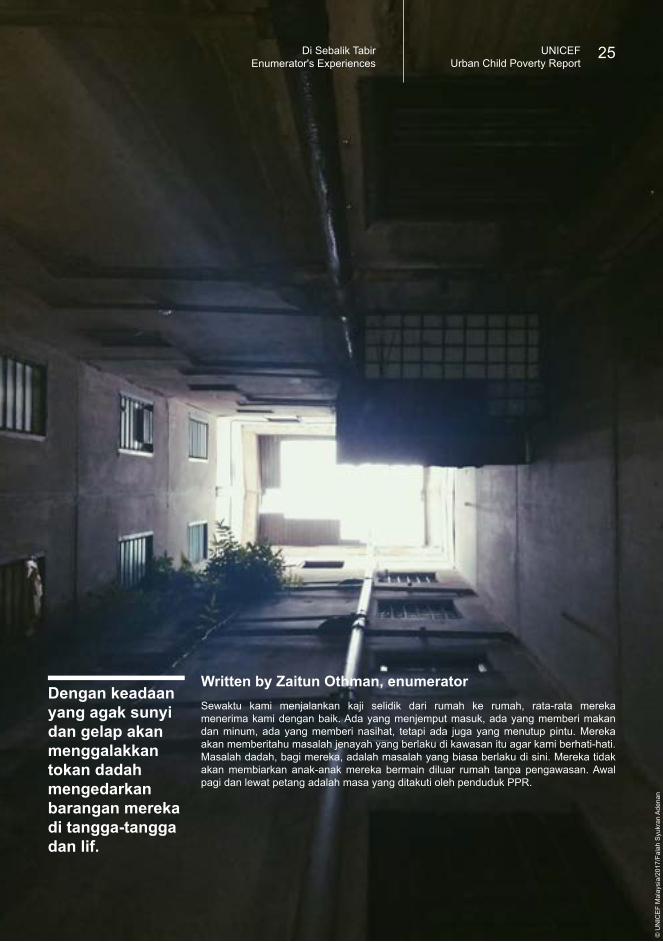
Sewaktu kami menjalankan kaji selidik dari rumah ke rumah, rata-rata mereka menerima kami dengan baik. Ada yang menjemput masuk, ada yang memberi makan dan minum, ada yang memberi nasihat, tetapi ada juga yang menutup pintu. Mereka akan memberitahu masalah jenayah yang berlaku di kawasan itu agar kami berhati-hati. Masalah dadah, bagi mereka, adalah masalah yang biasa berlaku di sini. Mereka tidak akan membiarkan anak-anak mereka bermain diluar rumah tanpa pengawasan. Awal pagi dan lewat petang adalah masa yang ditakuti oleh penduduk PPR.
Dengan keadaan yang agak sunyi dan gelap akan menggalakkan tokan dadah mengedarkan barangan mereka di tangga-tangga dan lif.
Written by Zaitun Othman, enumerator
© U
NIC
EF M
alay
sia/
2017
/Fal
ah S
yukr
an A
dena
n
UNICEFUrban Child Poverty Report
26 Di Sebalik TabirPhotography Course
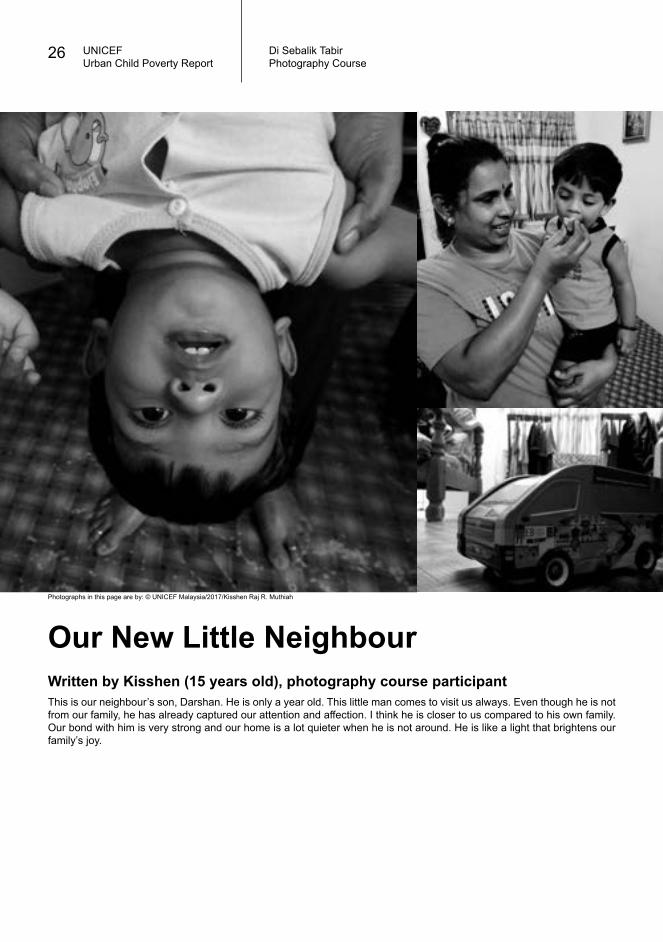
Our New Little Neighbour
This is our neighbour’s son, Darshan. He is only a year old. This little man comes to visit us always. Even though he is not from our family, he has already captured our attention and affection. I think he is closer to us compared to his own family. Our bond with him is very strong and our home is a lot quieter when he is not around. He is like a light that brightens our family’s joy.
Written by Kisshen (15 years old), photography course participant
Photographs in this page are by: © UNICEF Malaysia/2017/Kisshen Raj R. Muthiah
Living Standards
IntroductionThe Study
Income, Transfers and SavingsLiving Standards
Education and NutritionPoverty and Deprivation
MalnutritionPolicy Recommendations
Programme ReportsAppendices and References
Very dirty
Dirty
Very clean
Clean
Cleanliness of public areas Effectiveness of drainage system
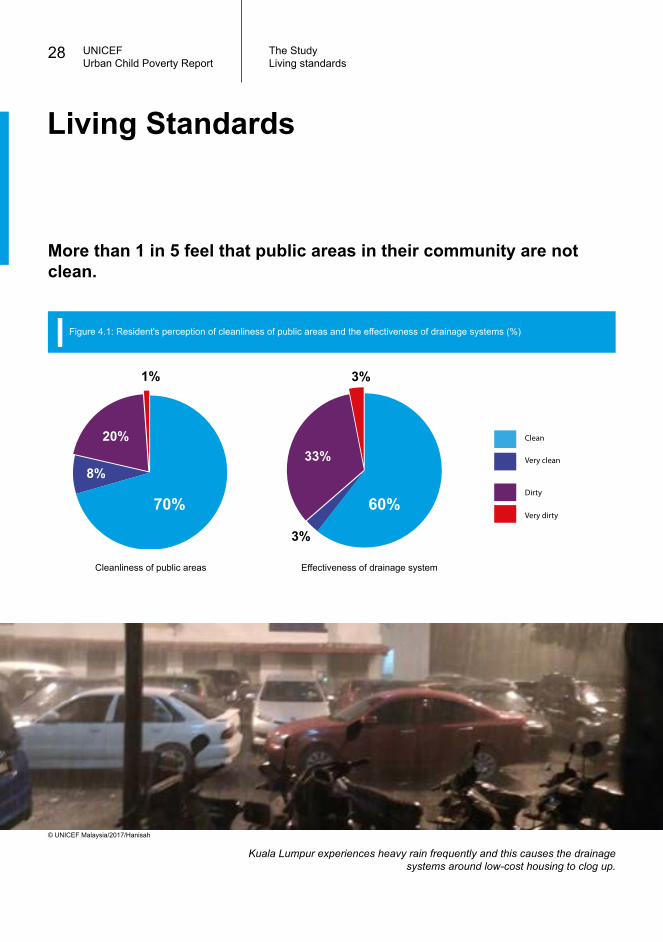
More than 1 in 5 feel that public areas in their community are not clean.
Figure 4.1: Resident's perception of cleanliness of public areas and the effectiveness of drainage systems (%)
60%70%
8%
20%33%
3%
1% 3%
UNICEFUrban Child Poverty Report
28 The Study
Living Standards
Living standards
Kuala Lumpur experiences heavy rain frequently and this causes the drainage systems around low-cost housing to clog up.
© UNICEF Malaysia/2017/Hanisah
Not close
Really close
Close
0
10
20
30
40
50
60
All thetime
NightEveningand night
EveningMorningand night
MorningDon'thave time
All thetime
NightEveningand night
EveningMorningand night
MorningDon'thave time
Percentage of households (%)
Relationship with other ethnic groups Relationship with neighbours
Time spent with mother Time spent with father
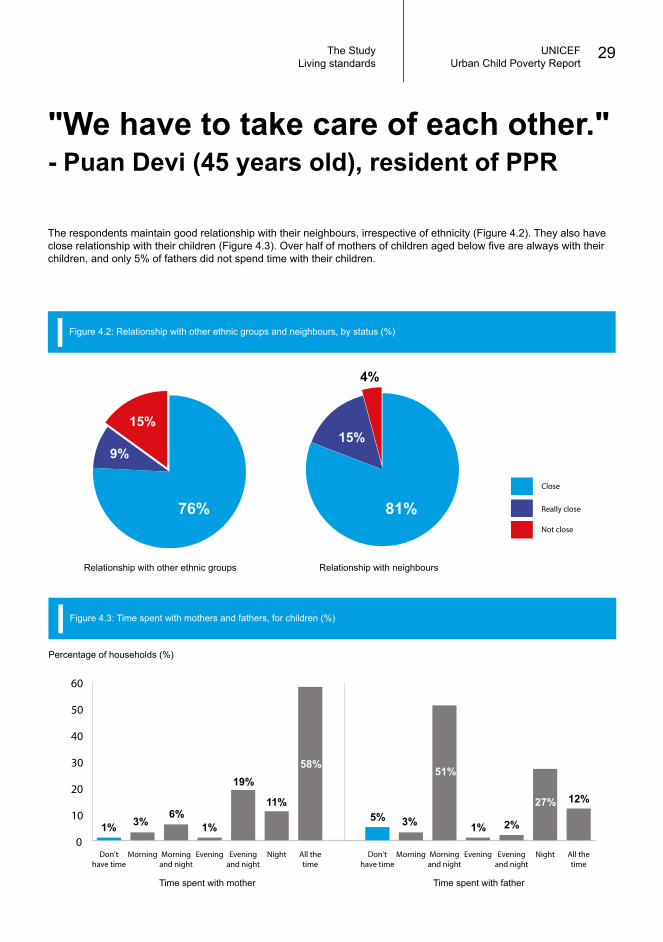
The respondents maintain good relationship with their neighbours, irrespective of ethnicity (Figure 4.2). They also have close relationship with their children (Figure 4.3). Over half of mothers of children aged below five are always with their children, and only 5% of fathers did not spend time with their children.
Figure 4.2: Relationship with other ethnic groups and neighbours, by status (%)
Figure 4.3: Time spent with mothers and fathers, for children (%)
81%76%
9%15%
15%
4%
1%5%3% 3%
6%
51%
1% 1%
19%
2%
11% 27%
58%
12%
UNICEFUrban Child Poverty Report
29The Study
"We have to take care of each other."- Puan Devi (45 years old), resident of PPR
Living standards
Drugs
Sexual relationship
Stealing
Smoking and drinking alcohol
Stealing
Drinking alcohol
Drugs
Smoking
UNICEFUrban Child Poverty Report
30 The Study
80% 65%
9%
19%
6% 6%
12%
4%
Living standards
0
20
40
60
80
100
Early nightAfternoonMorning
Safe
Not safe
Percentage of households (%)
Time of the day
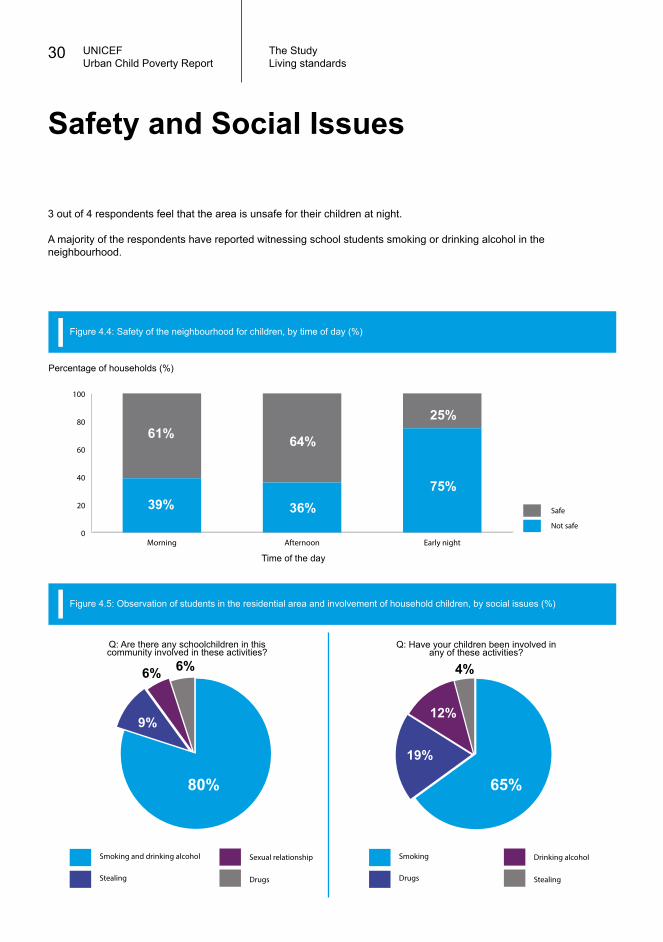
3 out of 4 respondents feel that the area is unsafe for their children at night.
A majority of the respondents have reported witnessing school students smoking or drinking alcohol in the neighbourhood.
Figure 4.4: Safety of the neighbourhood for children, by time of day (%)
Safety and Social Issues
Q: Are there any schoolchildren in this community involved in these activities?
Q: Have your children been involved in any of these activities?
Figure 4.5: Observation of students in the residential area and involvement of household children, by social issues (%)
39% 36%75%
61% 64%
25%
UNICEFUrban Child Poverty Report
31Di Sebalik Tabir
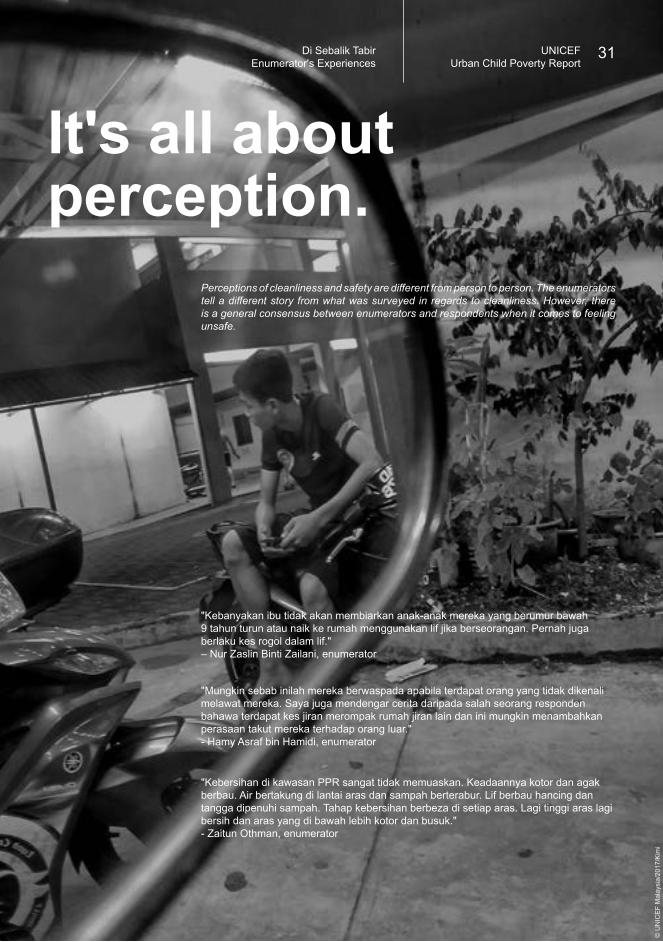
It's all about perception.
Enumerator's Experiences
Perceptions of cleanliness and safety are different from person to person. The enumerators tell a different story from what was surveyed in regards to cleanliness. However, there is a general consensus between enumerators and respondents when it comes to feeling unsafe.
"Kebersihan di kawasan PPR sangat tidak memuaskan. Keadaannya kotor dan agak berbau. Air bertakung di lantai aras dan sampah berterabur. Lif berbau hancing dan tangga dipenuhi sampah. Tahap kebersihan berbeza di setiap aras. Lagi tinggi aras lagi bersih dan aras yang di bawah lebih kotor dan busuk."- Zaitun Othman, enumerator
"Mungkin sebab inilah mereka berwaspada apabila terdapat orang yang tidak dikenali melawat mereka. Saya juga mendengar cerita daripada salah seorang responden bahawa terdapat kes jiran merompak rumah jiran lain dan ini mungkin menambahkan perasaan takut mereka terhadap orang luar."- Hamy Asraf bin Hamidi, enumerator
"Kebanyakan ibu tidak akan membiarkan anak-anak mereka yang berumur bawah 9 tahun turun atau naik ke rumah menggunakan lif jika berseorangan. Pernah juga berlaku kes rogol dalam lif."– Nur Zaslin Binti Zailani, enumerator
© U
NIC
EF M
alay
sia/
2017
/Kim
i
Education and Nutrition
IntroductionThe Study
Income, Transfers and SavingsLiving Standards
Education and NutritionPoverty and Deprivation
MalnutritionPolicy Recommendations
Programme ReportsAppendices and References
0
10
20
30
40
50
60
7-17 years old5-6 years old
51%
2%
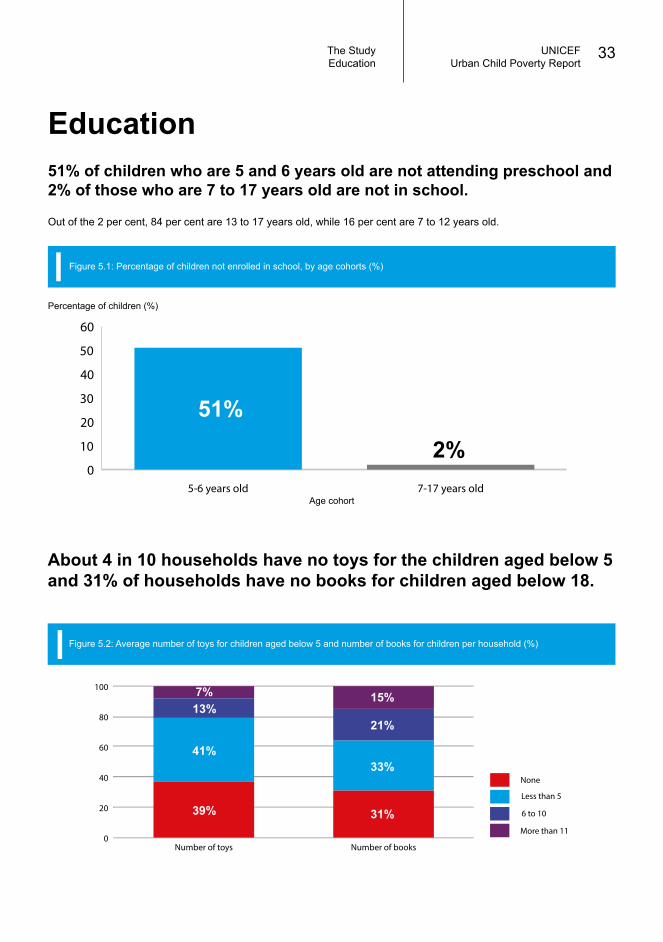
Figure 5.2: Average number of toys for children aged below 5 and number of books for children per household (%)
0
20
40
60
80
100
Number of booksNumber of toys
None
Less than 5
6 to 10
More than 11
39% 31%
41%33%
13%21%
7% 15%
About 4 in 10 households have no toys for the children aged below 5 and 31% of households have no books for children aged below 18.
Figure 5.1: Percentage of children not enrolled in school, by age cohorts (%)
Percentage of children (%)
Age cohort
UNICEFUrban Child Poverty Report
33The Study
Education51% of children who are 5 and 6 years old are not attending preschool and 2% of those who are 7 to 17 years old are not in school.
Education
Out of the 2 per cent, 84 per cent are 13 to 17 years old, while 16 per cent are 7 to 12 years old.
0
20
40
60
80
100
More than 11
6 until 10
Less than 5
No books
TertiaryEducation
SecondaryEducation
PrimaryEducation
No FormalEducation
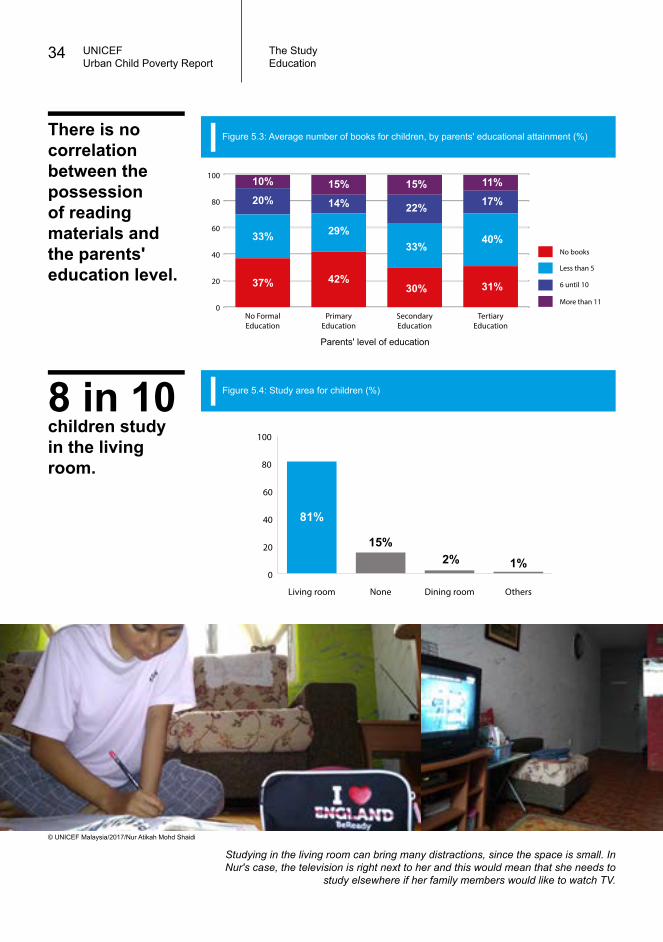
There is no correlation between the possession of reading materials and the parents' education level.
Figure 5.3: Average number of books for children, by parents' educational attainment (%)
Parents' level of education
37% 42%30% 31%
33% 29%33% 40%
20% 14% 22% 17%
10% 15% 15% 11%
0
20
40
60
80
100
OthersDining roomNoneLiving room
8 in 10children study in the living room.
Figure 5.4: Study area for children (%)
81%
15%2% 1%
UNICEFUrban Child Poverty Report
34 The StudyEducation
Studying in the living room can bring many distractions, since the space is small. In Nur's case, the television is right next to her and this would mean that she needs to
study elsewhere if her family members would like to watch TV.
© UNICEF Malaysia/2017/Nur Atikah Mohd Shaidi
Policy recommendation: Safe, shared spaces for children
0
20
40
60
80
WeakModerateGoodVery good
0
20
40
60
80
100
E
D
C
B
A
English: SampleScience: SampleScience: NationalAverage, 2013
Math: SampleMath: National Average, 2013
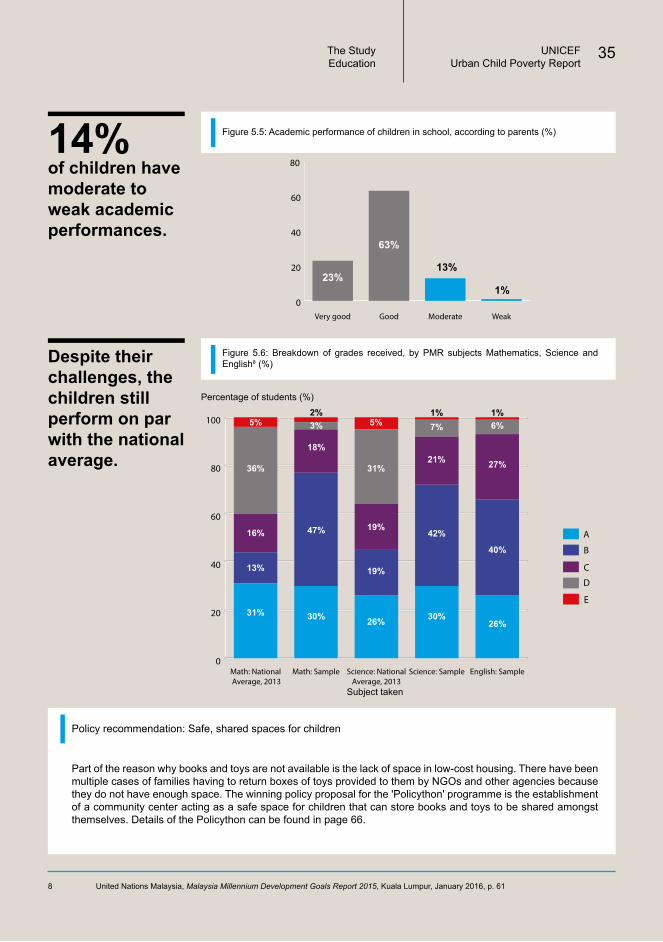
14%of children have moderate to weak academic performances.
Despite their challenges, the children still perform on par with the national average.
Percentage of students (%)
Subject taken
23%
63%
13%
1%
13%
16%
36%
5%
31% 30% 26% 30%26%
47%
19%
42%
40%
18%
19%
21% 27%
3%
31%
7% 6%2%
5%1% 1%
Figure 5.5: Academic performance of children in school, according to parents (%)
Figure 5.6: Breakdown of grades received, by PMR subjects Mathematics, Science and English8 (%)
UNICEFUrban Child Poverty Report
35The StudyEducation
Part of the reason why books and toys are not available is the lack of space in low-cost housing. There have been multiple cases of families having to return boxes of toys provided to them by NGOs and other agencies because they do not have enough space. The winning policy proposal for the 'Policython' programme is the establishment of a community center acting as a safe space for children that can store books and toys to be shared amongst themselves. Details of the Policython can be found in page 66.
8 United Nations Malaysia, Malaysia Millennium Development Goals Report 2015, Kuala Lumpur, January 2016, p. 61
UNICEFUrban Child Poverty Report
36 The Study
Nutrition
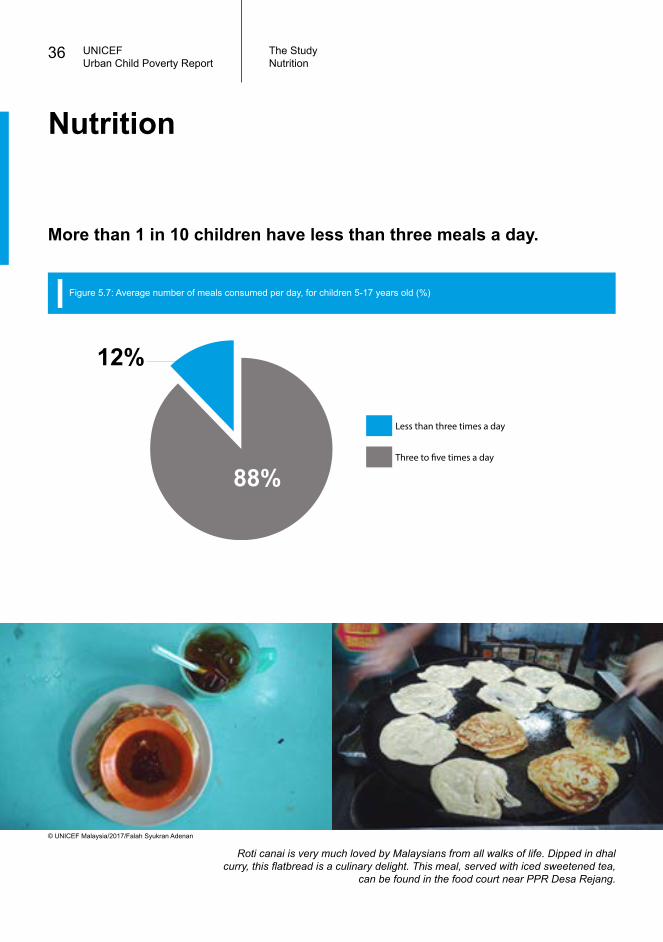
More than 1 in 10 children have less than three meals a day.
Less than three times a day
Three to �ve times a day
Nutrition
Roti canai is very much loved by Malaysians from all walks of life. Dipped in dhal curry, this flatbread is a culinary delight. This meal, served with iced sweetened tea,
can be found in the food court near PPR Desa Rejang.
Figure 5.7: Average number of meals consumed per day, for children 5-17 years old (%)
88%
12%
© UNICEF Malaysia/2017/Falah Syukran Adenan
UNICEFUrban Child Poverty Report
37The Study
Others
Limited time
Fast food is easier to prepare and cheaper
High prices and insu�cient income
0
20
40
60
80
100
Rarely orfrequently?
Not enough moneyto buy food
Not enough
Enough money
Frequently
Rarely
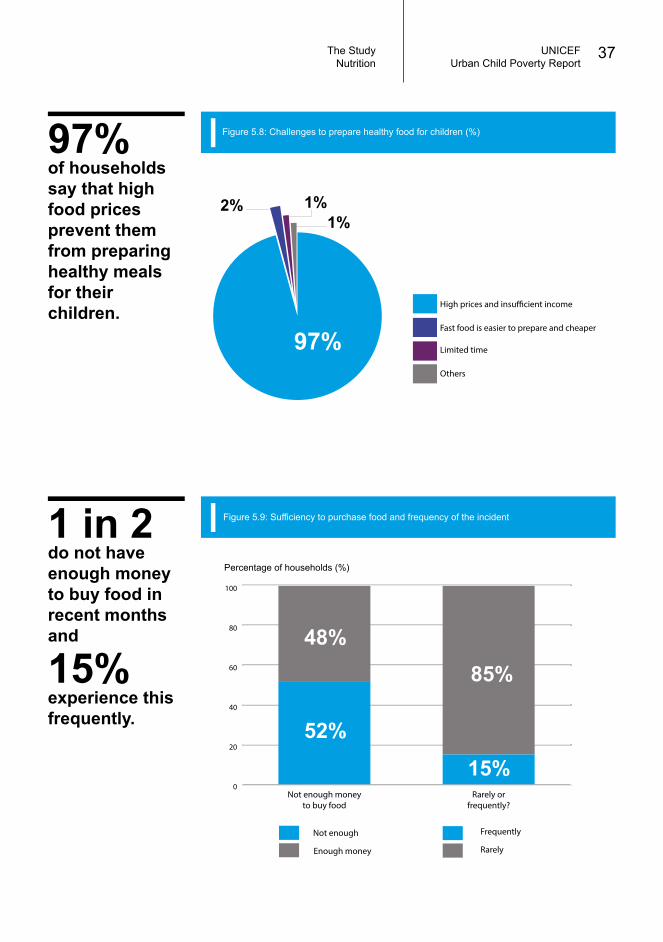
97%of households say that high food prices prevent them from preparing healthy meals for their children.
1 in 2do not have enough money to buy food in recent months and
15%experience this frequently.
Percentage of households (%)
Figure 5.8: Challenges to prepare healthy food for children (%)
Figure 5.9: Sufficiency to purchase food and frequency of the incident
Nutrition
97%
2% 1%1%
48%
52%15%
85%
UNICEFUrban Child Poverty Report
38 Di Sebalik TabirEnumerator's Experiences
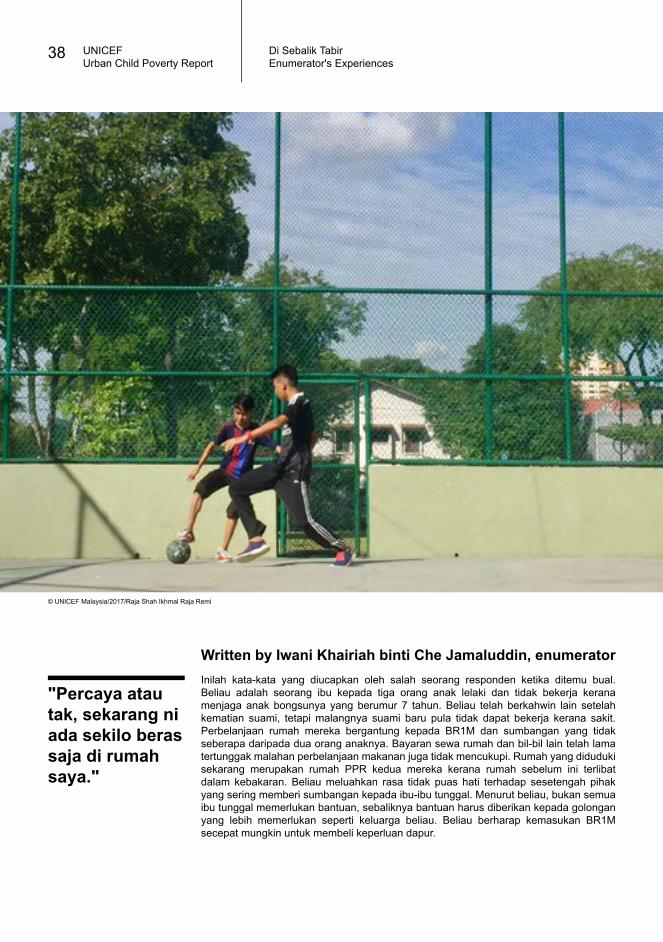
Inilah kata-kata yang diucapkan oleh salah seorang responden ketika ditemu bual. Beliau adalah seorang ibu kepada tiga orang anak lelaki dan tidak bekerja kerana menjaga anak bongsunya yang berumur 7 tahun. Beliau telah berkahwin lain setelah kematian suami, tetapi malangnya suami baru pula tidak dapat bekerja kerana sakit. Perbelanjaan rumah mereka bergantung kepada BR1M dan sumbangan yang tidak seberapa daripada dua orang anaknya. Bayaran sewa rumah dan bil-bil lain telah lama tertunggak malahan perbelanjaan makanan juga tidak mencukupi. Rumah yang diduduki sekarang merupakan rumah PPR kedua mereka kerana rumah sebelum ini terlibat dalam kebakaran. Beliau meluahkan rasa tidak puas hati terhadap sesetengah pihak yang sering memberi sumbangan kepada ibu-ibu tunggal. Menurut beliau, bukan semua ibu tunggal memerlukan bantuan, sebaliknya bantuan harus diberikan kepada golongan yang lebih memerlukan seperti keluarga beliau. Beliau berharap kemasukan BR1M secepat mungkin untuk membeli keperluan dapur.
"Percaya atau tak, sekarang ni ada sekilo beras saja di rumah saya."
Written by Iwani Khairiah binti Che Jamaluddin, enumerator
© UNICEF Malaysia/2017/Raja Shah Ikhmal Raja Remi
© UNICEF Malaysia/2017/Raja Shah Ikhmal Raja Remi© UNICEF Malaysia/2017/Raja Shah Ikhmal Raja Remi
© UNICEF Malaysia/2017/Muhammad Haiqal Mohd Hazrari
Poverty and Deprivation
IntroductionThe Study
Income, Transfers and SavingsLiving Standards
Education and NutritionPoverty and Deprivation
MalnutritionPolicy Recommendations
Programme ReportsAppendices and References
© U
NIC
EF M
alay
sia/
2017
/Fal
ah S
yukr
an A
dena
n
UNICEFUrban Child Poverty Report
41The Study
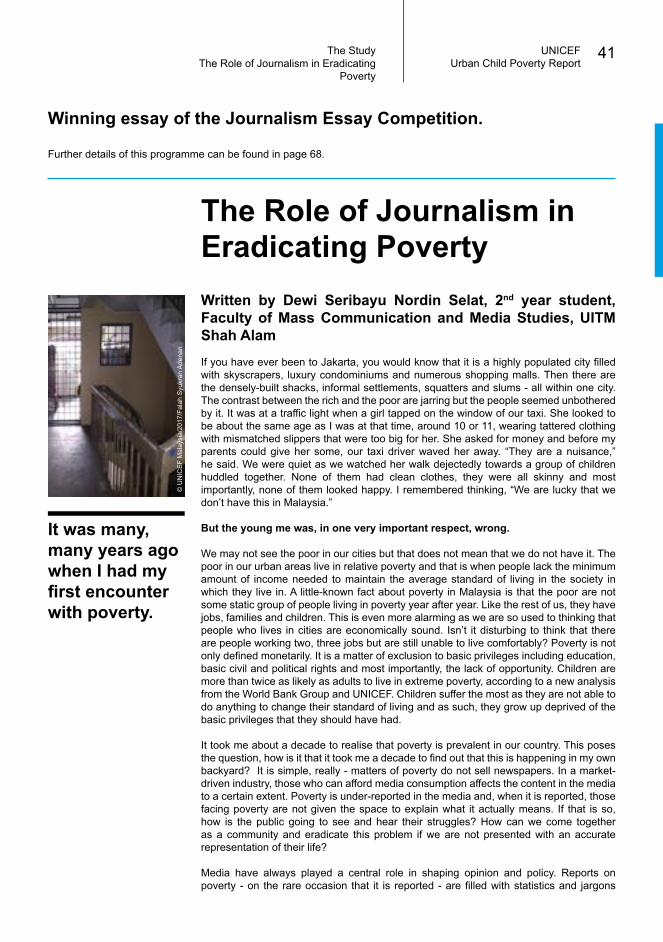
If you have ever been to Jakarta, you would know that it is a highly populated city filled with skyscrapers, luxury condominiums and numerous shopping malls. Then there are the densely-built shacks, informal settlements, squatters and slums - all within one city. The contrast between the rich and the poor are jarring but the people seemed unbothered by it. It was at a traffic light when a girl tapped on the window of our taxi. She looked to be about the same age as I was at that time, around 10 or 11, wearing tattered clothing with mismatched slippers that were too big for her. She asked for money and before my parents could give her some, our taxi driver waved her away. “They are a nuisance,” he said. We were quiet as we watched her walk dejectedly towards a group of children huddled together. None of them had clean clothes, they were all skinny and most importantly, none of them looked happy. I remembered thinking, “We are lucky that we don’t have this in Malaysia.”
But the young me was, in one very important respect, wrong. We may not see the poor in our cities but that does not mean that we do not have it. The poor in our urban areas live in relative poverty and that is when people lack the minimum amount of income needed to maintain the average standard of living in the society in which they live in. A little-known fact about poverty in Malaysia is that the poor are not some static group of people living in poverty year after year. Like the rest of us, they have jobs, families and children. This is even more alarming as we are so used to thinking that people who lives in cities are economically sound. Isn’t it disturbing to think that there are people working two, three jobs but are still unable to live comfortably? Poverty is not only defined monetarily. It is a matter of exclusion to basic privileges including education, basic civil and political rights and most importantly, the lack of opportunity. Children are more than twice as likely as adults to live in extreme poverty, according to a new analysis from the World Bank Group and UNICEF. Children suffer the most as they are not able to do anything to change their standard of living and as such, they grow up deprived of the basic privileges that they should have had. It took me about a decade to realise that poverty is prevalent in our country. This poses the question, how is it that it took me a decade to find out that this is happening in my own backyard? It is simple, really - matters of poverty do not sell newspapers. In a market-driven industry, those who can afford media consumption affects the content in the media to a certain extent. Poverty is under-reported in the media and, when it is reported, those facing poverty are not given the space to explain what it actually means. If that is so, how is the public going to see and hear their struggles? How can we come together as a community and eradicate this problem if we are not presented with an accurate representation of their life? Media have always played a central role in shaping opinion and policy. Reports on poverty - on the rare occasion that it is reported - are filled with statistics and jargons
It was many, many years ago when I had my first encounter with poverty.
The Role of Journalism in Eradicating PovertyWritten by Dewi Seribayu Nordin Selat, 2nd year student, Faculty of Mass Communication and Media Studies, UITM Shah Alam
Winning essay of the Journalism Essay Competition.
Further details of this programme can be found in page 68.
The Role of Journalism in Eradicating Poverty
UNICEFUrban Child Poverty Report
42 Di Sebalik TabirThe Role of Journalism in Eradicating Poverty
that is incomprehensible to us. Poverty has often been presented to us in a very robotic manner, devoid of emotion and compassion. While statistics are important, it detaches the public from this issue and in some cases, the poor are dehumanised. In order for us to stir the public, we need to appeal to their sensibilities. How so? Well, words are undeniably powerful but when it is accompanied by a well-placed photograph? It compels change. Photographs are like windows that the people can peek into, windows that can connect them to the struggles and hopelessness of poverty. Photographs show them the harsh reality of the urban poor. Photographs tell us what words cannot. Photographs tell stories. Photographs tap into the soul.
Poverty is unforgiving especially towards children. Growing up and living in this kind of environment leave deep scars and shape them to be people who have a pessimistic view of the world. Poverty not only exists externally, but it can also exist within the mind and spirit of a person. Poor people struggle with hopelessness, anxiety, shame and inferiority. It is undeniable that this is the result of being voiceless and powerless. It gives an internalised worldview where many believe that they are of no value and have nothing significant to offer. As such, children grow up without aspirations and dreams. Mix with the wrong company and some may end up becoming predators and join criminal gangs. The environment that they live in are not conducive nor are there positive role models for them to build a strong moral compass. These children not only lack moral anchoring, but they lack focus and drift through life aimlessly. But these can change if they have a voice. Without the access to a voice, those living in poverty are unable to participate directly in debate or to express their views on public policies that directly affect them. From such perspective, it can be said that the poor lack information and knowledge of actions that could be taken to improve their conditions. It’s not that they don’t want to, it’s because they don’t know how.
It is imperative that we remember the fact that the future of our country lies in the youth. These children are no exception to that. How are we going to move forward as a nation if we are unable to give these children another chance at life? If this issue persists for too long, we will create the culture of poverty, passing from generation to generation. The problem of today is tomorrow. What we cannot fix in this generation will be the problem of the future. And if we want people to see that, we must be very honest about what, and who, we mean when we talk about the poor. Be their voice. Be their change.
Poverty and Deprivation
Poverty and Deprivation
0
20
40
60
80
100
M40OtherB40
VulnerablePLIKL0
20
40
60
80
100
Low-cost�ats**
Low-cost�ats*
KL**KL*National
Figure 6.1: Absolute poverty by income profile (%) Figure 6.2: Relative poverty by income profile (%)
Percentage of households %) Percentage of households %)
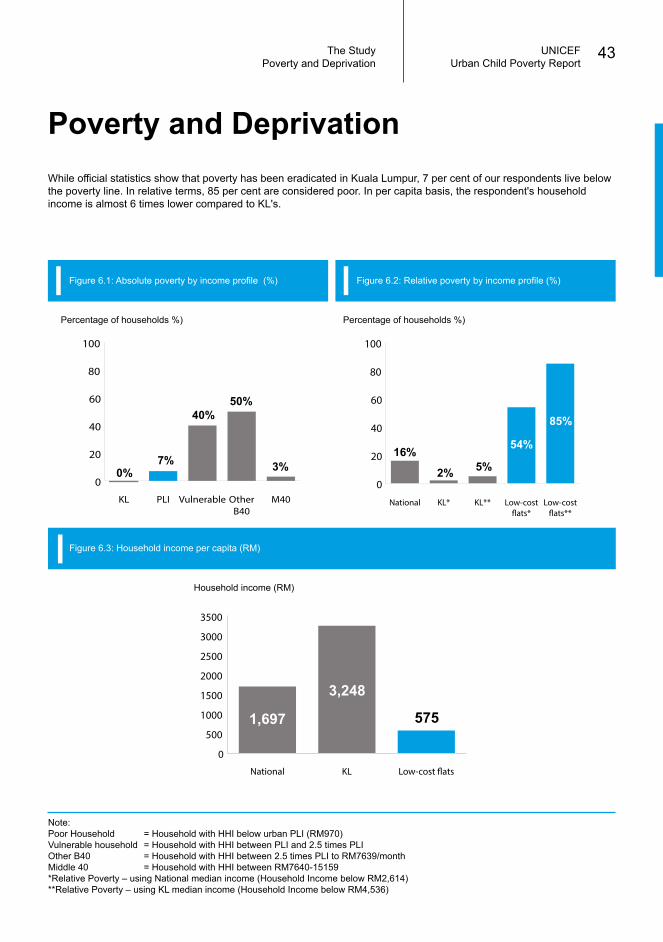
While official statistics show that poverty has been eradicated in Kuala Lumpur, 7 per cent of our respondents live below the poverty line. In relative terms, 85 per cent are considered poor. In per capita basis, the respondent's household income is almost 6 times lower compared to KL's.
0
500
1000
1500
2000
2500
3000
3500
Low-cost �atsKLNational
Figure 6.3: Household income per capita (RM)
Household income (RM)
Note:Poor Household = Household with HHI below urban PLI (RM970)Vulnerable household = Household with HHI between PLI and 2.5 times PLIOther B40 = Household with HHI between 2.5 times PLI to RM7639/month Middle 40 = Household with HHI between RM7640-15159*Relative Poverty – using National median income (Household Income below RM2,614) **Relative Poverty – using KL median income (Household Income below RM4,536)
0%
16%7%2%
40%
5%
50%
54%
3%
85%
1,697
3,248
575
UNICEFUrban Child Poverty Report
43The Study
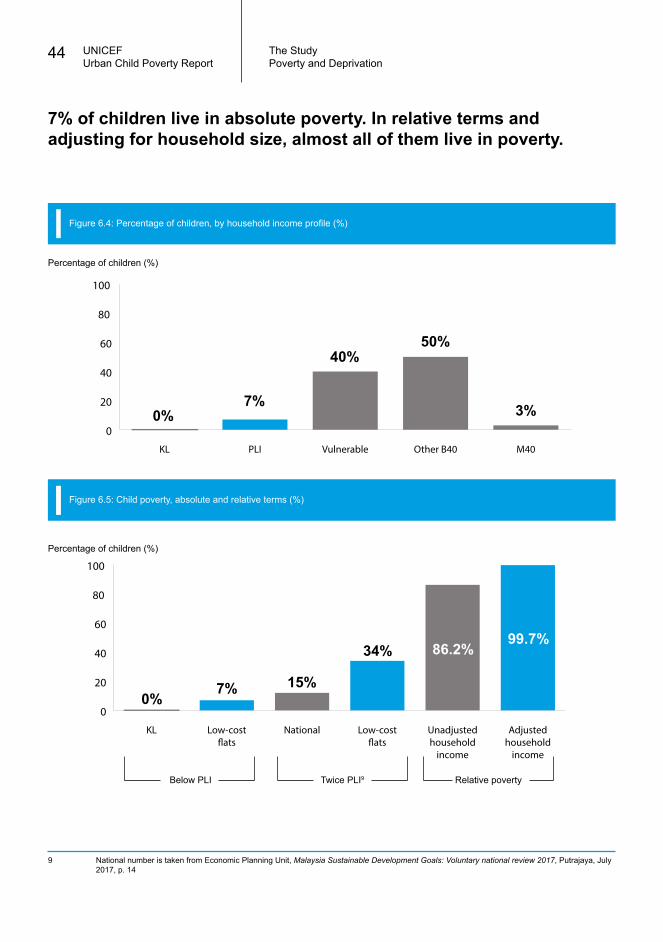
7% of children live in absolute poverty. In relative terms and adjusting for household size, almost all of them live in poverty.
Poverty and Deprivation
Figure 6.4: Percentage of children, by household income profile (%)
Percentage of children (%)
Figure 6.5: Child poverty, absolute and relative terms (%)
Percentage of children (%)
0
20
40
60
80
100
M40Other B40VulnerablePLIKL
0
20
40
60
80
100
Adjustedhousehold
income
Unadjustedhousehold
income
Low-cost�ats
NationalLow-cost�ats
KL
Relative povertyTwice PLI9Below PLI
0%7% 15%
34% 86.2%99.7%
7%0%
40%50%
3%
UNICEFUrban Child Poverty Report
44 The Study
9 National number is taken from Economic Planning Unit, Malaysia Sustainable Development Goals: Voluntary national review 2017, Putrajaya, July 2017, p. 14

The Muthiah family's head of household normally spends his time after work in the living room. In the background, dining chairs were also used to hang his pants.
Photography Course
© U
NIC
EF M
alay
sia/
2017
/Kis
shen
Raj
R. M
uthi
ah
UNICEFUrban Child Poverty Report
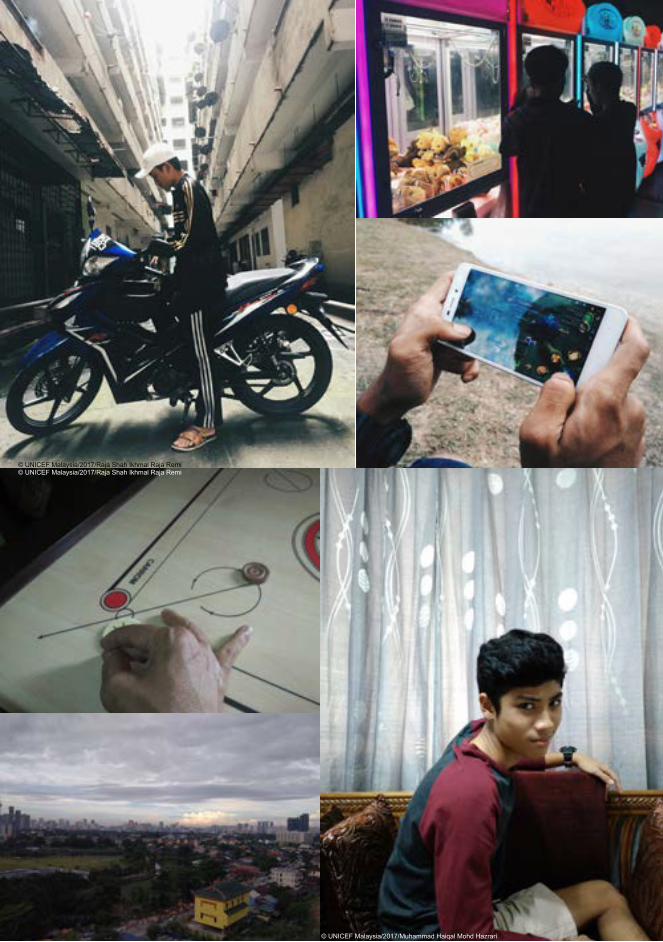
45Di Sebalik Tabir
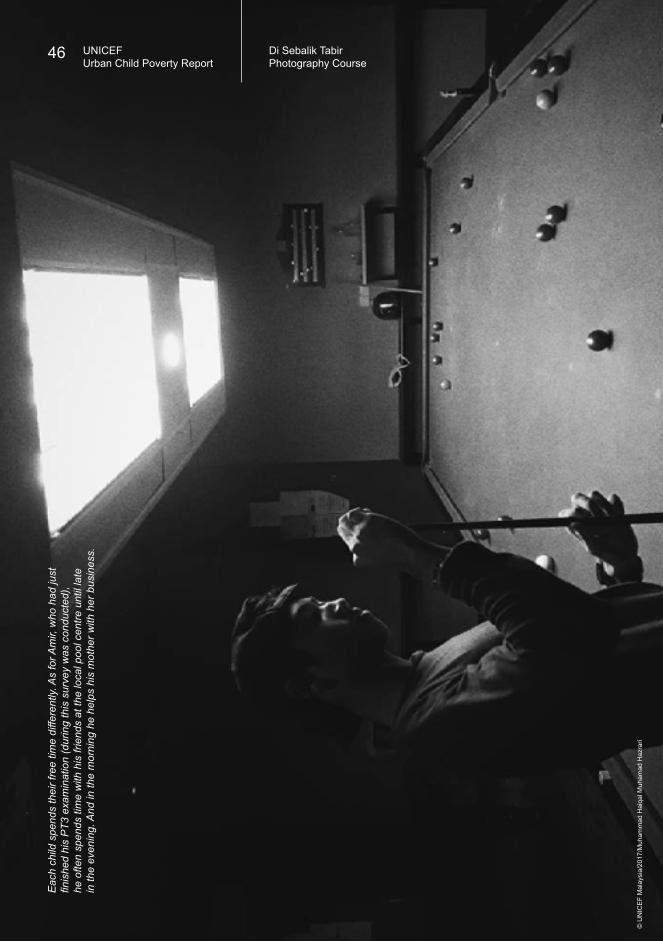
Eac
h ch
ild s
pend
s th
eir f
ree
time
diffe
rent
ly. A
s fo
r Am
ir, w
ho h
ad ju
stfin
ishe
d hi
s P
T3 e
xam
inat
ion
(dur
ing
this
sur
vey
was
con
duct
ed),
he o
ften
spen
ds ti
me
with
his
frie
nds
at th
e lo
cal p
ool c
entre
unt
il la
tein
the
even
ing.
And
in th
e m
orni
ng h
e he
lps
his
mot
her w
ith h
er b
usin
ess.
© U
NIC
EF M
alay
sia/
2017
/Muh
amm
ad H
aiqa
l Muh
amad
Haz
rari
UNICEFUrban Child Poverty Report
46 Di Sebalik TabirPhotography Course

© UNICEF Malaysia/2017/Muhammad Amerol Afiq Mohd Dzon Akhirom
UNICEFUrban Child Poverty Report
47Di Sebalik Tabir
Kakak Saya
Kakak saya seorang yang sabar dan tidak berputus asa. Bagaimanapun ada masanya dia kecewa juga apabila pelanggan masih marah-marah walaupun sudah dilayan dengan baik. Kadang-kadang dia juga diperlekehkan oleh orang kaya yang ingat dia tidak mempunyai sijil SPM sebab bekerja di kedai menjual telefon. Apabila tidak dapat menjual sebuah telefon dalam masa dua minggu atau sebulan dia terfikir untuk berhenti kerja, tetapi tetap berusaha untuk membuat yang terbaik. Kakak saya juga seorang yang mempunyai hubungan baik dengan majikan dan rakan sekerjanya.
Written by Amerol (15 years old), photography course participant
Photography Course
Malnutrition
IntroductionThe Study
Income, Transfers and SavingsLiving Standards
Education and NutritionPoverty and Deprivation
MalnutritionPolicy Recommendations
Programme ReportsAppendices and References
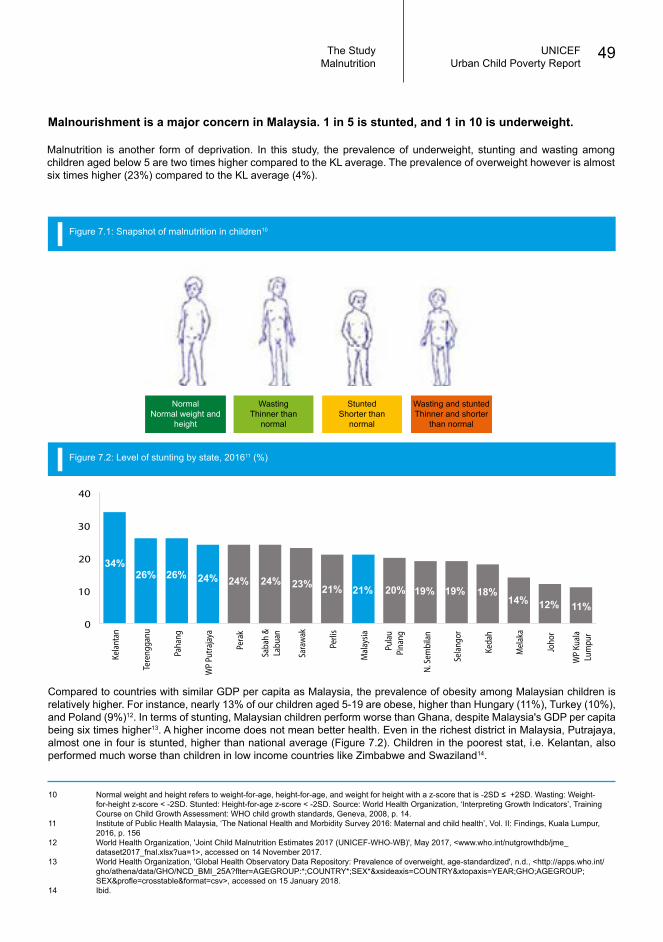
Figure 7.2: Level of stunting by state, 201611 (%)
Malnourishment is a major concern in Malaysia. 1 in 5 is stunted, and 1 in 10 is underweight.
Compared to countries with similar GDP per capita as Malaysia, the prevalence of obesity among Malaysian children is relatively higher. For instance, nearly 13% of our children aged 5-19 are obese, higher than Hungary (11%), Turkey (10%), and Poland (9%)12. In terms of stunting, Malaysian children perform worse than Ghana, despite Malaysia's GDP per capita being six times higher13. A higher income does not mean better health. Even in the richest district in Malaysia, Putrajaya, almost one in four is stunted, higher than national average (Figure 7.2). Children in the poorest stat, i.e. Kelantan, also performed much worse than children in low income countries like Zimbabwe and Swaziland14.
0
10
20
30
40
WP
Kual
aLu
mpu
r
Joho
r
Mel
aka
Keda
h
Sela
ngor
N. S
embi
lan
Pula
uPi
nang
Mal
aysia
Perli
s
Sara
wak
Saba
h &
Labu
an
Pera
k
WP
Putra
jaya
Paha
ng
Tere
ngga
nu
Kela
ntan
34%26% 24%
21% 19%26% 24%
21% 20% 18%24% 23% 19%
14% 12% 11%
10 Normal weight and height refers to weight-for-age, height-for-age, and weight for height with a z-score that is -2SD ≤ +2SD. Wasting: Weight- for-height z-score < -2SD. Stunted: Height-for-age z-score < -2SD. Source: World Health Organization, ‘Interpreting Growth Indicators’, Training Course on Child Growth Assessment: WHO child growth standards, Geneva, 2008, p. 14.11 Institute of Public Health Malaysia, ‘The National Health and Morbidity Survey 2016: Maternal and child health’, Vol. II: Findings, Kuala Lumpur, 2016, p. 15612 World Health Organization, 'Joint Child Malnutrition Estimates 2017 (UNICEF-WHO-WB)', May 2017, <www.who.int/nutgrowthdb/jme_ dataset2017_fnal.xlsx?ua=1>, accessed on 14 November 2017.13 World Health Organization, 'Global Health Observatory Data Repository: Prevalence of overweight, age-standardized', n.d., <http://apps.who.int/ gho/athena/data/GHO/NCD_BMI_25A?flter=AGEGROUP:*;COUNTRY*;SEX*&xsideaxis=COUNTRY&xtopaxis=YEAR;GHO;AGEGROUP; SEX&profle=crosstable&format=csv>, accessed on 15 January 2018.14 Ibid.
UNICEFUrban Child Poverty Report
49The StudyMalnutrition
Figure 7.1: Snapshot of malnutrition in children10
NormalNormal weight and
height
WastingThinner than
normal
Wasting and stuntedThinner and shorter
than normal
StuntedShorter than
normal
Malnutrition is another form of deprivation. In this study, the prevalence of underweight, stunting and wasting among children aged below 5 are two times higher compared to the KL average. The prevalence of overweight however is almost six times higher (23%) compared to the KL average (4%).
Wasting Stunting
OverweightUnderweight Obese(Children and adolescents
aged 5 to 19)
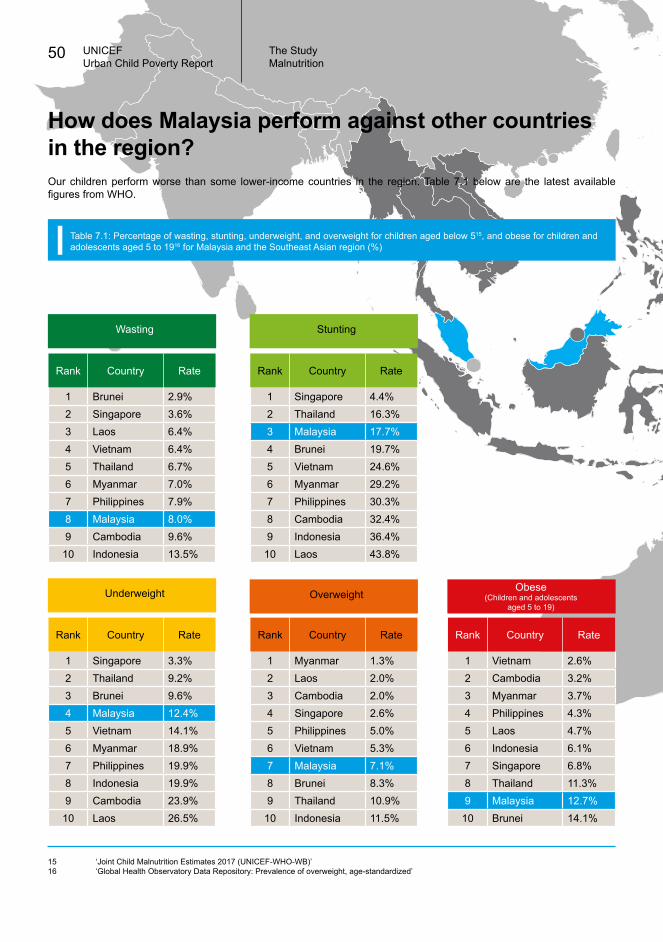
Table 7.1: Percentage of wasting, stunting, underweight, and overweight for children aged below 515, and obese for children and adolescents aged 5 to 1916 for Malaysia and the Southeast Asian region (%)
UNICEFUrban Child Poverty Report
50 The Study
Our children perform worse than some lower-income countries in the region. Table 7.1 below are the latest available figures from WHO.
How does Malaysia perform against other countries in the region?
Rank Country Rate
1 Brunei 2.9%2 Singapore 3.6%3 Laos 6.4%4 Vietnam 6.4%5 Thailand 6.7%6 Myanmar 7.0%7 Philippines 7.9%8 Malaysia 8.0%9 Cambodia 9.6%10 Indonesia 13.5%
Rank Country Rate
1 Singapore 4.4%2 Thailand 16.3%3 Malaysia 17.7%4 Brunei 19.7%5 Vietnam 24.6%6 Myanmar 29.2%7 Philippines 30.3%8 Cambodia 32.4%9 Indonesia 36.4%10 Laos 43.8%
Rank Country Rate
1 Singapore 3.3%2 Thailand 9.2%3 Brunei 9.6%4 Malaysia 12.4%5 Vietnam 14.1%6 Myanmar 18.9%7 Philippines 19.9%8 Indonesia 19.9%9 Cambodia 23.9%10 Laos 26.5%
Rank Country Rate
1 Myanmar 1.3%2 Laos 2.0%3 Cambodia 2.0%4 Singapore 2.6%5 Philippines 5.0%6 Vietnam 5.3%7 Malaysia 7.1%8 Brunei 8.3%9 Thailand 10.9%10 Indonesia 11.5%
Rank Country Rate
1 Vietnam 2.6%2 Cambodia 3.2%3 Myanmar 3.7%4 Philippines 4.3%5 Laos 4.7%6 Indonesia 6.1%7 Singapore 6.8%8 Thailand 11.3%9 Malaysia 12.7%10 Brunei 14.1%
Malnutrition
15 ‘Joint Child Malnutrition Estimates 2017 (UNICEF-WHO-WB)’16 ‘Global Health Observatory Data Repository: Prevalence of overweight, age-standardized’
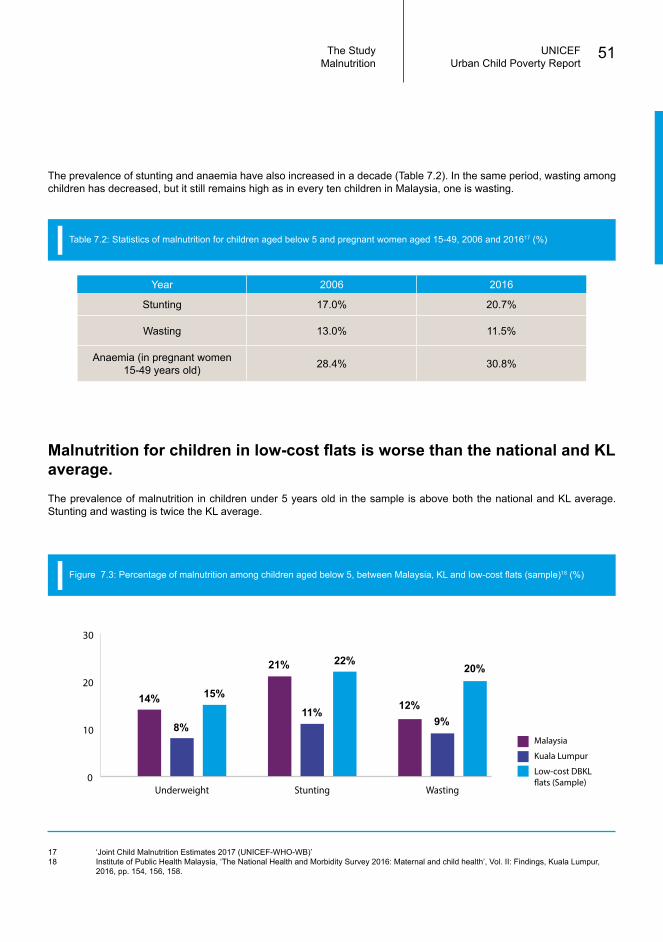
The prevalence of stunting and anaemia have also increased in a decade (Table 7.2). In the same period, wasting among children has decreased, but it still remains high as in every ten children in Malaysia, one is wasting.
Table 7.2: Statistics of malnutrition for children aged below 5 and pregnant women aged 15-49, 2006 and 201617 (%)
Year 2006 2016
Stunting 17.0% 20.7%
Wasting 13.0% 11.5%
Anaemia (in pregnant women 15-49 years old) 28.4% 30.8%
UNICEFUrban Child Poverty Report
51The StudyMalnutrition
Figure 7.3: Percentage of malnutrition among children aged below 5, between Malaysia, KL and low-cost flats (sample)18 (%)
0
10
20
30
WastingStuntingUnderweight
Malaysia
Kuala Lumpur
Low-cost DBKL�ats (Sample)
14%
8%
15%
21%
11%
22%
12%9%
20%
Malnutrition for children in low-cost flats is worse than the national and KL average.The prevalence of malnutrition in children under 5 years old in the sample is above both the national and KL average. Stunting and wasting is twice the KL average.
17 ‘Joint Child Malnutrition Estimates 2017 (UNICEF-WHO-WB)’18 Institute of Public Health Malaysia, ‘The National Health and Morbidity Survey 2016: Maternal and child health’, Vol. II: Findings, Kuala Lumpur, 2016, pp. 154, 156, 158.
0
20
40
60
80
100
Weight-for-age status
Normal
Underweight
Severly underweight
Overweight
0
20
40
60
80
100
Height-for-age status
Normal
Stunting
Severely stunting
Tall
0
20
40
60
80
100
Weight-for-height status
Normal
Wasting
Severely wasting
Overweight
Obese
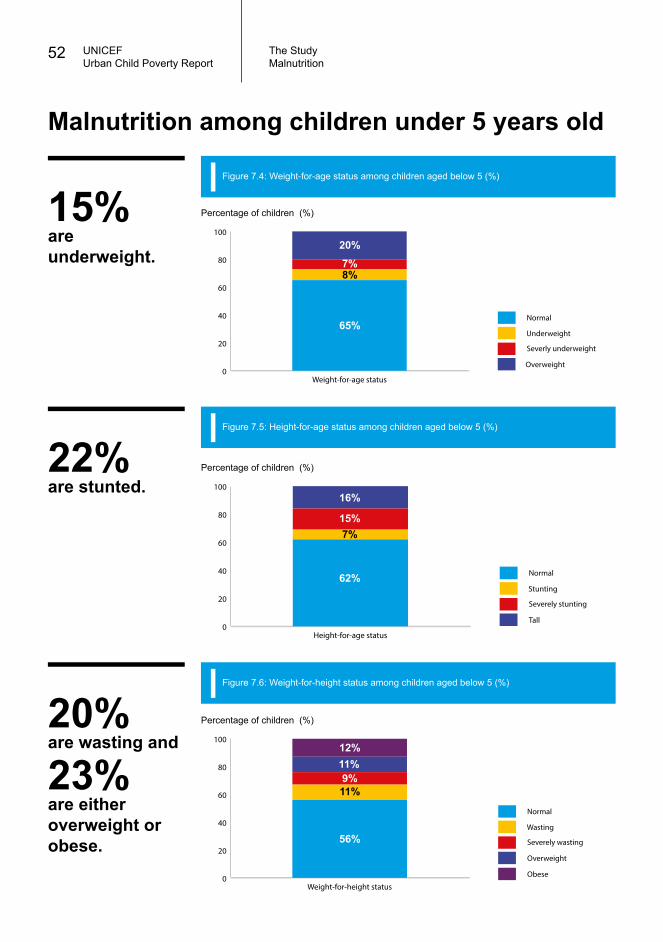
15%are underweight.
22%are stunted.
Percentage of children (%)
Percentage of children (%)
Percentage of children (%)
Figure 7.4: Weight-for-age status among children aged below 5 (%)
Figure 7.5: Height-for-age status among children aged below 5 (%)
20%are wasting and
23%are either overweight or obese.
Figure 7.6: Weight-for-height status among children aged below 5 (%)
20%
16%
11%12%
7%
15%
9%
8%
7%
11%
65%
62%
56%
UNICEFUrban Child Poverty Report
52 The StudyMalnutrition
Malnutrition among children under 5 years old
0
20
40
60
80
100
4 years old2 years old
Normal
Stunting
Severely stunting
Tall
0
20
40
60
80
100
4 years old2 years old
Normal
Underweight
Severly underweight
Overweight
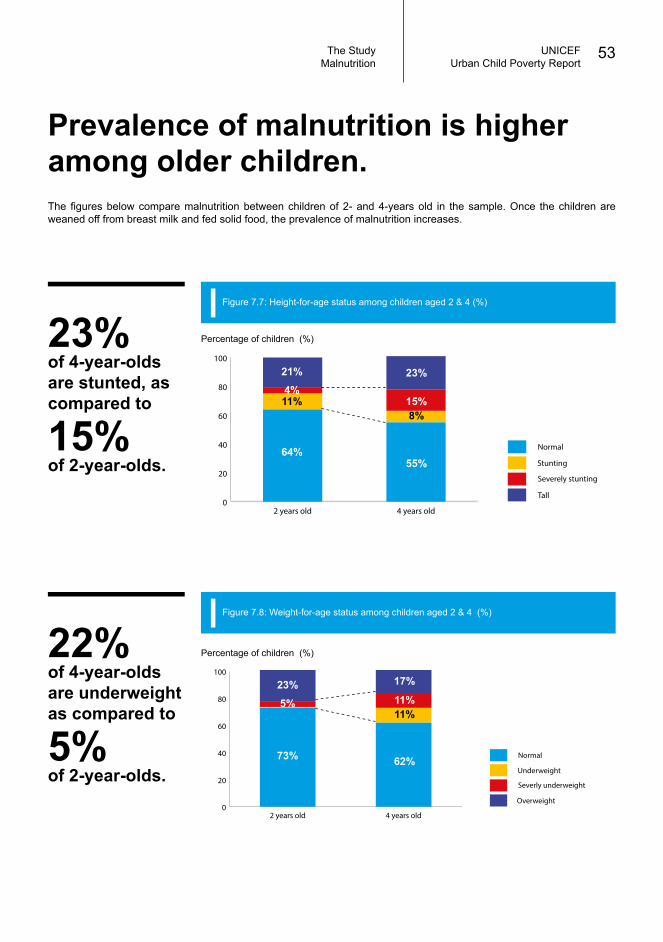
23%of 4-year-olds are stunted, as compared to
15%of 2-year-olds.
22%of 4-year-olds are underweight as compared to
5%of 2-year-olds.
Percentage of children (%)
Percentage of children (%)
Figure 7.7: Height-for-age status among children aged 2 & 4 (%)
Figure 7.8: Weight-for-age status among children aged 2 & 4 (%)
21%4%11%
64%
23%
15%8%
55%
23%5%
73%
17%11%11%
62%
Prevalence of malnutrition is higher among older children.The figures below compare malnutrition between children of 2- and 4-years old in the sample. Once the children are weaned off from breast milk and fed solid food, the prevalence of malnutrition increases.
UNICEFUrban Child Poverty Report
53The StudyMalnutrition
0
20
40
60
80
100
4 years old2 years old
Normal
Wasting
Severely wasting
Overweight
Obese
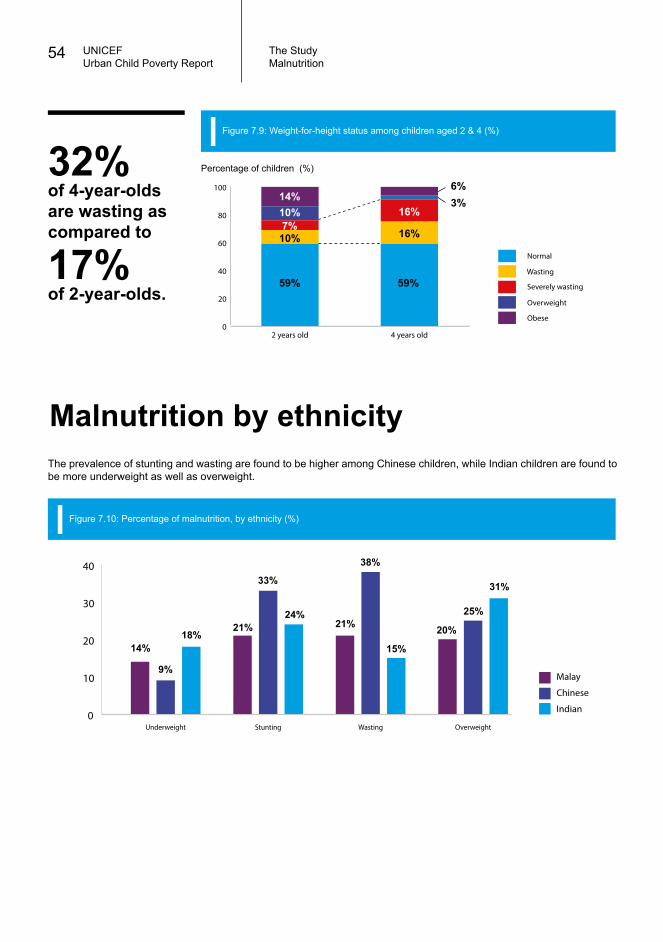
Percentage of children (%)32%of 4-year-olds are wasting as compared to
17%of 2-year-olds.
Figure 7.9: Weight-for-height status among children aged 2 & 4 (%)
10%14% 3%
6%
7%16%
10% 16%
59% 59%
UNICEFUrban Child Poverty Report
54 The StudyMalnutrition
0
10
20
30
40
OverweightWastingStuntingUnderweight
Malay
Chinese
Indian
14%
9%
18% 20%21%25%
33% 31%
24%21%
15%
38%
Figure 7.10: Percentage of malnutrition, by ethnicity (%)
Malnutrition by ethnicityThe prevalence of stunting and wasting are found to be higher among Chinese children, while Indian children are found to be more underweight as well as overweight.
UNICEFUrban Child Poverty Report
55The StudyDoes size matter?
The objective of this paper is to investigate ‘health poverty’ among children (5-17 years old) living in an Urban Vulnerable Group (UVG) household. Does the size of the child from UVG household matter? Do bigger and heavier children mean they have better access to food and nutrition, or the contrary?
The Economic Planning Unit defines the UVG as a group of people who are vulnerable to crisis and economic uncertainties, have low income, low education and are often engaged in low-skill and less productive sectors. Childhood obesity is a global phenomenon and is becoming more prevalent in a rapidly urbanising country like Malaysia. Obesity is a physical condition where body weight increases by consuming more energy than expending it. It impairs health and curtails longevity, leading to severe health risks, namely non-communicable diseases like cardiovascular disease, diabetes mellitus and cancer.
The obesity prevalence in Malaysia accelerated post-1990, where Malaysians generally prefer passive modes of transport and leisure activities that require minimal physical energy. The prevalence of obesity among Malaysian children between the ages 5 and 19 is higher than the global prevalence. It is also found that by strata, urban areas have more overweight and obese children at 19.1% compared to children in rural areas at 16.5-17.5%20. Corresponding with this fact is the increasingly ubiquitous trend of food away-from-home, which is becoming a major diet component in most rapidly-urbanising countries. The longer work hours and distance from home to work compel people to consume food outside their homes.
The Department of Statistics reports a steady increase in the food away-from-home index, the most recent being an increase of 3.3% in October 2016. A food away-from-home is associated with higher energy and fat intake and lower micronutrient intake and this could lead to increased prevalence of obesity. As processed food becomes more widely available, diet becomes more laden with high calories and sugar. Coupled with an inactive lifestyle, the modern diet is the ideal recipe for chronic diseases especially among the poor. A survey among teenagers in Egypt revealed that more than 50% consume one or more sweet carbonated beverages daily while close to 90% did not participate in regular physical exercise21.
This study found that the highest prevalence of overweight and obesity occurred among children of Chinese ethnicity (17.3%), followed by Malay (17.2%), Indian (16%) and other Bumiputera (16%). When it comes to obesity, Chinese children ranked highest at 19%, followed by Indian (18%), Malay (17%), and other Bumiputera (16%). The size of family also matters as larger households are about 12% and 7% more likely to have overweight and obese kids. By adults nutritional status, households with heavier adults also are approximately 5.3% and 10% more likely to have overweight and obese kids respectively. By income, families under the UVG category are about 5% less likely to have obese kids. By education of the parents, higher educated parents/HOHs have 3% lower possibility of having obese kids in their households. Households led by single-parents are also more likely to have overweight and obese children.
Although the results do not explicitly specify that UVG households are likely to have overweight and obese children, this group cannot be overlooked. Given that most single-parent led households are in the UVG category, suffice to say that the overweight and obesity issue among the UVGs households is becoming more prevalent.
This trend is similar to the experience of developed countries during their rapid urbanisation stage. It confirms the notion that obesity not only plagues the affluent, but pervades all levels of society. Though currently not at alarming levels, it should be an indication of future trends if left unheeded. Especially when access to healthy fresh produce is increasingly limited, in terms of availability and affordability, compared to mass-produced, calorie- and energy-denseprocessed foods.
Does size matter? Yes, it does.19
A summary of the winning paper for the Student Research Award titled "Urban Child Poverty: Does Size Matter?" by Sudha Sivadas and Normaz Wana Ismail from the Faculty of Economics and Management, Universiti Putra Malaysia. Details of this programme can be found in page 69.
19 Ismail, Normaz W., Sudha Sivadas, Urban Child Poverty: Does size matter?, Universiti Putra Malaysia, November 2017, pp. 3020 Institute of Public Health Malaysia, ‘The National Health and Morbidity Survey 2015’, Vol. II: Non-communicable diseases, risk factors & other health problems, Kuala Lumpur, 2015, p. 78.21 Lobstein, Tim, et al., ‘Child and Adolescent Obesity: Part of a bigger picture’, The Lancet, vol. 385, no. 9986, 20 June 2015
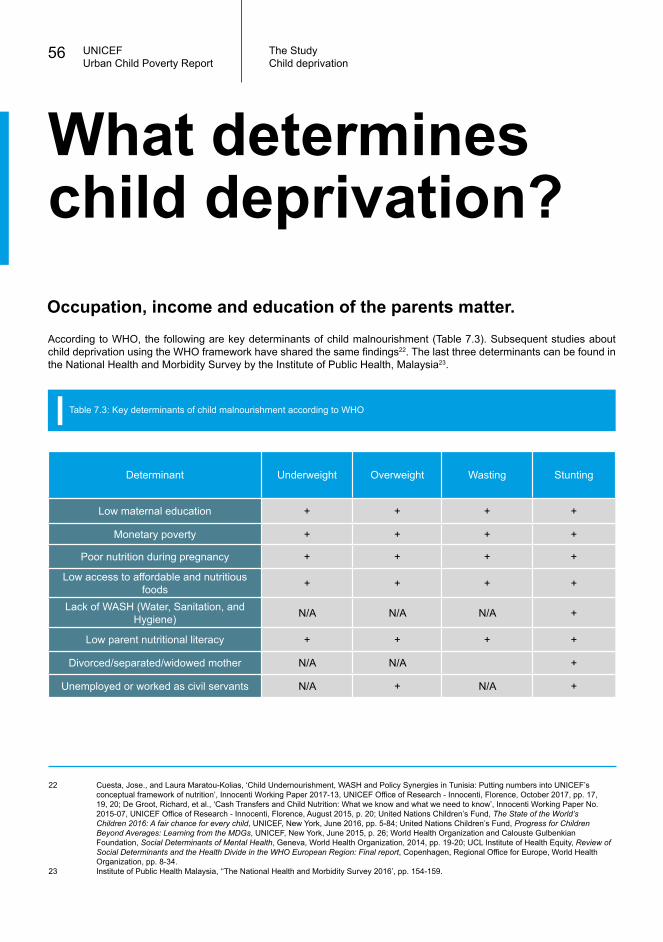
Determinant Underweight Overweight Wasting Stunting
Low maternal education + + + +
Monetary poverty + + + +
Poor nutrition during pregnancy + + + +
Low access to affordable and nutritious foods + + + +
Lack of WASH (Water, Sanitation, and Hygiene) N/A N/A N/A +
Low parent nutritional literacy + + + +
Divorced/separated/widowed mother N/A N/A +
Unemployed or worked as civil servants N/A + N/A +
22 Cuesta, Jose., and Laura Maratou-Kolias, ‘Child Undernourishment, WASH and Policy Synergies in Tunisia: Putting numbers into UNICEF’s conceptual framework of nutrition’, Innocenti Working Paper 2017-13, UNICEF Office of Research - Innocenti, Florence, October 2017, pp. 17, 19, 20; De Groot, Richard, et al., ‘Cash Transfers and Child Nutrition: What we know and what we need to know’, Innocenti Working Paper No. 2015-07, UNICEF Office of Research - Innocenti, Florence, August 2015, p. 20; United Nations Children’s Fund, The State of the World’s Children 2016: A fair chance for every child, UNICEF, New York, June 2016, pp. 5-84; United Nations Children’s Fund, Progress for Children Beyond Averages: Learning from the MDGs, UNICEF, New York, June 2015, p. 26; World Health Organization and Calouste Gulbenkian Foundation, Social Determinants of Mental Health, Geneva, World Health Organization, 2014, pp. 19-20; UCL Institute of Health Equity, Review of Social Determinants and the Health Divide in the WHO European Region: Final report, Copenhagen, Regional Office for Europe, World Health Organization, pp. 8-34.23 Institute of Public Health Malaysia, ‘‘The National Health and Morbidity Survey 2016’, pp. 154-159.
UNICEFUrban Child Poverty Report
56 The Study
What determines child deprivation?
Child deprivation
According to WHO, the following are key determinants of child malnourishment (Table 7.3). Subsequent studies about child deprivation using the WHO framework have shared the same findings22. The last three determinants can be found in the National Health and Morbidity Survey by the Institute of Public Health, Malaysia23.
Occupation, income and education of the parents matter.
Table 7.3: Key determinants of child malnourishment according to WHO
© U
NIC
EF M
alay
sia/
2017
Muh
amad
Ada
m F
itri A
zrul
Azl
am
UNICEFUrban Child Poverty Report
57Di Sebalik TabirEnumerator's Experiences
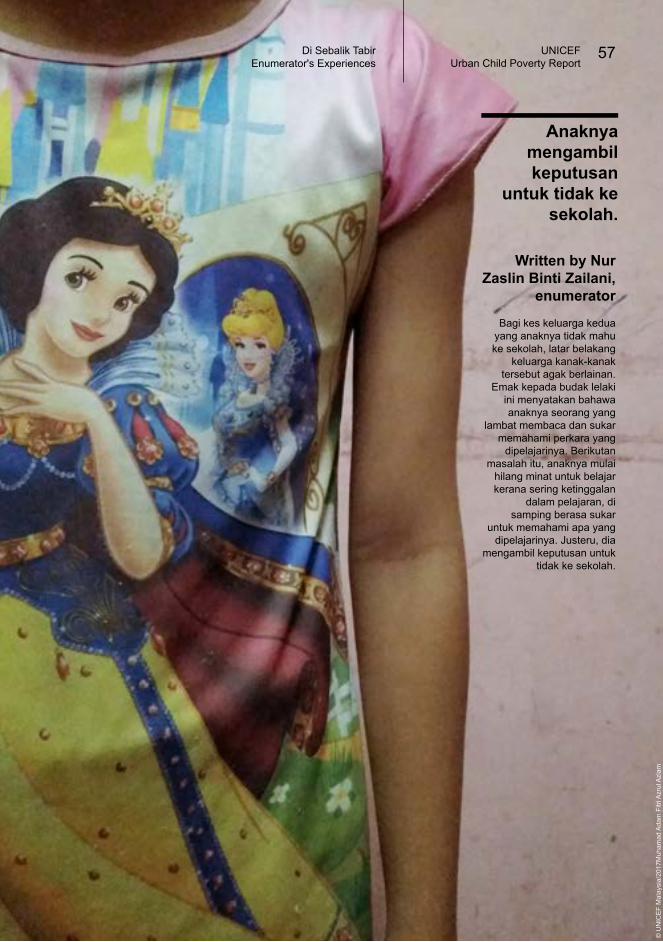
Bagi kes keluarga kedua yang anaknya tidak mahu ke sekolah, latar belakang
keluarga kanak-kanak tersebut agak berlainan.
Emak kepada budak lelaki ini menyatakan bahawa anaknya seorang yang
lambat membaca dan sukar memahami perkara yang
dipelajarinya. Berikutan masalah itu, anaknya mulai
hilang minat untuk belajar kerana sering ketinggalan
dalam pelajaran, di samping berasa sukar
untuk memahami apa yang dipelajarinya. Justeru, dia
mengambil keputusan untuk tidak ke sekolah.
Anaknya mengambil keputusan
untuk tidak ke sekolah.
Written by Nur Zaslin Binti Zailani,
enumerator
UNICEFUrban Child Poverty Report
58 Di Sebalik TabirEnumerator's Experiences
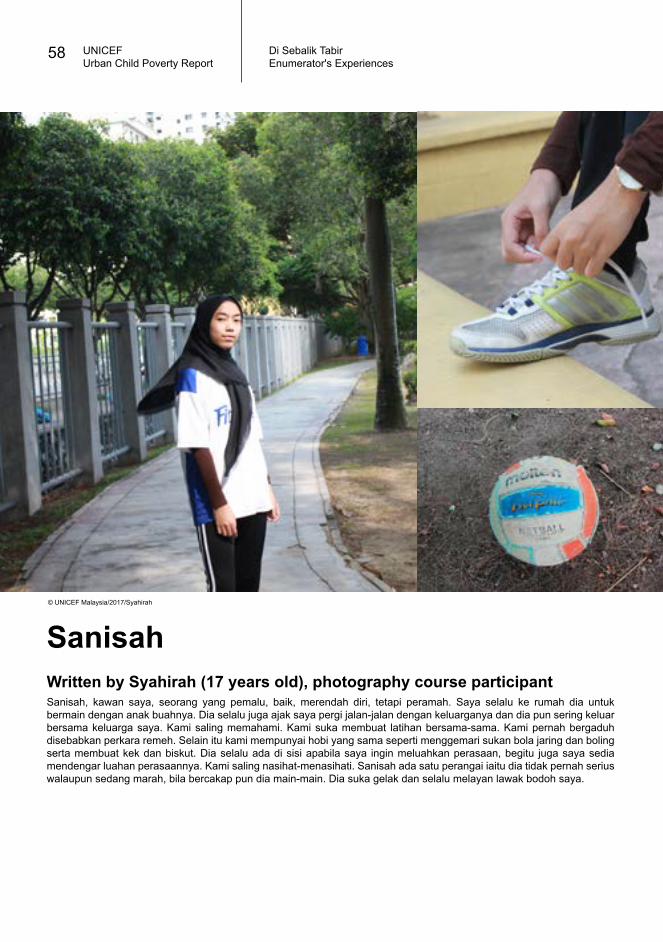
Sanisah
Sanisah, kawan saya, seorang yang pemalu, baik, merendah diri, tetapi peramah. Saya selalu ke rumah dia untuk bermain dengan anak buahnya. Dia selalu juga ajak saya pergi jalan-jalan dengan keluarganya dan dia pun sering keluar bersama keluarga saya. Kami saling memahami. Kami suka membuat latihan bersama-sama. Kami pernah bergaduh disebabkan perkara remeh. Selain itu kami mempunyai hobi yang sama seperti menggemari sukan bola jaring dan boling serta membuat kek dan biskut. Dia selalu ada di sisi apabila saya ingin meluahkan perasaan, begitu juga saya sedia mendengar luahan perasaannya. Kami saling nasihat-menasihati. Sanisah ada satu perangai iaitu dia tidak pernah serius walaupun sedang marah, bila bercakap pun dia main-main. Dia suka gelak dan selalu melayan lawak bodoh saya.
Written by Syahirah (17 years old), photography course participant
© UNICEF Malaysia/2017/Syahirah
Policy Recommendations
IntroductionThe Study
Income, Transfers and SavingsLiving Standards
Education and NutritionPoverty and Deprivation
MalnutritionPolicy Recommendations
Programme ReportsAppendices and References
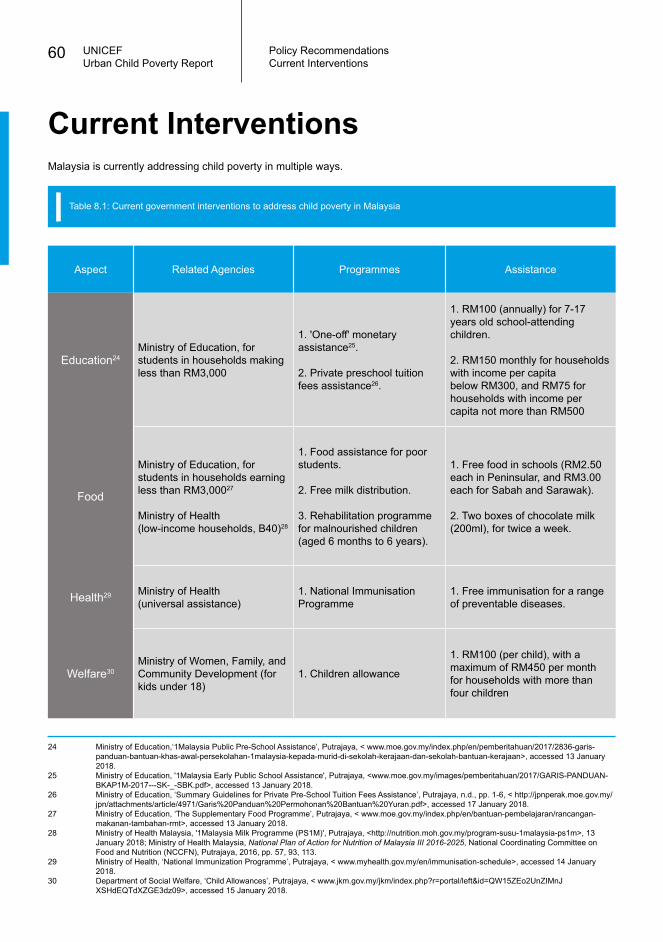
Table 8.1: Current government interventions to address child poverty in Malaysia
Aspect Related Agencies Programmes Assistance
Education24Ministry of Education, for students in households making less than RM3,000
1. 'One-off' monetary assistance25.
2. Private preschool tuition fees assistance26.
1. RM100 (annually) for 7-17 years old school-attending children.
2. RM150 monthly for households with income per capita below RM300, and RM75 for households with income per capita not more than RM500
Food
Ministry of Education, for students in households earning less than RM3,00027
Ministry of Health(low-income households, B40)28
1. Food assistance for poor students.
2. Free milk distribution.
3. Rehabilitation programme for malnourished children (aged 6 months to 6 years).
1. Free food in schools (RM2.50 each in Peninsular, and RM3.00 each for Sabah and Sarawak).
2. Two boxes of chocolate milk (200ml), for twice a week.
Health29 Ministry of Health(universal assistance)
1. National Immunisation Programme
1. Free immunisation for a range of preventable diseases.
Welfare30Ministry of Women, Family, and Community Development (for kids under 18)
1. Children allowance
1. RM100 (per child), with a maximum of RM450 per month for households with more than four children
Malaysia is currently addressing child poverty in multiple ways.
Current Interventions
24 Ministry of Education,‘1Malaysia Public Pre-School Assistance’, Putrajaya, < www.moe.gov.my/index.php/en/pemberitahuan/2017/2836-garis- panduan-bantuan-khas-awal-persekolahan-1malaysia-kepada-murid-di-sekolah-kerajaan-dan-sekolah-bantuan-kerajaan>, accessed 13 January 2018. 25 Ministry of Education, '1Malaysia Early Public School Assistance', Putrajaya, <www.moe.gov.my/images/pemberitahuan/2017/GARIS-PANDUAN- BKAP1M-2017---SK-_-SBK.pdf>, accessed 13 January 2018.26 Ministry of Education, ‘Summary Guidelines for Private Pre-School Tuition Fees Assistance’, Putrajaya, n.d., pp. 1-6, < http://jpnperak.moe.gov.my/ jpn/attachments/article/4971/Garis%20Panduan%20Permohonan%20Bantuan%20Yuran.pdf>, accessed 17 January 2018.27 Ministry of Education, ‘The Supplementary Food Programme’, Putrajaya, < www.moe.gov.my/index.php/en/bantuan-pembelajaran/rancangan- makanan-tambahan-rmt>, accessed 13 January 2018.28 Ministry of Health Malaysia, '1Malaysia Milk Programme (PS1M)', Putrajaya, <http://nutrition.moh.gov.my/program-susu-1malaysia-ps1m>, 13 January 2018; Ministry of Health Malaysia, National Plan of Action for Nutrition of Malaysia III 2016-2025, National Coordinating Committee on Food and Nutrition (NCCFN), Putrajaya, 2016, pp. 57, 93, 113.29 Ministry of Health, ‘National Immunization Programme’, Putrajaya, < www.myhealth.gov.my/en/immunisation-schedule>, accessed 14 January 2018. 30 Department of Social Welfare, ‘Child Allowances’, Putrajaya, < www.jkm.gov.my/jkm/index.php?r=portal/left&id=QW15ZEo2UnZIMnJ XSHdEQTdXZGE3dz09>, accessed 15 January 2018.
UNICEFUrban Child Poverty Report
60 Policy RecommendationsCurrent Interventions
31 United Nations Children’s Fund, Public Finance and Social Budgeting, learning Module, UNICEF, New York, 2011.
UNICEFUrban Child Poverty Report
61Policy RecommendationsMoving forward
Policy Recommendations
As mentioned earlier in the report, Malaysia already has access to primary school education for all, access to healthcare for all and existing targeted programmes for children from poor households as well as targeted programmes for poor households. Yet, the challenges still continue especially for children from low income households and marginalised groups. The data clearly shows how poverty and intersecting inequalities affects a child’s vulnerability towards social mobility and social exclusion. Hence, the best way forward in ensuring that every child in Malaysia has an equal head start is by providing a social protection floor for all. This is a set of public actions which address not only income poverty and economic shocks, but also social vulnerability, thus taking into account the inter-relationship between exclusion and poverty. In recent years, social protection has emerged as a major new focus in efforts to reduce poverty around the world. Through income support and programmes designed to increase access to services (such as health, education and nutrition), social protection helps realize the human rights of children and families. Social protection strategies are also a crucial element of effective policy responses to adverse economic conditions, addressing not only vulnerabilities caused by current conditions but also strengthens preparedness to future uncertainty.
Child-sensitive social protection systems mitigate the effects of poverty on families, strengthen families in their child care role, and enhance access to basic services for the poorest and most marginalised. Since many at-risk children also live outside family care, child-sensitive social protection systems must be responsive to this vulnerable group, as well as to children facing abuse or discrimination at home.
Within an overarching social protection system, child sensitive policies should target the following issues in Table 8.2.
Social Protection Floor
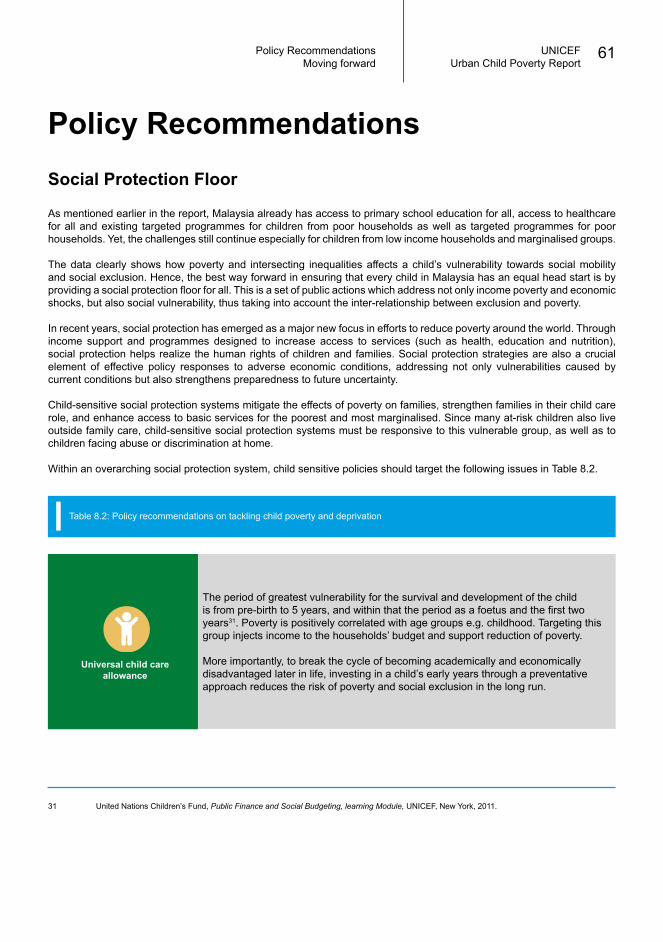
Table 8.2: Policy recommendations on tackling child poverty and deprivation
The period of greatest vulnerability for the survival and development of the child is from pre-birth to 5 years, and within that the period as a foetus and the first two years31. Poverty is positively correlated with age groups e.g. childhood. Targeting this group injects income to the households’ budget and support reduction of poverty.
More importantly, to break the cycle of becoming academically and economically disadvantaged later in life, investing in a child’s early years through a preventative approach reduces the risk of poverty and social exclusion in the long run.
Universal child care allowance
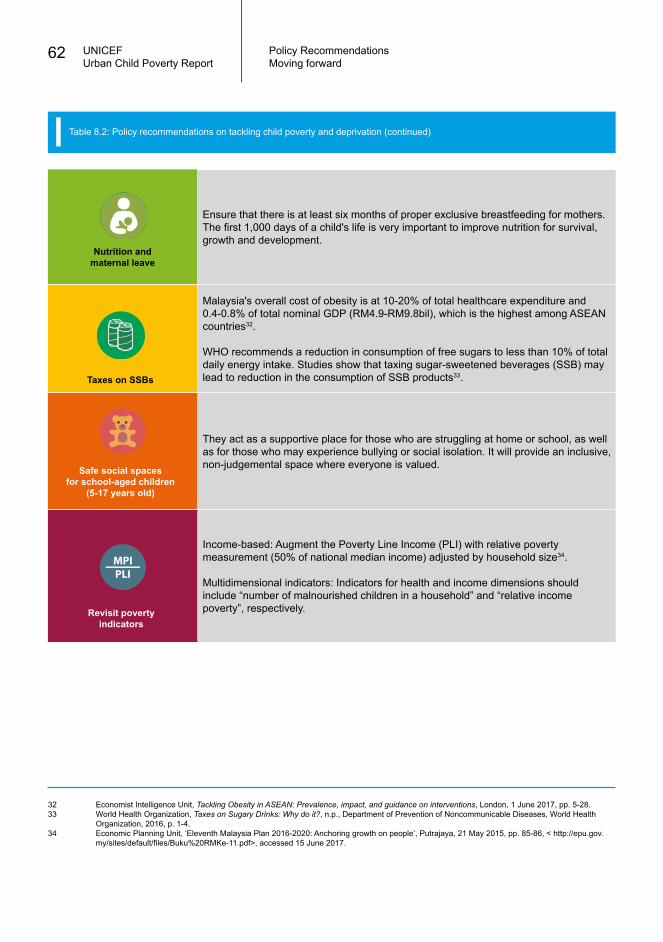
32 Economist Intelligence Unit, Tackling Obesity in ASEAN: Prevalence, impact, and guidance on interventions, London, 1 June 2017, pp. 5-28.33 World Health Organization, Taxes on Sugary Drinks: Why do it?, n.p., Department of Prevention of Noncommunicable Diseases, World Health Organization, 2016, p. 1-4.34 Economic Planning Unit, ‘Eleventh Malaysia Plan 2016-2020: Anchoring growth on people’, Putrajaya, 21 May 2015, pp. 85-86, < http://epu.gov. my/sites/default/files/Buku%20RMKe-11.pdf>, accessed 15 June 2017.
UNICEFUrban Child Poverty Report
62 Policy Recommendations
Ensure that there is at least six months of proper exclusive breastfeeding for mothers. The first 1,000 days of a child's life is very important to improve nutrition for survival, growth and development.
Malaysia's overall cost of obesity is at 10-20% of total healthcare expenditure and 0.4-0.8% of total nominal GDP (RM4.9-RM9.8bil), which is the highest among ASEAN countries32.
WHO recommends a reduction in consumption of free sugars to less than 10% of total daily energy intake. Studies show that taxing sugar-sweetened beverages (SSB) may lead to reduction in the consumption of SSB products33.
They act as a supportive place for those who are struggling at home or school, as well as for those who may experience bullying or social isolation. It will provide an inclusive, non-judgemental space where everyone is valued.
Income-based: Augment the Poverty Line Income (PLI) with relative poverty measurement (50% of national median income) adjusted by household size34.
Multidimensional indicators: Indicators for health and income dimensions should include “number of malnourished children in a household” and “relative income poverty”, respectively.
Taxes on SSBs
Revisit poverty indicators
Safe social spacesfor school-aged children
(5-17 years old)
MPIPLI
Nutrition andmaternal leave
MPIPLI
Table 8.2: Policy recommendations on tackling child poverty and deprivation (continued)
Moving forward
Programme Reports
IntroductionThe Study
Income, Transfers and SavingsLiving Standards
Education and NutritionPoverty and Deprivation
MalnutritionPolicy Recommendations
Programme ReportsAppendices and References
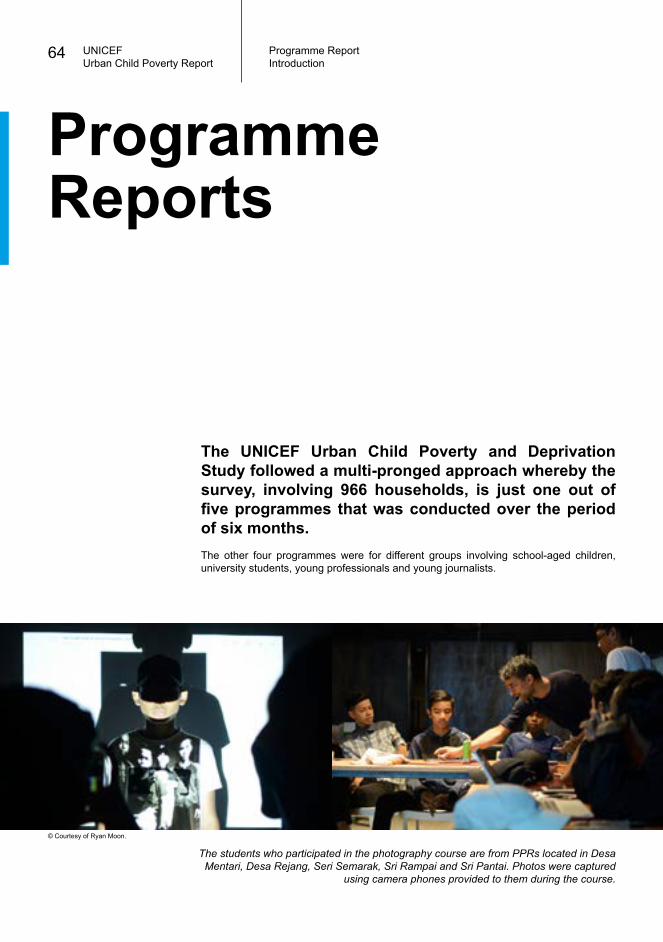
UNICEFUrban Child Poverty Report
64 Programme Report
Programme Reports
The UNICEF Urban Child Poverty and Deprivation Study followed a multi-pronged approach whereby the survey, involving 966 households, is just one out of five programmes that was conducted over the period of six months.The other four programmes were for different groups involving school-aged children, university students, young professionals and young journalists.
The students who participated in the photography course are from PPRs located in Desa Mentari, Desa Rejang, Seri Semarak, Sri Rampai and Sri Pantai. Photos were captured
using camera phones provided to them during the course.
Introduction
© Courtesy of Ryan Moon.
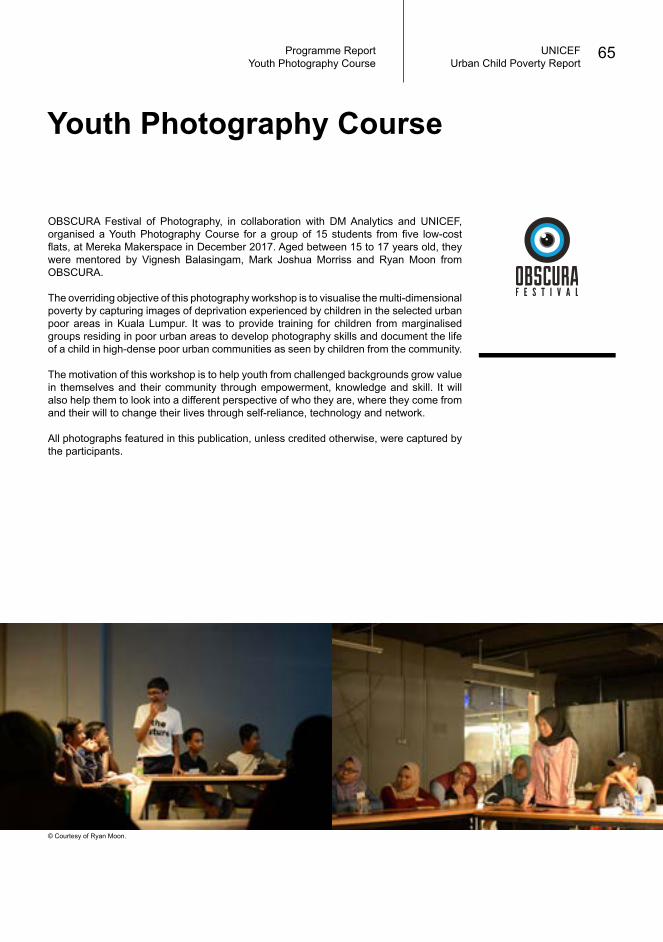
UNICEFUrban Child Poverty Report
65Programme Report
Youth Photography Course
Youth Photography Course
OBSCURA Festival of Photography, in collaboration with DM Analytics and UNICEF, organised a Youth Photography Course for a group of 15 students from five low-cost flats, at Mereka Makerspace in December 2017. Aged between 15 to 17 years old, they were mentored by Vignesh Balasingam, Mark Joshua Morriss and Ryan Moon from OBSCURA.
The overriding objective of this photography workshop is to visualise the multi-dimensional poverty by capturing images of deprivation experienced by children in the selected urban poor areas in Kuala Lumpur. It was to provide training for children from marginalised groups residing in poor urban areas to develop photography skills and document the life of a child in high-dense poor urban communities as seen by children from the community.
The motivation of this workshop is to help youth from challenged backgrounds grow value in themselves and their community through empowerment, knowledge and skill. It will also help them to look into a different perspective of who they are, where they come from and their will to change their lives through self-reliance, technology and network.
All photographs featured in this publication, unless credited otherwise, were captured by the participants.
© Courtesy of Ryan Moon.
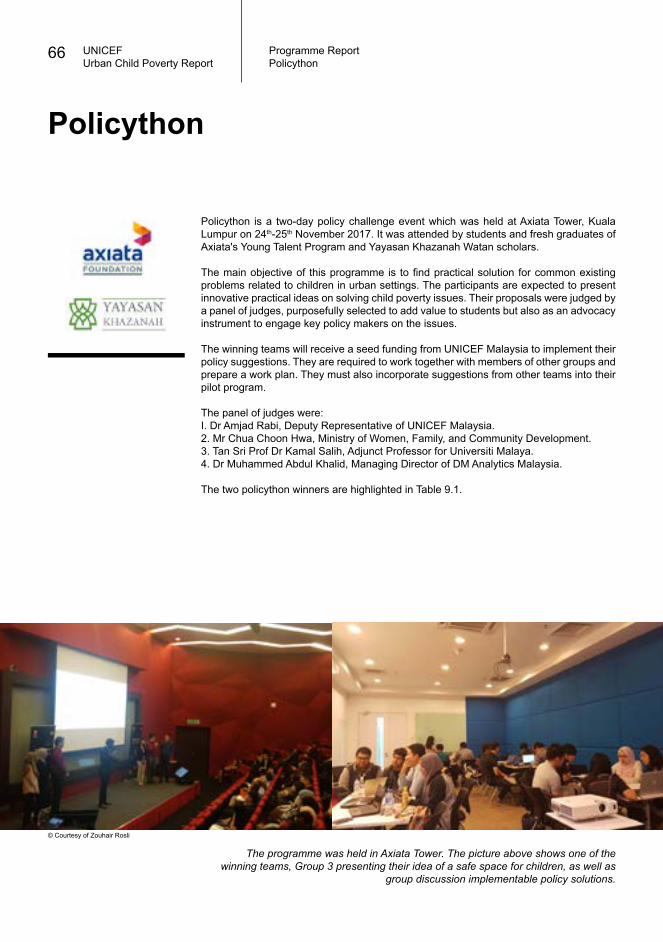
UNICEFUrban Child Poverty Report
66 Programme Report
Policython
Policython
Policython is a two-day policy challenge event which was held at Axiata Tower, Kuala Lumpur on 24th-25th November 2017. It was attended by students and fresh graduates of Axiata's Young Talent Program and Yayasan Khazanah Watan scholars.
The main objective of this programme is to find practical solution for common existing problems related to children in urban settings. The participants are expected to present innovative practical ideas on solving child poverty issues. Their proposals were judged by a panel of judges, purposefully selected to add value to students but also as an advocacy instrument to engage key policy makers on the issues.
The winning teams will receive a seed funding from UNICEF Malaysia to implement their policy suggestions. They are required to work together with members of other groups and prepare a work plan. They must also incorporate suggestions from other teams into their pilot program.
The panel of judges were: I. Dr Amjad Rabi, Deputy Representative of UNICEF Malaysia.2. Mr Chua Choon Hwa, Ministry of Women, Family, and Community Development.3. Tan Sri Prof Dr Kamal Salih, Adjunct Professor for Universiti Malaya.4. Dr Muhammed Abdul Khalid, Managing Director of DM Analytics Malaysia.
The two policython winners are highlighted in Table 9.1.
The programme was held in Axiata Tower. The picture above shows one of the winning teams, Group 3 presenting their idea of a safe space for children, as well as
group discussion implementable policy solutions.
© Courtesy of Zouhair Rosli
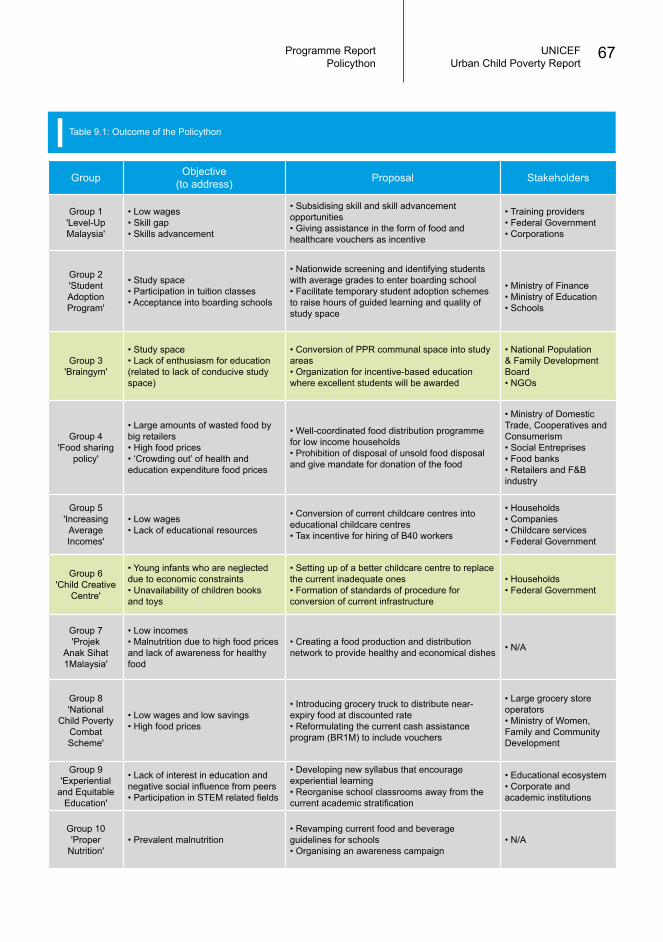
UNICEFUrban Child Poverty Report
67Programme ReportPolicython
Group Objective(to address) Proposal Stakeholders
Group 1'Level-Up Malaysia'
• Low wages• Skill gap• Skills advancement
• Subsidising skill and skill advancement opportunities• Giving assistance in the form of food and healthcare vouchers as incentive
• Training providers• Federal Government• Corporations
Group 2'Student Adoption Program'
• Study space• Participation in tuition classes• Acceptance into boarding schools
• Nationwide screening and identifying students with average grades to enter boarding school• Facilitate temporary student adoption schemes to raise hours of guided learning and quality of study space
• Ministry of Finance• Ministry of Education• Schools
Group 3'Braingym'
• Study space• Lack of enthusiasm for education (related to lack of conducive study space)
• Conversion of PPR communal space into study areas• Organization for incentive-based education where excellent students will be awarded
• National Population & Family Development Board• NGOs
Group 4'Food sharing
policy'
• Large amounts of wasted food by big retailers• High food prices• ‘Crowding out’ of health and education expenditure food prices
• Well-coordinated food distribution programme for low income households• Prohibition of disposal of unsold food disposal and give mandate for donation of the food
• Ministry of Domestic Trade, Cooperatives and Consumerism• Social Entreprises• Food banks• Retailers and F&B industry
Group 5'Increasing Average Incomes'
• Low wages• Lack of educational resources
• Conversion of current childcare centres into educational childcare centres• Tax incentive for hiring of B40 workers
• Households• Companies• Childcare services• Federal Government
Group 6'Child Creative
Centre'
• Young infants who are neglected due to economic constraints• Unavailability of children books and toys
• Setting up of a better childcare centre to replace the current inadequate ones• Formation of standards of procedure for conversion of current infrastructure
• Households• Federal Government
Group 7'Projek
Anak Sihat 1Malaysia'
• Low incomes• Malnutrition due to high food prices and lack of awareness for healthy food
• Creating a food production and distribution network to provide healthy and economical dishes • N/A
Group 8'National
Child Poverty Combat Scheme'
• Low wages and low savings• High food prices
• Introducing grocery truck to distribute near-expiry food at discounted rate• Reformulating the current cash assistance program (BR1M) to include vouchers
• Large grocery store operators• Ministry of Women, Family and Community Development
Group 9'Experiential
and Equitable Education'
• Lack of interest in education and negative social influence from peers• Participation in STEM related fields
• Developing new syllabus that encourage experiential learning• Reorganise school classrooms away from the current academic stratification
• Educational ecosystem• Corporate and academic institutions
Group 10'Proper
Nutrition'• Prevalent malnutrition
• Revamping current food and beverage guidelines for schools• Organising an awareness campaign
• N/A
Table 9.1: Outcome of the Policython
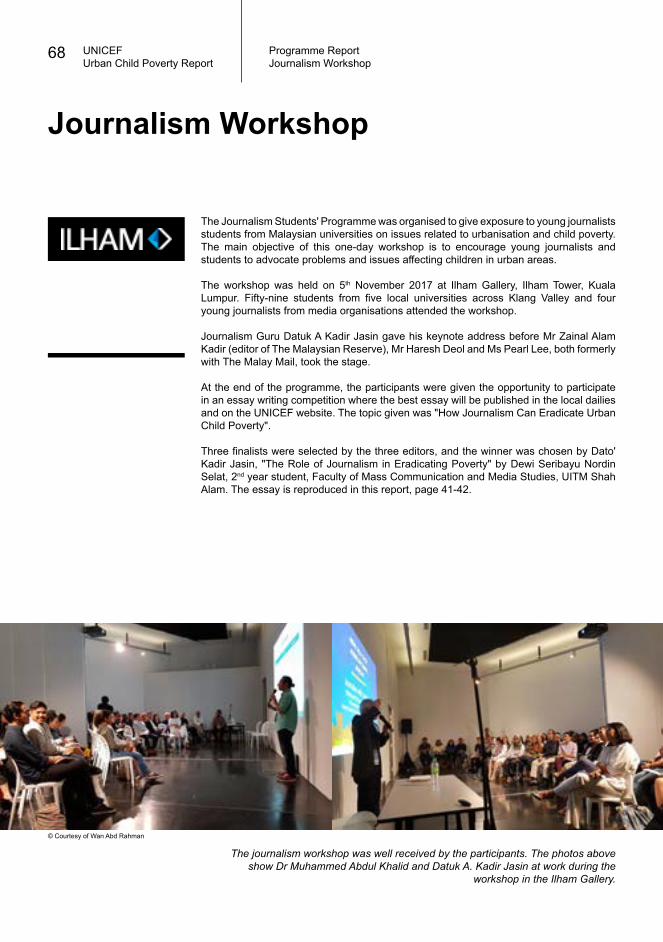
UNICEFUrban Child Poverty Report
68 Programme Report
Journalism Workshop
The Journalism Students' Programme was organised to give exposure to young journalists students from Malaysian universities on issues related to urbanisation and child poverty. The main objective of this one-day workshop is to encourage young journalists and students to advocate problems and issues affecting children in urban areas.
The workshop was held on 5th November 2017 at Ilham Gallery, Ilham Tower, Kuala Lumpur. Fifty-nine students from five local universities across Klang Valley and four young journalists from media organisations attended the workshop.
Journalism Guru Datuk A Kadir Jasin gave his keynote address before Mr Zainal Alam Kadir (editor of The Malaysian Reserve), Mr Haresh Deol and Ms Pearl Lee, both formerly with The Malay Mail, took the stage.
At the end of the programme, the participants were given the opportunity to participate in an essay writing competition where the best essay will be published in the local dailies and on the UNICEF website. The topic given was "How Journalism Can Eradicate Urban Child Poverty".
Three finalists were selected by the three editors, and the winner was chosen by Dato' Kadir Jasin, "The Role of Journalism in Eradicating Poverty" by Dewi Seribayu Nordin Selat, 2nd year student, Faculty of Mass Communication and Media Studies, UITM Shah Alam. The essay is reproduced in this report, page 41-42.
Journalism Workshop
The journalism workshop was well received by the participants. The photos above show Dr Muhammed Abdul Khalid and Datuk A. Kadir Jasin at work during the
workshop in the Ilham Gallery.
© Courtesy of Wan Abd Rahman
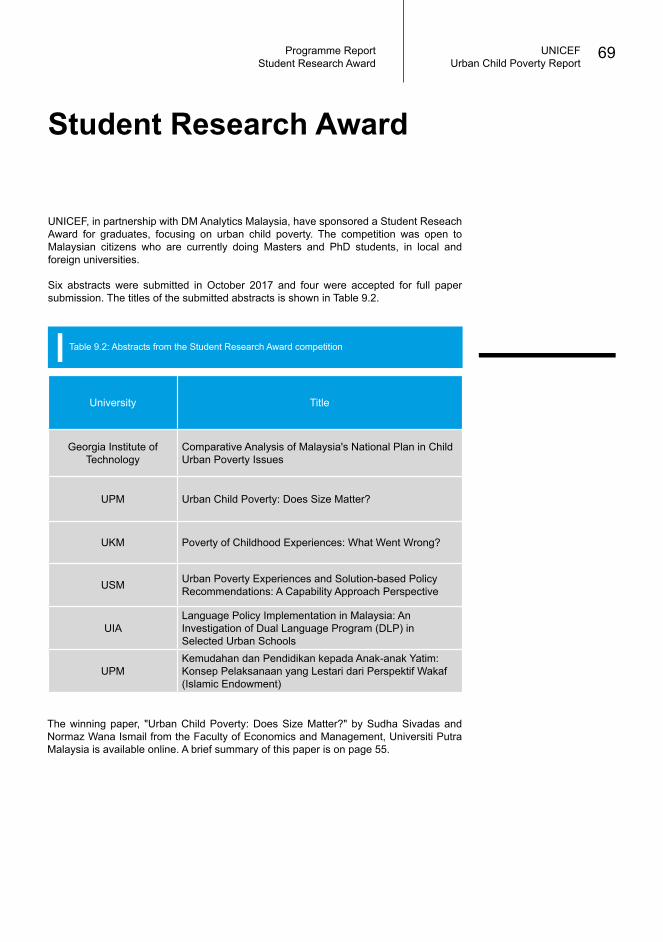
UNICEFUrban Child Poverty Report
69Programme Report
Student Research Award
Student Research Award
UNICEF, in partnership with DM Analytics Malaysia, have sponsored a Student Reseach Award for graduates, focusing on urban child poverty. The competition was open to Malaysian citizens who are currently doing Masters and PhD students, in local and foreign universities.
Six abstracts were submitted in October 2017 and four were accepted for full paper submission. The titles of the submitted abstracts is shown in Table 9.2.
The winning paper, "Urban Child Poverty: Does Size Matter?" by Sudha Sivadas and Normaz Wana Ismail from the Faculty of Economics and Management, Universiti Putra Malaysia is available online. A brief summary of this paper is on page 55.
University Title
Georgia Institute of Technology
Comparative Analysis of Malaysia's National Plan in Child Urban Poverty Issues
UPM Urban Child Poverty: Does Size Matter?
UKM Poverty of Childhood Experiences: What Went Wrong?
USM Urban Poverty Experiences and Solution-based Policy Recommendations: A Capability Approach Perspective
UIALanguage Policy Implementation in Malaysia: An Investigation of Dual Language Program (DLP) in Selected Urban Schools
UPMKemudahan dan Pendidikan kepada Anak-anak Yatim: Konsep Pelaksanaan yang Lestari dari Perspektif Wakaf (Islamic Endowment)
Table 9.2: Abstracts from the Student Research Award competition
Appendices and References
IntroductionThe Study
Income, Transfers and SavingsLiving Standards
Education and NutritionPoverty and Deprivation
MalnutritionPolicy Recommendations
Programme ReportsAppendices and References
35 Gordon, David, et al., Child Poverty in the Developing World, University of Bristol, Bristol, October 2003, pp. 7-8; de Neubourg, C., et al., ‘Child Deprivation, Multidimensional Poverty and Monetary Poverty in Europe’, Innocenti Working Paper 2012-02, UNICEF Innocenti Research Centre, Florence, March 2012, pp. 6-7; Hjelm, L., et al., ‘Comparing Approaches to the Measurement of Multidimensional Child Poverty’, Innocenti Working Paper 2016-29, UNICEF Office of Research, Florence, December 2016, pp. 12, 15.36 International Labour Organization, International Standard Classification of Occupation, ISCO-08 Vol. 1: Structure, group definitions and correspondence tables, Geneva, 2012, p. 398.37 Ministry of Human Resources Malaysia, Malaysia Standard of Classification of Occupation 2008, 3rd ed., Putrajaya, June 2010, pp. 1-281.38 United Nations, Canberra Group Handbook on Household Income Statistics 2011, 2nd ed., United Nations Economic Commission for Europe, Geneva, 2011, pp. 194..
UNICEFUrban Child Poverty Report
71Appendices and References
Appendix A: MethodologyData collection method: This study collected data through face-to-face interview with heads of household using a semi-structured questionnaire. The targeted household must have at least one child aged below 18 years old and under the responsibility of the head of household. The survey was conducted between 20th August 2017 and 30th September 2017. The respondents were asked about their current socio-economic status and their children’s well-being. The questions were structured to capture deprivation in four dimensions: 1) Income, 2) Education, 3) Health, and 4) Living standards.
The approach is widely used in analysing child poverty and disparities35.
Scope and coverage: The survey covered 16 selected low-cost flats (PPR) in Kuala Lumpur (KL) and one PPR in Selangor.
Sampling frame and technique: “Area sampling” method is used to determine the specific sample area, which involved the low-cost flats in KL and Selangor. The total areas concerned were selected by some restricted random process and based on the B40 income group database.
Sample size: The sample size for this study is 966 with 3% margin of error at 95% confidence level.
Rounding of estimates: The calculation of certain categories may not always be the same between tables due to independent rounding. The differences however were insignificant. Percentages shown in the charts were computed from actual absolute figures and may not always add up exactly to 100 per cent because of the rounding method used.
Key Demographic Characteristics of the Respondents
Mean age:Head of Household = 45 years oldChildren = 10
Ethnic Group:Malay = 68% Chinese = 5% Indian = 27%
Definition of Key Measures
Head of family or household is any family member whether female or male, who is considered as the head of family or as a reference by other family members.
Child is an individual aged 0-17 years old and under the responsibility of the head of household.
Education is categorized by highest formal education level and highest certificates obtained following the International Standard Classification of Occupation (ISCO-08)36.
Occupational groups are categorized into 9 major groups according to Malaysia Standard Classification of Occupation (MASCO) 200837.
Income consists of paid-employment, self-employment, property & investment, and current transfers received. The classification is based on Canberra Group Handbook on Household Income Statistics, second edition (2011)38.
Savings is defined as household savings with any saving institutions. This can include savings account in any banking entities, Lembaga Tabung Haji (Pilgrims Fund Board), Employees Provident Fund (EPF) and any other unit trust funds (ASN/ASB).
Appendix A: Methodology
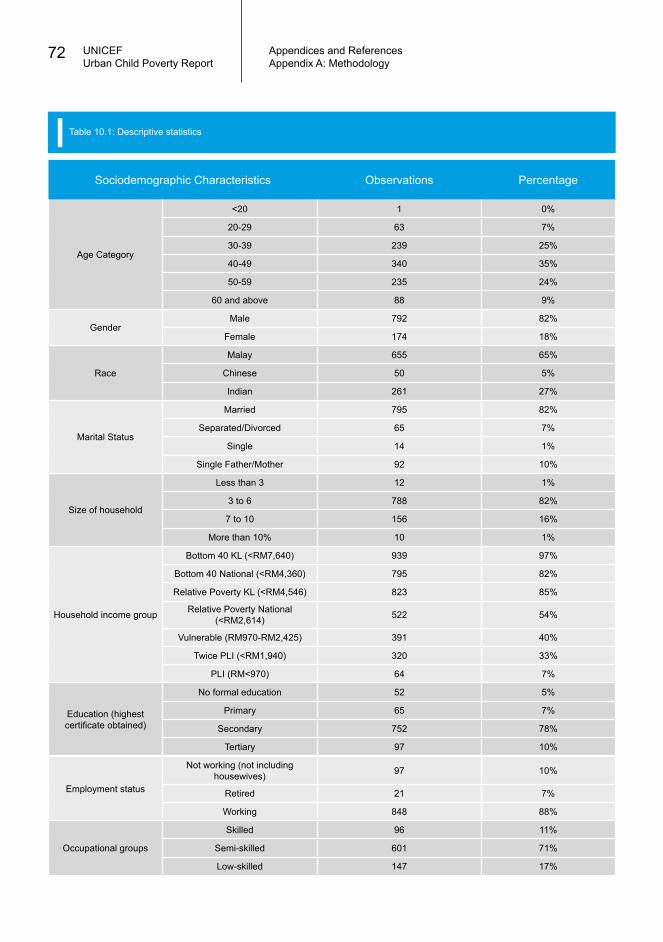
UNICEFUrban Child Poverty Report
72 Appendices and References
Employment status
Not working (not including housewives) 97 10%
Retired 21 7%
Working 848 88%
Occupational groups
Skilled 96 11%
Semi-skilled 601 71%
Low-skilled 147 17%
Sociodemographic Characteristics Observations Percentage
Age Category
<20 1 0%
20-29 63 7%
30-39 239 25%
40-49 340 35%
50-59 235 24%
60 and above 88 9%
GenderMale 792 82%
Female 174 18%
Race
Malay 655 65%
Chinese 50 5%
Indian 261 27%
Marital Status
Married 795 82%
Separated/Divorced 65 7%
Single 14 1%
Single Father/Mother 92 10%
Size of household
Less than 3 12 1%
3 to 6 788 82%
7 to 10 156 16%
More than 10% 10 1%
Household income group
Bottom 40 KL (<RM7,640) 939 97%
Bottom 40 National (<RM4,360) 795 82%
Relative Poverty KL (<RM4,546) 823 85%
Relative Poverty National (<RM2,614) 522 54%
Vulnerable (RM970-RM2,425) 391 40%
Twice PLI (<RM1,940) 320 33%
PLI (RM<970) 64 7%
Education (highest certificate obtained)
No formal education 52 5%
Primary 65 7%
Secondary 752 78%
Tertiary 97 10%
Table 10.1: Descriptive statistics
Appendix A: Methodology
UNICEFUrban Child Poverty Report
73Appendices and References
ReferencesCuesta, Jose., and Laura Maratou-Kolias, ‘Child Undernourishment, WASH and Policy Synergies in Tunisia: Putting numbers into UNICEF’s conceptual framework of nutrition’, Innocenti Working Paper 2017-13, UNICEF Office of Research - Innocenti, Florence, October 2017, pp. 25.
De Groot, Richard, et al., ‘Cash Transfers and Child Nutrition: What we know and what we need to know’, Innocenti Working Paper No. 2015-07, UNICEF Office of Research - Innocenti, Florence, August 2015, pp. 31.
De Neubourg, C., et al., ‘Child Deprivation, Multidimensional Poverty and Monetary Poverty in Europe’, Innocenti Working Paper 2012-02, UNICEF Innocenti Research Centre, Florence, March 2012, pp. 42.
Department of Social Welfare, ‘Child Allowances’, Putrajaya, < www.jkm.gov.my/jkm/index.php?r=portal/left&id=QW15ZEo2UnZIMnJXSHdEQTdXZGE3dz09>, accessed 15 January 2018.
Department of Statistics Malaysia, ‘Labour Force Survey Report 2016’, Putrajaya, April 2017, pp. 318.
Department of Statistics Malaysia, ‘Salaries & Wages Survey Report 2016’, Putrajaya, May 2017, pp. 71.
Department of Statistics Malaysia, ‘Household Income & Basic Amenities Survey Report 2016’, Putrajaya, October 2017, pp. 199.
Economist Intelligence Unit, Tackling Obesity in ASEAN: Prevalence, impact, and guidance on interventions, London, 1 June 2017, pp. 75.
Economic Planning Unit, Malaysia Sustainable Development Goals: Voluntary national review 2017, Putrajaya, July 2017, pp. 68.
Economic Planning Unit, ‘Published Time-Series Economic Statistics; National Account’, 2017, <www.epu.gov.my/en/economic-statistics/national-accounts>, accessed 11 November 2017.
Economic Planning Unit, ‘Eleventh Malaysia Plan 2016-2020: Anchoring growth on people’, Putrajaya, 21 May 2015, pp. 370, < http://epu.gov.my/sites/default/files/Buku%20RMKe-11.pdf>, accessed 15 June 2017.
Economic Planning Unit, ‘Strategy Paper 02: Elevating B40 households towards a middle-class society’, Eleventh
Malaysia Plan, Putrajaya, May 2015, pp. 25, < http://.epu.gov.my/sites/default/files/Strategy%20Paper%2002.pdf>, accessed 15 June 2017.
Gordon, David, et al., Child Poverty in the Developing World, University of Bristol, Bristol, October 2003, pp. 36
Hagen-Zanker, Jessica, et al., The Impact of Cash Transfers on Women and Girls: A summary of the evidence, London, Overseas Development Institute, 2016, pp. 7.
Hjelm, L., et al., ‘Comparing Approaches to the Measurement of Multidimensional Child Poverty’, Innocenti Working Paper 2016-29, UNICEF Office of Research, Florence, December 2016, pp. 28.
Institute of Public Health Malaysia, ‘The National Health and Morbidity Survey 2015’, Vol. II: Non-communicable diseases, risk factors & other health problems, Kuala Lumpur, 2015, pp. 291.
International Labour Organization, International Standard Classification of Occupation, ISCO-08 Vol. 1: Structure, group definitions and correspondence tables, Geneva, 2012, pp. 420.
Ismail, Normaz W., Sudha Sivadas, Urban Child Poverty: Does size matter?, Universiti Putra Malaysia, November 2017, pp. 30.
Institute of Public Health Malaysia, ‘The National Health and Morbidity Survey 2016: Maternal and child health’, Vol. II: Findings, Kuala Lumpur, 2016, pp. 272.
Lobstein, Tim., et al., ‘Child and Adolescent Obesity: Part of a bigger picture’, The Lancet, vol. 385, no. 9986, 20 June 2015, pp. 2510-2520.
Ministry of Education, ‘The Supplementary Food Programme’, Putrajaya, < www.moe.gov.my/index.php/en/bantuan-pembelajaran/rancangan-makanan-tambahan-rmt>, accessed 13 January 2018.
Ministry of Education, ‘Summary Guidelines for Private Pre-School Tuition Fees Assistance’, Putrajaya, n.d., pp. 1-6, < http://jpnperak.moe.gov.my/jpn/attachments/article/4971/Garis%20Panduan%20Permohonan%20Bantuan%20Yuran.pdf>, accessed 17 January 2018.
Ministry of Education, ‘Guidelines for 1Malaysia Public Pre-School Assistance’, Putrajaya, < www.moe.gov.my/index.php/en/pemberitahuan/2017/2836-garis-
References
UNICEFUrban Child Poverty Report
74 Appendices and References
panduan-bantuan-khas-awal-persekolahan-1malaysia-kepada-murid-di-sekolah-kerajaan-dan-sekolah-bantuan-kerajaan>, accessed 13 January 2018.
Ministry of Health Malaysia, '1Malaysia Milk Programme (PS1M)', Putrajaya, <http://nutrition.moh.gov.my/program-susu-1malaysia-ps1m>, accessed 13 January 2018.
Ministry of Health, ‘National Immunization Programme’, Putrajaya, < www.myhealth.gov.my/en/immunisation-schedule>, accessed 14 January 2018.
Ministry of Health Malaysia, National Plan of Action for Nutrition of Malaysia III 2016-2025, National Coordinating Committee on Food and Nutrition (NCCFN), Putrajaya, 2016, pp. 165.
Ministry of Human Resources Malaysia, Malaysia Standard of Classification of Occupation 2008, 3rd ed., Putrajaya, June 2010, pp. 281.
UCL Institute of Health Equity, Review of Social Determinants and the Health Divide in the WHO European Region: Final report, Copenhagen, Regional Office for Europe, World Health Organization, pp. 188.
United Nations Children’s Fund, Public Finance and Social Budgeting, learning Module, UNICEF, New York, 2011.
United Nations Children’s Fund, Progress for Children Beyond Averages: Learning from the MDGs, UNICEF, New York, June 2015, pp. 65.
United Nations Children’s Fund, The State of the World’s Children 2016: A fair chance for every child, UNICEF, New York, June 2016, pp. 172.
United Nations Malaysia, Malaysia Millennium Development Goals Report 2015, Kuala Lumpur, January 2016, pp. 229
Watts, Jonathan, ‘Brazil's Bolsa Familia Scheme Marks a Decade of Pioneering Poverty Relief’, The Guardian, 17 Dec 2013, < www.theguardian.com/global development/2013/dec/17/brazil-bolsa-familia-decade-anniversary-poverty-relief>, accessed 5 January 2018.
World Bank, ‘Prevalence of Anemia among Pregnant Women (%)’, < www.data.worldbank.org/indicator/SH.PRG.ANEM?locations=MY>, accessed on 19 January 2018.
World Health Organization, ‘Interpreting Growth Indicators’,
Training Course on Child Growth Assessment: WHO child growth standards, Geneva, 2008, pp. 48.
World Health Organization and Calouste Gulbenkian Foundation, Social Determinants of Mental Health, Geneva, World Health Organization, 2014, pp. 52.
World Health Organization, Taxes on Sugary Drinks: Why do it?, n.p., Department of Prevention of Noncommunicable Diseases, World Health Organization, 2016, p. 1-4.
World Health Organization, ‘Joint Child Malnutrition Estimates 2017 (UNICEF-WHO-WB)’, May 2017, <www.who.int/nutgrowthdb/jme_dataset2017_final.xlsx?ua=1>, accessed on 14 November 2017.
World Health Organization, ‘Global Health Observatory Data Repository: Prevalence of overweight, age-standardized’, n.d., <http://apps.who.int/gho/athena/data/GHO/NCD_BMI_25A?filter=AGEGROUP:*;COUNTRY:*;SEX:*&xsideaxis=COUNTRY&xtopaxis=YEAR;GHO;AGEGROUP;SEX&profile=crosstable&format=csv>, accessed on 15 January 2017.
References
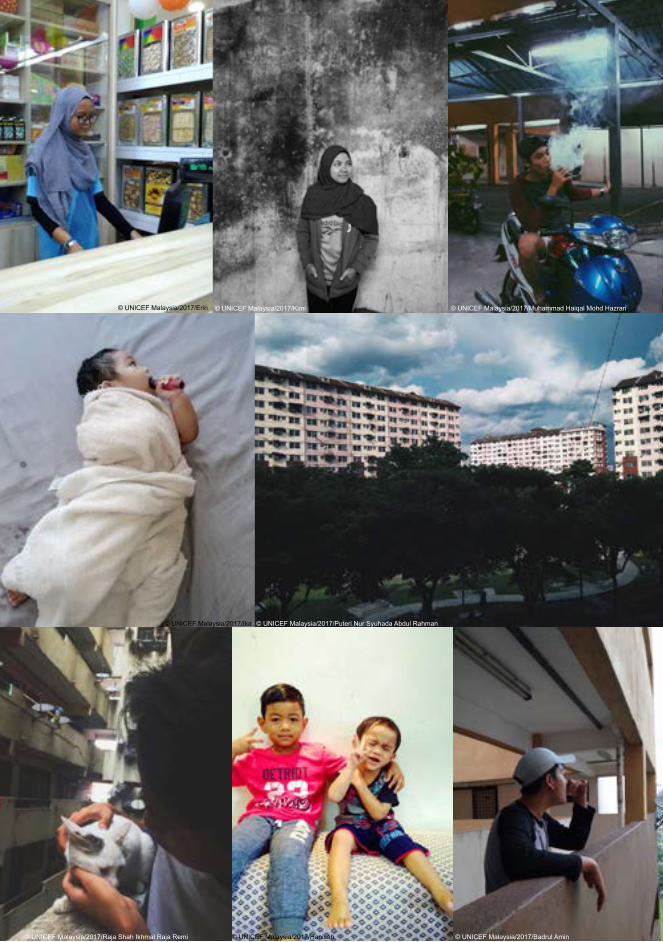
© UNICEF Malaysia/2017/Erin
© UNICEF Malaysia/2017/Ika © UNICEF Malaysia/2017/Puteri Nur Syuhada Abdul Rahman
© UNICEF Malaysia/2017/Badrul Amin© UNICEF Malaysia/2017/Raja Shah Ikhmal Raja Remi © UNICEF Malaysia/2017/Hanisah
© UNICEF Malaysia/2017/Kimi © UNICEF Malaysia/2017/Muhammad Haiqal Mohd Hazrari
"Kita hidup berjiran kenalah ambil tahu pasal jiran kita.
Siapa lagi nak tolong kita kalau ada masalah?"
- Penduduk PPR
"We live in a community so we have to take care of each other.
Who else will help us when we're in trouble?"
- Resident of PPR low-cost flat