chile day final - ripley inversiones · 2 ripley corp chile ... • additionally, the debt profile...
TRANSCRIPT

Ripley CorpPresentation July 2009
2
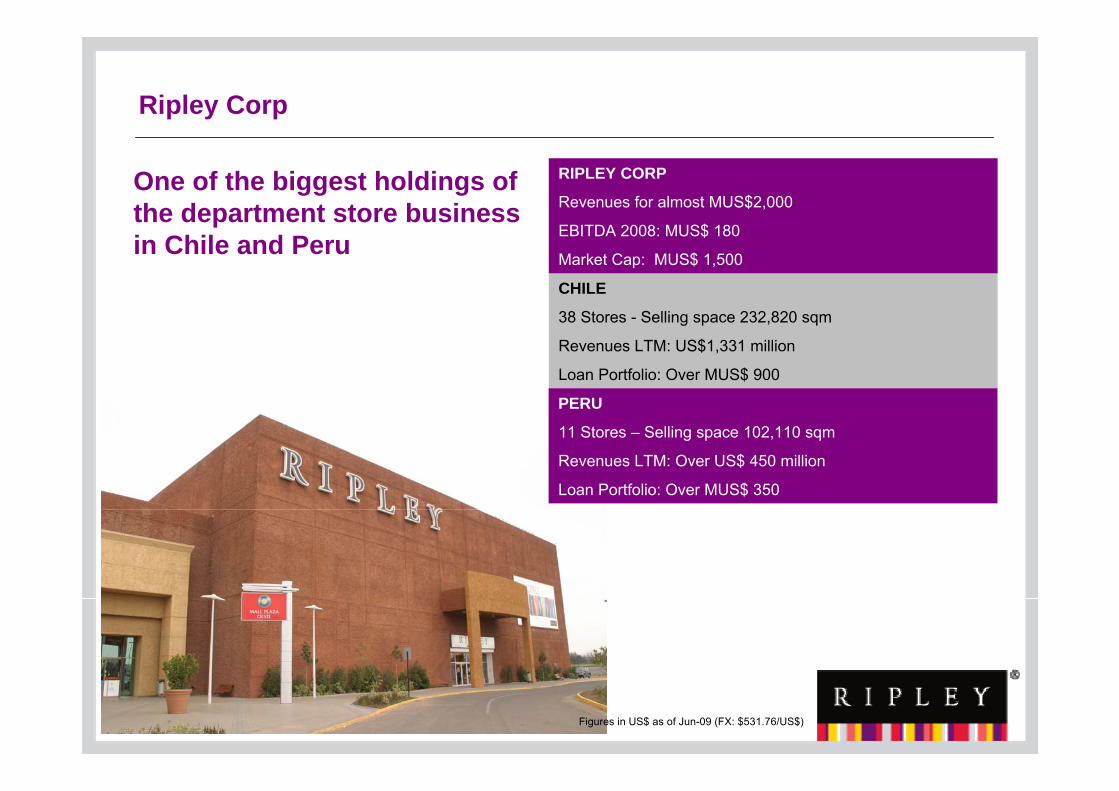
Ripley Corp
CHILE
38 Stores - Selling space 232,820 sqm
Revenues LTM: US$1,331 million
Loan Portfolio: Over MUS$ 900
RIPLEY CORP
Revenues for almost MUS$2,000
EBITDA 2008: MUS$ 180
Market Cap: MUS$ 1,500
One of the biggest holdings of the department store business in Chile and Peru
PERU
11 Stores – Selling space 102,110 sqm
Revenues LTM: Over US$ 450 million
Loan Portfolio: Over MUS$ 350
Figures in US$ as of Jun-09 (FX: $531.76/US$)

3
Contents
• Ripley - 53 years of history
• Recent Developments
• Ripley Chile
• Ripley Peru
• Conclusion
4
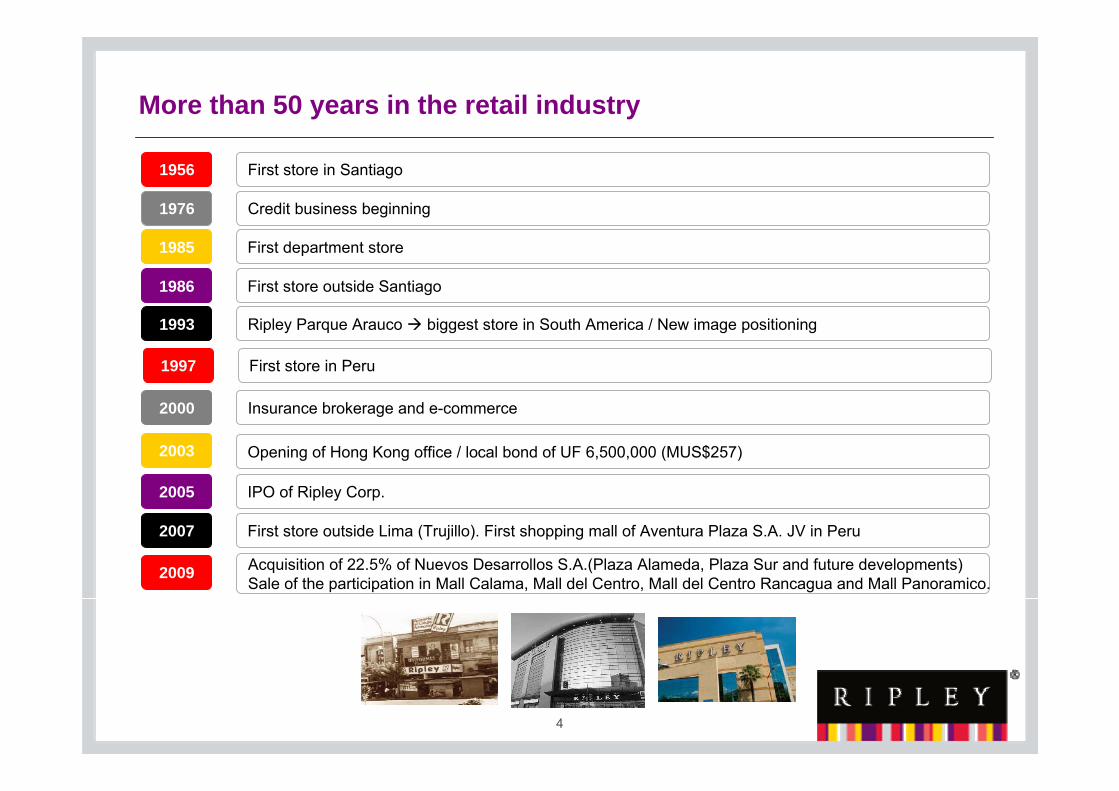
More than 50 years in the retail industry
1956 First store in Santiago
1976 Credit business beginning
1985 First department store
1986 First store outside Santiago
2000 Insurance brokerage and e-commerce
1993 Ripley Parque Arauco biggest store in South America / New image positioning
2003 Opening of Hong Kong office / local bond of UF 6,500,000 (MUS$257)
2005 IPO of Ripley Corp.
2007 First store outside Lima (Trujillo). First shopping mall of Aventura Plaza S.A. JV in Peru
2009 Acquisition of 22.5% of Nuevos Desarrollos S.A.(Plaza Alameda, Plaza Sur and future developments)Sale of the participation in Mall Calama, Mall del Centro, Mall del Centro Rancagua and Mall Panoramico.
1997 First store in Peru
5
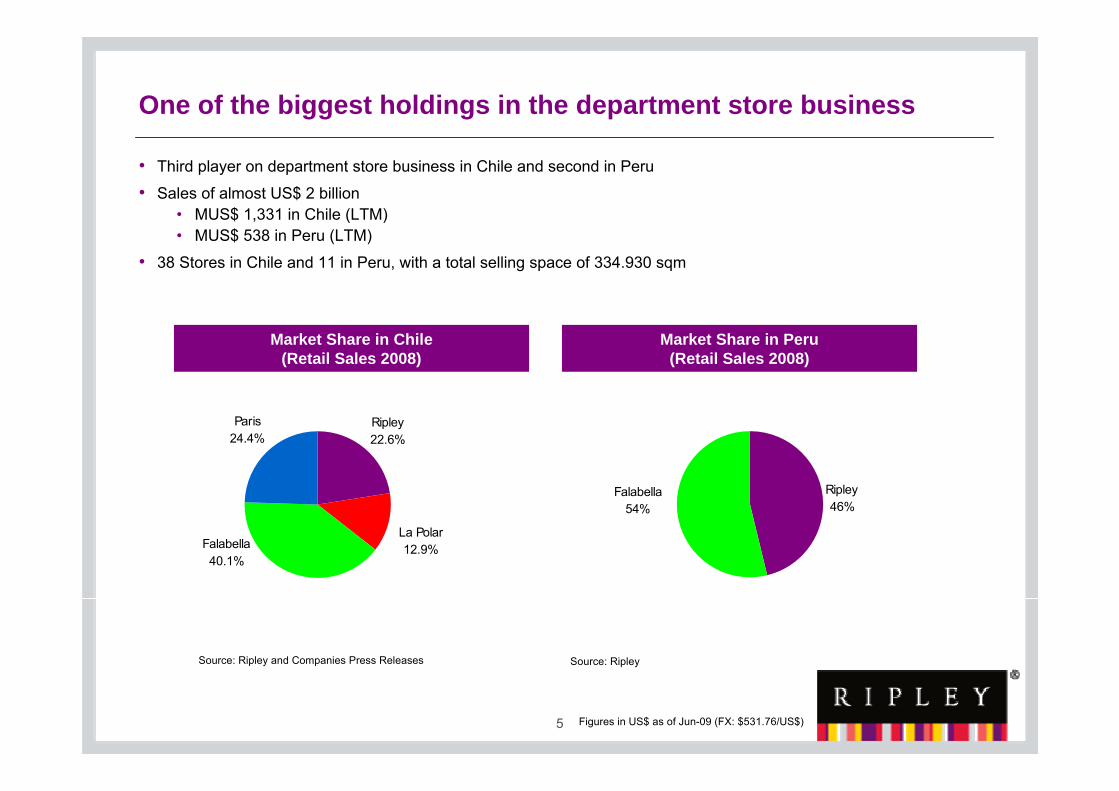
One of the biggest holdings in the department store business
• Third player on department store business in Chile and second in Peru
• Sales of almost US$ 2 billion• MUS$ 1,331 in Chile (LTM)• MUS$ 538 in Peru (LTM)
• 38 Stores in Chile and 11 in Peru, with a total selling space of 334.930 sqm
Paris24.4%
Ripley22.6%
La Polar12.9%Falabella
40.1%
Market Share in Chile(Retail Sales 2008)
Market Share in Peru(Retail Sales 2008)
Source: Ripley and Companies Press Releases Source: Ripley
Ripley46%
Falabella54%
Figures in US$ as of Jun-09 (FX: $531.76/US$)
6
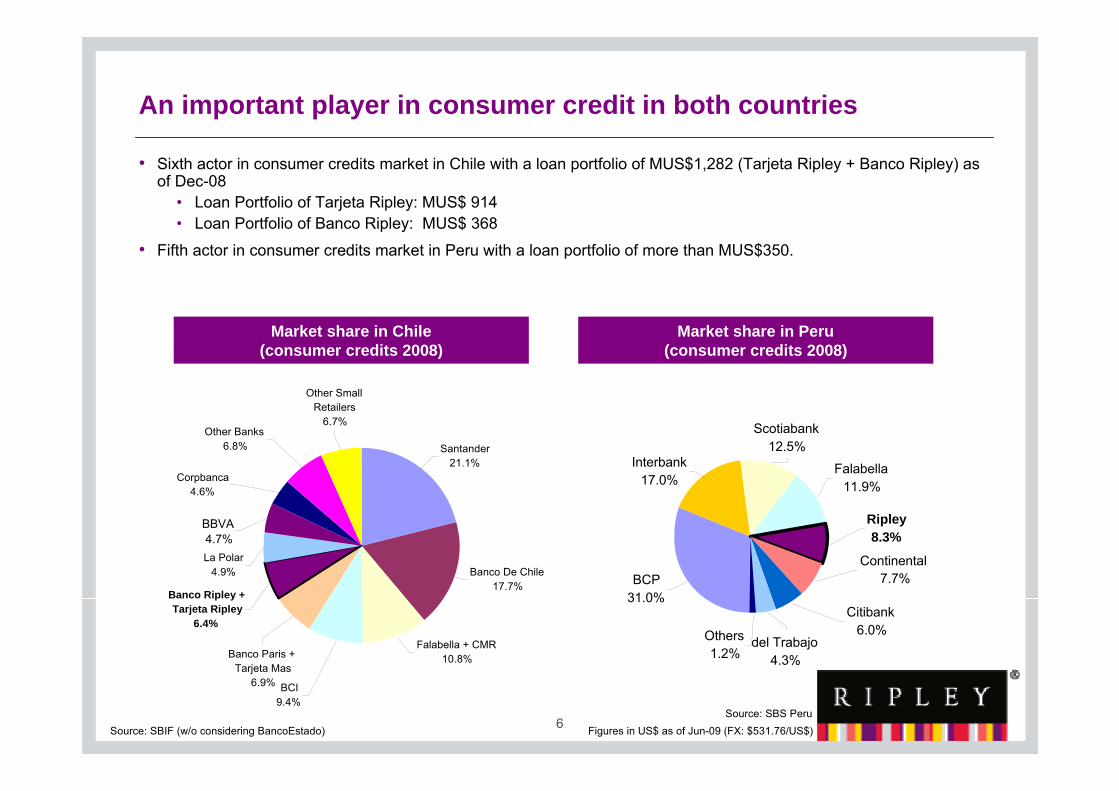
An important player in consumer credit in both countries
• Sixth actor in consumer credits market in Chile with a loan portfolio of MUS$1,282 (Tarjeta Ripley + Banco Ripley) as of Dec-08
• Loan Portfolio of Tarjeta Ripley: MUS$ 914• Loan Portfolio of Banco Ripley: MUS$ 368
• Fifth actor in consumer credits market in Peru with a loan portfolio of more than MUS$350.
Source: SBIF (w/o considering BancoEstado)
Market share in Chile(consumer credits 2008)
Market share in Peru(consumer credits 2008)
Source: SBS PeruFigures in US$ as of Jun-09 (FX: $531.76/US$)
BCP31.0%
Others1.2%
Interbank17.0%
Scotiabank12.5%
Falabella11.9%
Ripley8.3%
Continental7.7%
Citibank6.0%
del Trabajo4.3%
Corpbanca4.6%
Other Small Retailers
6.7%Other Banks
6.8% Santander21.1%
Banco De Chile17.7%
Falabella + CMR10.8%
Banco Ripley + Tarjeta Ripley
6.4%
La Polar4.9%
BBVA4.7%
Banco Paris + Tarjeta Mas
6.9% BCI9.4%
7
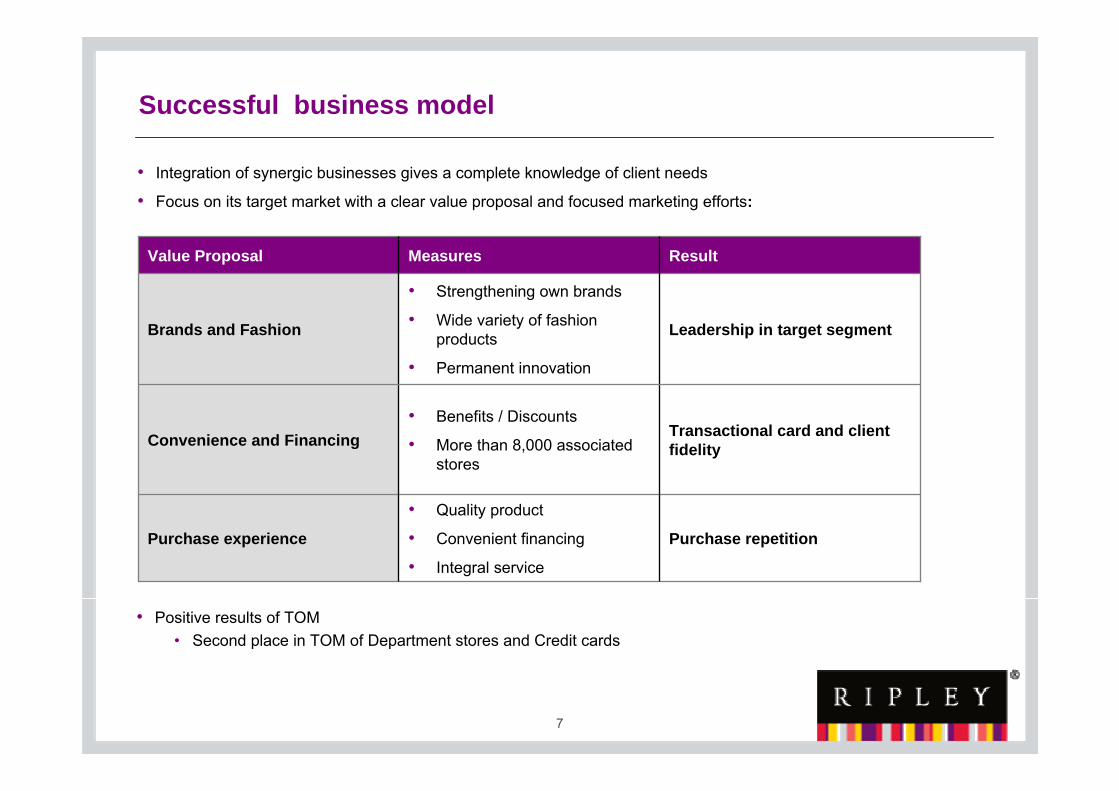
Successful business model
• Integration of synergic businesses gives a complete knowledge of client needs
• Focus on its target market with a clear value proposal and focused marketing efforts:
Leadership in target segment
• Strengthening own brands
• Wide variety of fashion products
• Permanent innovation
Brands and Fashion
Purchase repetition
• Quality product
• Convenient financing
• Integral service
Purchase experience
Transactional card and client fidelity
• Benefits / Discounts
• More than 8,000 associated stores
Convenience and Financing
ResultMeasuresValue Proposal
• Positive results of TOM• Second place in TOM of Department stores and Credit cards
8
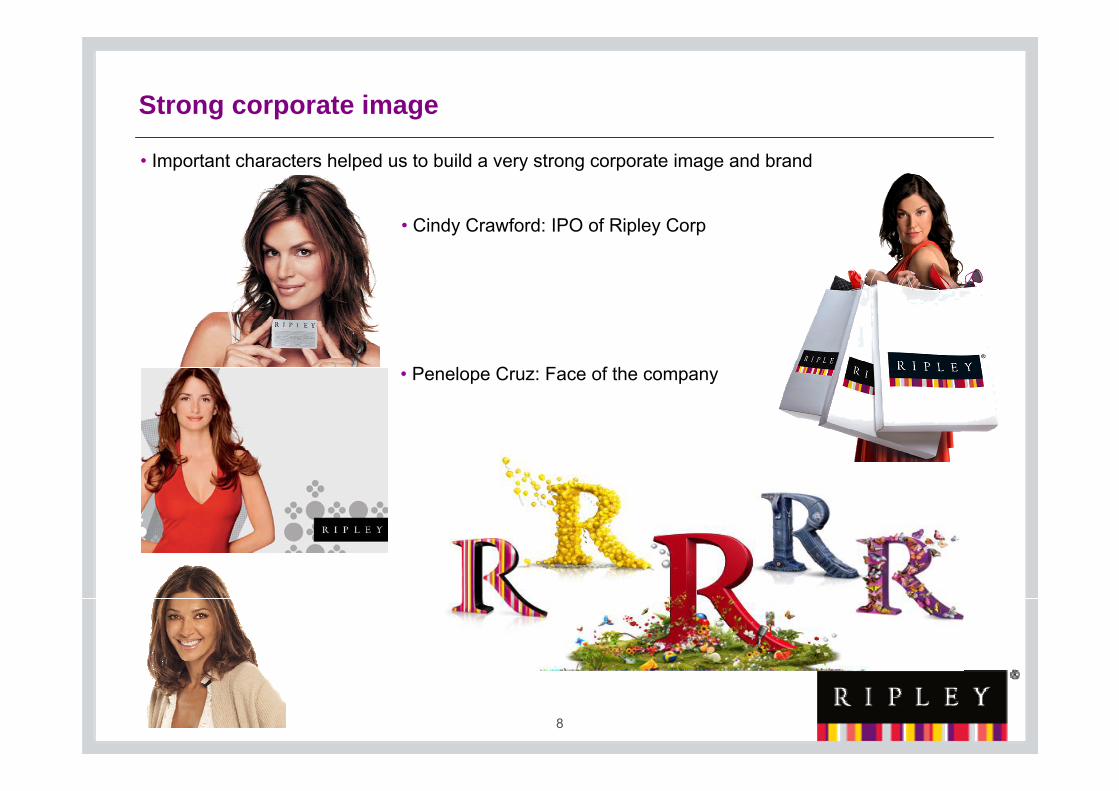
Strong corporate image
• Important characters helped us to build a very strong corporate image and brand
• Cindy Crawford: IPO of Ripley Corp
• Penelope Cruz: Face of the company
9
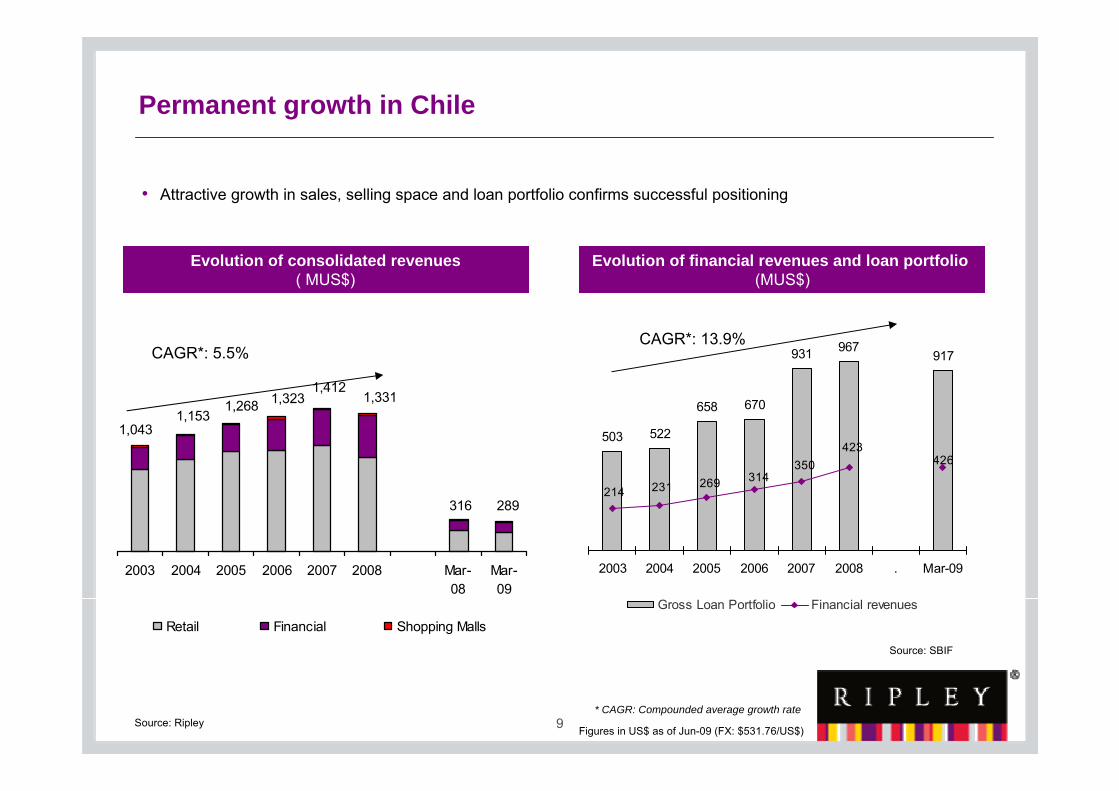
Permanent growth in Chile
• Attractive growth in sales, selling space and loan portfolio confirms successful positioning
Evolution of consolidated revenues( MUS$)
2003 2004 2005 2006 2007 2008 Mar-08
Mar-09
Retail Financial Shopping Malls
1,1531,268 1,323
1,4121,331
316 289
1,043
CAGR*: 5.5%
* CAGR: Compounded average growth rateSource: Ripley
Evolution of financial revenues and loan portfolio (MUS$)
522
658 670
931 967917
503423
350314269231214
426
2003 2004 2005 2006 2007 2008 . Mar-09
Gross Loan Portfolio Financial revenues
CAGR*: 13.9%
Source: SBIF
Figures in US$ as of Jun-09 (FX: $531.76/US$)

10
Permanent growth in Peru
• Strong increase on sales, financial revenues and loan portfolio confirm important growth in Peru
368 374
538
82 92
2006 2007 2008 Mar-08 Mar-09
CAGR*: 19.7%
Source: Ripley
142
191
158
104
4960
102 103
2006 2007 2008 . Mar-09
Loan Portfolio Financial revenues
CAGR*: 35.7%
* CAGR: Compounded average growth rate
Evolution of consolidated revenues( MUS$)
Evolution of financial revenues and loan portfolio Banco Ripley Peru (MUS$)
Figures in US$ as of Jun-09 (FX: $531.76/US$)
11
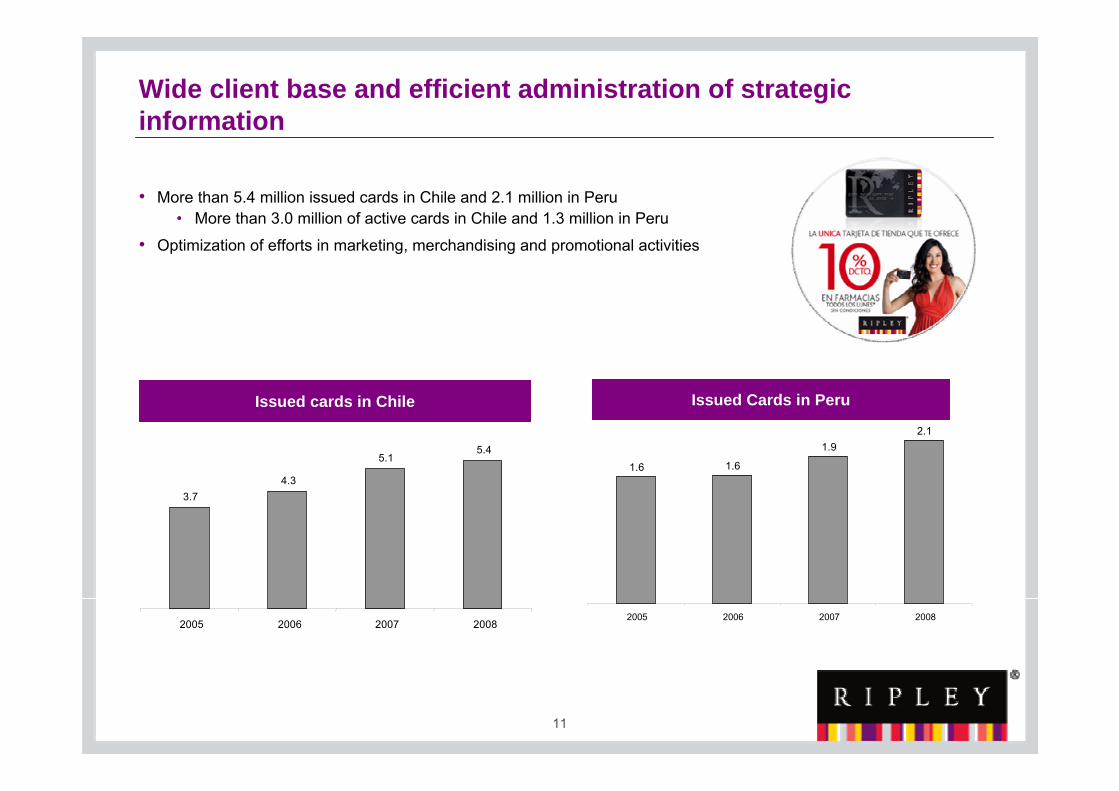
Wide client base and efficient administration of strategic information
• More than 5.4 million issued cards in Chile and 2.1 million in Peru• More than 3.0 million of active cards in Chile and 1.3 million in Peru
• Optimization of efforts in marketing, merchandising and promotional activities
Issued cards in Chile
3.74.3
5.15.4
2005 2006 2007 2008
1.6 1.6
1.92.1
2005 2006 2007 2008
Issued Cards in Peru
12
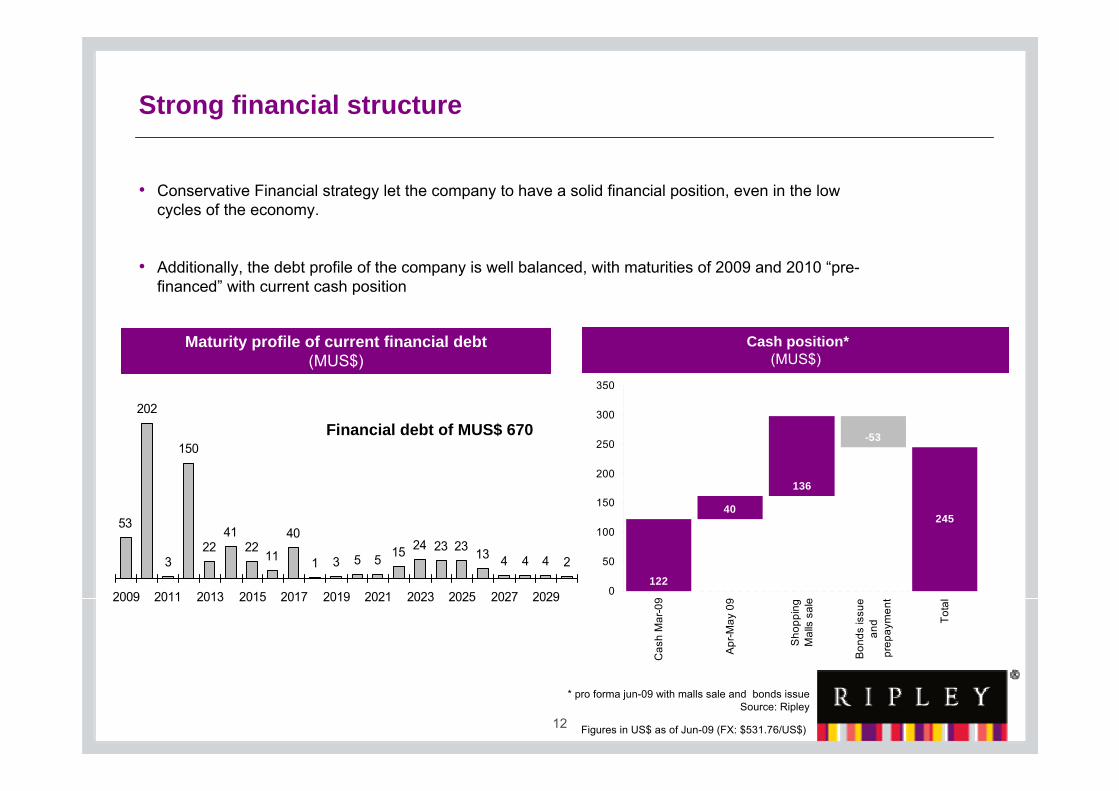
Strong financial structure
• Conservative Financial strategy let the company to have a solid financial position, even in the low cycles of the economy.
• Additionally, the debt profile of the company is well balanced, with maturities of 2009 and 2010 “pre-financed” with current cash position
Maturity profile of current financial debt(MUS$)
3
150
2241
2211
40
1 3 5 5 15 24 23 23 13 4 4 4 2
53
202
2009 2011 2013 2015 2017 2019 2021 2023 2025 2027 2029
Cash position*(MUS$)
122
40
136
-53
245
0
50
100
150
200
250
300
350
Cas
h M
ar-0
9
Apr
-May
09
Sho
ppin
gM
alls
sal
e
Bon
ds is
sue
and
prep
aym
ent
Tota
l
* pro forma jun-09 with malls sale and bonds issueSource: Ripley
Figures in US$ as of Jun-09 (FX: $531.76/US$)
Financial debt of MUS$ 670
13
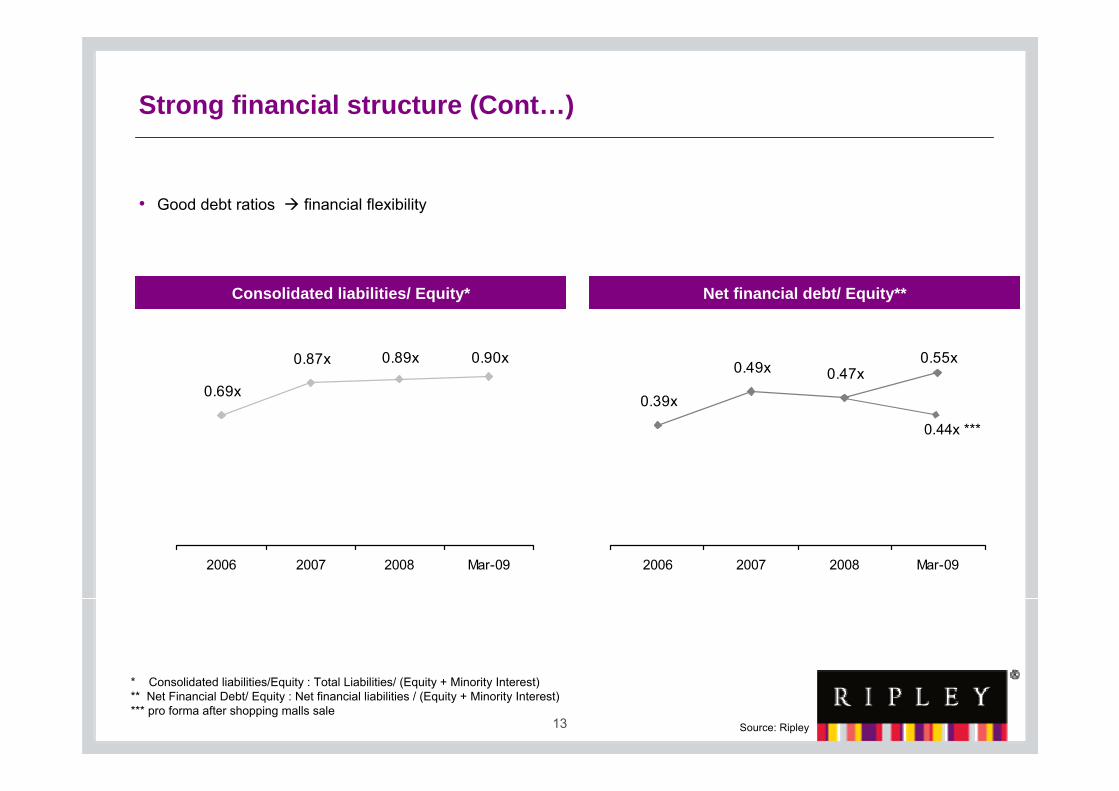
Strong financial structure (Cont…)
• Good debt ratios financial flexibility
Consolidated liabilities/ Equity* Net financial debt/ Equity**
0.90x0.87x 0.89x
0.69x
2006 2007 2008 Mar-09
0.39x
0.47x0.55x0.49x
2006 2007 2008 Mar-09
* Consolidated liabilities/Equity : Total Liabilities/ (Equity + Minority Interest)** Net Financial Debt/ Equity : Net financial liabilities / (Equity + Minority Interest)*** pro forma after shopping malls sale
Source: Ripley
0.44x ***
14
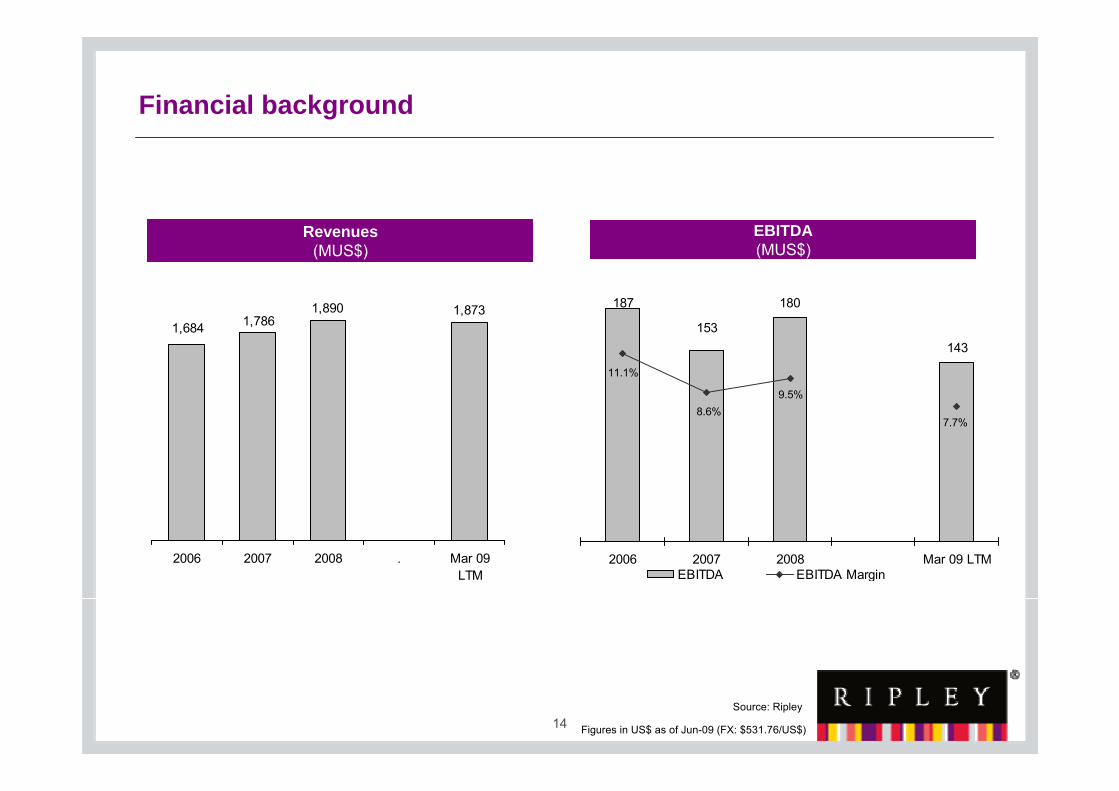
Financial background
Revenues(MUS$)
EBITDA(MUS$)
1,684 1,7861,890 1,873
2006 2007 2008 . Mar 09LTM
180
143153
187
9.5%
7.7%8.6%
11.1%
2006 2007 2008 Mar 09 LTMEBITDA EBITDA Margin
Source: Ripley
Figures in US$ as of Jun-09 (FX: $531.76/US$)
15
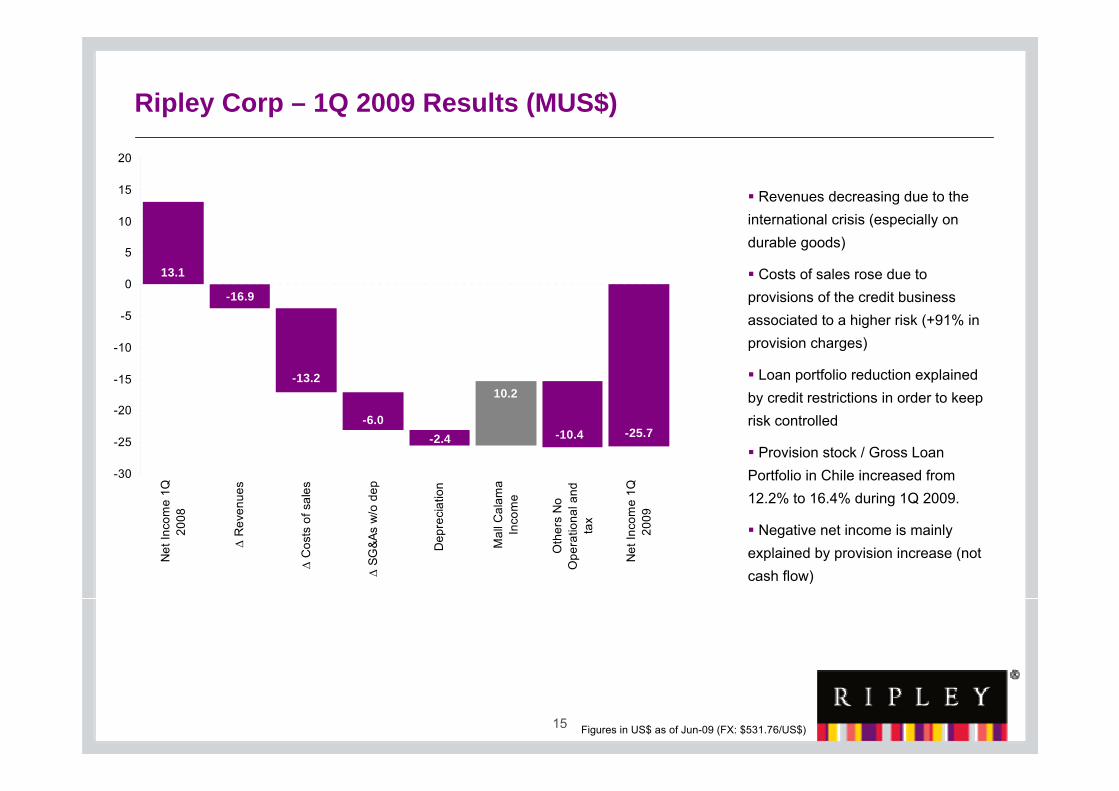
Ripley Corp – 1Q 2009 Results (MUS$)
Revenues decreasing due to the international crisis (especially on durable goods)
Costs of sales rose due to provisions of the credit business associated to a higher risk (+91% in provision charges)
Loan portfolio reduction explained by credit restrictions in order to keep risk controlled
Provision stock / Gross Loan Portfolio in Chile increased from 12.2% to 16.4% during 1Q 2009.
Negative net income is mainly explained by provision increase (not cash flow)
-25.7-10.4
10.2
-2.4-6.0
-13.2
-16.9
13.1
-30
-25
-20
-15
-10
-5
0
5
10
15
20N
et In
com
e 1Q
2008
∆ R
even
ues
∆ C
osts
of s
ales
∆ SG
&As
w/o
dep
Dep
reci
atio
n
Mal
l Cal
ama
Inco
me
Oth
ers
No
Ope
ratio
nal a
ndta
x
Net
Inco
me
1Q20
09
Figures in US$ as of Jun-09 (FX: $531.76/US$)
16
Contents
• Ripley - 53 years of history
• Recent Developments
• Ripley Chile
• Ripley Peru
• Conclusion

17
Controller group has an important knowledge of the business
• Calderon family have been connected to retail business for over 50 years excellent knowledge of the industry
• In May 2009, Inversiones Bujorico Ltda.(Calderon Kohon Family) subscribed with Inversiones Conca S.A. (related to Chilean entrepreneur Alvaro Saieh) a promise of selling 20% of Ripley, transaction that should be made before November 30th 2009.
• Alvaro Saieh has a successful experience on very complementary businesses to Ripley (food retail, banking and real estate).
Free FloatMajor Shareholders
Free Float19%
Inversiones Bujorico Ltda.**20%
Inversiones R S.A.*61%
Mutual Funds7.3%
International Investors
19.7%
Pension Funds16.0%
Insurance Companies
1.2%
Retail54.4%
18
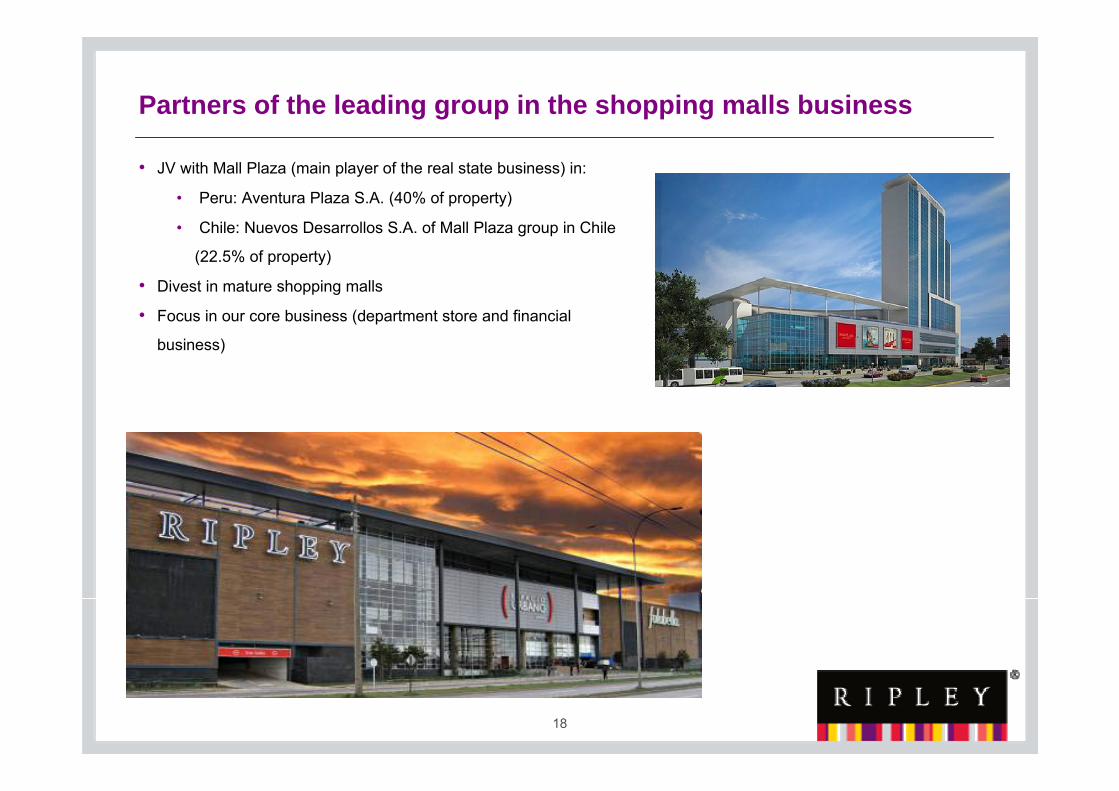
Partners of the leading group in the shopping malls business
• JV with Mall Plaza (main player of the real state business) in:
• Peru: Aventura Plaza S.A. (40% of property)
• Chile: Nuevos Desarrollos S.A. of Mall Plaza group in Chile
(22.5% of property)
• Divest in mature shopping malls
• Focus in our core business (department store and financial
business)
19
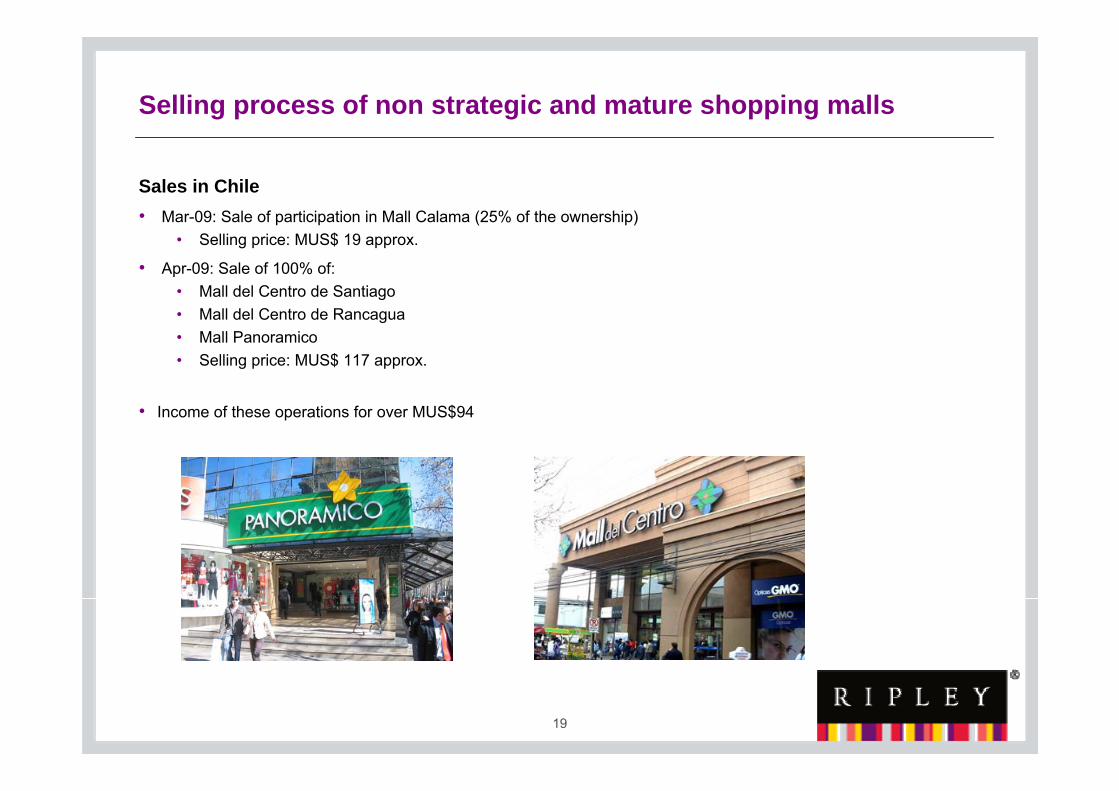
Selling process of non strategic and mature shopping malls
Sales in Chile• Mar-09: Sale of participation in Mall Calama (25% of the ownership)
• Selling price: MUS$ 19 approx.
• Apr-09: Sale of 100% of:• Mall del Centro de Santiago• Mall del Centro de Rancagua• Mall Panoramico• Selling price: MUS$ 117 approx.
• Income of these operations for over MUS$94
20
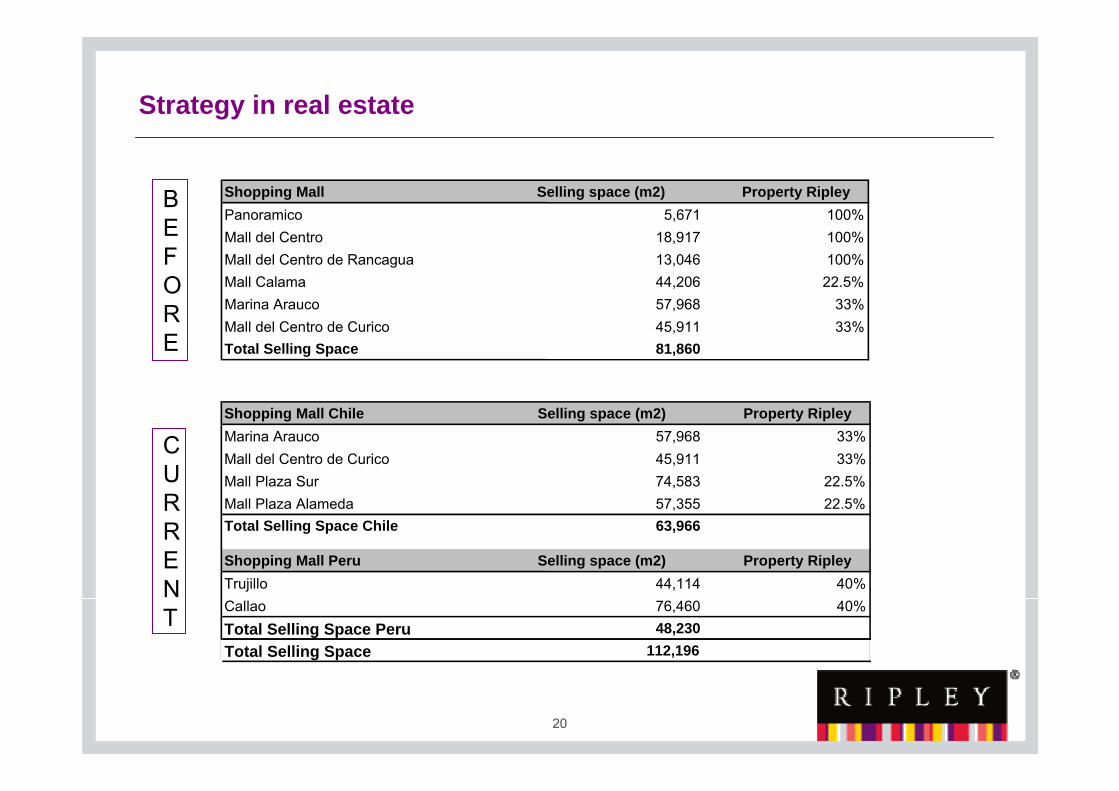
Strategy in real estate
BEFORE
CURRENT
Shopping Mall Selling space (m2) Property RipleyPanoramico 5,671 100%Mall del Centro 18,917 100%Mall del Centro de Rancagua 13,046 100%Mall Calama 44,206 22.5%Marina Arauco 57,968 33%Mall del Centro de Curico 45,911 33%Total Selling Space 81,860
Shopping Mall Chile Selling space (m2) Property RipleyMarina Arauco 57,968 33%Mall del Centro de Curico 45,911 33%Mall Plaza Sur 74,583 22.5%Mall Plaza Alameda 57,355 22.5%Total Selling Space Chile 63,966
Shopping Mall Peru Selling space (m2) Property RipleyTrujillo 44,114 40%Callao 76,460 40%Total Selling Space Peru 48,230Total Selling Space 112,196

21
Successful bond issue – Ripley Chile
On June 25th 2009, Ripley Chile made a successful issue of UF 3,000,000 (MUS$118 approx.)
• Series E: • UF 1,000,000 (MUS$ 39) • Duration: 11 years (21 year period)• Rate: 5.04% (spread of 167 bps)
• Series F:• UF 2,000,000 (MUS$ 79)• Duration: 4.7 years (7 year period)• Rate: 4.45% (spread of 170 bps)
On June 26th was informed an anticipated rescue of the previous bond series of Ripley Chile -series A UF 1.071.428 (MUS$ 42) and series B UF 3.390.625(MUS$ 134). This amount will be paid on July 27th 2009 with the funds from the bond issue of the series E and F and current available cash.
Considering prepayment of series B:
Annual Savings of MUS$1 in financial expenses
Savings in Present Value: MUS$6.2
Average Duration increases from 6.1 to 6.8 years
Figures in US$ as of Jun-09 (FX: $531.76/US$)
22
Contents
• Ripley - 53 years of history
• Recent Developments
• Ripley Chile
• Ripley Peru
• Conclusion
Brands & Fashion (Variety and Design)
Purchaseexperience
Convenience and easy Financing
23
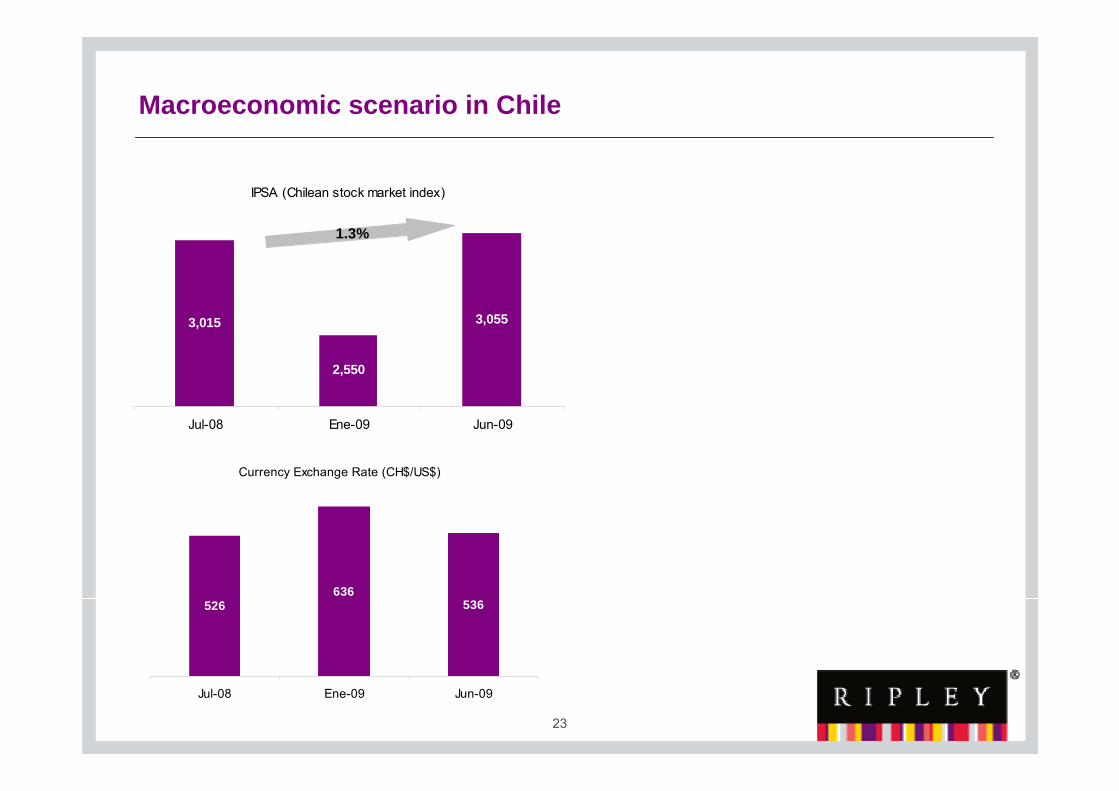
Macroeconomic scenario in Chile
IPSA (Chilean stock market index)
3,015
2,550
3,055
Jul-08 Ene-09 Jun-09
1.3%
Currency Exchange Rate (CH$/US$)
526636
536
Jul-08 Ene-09 Jun-09
24
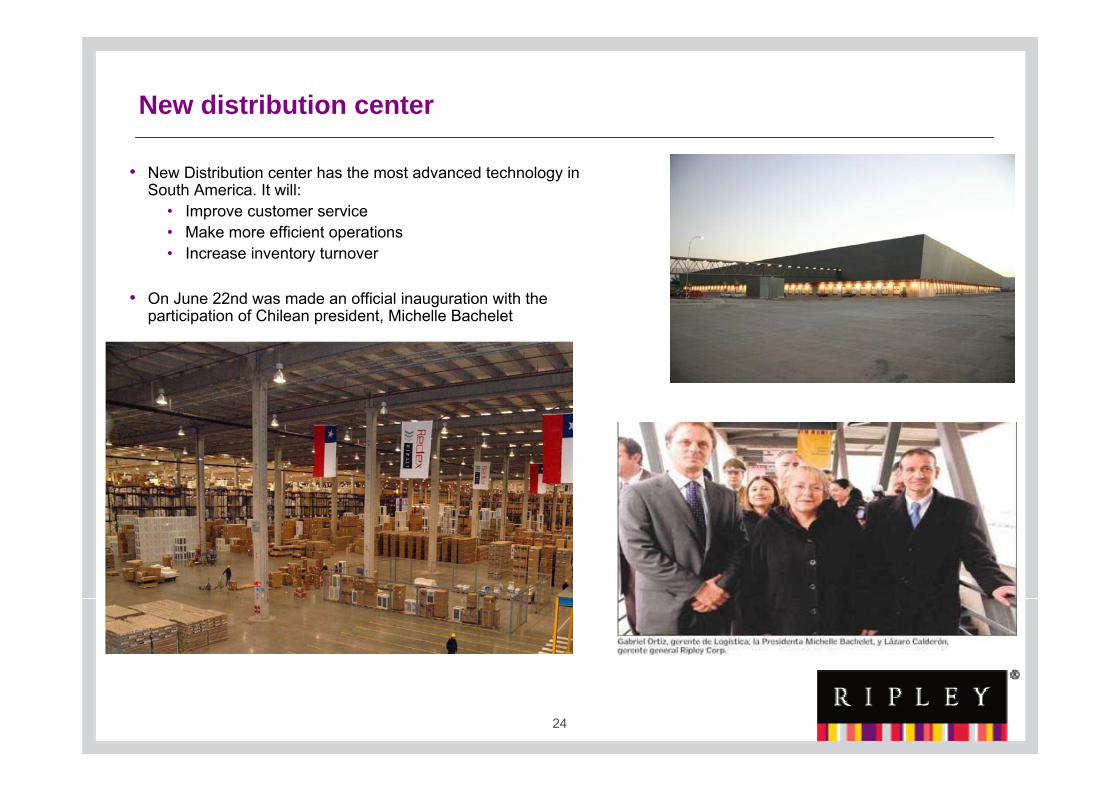
New distribution center
• New Distribution center has the most advanced technology in South America. It will:
• Improve customer service• Make more efficient operations• Increase inventory turnover
• On June 22nd was made an official inauguration with the participation of Chilean president, Michelle Bachelet
25
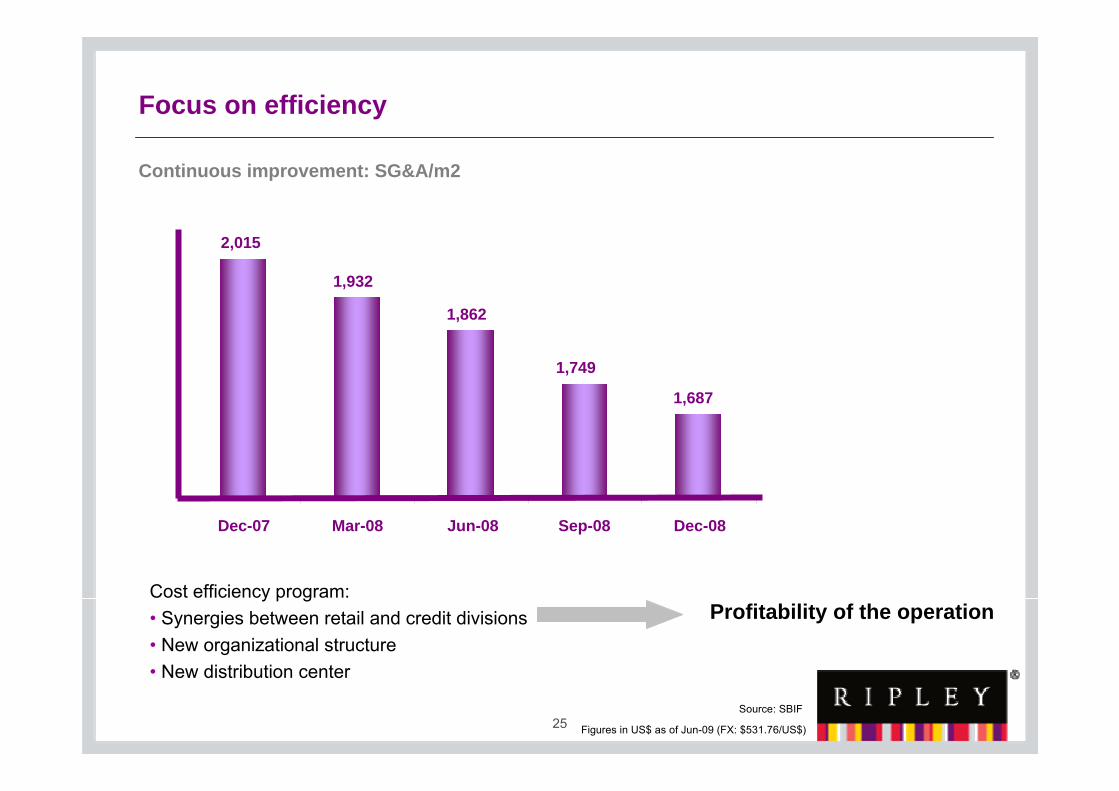
Focus on efficiency
Source: SBIF
2,015
1,932
1,862
1,749
1,687
Dec-07 Mar-08 Jun-08 Sep-08 Dec-08
Continuous improvement: SG&A/m2
Cost efficiency program:• Synergies between retail and credit divisions• New organizational structure• New distribution center
Figures in US$ as of Jun-09 (FX: $531.76/US$)
Profitability of the operation
26
Contents
• Ripley - 53 years of history
• Recent Developments
• Ripley Chile
• Ripley Peru
• Conclusion
27
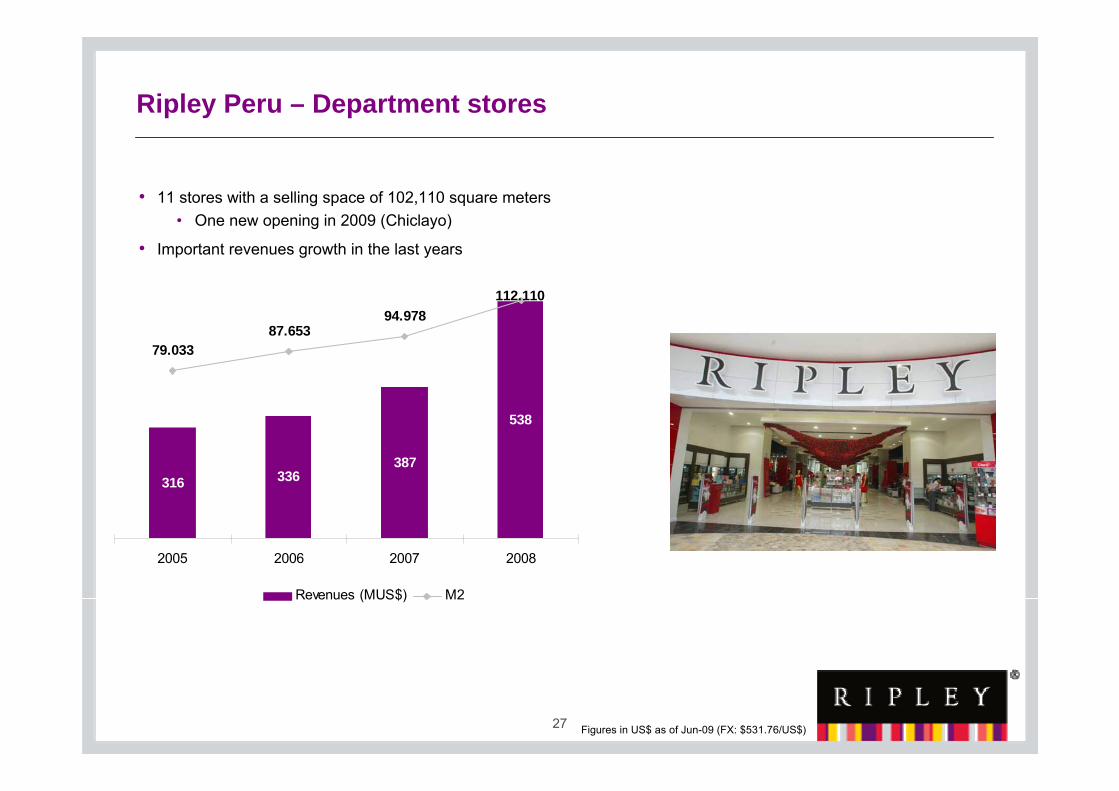
Ripley Peru – Department stores
• 11 stores with a selling space of 102,110 square meters• One new opening in 2009 (Chiclayo)
• Important revenues growth in the last years
316 336387
538
79.03387.653
94.978112.110
2005 2006 2007 2008
Revenues (MUS$) M2
Figures in US$ as of Jun-09 (FX: $531.76/US$)
28
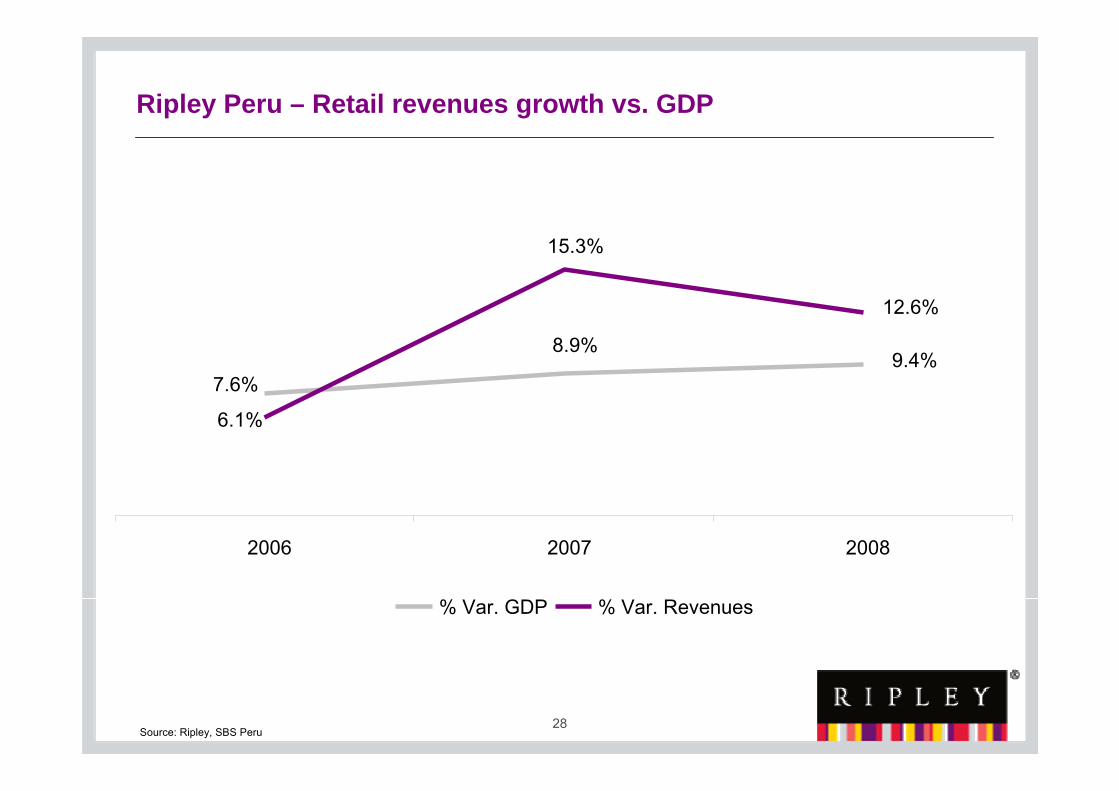
Ripley Peru – Retail revenues growth vs. GDP
Source: Ripley, SBS Peru
9.4%7.6%
8.9%
12.6%
15.3%
6.1%
2006 2007 2008
% Var. GDP % Var. Revenues
29
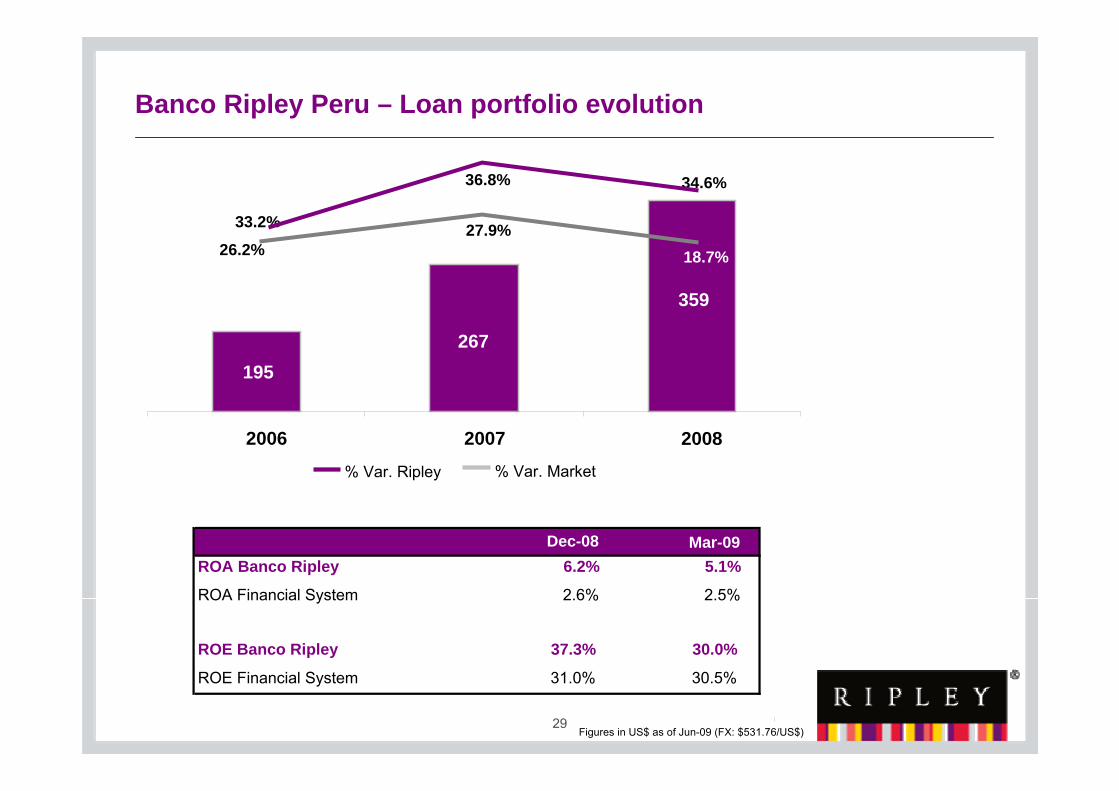
Banco Ripley Peru – Loan portfolio evolution
Figures in US$ as of Jun-09 (FX: $531.76/US$)
267195
359
2006 2007 2008
34.6%
18.7%
36.8%
33.2%
26.2%27.9%
Dec-08 Mar-09ROA Banco Ripley 6.2% 5.1%
ROA Financial System 2.6% 2.5%
ROE Banco Ripley 37.3% 30.0%
ROE Financial System 31.0% 30.5%
% Var. Ripley % Var. Market
30
• Ripley - 53 years of history
• Recent Developments
• Ripley Chile
• Ripley Peru
• Conclusion
Contents

31
Why Invest in Ripley?
Source: Ripley, SBS Peru.
Considers consumer loan portfolio of banks and credit cards + Financiera CMR and Cordillera
• Important player in the department store business in Chile and Peru:• Revenues of almost US$2 billion • 49 stores with over 330,000 sqm
• Wide client base: • Over 4 million active customers of Tarjeta Ripley in Chile and Peru
• Strong financial position• Conservative financial strategy• “Pre-financed” two years debt• Good debt profile
• Stock price at attractive levels, reflecting the low period of the economic cycle• P/BV 1.2x
32
Contact Information
• Speakers• Lazaro Calderon – CEO Ripley Corp
• Juan Diuana – CFO Ripley Chile
• Andres Oksenberg – Investor Relations
• Contact:Phone: (+56-2) 694 1042E-Mail: [email protected]
Ripley CorpPresentation July 2009