circ atm balanta energ
DESCRIPTION
BILANT ENERGETIC ATMOSFERATRANSCRIPT

Course 12.812, General Circulation of the Earth's AtmosphereProf. Peter Stone
Section 3: The Angular Momentum and Kinetic Energy Budgets
Zonal Mean General Circulation
In the Figures 7.14, 7.15 and 7.19 in Peixoto and Oort (1992) we see the station-based analysis of u andψ from Peixoto and Oort, i.e., based on the 10 years of data in the MIT GC library. Figure 7.14 in Peixoto and Oort (1992) shows u at 200 mb, the standard level where the zonal winds are usually strongest. We note that the variations are primarily latitudinal, with the strongest winds, i.e., the jet streams, between about 25o and 40o. The zonality is stronger in the Southern Hemisphere as one would expect. Note the strongest flow on the east coast of Asia. If one averages u globally at 200 mb, there is a superrotation of the atmosphere as a whole of about 6 m/s.
Figure 7.15 in Peixoto and Oort (1992) shows [ u ] for the annual mean and solstice seasons. Note the approximate symmetry about the equator in the zonal mean, the stronger jets in winter, the stronger seasonal cycle in the Northern Hemisphere, and the low latitude easterlies. We would like to explain these features (momentum balance).
Figure 7.19 in Peixoto and Oort (1992) shows [ψ ]. Recall that the analysis error is particularly large in this field. The maximum [ v ] (see Table 4 in Peixoto and Oort (1983)) occurs in the upper and lower branches of the strong seasonal overturning circulations near the equator, and are ~ 3 m/s, an order of magnitude less than [ u ]. In the annual mean [ v ] is only ~ 1 m/s. There is generally a three-celled structure in both hemispheres, which are generally referred to as the Hadley cell, the Ferrel cell, and the (very weak) polar cell.
Figure by MIT OCW.
Note that the Ferrel cell is thermodynamically indirect, warm air sinking and cold air rising. This is something we want to understand. Note that the jet streams are located at the poleward edge of the Hadley cells, that the Hadley cells almost disappear in summer,
Page 1 of 25

! !
! !
!
and that the rising branch between the two Hadley cells (the mean ITCZ) tends to follow the seasonal excursions in the location of the sun, moving back and forth between 10N and 10S. If one looks at longitudinal variations of the circulations, the Hadley cells are much more coherent than the others. The mean rising/sinking branches affect the hydrological cycle as we shall see: the rising branches of the Hadley cells are generally relatively moist, and the sinking branches relatively dry.
Conservation Equations for Angular Momentum
! and if a forceM
For a particle located by the position vector ! r in an inertial ref. frame, moving with a!×rvelocity v! , its absolute angular momentum per unit mass is F is,v = !
M ! r ×!F
dapplied to the particle, conservation of momentum requires . The atmosphere= dt
is attached to the rotating earth, which has large angular momentum about the axis of rotation. If n̂ is a unit vector in the direction of the axis of rotation, and Ω is the angular velocity about the axis, then a parcel moving with the earth moves with a velocity!, and a parcel of the atmosphere moving with a velocityr
! and the component in the direction ofc); !r +Ωn̂ × c relative to this will have ! a total angular momentum M r × (Ωn̂ ×=
rotation will be M ! ⋅ n,ˆ or, with u = relative zonal velocity = r cosφλ! , spherical
coordinates, r,φ,λ , (origin at the center of the earth), M ≡ M ⋅ n̂ = Ωr2 cos2 φ + ur cosφ . If a is the radius of the earth, r = a + r ' , and in the atmosphere r ' ≤ 12 km, a = 6400 km; ∴ r ' ! a , and we can approximate r ≅ a .
In the absence of any forces, n̂ ⋅ d ! M =
d (n̂ ⋅ ! M) = dM = 0 , and angular momentum
dt dt dt about the axis of rotation is conserved, i.e.
Ωa2 cos2 φ + ua cosφ = constant
The first term is the earth’s angular momentum, denoted Me, and the second term is the relative angular momentum, denoted Ma. For example, if a parcel moves nearer or further from the equator, while maintaining the same distance from the center of the earth, then asφ changes u must change. Since cosφ decreases as we move away from the equator u must increase, i.e., acquire a westerly component; and vice versa, a parcel moving towards the equator must acquire an easterly component. For example, consider a parcel that starts at the equator with u = 0. ∴ M = Ωa2 = constant, and
ua cosφ = Ωa2 (1− cos2 φ), u = Ωa tanφ sinφ.
The relative total angular momentum of the atmosphere, Ma, is
Page 2 of 25

M a = ∫ Madm = ∫ ua cosφ dm where dm is a mass element. However, this is not atm.
necessarily a constant. As we saw in Figure 7.15 in Peixoto and Oort (1992), the seasonal cycle is stronger in the Northern Hemisphere, and thus we might expect Ma to be larger in DJF than in JJA. This is in fact the case, as shown in Figure 11.2 in Peixoto and Oort (1992). In order for M to be conserved, the earth’s angular momentum must change in a compensating way, i.e. Ω, or the length of the day, must change. This in fact does happen, as shown in Figure 11.2 in Peixoto and Oort (1992). Note that the fluctuations are very small: if ρe is the density of the earth, then the total angular momentum of the solid earth is
M e = ∫ Ωr2 cos2 φ dm = ∫ Ωρer4 cos3 φ drdφdλ ;
and M = 2 mea2Ω ∼ 6 ×1033 kgm2/s , where me is the mass of the earth (assuming ρe = e 5
constant).
The fluctuations in Ma are ΔMa ∼ 1×1026 (from Figure 11.2 in Peixoto and Oort (1992))
and therefore the compensating changes in Me are
2 ΔΩ ΔTΔM ∼ M a2ΔΩ ∼ M ∼ M , where T = length of day.e 5 e e Ω e T
ΔM 1026 e ∼Thus the change in the length of day is given by ;
M 6 ×1033 e
8 ×10⁴
ΔT ∼ ∼ 10−3 sec.6 ×107
Note from Figure 11.2 in Peixoto and Oort (1992) that there does appear to be a secular trend in the length of day (not in Ma), which is believed to be due to exchanges of angular momentum between the earth’s crust and core. There is also some external forcing, i.e., tidal forcing (the earth’s rotation is slowing down very slowly), but these effects are even smaller than those seen in Figure 11.2 in Peixoto and Oort (1992).
There are two significant forces that do act to change M in the atmosphere, namely pressure forces and friction. Thus we can write for our conservation equation in spherical coordinates: dM = −
1 ∂p + a cosφF dt ρ ∂λ
where F is the frictional force in the longitudinal direction.
For the friction term, we can write
Page 3 of 25

! !
ρF ! = −∇ ⋅ τ
"
where τ!
is the stress tensor and thus the x component is xx +ρF = −(∂
∂τx
∂∂τyyx +
∂∂τzzx ) ≅ −
∂∂τzzx
because near the earth’s surface where the friction is concentrated, the vertical shears are much stronger than the horizontal shears (H ! L). Multiplying through by ρ and invoking continuity we have
d(ρM) ∂ ! ∂p − a cosφ ∂τ . zx = (ρM) + ∇ ⋅ (ρMv) = −
dt ∂t ∂λ ∂z
If we now integrate over the volume of the whole atmosphere,
∫ ∇ ⋅ (ρMv)dV = ∫ ρMv ⋅ ndS = 0 ˆ (Gauss’ Theorem),
∞ zx dz = τ 0 = surface wind stress, and
∂z− ∫ ∂τzs
2π
∫ ∂pdλ = 0 if z > zs , where zs(x, y) = height of surface topography,∂λ 0
but ≠ 0 if z < zs(x, y). Consider the case where there is a single mountain, as diagrammed, with the pressures indicated, at level z1.
Figure by MIT OCW.
∫ ∂pdλ = λ
∫ 1 ∂pdλ +
2
∫π ∂pdλ = p(λ1) − p0 + p0 − p(λ2 ) = PW'(z1) − PE'(z1) ;
∂λ ∂λ ∂λat z = z1 0 λ2
and we must sum the contribution over all mountains.
Page 4 of 25

∴ ∂ ∫ ρMdV = TM + TF where ∂t atm.
π /2 zs
TM = ∫ ∑(piE − piW)dA = ∫ a2 cosφdφ ∫ dz∑(piE − piW) , i −π /2 0 i
π /2 2π
TF = ∫ a cosφτ 0dA = ∫ ∫ a3 cos2 φτ 0dλdφ . −π /2 0
Thus the total angular momentum of the atmosphere can only be changed by mountain torques or surface stresses. If the system is stationary, then these must sum to zero. Note that τ 0 acts against the surface winds. Thus if the winds are from the west (u > 0), τ 0 < 0; and from the east (u < 0), τ 0 > 0.
Conservation Equation for Relative Angular Momentum
Now let us put the angular momentum equation in a more convenient form. Let M = Ωa2 cos2 φ + Ma
and substitute into our equation. Since
d ∂ u ∂ v ∂ ∂ = + + + w dt ∂t acosφ ∂λ a ∂φ ∂z
and d (Ωa2 cos2 φ) = −2Ωa2 cosφ sinφ(v) = −fva cosφ dt a
where f = 2Ωsinφ = Coriolis Parameter.
∴ dMa = −
1 ∂p + a cosφ(fv + F) dt ρ ∂λ
and we recognize the Coriolis Force. This accounts for the changes in u when a parcel moves to a different latitude, as required by momentum conservation. (If we substitute Ma = a cosφu this would become the conventional equation for u on a rotating sphere.)
Oort and Peixoto’s Balancing Method
Note that the equation that Oort and Peixoto (1983) used to calculate [ v ] indirectly was based on the equation for angular momentum conservation. For the relative angular momentum, M = a cosφu , in pressure coordinates, we havea
Page 5 of 25
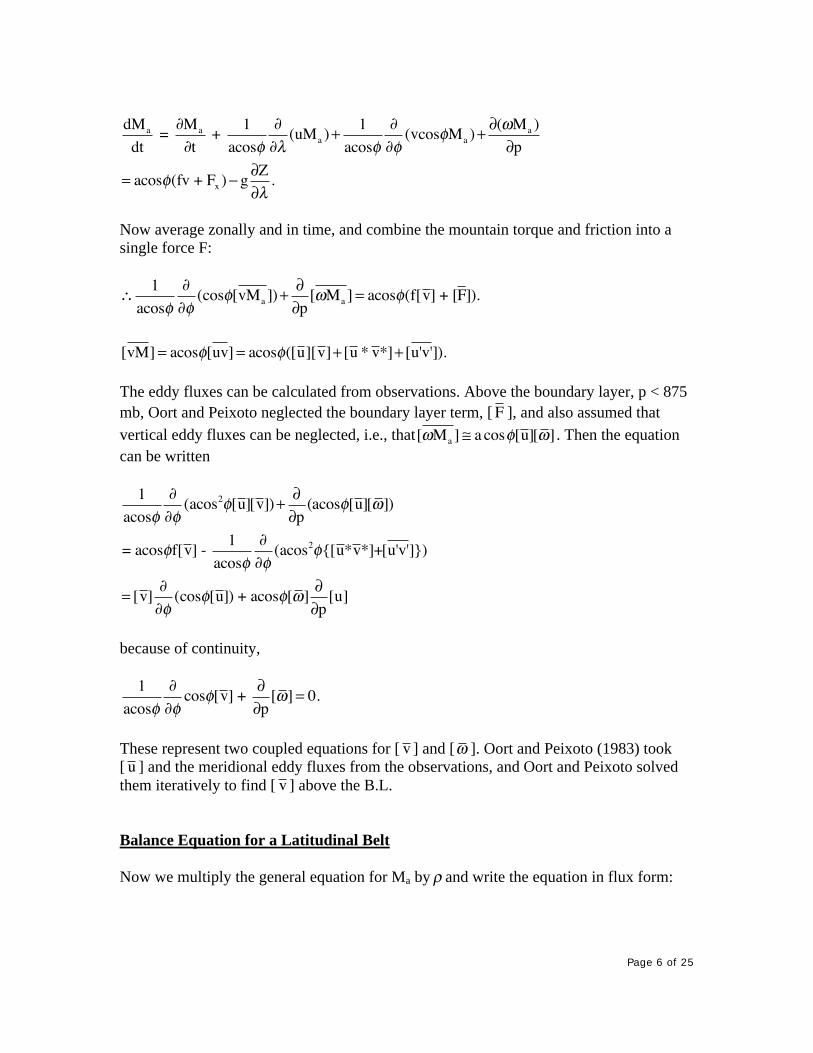
dM ∂M 1 ∂ (uM ) + 1 ∂ (vcosφM ) +
∂(ωM )a a + a=dt ∂t acosφ ∂λ a acosφ ∂φ a ∂p
∂Z = acosφ(fv + F ) − g .x ∂λ
Now average zonally and in time, and combine the mountain torque and friction into a single force F:
1 ∂ ∂∴ (cosφ[vM ]) + [ωM ] = acosφ(f[v] + [F]).acosφ ∂φ a ∂p a
[vM] = acosφ[uv] = acosφ([u][v]+ [u * v*]+ [u'v']).
The eddy fluxes can be calculated from observations. Above the boundary layer, p < 875 mb, Oort and Peixoto neglected the boundary layer term, [ F ], and also assumed that vertical eddy fluxes can be neglected, i.e., that[ωM ] ≅ a cosφ[u][ω] . Then the equationa
can be written
1 ∂ (acos2φ[u][v]) + ∂ (acosφ[u][ω])
acosφ ∂φ ∂p
1 ∂= acosφf[v] - (acos2φ{[u*v*]+[u'v']}) acosφ ∂φ
∂ ∂ = [v] (cosφ[u]) + acosφ[ω] [u] ∂φ ∂p
because of continuity,
1 ∂ ∂ cosφ[v] + [ω] = 0. acosφ ∂φ ∂p
These represent two coupled equations for [ v ] and [ω ]. Oort and Peixoto (1983) took [ u ] and the meridional eddy fluxes from the observations, and Oort and Peixoto solved them iteratively to find [ v ] above the B.L.
Balance Equation for a Latitudinal Belt
Now we multiply the general equation for Ma by ρ and write the equation in flux form:
Page 6 of 25

a∴ ∂(ρM ) 1 ∂ (ρuM ) +
1 ∂ (ρvcosφM ) + ∂(ρwM )a +
∂t acosφ ∂λ a acosφ ∂φ a ∂z
zx = − ∂p + acosφ(ρfv -∂τ ). ∂λ ∂z
Now we consider the balance that maintains ρMa, the relative angular momentum of the atmosphere. First we consider a stationary state (annual mean or solstice season) so ∂ = 0 . Then we integrate vertically, applying the B.C. that w = 0 at z = zs,∞. ∂t
1 ∂ ∞
∴ ∫ ρuMadz + 1 ∂ ∞
∫ ρvMacosφdz acosφ ∂λ acosφ ∂φzs zs
= −∞
∫ ∂pdz + acosφf ∞
∫ ρvdz + acosφτ 0 . ∂λzs zs
Next we integrate zonally, and invoke the cyclicality of ρuMa (note that u = 0 on the sides of mountains). Note also that mass conservation requires that 2π
∫ dλ ∞
∫ ρvdz = 0. 0 zs
Thus this term, which represents the transport of the earth’s angular momentum, has no net momentum transport. We can integrate ∂p / ∂λ as before to pick up the mountain torques. Thus we obtain
1 ∂ 2
∫π
dλ ∞
∫ ρvMacosφdz acosφ ∂φ 0 zs
∞ 2πi i= ∫ ∑(pE − pW )dz + acosφ ∫ τ 0 (λ)d λ.
zs i 0
If we adopt the convention that v = 0 when z < zs, then in the first integral we can replace the lower limit by z = 0 and then change to pressure coordinates. Then also introducing the [ ] operator we have
1 ∂ 2
∫π
dλ p
∫ 0 vMa cosφdp = 2π p0 ∂ ([vM ]cosφ)dp; ∫ acosφ ∂φ g agcosφ ∂φ a
0 0 0
where p0 = constant pressure > ps(max).
∴we can rewrite our balance equation as follows:
Page 7 of 25

∞1 p0 ∂ ([vM ]cosφ)dp = g i i∫ ∑(pE − pW )dz + agcosφ[τ 0 ]∫ acosφ 0 ∂φ a 2π zs i
Thus the divergence of relative angular momentum in a latitude belt (width dφ → 0) must be balanced by mountain torques and surface stress.
Figure by MIT OCW.
Note that the dynamical transport term can be written as [vM ] = acosφ[uv] = acosφ{[u][v]+ [u * v*]+ [u'v']}. a
Thus we can analyze the data to determine the different contributions to the total transport of relative angular momentum. Note also that if we now integrate over all latitudes, multiplying by the area element for a latitude belt,
2πa2 cosφdφ since v → 0 at φ = ±π / 2 , we obtain:
∞ π /2
g ∫ dz ∫ a2cosφdφ∑(pEi − piW) + 2πa3g ∫ cos2φdφ[τ 0 ] = 0
zs −π /2 i
i.e., the total area weighted sum of the mountain torques plus frictional stress must equal zero.
Observational Analyses: Figure 11.7 in Peixoto and Oort (1992) shows the annual mean total meridional angular momentum transport and its components as functions of height and latitude. This is from Peixoto and Oort (1983) – the 10-year MIT G.C. library. (Note that at a given level, the Coriolis term would dominate). We note:
1) Total [ uv ] is approximately anti-symmetric about the equator. Page 8 of 25

!" !
2) It is generally poleward, except at high latitudes. 3) It peaks at ~ 200 mb, 30o latitude. 4) It is dominated by the TE flux, [ u'v' ]. 5) [ u ][ v ] reflects the three celled [ψ ]. 6) The stationary eddies are primarily in the Northern Hemisphere.
1 ps The vertically averaged transports, i.e., ∫ [uv ]dp , etc., are shown in Figure 11.8 in ps 0
Peixoto and Oort (1992). To convert these to total angular momentum we would have to
multiply them by 2πa2
cos2φp . If ps = 1000 mb, then 2πa2ps = 2.56 ×10¹⁸ kg . Thes g g seasonal results, as well as the annual means, are shown. We note
1) [ u'v' ] dominates in all seasons. 2) [ u*v* ] is quite important in the Northern Hemisphere in winter. 3) The strong seasonal cycles in [ u*v* ] and [ v ][ u ].
What about the remaining terms in the balance? The mountain torque can in principle be calculated from maps of ps and zs (topography). The former analyses, based on weather station data, is at much lower resolution than the latter. The one analysis that has been carried out was by Newton (1971a). His ps data is at a much lower resolution (“synoptic” resolution) than topographic data, and thus his calculations in effect ignored torques acting on small scale topographic roughness. He used climatological data mainly for 1000 mb and 850 mb pressure surface heights, and linearly interpolated between them to
zs
get p(z). He combined these with topographic profiles to calculate ∫ ∑(piE − piW)dz 0 i
every 5o of latitude. Some examples of his results are shown in Figure 1 in Newton (1971a). On the left are topographic profiles at 35N and pressure height profiles. On the right are the deduced Δp's ( = pE – pW) vs. height acting on the smoothed topography. The zonal mean results are shown in Figure 11.12 in Peixoto and Oort (1992). These calculations should be pretty good (except for the unresolved component) because data on ps and zs are good.
The units are “Hadleys”, 1 Hadley = 1018 kg m2/s2.
The frictional torques are even harder to calculate. Attempts to do so have been based on the common parameterization of surface torque used in models, i.e.,
v uτ 0 = −ρcD s s
where “s” indicates surface values, and cD is a “drag” coefficient. The problem with calculations like this is that the formula is nonlinear, so that the meanτ 0 is not given solely by the mean winds, and that near the surface the winds are turbulent, and vary on short time scales that are not resolved by the station observations. Also cD is not a constant, but in general depends on the stability of the B.L. (i.e., the Richardson number) and the surface roughness.
Page 9 of 25

Newton (1971b) gathered in one figure different calculations of mean surface drag based on the drag law (Figure 1 in Newton (1971b)). Note the different formulas used for cD, shown in the figure’s inset. There is at least qualitative agreement among them. 3 are just for oceans; one (Kung, Δ 's ) includes land, but is not global. Note the stronger drags in the Southern Hemisphere.
By contrast it is much easier to calculate the divergence of [ vMa ], because this is produced by large scale circulations that are relatively well resolved by the observing network, at least in the Northern Hemisphere. Thus in practice [ τ 0 ] is calculated as a residual from the angular momentum balance equation:
∞1 p0 ∂ agcosφ[τ 0 ] = ([vM ]cosφ)dp - g ∫ dz∑(piE − pi ).∫ acosφ 0 ∂φ a 2π zs i
w
The divergence term, calculated again by Oort and Peixoto (1983) from the same analysis as Figures 11.7 and 11.8 in Peixoto and Oort (1992), is shown in the left side of Figure 11.12 in Peixoto and Oort (1992). It is plotted as the total torque needed to balance the divergence. We see that there is a strong westward torque required in mid latitudes, and a strong eastward torque in low latitudes. Comparing with the mountain torque on the right, we see that the mountain torque is generally positively correlated with the required torque, but is weaker, ranging from about half of the required torque in northern mid latitudes to about 1/8 in southern mid latitudes. The much smaller mountain torque in the Southern Hemisphere is what we would expect, because of the relative lack of mountains in the Southern Hemisphere. The difference must be balanced by the frictional torque. Referring to Figure 1 in Newton (1971b), again, we see that this is consistent with the estimated stronger frictional torque in the Southern Hemisphere. Indeed if we add the frictional and mountain torque together there is a rough quantitative agreement with the required torque. We can schematically summarize the atmosphere’s angular momentum cycle as follows
Figure by MIT OCW. Page 10 of 25

where F = friction torque, MT = mountain torque. We can infer vertical transports in the atmosphere and horizontal transports/torques below the surface in the land and oceans. These are both hard to measure, but could be calculated as residuals. Also the high latitude results in the atmosphere are not very reliable.
There has been one analysis of the atmospheric angular momentum balance based on the NCEP/NCAR re-analysis by Huang et al. (1999). Note that this model (like most nowadays) includes a parameterization of gravity wave drag, i.e., a parameterization of the effect of gravity waves generated by sub-grid scale topography. These gravity waves propagate into the stratosphere where they break and act as a drag on the westerly winds there. The momentum they deposit there is generated near the surface by mountain torques associated with the sub-grid scale topography, i.e., the stress associated with them must be parameterized. Huang et al. (1999) used 29 years of re-analysis data (1968-96). The basic equation that Huang et al. used to analyze the momentum balance was that for the total angular momentum,
∂ (ρM) + ∇ ⋅ (ρM) = − ∂p − a cosφ(∂τ zx + ∂τGW )
∂t ∂λ ∂z ∂z
where we have now added a term τGW to represent the gravity-wave drag. If we integrate this over the whole atmosphere, the divergence of the dynamical transport integrates to zero, and we obtain
∂M ∂M= a = TM + TF + TG (Note that M = M a because the Coriolis term integrates to∂t ∂t
zero.)
where
M = ∫ Mdm = ∫ ρMdV , π /2 2π
TGW = ∫ ∫ a3 cos2 φ τGW,Sdλdφ, −π /2 0
τGW,S = the gravity wave stress at the surface, and TM and TF are defined as previously.
Note that in equilibrium, or in an annual mean, each side of the equation should be zero, but there is a seasonal cycle in M , as we noted before, or at least there is in the relative angular momentum.
Huang et al. calculated the mean seasonal cycle for M , TM, TF, and TG from the 29 years of re-analysis data. In the re-analysis, data on u, and p are directly assimilated, and thus we would expect M and TM to be directly controlled by the data. On the other hand TF and TG are parameterized, and this will introduce error independent of errors in the
Page 11 of 25

!" !
observations or analysis. Huang et al. made the plausible assumption that if there is substantial error, i.e., the above equation is not well satisfied, then the main errors are likely to be in the sub-grid scale parameterizations. However, recall Oort (1978)’s result (Figure 12 in Oort (1978)) that there are huge errors in [ uv ] analyzed in the Southern Hemisphere. Figure 4 (top) and Figure 5 (top) in Huang et al. (1999) shows the mean
dMdifference (bias) between the torque required to explain and that calculated by thedt
model. Thus Figure 5 (top) in Huang et al. (1999) shows that on average, the total torque is about 10 Hadleys too large (too westward). This is huge when one recalls that the net torques locally are ~ 5 Hadleys (see Figure 11.12 in Peixoto and Oort (1992)). Recall that
M ∼ 1.4 ×1026 kg m2 /s and thata
1 Hadley = 1018 kg m2 /s2.
Thus if the NCEP model was not restrained by observations, the imbalance of 10 Hadleys implies a spin-down time of
1.4 ×1026 1t ∼ = 1.4 ×10⁷ sec. ∼ year! 1019 2
This is confirmed by Figure 8 in Huang et al (1999), which shows what happens in NCEP forecasts starting from observed (analyzed) states, compared to the actual subsequent observations. The relative angular momentum of the atmosphere systematically decreases compared to the observations, and rather rapidly. This is strong evidence of systematic bias in the NCEP model, and again raises the question of whether the results of data-assimilation based re-analyses are superior to purely data-based analyses. It also illustrates that a good NWP model is not necessarily a good climate model.
Where is the error in the NCEP model? Huang et al made several comparisons to gain insight about this. They noted that, if TGW is omitted, the angular momentum is much more closely in balance, as shown in the top of Figure 4 in Huang et al (1999). Without TG , the imbalance overall is reduced to about 2 Hadleys. They also compared their results with Newton (1972)’s earlier results which did not use a model. The comparison is shown in Figure 7 in Huang et al (1999). Their results for TM + TF are in excellent agreement with the earlier results, as shown in Figure 7 (a) in Huang et al (1999). However, note that Newton’s result is not in such good agreement with Peixoto and Oort (1992). (Compare Figure 11.12 in Peixoto and Oort (1992) with Figure 7a in Huang et al (1999)). In Newton’s result at 40N TF + TM in the annual mean is about –4 while Peixoto and Oort’s result is about –5.3. Since TF in Peixoto and Oort’s calculation was calculated as a residual, it could include some gravity wave drag. TG is shown separately in Figure 7 (d) in Huang et al (1999). It peaks at -1.8 Hadleys at 40N; and is opposite to vs . As expected, it is strongest in latitudes where it is most mountainous, and
Page 12 of 25

!" !
in those regions it is comparable to TM + TF . Huang et al. speculated that gravity wave drag is the main culprit; i.e., that the parameterization of τGW is poor. However the inadequacy of the rawinsonde network in the Southern Hemisphere might also be at fault.
Momentum Balance in Quasi-geostrophic Models
Finally we make a few comments about the required angular momentum balance in simplified models. In mid and high latitudes the motions are quasi-geostrophic, and thus in rectangular pressure coordinates we can write:
∂u ∂ ∂ ∂Φ ∂τ+ (u2 ) + (uv) = fv − + g∂t ∂x ∂y ∂x ∂p
Furthermore we assume that there is no topography and thus no mountain torque or gravity wave drag, and that the flow is stationary (annual mean, etc.). Then if we integrate zonally and vertically we are left with
0 + 0 + ∂
p
∫ 0
[uv ]dp = 0 + 0 + gτ0. ∂y 0
∂ΦFurthermore [uv] = [([u]+ v*)([v]+ v*)] = [u * v*] because to lowest order fv = . ∂x
∂ p0
∴ ∫ [u * v * ]dp = gτ0 = −ρgcD | vs | us.∂y 0
Therefore to lowest order the only contribution to the angular momentum flux is the eddy flux. This is a good approximation, as seen in Figure 11.7 in Peixoto and Oort (1992). Furthermore, when we have a convergence of eddy momentum flux, as in mid-latitudes as shown in Figure 11.7 in Peixoto and Oort (1992), this has to be balanced by surface westerlies, i.e., us > 0, which is what is observed. This picture is qualitatively correct, although mountain torque and perhaps gravity wave drag contribute some of the surface torque in the Northern Hemisphere.
Qualitatively we can regard the surface westerlies in mid-latitudes as being forced by the convergence of eddy momentum fluxes in that region. In order for this convergence to occur in the Northern Hemisphere, u* and v* must be negatively correlated in higher latitudes and positively correlated in lower latitudes as shown:
Page 13 of 25

y
u*v* < 0
x [u] accelerated
u*v* > 0
Note that the momentum transport by the eddies is up the gradient of angular momentum, i.e., it is strengthening the mid-latitude jet stream. Note particularly that in the Northern Hemisphere there is convergence of momentum between 30N and 60N and the maximum in [u] is at 35N (see Figures 7.15 and 11.8 in Peixoto and Oort (1992)).
Kinetic Energy: Later in the course we will look at the balance of kinetic energy in the atmosphere in the context of the total atmospheric energy cycle. However, there are some aspects of the kinetic energy which tie in with the angular momentum balance, and so we look at the kinetic energy here. We write the kinetic energy per unit mass:
1 1K = (u2 + v2 + w2 ) ≅ (u2 + v2 ).2 2
w2 is completely negligible because of the small aspect ratio: w H∼ ∼ 10−2 , w2 ∼ 10−4 u2; and in mid-high latitudes it is even smaller because the
u L HRossby number is small: w ∼ Rou, Ro ∼ 10−1. L
As usual, we will focus on the zonal mean, since longitudinal variations in the time mean state are smaller than in the latitudinal and vertical directions, i.e., Δulong ∼ 100 m2/s2 in the Northern Hemisphere and ~ 50 m2/s2 in the Southern Hemisphere vs 300 m2/s2 in the vertical and latitudinal directions. The zonal mean can be decomposed in our usual fashion:
[u2] = [u]2 + [u *2]+ [u '2 ], etc, and
1∴ K = KM + KSE + KTE , where KM = ([u2]+ [v2]), 2
1KSE 2([u *2]+ [v *2]) , etc.=
Page 14 of 25

Note that in the case of KM, [v] ∼ 10−1[u]and thus to a very good approximation
1KM ≅ [u2].2
Figure 7.22 in Peixoto and Oort (1992) illustrates the annual mean distribution of K, KTE, KSE, and KM vs φ and p. We note:
1. KTE ~ KM 2. The smallness of KSE 3. K, KTE, and KM are approximately symmetric about 0o.
Figure 7.20 in Peixoto and Oort (1992) shows the vertical mean of the individual components of KM, KTE, KSE. The seasonal cycle is now included and we note:
4. The seasonal cycle in KSE is strong and KSE is significant in Northern Hemisphere winter.
2 2 5. [u ' ] ∼ [v ' ]. This is particularly interesting. This “equi-partition” between the
two components of KTE tells us that typical TE’s, because they are quasi-geostrophic, are “square”:
∂Z ∂Zfv = g , fu = −g∂x ∂y
[u '2 ]
[v '2 ]
1/ 2 ⎞⎟⎟⎠∼
⎛ L L| u ' | g | Z | ⎜⎜⎝
∴ ∼ 1.∼ x ∼ x
| v ' | Ly g | Z | L y
Thus typical TE scales are the same in the N-S and E-W directions. Finally 6. We can calculate the correlation between u ' and v ' which is responsible for
maintaining the angular momentum balance: [u 'v ']r = .
([u '2 ][v '2 ])1/ 2
Referring to Figures 11.7, 7.20 and 7.22 in Peixoto and Oort (1992) we have at the peak in [u 'v '] in the annual mean in both hemispheres:
=KTE
12 ([u '2 ]+ [v '2 ]) ∼ [u '2 ] ∼ [v '2 ]
[u 'v '] ∼
40 m2 /s2
∼ 0.20∴ r = | KTE | 200 m2 /s2
Thus the eddies are not very efficient at transporting momentum into mid-latitudes. Page 15 of 25

Equation for the Kinetic Energy in [u]: This equation shows a useful relation between the kinetic energy in [u] and the angular momentum balance. We start with our equation for conservation of angular momentum (see Starr and Gaut, 1969):
∂ (ρM) + ∇ ⋅ (ρM) = − ∂p + a cosφF∂t ∂λ t
where M = Ωa2 cos2 φ + ua cosφ,and we now let Ft = total surface force due to everything, friction, MT, GW, etc. In this derivation we will neglect horizontal and time variations inρ, i.e., assume that ρ = ρ(z) only. We can relate the horizontal variations inρ to those in p through the equation of state:
p = RρT, ∴dp = RρdT + RTdρ; dp = dT dρ ;+
p T ρ
1From the first law of thermodynamics, if α = , for adiabatic motion ρ
dT dα c + p = 0; v dt dt
∴c dT = −pdα = ρp
2 dρ v
∴ dT =
pdρ = R dρ ; R = cp − cv , γ =
cp
T c ρ2T c ρ c v v v
dp = R dρ dρ ;∴ +
p cv ρ ρ
dρ = dp cv dp 1;∴ =
ρ p cv + R p γ
Now we estimate dp from the horizontal momentum equation:
fu = − 1 ∂p + ⋅ ⋅ ; ∴ fu ∼ δp ;ρ ∂y ρL
Page 16 of 25

u u2 dpR = ∴ ∼ o fL R L ρL o
∴ dρ ∼
1 ρ u2
∼ 1 u2
∼ u2
ρ γp Ro γRT Ro c2Ro
where c = speed of second ~ 330 m/s;
dρ 102 1∴ ∼ ∼ 10−4
ρ (3.3×10² )2 10
The vertical variations are of course O(1): ρ ∼ ρ0e−z / H , and H ~ 8 km.
Now we substitute u = [u] + u* in the angular momentum equation’s first term
∂ (ρM) = ∂ {ρa2 cos2 φ + ρa cosφ([u]+ u*)}
∂t ∂t ∂(ρ[u]) ∂(ρu*) = a cosφ + a cos φ .
∂t ∂t
Substitute this into the angular momentum equation and multiply by [u] = [λ! ]a cosφ
∴[u]∂(ρ[u]) + [u]∂(ρu*) + [λ! ]∇ ⋅ ρMv " = −[λ! ] ∂p + [u]Ft . ∂t ∂t ∂λ
∂ 1The first term is just ( ρ[u]2 ) , the rate of change of the mean kinetic energy in [u].∂t 2
[λ! ] is just the mean angular velocity relative to the rotating system. Now we integrate over the volume of a polar cap:
dV = a2 cosφdzdλdφ, 0 ≤ z ≤∞, 0 ≤ λ ≤ 2π, φ0 ≤ φ ≤ π / 2.
When we perform the integration over λ,we lose the second term on the left and the first on the right (i.e., we incorporate the mountain torque into Ft.) The third term on the left loses the x and p terms. Thus
∂ ∫ (1 ρ[u]2 )dA = − ∫ [λ! ] ∂ [ρvM cosφ]dA + ∫ [u]FtdA ∂t 2 a cosφ ∂φ pc pc pc
Page 17 of 25

where dA = 2πa2 cosφdzdφ, Ma = ua cosφ.
The first term on the right now in effect represents a potential source term for [u]2, while the second is generally a sink associated mainly with surface dissipation. From this first term, we see that there is kinetic energy generated in [u] if [λ! ] and the divergence of ρvM are negatively correlated, i.e., if there is convergence of angular momentum where the angular velocity is large. And conversely it is dissipated if there is a divergence of angular momentum where the angular velocity is large.
Figure 1a in Peixoto et al. (1973) shows the annual mean distribution of a[ λ! ] = [u]
cosφ from 6 different analyses (the analysis differences are however small.) The distribution is of course similar to that of [u] − see Figure 7.15 in Peixoto and Oort (1992) – except that the jet stream is broader on the poleward side. We note that the meridional momentum transport by the relative motions, averaged zonally, is
[ρa cosφuv] ≅ ρa cosφ[uv] ,
i.e., the [uv] transport seen in Figure 11.7 in Peixoto and Oort (1992) is also relevant here. The convergence seen in Figure 11.7 in Peixoto and Oort (1992) poleward of the peaks in [uv] around 30o latitude is just enhanced by thecosφ factor.
1 ∂ ∂A(N.B. (Acos φ) = − tan φA; ∴convergence is increased.) cosφ ∂φ ∂φ
Thus between about 30o and 50o latitude there is strong generation of mean zonal kinetic energy, i.e. of [u]2. There is also generation in low latitudes where there is divergence of angular momentum transport because[λ! ] < 0.
1Zonal Kinetic Energy ( [u]2 ) annual mean budget in the Northern Hemisphere2
∂ ∫ (1 ρ[u]2 )dA = − ∫ [λ! ] ∂ [ρvM cosφ]dA − ∫ [u]FdA = 0 ∂t 2 a cosφ ∂φ a t
Page 18 of 25

! ! !
z TE’s TE’s
+ + SE’s SE’s MMC MMC
Equator North Pole
- -all torques all torques
(see Figures 11.7 and 11.12 in Peixoto and Oort (1992)). + indicates regions of strong generation of zonal kinetic energy, and - indicates regions of destruction.
Referring to Figure 11.7 in Peixoto and Oort (1992), we see that [u * v*] is correlated
with [u 'v '], but is weaker. Thus the SE’s and TE’s have similar tilts. [u][v] generally supports the eddies in the tropics and mid-latitudes, although the latitudes of maximum convergence in mid-latitudes are offset. The MMC component can be understood from the [ψ] and [u] distributions.
Sources of Total Kinetic Energy
The kinetic energy can be analyzed in the context of the atmosphere’s full energy cycle, which we will do later in the course. It can also be analyzed in both z and p coordinates, and it is instructive to do both. In z coordinates, we start from our earlier equation
d 1 V2 ) = −ρ ( v ⋅ ∇p −ρwg + ρ
where V2 = u2 + v2 + w2, i.e., we have not made the assumption of H.E. Now we define
K = 1 ρV2, and use continuity to write the LHS by takingρ inside the derivatives, i.e.,2
Fv ⋅ dt 2
V2 ) =ρ d 1 ∂K vK = −! v ⋅
! ( + ∇ ⋅ ! v ⋅ ∇p −ρwg + ρ! F.
dt 2 ∂t
Now integrate over the whole domain, dV = dxdydz: Page 19 of 25

!
vKdV = 0 v ! ⋅ ˆ∫ ∇ ⋅ ! because of Gauss’ Theorem and the boundary condition n = 0
dV. (ditto plus continuity)− ∫ v ! ⋅ ∇pdV = ∫ p∇ ⋅ v !dV = − ∫ p dρ
ρ dt
∂ dα ! ∴ ∫ KdV = ∫ ρp dV − ∫ ρwgdV + ∫ ρv ! ⋅ FdV.
∂t dt
The first term we recognize from the first law of thermodynamics:
dT dα ! dT dα c + p = H, ∴ρcv = ρH! −ρp . v dt dt dt dt
Thus the first term on the RHS of the K equation and the last term on the RHS of the T equation represent the conversion of internal to kinetic energy,
! dαC(I,K) = ∫ p∇ ⋅ vdV = ∫ ρp dV, dt
i.e., the kinetic energy created by the expansion (divergence) of the fluid is at the expense of the internal energy.
The second term on the RHS of the K equation is the conversion of potential to kinetic energy, i.e.,
C(P,K) = − ∫ ρwgdV,
i.e., if light air rises and heavy air sinks, potential energy is converted to kinetic energy. Note that in equilibrium, if there is no flow of mass into the system,
∫ ρwgdA = C(P,K) = 0,
and thus no conversion of potential to kinetic energy. And finally the last term on the RHS of the K equation represents frictional dissipation, and is always negative since F is always opposed to v.! (Also recall that this term contributes to H! in the T equation.)
But it is also instructive to look at the kinetic energy equation in pressure coordinates, in which, with the assumption of a small aspect ratio, our equations of motion are
Page 20 of 25

! ! ! !
du ∂Z = fv − g + Fdt ∂x x
dv ∂Z = −fu − g + Fdt ∂y y
∂Z 1 .0 = −g − ∂p ρ
1The kinetic energy per unit mass is K = (u2 + v2 ).Therefore multiply the first two2
equations by u and v, respectively, and add:
dK ∂Z ∂Z∴ = −g(u + v ) + uFx + vFy;dt ∂x ∂y
Now integrate over the whole volume of the system in pressure coordinates: dV = dxdydp: We can simplify as follows: since
dK ∂K ! = + v ⋅ ∇K; dt ∂t
∫ v ⋅ ∇KdV = ∫ ∇ ⋅ vKdV − ∫ K∇ ⋅ vdV = ∫ ∇ ⋅vKdV since ∇ ⋅ v ! = 0 in p coordinates;
and by Gauss Theorem ∫ ∇ ⋅ ! = ∫ ! nKdS .vKdV v ⋅ ˆvol area
In pressure coordinates v ! ⋅ n̂ = 0 on all surfaces except the lower one, i.e., because of cyclicality there is no horizontal flow into the system, and at the upper boundary p = 0, ω = p! = 0 by definition. At the lower boundary, p = ps(x,y,t), ω = ωs . However at this boundary K ≡ 0 because of the frictional boundary condition. Therefore this term is also zero. Similarly, for the ∂K / ∂t term:
ps s ⎬∫ ∂Kdxdydp = ∫∫ dxdy
ps
∫(t )∂K dp = ∫∫ dxdy
⎧⎪⎨ ∂ ∫ Kdp − K(ps )
∂p ⎪⎫
∂t 0 ∂t ⎩⎪∂t 0 ∂t ⎭⎪
= ∂ ∫ Kdxdydp. ∂t
Therefore our equation when integrated over the whole domain becomes
Page 21 of 25

∂ ∫ KdV = ∫ {vH ⋅ F ! − g(u ∂Z ∂Z+ v )}dV
∂t ∂x ∂y
where dV = dxdydp.
Now consider the terms involving Z on the RHS:
! ! ! ∂Z ∂Z ∂Z because of continuity.∇ ⋅ (vZ) = v ⋅ ∇Z + Z∇ ⋅ v = u + v + ω ∂x ∂y ∂p
∴ ∫ (u ∂Z ∂Z ! ∂Z+ v )dV = ∫ (∇ ⋅ vZ −ω )dV ∂x ∂y ∂p
dV; by Gauss’ Theorem.= v ! nZdS − ∫ ω∂Z∫ ⋅ ˆ
∂p
The first term is again zero, because v ! ⋅ n̂ = 0, except at the lower boundary, where
v ! ⋅ ˆ ZnZ = ω .s s
∂ ∂Z ! ! ∴ ∫ KdV = ∫ gω dV + ∫ vH ⋅ FdV − ∫ ω Z dS. ∂t ∂p
s ssurface
The second term on the right represents friction. Since the frictional force is always directed against the motion, kinetic energy is lost to friction, i.e., v! H ⋅ F
! < 0 . The last term
on the right represents work done at the boundary by pressure forces and is generally very small. E.g., if ωs ~ 10 mb/day, Zs ~ 200 m, then since 1 mb = 100 Kg/m/s, ωsZs
~ 2 ×10⁻⁶ W/m2, which can be compared with other conversions, such as the remaining term, which we will look at later. They are O(1 W/m2).
∂Z 1There remains the other term on the right. If we substitute it becomes= − ∂p ρg
− ∫ αωdV. It looks like a potential energy conversion term, but it is not. Note that mass
conservation would require ∫ ωdV = 0 in p coordinates, but not ∫ αωdV = 0. It is analogous to a potential energy to kinetic energy conversion, i.e., it requires a correlation between light air rising and heavy air sinking, but in p coordinates this includes the conversion of internal energy as well.
Page 22 of 25

!
Eddy-Mean Flow Interactions
Now let’s use this equation to look at the possible kinetic energy exchanges between eddies and the mean flow. We introduce our zonal average operator and deviation, e.g.,
∫ KdV = 2π ∫ [K]dA, dA = dydp ;
divide by 2π, and let D = − ∫ [v! H ⋅ F]dA represent the friction. We neglect the surface term.
∴ ∂ ∫ [K]dA = ∫ g[ω∂Z]dA − D ∂t ∂p
1[K] = {[u2 ]+ [v2 ]}, [u2 ] = [u]2 + [u *2 ], etc.2
1 1Define KE = ([u *2 ]+ [v*2 ]), KM = ([u2 ]+ [v2 ])2 2
∴ ∂ ∫ [K]dA =
∂ ∫ (KM + KE )dA = ∫ g[ω∂Z]dA − D ∂t ∂t ∂p
But we can also derive a separate equation for ∂ ∫ KMdA from the momentum ∂t
equations. This term in effect represents an additional source/sink for KE. We write again our u and v equations, but in flux form:
∂u ! ∂Z+ ∇ ⋅ uv = fv − g + F∂t ∂x x
∂v ! ∂Z
∂t + ∇ ⋅ vv = −fu − g
∂y y+ F .
Take the zonal averages and multiply by [u] and [v] respectively: ∂ ∂(let ∇2 = the two-dimensional ∇, i.e., ( ) ):∂y, ∂p
∂ ![u] [u]+ [u]∇2 ⋅ [uv] = f[u][v]+ [u][F ] ,∂t x
Page 23 of 25

! !
∂ ! ∂[v] ∂t[v]+ [v]∇2 ⋅ [vv] = −f[v][v]+ [v]([Fy ] − g
∂y[Z]).
Now add and integrate over dA = dydp. As before, making use of continuity and H.E., we can replace [v]∂[Z] / ∂y by:
∫ [v]∂[Z] dydp = − ∫ [Z]∂[v] dydp = ∫ [Z]∂[ω] dydp = − ∫ [ω]∂[Z] dydp; ∂y ∂y ∂p ∂p
as before the surface term is negligible;
also again ∫ ∂KM ∂ ∫ KMdA,dA = ∂t ∂t
and we define DM = − ∫ [vH ] ⋅ [F]dA .
∴ ∂ ∫ KMdA = ∫ g[ω]∂[Z] ! !dA − DM − ∫ [u]∇2 ⋅ [uv]dA − ∫ [v]∇2 ⋅ [vv]dA . ∂t ∂p
∂Therefore substituting into our earlier equation for ∫ KMdA we have: ∂t
∂ ∫ KEdA ∂t
= ∫ g([ω∂Z] − [ω]∂[Z] ! !)dA − (D − DM) + ∫ [u]∇2 ⋅ [uv]dA + ∫ [v]∇2 ⋅ [vv]dA . ∂p ∂p
The last two terms tell us that whenever there is a positive correlation between the zonal mean horizontal velocity and the divergence of its momentum flux, the eddy kinetic energy increases. In effect mean flow kinetic energy associated with [u], [v], is being converted to eddy kinetic energy. These terms can also be rewritten by integrating by parts, e.g.,
∫ [u]{∂y −y0 ∂y ∂y dydp, ∂ [uv]}dydp = ∫ [u][uv] y0 dp − ∫ [uv]∂[u] dydp = − ∫ [uv]∂[u]
because of the boundary condition. Thus, for the last two terms all together we have
∂[u] + [uω]∂[u] + [v2 ]∂[v] + [vω]∂[v] }dA. − ∫ {[uv] ∂y ∂p ∂y ∂p
Page 24 of 25
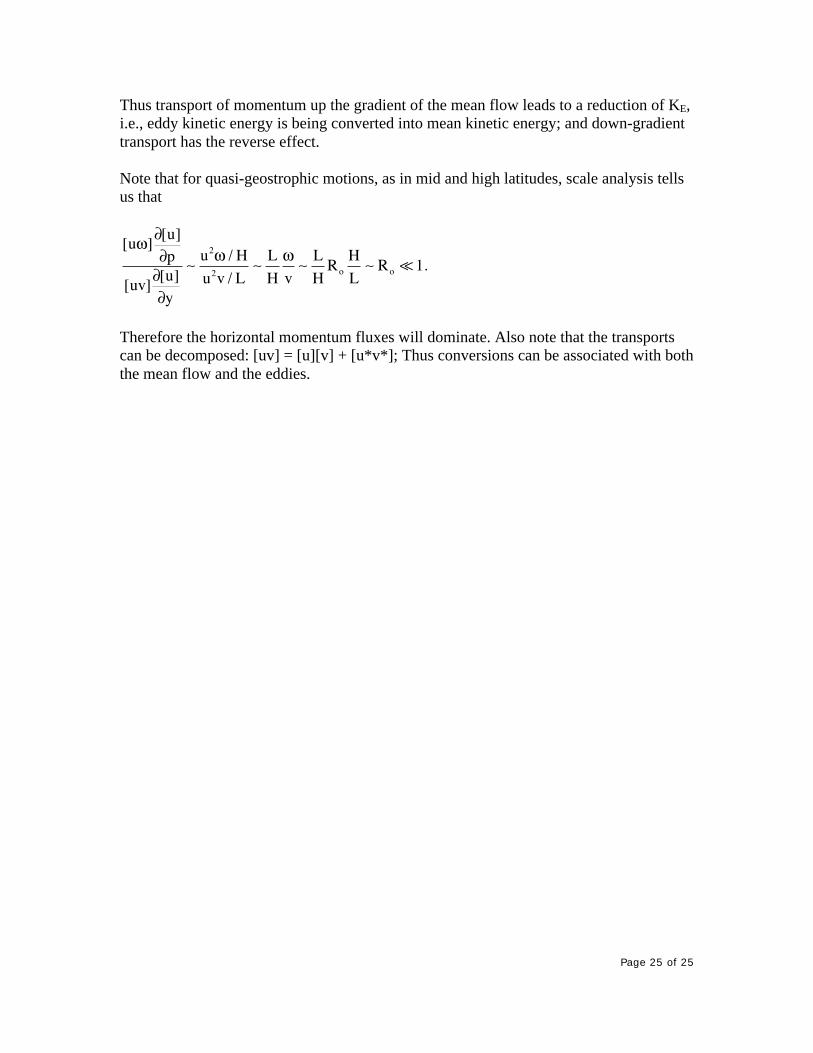
Thus transport of momentum up the gradient of the mean flow leads to a reduction of KE, i.e., eddy kinetic energy is being converted into mean kinetic energy; and down-gradient transport has the reverse effect.
Note that for quasi-geostrophic motions, as in mid and high latitudes, scale analysis tells us that
[uω]∂[u] ∂p ∼
u2ω / H ∼ L ω ∼ L H
∼ R " 1.R o
[uv]∂[u] u2v / L H v H o L
∂y
Therefore the horizontal momentum fluxes will dominate. Also note that the transports can be decomposed: [uv] = [u][v] + [u*v*]; Thus conversions can be associated with both the mean flow and the eddies.
Page 25 of 25