citation for the published paper: ingmar persson, paola d
TRANSCRIPT

This is an author produced version of a paper published in
Chemistry – a European journal.
This paper has been peer-reviewed but may not include the final publisher
proof-corrections or pagination.
Citation for the published paper:
Ingmar Persson, Paola D’Angelo & Daniel Lundberg. (2016) Hydrated and
Solvated Tin(II) Ions in Solution and the Solid State, and a Coordination
Chemistry Overview of the d(10)s(2) Metal Ions. Chemistry – a European
journal. Volume: 22, Number: 51, pp 18583-18592.
http://dx.doi.org/10.1002/chem.201603904.
Access to the published version may require journal subscription.
Published with permission from: Wiley.
Standard set statement from the publisher:
"This is the peer reviewed version of the following article: I. Persson, P. D'Angelo, D.
Lundberg, Chem. Eur. J. 2016, 22, 18583, which has been published in final form at
http://dx.doi.org/10.1002/chem.201603904 . This article may be used for non-
commercial purposes in accordance with Wiley Terms and Conditions for Self-
Archiving."
Epsilon Open Archive http://epsilon.slu.se

- 1 -
Hydrated and Solvated Tin(II) Ions in Solution and Solid State, and a
Coordination Chemistry Overview of the d10s2 Metal Ions
Ingmar Persson,a* Paola D’Angelob and Daniel Lundberga
a Department of Chemistry and Biotechnology, Swedish University of Agricultural Sciences,
P.O. Box 7015, SE-750 07 Uppsala, Sweden.
b Dipartimento di Chimica, Universitá di Roma “La Sapienza”, P.le A. Moro 5, I-00185
Roma, Italy.
Synopsis
The coordination chemistry of tin(II) is strongly affected by the partially filled Sn(5s)-
ligand(np) anti-bonding orbital causing structural distortions including a large void in the
coordination sphere. The mean tin-ligand atom bond distance varies largely with type of
ligand atom, even within the same coordination number. The actual coordination number and
bond angles of tin(II) complexes seems to depend on tin-ligand bond character.
Graphic Entry

- 2 -
Abstract
The coordination chemistry of d10s2 metal ions is strongly affected by an, at least partially,
occupied d10s2 metal ion-ligand anti-bonding orbital, which may cause a void in the coordination
sphere due to repulsion between the electrons in the anti-bonding orbital on the metal ion and
those on the ligands. The character of the formed d10s2 metal ion-ligand atom bond plays an
important role for the electron density in the anti-bonding orbital and thereby also for the
coordination chemistry. The hydrated tin(II) ion, [Sn(H2O)3]2+, and the trishydroxidostannate ion,
[Sn(OH)3]–, display very different mean Sn-O bond distances, 2.21 and 2.08 Å, and O-Sn-O
angles, ca. 78 and 90°, respectively, in both solid state and solution. By increasing the covalency
in the tin(II)-ligand bonds, the repulsion decreases and higher coordination numbers are obtained,
as seen in the solvated dimethylsulfoxide and N,N-dimethylthioformamide solvated tin(II) ions,
both five-coordinate in square-pyramidal fashion.

- 3 -
Introduction
In accordance with the general rule concerning oxidation states of the heavier p-block
elements, the group 14 elements tin and lead display the oxidation states +II and +IV with
preference for +II for lead and +IV for tin. Tin displays stable chemistry for both oxidation states
in water, while the chemistry of lead is dominated by lead(II) as lead(IV) compounds are strong
oxidants in aqueous systems, being spontaneously reduced to lead(II) under formation of oxygen
gas. The tendency of the heavier main group elements to adopt an oxidation state two steps
below being fully oxidized one has been attributed to the “inert pair” effect.[1] According to
valence bond theory an inert electron-pair can occupy a hybrid orbital formed by mixing the ns
and np orbitals on the metal ion and as such become stereo-chemically active. However,
according to molecular orbital theory the classical concept of 5s/5p orbital hybridization on the
tin(II) ion is regarded as incorrect. Instead the stereo-chemical activity is the result of tin(II) anti-
bonding orbital-donor atom interactions.[2] The character of the formed tin(II)-ligand atom bond
plays an important role for the electron density in the anti-bonding orbital and thereby on the size
of the created void, a so-called gap, in the coordination sphere of tin(II). With donor atoms
forming mainly electrostatic interactions, such as oxygen donor ligands, the antibonding Sn(5s)-
ligand(np) orbital couple with the Sn(5p) one. This coupling can only take place when the donor
atom of the ligand can generate a significant number of Sn(5s) states close to the Fermi level as
the large energy difference between Sn(5s) and Sn(5p) prevents them to form direct coupling.[2-4]
On the other hand, ligands forming mainly covalent bonds result in weaker antibonding Sn(5s)-
ligand atom(np)-Sn(5p) coupling causing a gradual decrease in the electron density in the anti-
bonding orbitals with increasing covalency of the Sn-ligand bond seen e.g. in a regular
octahedral configuration of telluride ions around tin(II) in solid SnTe.[5] Two general structural
types of tin(II) complexes are identified, the very uncommon holo-directed one without a gap in
the coordination sphere, only observed in solid SnTe,[5] and the totally dominating hemi-directed
one with a gap in the coordination sphere, as proposed by Shimoni-Livny et al. for lead(II),[6] but
applicable for other d10s2 metal complexes as well. The principles of the stereo-chemical activity
of d10s2 metal ions and the role of the anti-bonding metal-ligand molecular orbitals have been
described and discussed in a number of publication the last ten years,[2-4,7-10] and will not be
further discussed in this paper.
The structures of coordination compounds and complexes of tin(II) with oxygen donor
ligands in the solid state are very diverse with a broad range of coordination numbers, CNs, from

- 4 -
2 to 8,[11,12] Table S1. All these structures, including those with the highest coordination numbers,
have a visible gap in the coordination sphere, thus, all can be regarded as hemi-directed. This gap
is very significant for compounds and complexes with low coordination numbers, 2 ≤ CN ≤ 4,
with mean O-Sn-O bond angles typically at or below 90°, Table S1. Furthermore, the unusually
large mean Sn-O bond distance distribution within the same coordination number is striking, and
will be discussed in more detail, see Results and Discussion.
Despite the large number of coordination compounds of tin(II) reported in the solid
state,[11,12] Table S1, the knowledge about its coordination chemistry in solution is extremely
limited. The only two investigations of the structure of the hydrated tin(II) ion in aqueous
solution were both reported more than 30 years ago and are quite uncertain. A large angle X-ray
scattering (LAXS) study reported that tin(II) binds 2-3 water molecules at 2.3 Å,[13] and a
combined EXAFS and LAXS study reported that tin(II) binds 3-4 water molecules at 2.25-2.34
Å, with a significant gap in the coordination shell.[14] More recently, two theoretical simulations
made by Rode et al. have reported that the hydrated tin(II) ion binds eight water molecules in
asymmetrical bond distribution at 2.39 Å.[15,16] The first crystallographic study of a compound
with a hydrated tin(II) ion, [Sn(H2O)3](ClO4)2, was recently reported.[17] In this structure tin(II)
binds three water molecules at 2.200 Å, and the O-Sn-O bond angles are 76.9 o. Thus, the water
molecules occupy only a small fraction of the coordination sphere, less than 15 %, showing that
the anti-bonding orbital has a uniquely large influence on the coordination geometry. This is the
only homoleptic tin(II) complex with neutral and monodentate ligands reported so far.
The tin(II) ion undergoes hydrolysis even in weak acidic aqueous solution. The primary
hydrolysis product is the trinuclear [Sn3(OH)4]2+ complex with minor presence of mono- and
dinuclear complexes, [Sn(OH)]+ and [Sn2(OH)2]2+.[18] The structure of the trishydroxidostanna-
te(II), [Sn(OH)3]– complex in hyper-alkaline aqueous solution was reported recently.[19] The Sn-
O bond distance in the [Sn(OH)3]– complex, 2.080 Å, is in excellent agreement with the same
complex in the solid state, Na4[Sn(OH)3]2[Sn2O(OH)4],[20] mean Sn-O bond distance, 2.080 Å,
thus, remarkably shorter than in the hydrated tin(II) ion mentioned above.
The aim of this study is to get a deeper insight into the coordination chemistry of the d10s2
metal ions, focusing on tin(II), which is the least studied one in solution. Apart from the old and
highly uncertain data for the hydrate and some hydrolysis products in aqueous solution[13,14,19] no
other experimental structural information is available for solvated tin(II) ions in any other
solvent. Here, new experimental LAXS, EXAFS and XANES data are reported on the hydrated

- 5 -
tin(II) ion in aqueous solution, and the structure of [Sn(H2O)3](ClO4)2 has been re-determined
and confirmed, Table S2. Furthermore, the structure of the dimethylsulfoxide (dmso) solvated
tin(II) ion has been determined in solution and solid state, while the structure of the N,N-
dimethylthioformamide (dmtf) solvated tin(II) ion has been determined in solution as the
attempts to crystallization failed. The sulfur donor solvent dmtf may influence the coordination
chemistry of tin(II) in a different way than the oxygen donor solvents forming bonds with a
higher degree of covalency than oxygen donor solvents, seen in its significantly larger DS
number, 52, than for dmso (27.5) and water (18).[21] The coordination chemistry of the d10s2
metal ions will be summarized as they are the only metal ions whose coordination chemistry is
strongly affected by anti-bonding metal-ligand orbitals.
Results and Discussion
The Hydrated Tin(II) Ion
The crystal structure of [Sn(H2O)3](ClO4)2, 1, reported recently,[17] has been confirmed in
this study with the same structure parameters within the estimated errors. The structure of the
hydrated tin(II) ion in 1 is shown in Figure 1, selected bond distances and angles are given in
Table 1, the .cif file of 1 in Table S2 and a plot of the packing of 1 in the unit cell in Figure S1.
The EXAFS spectra of the hydrated tin(II) ion in aqueous solution and 1 are almost identical,
Figure 2, showing that the hydrated tin(II) ion has the same structure in aqueous solution as the
[Sn(H2O)3]2+ unit in 1. The structure parameters of the hydrated tin(II) ion from the EXAFS
studies of 1 and in aqueous solution are given in Table 2, and the fit of the experimental EXAFS
data are shown in Figure S2.
The radial distribution function (RDF) from the LAXS experiment on the aqueous tin(II)
perchlorate solution reveals four peaks at 1.45, 2.2, 2.9 and 4.15 Å, Figure 3. The peak at 1.45 Å
corresponds to the Cl-O bond distance within the perchlorate ion. The peaks at 2.2 and 4.15 Å
correspond to the first and second hydration sphere, and were refined to 2.206(6) and 4.126(9) Å,
respectively. The peak at 2.9 Å corresponds to the mean O(-H)∙∙∙O distance in the aqueous bulk.
The Sn-O distance is slightly longer in aqueous solution than in 1, seen in both EXAFS and
LAXS data, due to more complete and efficient hydration including a second hydration sphere.
The refined structure parameters are summarized in Table 3, the RDFs, the individual model
contributions to the RDF and the fit of the experimental data are shown in Figure 3.

- 6 -
Table 1. Selected bond lengths (Å) and angles (deg) in 1, 2 and 3. Mean values are given in italic
by type as discussed in the text, and a mean for all distances within parentheses.
[Sn(H2O)3](ClO4)2, 1
d(Sn-O)/Å O-Sn-O/° Reference
2.208(9) 77.8(4) this work
2.201(7) 76.9(3) 13
[Sn(OS(CH3)2)5](ClO4)2, 2
Bond distances/Å Bond angles/°
Sn1-O1 2.169(3) O1-Sn1-O2 76.1(1) O2-Sn1-O3 81.9(2)
Sn1-O2 2.301(3) O1-Sn1-O3 80.9(2) O2-Sn1-O4 154.8(1)
Sn1-O3 2.351(4) O1-Sn1-O4 81.8(2) O2-Sn1-O5 88.2(1)
Sn1-O4 2.375(6) O1-Sn1-O5 78.8(1) O3-Sn1-O4 92.4(2)
Sn1-O5 2.344(3) O3-Sn1-O5 160.3(1)
O4-Sn1-O5 89.4(2)
2.169/2.343 (2.308) 79.4 88.0
Figure 1. Structure of the [Sn(H2O)3]2+ unit
in 1, with a gap covering more than a
hemisphere. Thermal elipsoids (at 40 %
probability) are shown for all non-hydrogen
atoms.
Figure 2. Experimental EXAFS data solid 1
(black line) and the hydrated tin(II) ion
aqueous solution (grey line). The sections
with dashed lines represents regions with
glitches not included in the calculations.
The analysis of the XANES region of 1 and aqueous solution of tin(II) perchlorate shows a
very good fit with a three-coordination and O-Sn-O bond angles close to 78°, Figure 4. The Sn-O
-3
-2
-1
0
1
2
3
3 5 7 9 11 13 15
k/Å-1
c(k
)*k
3
- 7 -
bond distances are systematically ca. 0.04 Å shorter than in the other structure methods applied.
The existence of systematic errors of this order of magnitude in the analysis of the XANES data
has been pointed out in previous works, and it is probably due to the longer mean path of the
photoelectron in the XANES energy range with respect to the EXAFS approach, and to the use of
a phenomenological approach to deal with inelastic losses.[22,23]
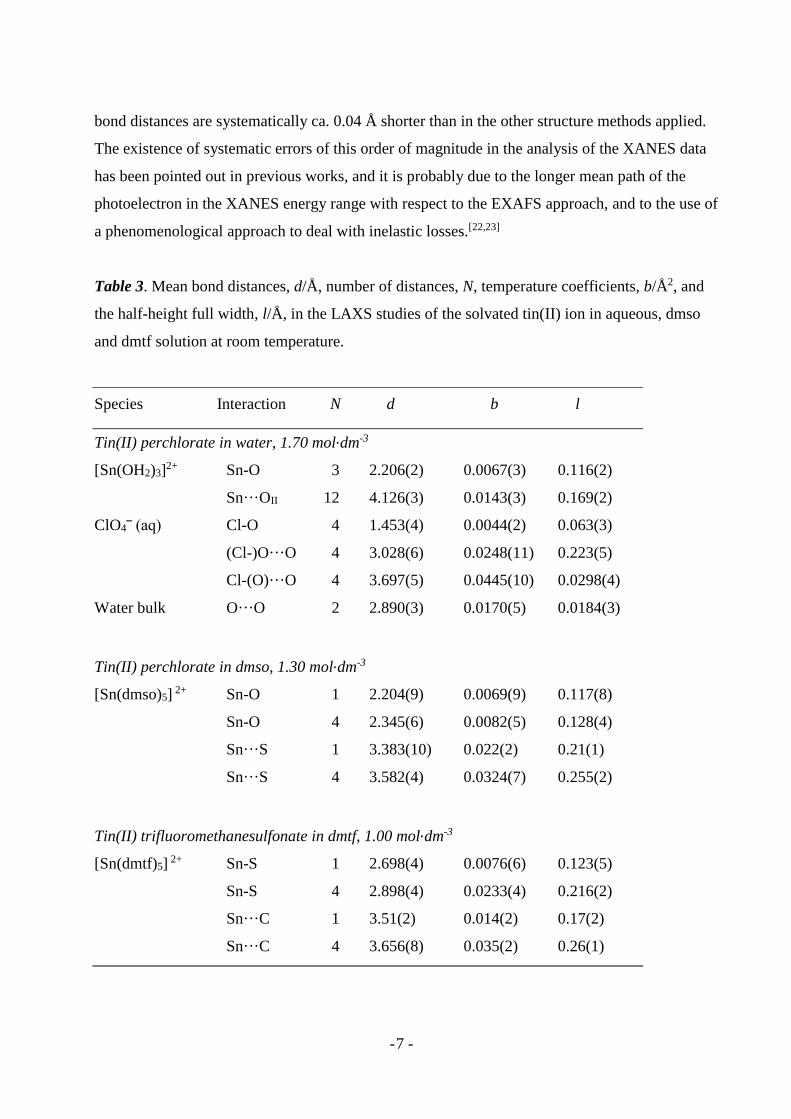
Table 3. Mean bond distances, d/Å, number of distances, N, temperature coefficients, b/Å2, and
the half-height full width, l/Å, in the LAXS studies of the solvated tin(II) ion in aqueous, dmso
and dmtf solution at room temperature.
Species Interaction N d b l
Tin(II) perchlorate in water, 1.70 mol.dm-3
[Sn(OH2)3]2+ Sn-O 3 2.206(2) 0.0067(3) 0.116(2)
Sn···OII 12 4.126(3) 0.0143(3) 0.169(2)
ClO4‾ (aq) Cl-O 4 1.453(4) 0.0044(2) 0.063(3)
(Cl-)O···O 4 3.028(6) 0.0248(11) 0.223(5)
Cl-(O)···O 4 3.697(5) 0.0445(10) 0.0298(4)
Water bulk O···O 2 2.890(3) 0.0170(5) 0.0184(3)
Tin(II) perchlorate in dmso, 1.30 mol.dm-3
[Sn(dmso)5] 2+ Sn-O 1 2.204(9) 0.0069(9) 0.117(8)
Sn-O 4 2.345(6) 0.0082(5) 0.128(4)
Sn···S 1 3.383(10) 0.022(2) 0.21(1)
Sn···S 4 3.582(4) 0.0324(7) 0.255(2)
Tin(II) trifluoromethanesulfonate in dmtf, 1.00 mol.dm-3
[Sn(dmtf)5] 2+ Sn-S 1 2.698(4) 0.0076(6) 0.123(5)
Sn-S 4 2.898(4) 0.0233(4) 0.216(2)
Sn···C 1 3.51(2) 0.014(2) 0.17(2)
Sn···C 4 3.656(8) 0.035(2) 0.26(1)

- 8 -
Figure 3. (Top) LAXS radial distribution
curves for a 1.70 mol.dm-3 aqueous solution
of tin(II) perchlorate. Upper part: Separate
model contributions (offset: 16) of the
hydrated tin(II) ion (cerise line), the
hydrated perchlorate ion (orange line) and
aqueous bulk (green line). (Middle)
Experimental RDF: D(r)-4pr2 o (black
line); sum of model contributions (black
line); difference (blue line). (Bottom)
Reduced LAXS intensity functions s.i(s)
(black line); model s.icalc(s) (red line).
Figure 4. Experimental XANES data (black
line) and modelled XANES data by MXAN
(red line) for 1/ the hydrated tin(II) ion in 1,
2/ the hydrated tin(II) ion in aqueous solu-
tion, the blue line is the best fit of a five-
coordinate model, 3/ the dimethylsulfoxide
solvated tin(II) ion in 2. The structure and
energy parameters given in Table 4.
-20
-16
-12
-8
-4
0
4
8
12
16
20
24
0 1 2 3 4 5 6 7 8 9 10
(D(r
)-4pr2
o)·
10
-3/e
2·Å
-1
r/Å
-2,0
-1,0
0,0
1,0
2,0
0 2 4 6 8 10 12 14 16
s·i(s
)·1
0-3
/e.u
.·Å
-1
s/Å-1
0,6
0,8
1,0
1,2
1,4
-10 10 30 50 70 90 110 130
eV
A 123

- 9 -
Table 4. Non-structural and structural parameters obtained from the minimization procedures. The refined non-structural
parameters are the Fermi energy level (with respect to the threshold energy), EF/eV, the threshold energy, Eo/eV, the energy
and amplitude of the plasmon, Es/eV and As, respectively, core-hole broadening, c/eV, and the width of the Gaussian
convolution function accounting for the experimental resolution, exp /eV, and the refined structural parameters are Sn-O
bond distance, d(Sn-O)/Å, O-Sn-O bond angle, (OSnO)/°, Sn--S bond distance, d(Sn--S)/Å, and Sn-O-S bond angle,
(SnOS)/°, while the coordination number around tin, N(Sn-O), was fixed.
Non-structural parameters
EF Eo Es As c exp
Sn2+/aq −4.98 29207.7 14.60 6.57 9.05 3.67
1 −5.01 29207.9 17.60 7.70 9.05 3.67
[Sn(OH)3]-/aq -8.49 29208.7 9.89 12.37 8.95 3.67
2 −2.27 29212.0 15.89 11.69 11.64 4.78
Structural parameters
d(Sn-O) N(Sn-O) (OSnO) d(S--H) (SnOH) d(Sn--S) (SnOS)
Sn2+/aq 2.123 3 77.4 2.815 127.8
1 2.165 3 80.5 2.885 130.7
[Sn(OH)3]-/aq 2.043 3 89.7 2.531 109.5
2.063 3 89.7 2.549 109.5
2 2.192 1 90 3.32 134.5
2.290 4 90 3.415 125.5
--------------------------------------------------------------------------------------------------------------------------------------------------

- 10 -
A five-coordinated square pyramidal model, similar to the one found in the dmso solvate, vide
infra, was also tested but the fit was significantly worse than for the three-coordinated model,
Figure 4. The structural and non-structural parameters of the XANES fittings are summarized in
Table 4.
The Sn-O bond distance in the hydrated tin(II) ion, 2.21 Å, is the longest Sn-O bond
distance reported for a three-coordinate tin(II) compound, ca. 0.13 Å longer than in the
trihydroxidostannate(II) complex, [Sn(OH)3]–.[19] Furthermore, the O-Sn-O bond angles in the
hydrated tin(II) ion are very small, ca. 78 °, showing that the size requirements of the anti-
bonding orbital is extensive.
The trishydroxidostannate(II) ion in alkaline aqueous solution
The Sn-O bond distance in the [Sn(OH)3]– ion in alkaline aqueous solution[19] and solid
state[20] is 2.08 Å. The mean O-Sn-O bond angle in the [Sn(OH)3]- complex in solid
Na4[Sn(OH)3]2[Sn2O(OH)4] is 88.7 o, while it was not possible to determine it from the EXAFS
data. The fitting of the XANES region resulted in a Sn-O bond distance of 2.04 Å, 0.04 Å shorter
than expected, vide supra, and a mean O-Sn-O bond angle of ca. 90 °, Table 4, which is in good
agreement with the observation in the solid state. The fit of the XANES region is shown in
Figure 4, and the refined non-structural and structural parameters are summarized in Table 4.
Relationship between Sn-O bond distance and O-Sn-O bond angle in three-coordinate tin(II)
complexes with oxygen donor ligands.
The only two three-coordinate tin(II) complexes studied in aqueous solution, [Sn(H2O)3]2+
and [Sn(OH)3]–, display a remarkable difference in both Sn-O bond distance and O-Sn-O bond
angle, not seen for any other metal ion system. For all metal ions other than the d10s2 ones, the
relationship between M-O bond distance and coordination number is very strict and it is possible
with good accuracy to predict the coordination number from the mean bond distance and vice
versa.[24] In order to shed light on the peculiar coordination chemistry of the tin(II) ion, all
reported three-coordinated tin(II) complexes with oxygen donor ligands are summarized, Table
S1. A scatter plot shows a weak relationship between Sn-O bond distance and O-Sn-O bond
angle with increasing bond angle with decreasing Sn-O bond distance, Figure 5. This indicates
that complexes with low degree of covalency in the Sn-O bonds, such as [Sn(H2O)3]2+, result in
high electron density in the anti-bonding Sn-O molecular orbital, weakening the Sn-O bonds, and

- 11 -
the O-Sn-O bond angle becomes smaller due to increased repulsion between electrons in the anti-
bonding orbitals and the coordinated ligands. With increasing degree of covalency in the Sn-O
bond the electron density in the anti-bonding Sn-O molecular orbital decreases allowing shorter
Sn-O bonds and larger O-Sn-O bond angles, as in [Sn(OH)3]–. However, when the degree of
covalency increases even more, the electron density in the anti-bonding orbital becomes
sufficiently low to allow higher CNs, see Summary.
Figure 5. The distribution of mean Sn-O
distance and their corresponding mean O-
Sn-O bond angle αof all reported tin(II)
hydrate and solvates (filled circles) listed in
the Inorganic Crystal Structure Database
(ref. 8) and the Cambridge Structural Data-
base (ref. 7), as compared to the hydrated
tin(II) ion in solution and solid state, and the
trihydroxostannate(II) anion in aqueous
solution and solid state.
The Dimethylsulfoxide Solvated Tin(II) Ion
The crystal structure of pentakis(dmso)tin(II) perchlorate [Sn(OS(CH3)2)5](ClO4)2, 2,
shows that tin(II) binds five dmso molecules in square pyramidal fashion, where the square plane
of oxygens is on the same side as the axial oxygen making it distorted and clearly affected by the
electron density in the anti-bonding orbital, responsible for the large gap in the coordination
sphere; the mean Oax-Sn-Oeq and Oeq-Sn-Oeq angles are 79.4 and 88.0 °, respectively, Table 1.
The Sn-O bond distance to the axially coordinated dmso, opposite to the anti-bonding orbital, is
markedly shorter, 2.172 Å, than those in the equatorial plane, mean 2.343 Å. This is the first
reported isolated five-coordinate tin(II) compound. The only two previously reported five-coor-
dinate tin(II) complexes with only oxygen donor ligands are in mixed tin(II)/tin(IV) tetrameric
compounds with two bridging oxo and eight bridging trifluoroacetato groups.[25,26] In these two
compounds, tin(II) has the same kind of distorted square pyramidal configuration as in 2. The
mean Sn-O bond distances in the axial and equatorial positions are 2.14 and 2.45 Å, respectively,
thus significantly different from the Sn-O distances in 2. The structure of the [Sn(OS(CH3)2)5]2+

- 12 -
unit is shown in Figure 6, and its position in the unit cell in Figure S3, selected Sn-O bond
distances and O-Sn-O bond angles are given in Table 1, and the .cif file in Table S3 in the
Supporting Material section.
Figure 6. Structure of the [Sn(OS(CH3)2)5]2+
unit in 2 with a gap covering roughly a
hemisphere. Thermal elipsoids (at 40 %
probability) are shown for all atoms; methyl
hydrogens have been removed for clarity.
Figure 7. (Top) LAXS radial distribution
curves for a 1.30 mol.dm-3 dimethylsulf-
oxide solution of tin(II) perchlorate. Upper
part: Separate model contributions (offset:
18) of the hydrated tin(II) ion (cerise line),
the perchlorate ion (brown line) and solvent
(green line). (Middle) Experimental RDF:
D(r)-4pr2 o (red line); sum of model
contributions (black line); difference (blue
line). (Bottom) Reduced LAXS intensity
functions s.i(s) (black line); model s.icalc(s)
(red line). -16
-12
-8
-4
0
4
8
12
16
20
24
28
32
0 1 2 3 4 5 6 7 8 9 10
(D(r
)-4pr2
o)·
10
-3/e
2·Å
-1
r/Å
-1,0
-0,5
0,0
0,5
1,0
0 2 4 6 8 10 12 14 16
s·i(s
)·1
0-3
/e.u
.·Å
-1
s/Å-1

- 13 -
The RDF of the LAXS data of the dmso solution of tin(II) trifluoromethanesulfonate reveal
three peaks at 1.5, 2.35 and 3.4 Å, and a marked shoulder at 1.8 Å, Figure 7. The peak at 1.5 Å
and the shoulder at 1.8 Å correspond to the intramolecular distances within the dmso molecule
and the trifluoromethanesulfonate ion, and the distances at 2.35 and 3.4 Å to the Sn-O and Sn∙∙∙S
distances in the dmso solvated tin(II) ion, respectively. The structure of the pentakis(dmso)tin(II)
ion in 2 was used as a starting model for the structure in solution as the observed Sn-O bond
distance at ca. 2.35 Å fits well with the structure of 2, and it is far too long for a lower
coordination number, Table S1. The Sn-Oeq and Sn-Oax bond distances were refined to 2.345(12)
and 2.20(2) Å, respectively, and the corresponding Sn∙∙∙Seq and Sn∙∙∙Sax distances to 3.582(8) and
3.38(2) Å, respectively, yielding Sn-O-S bond angels of 134(2) and 129(3)°, respectively. This
shows that the structure of the pentakis(dmso)tin(II) ion in 2 is maintained in dmso solution. The
structure parameters are given in Table 3 and the RDF and fit of experimental LAXS data are
shown in Figure 7. Analyses of the XANES region of 2 show a very good fit with a five-
coordination with four dmso molecules in the equatorial positions and one in the axial one, and
Oax-Sn-Oeq and Oeq-Sn-Oeq angles of ca. 82 and 90 °, respectively, and Figure 4. The Sn-O bond
distances are systematically ca. 0.04 Å shorter than in 2. The non-structural and structural
parameters of the XANES fittings are summarized in Table 4.
The reason for the large difference in structure between the hydrated and dmso solvated
tin(II) ions is likely the difference in the Sn-O bond characteristics with a larger covalent
contribution in dmso causing a lower electron density around tin(II), thereby decreasing the
electrostatic repulsion between the anti-bonding orbitals allowing more ligands to bind. The
oxygen in dmso has a significantly better ability to form covalent interactions than the oxygen in
water seen in the solvent ligands’ DS values, 27 and 18, respectively.[21] The pentakis(dmso)-
tin(II) ion is the first isolated tin(II) complex with monodentate ligands with a coordination
number larger than three; one four-coordinate complex with monodentate ligands has been
reported, but that compound has a chain-like structure.[27]
The N,N-Dimethylthioformamide Solvated Tin(II) Ion
The RDF of the LAXS data of the dmtf solution of tin(II) trifluoromethanesulfonate
solution reveal three peaks at 1.5, 2.75 and 3.4 Å, Figure 8. The intramolecular distances in dmtf

- 14 -
Figure 8. (Top) LAXS radial distribution
curves for a 1.00 mol.dm-3 N,N-dimethyl-
thioformamide solution of tin(II) perchlo-
rate. Upper part: Separate model contribu-
tions (offset: 24) of the hydrated tin(II) ion
(cerise line), the trifluoromethanesulfonate
ion (orange line) and solvent (green line).
(Middle) Experimental RDF: D(r)-4pr2o
(red line); sum of model contributions (black
line); difference (blue line). (Bottom)
Reduced LAXS intensity functions s.i(s)
(black line); model s.icalc(s) (red line).
Figure 9. Proposed structure of the
[Sn(SCN(CH3)2)5]2+ ion, featuring a
hemispherical gap.
-24
-16
-8
0
8
16
24
32
40
0 1 2 3 4 5 6 7 8 9 10
(D(r
)-4pr2
o)·
10
-3/e
2·Å
-1
r/Å
-2
-1
0
1
2
0 2 4 6 8 10 12 14 16
s·i(s
)·1
0-3
/e.u
.·Å
-1
s/Å-1

- 15 -
and in the trifluoromethanesulfonate ion give large contributions to all peaks, but the major
contribution to the latter two peaks corresponds to the Sn-S and Sn∙∙∙C distances in the dmtf
solvated tin(II) ion. The best fit of the experimental data was obtained by a five-coordinate
model with a similar configuration as the pentakis(dmso)tin(II) ion. The Sn-Seq and Sn-Sax bond
distances were refined to 2.898(8) and 2.698(8) Å, respectively, and the corresponding Sn∙∙∙Ceq
and Sn∙∙∙Cax distances to 3.656(16) and 3.51(4) Å, respectively, giving Sn-S-C bond angles of
102.5(1.2) and 104(2) °, respectively. A proposed model of the pentakis(dmtf)tin(II) ion is
shown in Figure 9.
As coordinating solvent dmtf has an even stronger ability to form covalent interactions than
dmso with DS values of 52 and 27, respectively,[21] and a high CN is therefore expected, but
apparently not sufficiently high to form a holo-directed complex. There are five two-coordinate
tin(II) complexes with monodentate sulfur donors, albeit anionic, with all featuring a distinct L-
shaped S-Sn-S center. The gap extends up to 280° while the mean Sn-S bond distance is 2.47 Å,
Table S4. Additionally, there are three three-coordinate structures of tin(II) complexes with
monodentate sulfur donor ligands have been reported. In these cases the ligands are anions, two
structures with the monodentate phenylthiolate ion, C6H5S–, and one with the thiobenzoate ion,
C6H5CS2–. For these structures, the tin(II) ion binds the three ligands in pyramidal fashion with a
mean Sn-S bond distance of 2.56 Å, a mean S-Sn-S bond angle of 91.5 °, thus a somewhat larger
angle than in the three-coordinate oxygen donor complexes, Tables S1 and S4. For higher
coordination numbers, no tin(II) complexes with only monodentate sulfur donor ligands have
been reported, Table S4.
Coordination chemistry and ionic radii of d10s2 metal ions
The coordination chemistry of the d10s2 metal ions is strongly affected by partially filled anti-
bonding metal-ligand molecule orbitals which may cause a significant gap in the coordination
sphere as discussed in the Introduction section. The configurations around the central atom in
tin(II) as well as thallium(I), lead(II) and bismuth(III) complexes and compounds in reported
solid state structures are summarized in Tables S1 and S5-S7, respectively. This summary shows
that all thallium(I) and tin(II) complexes/compounds reported so far in solid state, except SnTe,5
display a significant gap in the coordination sphere, i.e. hemi-directed coordination, as well as for
lead(II)[24] and bismuth(III) complexes/compounds with low coordination numbers, while those
with higher coordination number may be either hemi- or holo-directed, Tables S6 and S7. Hemi-

- 16 -
directed complexes display a wide bond distance distribution, sometimes several tenths of an
Ångström, and the distribution of mean bond distances for complexes and compounds with a
certain coordination number is much wider than for any other kind of metal ions; the typical
coordination geometries for hemi-directed d10s2 metal ions with coordination numbers 2-8 are
shown in Figure S4. This makes it not possible to give a well-defined ionic radius for hemi-
directed d10s2 metal ions, where instead a possible ionic radius range can be given, Table 5. This
means also that for the hemi-directed d10s2 ions it is not possible to predict the coordination
number of the metal ion from the metal-ligand bond distance, which is normally the case for
other metal ions. On the other hand, the holo-directed complexes have narrow bond distance
distribution, and the spread in the mean bond distances for a certain coordination number is
smaller making it possible to give an ionic radius in the same sense as for other metal ions, Table
5.
Table 5. Summary of observed ionic radius ranges for hemi-directed tin(II), thallium(I), lead(II)
and bismuth(III) ions for the coordination numbers, CNs, 2-8, and ionic radii for holo-directed
lead(II) and bismuth(III) ions for coordination numbers 6 and 8 for solid state structures assuming
a radius of oxygen donor ligands to 1.34 Å, ref. 29. * denotes that only a limited number of data is
available, see Tables S1, and S5-S7 for details.
CN 2 3 4 5 6 7 8
Hemi-directed complexes
Tin(II) 0.62-0.76 0.74-0.84 0.85-0.97 1.04-1.05* 1.05-1.18 ~1.26*
Thallium(I) 1.12-1.39 1.13-1.51 1.30-1.55 1.49-1.57* 1.52-1.67 1.57-1.61* 1.54-1.67
Lead(II) ~0.85* 0.88-1.02 0.89-1.10 1.08-1.22 1.17-1.26 1.23-1.34 1.31-1.34*
Bismuth(III) 0.69-0.81 0.82-0.96 0.89-1.06 0.99-1.22 1.08-1.21 1.11-1.20
Holo-directed complexes
Lead(II) 1.16 1.30
Bismuth(III) 0.98 1.12
As a consequence of the importance of the bonding character of the d10s2 metal-ligand bond, the
coordination number of solvates and complexes is independent of the chemical activity of the
ligand in solution as shown here for tin(II) in pure solvents and in hyper-alkaline aqueous
solution.[19] The hydrated tin(II) and lead(II)[28] ions are hemi-directed three- and six-coordinate

- 17 -
in aqueous solution, and the hydroxostannate(II) and -plumbate(II) complexes in hyper-alkaline
solution are both hemi-directed three-coordinate, [19,30] while hydrated bismuth(III) ion is holo-
directed eight-coordinate in aqueous solution.[31]
Conclusions
The coordination chemistry of tin(II), and the other d10s2 metal ions thallium(I), lead(II) and
bismuth(III), is strongly affected by filled or partly filled metal(ns)-ligand(np) anti-bonding
orbitals, which may form large voids in the coordination sphere and especially for complexes
with low coordination number. Therefore, the metal-ligand bond character is highly responsible
for the coordination number and geometry, with increasing voids with increasing electrostatic
character of the metal-ligand bond. Complexes with a void in the coordination sphere, hemi-
directed, are characterized by very broad bond distance distribution and may have very different
mean metal-ligand bond distance within the same coordination number, and without well-defined
ionic radii. On the other hand, complexes without a void, holo-directed, have narrow bond
distance distribution, and well-defined ionic radii for different coordination numbers can be
obtained, Table 5. Prime examples of hemi-directed complexes are the three-coordinated
[Sn(H2O)3]2+ and [Sn(OH)3]
- complexes in acidic and hyper-alkaline aqueous solution,
respectively,[19] vide supra. With increasing covalency of the metal-ligand bond the electron
density on the anti-bonding orbital decreases allowing higher coordination numbers seen in the
five-coordinate dmso and dmtf solvated tin(II) ions. Tin(II) seems to be stable in aqueous
solutions over long periods of time while in organic solvents as dmso and dmtf the solvent is
slowly reduced and tin(II) oxidized to tin(IV).
Experimental Section
Solvents. All water used was MilliQ-filtered. Dimethylsulfoxide, (CH3)2SO (Merck), was freshly
distilled under vacuum over calcium hydride, CaH2 (Fluka), before use, while N,N-
dimethylthioformamide, (CH3)2NCHS, (Sigma-Aldrich), was used as purchased.
Chemicals. Tin(II) oxide, SnO (Aldrich), perchloric acid, HClO4 (Fluka), and
trifluoromethanesulfonic acid, CF3SO3H (Fluka), were used as purchased.
Preparation of salts. Anhydrous tin(II) trifluoromethanesulfonate, Sn(CF3SO3)2, was prepared by
dropwise addition of trifluoromethanesulfonic acid to a slurry of tin(II) oxide under stirring until
a clear solution was obtained. The obtained solution was cooled to room temperature and filtered,

- 18 -
and thereafter put into an oven at 450 K to boil off water and excess acid. The obtained white
powder was ground into a fine powder and stored in oven at 450 K.
Trisaquatin(II) perchlorate, [Sn(H2O)3](ClO4)2, 1, was prepared by dropwise addition of
perchloric acid to a slurry of tin(II) oxide under stirring until a clear solution was obtained. The
volume of the solution was reduced by evaporation, and the obtained solution was refrigerated
for crystallization.
Pentakis(dmso)tin(II) perchlorate, [Sn(OS(CH3)2)5](ClO4)2, 2, was prepared by dissolving 1.0 g
1 (2.7 mmole) in 20 mL dry acetone and 1.0 mL 2,2-dimethoxypropane (8.1 mmole) was added,
and the solution was stirred for two hours, and thereafter 1.15 mL dimethylsulfoxide (16.2
mmole) was added and the resulting solution was stirred for another 30 minutes.[32] The volume
of the solution was reduced to ca. 5 mL by evaporation, and then refrigerated for crystallization.
Preparation of Solutions. The aqueous tin(II) perchlorate solution was prepared by dissolving 1
in 0.1 mol·dm-3 perchloric acid. The dmso solution of tin(II) perchlorate, and the dmtf solution of
tin(II) trifluoromethanesulfonate were prepared by dissolving appropriate amount of 2 and
anhydrous tin(II) trifluoromethanesulfonate in respective solvent. Composition, density and
linear absorption coefficients of the studied solutions are summarized in Table 7. Long-time
storage of the tin(II) dmso and dmtf solutions reveal slow reduction of the solvent to dimethyl
sulfide and sulfide ions, respectively, and tin(II) was oxidized to tin(IV). It is therefore important
to study freshly prepared solutions in solvents which may participate in redox reactions.
Table 7. Compositions (in mol·dm-3), densities (ρ), and linear absorption coefficients (μ) of the
aqueous, dimethylsulfoxide (dmso) and N,N-dimethylthioformamide (dmtf) solutions used in the
LAXS and/or XAFS measurements.
Sample [Sn2+] [X-] [solvent] /gcm‾3 /cm‾1
Sn(ClO4)2 in water a,b 1.700 4.400 45.028 1.456 9.45
Sn(ClO4)2 in dmso a,b 1.300 2.600 11.272 1.423 9.93
Sn(CF3SO3)2 in dmtf a,b 1.000 2.000 7.512 1.388 8.42
a LAXS b EXAFS
Single-Crystal X-ray Diffraction
Data were collected on a Bruker SMART CCD 1 k diffractometer at ambient room temperature,
Table 7. The crystals were mounted in glass capillaries, which were sealed by burning
- 19 -
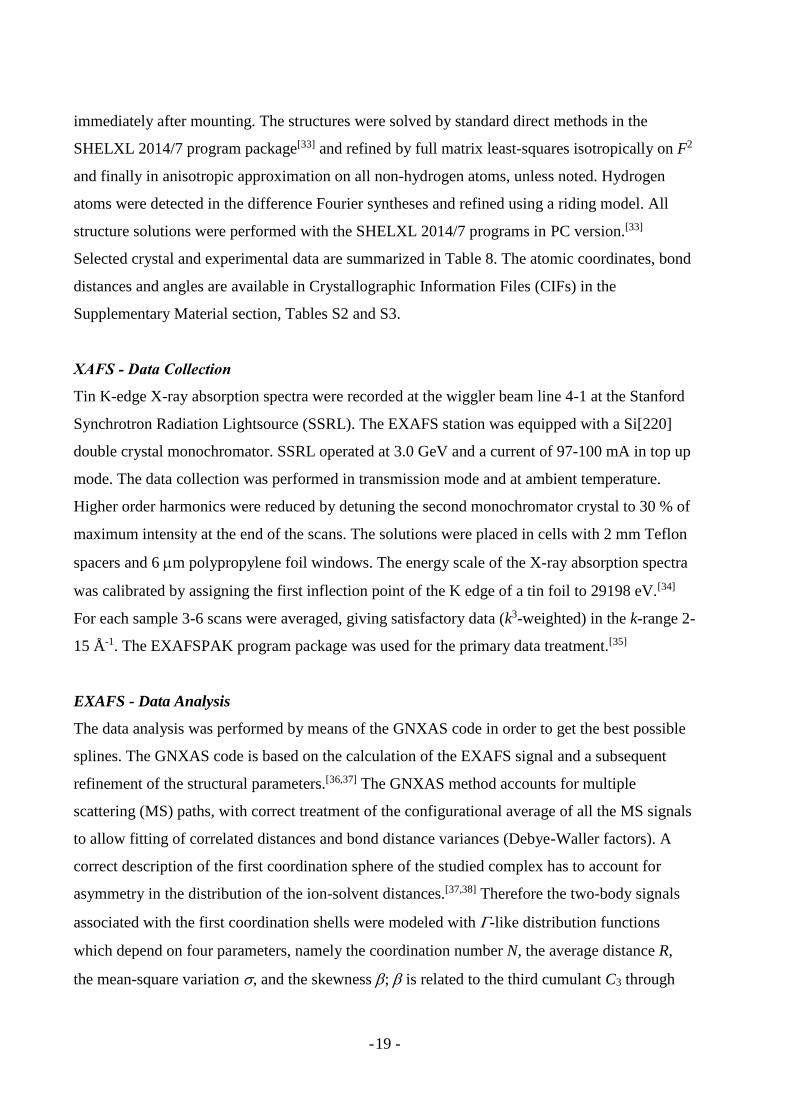
immediately after mounting. The structures were solved by standard direct methods in the
SHELXL 2014/7 program package[33] and refined by full matrix least-squares isotropically on F2
and finally in anisotropic approximation on all non-hydrogen atoms, unless noted. Hydrogen
atoms were detected in the difference Fourier syntheses and refined using a riding model. All
structure solutions were performed with the SHELXL 2014/7 programs in PC version.[33]
Selected crystal and experimental data are summarized in Table 8. The atomic coordinates, bond
distances and angles are available in Crystallographic Information Files (CIFs) in the
Supplementary Material section, Tables S2 and S3.
XAFS - Data Collection
Tin K-edge X-ray absorption spectra were recorded at the wiggler beam line 4-1 at the Stanford
Synchrotron Radiation Lightsource (SSRL). The EXAFS station was equipped with a Si[220]
double crystal monochromator. SSRL operated at 3.0 GeV and a current of 97-100 mA in top up
mode. The data collection was performed in transmission mode and at ambient temperature.
Higher order harmonics were reduced by detuning the second monochromator crystal to 30 % of
maximum intensity at the end of the scans. The solutions were placed in cells with 2 mm Teflon
spacers and 6 m polypropylene foil windows. The energy scale of the X-ray absorption spectra
was calibrated by assigning the first inflection point of the K edge of a tin foil to 29198 eV.[34]
For each sample 3-6 scans were averaged, giving satisfactory data (k3-weighted) in the k-range 2-
15 Å-1. The EXAFSPAK program package was used for the primary data treatment.[35]
EXAFS - Data Analysis
The data analysis was performed by means of the GNXAS code in order to get the best possible
splines. The GNXAS code is based on the calculation of the EXAFS signal and a subsequent
refinement of the structural parameters.[36,37] The GNXAS method accounts for multiple
scattering (MS) paths, with correct treatment of the configurational average of all the MS signals
to allow fitting of correlated distances and bond distance variances (Debye-Waller factors). A
correct description of the first coordination sphere of the studied complex has to account for
asymmetry in the distribution of the ion-solvent distances.[37,38] Therefore the two-body signals
associated with the first coordination shells were modeled with -like distribution functions
which depend on four parameters, namely the coordination number N, the average distance R,
the mean-square variation , and the skewness ; is related to the third cumulant C3 through

- 20 -
the relation C3=.. It is important to stress that the position of the maximum of the distribution,
Rm, is different and at shorter distance than the mean distance.
The standard deviations given for the reported refined parameters are obtained from k3-weighted
least squares refinements of the EXAFS function c(k), do not include systematic errors of the
measurements. These statistical error estimates provide a measure of the precision of the results
and allow reasonable comparisons e.g. of the significance of relative shifts in the distances.
However, the variations in the refined parameters, including the shift in the Eo value (for which
k=0), using different models and data ranges, indicate that the absolute accuracy of the distances
given for the separate complexes is within 0.005 to 0.02 Å for well-defined interactions. The
“standard deviations” given in the text have been increased accordingly to include estimated
additional effects of systematic errors.
Large-Angle X-ray Scattering
A large-angle θ-θ diffractometer was used to measure the scattering of Mo Kα radiation
(λ=0.7107 Å) on the free surface of an aqueous solution of tin(II) perchlorate, and dmso and dmtf
solutions of tin(II) trifluoromethanesulfonate. The solutions were contained in a Teflon cuvette
inside a radiation shield with beryllium windows. After monochromatization of scattered
radiation, by means of a focusing LiF crystal, the intensity was measured at 450 discrete points in
the range 1<θ<65 ° (the scattering angle is 2θ). A total of 100,000 counts were accumulated at
each angle and the whole angular range was scanned twice, corresponding to a statistical
uncertainty of about 0.3 %. The divergence of the primary X-ray beam was limited by 1 or 1/4 °
slits for different θ regions with some parts of the data overlapping for scaling purposes.
All data treatment was carried out by the KURVLR program[39] which has been described in
detail previously.[40] The experimental intensities were normalized to a stoichiometric unit of
volume containing one tin atom, using the scattering factors ƒ for neutral atoms, including
corrections for anomalous dispersion, Δƒ' and Δƒ",[41] and values for Compton scattering.[42] To
receive a better alignment of the intensity function, a Fourier back-transformation was applied to
eliminate spurious not related to any interatomic distances peaks below 1.2 Å in the radial
distribution function.[43] Least-squares refinements of the model parameters were performed by
means of the STEPLR program[44] to minimize the error square sum U = Σ w(s)·[iexp(s) - ical(s)]2.

- 21 -
Table 8. Crystallographic data and structure refinement details for tin(II) compounds 1 and 2.
1 2
Formula [Sn(H2O)3](ClO4)2 [Sn(dmso)5](ClO4)2
H6Cl2O11Sn C10H30Cl2O13S5Sn
MW 371.64 708.26
Diffractometer system Bruker Smart CCD Bruker Smart CCD
Radiation, /Å 0.71073 0.71073
Crystal system Hexagonal Triclinic
Space group P63 (No. 173) P-1 (No. 2)
a/Å 7.1492(13) 11.106(2)
b/Å 7.1492(13) 11.456(2)
c/Å 9.861(3) 12.482(3)
/° 90 66.51(3)
/° 90 81.04(3)
/° 120 89.84(3)
V/Å3 436.5(2) 1435.6(6)
T/K 295(2) 300(2)
Z 2 2
Dc/g cm-1 2.828 1.488
F2 356 716
µ/mm-1 3.587 1.488
crystal size/mm 0.2 x 0.25 x 0.3 0.25 x 0.27 x 0.32
θ range/° 3.29-25.68 1.80 - 25.02
index ranges -8 ≤ h ≤ 6 -11 ≤ h ≤ 13
-8 ≤ k ≤ 8 -12 ≤ k ≤ 13
-11 ≤ l ≤ 12 -14 ≤ l ≤ 14
Measured reflections 2317 7318
Unique reflections 547 (Rint = 0 0.0303) 3368 (Rint = 0.0145)
Data/Restraints/Params 547/4/53 4989/234/311
Goodness of fit 1.158 0.915
Refinement method Full-matrix least-sq. F2 Full-matrix least-sq. F2
Final R1, wR2 [I > 2(I)]a 0.0482,0.1117 0.0382, 0.0898
Final R1, wR2 [all data] 0.0490,0.1129 0.0631, 0.0954
Max. peak/hole eÅ-3 1.303/-1.844 0.586/-0.415
a R values are defined as: R1 = ||Fo|-|Fc||/|Fo|, wR2 = [[w(Fo2 – Fc
2)2]/[w(Fo2)2]]0.5; dmso =
(CH3)2SO

- 22 -
XANES – Data analysis
The analysis of the XANES data was carried out with the MXAN code.[45] MXAN uses the
muffin-tin (MT) approximation for the shape of the potential and a complex optical potential,
based on the local density approximation of the self-energy of the excited photoelectron. The MT
radii have been chosen on the basis of previous investigations and are 1.5, 1.0, 0.8, 0.7 and 0.21
Å for tin, sulfur, oxygen, carbon and hydrogen, respectively.[45] The self-energy is calculated in
the framework of the Hedin-Lundqvist (HL) scheme. Only the real part of the HL potential is
used in the calculation, while inelastic losses are accounted for by MXAN using a
phenomenological approach based on the convolution of the theoretical spectrum with a
Lorentizian function having an energy-dependent width of the form Γtot(E)= Γc+ Γmfp(E). The
constant part, Γc, includes the core-hole lifetime, while the energy-dependent term, Γmfp(E),
represents all the intrinsic and extrinsic inelastic processes. The function Γmfp(E) is zero below an
onset energy, Es, and begins to increase from a value, As, following the universal functional form
of the mean free path in solids. Both the onset energy Es and the jump As are introduced in the
Γtot(E) function via an arctangent functional to avoid discontinuities and to simulate the electron-
hole pair excitations. Their numerical values are derived at each computational step (i.e., for each
geometric configuration) on the basis of a Monte Carlo fit. The experimental resolution is taken
into account by a Gaussian convolution. The minimization procedures have been carried out
starting from the X-ray structures of triaquatin(II) perchlorate and pentakis(dmso)tin(II)
perchlorate, see cif files in the Supporting Material section. Least-squares fits of the experimental
data in the space of the structural and non-structural parameters are achieved by minimizing the
residual function defined as
Rsq= ∑wi(yitheo - yi
exp)/(εi2 ∑wi
m
i=1
m
i=1
)
where m is the number of data points, yitheo and yi
exp are the theoretical and experimental values of
absorption, respectively, i is the individual error in the experimental data set, and wi is a
statistical weight. For wi = 1 (constant), the square residual function, Rsq, becomes the statistical
w2 function. Here, we assumed a constant experimental error, = 1.2%, for the whole
experimental data set. Six non-structural parameters have been optimized, namely the Fermi
energy level, EF, the core-hole lifetime Γc, the experimental resolution Γexp, the threshold
energy Eo, and the energy and amplitude of the plasmon, Es and As, respectively.

- 23 -
Acknowledgments
We gratefully acknowledge the Swedish Research Council for financial support. Portions of this
research were carried out at the Stanford Synchrotron Radiation Lightsource (SSRL), which is
acknowledged for the allocation of beam-time and laboratory facilities. SSRL is a national user
facility operated by Stanford University on behalf of the US Department of Energy, Office of
Basic Energy Services. The SSRL Structural Molecular Biology Program is supported by the
Department of Energy, Office of Biological and Environmental Research, and by the National
Institute of Health, National Center for Research Resources, Biomedical Technology Program.
Supporting Material
Supporting information available: Additional information as noted in the text is available, free of
charge, via the internet at http://....
References
[1] a/ N. V. Sidgwick, The Electronic Theory of Valency, Clarendon Press, Oxford, UK, 1927;
b/ N. V. Sidgwick, H. M. Powell, Proc. R. Soc. (London) 1940, 176, 153-180.
[2] A. Walsh, G. A. Watson, J. Phys. Chem. B 2005, 109, 18868-18875.
[3] M. W. Stoltzfus, P. M. Woodward, R. Seshadri, J.-H. Klepeis, B. Bursten, Inorg. Chem.
2007, 46, 3839-3850.
[4] A. Walsh, D. J. Payne, R. G. Edgell, G. A. Watson, Chem. Soc. Rev. 2011, 40, 4455-4463.
[5] a/ R. F. Bis, J. R. Dixon, J. Appl. Phys. 1969, 40, 1918-1921; b/ R. F. Brebrick, J. Phys.
Chem. Solids 1971, 32, 551-562; c/ K. Dovletov, N. K. Samakhotina, A. V. Anikin, A.
Ashirov, Inorg. Mater. 1975, 11, 1036-1038; d/ U. Sondermann, J. Magnetism Magnetic
Mater. 1976, 2, 216-222; e/ Y. Sternberg, N. Yellin, S. Cohen, L. Ben Dor, J. Solid State
Chem. 1982, 43, 364-367; f/ E. I. Rogacheva, G. V. Gorne, S. A. Laptev, A. V. Arinkin, T.
B. Vesiene, J. Solid State Chem. 1982, 43, 364-367; J. Phys. Soc. Jpn. 1988, 57, 3820-3823;
g/ I. V. Dubrovin, L. D. Budennaya, I. B. Mizetskaya, E. V. Sharkina, Inorg. Mater. 1983,
19, 1603-1606; h/ S. A. Movsum-Zade, M. R. Allasov, A. A. Movsum-Zade, E. S.
Guseinova, Russ. J. Inorg. Chem. 1984, 29, 1194-1196; i/ R. T. Yakimova, E. P. Trifonova,
L. Karagiozov, S. Petrov, Cryst. Res. Technol. 1984, 19, K109-K112; j/ S. A. Stavrianidis,
A. A. Kutsiya, G. A. Keiyan, R. A. Markeliya, R. R. Shvangiradze, Inorg. Mater. 1984, 20,
1520-1521; k/ A. Ashirov, A. P. Gurshumov, K. Dovletov, N. A. Mamedov, Russ. J. Inorg.

- 24 -
Chem. 1986, 31, 729-731; l/ I. V. Dubrovin, L. D. Budennaya, I. B. Mizetskaya, E. V.
Sharkina, Inorg. Mater. 1986, 22, 515-520; m/ N. I. Dzyubenko, E. I. Rogacheva, G. V.
Gorne, N. K. Zhigarev, A. B. Ivanova, Inorg. Mater. 1988, 24, 1486-1488; n/ T. S. Yeoh, S.
G. Teoh, H. K. Fun, J Phys. Soc. Jpn. 1988, 57, 3820-3823; o/ R. Marx, K. J. Range, J. Less-
Common Met. 1989, 155, 49-59; p/ P. Bauer Pereira, I. Sergueev, S. Gorsse, J. Dadda, E.
Müller, R. P. Hermann, Physica Status Solidi B - Basic Solid State Physics 2013, 250, 1300-
1307.
[6] L. Shimoni-Livny, J. P. Glusker, C. W. Bock, Inorg. Chem. 1998, 37, 1853-1867, and
references therein.
[7] Mudring, A.-V. in Inorganic Chemistry in Focus III, ed. Meyer, G.; Naumann, D.;
Wesemann, L., Wiley-VCH Verlag, Weinheim, Germany 2006.
[8] Mudring, A.-V.; Rieger, F. Inorg. Chem. 2005, 44, 6240-6243.
[9] Walsh, A.; Watson, G. W. J. Solid State Chem. 2005, 178, 1422-1428.
[10] Mudring, A.-V. Eur. J. Inorg. Chem. 2007, 882-890, and references therein.
[11] F. H. Allen, Acta Crystallogr., Sect. B 2002, 58, 380-388.
[12] Inorganic Crystal Structure Database 1.4.6 (release: 2016-1); FIZ/NIST.
[13] G. Johansson, H. Ohtaki, Acta Chem. Scand. 1973, 27, 643-660.
[14] T. Yamaguchi, O. Lindqvist, T. Cleason, J. B. Boyce, Chem. Phys Lett. 1982, 93, 528-532.
[15] L. H. V. Lim, T. S. Hofer, A. B. Pribil, B. M. Rode, J. Phys. Chem. B 2009, 113, 4372-
4378.
[16] T. S. Hofer, A. B. Pribil, B. R. Randolf, B. M. Rode, J. Am. Chem. Soc. 2005, 127, 14231-
14238.
[17] E. Hennings, H. Schmidt, M. Köhler, W. Voigt, Acta Crystallogr., Sect. E. 2014, 70, 474-
476.
[18] R. S. Tobias, Acta Chem. Scand. 1958, 12, 198-223.
[19] E. G. Bajnóczi, E. Czeglédi, E. Kuzmann, Z. Hamonnay, G. Dombi, P. Forgo, O. Berkesi,
I. Pálinkó, G. Peintler, P. Sipos, I. Persson, I. Dalton Trans. 2014, 43, 17971-17979.
[20] H. G. von Schnering, R. Nesper, H. Pelshenke, Z. Anorg Allg. Chem. 1983, 499, 117-129.
[21] M. Sandström, I. Persson, P. Persson, Acta Chem. Scand. 1990, 44, 653-675.
[22] P. D’Angelo, D. Lucarelli, S. Della Longa, M. Benfatto, J. L. Hazeman, A. Feis, G.
Smulevich, A. Ilari, A. Bonamore, A. Boffi, Biophys. J. 2004, 86, 3882-3892.

- 25 -
[23] P. D’Angelo, A. Lapi, V. Migliorati, A. Arcovito, M. Benfatto, O. M. Roscioni, W. Meyer-
Klaucke, S. Della Longa, Inorg. Chem. 2008, 47, 9905-9918.
[24] R. D. Shannon, Acta Crystallogr., Sect. A 1976, 32, 751-767
[25] A. V. Zabula, A. S. Filatov, M. A. Petrukhina, J. Cluster Sci. 2010, 21, 361-370.
[26] T. Birchall, J. P. Johnson, J. Chem. Soc., Dalton Trans. 1981, 69-73.
[27] T. J. Boyle, T. M. Alam, M. A. Rodriguez, C. A. Zechmann, Inorg. Chem. 2002, 41, 2574-
2582.
[28] I. Persson, K. Lyczko, D. Lundberg, L. Eriksson, A. Płaczek, Inorg. Chem. 2011, 50, 1058-
1072;
[29] J. K. Beattie, S. P. Best, B. W. Skelton, A. H. White, J. Chem. Soc., Dalton Trans. 1981,
2105-2111.
[30] E. G. Bajnóczi, I. Pálinkó, T. Körtvéleysi, S. Bálint, I. Bakó, P. Sipos, I. Persson, Dalton
Trans. 2014, 43, 17539-17543.
[31] J. Näslund, I. Persson, M. Sandström, Inorg. Chem. 2000, 39, 4012-4021.
[32] K. Starke, J. Inorg. Nucl. Chem. 1959, 11, 77-78.
[33] G. M. Sheldrick, SHELX 2014/7: Program for Crystal Structure Refinement; University of
Göttingen, Göttingen, Germany, 2014.
[34] A. Thompson, D. Attwood, E. Gullikson, M. Howells, K.-J. Kim, J. Kirz, J. Kortright, I.
Lindau, Y. Liu, P. Pianetta, A. Robinson, J. Scofield, J. Underwood, G. Williams, H. Winick,
X-ray data booklet, Lawrence Berkley National Laboratory, 2009.
[35] G. N. George, I. F. Pickering, EXAFSPAK - A suite of Computer Programs for Analysis of
X-ray absorption spectra, Stanford Synchrotron Radiation Laboratory, Stanford, CA, 1995.
http://www-ssrl.slac.stanford.edu/~george/exafspak/exafs.htm
[36] A. Filipponi, A. Di Cicco, C. R. Natoli, Phys. Rev. B. 1995, 52, 15122-15134.
[37] A. Filipponi, J. Phys.: Condens. Matter, 1994, 6, 8415-8427.
[38] L. Hedin, B. I. Lundqvist, J. Phys. C: Solid State Phys., 1971, 4, 2064-2083.
[39] G. Johansson, M. Sandström, Chem. Scr. 1973, 4, 195-198.
[40] C. M. V. Stålhandske, I. Persson, M. Sandström, E. Kamienska-Piotrowicz, Inorg. Chem.
1997, 36, 3174-3182.
[41] International tables for X-ray Crystallography, Kynoch Press: Birmingham, U.K., 1974,
Vol. 4.
[42] D. T. Cromer, J. Chem. Phys. 1969, 50, 4857-4859.
- 26 -
[43] H. A. Levy, M. D. Danford, A. H. Narten, Data Collection and Evaluation with an X-ray
Diffractometer Designed for the Study of Liquid Structure, Technical Report ORNL-3960;
Oak Ridge National Laboratory: Oak Ridge, TN, 1966.
[44] M. Molund, I. Persson, Chem. Scr. 1985, 25, 197-197.
[45] M. Benfatto, S. Della Longa, C. R. Natoli, J. Synchrotron Radiat. 2003, 10, 51–57.