citation. international crops research institute for the ...oar.icrisat.org/1097/1/ra_00365.pdf ·...
TRANSCRIPT

Citation. Kleih, Ulrich, Bala Ravi, S., Dayakar Rao, B., and Yoganand, B. 2000. Industrial utilizationof sorghum in India. Working Paper Series no. 4. Patancheru 502 324, Andhra Pradesh, India:International Crops Research Institute for the Semi-Arid Tropics. 44 pp .
Titles in the Working Paper Series are informal communications, published without formal review.They aim to disseminate information and stimulate feedback from the scientific community. A largenumber of similar informal publications have been distributed by ICRISAT's Socioeconomics andPolicy Program, under various titles: Progress Reports, Discussion Papers, and Occasional Papers.
Abstract
Patterns of human consumption of sorghum are well documented. Much less is known about theindustrial utilization of the crop and the market opportunities this presents for poor sorghumproducers. This study documents the emerging patterns of industrial utilization and provides evidencethat between 10-40% of rainy-season sorghum is used for nonfood uses. Postrainy-season sorghumutilization remains solely for food purposes as it is not price competitive as an industrial raw material.The main utilization sectors are the poultry feed sector (approximately 0.5 million t per year); the dairyfeed sector (approximately 0.2 million t per year); and the grain alcohol sector (approximately 0.1million t per year). In the most important utilization sector, poultry feed, sorghum utilization is relatedto the price of competing cereals, particularly maize. Sorghum is used when prices are 20-30% lowerthan that of maize. With the demand for poultry feed estimated to be 15% per year, and with limitedopportunities for increased maize production, the demand for sorghum is likely to strengthen.However, the impact of trade liberalization and particularly maize imports will have to be considered.Institutional arrangements linking the key utilization industries and related public sector research havein the past been weak. Improving these linkages through public-private sector partnerships would helpto further support private sector market development for a commodity produced by some of India'spoorest farmers.
This publication is an output from a research project funded by the United Kingdom Departmentfor International Development for the benefit of developing countries. The views expressed arenot necessarily those of DFID [R 6687 : Crop Post-Harvest Programme].
© 2000 by the International Crops Research Institute for the Semi-Ar id Tropics ( ICRISAT).
A l l rights reserved. Except for quotations of short passages for the purposes of cri t icism and review, no part of this publication
may be reproduced, stored in retrieval systems, or transmitted, in any form or by any means, electronic, mechanical,
photocopying, recording, or otherwise, without prior permission of ICRISAT. It is hoped that this copyright declaration w i l l
not diminish the bona fide use of its research f indings in agricultural research and development in or for the tropics.
The designations employed and the presentation of the material in this publication do not imply the expression of any opinion
of the material in this publication whatsoever on the part of ICRISAT concerning the legal status of any country, territory, city,
or area, or of its authorities, or concerning the delimitation of its frontiers or boundaries. Where trade names are used this does
not constitute endorsement of or discrimination against any product by the Institute.

Industrial Utilization of Sorghum in India
Ulrich Kleih, S Bala Ravi, B Dayakar Rao, and
B Yoganand
ICRISAT
International Crops Research
Institute for the Semi-Arid Tropics
Patancheru 502 324
Andhra Pradesh, India
National Research Centre
for Sorghum
Rajendranagar,
Hyderabad 500 0 3 0
Andhra Pradesh, India
2000
Natural Resources Institute
University of Greenwich
Cha tham Mari t ime
Kent ME4 4TB
Uni t ed Kingdom

About the Authors
Ulrich Kleih Principal Economist, and Head Marketing Systems Economics Group,Natural Resources Institute,University of Greenwich, Chatham Maritime,Kent ME4 4TB, United Kingdom
S Bala Ravi Principal Scientist, National Research Centre for Sorghum,Rajendranagar, Hyderabad 500 030, Andhra Pradesh, India
B Dayakar Rao Scientist, National Research Centre for Sorghum,Rajendranagar, Hyderabad 500 030, Andhra Pradesh, India
B Yoganand Scientific Officer, International Crops Research Institute for theSemi-Arid Tropics, Patancheru 502 324, Andhra Pradesh, India

Acronyms and Abbreviations
AIDA
AISMA
AME
ANGRAU
APEDA
BCF
CBC
CFTRI
CLFMA
DFID
ENA
ENS
FAO
ICRISAT
IMDA
IMFL
IMRB
KLPD
MSP
NARS
NDDB
NRCS
NRI
NSSO
RS
SIF
USDA
All India Distillers' Association
All India Starch Manufacturers' Association
Apparent Metabolizable Energy
Acharya N G Ranga Agricultural University
Agriculture and Processed food products Export Development Authority
Balanced cattle feed
Crossbred cows
Central Food Technology Research Institute
Compound Livestock Feed Manufacturers' Association of India
Department for International Development
Extra Neutral Alcohol
Extra Neutral Spirit
Food and Agriculture Organization of the United Nations
International Crops Research Institute for the Semi-Arid Tropics
Indian Maize Development Association
Indian Manufactured Foreign Liquor
Indian Market Research Bureau
Kilo Litres Per Day
Minimum Support Price
National agricultural research system
National Dairy Development Board
National Research Centre for Sorghum
Natural Resources Institute
National Sample Survey Organisation
Rectified Spirit
Saccharification and Instant Fermentation
United States Department of Agriculture
Exchange rate (August 1998)
£1 = Indian Rupees 70
US$1 = R s 42


Contents
Acknowledgments 1
Summary 2
Recommendations 5
Introduction 6
Background 6 Methodology 6 Global sorghum utilization 6 The Indian sorghum economy 7
Animal feed sector 9 Increasing demand for livestock products 9 The feed industry 10The poultry industry 11The dairy industry 16
Alcohol 21The industry 21Production of grain-based alcohol 22Alcohol from sorghum 23Prospects 24
Starch industry 25An overview 25Sorghum as a raw material 25Prospects 26
Other industries 27Brewing 27Industrial food processing 28Sorghum milling 28Exports 28
Maize, industrial sorghum's main competitor 30
References 31
Appendix 32


A c k n o w l e d g m e n t s
The authors would like to thank the International Crops Research Institute for the Semi-Arid Tropics(ICRISAT), the National Research Centre for Sorghum (NRCS), and the Natural Resources Institute(NRI) for the institutional support rendered during the course of this study. Thanks must go especiallyto Andy Hall, Co-ordinator of the NRI/ICRISAT sorghum project, B S Rana, Director of NRCS, andParthasarathy Rao, Socioeconomics and Policy Program (SEPP), ICRISAT, for their technical andfacilitating contributions during various stages of the study.
The team is particularly grateful to R B Somani of Dr Panjabrao Deshmukh Krishi Vidyapeeth,Akola, who provided information and participated in the field survey in Madhya Pradesh.
Our thanks to the several members of the industries visited, without whose co-operation and frankexchange of ideas, the study would not have been possible.
1

S u m m a r y
This study is based upon fieldwork undertaken in mid-1998 in the context of the project 'Sorghum inIndia: Technical, policy, economic, and social factors affecting improved utilization', which wasfunded by the Department for International Development (DFID) and jointly undertaken by ICRISAT,NRCS, and NRI.
The main industries using sorghum in India are the animal feed sector, alcohol distilleries, andstarch industries. Only rainy-season sorghum is used for industrial purposes. Postrainy-sorghum is a highly valued foodgrain, and thus too expensive to be used as industrial raw material.
Animal Feed SectorWhile discussing sorghum utilization for animal feed in India, one has to distinguish between poultryand dairy production. Although the latter has a solid foundation in the co-operative sector, the poultryindustry appears to be more dynamic.
According to poultry producers and feed millers, very little sorghum was used in poultry feed in1998/99 due to the availability of maize and its price advantage. Nevertheless, it was acknowledgedthat in the past, when maize was expensive, sorghum had been used at an inclusion rate of up to 10%in the case of broilers and up to 15% in the case of layers. Estimates of the industrial demand forsorghum are summarized in Table 1.
The demand for sorghum in poultry feed largely depends on the price of maize, which is the energysource preferred by poultry producers. According to industry sources, to make sorghum competitive,its price should be 20 - 30% lower than that of maize.
Table 1. S u m m a r y of indust r ia l d e m a n d ( '000 t ) for s o r g h u m in Ind ia .
Industry
Poultry feed
Broilers
Layers
Others
Dairy feed
Alcohol
Starch
Brewing
Food industry
Exports
Total
19981
86-129
312-468
2 0 - 30
160-240
90-100
50
0
0
0
718-1017
2 0 1 02
570-1150
1,100-1830
156-234
290-570
200-500
30-80
-
0
-
2346-4364
1. These figures reflect the average utilization of sorghum during the 1990s, based on past inclusion rates and current requirements of raw
material, rather than on specific data for 1998. The poultry and starch industries use sorghum only when maize is expensive or not
readily available.
2. Figures are projections.
2
Despite the recession in the Indian economy which started towards the end of the 1990s, thepoultry sector is expected to grow at a relatively high rate, i.e., 8 - 1 0 % per annum in the case of eggproduction, and about 15% per annum in the case of broilers.
The resulting increased demand for poultry feed is expected to lead to a deficit in energy sources,in particular, owing to the limited supply of maize. Imports of the latter are being considered but arecurrently too expensive due to the lack of adequate port handling infrastructure and transport facilities.As a consequence, sorghum appears to stand a chance as an alternative raw material in this sector.However, it may face competition from imports in the medium to long term.
The limited inclusion of sorghum in poultry feed and its relatively low status as a raw material ispartly due to perceptions and misconceptions surrounding the crop, such as:
• The level of tannin in Indian sorghum• The level of mycotoxins in blackened (i.e., molded) grain• Its energy value as compared to maize• Difficulties in sorghum processing• Lack of carotenoids for yolk pigmentation.
In this context, it appears that the industry could benefit from the availability of more accurateinformation on the feed value of the grain, and better linkages with sorghum researchers.
In the case of dairy feed, the co-operative sector readily acknowledges the inclusion of sorghum intheir livestock diets, although not all co-op feed mills use it. In general, relatively less grain (about10% depending on the type of feed) is used in dairy feed formulations. It is estimated that in 1998,approximately 50% of the commercial dairy feed producers (i.e., 4 million t in total) used sorghum atan inclusion rate of up to 10%.
According to feed millers, sorghum is included in feed rations mainly due to its cost, availability,and quality. According to some members of the industry, storage of sorghum poses a problem,particularly when the grain is used several months after harvest.
Although ruminants are less susceptible to partly damaged grain or the presence of tannin, it seemsthat private dairy feed millers in particular could benefit from more scientific information on thepossibility of including sorghum in rations. This should also give sorghum a higher status as a feedingredient. Animal feed specialists from NRI would be in a position to advise on this issue.
Apart from commercial feed manufacturers, small-scale dairy farmers are likely to consumesubstantial quantities of sorghum grain, particularly in regions where the crop is grown.
Alcohol DistilleriesAlthough the quantity of sorghum grain presently used by the alcohol sector is comparatively low, itseems to be the most "enthusiastic" user of the crop as an industrial raw material. With recent changesin government policies on licensing alcohol production and trade, the use of grains to produce potablealcohol is being promoted, thereby providing an opportunity for sorghum to gain greater acceptabilityas a raw material in the industry.
There are few complaints about sorghum, although some distillers indicated a preference forvarieties with a higher starch content and less protein. Distilleries had no objection to using severelyblackened grain as long as the starch content was acceptable.
In general, like most other industrial users, distilleries purchase rainy-season sorghum throughtraders or brokers in main producing centers. Though there were few complaints about this system,
3

some distillers felt that brokers sometimes abused their position to "control" the market. In thiscontext, contract farming may be an option providing better linkages between producers and industrialusers.
Starch IndustriesSome of the country's main starch manufacturers, who are primarily based in Ahmedabad, have usedup to 50 000 t of sorghum in the past when maize was in short supply. Starch producers have evenundertaken their own research into sorghum-based starch manufacturing technologies, and theirconclusion was that sorghum was not a preferred raw material and would only be used if there were noalternatives.
In order to improve the supply of maize, the starch and poultry industries have formed anassociation with maize research institutes called the Indian Maize Development Association (IMDA).
Other IndustriesAlthough beer brewers are aware of sorghum-based beer production in Africa, they prefer barley maltas the principal raw material. In addition, broken rice or flaked maize are used as adjuncts. However,one brewery (i.e., Hindustan Breweries in Mumbai) expressed interest in undertaking trials usingsorghum as an adjunct.
With the exception of a small market for speciality breads in urban centers, sorghum is notaccepted as a raw material for industrial food processing. Wheat flour or maize starch are the preferredingredients. Composite flours do not currently appear to be an option in bread baking or biscuitmanufacturing.
Export of sorghum does not appear to be an option for the time being. Moreover, Indian sorghumat present is not globally competitive and export quotas for coarse grains are usually taken up bymaize.
4

R e c o m m e n d a t i o n s
The following initiatives may be considered to improve the prospects for industrial utilization ofsorghum:
• Applied research and extension involving the private sector. A better link between institutionsinvolved in sorghum research and industries should improve the status of the crop. For example,on-farm feed trials with poultry farmers could lead to more accurate information on Indiansorghum varieties and make them more acceptable as a raw material.
• Breeding and/or distribution of varieties more appropriate for industrial use. For example,the livestock feed industry would prefer varieties with higher levels of energy, while the alcoholindustry would prefer a higher starch content. Since many varieties encompassing thesecharacteristics are likely to already exist, emphasis should be placed on their identification anddistribution.
• Extension of better storage techniques. This is required since the quality of sorghum stored6—12 months after harvest suffers, causing problems when the grain is used for industrialpurposes.
• Encouraging dairy and poultry production in sorghum-growing areas. Given sorghum'splace in the livestock feed industry, its use by small-scale farmers is worth exploring. If generationof cash is the primary objective, then it goes without saying that marketing systems have to be inplace (e.g., in the case of dairy production). The breeding of dual-purpose varieties (i.e., for fodderand feed grain) is an important element to be considered in this context.
• Strengthening farmer-industries linkages. Although many members of the industry seem to behappy with current sorghum marketing arrangements, there appears to be scope for certain formsof contract-farming and farmer associations to strengthen the link between sorghum producers andindustrial users. Efforts towards this end vis-a-vis the supply of maize are already beingundertaken by some members of the industry.
5
In t roduc t ion
B a c k g r o u n d
This study formed part of the project 'Sorghum in India: Technical, policy, economic, and socialfactors affecting improved utilization', which was DFID-funded and jointly undertaken by ICRISAT,NRCS, and NRI. Apart from production, human consumption, marketing, and policy issues, industrialutilization was identified as one of the key areas to be studied in determining the potential of sorghumin the semi-arid regions of India.
Given the limited prospects of human consumption of rainy-season sorghum, the study con-centrated on documenting the current status of the crop as an industrial raw material, and projectingfuture trends. There have been few such studies in the past, partly due to lack of reliable data.
The purpose of this paper is to document facts based on extensive surveys and discussions withindustries concerned, rather than to advocate the use of sorghum.
Methodo logy
The study was undertaken to test the following hypotheses:
• Due to economic and technical constraints, sorghum cannot compete with existing raw material invarious alternate uses, and
• The elimination or reduction of these constraints would result in improved utilization of rainy-season grain, particularly that which has fallen out of the human food chain.
A two-week exploratory survey was undertaken during Apr-May 1998 to identify the keyindustries to be studied and to collect literature on the subject. This involved visits to Akola,Hyderabad, Mumbai, and Pune. Based on this, it was decided to confine the study to the animal feed,alcohol, and starch industries.
A postal survey of 40 animal feed manufacturers, 5 starch producers, and 7 distilleries wasundertaken between May and Jul 1998. The survey was not intended for a statistical analysis, but toobtain more qualitative data on the subject.
The main survey spanned over four weeks in Aug and Sep 1998, with subteams visiting industriesin Ahmedabad, Alwar, Anand, Bhilai, Delhi, Ghatabillod, Hyderabad, Mumbai, Nagpur, and Rohtak.
Global Sorghum UtilizationWith an annual production of approximately 60-65 million t, sorghum is the fourth most importantcereal produced in the world. The USA (17 million t produced in 1994) is its major producer(ICRISAT & FAO 1996). Most of the sorghum in industrialized countries is used as an ingredient inanimal feed rations (Table 2). The production is highly commercialized with a good integrationbetween farmers and utilizing industries. In Asia and Africa, a major part of sorghum is produced forhuman consumption and the production is largely based on small-scale farming.
6

Table 2 . S o r g h u m ut i l izat ion1 i n Nor th A m e r i c a , As ia , and Af r i ca be tween 1992 a n d 19942.
User
Direct food
Feed
Other uses4
Total utilization
North America
m tonnes %3
0.1 1
11.1 97
0.3 3
11.5 100
Asia
m tonnes %3
13.3 64
5.6 27
2.0 10
20.9 100
Africa
m tonnes %3
12.8 74
1.3 8
3.2 18
17.3 100
1. Figures are the annual average.2. Figures do not include exports (e.g., during 1992-94, USA exported 6.6 m t year-1).3. Figures may not add up due to rounding errors.4. "Other uses" includes seed, manufacturing purposes, and waste.
Source: ICRISAT & FAO 1996
The Indian Sorghum EconomyIndia is the second largest producer of sorghum worldwide, and has the largest area under the crop. Itoccupies around 11 million ha in the semi-arid regions of the country and is the third most importantfood grain. Sorghum stover is widely used as fodder and it often gains importance over grain in certainregions, particularly where growing conditions are unfavorable.
Sorghum is grown both as a rainy-season (Jun-Oct) and postrainy-season (Sep-Jan) crop. Therainy-season crop is grown over about 53% of the area and it contributes about 65% of the totalproduction. The postrainy-season crop covers the rest of the area and production. The major statesgrowing rainy-season sorghum are Karnataka, Madhya Pradesh, and Maharashtra, which togethershare 63% of the area and 77% of the production (Figures 1 and 2, see Appendix). Maharashtra,Karnataka, and Andhra Pradesh together share 93% of the area under postrainy-season sorghum.While the rainy-season crop coincides with the main monsoon spell, postrainy-season sorghum isgrown on residual soil moisture and scanty rain during the crop season.
Postrainy-season sorghum grain maturing under dry weather is of high quality, valued for food,and fetches a high price. The rainy-season production system is notable for its wide use of high-yielding hybrids, which occupy about 75-80% of the area. Hence, the productivity of rainy-seasonsorghum is about 60% higher than that of the postrainy-season crop. The highest rainy-season yieldwas recorded in Maharashtra at 1.7 t ha-1, with some of its major districts yielding 1.9-2.6 t ha-1. Thesorghum varieties grown in India are predominantly white, and as a consequence, the tannin content isvirtually zero.
The demand for rainy-season grain as food has declined over the last decade, mainly due to thedeterioration in the apparent and actual grain quality as a result of rain-induced molding, increasingproduction of fine cereals (primarily wheat and rice), and public policies that make the latteraccessible to the economically deprived. The per capita consumption of sorghum in rural Indiadeclined from 1.59 kg month-1 in 1972 to 0.84 kg month-1 in 1993 and from 0.71 kg month-1 to 0.39 kgmonth-1 in urban areas during the same period.
Due to molding, rainy-season grain fetches lower prices and is hence less profitable than otherrainfed commercial crops. This has led to a reduction of about 42% in the area sown to rainy-seasonsorghum during the last three decades. It is believed that this decline may eventually stabilize around5 million ha and production around 8 million t (NRCS 1997), depending on the promotion of its
7

demand for nonfood uses. In this context, the lower price of rainy-season grain, in comparison to itscompetitor maize, is an advantage. During 1998, maize was available in adequate quantities andmarketed at prices marginally higher than those of rainy-season sorghum. Comparative price trends ofrainy-season sorghum and maize over the years, however, show that sorghum usually has a priceadvantage over maize ranging from 7-37%.
Given this situation the national agricultural research system (NARS) is contemplating an activestrategy to promote the use of sorghum in different industrial uses and to work in tandem with theseindustries. However, there has so far been no interface with client industries to respond to theirproblems on grain utilization. The present study found that NARS has neither a database on the currentindustrial utilization of sorghum nor direct contact with most current and potential user industries. Thetechnological suitability of the grain for the projected uses and the economic advantage of its usewould essentially determine the flow of sorghum to industrial uses in India. There are also severalopportunities to improve the grain yield at a more competitive cost of production. NARS is open todeveloping client-specific cultivars.
8

A n i m a l F e e d Sec to r
Increas ing D e m a n d for L ives tock P roduc ts
Increasing purchasing power,population growth, and highincome elasticities of demand willbe the driving forces behind futureincreases in the consumption ofanimal products in India. It can bepredicted that changes in India'sfood consumption patterns will besimilar to those in countries such asJapan and Korea (McKinsey 1997).Although the patterns may differfrom country to country due to
Table 3 . C h a n g e s (%) in food expend i t u re in Ind ia .
Urban IndiaCerealsMilk and meat
Rural IndiaCerealsMilk and meat
1970-71
36
20
54
15
1983
33
22
5016
1989-90
26
25
37
21
Source: McKinsey 1997.
sociocultural reasons, the trend will remain the same, i.e., cereal consumption declining and proteinconsumption increasing as per capita income increases. In fact, recent National Sample SurveyOrganisation (NSSO) data confirms this trend for both urban and rural India (Table 3).
According to the World Bank (1996), recent estimates of the expenditure elasticity for milk anddairy products are of the order of 1.14 - 1.47 in the case of rural households, and 0.61-1.09 for urbanhouseholds. The demand for meat, fish, and eggs is also more elastic in rural households (0.92 - 1.18)than in urban households (0.54 - 0.88).
Although vegetarianism is widespread in India, a large majority of the population eats meat (i.e.,primarily poultry, and mutton). According to the National Food Survey conducted by the IndianMarket Research Bureau (IMRB), 74% of the urban population is nonvegetarian (Sachdev, personalcommunication 1997).
Although the consumption of animal products has increased over the last three decades in India, itis still "considerably lower than in industrial countries and in other developing countries" (WorldBank 1996), particularly in the case of egg and meat (Table 4). According to the McKinsey report,
Table 4 . P e r cap i ta c o n s u m p t i o n (kg y e a r1 ) o f l i ves tock p roduc ts i n Ind ia a n d se lect coun t r i es ,
1992 .
Product
Milk (liquid milk)
Eggs (pieces)
Poultry meat
India
65.01
26.0
0.5
Other countries
China-3, Australia-104, USA-104
China-163, Japan-276, Australia-170, USA-181, Turkey-122
Hong Kong-43, China-4, USA-40, Thailand-9
1. Milk equivalent.
Sources: World Bank (1996) and USDA 1995.
9

based on Dairy India 1997, average milk consumption in India is 183 grams capita day-1 as comparedto a world average of 285 grams capita day-1. The same source also states that "Urban India consumesabout four times as much milk as rural India", and predicts that "the consumption of Indian dairyproducts is likely to grow fast - at an annual growth rate of over 20 per cent".
According to the World Bank (1996), "recent estimates of livestock product demand in the year2020, assuming that the economy consistently grows at 5.5 percent per year, and population growth,price and income elasticities of the past ten years remain stable, indicate that demand for milk willincrease by a factor of 10 to about 497 million t by 2020. Demand for eggs and poultry meat willincrease by a factor of 7 to 7.21 and 1.35 million t respectively".
Although some of these growth rates may seem too optimistic, particularly in the light of a sluggish economy, it can be predicted that there will be a substantial increase in the demand for animalproducts, most likely driven by the fast growing middle class.
The growing demand for livestock products can either be met through imports or increaseddomestic production. Assuming the latter will continue, there will be an increased demand for animalfeeds such as crop residues, forage crops, and feed concentrates such as grains and oilcakes. This studyfocuses on the concentrate feed industry, particularly on grains.
The Feed IndustryThe feed industry can be broadly categorized into the:
• Organized sector, comprising the Compound Livestock Feed Manufacturers' Association of India(CLFMA), which includes both poultry and dairy feed manufacturers;
• Co-operative sector, (i.e., most of the larger co-operatives are also CLFMA members), which isresponsible for approximately 50% of the commercial dairy feed rations; and
• Unorganized sector, which includes small-scale feed millers or commercial farmers mixing theirown feeds for egg production, and who are not members of either of the first two sectors.Figure 3 (see appendix) provides an overview of the feed production by CLFMA members. In
1996/97, the total feed production was 2.94 million t, with poultry feeds accounting for 1.36 million t and cattle and other feeds accounting for 1.58 million t.
The bulk of industrial poultry feed production takes place outside the organized sector. Eggproducers mix their own layer rations on-farm, based on concentrates (excluding cereals) purchasedfrom feed millers and cereals procured from elsewhere.
The success of the Indian dairy industry is largely due to the co-operative movement andOperation Flood, which was initiated in Gujarat. Apart from dairy processing and marketing,co-operatives also produce and supply dairy rations. Feed supply and milk marketing are oftenintegrated. In fact, some of the biggest feed mills of the country belong to co-operatives (e.g., Amuland Kaira District Co-operative Milk Producers' Union Ltd).
The co-operative feed mills obtain advice on least-cost feed formulations and raw material supplyfrom the National Dairy Development Board (NDDB). According to NDDB, the total feed millingcapacity of the co-operative sector was of the order of 5040 t day-1 in 1998. This capacity was utilizedat 55% in mid-1998, suggesting an annual production of approximately 1 million t.
Most of the larger co-operatives form part of CLFMA. As a consequence, it is estimated that in1998 about 2 million t of commercial dairy feed were produced by the organized sector (i.e., CLFMAand co-operatives), and an additional 2 million t by the unorganized sector.
10

Table 5 . P roduc t ion , m a r k e t avai lab i l i ty , a n d d e m a n d (mi l lion tonnes) for feed ingred ients by
the l ivestock and pou l t ry feed sec to r in 2 0 0 0 .
Feed item
Energy sources
Maize
1994
Production
10.50
Sorghum and millets 21.00
Cassava (tapioca)Milling byproducts
Protein sources
Oilcakes/meals
Fish meal
Total concentrates
Total roughages
5.30
12.80
0.15
Market
availability
1.05
2.10
2.658.20
6.40
0.15
20.55
710.00
Demand
5.201
0.652.60
3.900.52
12.87
945.00
2000
Production
12.00
23.006.00
16.00
0.20
Market
availability
1.20
2.303.00
10.00
8.000.20
24.70
932.00
Demand
10.001
1.255.00
7.50
1.00
24.75
1306.00
Status
Very acute
Very acuteSurplusSurplus
Adequate
Very acute
Adequate
Acute
1. Combined demand for maize, sorghum, and millets.
Source: CV Reddy, personal communication 1997.
Expected increases in consumption of animal products will inevitably lead to an increased demandfor feed, which members of the industry forecast, will lead to severe shortages of raw materials,particularly carbohydrate sources such as coarse grains (Table 5). Although the figures on theavailability of maize seem underestimated, it is apparent that the industry predicts an acute shortage ofcoarse grains for animal feed in the future.
Chaddha (personal communication 1998) predicts a shortage of grains for animal feed, based on a projected poultry feed production of 12.5 million t in 2000, and 58.5 million t in 2015.
The World Bank (1996) estimates the deficit in concentrate feed for all categories of animals (i.e.,cattle and buffaloes, small ruminants, poultry, and pigs) at 2.6 million t and the deficit in roughage at251 million t. It also points out that most national calculations show a deficit of 50 - 60 million t inconcentrate feeds, which is mainly based on the assumption that 0.5 - 1.0 kgs of concentrate feed areconsumed per day per animal (i.e., primarily bovines) in the traditional sector. Although this maycorrespond to the theoretical requirement, in practice a majority of the animals in the traditional sector(e.g., desi cows) are predominantly fed on roughage.
The Poultry IndustryTable 6 illustrates the development of the Indian poultry industry during the 1990s. Until 1997/98, thesector grew at the rate of 10 - 12% in the case of egg production, and 20 - 25% for broiler meat.According to the McKinsey Report on "modernising the Indian food chain", the poultry sector "ispoised for dramatic growth" (i.e. in excess of 20% per annum over the next 10 years).
Such an expansion is likely to take place in the context of occasional fluctuations such as thoseexperienced during 1997/98. The unexpected economic slowdown in India towards the end of the1990s arising from global factors, led to a surplus production of broilers in particular, andsubsequently falling prices.
11

Table 6 . Ma in ind ica to rs o f pou l t r y deve lopmen t in Ind ia .
Indicators
Egg production (million)
Broiler production (million)
Commercial layers (million)
Poultry meat production ( '000 t)
Per capita availability year-1
Eggs (no.)Poultry meat (gms)
Parent stock in production ( '000 t)Layers
BroilersValue of poultry products (million Rs)
Poultry feed production (million t)
Value of veterinarypharmaceuticals (million Rs)Human population
1990
23 300
190
76
412
28494
960
2 0 0 0
37 490
4.3
2 0 0 0834
1996
30 000
510
103
870
32917
1 200
5 6 0 0
81 000
6.8
4 400948
1997
32 034
630
110
1 050
33
1 100
1 300
6 800
98 5007.6
5 0 0 0
953
20001
45 000
1085
155
1 200
45
1 200
1825
10000
111075
12.5
7 0 0 0
1 000
20151
180 000
6 0 0 0
700
9 0 0 0
180
9 0 0 0
7 32555 300
562 500
58.5
32 0001 0 4 0
1. Figures are projections.
Source: R. C. Chaddha, personal communication 1998.
In the medium to long term, however, growth is expected to pick up. It is projected that eggproduction will grow by about 9% per annum, and broiler production by approximately 15%. The feedrequired by parent stock and growers is expected to increase by 12% per annum.
The figures in Table 7 are based on findings of the survey undertaken in Apr and Aug 1998.Growers and parent stock consists of about 70 million layer growers, about 6 million broiler parents,and approximately 1.5 million layer parents. Also, the figures on feed intake do not always correspondto what is fed in reality (i.e., birds are often underfed).
Commercial poultry feed manufacturers primarily produce broiler feed. Layer feed rations, whichform the bulk of poultry feed, are generally mixed on-farm, whereby egg producers purchase
Table 7 . Es t ima ted feed requ i remen ts by the c o m m e r c i a l pou l t r y sec to r in 1998 and 2 0 1 0 .
Layers
Broilers
Growers and
parent stock
Total
Poultry
population
in 1998
(million)
130.0
650.0
Feed intake1
(kg head-1)
40.0
3.3
Feed
requirement
in 1998
(million t)
5.2
2.1
1.0
8.3
Annual growth
rates2
( 1 9 9 8 - 2 0 1 0 )
( % )
9%
15%
12%
Projected feed
requirement
in 20103
(million t)
14.6
11.5
3.9
30.0
1. Feed intake in the case of broilers corresponds to lifetime intake (about 6 weeks) and in the case of layers to the actual laying period
(about 1 year).
2. The growth rates chosen are lower than the figures published by the poultry industry, taking into account the recession in the Indian
economy which started at the end of the 1990s.
3. Summarized feed requirements.
12
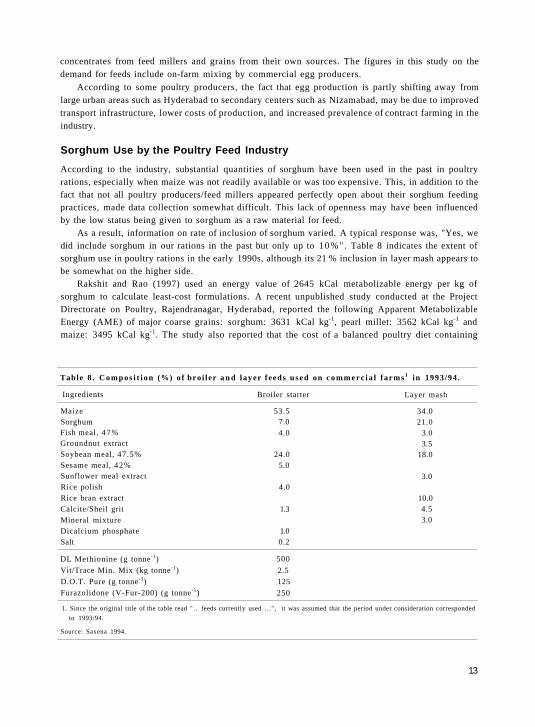
concentrates from feed millers and grains from their own sources. The figures in this study on thedemand for feeds include on-farm mixing by commercial egg producers.
According to some poultry producers, the fact that egg production is partly shifting away fromlarge urban areas such as Hyderabad to secondary centers such as Nizamabad, may be due to improvedtransport infrastructure, lower costs of production, and increased prevalence of contract farming in theindustry.
Sorghum Use by the Poultry Feed Industry
According to the industry, substantial quantities of sorghum have been used in the past in poultryrations, especially when maize was not readily available or was too expensive. This, in addition to thefact that not all poultry producers/feed millers appeared perfectly open about their sorghum feedingpractices, made data collection somewhat difficult. This lack of openness may have been influencedby the low status being given to sorghum as a raw material for feed.
As a result, information on rate of inclusion of sorghum varied. A typical response was, "Yes, wedid include sorghum in our rations in the past but only up to 10%" . Table 8 indicates the extent ofsorghum use in poultry rations in the early 1990s, although its 21 % inclusion in layer mash appears tobe somewhat on the higher side.
Rakshit and Rao (1997) used an energy value of 2645 kCal metabolizable energy per kg ofsorghum to calculate least-cost formulations. A recent unpublished study conducted at the ProjectDirectorate on Poultry, Rajendranagar, Hyderabad, reported the following Apparent MetabolizableEnergy (AME) of major coarse grains: sorghum: 3631 kCal kg-1, pearl millet: 3562 kCal kg-1 andmaize: 3495 kCal kg-1. The study also reported that the cost of a balanced poultry diet containing
Table 8 . Compos i t i on (%) o f bro i le r a n d layer feeds used on commerc ia l fa rms1 in 1993/94.
Ingredients
MaizeSorghumFish meal, 47%Groundnut extractSoybean meal, 47.5%Sesame meal, 42%Sunflower meal extractRice polishRice bran extractCalcite/Sheil gritMineral mixtureDicalcium phosphateSalt
DL Methionine (g tonne-1)
Vit/Trace Min. Mix (kg tonne-1)
D.O.T. Pure (g tonne-1)
Furazolidone (V-Fur-200) (g tonne-1)
Broiler starter
53.57.04.0
24.05.0
4.0
1.3
1.00.2
500
2.5125
250
Layer mash
34.021.0
3.03.5
18.0
3.0
10.04.53.0
1. Since the original title of the table read ".. feeds currently used ...", it was assumed that the period under consideration corresponded
to 1993/94.
Source: Saxena 1994.
13

different coarse grains at the 58% level is most favorable when pearl millet and sorghum are used incomparison with maize or ragi and the cost of feed using maize was the highest (Dr G Syamsunder,personal communication).
Researchers at the Acharya N.G. Ranga Agricultural University (ANGRAU), who are alsoconsultants for the poultry industry, recommend that not more than 30% of sorghum should beincluded in poultry feed due to uncertainties about tannin. In general, according to feed millers, moresorghum was used in layer rations, where energy matters less, than in broiler rations. During thesecond half of the 1990s it is reported that when maize was in short supply, average inclusion levelswere of the order of 10% for broiler rations and 15% for layers. Grower rations tend to include lesssorghum due to the risk of tannin.
Although sorghum grain is transported over long distances for feed production (e.g. fromMaharashtra to Tamil Nadu or West Bengal), it is unlikely that the entire poultry sector includedsorghum at the same level. Even when maize was in short supply, some producers would not prefersorghum over other grains such as broken wheat or ragi.
The survey revealed a range of positive and negative perceptions which discourage the use oradmission of sorghum in poultry rations. Overall, it became clear that sorghum is currently considereda second choice raw material for poultry feed.
Some of the issues highlighted in Table 9 appear to contradict each other. For example, accordingto the response to the survey questionnaire, availability was often stressed as an advantage while usingsorghum. However, some producers clearly found it more difficult to obtain the grain. This may be dueto location, lack of contact with sorghum traders/brokers or seasonal shortages.
The tannin content of sorghum grain, which is considered a disadvantage, is contentious.According to researchers at NRCS, Indian sorghum is predominantly white and virtually tannin-free.However, many poultry producers, including veterinary researchers from ANGRAU in Hyderabad areapparently not aware of this important fact. Inclusion levels may increase if producers know from
Table 9 . I ndus t ry -pe rce ived advan tages a n d d i s a d v a n t a ge s o f us ing s o r g h u m in pou l t ry feed.
Advantages
• Low cost
• Energy alternative to maize
• Easy availability
• Good pelletability
Disadvantages
• Lower energy content than maize
• Risk of aflatoxins (often associated with blackened grain)
• Risk of tannins
• Not always available
Problems with grinding; mash becomes powdery reducing
feed intake by birds
• Low palatability and digestibility
• Varying quality; grain often infested with weevils, fungi,
etc.
• Sorghum lacks the carotenoid pigments present in yellow
maize, which are necessary for egg yolk colour
• Feed including sorghum is more difficult to sell
• Absence of standard varieties in the market
Note: Apparent contradictions reflect information obtained during the course of the survey.
14

reliable sources that there is no risk of tannin in Indian sorghum, including the yellow varieties whichare generally suspected for tannin content. On the other hand, according to NRCS experts, the Indianyellow sorghum's carotene content may impart a yellow color to egg yolk.
Researchers at NRCS clarified through past studies that blackened or molded grain does notnormally contain aflatoxin. A post-graduate research study titled "Toxicopathological studies onfeeding of black sorghum to broilers", undertaken in Akola1, concluded that better performance wasobserved on a maize-based diet. Naturally infested black sorghum feed can be advocated in broilerrations to the extent of 75% (i.e., replacing maize up to 75%) without any adverse effect on bodyweight, hematological and biochemical parameters when compared with normal sorghum. Secondly,non-toxic effect was further confirmed from gross, histopathological and immune response studies(CMI & HI) in chicks. Severely damaged black sorghum, however, adversely affects all theseparameters. Thirdly, washing and sundrying black sorghum improves all the parameters includinghumoral and HI response. It is therefore recommended that the use of black sorghum can be enhancedwith this treatment prior to its use in broiler rations, in order to improve broiler performance. Thismethodology may prove useful in areas where black sorghum is consumed by the poor.
Although this study advocates the use of blackened sorghum in broiler rations, it also highlightssome of the difficulties faced in classifying different degrees of damage due to blackening. Hence careduring procurement is advised.
Opinions also differ widely on the amount of metabolizable energy in sorghum. Some see it as a good energy alternative to maize whereas others consider the energy level in sorghum too low (rangesbetween 2600 and 3100 kCal kg-1 of sorghum, as compared to 3300 kCal kg-1 in the case of maize).These disparities may be due to the quality of the sorghum examined, varietal differences, or themanner in which research was undertaken. More light needs to be shed on this issue and guidanceprovided to feed millers and poultry producers to promote the use of sorghum.
Table 10 shows the relative values (Indian Poultry Industry Yearbook, 1994) of grains used inanimal feed. The criticism about lower energy in sorghum is countered with results of recent studies onAME at the Project Directorate on Poultry.
The perceived disadvantage in grinding sorghum is largely due to the use of hammer mills
Table 10. Re la t ive va lue of g ra ins used in an ima l feed.
Grain
Maize
Wheat
Sorghum
Finger millet
Energy value
(% value of
maize)
100
96
95
95
Protein( % )
8.8
10.0
10.0
6.0
Palatability
level
Very high
Very high
High
High
Fiber
( % )
2.0
2.5
2.0
3.0
Protein
balance
Good
Excellent
Fair
Fair
Bewareof. . .
High moistureAflatoxin
New wheat
Tannin
Sand/silica
Source: Saxena 1994.
1. The study was undertaken by M R Joshi. under the supervision of Dr M V Joshi. in the Department of Veterinary Pathology at
Dr Panjabrao Deshmukh Krishi Vidyapeeth, Akola, It led to a paper which was accepted for presentation at the World Poultry Conference
in September 1996. New Delhi.
15
designed for grinding corn, which could be overcome by modifying the milling equipment. NRCSscientists also point out that when there is a steady demand for grain, farmers may grow standardvarieties suited for feed, and variations in quality could be offset by contract farming.
These research findings on sorghum as feed for poultry have not found ready acceptance, which isan important reason for its poor reputation as a poultry feed ingredient, and its use only when maize isin short supply or too costly. At the same time, the quality of sorghum grain towards the end of thestorage season (Jun to Aug) appears to be unfavorable due to its great vulnerability to damage duringstorage.
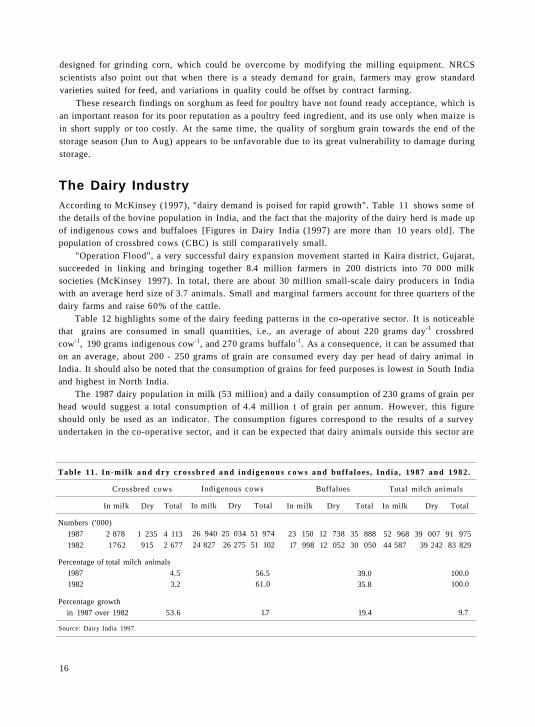
The Dairy IndustryAccording to McKinsey (1997), "dairy demand is poised for rapid growth". Table 11 shows some ofthe details of the bovine population in India, and the fact that the majority of the dairy herd is made upof indigenous cows and buffaloes [Figures in Dairy India (1997) are more than 10 years old]. Thepopulation of crossbred cows (CBC) is still comparatively small.
"Operation Flood", a very successful dairy expansion movement started in Kaira district, Gujarat,succeeded in linking and bringing together 8.4 million farmers in 200 districts into 70 000 milksocieties (McKinsey 1997). In total, there are about 30 million small-scale dairy producers in Indiawith an average herd size of 3.7 animals. Small and marginal farmers account for three quarters of thedairy farms and raise 60% of the cattle.
Table 12 highlights some of the dairy feeding patterns in the co-operative sector. It is noticeablethat grains are consumed in small quantities, i.e., an average of about 220 grams day-1 crossbredcow-1, 190 grams indigenous cow-1, and 270 grams buffalo-1. As a consequence, it can be assumed thaton an average, about 200 - 250 grams of grain are consumed every day per head of dairy animal inIndia. It should also be noted that the consumption of grains for feed purposes is lowest in South Indiaand highest in North India.
The 1987 dairy population in milk (53 million) and a daily consumption of 230 grams of grain perhead would suggest a total consumption of 4.4 million t of grain per annum. However, this figureshould only be used as an indicator. The consumption figures correspond to the results of a surveyundertaken in the co-operative sector, and it can be expected that dairy animals outside this sector are
Table 11. In -mi lk a n d d r y c rossb red a n d i nd igenous c o w s an d buf fa loes, Ind ia , 1987 and 1982 .
Crossbred cows
In milk Dry Total
Numbers ('000)
1987 2 878 1 235 4 113
1982 1762 915 2 677
Percentage of total milch animals
1987 4.5
1982 3.2
Percentage growth
in 1987 over 1982 53.6
Indigenous cows
In milk Dry Total
26 940 25 034 51 974
24 827 26 275 51 102
56.561.0
1.7
Buffaloes
In milk Dry Total
23 150 12 738 35 888
17 998 12 052 30 050
39.035.8
19.4
Total milch animals
In milk Dry Total
52 968 39 007 91 975
44 587 39 242 83 829
100.0100.0
9.7
Source: Dairy India 1997.
16

Table 12. Z o n e wise1 feed ing (kg day- 1 an imal - 1) o f m i l ch an ima ls .
Type of feed
Green fodder
Dry fodder
Grains
Oilcakes
BCF2
Others3
Crossbred cows
E
3.64
6.16
0.270.67
0.77
0.76
N
13.65
6.32
0.40
0.66
0.580.14
S
5.407.50
0.060.64
0.630.64
W
6.08
8.92
0.16
0.53
1.32
0.13
Indigenous cows
E
2.97
5.51
0.190.46
0.34
0.53
N
5.63
7.57
0.350.31
0.33
0.06
S
4.037.29
0.05
0.280.22
0.47
W
3.698.22
0.180.32
0.44
0.10
Buffaloes
E
5.878.39
0.310.51
0.21
0.26
N
11.36
8.550.44
0.53
0.210.07
S
4.18
8.22
0.050.24
0.230.57
W
5.509.74
0.280.36
0.83
0.11
1. E = East, N = North, S = South, W = West.
2. BCF = Balanced cattle feed.3. Includes pulses, bran, and cereal husk.
Source: Bhide and Chaudhari 1997.
fed less grain. At the same time, the dairy population has most likely increased. In fact, according toDairy India 1997, the annual growth rate in milk production was about 5% during the 1980s and 1990s.
According to the 1998/99 estimate, approximately 4 million t of dairy feed is produced in India bythe commercial sector (i.e., about 1 million t by nonco-operative CLFMA members, 1 million t by theco-operative sector, and 2 million t by the unorganized commercial sector).
The survey revealed that relatively little grain is used in dairy feed rations, which can be classifiedinto standard feed, bypass feed, and high-energy feed. Manufacturers prefer to market more than a dozen feed formulations at a cheaper price for higher marketability. Standard dairy rations, whichcomprise the bulk of commercial feed, include approximately 10% grain; the bypass feed about5 - 10%, and the high-energy feed about 20%. As a consequence, it is assumed that dairy rationsinclude, on an average, about 10% grain, which would correspond to a total use of about 0.4 million t per annum by the industrial dairy sector.
Assuming an annual growth rate of 3%, based on the findings of the survey, it is predicted thatcommercial production of dairy feed will touch 5.7 million t in the year 2010. Though a conservativeestimate, it reflects the views of the industry surveyed in mid-1998. Going by this projection, graindemand for dairy feed in 2010 could be about 0.57 million t. It must be mentioned here that anunestimated quantity of grain, whether partly damaged or not, is directly fed to animals at the farmlevel.
Sorghum Use by the Dairy Feed IndustryThe cooperative dairy sector as a whole is very open on the utilization of sorghum. According toanimal nutritionists of NDDB, the inclusion rate of sorghum in commercial dairy feed is of the order of10%, and sorghum is the main cereal used, followed by maize, damaged wheat, and pearl millet.Computerized least-cost formulations are used to calculate the exact proportions of the ingredients.
The Amul feed mill at Kajari-Boriavia (in the Kaira District Co-op Milk Producers' Union,Anand), with an installed capacity of 600 t of feed per day and the largest feed factory in India,regularly uses sorghum in its feed production. During 1998, for the production of bypass proteinrations, it followed an inclusion level of 2 -5% (Jan-Mar 1998 2%; Apr-May 1998 5%). Demand fordairy feed rations is higher between Oct and Mar, when less green fodder is available. Therefore, thedemand for grain too is higher during this period.
17

Table 13. Nut r i t iona l va lue o f g ra ins for da i r y cat t le a n d buf fa lo .
Grain
BarleyPearl millet
Sorghum
Maize
OatsWheat
Dry matter (%)
90
89
87
89
8989
Protein
Total(%)
8.7
11.9
15.2
8.9
11.813
Digestible
( % )
6.9
5.1
7.3
6.88.8
10.1
TDN
( % )
79
61
86
81
6878
Energy (per kg)
Digestible
(Kcal)
3483
26653772
3571
29983449
Metabolizable
(Kcal)
-
2185
3093
2928
24582820
Ca(%)
0.06
0.12
0.12
0.02
0.100.50
P
( % )
0.33
0.460.44
0.31
0.350.40
Source: Dairy India 1997.
During 1998, Amul paid between Rs 3800 and 4000 per t of sorghum (landed factory). The mainsupplier was in Maharashtra (Jalgaon, Akola, etc). According to Amul, Rs 3200 could be considered a low price, and Rs 4200 the maximum they are prepared to pay. It was also noted that sorghum is notalways available between Feb and Sep. Given its price range and ready availability, the cooperativefeed sector is highly satisfied with sorghum as a feed component. In this context, the observation by DrAmrita Patel, Managing Director, NDDB, on the need to develop satisfactory and safe storagetechniques for sorghum grain is very pertinent.
Table 13 shows the nutritional values of various grains. According to it, sorghum is ahead of othergrains in most nutritional categories. Feed experts at Amul mentioned that up to 5% tannin in grainmay not adversely affect animal production. However, the non-co-operative commercial feed millersoften have different views on sorghum grain. This may be related to the market perception on theimage of sorghum grain, which in turn may be influenced by the moldy or blackened state in which itis often sold in the market, rather than on its feed value and economic advantage.
Table 14 summarizes the advantages and disadvantages of using sorghum in dairy feed, asexpressed by dairy feed millers during the course of the survey. They are quite similar to the onesexpressed by the poultry industry.
Table 14. Indus t ry -perce ived advan tages a n d d i sadvan tages o f us ing s o r g h u m in da i ry feed.
Advantages
• Low cost
Good energy source
• No problems with processing, if appropriate
equipment is used (e.g., Amul)
• Good availability
• Traditionally fed to cattle in rural areas
Disadvantages
• Presence of tannins
• Discoloration of grains
• Deterioration of quality during storage (due tomould and insects)
• Moisture content is sometimes too high
• Not always available round the year
• Low palatability and digestibility
• Customer resistance if sorghum is included in feed
(although manufacturers usually do not disclose
raw materials used)
• Absence of standard varieties in the market
Note: Apparent contradictions reflect information obtained during the course of the survey.
18
Sorghum Price Paid by the Feed Industry
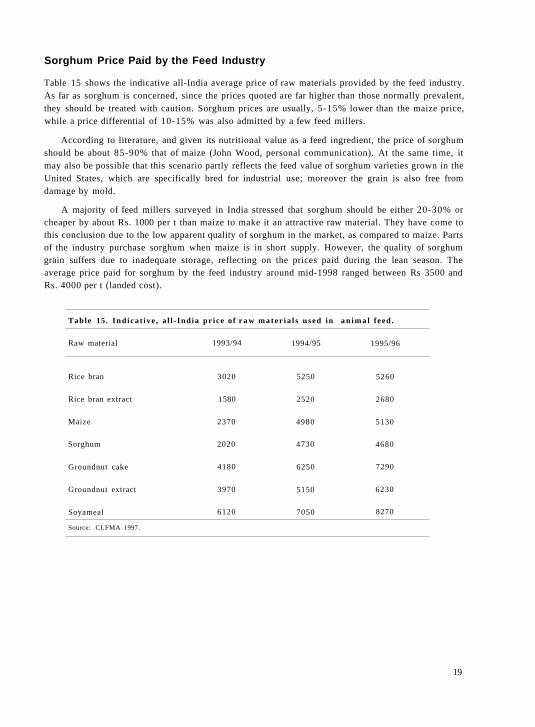
Table 15 shows the indicative all-India average price of raw materials provided by the feed industry.As far as sorghum is concerned, since the prices quoted are far higher than those normally prevalent,they should be treated with caution. Sorghum prices are usually, 5-15% lower than the maize price,while a price differential of 10-15% was also admitted by a few feed millers.
According to literature, and given its nutritional value as a feed ingredient, the price of sorghumshould be about 85-90% that of maize (John Wood, personal communication). At the same time, itmay also be possible that this scenario partly reflects the feed value of sorghum varieties grown in theUnited States, which are specifically bred for industrial use; moreover the grain is also free fromdamage by mold.
A majority of feed millers surveyed in India stressed that sorghum should be either 20-30% orcheaper by about Rs. 1000 per t than maize to make it an attractive raw material. They have come tothis conclusion due to the low apparent quality of sorghum in the market, as compared to maize. Partsof the industry purchase sorghum when maize is in short supply. However, the quality of sorghumgrain suffers due to inadequate storage, reflecting on the prices paid during the lean season. Theaverage price paid for sorghum by the feed industry around mid-1998 ranged between Rs 3500 andRs. 4000 per t (landed cost).
Table 15. Ind ica t ive , a l l - Ind ia pr ice o f r a w mate r ia l s used in an ima l feed.
Raw material
Rice bran
Rice bran extract
Maize
Sorghum
Groundnut cake
Groundnut extract
Soyameal
1993/94
3020
1580
2370
2020
4180
3970
6120
1994/95
5250
2520
4980
4730
6250
5150
7050
1995/96
5260
2680
5130
4680
7290
6230
8270
Source: CLFMA 1997.
19

Potential Demand for Sorghum
Based on the preceding discussion, the calculations presented in Table 16 show the potential demandfor sorghum to be of the order of 2.9 million t. It is expected that due to better quality and moreinformation on the feed value of this grain, a greater number of feed producers would include sorghumat higher levels as compared to 1998. Though this level of demand may occur, given the actual andprojected feed deficit in the Indian animal feed industry, it is assumed that maize will not be able to fillthis gap alone due to its higher cost and limitations for potential expansion in production.
Figure 4 demonstrates the potential sorghum demand at different inclusion levels in the main feedcategories in 2010. It was assumed that 50% of the respective feed industries would include sorghumin their rations at the inclusion rates shown.
At this point it may be appropriate to reiterate that future demand for sorghum in feed rations is a function of its price, regular availability, and quality. Particularly in the case of poultry feed, sorghumhas to compete with maize on these aspects.
Table 16 . Po ten t ia l d e m a n d for s o r g h u m in c o m m e r c i a l an ima l feed.
Poultry industry
Layers
Broilers
Growers and
parent stock
Dairy industry
Total
Feeddemandin 19981
(million t)
5.2
2.14
1.0
4.0
Annualgrowth
rate
( % )
9%
15%
12%
3%
Projected feed
demand
in 2010(million t)
14.6
11.4
3.9
5.7
Sorghuminclusion rates
(by 50% of
industry in 2010)
20%
15%
10%
15%
Potential
demand forsorghum in feed
in 2010(million t)
1.46
0.86
0.19
0.43
2.94
1. It is estimated that layer rations contain 15% sorghum, broiler rations 10%, grower and parent stock rations 5%, and dairy rations 10%.
It is assumed that by 2010, due to better quality sorghum and improved information, these inclusion levels will have increased to the rates
shown. The figures in Table 1 are based on the assumption that 40% (low scenario) to 60% (high scenario) of the respective feed
industries include sorghum at these inclusion rates.
20

Alcohol
The IndustryWhile discussing the potential for using sorghum in alcohol production, one must keep in mind that inIndia, molasses (a byproduct of sugar manufacture using sugarcane) constitutes the most importantraw material in this industry. It is estimated that about 95% of the alcohol manufactured in India isfrom molasses and the rest comes from grains, and roots and tubers.
According to the All-India Distillers' Association (AIDA), alcohol production during 1997-98was 1100 million liters. In general, 47% of this was redistilled as extra neutral spirit (ENS) for potablealcohol and 53% used for industrial purposes. In Maharashtra, the largest alcohol producing State, thisratio is 35% for human consumption and the rest goes for industrial use.
Molasses-based ENS is being used to develop several exotic formulations under local brandswhich are generally known as Indian Manufactured Foreign Liquor (IMFL). The manufacture ofgrain-based alcohol began in India only in the 1990s with the entry of Scotch whisky manufacturersand distributors. As a result, the local molasses-based potable alcohol industry has been facingcompetition from international Scotch whisky producers or importers. According to the ScotchWhisky Association, though the current Indian market for its product is very limited for differentreasons, with increasing purchasing power, consumers will shift to more expensive products, and as a consequence, higher demand for grain-based alcohol and foreign liquor such as Scotch whisky isexpected. These liquors are qualitatively superior to molasses-based IMFL.
At the same time, the supply of and demand for alcohol are highly influenced by Governmentpolicies which have an impact on:
• licensing of alcohol factories• trade and taxation laws affecting the supply and costing of raw materials• the level of duties and levies on potable ENA• ban on alcohol production and consumption (prohibition) in some states; and• the restriction on international companies to use only grain-based potable alcohol.
Granting licenses to alcohol factories is the State government's prerogative. In some states (e.g.,Maharashtra) no new licenses for molasses-based potable alcohol industries have been issued. TheGovernment of India favors restrictions on licensing due to production-related environmentalpollution and the low quality of molasses-based alcohol which may contain harmful aldehydes andsulphates.
In June 1993, the Central Molasses Board, which controlled the price of molasses was dissolvedand the policy on its pricing was delegated to State governments. This resulted in varying spurts inprices across the country - from Rs 150 per tonne (regulated price) to between Rs 800 and Rs 2500(landed cost) - depending on the season and location of the factory. As a result, the cost of producingmolasses-based alcohol went up, making it nonviable for factories with outdated productiontechnology, and those with production levels far below installed capacity, and an increased interest inalternate raw materials, particularly cheaper coarse grains.
Production of sorghum-based alcohol was not encouraged in the past keeping in mind foodsecurity, since it is the third most important foodgrain in India. However, with decreasing per capitaconsumption of sorghum and greater availability of rice and wheat, rainy-season sorghum is gainingpopularity as a raw material for industrial uses.
21

Duties and levies on potable alcohol include central excise duty, state taxes, and duties on inter-state movement. According to AIDA, the retail price of potable alcohol constitutes 75% excise duty,1 0 - 1 5 % marketing margin, and 10% producer's price. Maharashtra levies an export pass fee of Rs 10per liter of rectified spirit (RS) leaving the State. This fee is not levied in other States like MadhyaPradesh, highlighting how complex and different the system is across the country.
Gujarat, Andhra Pradesh, and Haryana are the States where complete or partial prohibition wasintroduced in the recent past. It was subsequently lifted in Gujarath. According to AIDA's newsletter(1998), the Centre is considering scrapping the law, "which empowers the union and stategovernments to ban the movement of and trade in alcoholic products and impose prohibition in anypart of the country". Frequent policy changes on prohibition and other legislation affecting theproduction, transport, trade, and consumption of alcohol make business planning difficult forcompanies active in this field.
When multinationals entered the alcohol trade in India, they were required to confine themselvesto production and marketing of grain-based alcohol. This has to be seen in the light of the Governmentof India's policy not to issue more licenses for the production of molasses-based potable alcohol.However, according to distillers, some multinationals have entered into joint ventures with domesticcompanies having licenses to produce molasses-based alcohol.
Production of Grain-based AlcoholTowards the end of the 1990s, about 13 multinationals had been licensed to produce and/or marketgrain-based alcohol. According to Praj Industries, Pune, a leading group which provides processingengineering, and turnkey plant erection facilities for the production of RS and extra neutral alcohol(ENA) from molasses and nonmolasses raw material, there are at least seven distilleries with aninstalled capacity of 224 KLPD (kiloliter per day) alcohol from grain. Of these, about six startedproduction (some of them were visited during this survey), and another one at Nasik, Maharashtra, wasin preproduction stage in mid-1998. These plants even use damaged grain sold by the FoodCorporation of India (FCI), broken rice, barley, and coarse grains such as pearl millet and sorghum,which are locally competitive. According to an article in Business Line (7 Feb 1997), the total licensedcapacity of nonmolasses-based alcohol is 100 million liters per year, working out to about 9% of 1100million liters of RS produced in 1997/98 as reported by AIDA. There is reason to believe that 50% ofthe installed nonmolasses-based alcohol production is currently underway. This may constitute about4.5% of the total alcohol produced.
On the basis of an annual production of approximately 50 million liters of rectified grain alcohol,one can assume that about 143 000 t of grain could have been used in 1998.
Grain-based alcohol is more expensive to produce than molasses-based alcohol, due to the highcost of raw material and additional processing costs (for coal/steam, and enzymes). During mid-1998in eastern Maharashtra, the cost of producting ENA from molasses varied from Rs 13 to 16 per liter,and that from grain from Rs 21 to 27 per litre depending on raw material cost and alcohol recovery.
Due to the current excise duty formula which is based on production costs, grain-based alcohol is"penalised" for its higher cost of production. The Excise Commissioner of Maharashtra, Ajit KumarJain, aware of this disadvantage, suggested the possibility of a change in the duty structure to boost theproduction of grain-based alcohol. According to him, the Maharashtra Government was in favor ofpromoting grain-based alcohol production to create a demand for rainy-season sorghum. It must be
22

remembered in this context that rain-damaged or blackened sorghum could be a favorable raw materialfor alcohol production because of its lower market price. Maharashtra, the main producer of rainy-season sorghum, regularly faces the problem of finding suitable users of blackened sorghum whichconstitutes 40-60% of its produce, depending on the rainfall pattern during grain maturity.
Alcohol from SorghumRainy-season sorghum is the major raw material preferred by the alcohol industry. In general, thissurvey found the industry "enthusiastic" about using sorghum. Some of the distilleries near Nagpur,Bhilai, Ghatabillod, Cuddalore, and Bulandshahr were found using sorghum (nearly 40 million liters)either completely or partially for alcohol production. While this information is not exhaustive, there issufficient reason to conclude that in 1998, about one lakh t of sorghum was used to produce alcohol.
Praj Industries highlights the suitability of their alcohol distillation technology for blackenedsorghum under their slogan "Even with damaged grain Praj improves the health of your distillery".This group offers the HIFERM-NM process (Figure 5, see Appendix) for grain route distillationsystem for alternate production using molasses as well as grain/starch as raw materials. For distilleriesoperating with molasses, Praj Industries has developed a dual route module that allows switching tostarch-based raw materials when required.
While distilleries utilizing grain use modern technology, there area a few using outdated plantsand technology. The latter reported difficulties in grinding the grain as the plants did not have theirown grinder, and lumping of grain residue led to choked of drainage pipes. On the contrary, distilleriesusing modern technology faced no such problems. Sorghum, whether molded or not, is a welcome rawmaterial, and the major considerations are the landed price of the grain and its availability round theyear. In this context, storability, particularly of the blackened grain, is important.
Like most other industrial users, distilleries purchase rainy-season sorghum through traders orbrokers in main production centers such as Latur and Akola. Though there were few complaints aboutthis system, one distiller in Madhya Pradesh felt that brokers sometimes abused their position tocontrol the market. Some distilleries are even envisaging a form of contract farming involving thesupply of seeds.
Distillers reported that they bought sorghum at a price (landed cost) ranging between Rs 3500 and4200 per tonne. Prices are the lowest soon after harvest from Nov to Feb. The quality of grain suitablefor alcohol production could even be inferior to that used for cattle feed. Hence, the price of grain usedfor alcohol could not be higher than that used for feed.
Some distilleries indicated a preference for sorghum varieties with a higher starch content (closeto 70%) and less protein. However, they had no difficulty using severely blackened grain as long as thestarch content and cost were acceptable. According to scientists at NRCS, several popular high-yielding hybrids have a starch content of 70% and above, and the starch content in molded grain maybe less varying between 5% and 12% depending on the severity of damage.
Seagram, the principal trader of grain-based alcohol in India, has recently opened a researchlaboratory in Pune. As a consequence, it seems important for NRCS to stay in touch with suchagencies using grain for alcohol production. An exchange of ideas regarding processing technologyand varietal improvement of sorghum could be beneficial to producers and users.
When it came to trading, one of the distilleries mentioned difficulties in selling grain-basedalcohol because of the adulteration of grain-based whisky with molasses-based alcohol, leading to
23

Table 17. A d v a n t a g e s a n d d i sadvan tages o f us ing s o r g h u m in a lcoho l p roduc t i on .
Advantages
• No major technical constraints with modern
technology
• Causes least pollution
• Good quality alcohol free from sulphates and
aldehydes present in molasses-based alcohol
• Can create demand for damaged grain
• Possible regular sourcing of grain from
rainy-season crop
• Byproduct of grain alcohol production can be
used as animal feed
Disadvantages
• Sorghum is a food grain, and may not be
available for alcohol production in times of
food shortages
• Some producers in Maharashtra face difficulties
in selling grain-based alcohol, largely due to the
State-imposed export pass fee. This difficulty is
localized.
• Cost of production of ENA is higher than that
from molasses.
lower demand. Table 17 summarizes the advantages and disadvantages (as perceived by somemembers of the industry) of using sorghum as a raw material in the alcohol industry.
ProspectsDistillers generally expected the grain-based alcohol market to grow. Asked about the impact ofrecession, a distiller felt that it could lead to increased demand. The grain-based alcohol market isexpected to grow by about 5%. This would mean a total production of about 90 million liters of RScorresponding to a raw material requirement of about 260 000 t of grain in 2010.
However, given the overall economic climate, governmental policies, and the existing sparecapacities in the industry, it is unlikely that new factories will be commissioned in the short to mediumterm. If government policies on grain-based alcohol become more favorable, there is a possibility ofgrowth rising beyond 5%. Based on current use and projected growth rate, the demand for sorghum inthe alcohol industry is expected to be between 0.2 - 0.5 million t in 2010.
24
Starch Industry
An OverviewAccording to sources in the starch industry, it was estimated that 0.6 million t of starch (includingdownstream products) were produced from maize, and 0.1 million t from cassava (tapioca) during1998. According to the All India Starch Manufacturers' Association (AISMA), Mumbai, the percapita consumption of starch in India was 0.59 kg in 1994, compared to a global per capitaconsumption of 6.50 kg and 64.25 kgs in the USA. In the mid-1990s, the average growth rate for starchdemand was 5% in India, compared to 12% globally. Figure 6 compares starch consumption patternsin India and the USA.
Figure 7 provides an overview of the downstream products and byproducts from maize-basedstarch by wet milling. According to a major starch industry source, some of the byproducts, like liquidglucose, are derived directly from wet milled grains.
Maize is the preferred raw material in the starch industry. The average landed cost of maize during1998, according to industry sources, was between Rs 4000 and 5100 t-1. The average starch price wasRs 7.35 kg-1 in 1991 and Rs 9.20 kg-1 in 1995. Grades of starch required for major and minor uses varyand so do their prices.
Maize starch prices (per kg) around mid-1998 were Rs 10 for textile grade raw starch,between Rs 13 and 15 for paper manufacture-grade starch, and between Rs 10 and 15 for foodprocessing-grade starch.
Some of the downstream products such as dextrose and sorbitol fetch considerably higher prices.According to industry sources, if sorghum starch was available, it could have been sold largely fortextile use at about Rs 8 kg-1, a 20% reduction in price compared to maize starch of similar user grade.
Despite complaints by members of the industry about the general recession in the economy,reduced exports due to the economic crisis in Southeast Asia, and level of competition in the industry,starch demand can be expected to grow by 5% per annum in the medium to long term in India. Thedemand for starch appears to be saturated in the textile sector, whereas the paper manufacturing orfood processing industries which traditionally did not use much starch, are likely to generate highgrowth rates (10% and above).
Increasing demand for maize from the feed sector is reported to be causing an increase in pricesand a shortage of grain to the starch industry. In this context, the formation of the Indian MaizeDevelopment Association (1MDA) is expected to improve its supply.
Sorghum as a Raw MaterialSome of the country's main starch manufacturers who are based in Ahmedabad, Gujarat, have used upto 50 000 t of sorghum per annum in the past (1994/95 and 1997/98) when maize was in short supply.However, due to the availability of maize and its relatively low prices in 1998, no sorghum utilizationwas observed when this survey was underway.
Indian starch producers (particularly Anil Starch, Ahmedabad) have undertaken research intosorghum-based processing technologies. According to them, there was only one starch factory usingsorghum in the USA (established around 1980), and it too had stopped production after about fiveyears. Overall, the conclusion was that sorghum was not a preferred raw material but would only beused when there were no other alternatives. The constraints perceived by the industry in the use of
25

sorghum are low starch recovery rate, processing difficulties when maize-based technology andmachinery are used, low yield and low quality of byproducts, and poor quality starch fetching a lowprice.
Despite the industry's knowledge of sorghum processing, starch recovery rates are about 4%lower compared to maize (i.e., sorghum = 61 - 62%, maize = 65 - 66%). This could be to thephysicochemical nature of the sorghum grain (sorghum fiber retains more starch) or the processingmachinery and technology which are basically designed to use maize.
Among the difficulties experienced during processing are increased wear and tear of grindingequipment due to the more abrasive nature of sorghum grain, and the occurrence of 'gelling' inpostwet mill flow line causing clogging and related mechanical problems.
Both the yield and quality of byproducts (oil and gluten) from processed sorghum starch are lowcompared to maize. Apart from the lower recovery rate, customers prefer maize oil, which has a moreappealing color. Maize gluten is preferred by the poultry industry due to its yellow color (which in turnproduces a more yellow egg yolk). The difference in oil yield has a significant impact on the costeffectiveness of sorghum as compared to maize.
The quality of plain sorghum starch is considered inferior due to its off white color, makingmarketing more difficult. As a consequence, members of the industry who use it as a raw material arenot always very open about their practices. On the other hand, downstream products from sorghumstarch, such as liquid glucose, are easier to market as they are not visually different from similarproducts of maize. One industry member said he would purchase tapioca starch to producedownstream products if maize was short in supply. He would only consider sorghum if neither maizenor tapioca were available.
In order for sorghum to be used as an alternative raw material in the starch industry, it would haveto be considerably cheaper than maize. The price differential is of the order of Rs. 1000 - 1200 t-1 ofgrain. This compares to a maize price of Rs 4000 - 5100 in Gujarat in 1998. According to a starchmanufacturer near Delhi, the average annual maize price (landed factory) in 1997/98 was about Rs4650 t-1. In 1998, the price differential was not attractive enough for starch manufacturers to usesorghum as a raw material.
ProspectsSorghum can only be used by the starch industry if maize is in short supply. Yet, starch manufacturerswere eager for more information on the technical aspect of separating sorghum starch and itsbyproducts. In this light, the NRCS could keep in touch with AISMA and its members who have usedsorghum in the past (mostly Gujarat-based companies) and, in consultation with starch manufacturers,conduct studies to improve the prospects of this grain.
Given these factors, it is difficult to forecast the demand for sorghum in this sector. Some starchprocessors may always be tempted to use sorghum as soon as maize prices begin to rise. In particular,low quality textile starch and some downstream products are likely to be sorghum based. Interactionbetween the industry and research institutions could promote these uses. As a consequence, thedemand for sorghum in 2010 is projected between 30 000 - 80 000 t.
26

Other Industries
BrewingAlthough beer brewers are aware of sorghum-based beer production in Africa (South Africa andNigeria), they prefer the easily available barley malt as the principal raw material. In addition to barleymalt which constitutes about 40-60% of the ingredients, broken rice or flaked maize are commonlyused as adjuncts. According to the industry, sorghum is not currently used for beer production in Indiaeither as malt or as an adjunct. Therefore, it is difficult to judge the extent to which it might be adoptedas a raw material. It appears this may largely depend on the availability of barley malt and adjuncts,and their prices.
Table 18 provides an overview of the production of barley, malt, and beer in India. There has beena steady decline in area sown to barley due to pressure to increase wheat production. However, thisdecline has not been reflected in a significant measure in the production. In the long run, barleyproduction in India is expected to fall significantly. The demand for malted foods and beer on the otherhand is rising rapidly. The average annual growth rates for malted foods and beer were 15% and 51%between 1995 and 1998 and 8% and 32% between 1990 and 1998 respectively. In 1998, off-take ofbarley by the malted food sector was estimated at only about 5-6% of total production. However, ifsorghum malt or flaked grain could be available at more competitive prices, barley malt could be partlysubstituted and the adjunct completely replaced, helping reduce the cost of production of beer.Research into this area, could be jointly undertaken by interested breweries and the NRCS.
Hindustan Breweries in Mumbai, visited during this survey, expressed interest in undertaking suchexperimental trials using sorghum as an adjunct. However, the brewer was not clear where flaking ofsorghum would take place and what quality of grain would be required for it. This is because thebrewers have no working experience with sorghum, as compared with broken rice.
Given this scenario, one cannot forecast the quantity of sorghum that may possibly be used by thebrewing industry in 2010.
Table 18. P roduc t ion o f bar ley, m a l t e d food , a n d beer in Ind ia .
Year
1990-91
1991-92
1992-93
1993-94
1994-95
1995-96
1996-97
1997-98
Area under barley
('000 ha)
962
954
916
794
891
884
760
-
Barley production
('000 t)
1632
1699
1512
1313
1283
1654
1435
16701
Malted food
('000 t)
14.5
15.6
11.6
10.7
35.5
58.2
59.1
79.7
Beer
(million liters)
203.2
213.6
223.3
305.3
277.8
370.0
425.5
433.1
1. Forecast.
Sources: CMIE 1997; CMIE 1998.
27
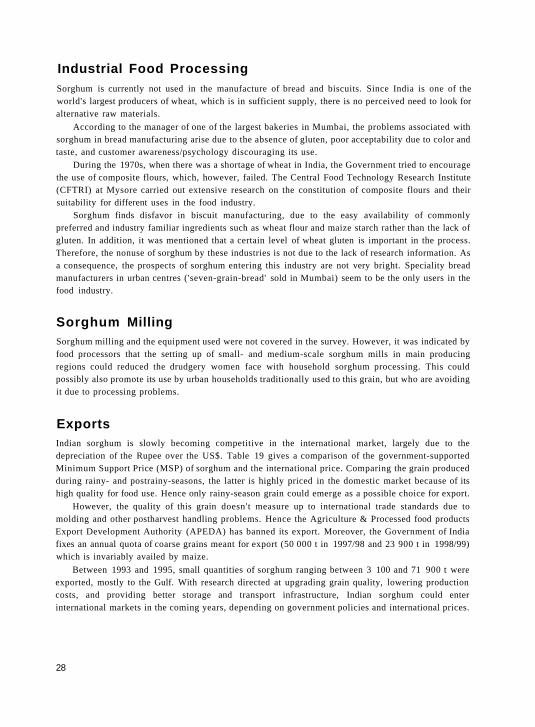
Industrial Food ProcessingSorghum is currently not used in the manufacture of bread and biscuits. Since India is one of theworld's largest producers of wheat, which is in sufficient supply, there is no perceived need to look foralternative raw materials.
According to the manager of one of the largest bakeries in Mumbai, the problems associated withsorghum in bread manufacturing arise due to the absence of gluten, poor acceptability due to color andtaste, and customer awareness/psychology discouraging its use.
During the 1970s, when there was a shortage of wheat in India, the Government tried to encouragethe use of composite flours, which, however, failed. The Central Food Technology Research Institute(CFTRI) at Mysore carried out extensive research on the constitution of composite flours and theirsuitability for different uses in the food industry.
Sorghum finds disfavor in biscuit manufacturing, due to the easy availability of commonlypreferred and industry familiar ingredients such as wheat flour and maize starch rather than the lack ofgluten. In addition, it was mentioned that a certain level of wheat gluten is important in the process.Therefore, the nonuse of sorghum by these industries is not due to the lack of research information. Asa consequence, the prospects of sorghum entering this industry are not very bright. Speciality breadmanufacturers in urban centres ('seven-grain-bread' sold in Mumbai) seem to be the only users in thefood industry.
Sorghum MillingSorghum milling and the equipment used were not covered in the survey. However, it was indicated byfood processors that the setting up of small- and medium-scale sorghum mills in main producingregions could reduced the drudgery women face with household sorghum processing. This couldpossibly also promote its use by urban households traditionally used to this grain, but who are avoidingit due to processing problems.
ExportsIndian sorghum is slowly becoming competitive in the international market, largely due to thedepreciation of the Rupee over the US$. Table 19 gives a comparison of the government-supportedMinimum Support Price (MSP) of sorghum and the international price. Comparing the grain producedduring rainy- and postrainy-seasons, the latter is highly priced in the domestic market because of itshigh quality for food use. Hence only rainy-season grain could emerge as a possible choice for export.
However, the quality of this grain doesn't measure up to international trade standards due tomolding and other postharvest handling problems. Hence the Agriculture & Processed food productsExport Development Authority (APEDA) has banned its export. Moreover, the Government of Indiafixes an annual quota of coarse grains meant for export (50 000 t in 1997/98 and 23 900 t in 1998/99)which is invariably availed by maize.
Between 1993 and 1995, small quantities of sorghum ranging between 3 100 and 71 900 t wereexported, mostly to the Gulf. With research directed at upgrading grain quality, lowering productioncosts, and providing better storage and transport infrastructure, Indian sorghum could enterinternational markets in the coming years, depending on government policies and international prices.
28
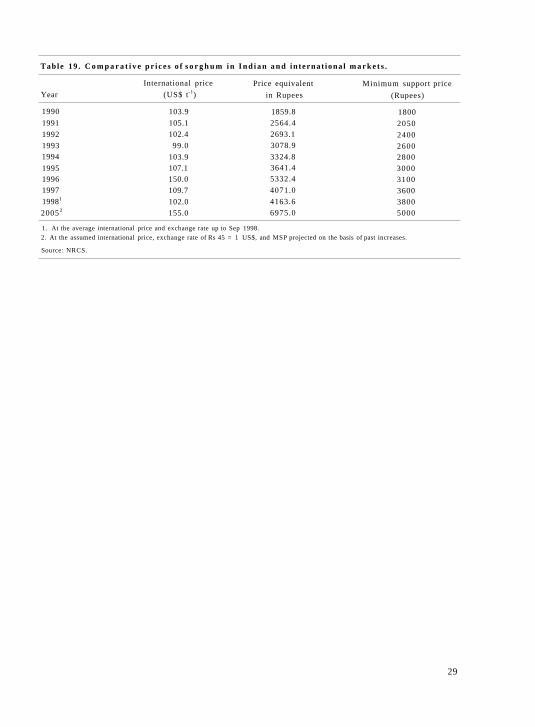
Table 19 . C o m p a r a t i v e p r i ces o f s o r g h u m in I nd ian a n d in terna t iona l ma rke t s .
Year
1990
1991
1992
19931994
199519961997
19981
20052
International price
(US$ t-1)
103.9
105.1
102.4
99.0
103.9107.1150.0
109.7
102.0
155.0
Price equivalent
in Rupees
1859.8
2564.4
2693.1
3078.9
3324.83641.45332.4
4071.0
4163.6
6975.0
Minimum support price
(Rupees)
1800
2050
2400
26002800
30003100
3600
38005000
1. At the average international price and exchange rate up to Sep 1998.2. At the assumed international price, exchange rate of Rs 45 = 1 US$, and MSP projected on the basis of past increases.
Source: NRCS.
29

Maize, Industrial Sorghum's Main Competitor
Maize is sorghum's main competitor in its industrial utilization. Although maize is also used as a foodcrop in India, its industrial use is very substantial. Table 20 shows how maize productionincreased from about 10 million t in 1992/93 to 11.2 million t in 1997/98. Figure 8 shows fluctuationsin the price of maize in the Nizamabad wholesale market as compared to the total Indian production. Itwould be useful to analyze the factors behind this increase. Increased production has largely comeabout from increase in production rather than an increase in the area sown to the crop. However,productivity rose by only about 6% from 1992 to 1997.
This scenario is encouraging some members of the poultry feed industry to favor maize imports,notwithstanding IMDA's primary goal of promoting increased maize production at lower cost.According to Blue Cross Consultants, Delhi, who have a link with the US Feed Grains Council, thereis zero duty on maize imports.
However, there are nontariff stipulations which make imports difficult (e.g., maize has to bedeclared not fit for human consumption; this is not done in the USA). In addition, imports are currentlytoo expensive due to the lack of adequate port handling infrastructure and transport facilities.According to Blue Cross Consultants, in mid-1998, the international FOB price per tonne of maize(No. 2, US Gulf) was $92, freight and insurance charges were $25, on-sea bagging cost $6, andtransport in India was about $3, leading to an overall price of $126 or about Rs 5300 (landed at factorygate). At the same time, in mid-1998, factory prices of Indian maize ranged between Rs 4000 and 5100in different regions. Hence, import may not always be cost effective. Therefore, the availability ofmaize may largely depend on how effectively its productivity increases.
In conclusion, it can be said that sorghum appears to stand a chance as an alternative raw materialin this sector. However, it is likely to face competition from imports in the medium to long term whenIndia develops better port and handling facilities.
Table 2 0 . A r e a , p roduc t ion , a n d p roduc t i v i t y o f m a i z e in Ind ia .
Area (m ha)
Production (m t)
Productivity (kg ha-1)
1992/93
5.9
10.0
1676
1993/94
6.0
9.6
1602
1994/95
6.1
8.9
1570
1995/96
6.0
9.5
1448
1996/97
6.3
10.6
1698
1997/98
6.3
11.2
1775
Source: Government of India 1998.
30

References
Government of India: Ministry of Agriculture. 1998. Agricultural Statistics at a Glance (1998).New Delhi, India: Ministry of Agriculture. 155 pp.
Bhide, S., and Chaudhari, S.K. 1997. Co-operative producers: Their productivity and income. Pages61-67 in Dairy India 1997. New Delhi, India: P.R. Gupta.
CLFMA (Compound Livestock Feed Manufacturers' Association of India). 1997. Annual Report1996-97. Mumbai, India: CLFMA.38 pp.
CMIE (Centre for Monitoring Indian Economy). 1997. Agriculture. Mumbai, India: CMIE. 322 pp.
CMIE (Centre for Monitoring Indian Economy). 1998. Monthly Review of Indian Agriculture.Mumbai., India: CMIE. 167 pp.
Dairy India. 1997. Statistics section. Pages 154-195 in Dairy India. Delhi, India: P.R.Gupta.
ICRISAT & FAO. 1996. The world sorghum and millet economies: Facts, trends and outlook.Patancheru and Rome. 68 pp.
McKinsey. 1997. Modernising the Indian food chain: Food and Agriculture Integrated DevelopmentAction. New Delhi, India: Confederation of Indian Industry. 178 pp.
NRCS (National Research Centre for Sorghum). 1997. Perspective Plan 2020 AD. Hyderabad , India:National Research Centre for Sorghum. 85 pp.
Rakshit, C.C., and Rao, B.S. 1997. Alternate feed uses. Pages 263-266 in Indian Poultry IndustryYearbook 1994. Delhi, India: S.P. Gupta.
Saxena, H.C. 1994. Checking feed prices. Pages 125-129 in Indian Poultry Industry Yearbook 1994.
Delhi, India: S.P. Gupta.
United States of America: Department of Agriculture. 1994. Statistical Abstracts of the United
States Situation. Washington D.C., USA: United States Department of Commerce. 40 pp.
United States of America: Department of Agriculture. 1995. Livestock and Poultry: WorldMarkets and Trade. Washington D.C., USA: United States Department of Agriculture. 42 pp.
World Bank. 1996. India Livestock Sector Review: Enhancing Growth and Development. Report No.
14522-IN. Washington D.C., USA: World Bank. 95 pp.
31

Appendix
Figure 1. Sorghum production in major states of India in 1995-96 (Source: NRCS).
Figure 2. Sorghum production in India between 1992 and 1996 (Source: NRCS).
32

Figure 3. Compound animal feed produced by members of CLFMA (Source: CLFMA).
1. Figures until 1990 are based on the calendar year.
2. Figures are from April to following March.
3. Cattle feed includes 'other feed', which accounted for about 15 000 t in 1992/93 and about 30 000 t in 1996/97.
33

Broiler feed Broiler rations
Layer feed Layer rations
Commercial dairy feed Commercial dairy rations
Figure 4. The potential demand for sorghum in the animal feed industry.
Note: Medium growth rates have been used to calculate the potential demand for sorghum.
It is assumed that 50% of the respective feed industries would include sorghum in their rations at the inclusion rates shown.
34

Figure 5. Praj Industries' HIFERM-NM process to convert starch into alcohol (Source: Praj Industries Ltd., Pune).
35
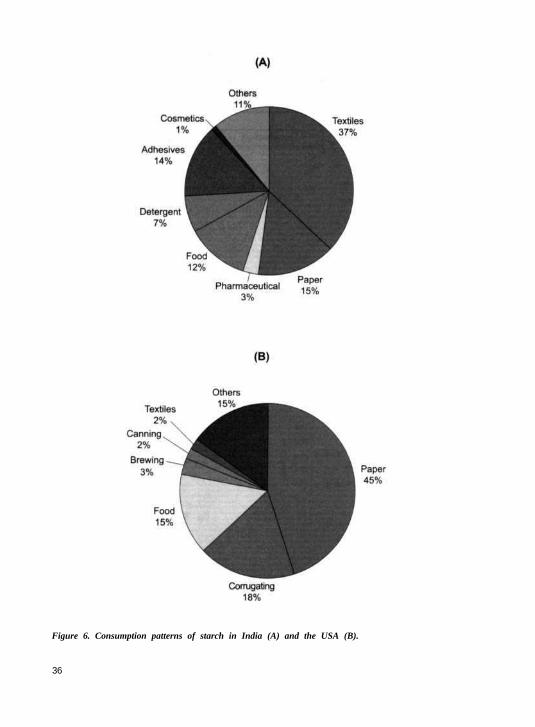
Figure 6. Consumption patterns of starch in India (A) and the USA (B).
36

Main grain
Plain starch
Byproducts :
* Gluten* Oil* Oilcake* Fiber* Steepwater
Downstream products :
* Modified starch* Dextrin* Liquid glucose* Dextrose monohydrate* Dextrose anhydrous* Sorbitol* Calcium gluconate* Citric acid
Figure 7. Downstream products and byproducts from the maize-based starch industry.
37
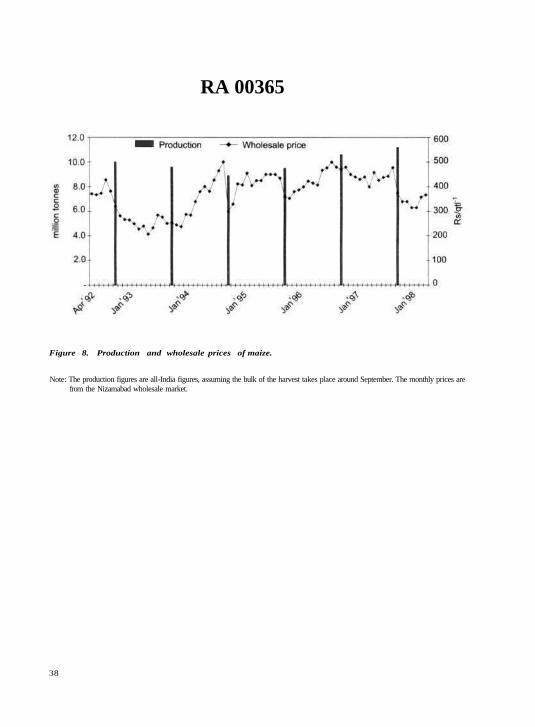
RA 00365
Figure 8. Production and wholesale prices of maize.
Note: The production figures are all-India figures, assuming the bulk of the harvest takes place around September. The monthly prices arefrom the Nizamabad wholesale market.
38

About ICRISAT
The semi-arid tropics (SAT) encompasses parts of 48 developing countries including most of India,parts of southeast Asia, a swathe across sub-Saharan Africa, much of southern and eastern Africa, andparts of Latin America. Many of these countries are among the poorest in the world. Approximatelyone-sixth of the world's population lives in the SAT, which is typified by unpredictable weather,limited and erratic rainfall, and nutrient-poor soils.
ICRISAT's mandate crops are sorghum, pearl millet, finger millet, chickpea, pigeonpea, andgroundnut; these six crops are vital to life for the ever-increasing populations of the semi-arid tropics.ICRISAT's mission is to conduct research which can lead to enhanced sustainable production of thesecrops and to improved management of the limited natural resources of the SAT ICRISATcommunicates information on technologies as they are developed through workshops, networks,training, library services, and publishing.
ICRISAT was established in 1972. It is one of 16 nonprofit, research and training centers fundedthrough the Consultative Group on International Agricultural Research (CGIAR). The CG1AR is aninformal association of approximately 50 public and private sector donors; it is co-sponsored by theFood and Agriculture Organization of the United Nations (FAO), the United Nations DevelopmentProgramme (UNDP), the United Nations Environment Programme (UNEP), and the World Bank.