city and county of san francisco shzr 043 -...
TRANSCRIPT
SEISMIC HAZARD ZONE REPORT 043
SEISMIC HAZARD ZONE REPORT FOR THE CITY AND COUNTY OF SAN FRANCISCO,
CALIFORNIA
2000
DEPARTMENT OF CONSERVATION Division of Mines and Geology
STATE OF CALIFORNIA
GRAY DAVIS GOVERNOR
THE RESOURCES AGENCY MARY D. NICHOLS
SECRETARY FOR RESOURCES
DEPARTMENT OF CONSERVATION DARRYL YOUNG
DIRECTOR

DIVISION OF MINES AND GEOLOGY
JAMES F. DAVIS, STATE GEOLOGIST
Copyright © 2001 by the California Department of Conservation. All rights reserved. No part of this publication may be reproduced without written consent of the Department of Conservation.
“The Department of Conservation makes no warrantees as to the suitability of this product for any particular purpose.”

SEISMIC HAZARD ZONE REPORT 043
SEISMIC HAZARD ZONE REPORT FOR THE CITY AND COUNTY OF SAN FRANCISCO,
CALIFORNIA
CALIFORNIA GEOLOGICAL SURVEY'S PUBLICATION SALES OFFICES:
Southern California Regional Office 888 South Figueroa Street, Suite 475 Los Angeles, CA 90017 (213) 239-0878
Publications and Information Office 801 K Street, MS 14-31 Sacramento, CA 95814-3531 (916) 445-5716
Bay Area Regional Office 345 Middlefield Road, MS 520 Menlo Park, CA 94025 (650) 688-6327

List of Revisions – City and County of San Francisco SHZR 043
2001 Text revised
9/1/5 BPS address corrected and web links updated and Figure 3.5 added and Figures 1.1 to 1.4 remade
10/10/05 Bay Area Regional Office and Southern California Regional Office addresses updated


iii
CONTENTS
EXECUTIVE SUMMARY ......................................................................................................... viii
INTRODUCTION ...........................................................................................................................1
SECTION 1 LIQUEFACTION EVALUATION REPORT Liquefaction Zones in the City and County of San Francisco, California.........................................................................................3
PURPOSE....................................................................................................................................3
BACKGROUND .....................................................................................................................4
METHODS SUMMARY.........................................................................................................4
SCOPE AND LIMITATIONS.................................................................................................4
PART I .........................................................................................................................................5
PHYSIOGRAPHY...................................................................................................................5
GEOLOGY ..............................................................................................................................5
ENGINEERING GEOLOGY ..................................................................................................6
GROUND-WATER CONDITIONS .......................................................................................8
PART II........................................................................................................................................9
LIQUEFACTION POTENTIAL .............................................................................................9
LIQUEFACTION SUSCEPTIBILITY....................................................................................9
LIQUEFACTION OPPORTUNITY .....................................................................................10
LIQUEFACTION ZONES ....................................................................................................12
ACKNOWLEDGMENTS .........................................................................................................13
REFERENCES ..........................................................................................................................14
SECTION 2 EARTHQUAKE-INDUCED LANDSLIDE EVALUATION REPORT Earthquake-Induced Landslide Zones in the City and County of San Francisco, California ........19

iv
PURPOSE..................................................................................................................................19
BACKGROUND ...................................................................................................................20
METHODS SUMMARY.......................................................................................................20
SCOPE AND LIMITATIONS...............................................................................................21
PART I .......................................................................................................................................21
PHYSIOGRAPHY.................................................................................................................21
GEOLOGY ............................................................................................................................22
ENGINEERING GEOLOGY ................................................................................................24
PART II......................................................................................................................................29
EARTHQUAKE-INDUCED LANDSLIDE HAZARD POTENTIAL.................................29
EARTHQUAKE-INDUCED LANDSLIDE HAZARD ZONE ............................................33
ACKNOWLEDGMENTS .........................................................................................................35
REFERENCES ..........................................................................................................................35
AIR PHOTOS ............................................................................................................................37
APPENDIX A Source of Rock Strength Data...........................................................................37
SECTION 3 GROUND SHAKING EVALUATION REPORT Potential Ground Shaking in the City and County of San Francisco, California .....................................................................39
PURPOSE..................................................................................................................................39
EARTHQUAKE HAZARD MODEL .......................................................................................40
APPLICATIONS FOR LIQUEFACTION AND LANDSLIDE HAZARD ASSESSMENTS 44
USE AND LIMITATIONS........................................................................................................47
REFERENCES ..........................................................................................................................48

v
ILLUSTRATIONS
Figure 2.1. Yield Acceleration vs. Newmark Displacement for the Southern California Edison Lucerne strong-motion record from the 28 June 1992 Landers, California earthquake. .......31
Figure 3.1. City and County of San Francisco and portions of adjacent quadrangles, 10% exceedance in 50 years peak ground acceleration (g)—Firm rock conditions. .....................41
Figure 3.2. City and County of San Francisco and portions of adjacent quadrangles, 10% exceedance in 50 years peak ground acceleration (g)—Soft rock conditions. ......................42
Figure 3.3. City and County of San Francisco and portions of adjacent quadrangles, 10% exceedance in 50 years peak ground acceleration (g)—Alluvium conditions.......................43
Figure 3.4. City and County of San Francisco and portions of adjacent quadrangles, 10% exceedance in 50 years peak ground acceleration—Predominant earthquake. .....................45
Figure 3.5. City and County of San Francisco and portions of adjacent quadrangles, 10% exceedance in 50 years magnitude-weighted pseudo-peak acceleration for alluvium - Liquefaction opportunity .......................................................................................................46
Table 1.1. Summary of Geotechnical Characteristics for Quaternary Geological Units Evaluated for Liquefaction Zoning in the City and County of San Francisco.........................8
Table 1.2. Liquefaction Susceptibility of Quaternary Sedimentary Units and Artificial Fill.......10
Table 2.1. Summary of the Shear Strength Statistics for the City and County of San Francisco.26
Table 2.2. Summary of the Shear Strength Groups for the City and County of San Francisco 27
Table 2.3. Hazard Potential Matrix for Earthquake-Induced Landslides in San Francisco. Shaded area indicates hazard potential levels included within the hazard zone....................33
Plate 1.1. Borehole log data locations, City and County of San Francisco ...................................50
Plate 1.2. Historically highest ground water contours and locations of boreholes City and County of San Francisco........................................................................................................51
Plate 2.1. Landslide inventory and shear test sample locations, City and County of San Francisco .........................................................................................................................52


vii
EXECUTIVE SUMMARY
This report summarizes the methods and sources of information used to prepare the Seismic Hazard Zone Map for the City and County of San Francisco, California. The map displays the boundaries of Zones of Required Investigation for liquefaction and earthquake-induced landslides over an area of approximately 49 square miles at a scale of 1 inch = 2,000 feet.
The City and County of San Francisco lie in the western part of the Coast Ranges on a peninsula bound by the Pacific Ocean on the west and San Francisco Bay on the north and east. The present topography is the result of erosion of bedrock of varying hardness with deposits of windblown sand that locally mantle the bedrock. Quaternary tectonism, marine and estuarine deposition, and placement artificial fill have also contributed to the current topographic setting of the city. San Francisco is accessible from the north across the Golden Gate Bridge via U.S. Highway 101, from the east via Interstate Highway 80 across the Bay Bridge, and from the south via U. S. Highway 101 and Interstate Highway 280. Land use in the city varies from densely urban in the northeast to a multilevel residential setting elsewhere. Scattered across the city are several parks, the largest of which is Golden Gate Park in the west-central part of the city.
The map is prepared by employing geographic information system (GIS) technology, which allows the manipulation of three-dimensional data. Information considered includes topography, surface and subsurface geology, borehole data, historical ground-water levels, existing landslide features, slope gradient, rock-strength measurements, geologic structure, and probabilistic earthquake shaking estimates. The shaking inputs are based upon probabilistic seismic hazard maps that depict peak ground acceleration, mode magnitude, and mode distance with a 10% probability of exceedance in 50 years.
Ground failure associated with liquefaction has occurred during historical earthquakes in San Francisco. In the City and County of San Francisco the liquefaction zone is concentrated south of Market Street, in the Mission District, at Hunters Point, in areas of artificial fill (“made land”) along the waterfront, especially the Marina District and at Treasure Island, and along the beaches facing the ocean. Steep slopes on hills within the city and cliffs facing the ocean are the areas most susceptible to landsliding. About 3 percent of the land in San Francisco is within the earthquake-induced landslide hazard zone.

How to view or obtain the map
Seismic Hazard Zone Maps, Seismic Hazard Zone Reports and additional information on seismic hazard zone mapping in California are available on the Division of Mines and Geology's Internet page: http://www.conservation.ca.gov/CGS/index.htm
Paper copies of Official Seismic Hazard Zone Maps, released by DMG, which depict zones of required investigation for liquefaction and/or earthquake-induced landslides, are available for purchase from:
BPS Reprographic Services 945 Bryant Street San Francisco, California 94105 (415) 512-6550
Seismic Hazard Zone Reports (SHZR) summarize the development of the hazard zone map for each area and contain background documentation for use by site investigators and local government reviewers. These reports are available for reference at DMG offices in Sacramento, San Francisco, and Los Angeles. NOTE: The reports are not available through BPS Reprographic Services.

1
INTRODUCTION
The Seismic Hazards Mapping Act (the Act) of 1990 (Public Resources Code, Chapter 7.8, Division 2) directs the California Department of Conservation (DOC), Division of Mines and Geology (DMG) to delineate seismic hazard zones. The purpose of the Act is to reduce the threat to public health and safety and to minimize the loss of life and property by identifying and mitigating seismic hazards. Cities, counties, and state agencies are directed to use the seismic hazard zone maps in their land-use planning and permitting processes. They must withhold development permits for a site within a zone until the geologic and soil conditions of the project site are investigated and appropriate mitigation measures, if any, are incorporated into development plans. The Act also requires sellers (and their agents) of real property within a mapped hazard zone to disclose at the time of sale that the property lies within such a zone. Evaluation and mitigation of seismic hazards are to be conducted under guidelines established by the California State Mining and Geology Board (DOC, 1997; also available on the Internet at http://gmw.consrv.ca.gov/shmp/webdocs/sp117.pdf).
The Act also directs SMGB to appoint and consult with the Seismic Hazards Mapping Act Advisory Committee (SHMAAC) in developing criteria for the preparation of the seismic hazard zone maps. SHMAAC consists of geologists, seismologists, civil and structural engineers, representatives of city and county governments, the state insurance commissioner and the insurance industry. In 1991 SMGB adopted initial criteria for delineating seismic hazard zones to promote uniform and effective statewide implementation of the Act. These initial criteria provide detailed standards for mapping regional liquefaction hazards. They also directed DMG to develop a set of probabilistic seismic maps for California and to research methods that might be appropriate for mapping earthquake-induced landslide hazards.
In 1996, working groups established by SHMAAC reviewed the prototype maps and the techniques used to create them. The reviews resulted in recommendations that 1) the process for zoning liquefaction hazards remain unchanged and 2) earthquake-induced landslide zones be delineated using a modified Newmark analysis.
This Seismic Hazard Zone Report summarizes the development of the hazard zone map. The process of zoning for liquefaction uses a combination of Quaternary geologic mapping, historical ground-water information, and subsurface geotechnical data. The process for zoning earthquake-induced landslides incorporates earthquake loading, existing landslide features, slope gradient, rock strength, and geologic structure. Probabilistic seismic hazard maps, which are the underpinning for delineating seismic hazard zones, have been prepared for peak ground acceleration, mode magnitude, and mode distance with a 10% probability of exceedance in 50 years (Petersen and others, 1996) in accordance with the mapping criteria.

This report summarizes seismic hazard zone mapping for potentially liquefiable soils and earthquake-induced landslides in the City and County of San Francisco.

3
SECTION 1 LIQUEFACTION EVALUATION REPORT
Liquefaction Zones in the City and County of San Francisco, California
By Mark J. DeLisle
California Department of Conservation
Division of Mines and Geology
PURPOSE
The Seismic Hazards Mapping Act (the Act) of 1990 (Public Resources Code, Chapter 7.8, Division 2) directs the California Department of Conservation (DOC), Division of Mines and Geology (DMG) to delineate Seismic Hazard Zones. The purpose of the Act is to reduce the threat to public health and safety and to minimize the loss of life and property by identifying and mitigating seismic hazards. Cities, counties, and state agencies are directed to use seismic hazard zone maps developed by DMG in their land-use planning and permitting processes. The Act requires that site-specific geotechnical investigations be performed prior to permitting most urban development projects within seismic hazard zones. Evaluation and mitigation of seismic hazards are to be conducted under guidelines adopted by the California State Mining and Geology Board (SMGB) (DOC, 1997; also available on the Internet at http://gmw.consrv.ca.gov/shmp/webdocs/sp117.pdf).
This section of the evaluation report summarizes seismic hazard zone mapping for potentially liquefiable soils in the City and County of San Francisco. This section, along with Section 2 (addressing earthquake-induced landslides), and Section 3 (addressing potential ground shaking), form a report that is one of a series that summarizes production of similar seismic hazard zone maps within the state (Smith, 1996). Additional information on seismic hazards zone mapping in California is on DMG’s Internet web page: http://www.conservation.ca.gov/CGS/index.htm

DIVISION OF MINES AND GEOLOGY SHZR 043
4
BACKGROUND
Liquefaction-induced ground failure has historically been a major cause of earthquake damage in northern California. During the 1989 Loma Prieta and 1906 San Francisco earthquakes, significant damage to roads, utility pipelines, buildings, and other structures in the San Francisco Bay area was caused by liquefaction-induced ground displacement.
Localities most susceptible to liquefaction-induced damage are underlain by loose, water-saturated, granular sediment within 40 feet of the ground surface. These geological and ground-water conditions are widespread in the San Francisco Bay area, most notably in some densely populated valley regions and alluviated floodplains. In addition, the opportunity for strong ground shaking is high because of the many nearby active faults. The combination of these factors constitutes a significant seismic hazard especially in areas marginal to the San Francisco Bay in general, as well as in the City and County of San Francisco.
METHODS SUMMARY
Characterization of liquefaction hazard presented in this report requires preparation of maps that delineate areas underlain by potentially liquefiable sediment. The following were collected or generated for this evaluation:
• Existing geologic maps were used to provide an accurate representation of the spatial distribution of Quaternary deposits in the study area. Geologic units that generally are susceptible to liquefaction include late Quaternary alluvial and fluvial sedimentary deposits and artificial fill
• Construction of shallow ground-water maps showing the historically highest known ground-water levels
• Quantitative analysis of geotechnical data to evaluate liquefaction potential of deposits
• Information on potential ground shaking intensity based on DMG probabilistic shaking maps
The data collected for this evaluation were processed into a series of geographic information system (GIS) layers using commercially available software. The liquefaction zone map was derived from a synthesis of these data and according to criteria adopted by the SMGB (DOC, 2000).
SCOPE AND LIMITATIONS
Evaluation for potentially liquefiable soils generally is confined to areas covered by Quaternary (less than about 1.6 million years) sedimentary deposits. Such areas consist
2001 SEISMIC HAZARD ZONE REPORT FOR THE CITY AND COUNTY OF SAN FRANCISCO 5
mainly of low-lying shoreline regions, alluviated valleys, and floodplains, and alluvial fans. DMG’s liquefaction hazard evaluations are based on information on earthquake ground shaking, surface and subsurface lithology, geotechnical soil properties, and ground-water depth, which is gathered from various sources. Although selection of data used in this evaluation was rigorous, the quality of the data used varies. The State of California and the Department of Conservation make no representations or warranties regarding the accuracy of the data obtained from outside sources.
Liquefaction zone maps are intended to prompt more detailed, site-specific geotechnical investigations, as required by the Act. As such, liquefaction zone maps identify areas where the potential for liquefaction is relatively high. They do not predict the amount or direction of liquefaction-related ground displacements, or the amount of damage to facilities that may result from liquefaction. Factors that control liquefaction-induced ground failure are the extent, depth, density, and thickness of liquefiable materials, depth to ground water, rate of drainage, slope gradient, proximity to free faces, and intensity and duration of ground shaking. These factors must be evaluated on a site-specific basis to assess the potential for ground failure at any given project site.
Information developed in the study is presented in two parts: physiographic, geologic, and hydrologic conditions in PART I, and liquefaction and zoning evaluations in PART II.
PART I
PHYSIOGRAPHY
Study Area Location and Physiography
The City and County of San Francisco lie in the western part of the Coast Ranges along the central California coast. The study area is a peninsula bound by the Pacific Ocean on the west and San Francisco Bay on the north and east. The prominent northwesterly structural and topographic trend of the northern Coast Ranges is not evident in the city except for minor hills and valleys. The present topography is the result of erosion of Mesozoic Franciscan Complex rocks of varying hardness with deposits of windblown sand that locally mantle the bedrock exposures. Quaternary tectonism, marine and estuarine deposition, and artificial fill (man-made land) have also contributed to the development of the current topography of the study area.
GEOLOGY
Surficial Geology
The City and County of San Francisco are located within the southern portion of the San Francisco North, western portion of the Oakland West, northern portion of the San

DIVISION OF MINES AND GEOLOGY SHZR 043
6
Francisco South and northwestern portion of the Hunters Point 7.5-minute U. S. Geological Survey topographic quadrangles. These quadrangles have been mapped in detail by Radbruch (1957), Bonilla (1971), Schlocker (1974), Helley and others (1979), Helley and Graymer (1997) and Knudsen and others (1997).
The geologic formations on the peninsula fall into three groups, which differ greatly in age; older bedrock, Tertiary strata, and surficial deposits. The older bedrock consists of Franciscan Complex sedimentary rocks, greenstone, various other metamorphic and sheared rocks and associated serpentinite, and gabbro-diabase intrusions. Tertiary rocks crop out in the sea cliffs along the southwestern part of the county. Tilted marine strata of the Plio-Pleistocene Merced Formation (QTm) (Clifton and Hunter, 1987) lie unconformably below Pleistocene Colma Formation (Qco) and late Pleistocene and Holocene dune sand (Qs). The surficial deposits of the city consist of colluvium in the hills with broad valleys that are underlain by unconsolidated material. Unconsolidated late Pleistocene and Holocene deposits are primarily sand, modern beach deposits (Qm), dune sand (Qs), and undifferentiated Quaternary deposits (Qa). Also included is bay mud (Qhbm) (Joyner, 1982), landslides, rubbly slope debris, and ravine fill. These units were deposited on the old topographic surface of Franciscan Complex rocks (Bonilla, 1964) or Pleistocene deposits. Artificial fill (af) is also widespread in the area.
Yerba Buena Island is a natural island composed of Franciscan Complex sandstone, colluvium, and artificial fill (af). Treasure Island consists entirely of sandy and silty artificial fill.
The Quaternary geology was compiled from published geologic maps of Radbruch (1957), Radbruch and Schlocker (1958), Bonilla (1971), Schlocker (1974), and Knudsen and others (1997). Slight modifications to the boundaries of some Quaternary units were made based on subsurface information from boreholes and examination of old U.S. Coast Survey (1851, 1857a, 1857b, 1867) topographic maps. These old topographic maps are particularly useful in determining areas of artificial fill. Modifications to the maps were made (using computers) by matching the pre-existing coastline and old drainage patterns with present-day topography, which permitted identification of previously unknown fills.
The Quaternary deposits evaluated for liquefaction zoning are artificial fills (af), modern beach deposits (Qm), dune sand (Qs), and undifferentiated Quaternary deposits (Qa).
ENGINEERING GEOLOGY
Borehole information was used to determine general subsurface conditions. Water depths, local site stratigraphy, and standard penetration tests (SPT) were used to characterize the geotechnical properties of each stratigraphic unit. Geotechnical data were collected from more than 600 sites, where one or more holes had been drilled. Borehole logs from these sites were collected, after inspecting several thousand files, from CalTrans, the City of San Francisco’s Bureau of Building Inspection, Clean Water Program, Bureau of Engineering, and Department of City Planning. Plate 1.1 shows the locations of boreholes used in this study.

2001 SEISMIC HAZARD ZONE REPORT FOR THE CITY AND COUNTY OF SAN FRANCISCO 7
Several geologic cross sections were constructed across the study area using areal-geology and borehole-lithology information to make subsurface stratigraphic correlations. On the western side of the peninsula, the dune sand deposits (Qs) extend from west of Lake Merced, where they unconformably overlie the Pleistocene Colma Formation, to the north. At Point Lobos and the Presidio the dune sand overlies the Franciscan Complex. The thickness of the dune sand ranges from zero to nearly 100 feet; its relative density grades from loose near the surface to dense and very dense with depth. The dune sand is Holocene to possibly Pleistocene. The Colma Formation lies on Franciscan Complex rocks and consists of interbedded dense sand, silty sand, clayey sand, and stiff clay. The Colma Formation originated in shallow marine, estuarine, and alluvial environments.
On the eastern side of the peninsula, the dune sand deposits extend from the bay on the north to an area south of Market Street. On the north, the dune sand overlies probable Colma Formation; whereas, on the south, it overlies undivided Quaternary deposits (Qa) and interfingers with the Holocene bay mud (Qhbm). Bay mud underlies areas of artificial fill (af) along fringes of the bay between the present and past (historical) shorelines. For example, one borehole near China Basin between 4th and 5th streets penetrated 125 feet of bay mud (Qhbm). There is artificial fill (af) to 60 feet in a borehole south of Market Street along the Embarcadero. The Qa overlies the Colma Formation and consists of stiff clay, clayey sand, silty sand, and sand. The Qa appears to consist of late Pleistocene to Holocene alluvial, estuarine, and, possibly, eolian deposits.
Standard Penetration Test (SPT) data provide a standardized measure of the penetration resistance of a geologic deposit and commonly are used as an index of density. Many geotechnical investigations record SPT data, including the number of blows by a 140-pound drop weight required to drive a sampler of specific dimensions one foot into the soil. Recorded blow counts for non-SPT geotechnical sampling, where the sampler diameter, hammer weight or drop distance differ from those specified for an SPT (ASTM D1586), were converted to SPT-equivalent blow count values and entered into the DMG GIS. The actual and converted SPT blow counts were normalized to a common reference effective overburden pressure of one atmosphere (approximately one ton per square foot) and a hammer efficiency of 60% using a method described by Seed and Idriss (1982) and Seed and others (1985). This normalized blow count is referred to as (N1)60.
From a geotechnical perspective, dune sand is fine- to medium-grained and well sorted, with less than 5% fines by weight. Normalized blow count values, (N1)60, for 597 dune sand samples (Table 1.1) have a mean value of 29. Where the ground is saturated, less than 1% of the samples has values lower than 15 and the mean (N1)60 is 39, indicating that this sand may densify rapidly when saturated. Samples of undifferentiated Quaternary deposits were grouped into two categories: sand (SP in the Unified Soil Classification) and silty sand (SM). The 129 well-sorted sand (SP) samples have a mean (N1)60 value of 43, and the 134 samples of silty sand (SM) have a mean (N1)60 of 40. A summary of the Quaternary units is shown in Table 1.1.

DIVISION OF MINES AND GEOLOGY SHZR 043
8
*Where the sampler diameter, hammer size or drop distance differed from those specified for an SPT, recorded blow counts were converted to the equivalent of SPT blow counts. The actual and converted SPT blow counts were normalized using a common effective overburden pressure and adjusted for equipment and operational procedures using a method described by Seed and Idriss (1982) and Seed and others (1985). This normalized blow count, (N1)60, is used in Table 1.1
Table 1.1. Summary of Geotechnical Characteristics for Quaternary Geological Units Evaluated for Liquefaction Zoning in the City and County of San Francisco.
GROUND-WATER CONDITIONS
Liquefaction hazard may exist in areas where depth to ground water is 40 feet or less. DMG uses the highest known ground-water levels because water levels during an earthquake cannot be anticipated because of the unpredictable fluctuations caused by natural processes and human activities. A historical-high ground-water map differs from most ground-water maps, which show the actual water table at a particular time. Plate 1.2 depicts a hypothetical ground-water table within alluviated areas.
Ground-water conditions were investigated in the City and County of San Francisco to evaluate the depth to saturated materials. Saturated conditions reduce the effective normal stress, thereby increasing the likelihood of earthquake-induced liquefaction (Youd, 1973). For this evaluation, a ground-water surface map, showing the historically highest ground water, was prepared. Soils above the mapped water surface are considered non-liquefiable. Preparation of the map incorporated a study for San Francisco County by Bartell (1913) using water depths from approximately 700 water wells. Water depths recorded on Caltrans borehole logs, U.S. Geological Survey (USGS) monitoring wells (Phillips and others, 1993), California Department of Water Resources water-well logs, and borehole logs from soils reports and other geotechnical investigations from 1955-92 were collected from various agencies. Data were plotted and tabulated, and ground-water depths were contoured (Plate 1.2). Most ground-water maps show the actual water table at a particular time, whereas this map depicts a hypothetical ground-water table. These unpublished ground-water maps are used during the liquefaction analysis.
Geologic Unit Soil Class
Low Range (lower 10%)
Average (40-60%)
High Range (upper 10%)
Low Range (lower 10%)
Most Common Range (40-60%)
High Range (upper 10%)
Dune sand SP 92-98 105 112-124 3-9 20-28 54-128Undiff. Quat. SP 93-101 107 115-123 6-14 33-48 77-136Undiff. Quat. SM 97-104 110 118-124 6-11 30-38 75-133
STANDARD PENETRATION RESISTANCE
(blows/foot)*
GEOLOGIC DATA DRY UNIT WEIGHT
(PCF)

2001 SEISMIC HAZARD ZONE REPORT FOR THE CITY AND COUNTY OF SAN FRANCISCO 9
PART II
LIQUEFACTION POTENTIAL
Liquefaction may occur in water-saturated sediment during moderate to great earthquakes. Liquefied sediment loses strength and may fail, causing damage to buildings, bridges, and other structures. Many methods for mapping liquefaction hazard have been proposed. Youd (1991) highlights the principal developments and notes some of the widely used criteria. Youd and Perkins (1978) demonstrate the use of geologic criteria as a qualitative characterization of liquefaction susceptibility and introduce the mapping technique of combining a liquefaction susceptibility map and a liquefaction opportunity map to produce a liquefaction potential map. Liquefaction susceptibility is a function of the capacity of sediment to resist liquefaction. Liquefaction opportunity is a function of the potential seismic ground shaking intensity.
The method applied in this study for evaluating liquefaction potential is similar to that of Tinsley and others (1985). Tinsley and others (1985) applied a combination of the techniques used by Seed and others (1983) and Youd and Perkins (1978) for their mapping of liquefaction hazards in the Los Angeles region. This method combines geotechnical analyses, geologic and hydrologic mapping, and probabilistic earthquake shaking estimates, but follows criteria adopted by the SMGB (DOC, 2000).
LIQUEFACTION SUSCEPTIBILITY
Liquefaction susceptibility reflects the relative resistance of a soil to loss of strength when subjected to ground shaking. Physical properties of soil such as sediment grain-size distribution, compaction, cementation, saturation, and depth govern the degree of resistance to liquefaction. Some of these properties can be correlated to a sediment’s geologic age and environment of deposition of a sediment. With increasing age, relative density may increase through cementation of the particles or compaction caused by the weight of the overlying sediment. Grain-size characteristics of a soil also influence susceptibility to liquefaction. Sand is more susceptible than silt or gravel, although silt of low plasticity is treated as liquefiable in this investigation. Cohesive soils generally are not considered susceptible to liquefaction. Such soils may be vulnerable to strength loss with remolding and represent a hazard that is not addressed in this investigation. Soil characteristics and processes that result in higher measured penetration resistances generally indicate lower liquefaction susceptibility. Thus, blow count and cone penetrometer values are useful indicators of liquefaction susceptibility.
Saturation is required for liquefaction, and the liquefaction susceptibility of a soil varies with the depth to ground water. Very shallow ground water increases the susceptibility to liquefaction (soil is more likely to liquefy). Soils that lack resistance (susceptible soils) typically are saturated, loose and sandy. Soils resistant to liquefaction include all soil types that are dry, cohesive, or sufficiently dense.

DIVISION OF MINES AND GEOLOGY SHZR 043
10
DMG’s map inventory of areas containing soils susceptible to liquefaction begins with evaluation of geologic maps and historical occurrences, cross-sections, geotechnical test data, geomorphology, and ground-water hydrology. Soil properties and soil conditions such as type, age, texture, color, and consistency, along with historical depths to ground water are used to identify, characterize, and correlate susceptible soils. Because Quaternary geologic mapping is based on similar soil observations, liquefaction susceptibility maps typically are similar to Quaternary geologic maps.
The propensity for a deposit to fail was characterized by grouping deposits into high, moderate, low, and very low categories (Table 1.2) based on depth to ground water, type of sediment, texture, and stiffness, as determined by the SPT. The highest susceptibility is found in areas where dune sand (Qs) is saturated at depths shallower than 10 feet, in areas of artificial fill, and beach deposits.
Also, historical occurrences of liquefaction during the 1906 San Francisco earthquake indicate a pronounced lack of liquefaction in the undifferentiated Quaternary deposits (Qa) or the dune sand (Qs) where the depth to ground water is more than 10 feet. There is one reported occurrence of ground failure on 48th Avenue between K and N streets (currently 48th Avenue between Kirkham and Noriega streets) in dune sand where depth to water is less than 10 feet. This description (Lawson and others, 1908) does indicate the area was developed prior to 1906; consequently, it may have been the fill material that failed.
Water depth High Moderate Low Very Low
10 ft af, Qm, Qs Qa bedrock, Qcl
10-30 ft af Qs Qa bedrock, Qcl
30-50 ft af Qs Qa bedrock, Qcl
Table 1.2. Liquefaction Susceptibility of Quaternary Sedimentary Units and Artificial Fill.
LIQUEFACTION OPPORTUNITY
Liquefaction opportunity is a measure, expressed in probabilistic terms, of the potential for strong ground shaking. Analyses of in-situ liquefaction resistance require assessment of liquefaction opportunity. The minimum level of seismic excitation to be used for such purposes is the level of peak ground acceleration (PGA) with a 10% probability of exceedance over a 50-year period (DOC, 2000). The earthquake magnitude used in DMG’s analysis is the magnitude that contributes most to the calculated PGA for an area.
For the City and County of San Francisco area, peak accelerations of 0.5 g to 0.86 g resulting from an earthquake of magnitude 7.9 were used for liquefaction analyses. The

2001 SEISMIC HAZARD ZONE REPORT FOR THE CITY AND COUNTY OF SAN FRANCISCO 11
PGA and magnitude values were based on de-aggregation of the probabilistic hazard at the 10% in 50-year hazard level (Petersen and others, 1996). See the ground motion portion (Section 3) of this report for further details. Due to this anticipated high shaking hazard, the susceptibility maps are essentially the same as the liquefaction potential maps.
Quantitative Liquefaction Analysis
DMG performs quantitative analysis of geotechnical data to evaluate liquefaction potential using the Seed-Idriss Simplified Procedure (Seed and Idriss, 1971; Seed and others, 1983; National Research Council, 1985; Seed and others, 1985; Seed and Harder, 1990; Youd and Idriss, 1997). Using the Seed-Idriss Simplified Procedure one can calculate soil resistance to liquefaction, expressed in terms of cyclic resistance ratio (CRR), based on SPT results, ground-water level, soil density, moisture content, soil type, and sample depth. CRR values are then compared to calculated earthquake-generated shear stresses expressed in terms of cyclic stress ratio (CSR). The Seed-Idriss Simplified Procedure requires normalizing earthquake loading relative to a M7.5 event for the liquefaction analysis. To accomplish this, DMG’s analysis uses the Idriss magnitude scaling factor (MSF) (Youd and Idriss, 1997). It is convenient to think in terms of a factor of safety (FS) relative to liquefaction, where: FS = (CRR / CSR) * MSF. FS, therefore, is a quantitative measure of liquefaction potential. DMG uses a factor of safety of 1.0 or less, where CSR equals or exceeds CRR, to indicate the presence of potentially liquefiable soil. While an FS of 1.0 is considered the “trigger” for liquefaction, for a site specific analysis an FS of as much as 1.5 may be appropriate depending on the vulnerability of the site and related structures. The DMG liquefaction analysis program calculates an FS for each geotechnical sample for which blow counts were collected. Typically, multiple samples are collected for each borehole. The lowest FS in each borehole is used for that location. FS values vary in reliability according to the quality of the geotechnical data used in their calculation. FS, as well as other considerations such as slope, presence of free faces, and thickness and depth of potentially liquefiable soil, are evaluated in order to construct liquefaction potential maps, which are then used to make a map showing zones of required investigation.
More than 400 of the borehole logs collected in the City and County of San Francisco include blow-count data from SPTs or from penetration tests that allow reasonable blow count translations to SPT-equivalent values. Non-SPT values, such as those resulting from the use of 2-inch or 2½-inch inside-diameter ring samplers, were translated to SPT-equivalent values if reasonable factors could be used in conversion calculations. The reliability of the SPT-equivalent values varies. Therefore, they are weighted and used in a more qualitative manner. Few borehole logs, however, include all of the information (e.g. soil density, moisture content, sieve analysis, etc.) required for an ideal Seed-Idriss Simplified Procedure. For boreholes having acceptable penetration tests, liquefaction analysis is performed using recorded density, moisture, and sieve test values or using averaged test values of similar materials.

DIVISION OF MINES AND GEOLOGY SHZR 043
12
LIQUEFACTION ZONES
Criteria for Zoning
Areas underlain by materials susceptible to liquefaction during an earthquake were included in liquefaction zones using criteria developed by the Seismic Hazards Mapping Act Advisory Committee and adopted by the SMGB (DOC, 2000). Under those guideline criteria, liquefaction zones are areas meeting one or more of the following:
1. Areas known to have experienced liquefaction during historical earthquakes
2. All areas of uncompacted artificial fill containing liquefaction-susceptible material that are saturated, nearly saturated, or may be expected to become saturated
3. Areas where sufficient existing geotechnical data and analyses indicate that the soils are potentially liquefiable
4. Areas where existing geotechnical data are insufficient
In areas of limited or no geotechnical data, susceptibility zones may be identified by geologic criteria as follows:
a) Areas containing soil deposits of late Holocene age (current river channels and their historic floodplains, marshes and estuaries), where the M7.5-weighted peak acceleration that has a 10% probability of being exceeded in 50 years is greater than or equal to 0.10 g and the water table is less than 40 feet below the ground surface; or
b) Areas containing soil deposits of Holocene age (less than 11,000 years), where the M7.5-weighted peak acceleration that has a 10% probability of being exceeded in 50 years is greater than or equal to 0.20 g and the historical high water table is less than or equal to 30 feet below the ground surface; or
c) Areas containing soil deposits of latest Pleistocene age (11,000 to 15,000 years), where the M7.5-weighted peak acceleration that has a 10% probability of being exceeded in 50 years is greater than or equal to 0.30 g and the historical high water table is less than or equal to 20 feet below the ground surface.
Application of SMGB criteria to liquefaction zoning in the City and County of San Francisco is summarized below.
Areas of Past Liquefaction
In the study area, historic occurrences of liquefaction are documented by Lawson and others, (1908), Youd and Hoose (1976; 1978), Bennet (1990), Seed and others (1990), Harding Lawson Associates and others (1991a; 1991b), Pease and others (1992); Pease and O’Rourke (1993), Bardet and Kapuskar (1993) and Tinsley and others (1998). All areas of historic liquefaction are included in the hazard zone.

2001 SEISMIC HAZARD ZONE REPORT FOR THE CITY AND COUNTY OF SAN FRANCISCO 13
Artificial Fills
Artificial fill (af) has been placed at many localities during the development of San Francisco. Many of the historic occurrences of ground failure related to liquefaction are associated with artificial fill. These fills are composed of various materials compacted to varying densities. Pease and others (1992) in a study of the Marina District using borehole and SPT information, found hydraulic fill has a mean (N1)60 of 6, land-tipped fill has a mean (N1)60 of 14, whereas natural sand deposits have a mean (N1)60 of 26. Due to the variability of the material and the haphazard distribution of that material in artificial fill deposits, a site-specific investigation is necessary to determine if a hazard exists. All fill material that is saturated or may become saturated is included within the hazard zone.
Areas with Sufficient Existing Geotechnical Data
Geotechnical data were collected from more than 600 sites where one or more boreholes were drilled. Borehole logs were collected from files of Caltrans and the City of San Francisco’s Bureau of Building Inspection, Clean Water Program, Bureau of Engineering, and Department of City Planning.
The undifferentiated Quaternary deposits (Qa) and the dune sand (Qs) deposits were analyzed and characterized, as discussed previously under “Liquefaction Susceptibility.” The hazard zone boundary is defined by the susceptibility category with no modification by ground shaking, because over the entire area ground shaking exceeds the critical level necessary to induce liquefaction.
Areas with Insufficient Existing Geotechnical Data
No borehole information was found for modern beach deposits (Qb). However, by the loose, saturated-sand nature of the material in these deposits, they are included within the hazard zone.
ACKNOWLEDGMENTS
Many individuals from many different agencies provided useful information. It is impossible to list all that assisted in the process. Key individuals are Catherine Bauman, San Francisco Department of City Planning, who formed an oversight committee in order to keep the city engineers informed and involved with our program, and the staff of the San Francisco Department of Building Inspection, who granted access to the city’s geotechnical files.
Many DMG staff helped to prepare the hazard map. Bob Moskovitz, Teri McGuire, Scott Shepherd and Barbara Wanish provided GIS operations support, and designed and plotted the graphic displays associated with the liquefaction zone map and this report. Robert Darragh, Dames and Moore formed a peer-review committee, which consisted of Henry Taylor, Faiz Makdisi, Keith Kelson, Tom Holzer, James Gamble, Lelio Mejia,

DIVISION OF MINES AND GEOLOGY SHZR 043
14
Frank Rollo, and Dick Tait for review of the San Francisco North Quadrangle hazard map.
Finally, I wish to thank Julie Monet, who collected much of the borehole data, entered it in a database and assisted in the analysis for the San Francisco South Quadrangle.
REFERENCES
American Society for Testing and Materials, 1999, Standard test method for penetration test and split-barrel sampling of soils, Test Method D1586-99, in Annual Book of ASTM Standards, v. 4.08.
Bardet, J.P. and Kapuskar, M., 1993, Liquefaction sand boils in San Francisco during 1989 Loma Prieta earthquake: Journal of Geotechnical Engineering, v. 119, no. 3, p. 543-562.
Bartell, M.J., 1913, Report on the underground water supply of San Francisco County: San Francisco Department of Public Works, 157 p.
Bennett, M.G., 1990, Ground deformation and liquefaction of soil in the Marina District: U.S. Geological Survey Open-File Report 90-253, p. 44-79
Bonilla, M.G., 1964, Bedrock-surface map of the San Francisco South Quadrangle, California: U.S. Geological Survey Miscellaneous Field Studies Map MF-334, scale 1:31,680.
Bonilla, M.G., 1971, Preliminary geologic map of the San Francisco South Quadrangle and part of the Hunter's Point Quadrangle, California: U.S. Geological Survey Miscellaneous Field Studies Map MF-311, 2 sheets, scale 1:24,000.
California Department of Conservation, Division of Mines and Geology, 1997, Guidelines for evaluating and mitigating seismic hazards in California, Special Publication 117, 74 p.
California Department of Conservation, Division of Mines and Geology, 2000, Recommended criteria for delineating seismic hazard zones in California, Special Publication 118, 12 p.
Clifton, H.E. and Hunter, R.E., 1987, The Merced Formation and related beds: a mile-thick succession of late Cenozoic coastal and shelf deposits in the seacliffs of San Francisco, California: Geological Society of America Centennial Field Guide Cordilleran Section, p. 257-262.
Harding Lawson Associates, Dames and Moore, Kennedy, Jenks, Chilton, and EQE Engineering, 1991a, Liquefaction study, North Beach, Embarcadero waterfront,

2001 SEISMIC HAZARD ZONE REPORT FOR THE CITY AND COUNTY OF SAN FRANCISCO 15
South Beach, and Upper Mission Creek area, San Francisco, California: Harding Lawson Associates, San Francisco, California Report No. 17592.041.04.
Harding Lawson Associates, Dames and Moore, Kennedy, Jenks, Chilton, and EQE Engineering, 1991b, Marina District and Sullivan Marsh liquefaction study, San Francisco, California: Harding Lawson Associates, San Francisco, California Report No. 17592.041.04.
Helley, E.J., Lajoie, K.R., Spangle, W.E. and Blair, M.L., 1979, Flatland deposits of the San Francisco Bay Region, California-their geology and engineering properties, and their importance to comprehensive planning: U.S. Geological Survey Professional Paper 943, 88 p.
Helley, E.J. and Graymer, R.W., 1997, Quaternary geology of Alameda County, and parts of Contra Costa, Santa Clara San Mateo, San Francisco, Stanislaus and San Joaquin counties, California: A digital database: U.S. Geological Survey Open File Report 97-97.
Knudsen, K.L., Noller, J.S., Sowers, J.M. and Lettis, W.R., 1997, Map showing
Quaternary geology and liquefaction susceptibility, San Francisco, California, 1:100,000 Sheet: Final Technical Report: National Earthquake Hazards Reduction Program, U.S. Geological Survey, FY95 Award Number 1434-94-G-2499, p.1-20
Joyner, W.B., 1982, Map showing the 200-foot thickness contour of surficial deposits and the landward limit of Bay Mud deposits of San Francisco, California: U.S. Geological Survey Miscellaneous Field Studies Map MF-1376, scale 1:24,000.
Lawson, A.C. and others, 1908, The California earthquake of April 18, 1906: Report of the State Investigative Commission, Carnegie Institute, Washington, D.C.
National Research Council, 1985, Liquefaction of soils during earthquakes: National Research Council Special Publication, Committee on Earthquake Engineering, National Academy Press, Washington, D.C., 240 p.
Pease, J.W. and O'Rourke, T.D., 1993, Liquefaction hazards in the Mission District and south of Market areas, San Francisco, California: Prepared under U.S. Geological Survey Grant No. 14-08-0001-G2128.
Pease, J.W., O’Rourke, T.D. and Stewart, H.E., 1992, Post-liquefaction consolidation and lifeline damage in the Marina District after the 1989 Loma Prieta earthquake, in Hamada, Masanori and O'Rourke, T.D., editors, Proceedings from the Fourth Japan-U.S. Workshop on Earthquake Resistant Design of Lifeline Facilities and Countermeasures for Soil Liquefaction, v. 1: National Center for Earthquake Engineering Research, State University of New York at Buffalo, New York, Technical Report NCEER-92-0019.
Petersen, M.D., Bryant, W.A., Cramer, C.H., Cao, Tianqing, Reichle, M.S., Frankel, A.D., Lienkaemper, J.J., McCrory, P.A. and Schwartz, D.P., 1996, Probabilistic seismic hazard assessment for the State of California: California Department of

DIVISION OF MINES AND GEOLOGY SHZR 043
16
Conservation, Division of Mines and Geology, Open File Report 96-08; U.S. Geological Survey Open File Report 96-706, 33 p.
Phillips, S.P., Hamlin, S.N. and Yates, E.B., 1993, Geohydrology, water quality, and estimation of ground-water recharge in San Francisco, California, 1987-92: U.S. Geological Survey Water-Resources Investigations Report 93-4019.
Radbruch, D.H., 1957, Areal and engineering geology of the Oakland West Quadrangle, California: U.S. Geological Survey Miscellaneous Geologic Investigations Map I-239, scale 1:24,000.
Radbruch, D.H. and Schlocker, Julius, 1958, Engineering geology of Islais Creek basin, San Francisco, California: U.S. Geological Survey Miscellaneous Geologic Investigations Map I-264.
Schlocker, Julius, 1974, Geology of the San Francisco North Quadrangle, California: U.S. Geological Survey Professional Paper 782, 109 p.
Seed, H.B. and Idriss, I.M., 1971, Simplified procedure for evaluating soil liquefaction potential: Journal of the Soil Mechanics and Foundations Division of ASCE, v. 97: SM9, p. 1,249-1,273.
Seed, H.B. and Idriss, I.M., 1982, Ground motions and soil liquefaction during earthquakes: Monograph Series, Earthquake Engineering Research Institute, Berkeley, California, 134 p.
Seed, H.B., Idriss, I.M. and Arango, Ignacio, 1983, Evaluation of liquefaction potential using field performance data: Journal of Geotechnical Engineering, v. 109, no. 3, p. 458-482.
Seed, H.B., Tokimatsu, Kohji, Harder, L.F., and Chung, R.M., 1985, Influence of SPT procedures in soil liquefaction resistance evaluations: Journal of Geotechnical Engineering, ASCE, v. 111, no. 12, p. 1,425-1,445.
Seed, R.B. and Harder, L.F., 1990, SPT-based analysis of cyclic pore pressure generation and undrained residual strength: Proceedings of the H. Bolton Seed Memorial Symposium, v. 2, p. 351-376.
Seed, R.B., Dickenson, S.E., Riemer, M.F., Bray, J.D., Sitar, N., Mitchell, J.K., Idriss, I.M., Kayen, R.E., Kropp, A., Harder, L.F., Jr. and Power, M.S., 1990, Preliminary report on the principal geotechnical aspects of the October 17, 1989 Loma Prieta earthquake: Earthquake Engineering Research Center, College of Engineering, University of California, Berkeley, Report No. UCB/EERC-90/05.
Smith, T.C., 1996, Preliminary maps of seismic hazard zones and draft guidelines for evaluating and mitigating seismic hazards: California Geology, v. 49, no. 6, p. 147-150.

2001 SEISMIC HAZARD ZONE REPORT FOR THE CITY AND COUNTY OF SAN FRANCISCO 17
Tinsley, J.C., Egan, J.A., Kayen, R.E., Bennett, M.J., Kropp, A. and Holzer, T.L., 1998, Appendix: Maps and descriptions of liquefaction and associated effects in Holzer, T.L., editor, The Loma Prieta, California earthquake of October 17, 1989 – Liquefaction: U.S. Geological Survey Professional Paper 1551-B, p. B287-314.
Tinsley, J.C., Youd, T.L., Perkins, D.M. and Chen, A.T.F., 1985, Evaluating liquefaction potential, in Ziony, J.I., editor, Evaluating earthquake hazards in the Los Angeles region — An earth science perspective: U.S. Geological Survey Professional Paper 1360, p. 263-316.
U.S. Coast Survey, 1851, South shore Golden Gate from Point Lobos to San Francisco, California: Surveyed by R.J. Cutts.
U.S. Coast Survey, 1857a, Revisionary survey for the determination of the lighthouses and defense works of the harbor of San Francisco, California: Register No. 663.
U.S. Coast Survey, 1857b, City of San Francisco and its vicinity, California: Register No. 687.
U.S. Coast Survey, 1867, Map showing part of land approaches to city of San Francisco, California for use of Engineer Department U.S. Army: Register No. 1059.
Working Group on California Earthquake Probabilities, 1999, Understanding earthquake hazards in the San Francisco Bay region, California: U.S. Geological Survey Fact Sheet-152-99, 4 p.
Youd, T.L., 1973, Liquefaction, flow and associated ground failure: U.S. Geological Survey Circular 688, 12 p.
Youd, T.L., 1991, Mapping of earthquake-induced liquefaction for seismic zonation: Earthquake Engineering Research Institute, Proceedings, Fourth International Conference on Seismic Zonation, v. 1, p. 111-138.
Youd, T.L. and Hoose, S.N., 1976, Liquefaction during the 1906 San Francisco earthquake: Journal of the Geotechnical Engineering Division, v. 102, no. GT5, May, p. 425-440.
Youd, T.L. and Hoose, S.N., 1978, Historic ground failures in northern California triggered by earthquakes: U.S. Geological Survey Professional Paper 993, U.S. Government Printing Office, Washington, D.C., 178 p.
Youd, T.L. and Idriss, I.M., 1997, editors, Proceedings of the NCEER workshop on evaluation of liquefaction resistance of soils: National Center for Earthquake Engineering Research Technical Report NCEER-97-0022, 276 p.
Youd, T.L. and Idriss, I.M., 1997, Proceedings of the NCEER workshop on evaluation of liquefaction resistance of soils: Technical Report NCEER-97-0022, 277 p.

DIVISION OF MINES AND GEOLOGY SHZR 043
18
Youd, T.L. and Perkins, D.M., 1978, Mapping liquefaction-induced ground failure potential: Journal of Geotechnical Engineering, v. 104, p. 433-446.

2001 SEISMIC HAZARD ZONE REPORT FOR THE CITY AND COUNTY OF SAN FRANCISCO 19
SECTION 2 EARTHQUAKE-INDUCED LANDSLIDE
EVALUATION REPORT
Earthquake-Induced Landslide Zones in the City and County of San Francisco, California
By Rick I. Wilson, Mark O. Wiegers, and Timothy P. McCrink
California Department of Conservation
Division of Mines and Geology
PURPOSE
The Seismic Hazards Mapping Act (the Act) of 1990 (Public Resources Code, Chapter 7.8, Division 2) directs the California Department of Conservation (DOC), Division of Mines and Geology (DMG) to delineate Seismic Hazard Zones. The purpose of the Act is to reduce the threat to public health and safety and to minimize the loss of life and property by identifying and mitigating seismic hazards. Cities, counties, and state agencies are directed to use seismic hazard zone maps prepared by DMG in their land-use planning and permitting processes. The Act requires that site-specific geotechnical investigations be performed prior to permitting most urban development projects within the hazard zones. Evaluation and mitigation of seismic hazards are to be conducted under guidelines established by the California State Mining and Geology Board (DOC, 1997; also available on the Internet at http://gmw.consrv.ca.gov/shmp/webdocs/sp117.pdf).
This section of the evaluation report summarizes seismic hazard zone mapping for earthquake-induced landslides in the City and County of San Francisco (scale 1:24,000). This section, along with Section 1 (addressing liquefaction), and Section 3 (addressing earthquake shaking), form a report that is one of a series that summarizes the preparation of seismic hazard zone maps within the state (Smith, 1996). Additional information on seismic hazard zone mapping in California can be accessed on DMG’s Internet web page: http://www.conservation.ca.gov/CGS/index.htm.

DIVISION OF MINES AND GEOLOGY SHZR 043
20
BACKGROUND
Landslides triggered by earthquakes historically have been a significant cause of earthquake damage. In California, large earthquakes such as the 1971 San Fernando, 1989 Loma Prieta, and 1994 Northridge earthquakes triggered landslides that were responsible for destroying or damaging numerous structures, blocking major transportation corridors, and damaging life-line infrastructure. Areas that are most susceptible to earthquake-induced landslides are steep slopes in poorly cemented or highly fractured rocks, areas underlain by loose, weak soils, and areas on or adjacent to existing landslide deposits. These geologic and terrain conditions exist in many parts of California, including numerous hillside areas that have already been developed or are likely to be developed in the future. The opportunity for strong earthquake ground shaking is high in many parts of California because of the presence of numerous active faults. The combination of these factors constitutes a significant seismic hazard throughout much of California, including the hillside areas of San Francisco.
METHODS SUMMARY
The mapping of earthquake-induced landslide hazard zones presented in this report is based on the best available terrain, geologic, geotechnical, and seismological data. If unavailable or significantly outdated, new forms of these data were compiled or generated specifically for this project. The following were collected or generated for this evaluation:
• Digital terrain data were used to provide an up-to-date representation of slope gradient and slope aspect in the study area
• Geologic mapping was used to provide an accurate representation of the spatial distribution of geologic materials in the study area. In addition, a map of existing landslides, whether triggered by earthquakes or not, was prepared
• Geotechnical laboratory test data were collected and statistically analyzed to quantitatively characterize the strength properties and dynamic slope stability of geologic materials in the study area
• Seismological data in the form of DMG probabilistic shaking maps and catalogs of strong-motion records were used to characterize future earthquake shaking within the mapped area
The data collected for this evaluation were processed into a series of GIS layers using commercially available software. A slope stability analysis was performed using the Newmark method of analysis (Newmark, 1965), resulting in a map of landslide hazard potential. The earthquake-induced landslide hazard zone was derived from the landslide hazard potential map according to criteria developed in a DMG pilot study (McCrink and Real, 1996) and adopted by the State Mining and Geology Board (DOC, 2000).

2001 SEISMIC HAZARD ZONE REPORT FOR THE CITY AND COUNTY OF SAN FRANCISCO 21
SCOPE AND LIMITATIONS
The methodology used to make this map is based on earthquake ground-shaking estimates, geologic material-strength characteristics and slope gradient. These data are gathered from a variety of outside sources. Although the selection of data used in this evaluation was rigorous, the quality of the data is variable. The State of California and the Department of Conservation make no representations or warranties regarding the accuracy of the data gathered from outside sources.
Earthquake-induced landslide zone maps are intended to prompt more detailed, site-specific geotechnical investigations as required by the Act. As such, these zone maps identify areas where the potential for earthquake-induced landslides is relatively high. Due to limitations in methodology, it should be noted that these zone maps do not necessarily capture all potential earthquake-induced landslide hazards. Earthquake-induced ground failures that are not addressed by this map include those associated with ridge-top spreading and shattered ridges. It should also be noted that no attempt has been made to map potential run-out areas of triggered landslides. It is possible that such run-out areas may extend beyond the zone boundaries. The potential for ground failure resulting from liquefaction-induced lateral spreading of alluvial materials, considered by some to be a form of landsliding, is not specifically addressed by the earthquake-induced landslide zone or this report. See Section 1, Liquefaction Evaluation Report for the City and County of San Francisco, for more information on the delineation of liquefaction zones.
The remainder of this report describes in more detail the mapping data and processes used to prepare the earthquake-induced landslide zone map for the City and County of San Francisco. The information is presented in two parts. Part I covers physiographic, geologic and engineering geologic conditions in the study area. Part II covers the preparation of landslide hazard potential and landslide zone maps.
PART I
PHYSIOGRAPHY
Study Area Location and Physiography
San Francisco encompasses 49-square-miles and is located in the western part of the Coast Ranges along the central California coast. The city spreads across a peninsula bound by the Pacific Ocean on the west and San Francisco Bay on the north and east. The prominent northwesterly structural and topographic trend of the northern Coast Ranges is not evident in the city except for minor hills and valleys. The present topography is the result of erosion of Mesozoic Franciscan Complex rocks of varying hardness with deposits of windblown sand that mantle the bedrock exposures. Quaternary tectonism, marine and estuarine deposition, and artificial fill (man-made land)

DIVISION OF MINES AND GEOLOGY SHZR 043
22
have also contributed to the development of the current topographic setting of the study area.
San Francisco is accessible from the north on US Highway 101 across the Golden Gate Bridge, from the east on Interstate Highway 80 across the Bay Bridge, and from the south on US Highway 101 and Interstate Highway 280. Land use in the city varies from densely urban in the northeast to a multilevel residential setting elsewhere. Scattered across the city are several parks, the largest of which is Golden Gate Park in the west-central part of the city.
Digital Terrain Data
The calculation of slope gradient is an essential part of the evaluation of slope stability under earthquake conditions. A set of digital terrain files was obtained from the City to calculate slope gradient for the terrain within San Francisco. These files contained digitized contours, breaklines, and spot elevations that were collected from stereo-pair aerial photography flown in September and October 1993. These files were translated into a format usable by DMG and converted first to a triangular-irregular-network (TIN) computer model, and then into a regularly-spaced digital elevation model (DEM). The resulting DEM has a 10-meter horizontal resolution. Vertical accuracy is estimated to be on the order of 1 to 2 meters.
A slope map was made from the corrected DEM using a third-order, finite difference, center-weighted algorithm (Horn, 1981). The DEM was then used to make a slope-aspect map. The slope map was used first in conjunction with the aspect map and geologic structural data to identify areas of potential adverse bedding conditions, and then again with the geologic strength map in the preparation of the earthquake-induced landslide hazard potential map.
GEOLOGY
Bedrock and Surficial Geology
The northern parts of San Francisco are included on the southern portion of the San Francisco North, Point Bonita, and western portion of the Oakland West 7.5-minute quadrangles. These quadrangles have been mapped in detail by Schlocker (1974; San Francisco North and Point Bonita) and Radbruch (1957; Oakland West). Blake and others (in press) have updated the geologic maps for these areas in digital form. The southern parts of San Francisco are included in the northern portion of the San Francisco South and Hunters Point quadrangles, which were originally mapped by Bonilla (1971) and recently digitally updated (Bonilla, 1998). The geologic mapping was briefly field checked during this study. Observations were made of exposures, aspects of weathering, and general surface expression of the geologic units. In addition, the relation of the various geologic units to development and abundance of landslides was noted.
The bedrock consists of Cretaceous (K) and/or Jurassic (J) Franciscan Complex rocks, which accumulated in three distinct accreted terranes or structural assemblages. These

2001 SEISMIC HAZARD ZONE REPORT FOR THE CITY AND COUNTY OF SAN FRANCISCO 23
are, from west to east, the San Bruno Mountain terrane; the Marin Headlands terrane; and the Alcatraz terrane (Blake and others, in press). The Franciscan Complex is subdivided into lithologic units of: serpentinite (labeled sp on the geologic maps); harder, massive serpentinite and peridotite (Jspm), greenstone (KJg, Jfg, and Jfgs); chert (KJc and KJfch); massive graywacke sandstone (Kfss and Kfgwy); massive sandstone containing more than two-percent potassium feldspar (KJsk); shale with some sandstone interbeds (Kfsh); and interbedded sandstone and shale (KJs, Kfs, and fs). Two northwest-trending shear zones, consisting of indistinguishable, sheared rock units (KJu and fsr), separate the three accreted terranes.
The late Pliocene to Pleistocene Merced Formation (QTm), located primarily in the southwestern portion of San Francisco, consists of sand, silt, and clay basin deposits that originated in a shallow marine and coastal non-marine setting. As this basin was uplifted, the Pleistocene Colma Formation (Qc) was deposited unconformably on the Merced Formation and more extensively across the northwestern and central part of the city (Wahrhaftig and Sloan, 1989). The Qc consists of fine to medium sand with lesser beds of sandy silt, clay, and gravel. Other surficial deposits of the city consist of: rubbly slope debris and ravine fill (Qsr); old beach deposits (Oob); dune deposits (Qd); alluvium (Qal); bay mud (Qm); recent beach deposits (Qb and Qs); undifferentiated sedimentary deposits (Qu); landslides (Ql); and artificial fill (Qaf). These units were deposited on the old topographic surface of Franciscan Complex rocks. The Qsr generally surrounds the elevated bedrock outcrops. The Qd is prominent in the northern and central portions of the city and the Qu is located in the eastern part of the city. Additional information pertaining to the Quaternary deposits is presented in Section 1, the Liquefaction Evaluation Report.
Although landslide deposits were found throughout the city, they were found in greater frequency associated with the oversteepened slopes along the northern and western shoreline as well as in some inland upland areas. Of all of the geologic units, the Merced Formation (QTm) appears to have a greater abundance of landslides associated with it than other units.
Landslide Inventory
The evaluation of earthquake-induced landsliding requires an up-to-date and complete picture of the previous occurrence of landsliding. An inventory of existing landslides in San Francisco was prepared by reviewing published landslide inventories and combining field observations, analysis of aerial photos, and interpretation of landforms on current and older topographic maps.
Published maps and reports showing or discussing landslides, such as Schlocker (1974), Blake and others (1974), Radbruch (1957), and URS/John A. Blume and Associates (1974), were evaluated during the production of the landslide inventory for this study. In addition, there are a number of landslides that have been included in the inventory that were caused or reactivated during the 1906 San Francisco and 1989 Loma Prieta earthquakes (Lawson and others, 1908; Youd and Hoose, 1978; Seed and others, 1990; Keefer and Manson, 1998).

DIVISION OF MINES AND GEOLOGY SHZR 043
24
Stereo-paired, black-and-white aerial photos purchased from WAC Corporation of Eugene, Oregon were used for landslide interpretation (see Air Photos in References). These photos are dated 4-27-96 and are at a scale of 1:24,000. The photos were examined using a mirror stereoscope at 1.5x, 3x, and 8x magnification. Due to the amount of land modification and construction in San Francisco, many landslides are covered or modified and, therefore, difficult to identify using conventional techniques. For this reason, landslides identified in geotechnical reports on file with the San Francisco Department of Building Inspection were included in our inventory.
The completed hand-drawn landslide map was scanned and digitized. The database was populated with information on each landslide, including confidence of interpretation (definite, probable and questionable) and other properties, such as activity, thickness, and associated geologic unit(s). Landslides rated as definite and probable were carried into the slope stability analysis. Landslides rated as questionable were not carried into the slope stability analysis due to the uncertainty of their existence. A version of this landslide inventory is included with Plate 2.1.
ENGINEERING GEOLOGY
Geologic Material Strength
To evaluate the stability of geologic materials under earthquake conditions, the geologic map units described above were ranked and grouped on the basis of their shear strength. Shear strength data for the rock units identified on the geologic map were obtained from the City and County of San Francisco, Department of Building Inspection geotechnical files (see Appendix A). The locations of rock and soil samples taken for shear testing are shown on Plate 2.1.
Shear strength data gathered from the above source were compiled for each geologic map unit. Geologic units were grouped on the basis of average angle of internal friction (average phi) and lithologic character. Average (mean and median) phi values for each geologic map unit and corresponding strength group are summarized in Table 2.1. For most of the geologic strength groups in the map area, a single shear strength value was assigned and used in our slope stability analysis. A geologic material strength map was made based on the groupings presented in Tables 2.1 and 2.2, and this map provides a spatial representation of material strength for use in the slope stability analysis.
Geologic formations that are represented by different geologic symbols on the two geologic maps for San Francisco, north and south, have been combined for the statistical analysis. These formations are KJc-KJfch and Kfs-KJs.
Adverse Bedding Conditions
Adverse bedding conditions are an important consideration in slope stability analyses. Adverse bedding conditions occur where the dip direction of bedded sedimentary rocks is roughly the same as the slope aspect, and where the dip magnitude is less than the slope

2001 SEISMIC HAZARD ZONE REPORT FOR THE CITY AND COUNTY OF SAN FRANCISCO 25
gradient. Under these conditions, landslides can slip along bedding surfaces due to a lack of lateral support.
To account for adverse bedding in our slope stability evaluation, we used geologic structural data in combination with digital terrain data to identify areas with potentially adverse bedding, using methods similar to those of Brabb (1983). The structural data, derived from the geologic map database, was used to categorize areas of common bedding dip direction and magnitude. The dip direction was then compared to the slope aspect and, if the same, the dip magnitude and slope gradient categories were compared. If the dip magnitude was less than or equal to the slope gradient category but greater than 25% (4:1 slope), the area was marked as a potential adverse bedding area.
The formations, which contain interbedded sandstone and shale, were subdivided based on shear strength differences between coarse-grained (higher strength) and fine-grained (lower strength) lithologies. Shear strength values for the fine- and coarse-grained lithologies were then applied to areas of favorable and adverse bedding orientation, which were determined from structural and terrain data as discussed above. It was assumed that coarse-grained material (higher strength) dominates where bedding dips into a slope (favorable bedding) while fine-grained (lower strength) material dominates where bedding dips out of a slope (adverse bedding). The geologic material strength map was modified by assigning the lower, fine-grained shear strength values to areas where potential adverse bedding conditions were identified. The favorable and adverse bedding shear strength parameters for the formations are included in Table 2.1.
The results of the grouping of geologic materials in San Francisco are in Tables 2.1 and 2.2.

DIVISION OF MINES AND GEOLOGY SHZR 043
26
CITY AND COUNTY OF SAN FRANCISCO SHEAR STRENGTH GROUPS
Formation Number Mean/Median Mean/Median Mean/Median No data but Phi ValuesName* Tests Phi Group Phi Group C Similar Lithology Used in Stability
(rock types) (deg) (deg) (psf) Analyses
GROUP 1 KJc-KJfch(fbc) 3 36/30 36/35 399/200 gb, fs(fbc) 36Kfsh(fbc) 5 36/36 Jspm, KJgKfss(fbc) 3 38/31 Jfg, Jfgs
Kfs-KJs(fbc) 12 35/33 KJsk(fbc)Qc 65 35/35 Kfgwy(fbc)Qd 134 36/37 Qob
GROUP 2 sp 46 31/32 30/31 815/620 fsr(fbc) 30KJu(fbc) 3 30/30 Qb
Qsr 57 30/32 QsQu 105 30/30
GROUP 3 Qaf 49 27/26 27/26 693/420 QTm 27
GROUP 4 KJc-KJfch(abc) 6 22/23 22/22 1366/800 fs(abc) 22KJsk(abc) 2 21/21 Kfsh(abc) 12 22/22 Kfss(abc) 5 21/21
Kfs-KJs(abc) 41 21/23 Kfgwy(abc) 1 22/22 KJu(abc) 3 21/20fsr(abc) 4 22/22
GROUP 5 Qm 9 16/15 16/15 465/400 16
GROUP 6 Qls 9 11/11 11/11 693/700 11
*abc = adverse bedding condition, fine-grained material strength*fbc = favorable bedding condition, coarse-grained material strength
Table 2.1. Summary of the Shear Strength Statistics for the City and County of San Francisco.

2001 SEISMIC HAZARD ZONE REPORT FOR THE CITY AND COUNTY OF SAN FRANCISCO 27
SHEAR STRENGTH GROUPS FOR THE CITY AND COUNTY OF SAN FRANCISCO
GROUP 1 GROUP 2 GROUP 3 GROUP 4 GROUP 5 GROUP 6
Jspm, KJg sp QTm fs(abc) Qm QlsJfg, Jfgs KJu(fbc) Qaf KJc-KJfch(abc)
gb, fs(fbc) fsr(fbc) KJsk(abc) KJc-KJfch(fbc) Qsr Kfgwy(abc)
KJsk(fbc) Qu Kfss(abc)Kfgwy(fbc) Qd Kfsh(abc)Kfss(fbc) Qs Kfs-KJs(abc)Kfsh(fbc) KJu(abc)
Kfs-KJs(fbc) fsr(abc)Qc, Qob, Qd
Table 2.2. Summary of the Shear Strength Groups for the City and County of San Francisco.
Existing Landslides
The strength characteristics of existing landslides (Qls) must be based on tests of the materials along the landslide slip surface. Ideally, shear tests of slip surfaces formed in each mapped geologic unit would be used. However, this amount of information is rarely available, and for the preparation of the earthquake-induced landslide zone map it has been assumed that all landslides within the quadrangle have the same slip surface strength parameters. We collect and use primarily “residual” strength parameters from laboratory tests of slip surface materials tested in direct shear or ring shear test equipment. Back-calculated strength parameters, if the calculations appear to have been performed appropriately, have also been used.
The large number of landslides observed within the Merced Formation (QTm) in the southwestern portion of San Francisco and to the south in Daly City (Bonilla, 1971), along with the description by Ellen and Wentworth (1995) that weathered QTm is relatively weak, led to the inclusion of this unit in shear strength Group 3 (phi = 27 degrees).
According to statistical protocol, if there are fewer than 30 shear strength tests for a particular formation the median value, instead of the mean, should be used to represent the formation when forming shear strength groups. There is a disparity between the mean and median value for the rock formations KJc-KJfch(fbc), Kfss (fbc), and Kfs-KJs(fbc) that would normally lead to the formation of a new shear strength group or moving them from Group 1 to Group 2. However, they have been added to the stronger

DIVISION OF MINES AND GEOLOGY SHZR 043
28
Group 1 because of the similarity in observed field characteristics to other formations in Group 1, and the relative lack of landslides found in these formations.

2001 SEISMIC HAZARD ZONE REPORT FOR THE CITY AND COUNTY OF SAN FRANCISCO 29
PART II
EARTHQUAKE-INDUCED LANDSLIDE HAZARD POTENTIAL
Design Strong-Motion Record
To evaluate earthquake-induced landslide hazard potential in the study area, a method of dynamic slope stability analysis developed by Newmark (1965) was used. The Newmark method analyzes dynamic slope stability by calculating the cumulative down-slope displacement for a given earthquake strong-motion time history. As implemented for the preparation of earthquake-induced landslide zones, the Newmark method necessitates the selection of a design earthquake strong-motion record to provide the “ground shaking opportunity.” Although the San Andreas Fault Zone does not cross any portion of the City, it is clearly the dominant source for strong ground shaking within San Francisco. The selection of a strong-motion record was based on an estimation of probabilistic ground motion parameters for modal magnitude, modal distance, and peak ground acceleration (PGA). The parameters were estimated from maps prepared by DMG for a 10% probability of being exceeded in 50 years (Petersen and others, 1996). The parameters used in the record selection are:
Modal Magnitude: 7.7 to 7.9
Modal Distance: 3.6 to 13.0 km
PGA: 0.52 to 0.93 g
A suitable strong-motion record that precisely fits these parameters could not be found. The Southern California Edison Lucerne record from the 1992 7.3-magnitude Landers, California, earthquake was used because it was the closest fit to the above criteria. This record had a source to recording site distance of 1.1 km and a PGA of 0.80 g. The selected strong-motion record was not scaled or otherwise modified prior to analysis.
Displacement Calculation
The design strong-motion record was used to develop a relationship between landslide displacement and yield acceleration (ay), defined as the earthquake horizontal ground acceleration above which landslide displacements take place. This relationship was prepared by integrating the design strong-motion record twice for a given acceleration value to find the corresponding displacement, and the process was repeated for a range of acceleration values (Jibson, 1993). The resulting curve in Figure 2.1 represents the full spectrum of displacements that can be expected for the design strong-motion record. This curve provides the required link between anticipated earthquake shaking and

DIVISION OF MINES AND GEOLOGY SHZR 043
30
estimates of displacement for different combinations of geologic materials and slope gradient, as described in the Slope Stability Analysis section below.
The amount of displacement predicted by the Newmark analysis provides an indication of the relative amount of damage that could be caused by earthquake-induced landsliding. Displacements of 30, 15 and 5 cm were used as criteria for rating levels of earthquake-induced landslide hazard potential based on the work of Youd (1980), Wilson and Keefer (1983), and a DMG pilot study for earthquake-induced landslides (McCrink and Real, 1996). Applied to the curve in Figure 2.1, these displacements correspond to yield accelerations of 0.148, 0.182, and 0.243 g. Because these yield acceleration values are derived from the design strong-motion record, they represent the ground shaking opportunity thresholds that are significant in the City and County of San Francisco.

2001 SEISMIC HAZARD ZONE REPORT FOR THE CITY AND COUNTY OF SAN FRANCISCO 31
Figure 2.1. Yield Acceleration vs. Newmark Displacement for the Southern California Edison Lucerne strong-motion record from the 28 June 1992 Landers, California earthquake.
Slope Stability Analysis
A slope stability analysis was performed for each geologic material strength group at slope increments of 1 degree. An infinite-slope failure model under unsaturated slope conditions was assumed. A factor of safety was calculated first, followed by the calculation of yield acceleration from Newmark’s equation:
ay = ( FS - 1 )g sin α
where FS is the Factor of Safety, g is the acceleration due to gravity, and α is the direction of movement of the slide mass, in degrees measured from the horizontal, when displacement is initiated (Newmark, 1965). For an infinite slope failure α is the same as the slope angle.
0.1
1.0
10.0
100.0
1000.0 D
ISPL
AC
EMEN
T (c
m)
0.01 0.10 1.00 YIELD ACCELERATION (g)
NEWMARK DISPLACEMENTvs. YIELD ACCELERATION
SCE Lucerne Record - E-W Component
5 cm
15 cm
30 cm
0.142
0.1820.243

DIVISION OF MINES AND GEOLOGY SHZR 043
32
The yield accelerations resulting from Newmark’s equations represent the susceptibility to earthquake-induced failure of each geologic material strength group for a range of slope gradients. Based on the relationship between yield acceleration and Newmark displacement shown in Figure 2.1, hazard potentials were assigned as follows:
1. If the calculated yield acceleration was less than 0.142g, Newmark displacement greater than 30 cm is indicated, and a HIGH hazard potential was assigned (H on Table 2.3)
2. If the calculated yield acceleration fell between 0.142g and 0.182g, Newmark displacement between 15 cm and 30 cm is indicated, and a MODERATE hazard potential was assigned (M on Table 2.3)
3. If the calculated yield acceleration fell between 0.182g and 0.243g, Newmark displacement between 5 cm and 15 cm is indicated, and a LOW hazard potential was assigned (L on Table 2.3)
4. If the calculated yield acceleration was greater than 0.243g, Newmark displacement of less than 5 cm is indicated, and a VERY LOW potential was assigned (VL on Table 2.3)
Table 2.3 summarizes the results of the stability analyses. The earthquake-induced landslide hazard potential map was prepared by combining the geologic material-strength map and the slope map according to this table.
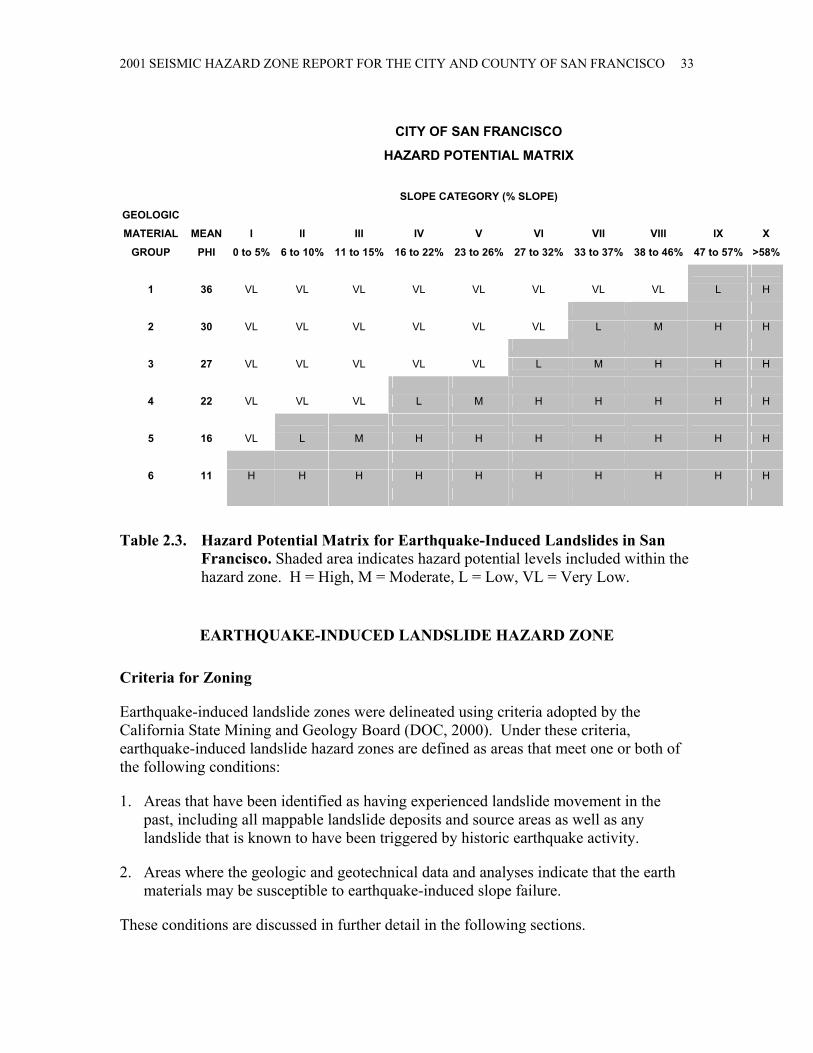
2001 SEISMIC HAZARD ZONE REPORT FOR THE CITY AND COUNTY OF SAN FRANCISCO 33
CITY OF SAN FRANCISCO
HAZARD POTENTIAL MATRIX
SLOPE CATEGORY (% SLOPE)
GEOLOGIC
MATERIAL MEAN I II III IV V VI VII VIII IX X
GROUP PHI 0 to 5% 6 to 10% 11 to 15% 16 to 22% 23 to 26% 27 to 32% 33 to 37% 38 to 46% 47 to 57% >58%
1 36 VL VL VL VL VL VL VL VL L H
2 30 VL VL VL VL VL VL L M H H
3 27 VL VL VL VL VL L M H H H
4 22 VL VL VL L M H H H H H
5 16 VL L M H H H H H H H
6 11 H H H H H H H H H H
Table 2.3. Hazard Potential Matrix for Earthquake-Induced Landslides in San Francisco. Shaded area indicates hazard potential levels included within the hazard zone. H = High, M = Moderate, L = Low, VL = Very Low.
EARTHQUAKE-INDUCED LANDSLIDE HAZARD ZONE
Criteria for Zoning
Earthquake-induced landslide zones were delineated using criteria adopted by the California State Mining and Geology Board (DOC, 2000). Under these criteria, earthquake-induced landslide hazard zones are defined as areas that meet one or both of the following conditions:
1. Areas that have been identified as having experienced landslide movement in the past, including all mappable landslide deposits and source areas as well as any landslide that is known to have been triggered by historic earthquake activity.
2. Areas where the geologic and geotechnical data and analyses indicate that the earth materials may be susceptible to earthquake-induced slope failure.
These conditions are discussed in further detail in the following sections.

DIVISION OF MINES AND GEOLOGY SHZR 043
34
Existing Landslides
Existing landslides typically consist of disrupted soils and rock materials that are generally weaker than adjacent undisturbed rock and soil materials. Previous studies indicate that existing landslides can be reactivated by earthquake movements (Keefer, 1984). Earthquake-triggered movement of existing landslides is most pronounced in steep head scarp areas and at the toe of existing landslide deposits. Although reactivation of deep-seated landslide deposits is less common (Keefer, 1984), a significant number of deep-seated landslide movements have occurred during, or soon after, several recent earthquakes. Based on these observations, all existing landslides with a definite or probable confidence rating are included within the earthquake-induced landslide hazard zone.
Geologic and Geotechnical Analysis
Based on the conclusions of a pilot study performed by DMG (McCrink and Real, 1996), it has been concluded that earthquake-induced landslide hazard zones should encompass all areas that have a High, Moderate or Low level of hazard potential (see Table 2.3). This would include all areas where the analyses indicate earthquake displacements of 5 centimeters or greater. Areas with a Very Low hazard potential, indicating less than 5 centimeters displacement, are excluded from the zone.
As summarized in Table 2.3, all areas characterized by the following geologic strength group and slope gradient conditions are included in the earthquake-induced landslide hazard zone:
1. Geologic Strength Group 6 is included for all slope gradient categories. (Note: Geologic Strength Group 6 includes all mappable landslides with a definite or probable confidence rating).
2. Geologic Strength Group 5 is included for all slopes steeper than 5 percent.
3. Geologic Strength Group 4 is included for all slopes steeper than 15 percent.
4. Geologic Strength Group 3 is included for all slopes steeper than 26 percent.
5. Geologic Strength Group 2 is included for all slopes steeper than 32 percent.
6. Geologic Strength Group 1 is included for all slopes greater than 46 percent.
This results in roughly 3% of the land in San Francisco lying within the earthquake-induced landslide hazard zone.

2001 SEISMIC HAZARD ZONE REPORT FOR THE CITY AND COUNTY OF SAN FRANCISCO 35
ACKNOWLEDGMENTS
The authors would like to thank the following individuals and organizations for their assistance in obtaining the data necessary to complete this project. Hanson Tom, Kung-Kay Chiu, Susan Yee, Zan Turner, and their staffs at the City and County of San Francisco were helpful in gathering rock strength and landslide inventory information. Jeffery Johnson and George White aided in the acquisition of the City’s digital terrain, orthophotos, and street/parcel files. Russ Graymer of the U.S. Geological Survey provided the preliminary digital geologic maps for the City.
REFERENCES
Blake, M.C., Jr., Bartow, J.A., Frizzel, V.A., Jr., Schlocker, J., Sorg, D., Wentworth, C. M. and Wright, R. H., 1974, Preliminary geologic map of Marin and San Francisco counties and Parts of Alameda, Contra Costa and Sonoma counties, California: U. S. Geological Survey Miscellaneous Field Studies Map MF-574, scale 1:62,500.
Blake, M.C., Jr., Graymer, R.W. and Jones, D.L., in press, Digital geologic map and map database of parts of Marin, San Francisco, Alameda, Contra Costa, and Sonoma counties, California: U.S. Geological Survey Miscellaneous Field Studies Report and Map, scale unknown.
Bonilla, M.G., 1971, Preliminary geologic map of the San Francisco South Quadrangle and part of the Hunters Point Quadrangle, California: U.S. Geological Survey, Miscellaneous Field Studies Map, MF-0311, scale 1:24,000, two sheets.
Bonilla, M.G., 1998, Preliminary geologic map of the San Francisco South 7.5-minute Quadrangle and part of the Hunters Point 7.5-minute Quadrangle, San Francisco Bay Area, California: A Digital Database: U.S. Geological Survey Open-File Report 98-354, scale 1:24,000.
Brabb, E.E., 1983, Map showing direction and amount of bedding dip of sedimentary rocks in San Mateo County, California: U.S. Geological Survey Miscellaneous Investigations Series Map I-1257C, 1 sheet, scale 1:62,500.
California Department of Conservation, Division of Mines and Geology, 1997, Guidelines for evaluating and mitigating seismic hazards in California: California Department of Conservation, Division of Mines and Geology, Special Publication 117, 74 p.
California Department of Conservation, Division of Mines and Geology, 2000, Recommended criteria for delineating seismic hazard zones: California Department of Conservation, Division of Mines and Geology, Special Publication 118, 12 p.

DIVISION OF MINES AND GEOLOGY SHZR 043
36
Ellen, S.D. and Wentworth, C.M., 1995, Hillside materials and slopes of the San Francisco Bay Region, California: U.S. Geological Survey Professional Paper 1357, 215 p.
Horn, B.K.P., 1981, Hill shading and the reflectance map: Proceedings of the IEEE, v. 69, no. 1, p. 14-47.
Jibson, R.W., 1993, Predicting earthquake-induced landslide displacements using Newmark’s sliding block analysis: Transportation Research Board, National Research Council, Transportation Research Record 1411, 17 p.
Keefer, D.K., 1984, Landslides caused by earthquakes: Geological Society of America Bulletin, v. 95, no. 4, p. 406-421.
Keefer, D.K. and Manson, M.W., 1998, Regional distribution and characteristics of landslides generated by the earthquake in Keefer, D.K., editor, The Loma Prieta, California, Earthquake of October 17, 1989 – Landslides: U.S. Geological Survey Professional Paper 1551-C, pp. C7-C32.
Lawson, A.C., chairman, 1908, The California earthquake of April 18, 1906; report of the State Earthquake Investigation Commission: Carnegie Institution of Washington, Publication 87, v. 1 and atlas, 451 p.
McCrink, T.P. and Real, C.R., 1996, Evaluation of the Newmark method for mapping earthquake-induced landslide hazards in the Laurel 7-1/2 minute Quadrangle, Santa Cruz County, California: California Division of Mines and Geology Final Technical Report for U.S. Geological Survey Contract 143-93-G-2334, U.S. Geological Survey, Reston, Virginia, 31 p.
Newmark, N.M., 1965, Effects of earthquakes on dams and embankments: Geotechnique, v. 15, no. 2, p. 139-160.
Petersen, M.D., Bryant, W.A., Cramer, C.H., Cao. T., Reichle, M.S., Frankel, A.D., Lienkaemper, J.J., McCrory, P.A. and Schwartz, D.P., 1996, Probabilistic seismic hazard assessment for the State of California: California Department of Conservation, Division of Mines and Geology, Open File Report 96-08; U.S. Geological Survey Open File Report 96-706, 33 p.
Radbruch, D. H., 1957, Areal and Engineering Geology of the Oakland West Quadrangle, California: U. S. Geological Survey Miscellaneous Geologic Investigations Map I-239, scale 1:24,000.
Schlocker, J., 1974, Geology of the San Francisco North Quadrangle, California: U. S. Geological Survey Professional Paper 782, 109p.
Seed, R.B., Dickenson, S.E., Reimer, M.F., Bray, J.D., Sitar, Nicholas, Mitchell, J.K., Idriss, I.M., Kayen, R.E., Kropp, Alan, Harder, L.F., Jr. and Power, M.S., 1990, Preliminary report on the principal geotechnical aspects of the October 17, 1989
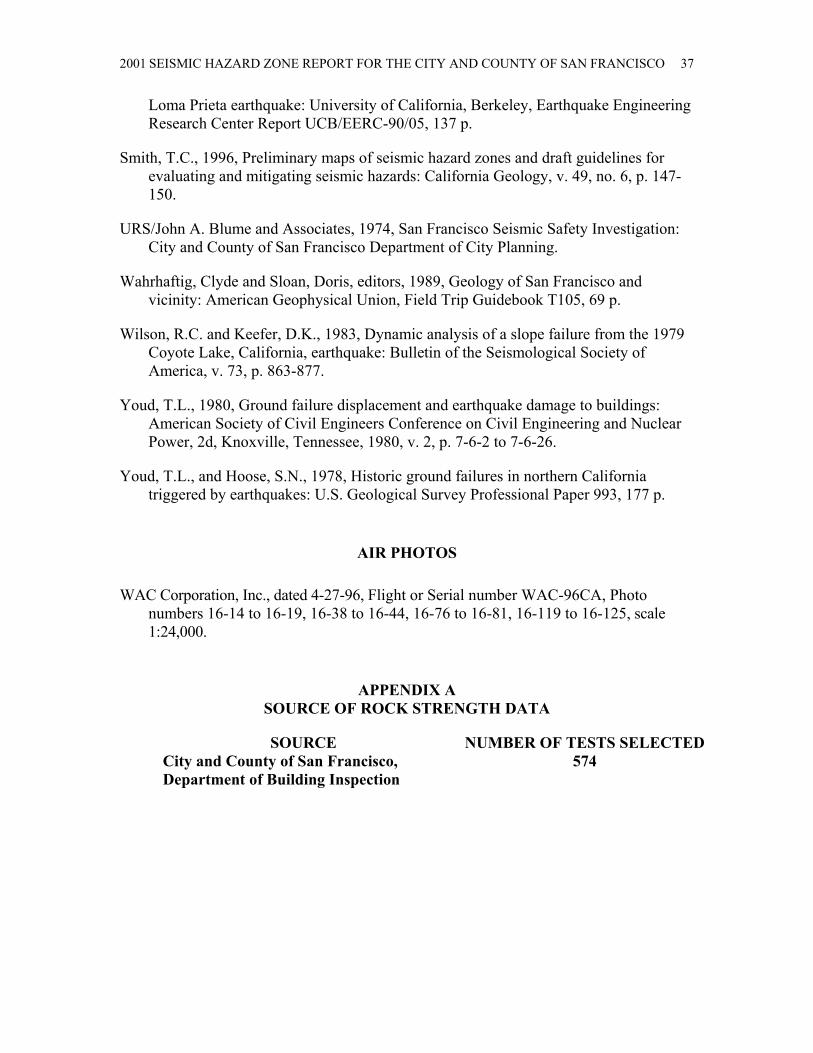
2001 SEISMIC HAZARD ZONE REPORT FOR THE CITY AND COUNTY OF SAN FRANCISCO 37
Loma Prieta earthquake: University of California, Berkeley, Earthquake Engineering Research Center Report UCB/EERC-90/05, 137 p.
Smith, T.C., 1996, Preliminary maps of seismic hazard zones and draft guidelines for evaluating and mitigating seismic hazards: California Geology, v. 49, no. 6, p. 147-150.
URS/John A. Blume and Associates, 1974, San Francisco Seismic Safety Investigation: City and County of San Francisco Department of City Planning.
Wahrhaftig, Clyde and Sloan, Doris, editors, 1989, Geology of San Francisco and vicinity: American Geophysical Union, Field Trip Guidebook T105, 69 p.
Wilson, R.C. and Keefer, D.K., 1983, Dynamic analysis of a slope failure from the 1979 Coyote Lake, California, earthquake: Bulletin of the Seismological Society of America, v. 73, p. 863-877.
Youd, T.L., 1980, Ground failure displacement and earthquake damage to buildings: American Society of Civil Engineers Conference on Civil Engineering and Nuclear Power, 2d, Knoxville, Tennessee, 1980, v. 2, p. 7-6-2 to 7-6-26.
Youd, T.L., and Hoose, S.N., 1978, Historic ground failures in northern California triggered by earthquakes: U.S. Geological Survey Professional Paper 993, 177 p.
AIR PHOTOS
WAC Corporation, Inc., dated 4-27-96, Flight or Serial number WAC-96CA, Photo numbers 16-14 to 16-19, 16-38 to 16-44, 16-76 to 16-81, 16-119 to 16-125, scale 1:24,000.
APPENDIX A SOURCE OF ROCK STRENGTH DATA
SOURCE NUMBER OF TESTS SELECTED City and County of San Francisco, Department of Building Inspection
574


2001 SEISMIC HAZARD ZONE REPORT FOR THE CITY AND COUNTY OF SAN FRANCISCO 39
SECTION 3 GROUND SHAKING EVALUATION REPORT
Potential Ground Shaking in the
City and County of San Francisco, California
By
Mark D. Petersen*, Chris H. Cramer*, Geoffrey A. Faneros, Charles R. Real, and Michael S. Reichle
California Department of Conservation
Division of Mines and Geology *Formerly with DMG, now with U.S. Geological Survey
PURPOSE
The Seismic Hazards Mapping Act (the Act) of 1990 (Public Resources Code, Chapter 7.8, Division 2) directs the California Department of Conservation (DOC), Division of Mines and Geology (DMG) to delineate Seismic Hazard Zones. The purpose of the Act is to reduce the threat to public health and safety and to minimize the loss of life and property by identifying and mitigating seismic hazards. Cities, counties, and state agencies are directed to use the Seismic Hazard Zone Maps in their land-use planning and permitting processes. The Act requires that site-specific geotechnical investigations be performed prior to permitting most urban development projects within the hazard zones. Evaluation and mitigation of seismic hazards are to be conducted under guidelines established by the California State Mining and Geology Board (DOC, 1997; also available on the Internet at http://gmw.consrv.ca.gov/shmp/webdocs/sp117.pdf).
This section of the evaluation report summarizes the ground motions used to evaluate liquefaction and earthquake-induced landslide potential for zoning purposes. Included are ground motion and related maps, a brief overview on how these maps were prepared, precautionary notes concerning their use, and related references. The maps provided herein are presented at a scale of approximately 1:150,000 (scale bar provided on maps), and show the full 7.5-minute quadrangle and portions of the adjacent eight quadrangles.

DIVISION OF MINES AND GEOLOGY SHZR 043
40
They can be used to assist in the specification of earthquake loading conditions for the analysis of ground failure according to the “Simple Prescribed Parameter Value” method (SPPV) described in the site investigation guidelines (California Department of Conservation, 1997). Alternatively, they can be used as a basis for comparing levels of ground motion determined by other methods with the statewide standard.
This section and Sections 1 and 2 (addressing liquefaction and earthquake-induced landslide hazards) constitute a report series that summarizes development of seismic hazard zone maps in the state. Additional information on seismic hazard zone mapping in California can be accessed on DMG’s Internet homepage: http://www.conservation.ca.gov/CGS/index.htm
EARTHQUAKE HAZARD MODEL
The estimated ground shaking is derived from the statewide probabilistic seismic hazard evaluation released cooperatively by the California Department of Conservation, Division of Mines and Geology, and the U.S. Geological Survey (Petersen and others, 1996). That report documents an extensive 3-year effort to obtain consensus within the scientific community regarding fault parameters that characterize the seismic hazard in California. Fault sources included in the model were evaluated for long-term slip rate, maximum earthquake magnitude, and rupture geometry. These fault parameters, along with historical seismicity, were used to estimate return times of moderate to large earthquakes that contribute to the hazard.
The ground shaking levels are estimated for each of the sources included in the seismic source model using attenuation relations that relate earthquake shaking with magnitude, distance from the earthquake, and type of fault rupture (strike-slip, reverse, normal, or subduction). The published hazard evaluation of Petersen and others (1996) only considers uniform firm-rock site conditions. In this report, however, we extend the hazard analysis to include the hazard of exceeding peak horizontal ground acceleration (PGA) at 10% probability of exceedance in 50 years on spatially uniform conditions of rock, soft rock, and alluvium. These soil and rock conditions approximately correspond to site categories defined in Chapter 16 of the Uniform Building Code (ICBO, 1997), which are commonly found in California. We use the attenuation relations of Boore and others (1997), Campbell (1997), Sadigh and others (1997), and Youngs and others (1997) to calculate the ground motions.
The seismic hazard maps for ground shaking are produced by calculating the hazard at sites separated by about 5 km. Figures 3.1 through 3.3 show the hazard for PGA at 10% probability of exceedance in 50 years assuming the entire map area is firm rock, soft rock, or alluvial site conditions respectively. The sites where the hazard is calculated are represented as dots and ground motion contours as shaded regions. The quadrangle of interest is outlined by bold lines and centered on the map. Portions of the eight adjacent

((((((((( (((((((((
((((((((( ((((((((( ((((((((( ((((((((( ((((((((( (((((((((
(((((((((((((((((( ((((((((( ((((((((( ((((((((( (((((((((
((((((((( ((((((((( ((((((((( ((((((((( ((((((((( (((((((((
((((((((( ((((((((( ((((((((( ((((((((( ((((((((( (((((((((
((((((((( ((((((((( ((((((((( (((((((((0.750.750.750.750.750.750.750.750.75 0.820.820.820.820.820.820.820.820.82 0.790.790.790.790.790.790.790.790.79 0.650.650.650.650.650.650.650.650.65 0.530.530.530.530.530.530.530.530.53 0.480.480.480.480.480.480.480.480.48
0.790.790.790.790.790.790.790.790.79 0.870.870.870.870.870.870.870.870.87 0.650.650.650.650.650.650.650.650.65 0.530.530.530.530.530.530.530.530.53 0.470.470.470.470.470.470.470.470.47 0.440.440.440.440.440.440.440.440.44
0.920.920.920.920.920.920.920.920.92 0.690.690.690.690.690.690.690.690.69 0.560.560.560.560.560.560.560.560.56 0.490.490.490.490.490.490.490.490.49 0.440.440.440.440.440.440.440.440.44 0.450.450.450.450.450.450.450.450.45
0.740.740.740.740.740.740.740.740.74 0.590.590.590.590.590.590.590.590.59 0.490.490.490.490.490.490.490.490.49 0.450.450.450.450.450.450.450.450.45 0.440.440.440.440.440.440.440.440.44 0.470.470.470.470.470.470.470.470.47
0.630.630.630.630.630.630.630.630.63 0.530.530.530.530.530.530.530.530.53 0.460.460.460.460.460.460.460.460.46 0.440.440.440.440.440.440.440.440.44 0.460.460.460.460.460.460.460.460.46 0.540.540.540.540.540.540.540.540.54
CITY AND COUNTY OF SAN FRANCISCO ANDADJACENT AREAS
10% EXCEEDANCE IN 50 YEARS PEAK GROUND ACCELERATION (g)1998
FIRM ROCK CONDITIONS
Department of ConservationCalifornia Geological Survey
Figure 3.1
0 1.5
Miles
3
Base map from GDT
SEISMIC HAZARD EVALUATION OF THE CITY AND COUNTY OF SAN FRANCISCO 412004
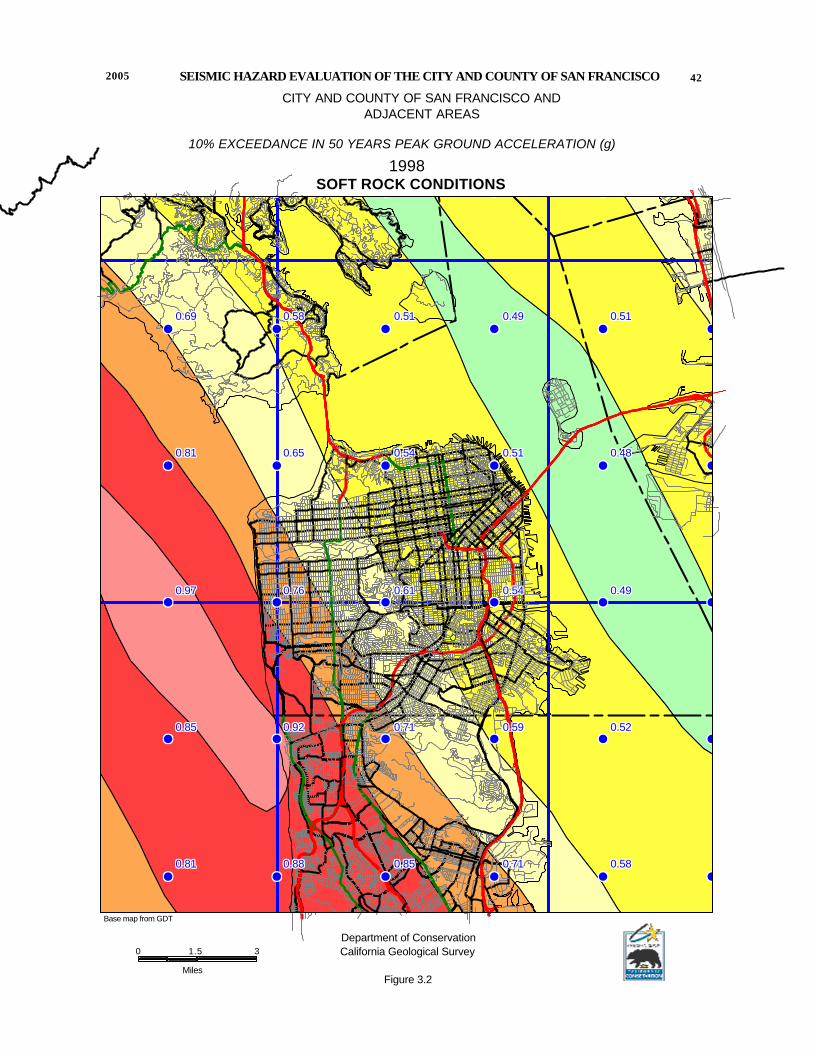
(((((((((((((((((( ((((((((( ((((((((( ((((((((( (((((((((
(((((((((
(((((((((
(((((((((((((((((( ((((((((( ((((((((( ((((((((( (((((((((
(((((((((((((((((( ((((((((( ((((((((( ((((((((( (((((((((
((((((((( ((((((((( ((((((((( ((((((((( (((((((((
((((((((( ((((((((( ((((((((( ((((((((( ((((((((( (((((((((
((((((((( ((((((((( ((((((((( ((((((((( (((((((((
0.810.810.810.810.810.810.810.810.81 0.880.880.880.880.880.880.880.880.88 0.850.850.850.850.850.850.850.850.85 0.710.710.710.710.710.710.710.710.71 0.580.580.580.580.580.580.580.580.58
0.850.850.850.850.850.850.850.850.85 0.920.920.920.920.920.920.920.920.92 0.710.710.710.710.710.710.710.710.71 0.590.590.590.590.590.590.590.590.59 0.520.520.520.520.520.520.520.520.52
0.970.970.970.970.970.970.970.970.97 0.760.760.760.760.760.760.760.760.76 0.610.610.610.610.610.610.610.610.61 0.540.540.540.540.540.540.540.540.54 0.490.490.490.490.490.490.490.490.49
0.810.810.810.810.810.810.810.810.81 0.650.650.650.650.650.650.650.650.65 0.540.540.540.540.540.540.540.540.54 0.510.510.510.510.510.510.510.510.51 0.480.480.480.480.480.480.480.480.48
0.690.690.690.690.690.690.690.690.69 0.580.580.580.580.580.580.580.580.58 0.510.510.510.510.510.510.510.510.51 0.490.490.490.490.490.490.490.490.49 0.510.510.510.510.510.510.510.510.51
CITY AND COUNTY OF SAN FRANCISCO ANDADJACENT AREAS
10% EXCEEDANCE IN 50 YEARS PEAK GROUND ACCELERATION (g)
1998SOFT ROCK CONDITIONS
Department of ConservationCalifornia Geological Survey
Figure 3.2
0 1.5
Miles
3
Base map from GDT
SEISMIC HAZARD EVALUATION OF THE CITY AND COUNTY OF SAN FRANCISCO2005 42

(((((((((
(((((((((
((((((((( ((((((((( ((((((((( ((((((((( (((((((((
((((((((( ((((((((( ((((((((( ((((((((( (((((((((
(((((((((((((((((( ((((((((( ((((((((( ((((((((( (((((((((
(((((((((((((((((( ((((((((( ((((((((( ((((((((( (((((((((
((((((((( ((((((((( ((((((((( ((((((((( ((((((((( (((((((((
0.760.760.760.760.760.760.760.760.76 0.810.810.810.810.810.810.810.810.81 0.790.790.790.790.790.790.790.790.79 0.70.70.70.70.70.70.70.70.7 0.600.600.600.600.600.600.600.600.60 0.560.560.560.560.560.56
0.810.810.810.810.810.810.810.810.81 0.820.820.820.820.820.820.820.820.82 0.700.700.700.700.700.700.700.700.70 0.600.600.600.600.600.600.600.600.60 0.550.550.550.550.550.550.550.550.55 0.530.530.530.530.530.53
0.910.910.910.910.910.910.910.910.91 0.730.730.730.730.730.730.730.730.73 0.630.630.630.630.630.630.630.630.63 0.570.570.570.570.570.570.570.570.57 0.530.530.530.530.530.530.530.530.53 0.530.530.530.530.530.53
0.770.770.770.770.770.770.770.770.77 0.650.650.650.650.650.650.650.650.65 0.570.570.570.570.570.570.570.570.57 0.540.540.540.540.540.540.540.540.54 0.520.520.520.520.520.520.520.520.52 0.540.540.540.540.540.54
0.680.680.680.680.680.680.680.680.68 0.600.600.600.600.600.600.600.600.60 0.540.540.540.540.540.540.540.540.54 0.530.530.530.530.530.530.530.530.53 0.530.530.530.530.530.530.530.530.53 0.580.580.580.580.580.58
CITY AND COUNTY OF SAN FRANCISCO ANDADJACENT AREAS
10% EXCEEDANCE IN 50 YEARS PEAK GROUND ACCELERATION (g)1998
ALLUVIUM CONDITIONS
Department of ConservationCalifornia Geological Survey
Figure 3.3
0 1.5
Miles
3
Base map from GDT
SEISMIC HAZARD EVALUATION OF THE CITY AND COUNTY OF SAN FRANCISCO2004 43

DIVISION OF MINES AND GEOLOGY SHZR 043
44
quadrangles are also shown so that the trends in the ground motion may be more apparent. We recommend estimating ground motion values by selecting the map that matches the actual site conditions, and interpolating from the calculated values of PGA rather than the contours, since the points are more accurate.
APPLICATIONS FOR LIQUEFACTION AND LANDSLIDE HAZARD ASSESSMENTS
Deaggregation of the seismic hazard identifies the contribution of each of the earthquakes (various magnitudes and distances) in the model to the ground motion hazard for a particular exposure period (see Cramer and Petersen, 1996). The map in Figure 3.4 identifies the magnitude and the distance (value in parentheses) of the earthquake that contributes most to the hazard at 10% probability of exceedance in 50 years on alluvial site conditions (predominant earthquake). This information gives a rationale for selecting a seismic record or ground motion level in evaluating ground failure. However, it is important to keep in mind that more than one earthquake may contribute significantly to the hazard at a site, and those events can have markedly different magnitudes and distances. For liquefaction hazard the predominant earthquake magnitude from Figure 3.4 and PGA from Figure 3.3 (alluvium conditions) can be used with the Youd and Idriss (1997) approach to estimate cyclic stress ratio demand. For landslide hazard the predominant earthquake magnitude and distance can be used to select a seismic record that is consistent with the hazard for calculating the Newmark displacement (Wilson and Keefer, 1983). When selecting the predominant earthquake magnitude and distance, it is advisable to consider the range of values in the vicinity of the site and perform the ground failure analysis accordingly. This would yield a range in ground failure hazard from which recommendations appropriate to the specific project can be made. Grid values for predominant earthquake magnitude and distance should not be interpolated at the site location, because these parameters are not continuous functions.
A preferred method of using the probabilistic seismic hazard model and the “simplified Seed-Idriss method” of assessing liquefaction hazard is to apply magnitude scaling probabilistically while calculating peak ground acceleration for alluvium. The result is a “magnitude-weighted” ground motion (liquefaction opportunity) map that can be used directly in the calculation of the cyclic stress ratio threshold for liquefaction and for estimating the factor of safety against liquefaction (Youd and Idriss, 1997). This can provide a better estimate of liquefaction hazard than use of predominate magnitude described above, because all magnitudes contributing to the estimate are used to weight the probabilistic calculation of peak ground acceleration (Real and others, 2000). Thus, large distant earthquakes that occur less frequently but contribute more to the liquefaction hazard are appropriately accounted for.
Figure 3.5 shows the magnitude-weighted alluvial PGA based on Idriss’ weighting function (Youd and Idriss, 1997). It is important to note that the values obtained from this map are pseudo-accelerations and should be used in the formula for factor of safety without any magnitude-scaling (a factor of 1) applied.

((((((((((((((((((((((((((((((((((((((((((((((((( ((((((((((((((((((((((((((((((((((((((((((((((((( ((((((((((((((((((((((((((((((((((((((((((((((((( (((((((((((((((((((((((((((((((((((((((((((((((((
(((((((((((((((((((((((((((((((((((((((((((((((((((((((((((((((((((((((((((((((((((((((((((((((((( ((((((((((((((((((((((((((((((((((((((((((((((((( ((((((((((((((((((((((((((((((((((((((((((((((((( ((((((((((((((((((((((((((((((((((((((((((((((((( (((((((((((((((((((((((((((((((((((((((((((((((((
((((((((((((((((((((((((((((((((((((((((((((((((( ((((((((((((((((((((((((((((((((((((((((((((((((( ((((((((((((((((((((((((((((((((((((((((((((((((( ((((((((((((((((((((((((((((((((((((((((((((((((( ((((((((((((((((((((((((((((((((((((((((((((((((( (((((((((((((((((((((((((((((((((((((((((((((((((
((((((((((((((((((((((((((((((((((((((((((((((((( ((((((((((((((((((((((((((((((((((((((((((((((((( ((((((((((((((((((((((((((((((((((((((((((((((((( ((((((((((((((((((((((((((((((((((((((((((((((((( ((((((((((((((((((((((((((((((((((((((((((((((((( (((((((((((((((((((((((((((((((((((((((((((((((((
((((((((((((((((((((((((((((((((((((((((((((((((( ((((((((((((((((((((((((((((((((((((((((((((((((( ((((((((((((((((((((((((((((((((((((((((((((((((( ((((((((((((((((((((((((((((((((((((((((((((((((( ((((((((((((((((((((((((((((((((((((((((((((((((( (((((((((((((((((((((((((((((((((((((((((((((((((
((((((((((((((((((((((((((((((((((((((((((((((((( (((((((((((((((((((((((((((((((((((((((((((((((((
97
7.97.97.97.97.97.97.97.97.9 7.97.97.97.97.97.97.97.97.9 7.97.97.97.97.97.97.97.97.9 7.97.97.97.97.97.97.97.97.9 7.97.97.97.97.97.97.97.97.9 777777777
7.97.97.97.97.97.97.97.97.9 7.97.97.97.97.97.97.97.97.9 7.97.97.97.97.97.97.97.97.9 7.97.97.97.97.97.97.97.97.9 7.97.97.97.97.97.97.97.97.9 777777777
7.97.97.97.97.97.97.97.97.9 7.97.97.97.97.97.97.97.97.9 7.97.97.97.97.97.97.97.97.9 7.97.97.97.97.97.97.97.97.9 7.97.97.97.97.97.97.97.97.9 777777777
7.97.97.97.97.97.97.97.97.9 7.97.97.97.97.97.97.97.97.9 7.97.97.97.97.97.97.97.97.9 7.97.97.97.97.97.97.97.97.9 7.97.97.97.97.97.97.97.97.9 777777777
7.97.97.97.97.97.97.97.97.9 7.97.97.97.97.97.97.97.97.9 7.97.97.97.97.97.97.97.97.9 7.97.97.97.97.97.97.97.97.9 7.97.97.97.97.97.97.97.97.9 777777777
(7)(7)(7)(7)(7)(7)(7)(7)(7) (2)(2)(2)(2)(2)(2)(2)(2)(2) (2)(2)(2)(2)(2)(2)(2)(2)(2) (7)(7)(7)(7)(7)(7)(7)(7)(7) (7)(7)(7)(7)(7)(7)(7)(7)(7) (((((((((
(2)(2)(2)(2)(2)(2)(2)(2)(2) (2)(2)(2)(2)(2)(2)(2)(2)(2) (7)(7)(7)(7)(7)(7)(7)(7)(7) (7)(7)(7)(7)(7)(7)(7)(7)(7) (12)(12)(12)(12)(12)(12)(12)(12)(12) (((((((((
(2)(2)(2)(2)(2)(2)(2)(2)(2) (2)(2)(2)(2)(2)(2)(2)(2)(2) (7)(7)(7)(7)(7)(7)(7)(7)(7) (12)(12)(12)(12)(12)(12)(12)(12)(12) (17)(17)(17)(17)(17)(17)(17)(17)(17) (((((((((
(2)(2)(2)(2)(2)(2)(2)(2)(2) (7)(7)(7)(7)(7)(7)(7)(7)(7) (12)(12)(12)(12)(12)(12)(12)(12)(12) (12)(12)(12)(12)(12)(12)(12)(12)(12) (17)(17)(17)(17)(17)(17)(17)(17)(17) (((((((((
(7)(7)(7)(7)(7)(7)(7)(7)(7) (7)(7)(7)(7)(7)(7)(7)(7)(7) (12)(12)(12)(12)(12)(12)(12)(12)(12) (17)(17)(17)(17)(17)(17)(17)(17)(17) (22)(22)(22)(22)(22)(22)(22)(22)(22) (((((((((
CITY AND COUNTY OF SAN FRANCISCO ANDADJACENT AREAS
10% EXCEEDANCE IN 50 YEARS PEAK GROUND ACCELERATION1998
PREDOMINANT EARTHQUAKE Magnitude (Mw) (Distance (km))
Department of ConservationCalifornia Geological Survey0 1.5
Miles
3
Figure 3.4
Base map from GDT
SEISMIC HAZARD EVALUATION OF THE CITY AND COUNTY OF SAN FRANCISCO2005 45
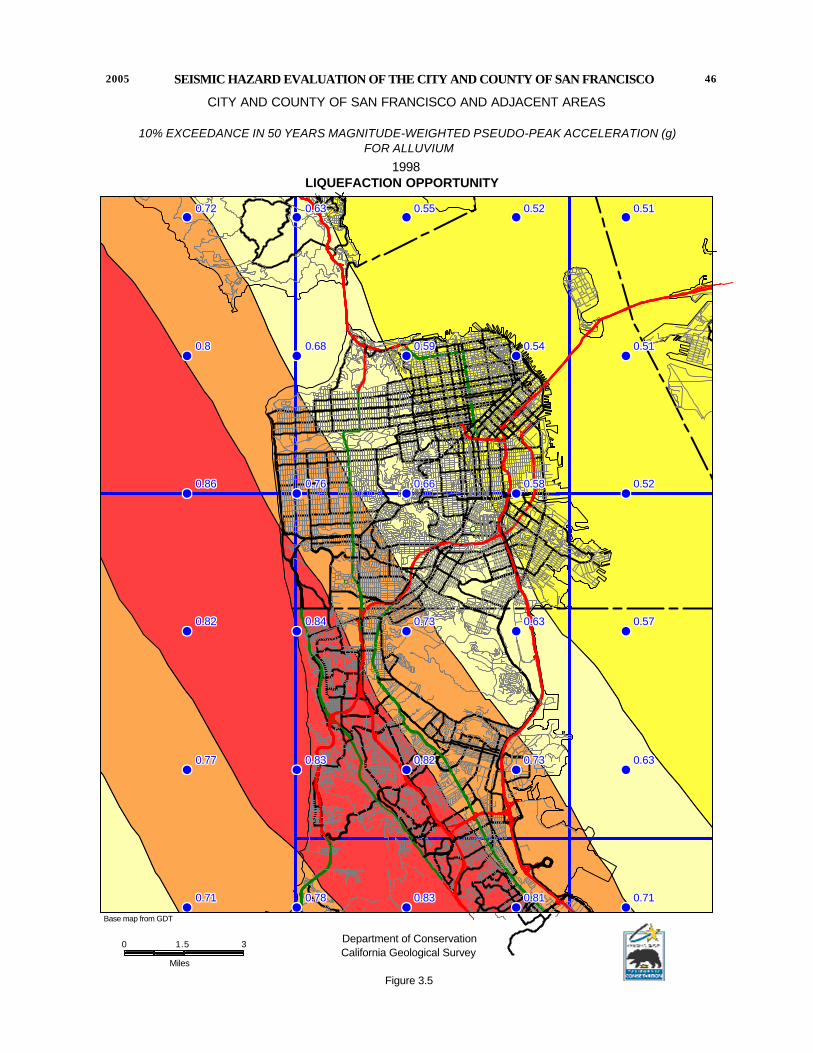
((((((((( ((((((((( ((((((((( ((((((((( (((((((((
((((((((( ((((((((( ((((((((( ((((((((( (((((((((
((((((((( ((((((((( ((((((((( ((((((((( (((((((((
((((((((( ((((((((( ((((((((( (((((((((
((((((((( ((((((((( ((((((((( ((((((((( (((((((((
((((((((( ((((((((( ((((((((( ((((((((( (((((((((
(((((((((0.710.710.710.710.710.710.710.710.71 0.780.780.780.780.780.780.780.780.78 0.830.830.830.830.830.830.830.830.83 0.810.810.810.810.810.810.810.810.81 0.710.710.710.710.710.710.710.710.71
0.770.770.770.770.770.770.770.770.77 0.830.830.830.830.830.830.830.830.83 0.820.820.820.820.820.820.820.820.82 0.730.730.730.730.730.730.730.730.73 0.630.630.630.630.630.630.630.630.63
0.820.820.820.820.820.820.820.820.82 0.840.840.840.840.840.840.840.840.84 0.730.730.730.730.730.730.730.730.73 0.630.630.630.630.630.630.630.630.63 0.570.570.570.570.570.570.570.570.57
0.860.860.860.860.860.860.860.860.86 0.760.760.760.760.760.760.760.760.76 0.660.660.660.660.660.660.660.660.66 0.580.580.580.580.580.580.580.580.58 0.520.520.520.520.520.520.520.520.52
0.80.80.80.80.80.80.80.80.8 0.680.680.680.680.680.680.680.680.68 0.590.590.590.590.590.590.590.590.59 0.540.540.540.540.540.540.540.540.54 0.510.510.510.510.510.510.510.510.51
0.720.720.720.720.720.720.720.720.72 0.630.630.630.630.630.630.630.630.63 0.550.550.550.550.550.550.550.550.55 0.520.520.520.520.520.520.520.520.52 0.510.510.510.510.510.510.510.510.51
CITY AND COUNTY OF SAN FRANCISCO AND ADJACENT AREAS
10% EXCEEDANCE IN 50 YEARS MAGNITUDE-WEIGHTED PSEUDO-PEAK ACCELERATION (g) FOR ALLUVIUM
1998LIQUEFACTION OPPORTUNITY
Department of ConservationCalifornia Geological Survey
Figure 3.5
0 1.5
Miles
3
Base map from GDT
SEISMIC HAZARD EVALUATION OF THE CITY AND COUNTY OF SAN FRANCISCO 462005

2001 SEISMIC HAZARD ZONE REPORT FOR THE CITY AND COUNTY OF SAN FRANCISCO 47
USE AND LIMITATIONS
The statewide map of seismic hazard has been developed using regional information and is not appropriate for site specific structural design applications. Use of the ground motion maps prepared at larger scale is limited to estimating earthquake loading conditions for preliminary assessment of ground failure at a specific location. We recommend consideration of site-specific analyses before deciding on the sole use of these maps for several reasons.
1. The seismogenic sources used to generate the peak ground accelerations were digitized from the 1:750,000-scale fault activity map of Jennings (1994). Uncertainties in fault location are estimated to be about 1 to 2 kilometers (Petersen and others, 1996). Therefore, differences in the location of calculated hazard values may also differ by a similar amount. At a specific location, however, the log-linear attenuation of ground motion with distance renders hazard estimates less sensitive to uncertainties in source location.
2. The hazard was calculated on a grid at sites separated by about 5 km (0.05 degrees). Therefore, the calculated hazard may be located a couple kilometers away from the site. We have provided shaded contours on the maps to indicate regional trends of the hazard model. However, the contours only show regional trends that may not be apparent from points on a single map. Differences of up to 2 km have been observed between contours and individual ground acceleration values. We recommend that the user interpolate PGA between the grid point values rather than simply using the shaded contours.
3. Uncertainties in the hazard values have been estimated to be about +/- 50% of the ground motion value at two standard deviations (Cramer and others, 1996).
4. Not all active faults in California are included in this model. For example, faults that do not have documented slip rates are not included in the source model. Scientific research may identify active faults that have not been previously recognized. Therefore, future versions of the hazard model may include other faults and omit faults that are currently considered.
5. A map of the predominant earthquake magnitude and distance is provided from the deaggregation of the probabilistic seismic hazard model. However, it is important to recognize that a site may have more than one earthquake that contributes significantly to the hazard. Therefore, in some cases earthquakes other than the predominant earthquake should also be considered.
Because of its simplicity, it is likely that the SPPV method (DOC, 1997) will be widely used to estimate earthquake shaking loading conditions for the evaluation of ground failure hazards. It should be kept in mind that ground motions at a given distance from an earthquake will vary depending on site-specific characteristics such as geology, soil properties, and topography, which may not have been adequately accounted for in the regional hazard analysis. Although this variance is represented to some degree by the

DIVISION OF MINES AND GEOLOGY SHZR 043
48
recorded ground motions that form the basis of the hazard model used to produce Figures 3.1, 3.2, and 3.3, extreme deviations can occur. More sophisticated methods that take into account other factors that may be present at the site (site amplification, basin effects, near source effects, etc.) should be employed as warranted. The decision to use the SPPV method with ground motions derived from Figures 3.1, 3.2, or 3.3 should be based on careful consideration of the above limitations, the geotechnical and seismological aspects of the project setting, and the “importance” or sensitivity of the proposed building with regard to occupant safety.
REFERENCES
Boore, D.M., Joyner, W.B. and Fumal, T.E., 1997, Empirical near-source attenuation relationships for horizontal and vertical components of peak ground acceleration, peak ground velocity, and pseudo-absolute acceleration response spectra: Seismological Research Letters, v. 68, p. 154-179.
California Department of Conservation, Division of Mines and Geology, 1997, Guidelines for evaluating and mitigating seismic hazards in California: Special Publication 117, 74 p.
Campbell, K.W., 1997, Attenuation relationships for shallow crustal earthquakes based on California strong motion data: Seismological Research Letters, v. 68, p. 180-189.
Cramer, C.H. and Petersen, M.D., 1996, Predominant seismic source distance and magnitude maps for Los Angeles, Orange and Ventura counties, California: Bulletin of the Seismological Society of America, v. 85, no. 5, p. 1645-1649.
Cramer, C.H., Petersen, M.D. and Reichle, M.S., 1996, A Monte Carlo approach in estimating uncertainty for a seismic hazard assessment of Los Angeles, Ventura, and Orange counties, California: Bulletin of the Seismological Society of America, v. 86, p. 1681-1691.
International Conference of Building Officials (ICBO), 1997, Uniform Building Code: v. 2, Structural engineering and installation standards, 492 p.
Jennings, C.W., compiler, 1994, Fault activity map of California and adjacent areas: California Department of Conservation, Division of Mines and Geology, California Geologic Data Map Series, map no. 8.
Petersen, M.D., Bryant, W.A., Cramer, C.H., Cao, T., Reichle, M.S., Frankel, A.D., Lienkaemper, J.J., McCrory, P.A. and Schwartz, D.P., 1996, Probabilistic seismic hazard assessment for the State of California: California Department of Conservation, Division of Mines and Geology Open-File Report 96-08; also U.S. Geological Survey Open-File Report 96-706, 33 p.

2001 SEISMIC HAZARD ZONE REPORT FOR THE CITY AND COUNTY OF SAN FRANCISCO 49
Real, C.R., Petersen, M.D., McCrink, T.P. and Cramer, C.H., 2000, Seismic Hazard Deaggregation in zoning earthquake-induced ground failures in southern California: Proceedings of the Sixth International Conference on Seismic Zonation, November 12-15, Palm Springs, California, EERI, Oakland, CA.
Sadigh, K., Chang, C.-Y., Egan, J.A., Makdisi, F. and Youngs, R.R., 1997, SEA96- A new predictive relation for earthquake ground motions in extensional tectonic regimes: Seismological Research Letters, v. 68, p. 190-198.
Wilson, R.C. and Keefer, D.K., 1983, Dynamic analysis of a slope failure from the 1979 Coyote Lake, California, Earthquake: Bulletin of the Seismological Society of America, v. 73, p. 863-877.
Youd, T.L. and Idriss I.M., 1997, Proceedings of the NCEER workshop on evaluation of liquefaction resistance of soils: Technical Report NCEER-97-0022, 40 p.
Youngs, R.R., Chiou, S.-J., Silva, W.J. and Humphrey, J.R., 1997, Stochastic point-source modeling of ground motions in the Cascadia Region: Seismological Research Letters, v. 68, p. 74-85.


