city of est covina
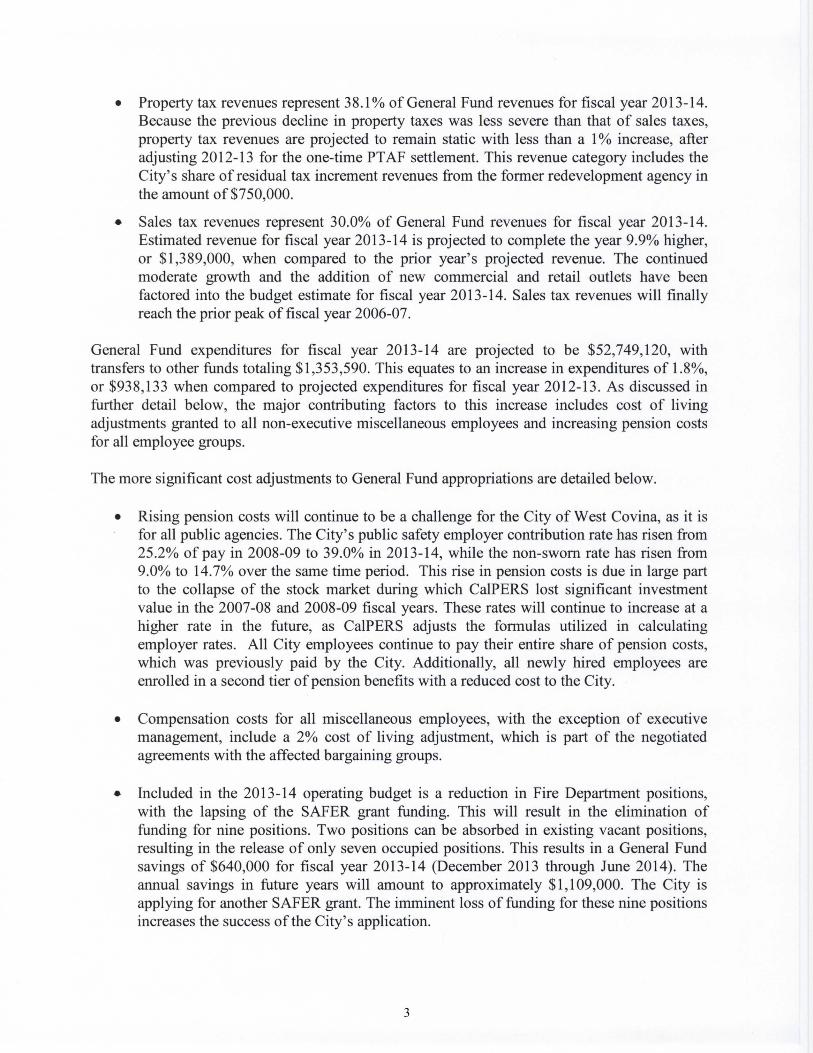
TRANSCRIPT
CITY OF
WEST COVINA
OPERATING AND CAPITAL IMPROVEMENT PROGRAM BUDGET
FISCAL YEAR 2013-14
CALIFORNIA

Photos Courtesy of the West Covina Historical Society and the West Covina Police Department Cover Design Sam Gutierrez, City of West Covina Public Works
CITY OF WEST COVINA, CALIFORNIA 1444 W. Garvey Avenue South, West Covina CA 91790
ADOPTED BUDGET for fiscal year
July 1, 2013 - June 30, 2014
CITY COUNCIL
Shelley Sanderson, Mayor Steve Herfert, Mayor Pro Tem
Andrew McIntyre Rob Sotelo Fred Sykes
CITY MANAGER
Christopher J. Chung
EXECUTIVE MANAGEMENT TEAM
Mike Lee, Assistant City Manager Arnold Alvarez-Glasman, City Attorney
Sue Rush, Assistant City Clerk Nita McKay, Finance and Administrative Services Director
Jeff Anderson, Planning Director Paul LaCommare, Interim Police Chief
Rick Genovese, Interim Fire Chief Shannon Yauchzee, Public Works Director
Christopher Freeland, Community Services Director

Page Intentionally Left Blank
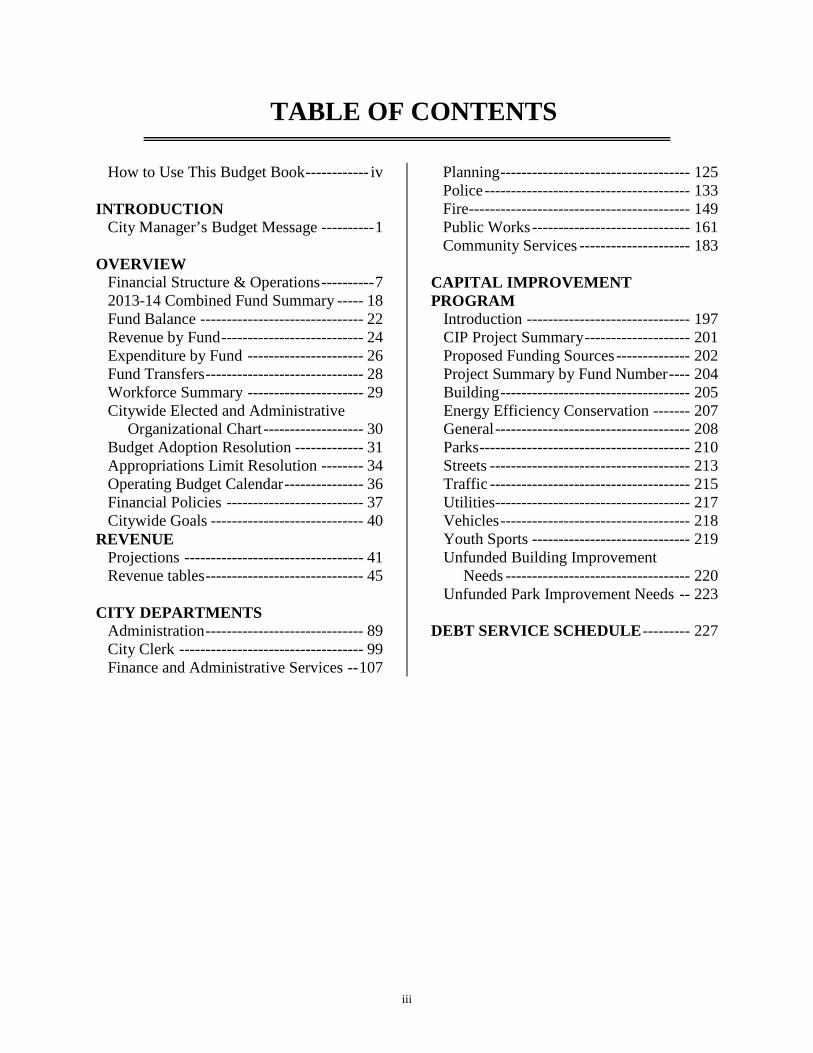
TABLE OF CONTENTS
How to Use This Budget Book ------------ iv
INTRODUCTION
City Manager’s Budget Message ---------- 1 OVERVIEW
Financial Structure & Operations ---------- 7 2013-14 Combined Fund Summary ----- 18 Fund Balance ------------------------------- 22 Revenue by Fund --------------------------- 24 Expenditure by Fund ---------------------- 26 Fund Transfers ------------------------------ 28 Workforce Summary ---------------------- 29 Citywide Elected and Administrative Organizational Chart ------------------- 30 Budget Adoption Resolution ------------- 31 Appropriations Limit Resolution -------- 34 Operating Budget Calendar --------------- 36 Financial Policies -------------------------- 37 Citywide Goals ----------------------------- 40
REVENUE Projections ---------------------------------- 41 Revenue tables ------------------------------ 45
CITY DEPARTMENTS Administration ------------------------------ 89 City Clerk ----------------------------------- 99 Finance and Administrative Services -- 107
Planning ------------------------------------ 125 Police --------------------------------------- 133 Fire ------------------------------------------ 149 Public Works ------------------------------ 161 Community Services --------------------- 183
CAPITAL IMPROVEMENT PROGRAM
Introduction ------------------------------- 197 CIP Project Summary -------------------- 201 Proposed Funding Sources -------------- 202 Project Summary by Fund Number ---- 204 Building ------------------------------------ 205 Energy Efficiency Conservation ------- 207 General ------------------------------------- 208 Parks ---------------------------------------- 210 Streets -------------------------------------- 213 Traffic -------------------------------------- 215 Utilities ------------------------------------- 217 Vehicles ------------------------------------ 218 Youth Sports ------------------------------ 219 Unfunded Building Improvement Needs ----------------------------------- 220 Unfunded Park Improvement Needs -- 223
DEBT SERVICE SCHEDULE --------- 227
iii
HOW TO USE THIS BUDGET BOOK
The budget is the City organization’s operational master plan for the fiscal year. It’s designed to acquaint readers with the organization and to help them make the best use of the information contained herein. The budget is divided into sections by tabs. A table of contents is included at the beginning of the book. The “Introduction” includes the City Manager’s Message. It identifies major issues, notes decisions to be made by the City Council when adopting the budget, and explains what the budget means for this fiscal year. The “Overview” section includes a summary of all fund types that are used to account for the City’s financial resources. This section also includes the combined fund summary, history of fund balances, revenues and expenditures, and a schedule of fund transfers. It also presents the Workforce Summary of the City.
An organizational chart provides the reader with a quick picture of the entire City organization. Organization charts for each department are located with the departmental budgets. The “Revenues” section describes the budget process and the major General Fund type revenues. This section also includes all revenues by fund. Included in each department section are narratives describing the department or division mission, an organization chart, fiscal year 2012-13 accomplishments, fiscal year 2013-14 goals and objectives, measures by which to judge the performance of the department during the next fiscal year, budget comments explaining significant expenditures within each budget, department issues, personnel details, followed by summary departmental expenditures that are grouped by type of expenditure (i.e. personnel costs, supplies and services, capital outlay) and source of funding.
iv

2
3
4
5
6
OVERVIEW
FINANCIAL STRUCTURE AND OPERATIONS
The City’s accounting system is organized and operated on a “fund basis” under which each fund is a distinct self-balancing accounting entity. A fund is “an independent fiscal and accounting entity used to record all financial transactions related to the specific purpose for which the fund was created”. Funds are established for the purpose of carrying on specific activities or attaining certain objectives in accordance with special regulations, legal restrictions, or limitations on the revenue source. The City’s annual operating budget is prepared in conformity with Generally Accepted Accounting Principles (GAAP).
The annual budget provides for the general operation of the City. The annual budget is adopted by City Council Resolution in June of each year for the General, Special Revenue, Debt Service, and Capital Projects Funds. The resolution appropriates funds for the operation of the City.
The City Manager is authorized to transfer budgeted amounts between departments to assure adequate and proper standards of service. Budgetary revisions, which increase the combined appropriations in individual funds, must be approved by the City Council. The City Manager is authorized to decrease department budgets to reflect savings generated by position vacancies. The budgetary level of control is at the departmental level.
The City provides a full range of services to its citizens. These include police, fire, emergency medical, street construction and maintenance, traffic signalization, parks,
recreational, cultural and social, planning, building and safety, economic development, environmental, and general administrative services.
Services are categorized into a departmental structure to afford similarity in services provided. Departments may receive funding from one or more funds. Through the budget process and ongoing activity, the City Council oversees the operation of the City, and sets forth community priorities and policies to be implemented by the City Manager. The City Manager directs the department heads in the administration of City programs and service delivery. The City Manager establishes administrative policy in areas under his purview.
To monitor and evaluate departmental effectiveness, a project-performance program has been initiated. Under this program, each department sets forth projects and programs to be undertaken during the fiscal year. Projects and programs may be one-time (with a specific completion date) or ongoing programs. A listing of each department’s projects and programs is submitted at the beginning of the fiscal year as an overview of the department’s work program. This information is compiled in the budget document and provides a detailed overview of the City’s work program for the fiscal year.
The more significant departmental projects and programs provide the basis for the departmental goals and objectives, and workload indicators included in the departmental budgets.
7
Departmental work programs are updated periodically. Completed projects, completion dates, new projects undertaken, as well as specific actions completed in providing ongoing programs, are established and reviewed. This process provides an ongoing measure of departmental activity and effectiveness in meeting the City Council’s priorities.
GANN LIMIT The adoption of the appropriation limit occurs annually to comply with the California Constitution, Article XIIIB (as amended) and Government Code Section 7910. The Gann Limit restricts annual expenditures the City may appropriate. If certain proceeds of taxes exceed allowed appropriations, the excess must either be refunded to the State Controller or refunded to the taxpayers. For the fiscal year ending June 30, 2013, the appropriation limit was $126,177,278. The City’s tax proceeds are projected to be less than the established appropriation limit. The limit for 2013-14 is $136,132,665.
BUDGET PROCESS The process of creating an operating budget for the City requires a great deal of effort on the part of the City Council and all members of the City’s management team. The budget process begins with a mid-year review. This allows department managers the opportunity to review their current work program and begin to plan for any changes, which they may recommend for the following year. Following the mid-year review, departments are requested to submit a prediction budget, which provides an estimate of the department’s proposed budget and which highlights any new
programs, major cost items, or reductions in programs. A preliminary revenue estimate is also prepared at this time. This information is compiled by the finance division and presented to the City Manager and departments as a prediction budget. At this early stage, the prediction budget normally identifies a gap between revenues and requested appropriations. This “gap” is then addressed through the various stages of the budget process.
Early in the budget process, the City Council provides policy direction to the City Manager and management team. Using the prediction budget and City Council policy direction, the City Manager provides direction to departments for preparing their line-item budgets. Line-item information is then forwarded to finance division staff for compilation. Once the initial line-item requests are compiled, finance division staff works with the City Manager and departments to identify any gap in revenues and expenditures, and to review departmental work programs.
At this point, the budget undergoes another review. Department managers are presented with updated revenue projections and any projected gap between revenues and expenditures. Actions available for addressing the budget gap are discussed, along with the merits of the various work program components. During this review, department managers adjust their budgets based on the City Manager’s direction. City Council Budget Study Sessions are then held to discuss departmental work programs, specific policy issues, and the Capital Improvement Budget (CIP). Final adjustments are made by the City Manager, and the manager’s recommended budget is prepared for presentation to the City Council. Additional City Council Budget
8
Study Sessions may be held to ensure that the budget accurately reflects the City Council’s objectives for the coming year. City Council adjustments are then incorporated into the manager’s recommended budget. The recommended budget is then presented to the City Council during a regular City Council meeting. The final budget is adopted, incorporating any final adjustments directed by the City Council as a result of the public hearing. Budget Amendment Procedures The City’s operating budget may be amended by three methods: 1) purchase order carryovers, 2) administrative carryovers approved by the City Manager, and 3) City Council action. Under all instances where appropriations are increased, funds must be available to match the request. Administrative Carryovers At the end of each fiscal year, the finance department requests that each department review its budget for items or programs for which any planned expenditure is pending. This may include a project, which has been initiated, or an item ordered but not received. The Director of Finance and Administrative Services determines the merit of any requests and ensures that adequate funding is available. Recommendations are then presented to the City Manager, who in turn, determines which requests will be approved. Approved carryover requests increase the department’s budget appropriation in the new fiscal year. City Council Action Throughout the year, the City Council considers departmental requests for
additional appropriations to fund activities not included in the original Adopted Budget. Capital Improvement Program Each year, the City Council adopts a Capital Improvement Program (CIP), which identifies all of the major projects to be undertaken to improve facilities and infrastructure within the city. During the fiscal year, a separate CIP document that reflects the current year program and proposes a program of prioritized projects for the next four to five years is prepared.
Department heads submit all proposed projects for their department in the foreseeable future, along with their best cost-estimate. The request includes the year a project will commence, any funding sources that may be available with either future sources or ones which might have been previously designated, justification for the project, and on-going costs expected to occur after the project has been completed. The CIP budget team then compiles the information and presents a draft CIP program to the City Council. Projects are prioritized, based on City Council and staff input. Additional projects may be approved during the year by City Council action. Capital projects may be funded from a variety of funds, with the majority of projects funded from restricted funds.
The City Council places a high priority on the maintenance and enhancement of recreational facilities, as reflected in the CIP. However, the recent reductions in available funding sources have resulted in a significantly reduced budget for these areas.
9
CIP Carryovers Every year, staff reviews each capital project and carries forward prior year appropriations for projects that have not been completed or for which long-term funding is being accumulated. The carryovers are handled administratively and are not included as part of the current year CIP Budget. Projects funded in prior years, but not started, are reviewed with the City Council during the CIP Budget Study Session. This review is designed to determine whether such projects continue to be City Council priorities. The budget for any project that has not been started and is no longer a City Council priority is made available for other projects. Allocated Costs As part of the City’s effort to incorporate stronger cost accounting controls and methods, the cost of operating certain departments is allocated to user departments. This process is used to fund those departments that provide inter-departmental services. This allows these departments to operate in a manner similar to an Internal Service Fund. Allocated departments include fleet maintenance, reprographic services, and risk management divisions. Fleet maintenance and reprographic services are budgeted based on prior year data and allocated based on a department’s actual service usage during the year. Risk management is funded by a separate charge for workers’ compensation, and one for property and liability insurance and claims. The appropriations for these programs are included in the operating budget of departments. Allocated costs were not adequate to cover all expenses in the fleet management fund. These allocations will be increased each year until the full costs of operations are recovered.
CITY FUND STRUCTURE
A number of different funds are utilized to account for the City, the Successor Agency to the Former Redevelopment Agency and Community Development Commission (which serves as the Housing Successor Agency) financial resources. Funds are classified into the following fund types:
• General Fund • Special Revenue Fund • Debt Service • Capital Projects • Proprietary
The City has established multiple funds under each fund type to assist in accounting and record keeping for the City and outside agencies.
A brief description of each fund with the above fund types is provided below.
GENERAL FUND TYPE
General Fund (Fund 110) The General Fund is the City’s largest single fund type and is used to account for unrestricted revenues. The City’s General Fund is the main operating fund for non-restricted revenues, such as general taxes and fees. Appropriations may be made from the General Fund for any legal City activity. This fund is used to account for basic City services such as police, fire, building, planning and general administration. Within the General Fund, the City maintains non-spendable (not available) and unassigned (available) reserves that represent the unappropriated fund balance.
10
SPECIAL REVENUE FUND TYPE
This fund type accounts for revenue that the City receives for a specific purpose. The City receives a significant amount of tax revenue that is restricted as to its use. The City also assesses property and business owner’s fees to be used to provide specific benefits to the assessed property or business. The City also receives grants and contracts that can only be used for specific purposes. These revenue sources are accounted for in the following Special Revenue Funds. AB939 (Fund 129) This fund accounts for revenues and expenditures of programs implemented to meet the requirements of the California Integrated Waste Management Act of 1989 (AB 939). Revenues are generated through a waste management fee. Programs funded include the development and implementation of a solid waste reduction and recycling project, household hazardous waste disposal project, and solid waste management activities. Air Quality Improvement Trust (Fund 119) In 1991-1992, the state passed AB 2766, the state’s Air Quality Improvement Trust Fund. An increase in motor vehicle license fees collected by the State of California supports this state fund. The City receives a portion of the fees to enhance the City’s clean air efforts. Programs supported by the fees include the Rideshare Program, the development of an Air Quality Management Plan and the City’s Alternative Fuel Program. Art in Public Places Fund (Fund 212) This fund accounts for development fees paid in lieu of acquisition and installation of
approved artwork in a development with expenditures restricted to acquisition, installation, maintenance and repair of artworks at approved sites. Business Improvement District (Fund 190) This is an assessment district supported by six of West Covina’s automobile dealers to fund the construction, maintenance, and operation of a reader board adjacent to Interstate 10. Business Improvement Tax Fund (Fund 118) The revenue source for this fund were business improvement taxes, which can only be used to benefit local businesses. The underlying tax has been eliminated so the residual balance in this fund has been declining and the fund will eventually be closed. Charter PEG (Fund 205) Charter Communications awarded the City a $150,000 Public Education Grant for a number of years. Due to changes in communications rules, no additional grant revenue is being received. The money remaining in this fund can only be used to make capital expenditures related to the City’s Public Access Channel. Citywide Maintenance District (Fund 188) This is the City’s most significant special assessment fund. Revenue for the fund comes from annual special benefit assessments from property owners who benefit from covered improvements. The Citywide Assessment District provides the majority of funding for the City’s street lighting system and street tree program. Coastal Sage and Scrub Community Facilities District (Fund 183) This community facilities district was formed to provide for the restoration and
11
ongoing maintenance of sensitive environmental habitat within the development area of a former landfill including habitat for endangered species such as the California gnatcatcher (Polioptila californica). Community Development Block Grant (Fund 131, 225) This fund accounts for activities of the Community Development Block Grant received from the U.S. Department of Housing and Urban Development, including monies received from this agency as part of the federal stimulus program. COPS/SLESF (Fund 155) This fund accounts for grant revenue provided by the state to support Community Oriented Policing programs. Funds must be spent on front-line law enforcement services. CRV / Litter Removal Grant (Fund 158) The California Redemption Value/Litter Removal Grant provides funds derived from consumer deposits on beverage containers. These funds are to be used for beverage container recycling and litter cleanup activities. Drug Enforcement Rebate (Funds 116 and 117) Drug Enforcement Rebate (DER) revenues are received based on the City’s participation in drug-related asset seizures. Funds are received from federal and state agencies. These funds are restricted to uses that enhance the police department’s activities. Fee and Charge (Fund 111) This fund applies to recreation services programs in which an individual must pay a registration fee in order to enroll in a recreation class, program or activity (e.g., child care, sports, arts, crafts and tiny tots).
Fire Training Fund (Fund 219) This fund accounts for fire training programs. Gasoline Tax (Fund 124) This fund accounts for State Gas Tax monies received under various state laws. The funds are used to fund the City’s street maintenance program. Activities include ongoing minor street repairs, upgrades of traffic signals, replacement and installation of new traffic signs, and street painting. Programs are administered through the public works department. Inmate Welfare (Fund 150) This fund accounts for revenues from items sold to inmates. The revenues are used to enhance inmate welfare. Integrated Waste Management (Fund 120) This fund is used to account for the City’s waste management efforts on non-AB939 programs. Funding comes from the residential trash hauler per the operating agreement. I.S.T.E.A./T-21 (Fund 140) The Intermodal Surface Transportation Efficiency Act of 1992 (ISTEA) is the Federal Highway Program. This fund accounts for federal money received for use in improving certain major streets. Caltrans and the Federal Highway Administration must approve projects. Maintenance District Funds (Fund 18x) The City levies special benefit assessments and property taxes upon property within defined districts. Through the Los Angeles County Tax Collector, assessments are placed on the property owner’s annual tax bill. These funds are used to maintain and improve the open spaces within the districts by providing landscape maintenance. Assessment districts currently established in
12

the City include: Maintenance District #1 (Fund 181) Maintenance District #2 (Fund 182) Maintenance District #4 (Fund 184) Maintenance District #6 (Fund 186) Maintenance District #7 (Fund 187) Measure R (Fund 224) Under Measure R, the City receives a portion of a ½ cent sales tax levied in Los Angeles County to provide transportation related projects and programs. The City uses Measure R Funds to provide a variety of transportation services including Dial-A-Ride, the West Covina Shuttle (a fixed route system), bus pass subsidies and recreational transit services. North Azusa Relinquishment Fund (Fund 215) This fund accounts for monies received from the State as a result of the relinquishment to the City of a certain portion of North Azusa Avenue. Police Special Programs Funds These funds come from federal or state grants to provide funding for various public safety programs. Bullet Proof Vest Grant (Fund 195) Traffic Safety grants (Funds 195 and 207) Justice Assistance grant (Fund 208) U.S. Dept of Justice (COPS) grant (Fund 214) Homeland Security Grants (Funds 219 and 227) Recovery Byrne Grant (Fund 228)
Police Special Programs Fund This fund accounts for donations received and expenditures related to various police programs. Police Donations (Fund 127) Police Private Grants (Fund 221) Proposition A (Fund 121) Under Proposition A, the City receives a portion of the ½ cent of sales tax levied in Los Angeles County to provide transportation-related programs and projects. In recent years, the City has sold its Prop A funds to other cities in exchange for non-restricted General Fund dollars. Proposition C (Fund 122) Under Proposition C, the City receives a portion of an additional ½ cent sales tax approved for transportation-related programs in Los Angeles County. The funds may be used for certain capital projects or transportation projects similar to those allowed under Proposition A. Projects include street rehabilitation and reconstruction, traffic monitoring systems, congestion management and planning, bus shelter maintenance, and Park-and-Ride lots. Public Safety Augmentation (Fund 153) This fund accounts for the permanent extension of the sales tax by ½ cent guaranteed under Proposition 172. These revenues are restricted to the enhancement of public safety services. Revenue is allocated based on each qualified county’s proportionate share of statewide taxable sales.
13
Senior Meals Program (Fund 146) This program provides meals to low-income seniors with funding from the United States Department of Agriculture and Area Agency on Aging. The program also receives donations from seniors for the meals served.
Sewer Maintenance (Fund 189) This fund supports the City’s street sweeping program and maintenance of the City’s sewer system. The City also provides services to the City of Covina through this fund.
Summer Meals Program (Fund 159) This fund comes from the Food and Nutrition Service (FNS) of the United States Department of Agriculture which provides for the free lunch to children on weekdays during the summer months.
Traffic Safety (Fund 123) This fund receives revenue from two citation sources: 1) moving traffic violations within the city limits and 2) parking violations. These resources are used to support the City’s Traffic Enforcement Program to fund certain traffic engineering costs and capital improvements such as traffic signals.
Transportation Development Act (Fund 128) Transportation Development Act Funds are received through the County and may only be used for specific transportation development purposes. These funds are generally used by the City for sidewalk rehabilitation and construction and the long-term transportation planning efforts within the city.
Tree Fund (Fund 144) This fund accumulates funds restricted for use in urban forestation projects.
Used Oil Block Grant (Fund 149) This grant is a three-year grant awarded solely to the City of West Covina. The California Integrated Waste Management Board (CIWMB) provides grant funds to cities to promote used motor oil recycling.
The environmental management division in the public works department oversees the use of these funds in used oil recycling programs. These grant funds are used to certify used oil collection centers and purchase promotional items to publicize and educate the community about used oil recycling.
Waste Management Enforcement Grant (Fund 145) This fund accounts for the money received from the State of California to help support the local enforcement agent monitor the local closed landfill.
WC Community Services Foundation Fund (Fund 220) This fund is used to account for activity of the West Covina Community Services Foundation, a 501(c)(3) non-profit organization.
14

CAPITAL PROJECT FUND TYPE This fund type is used for funds that are either restricted to, or designated for capital projects. The City has established the following Capital Project Funds: Construction Tax (Fund 161) The Construction Tax Fund receives monies from developers based on the construction of dwelling units in the city. These funds are then used to purchase or construct public facilities, such as street reconstruction, traffic signal modifications, curb and gutter replacements, and rehabilitation of park structures and equipment. Park Dedication Fees (Fund 17x) The City receives fees from developers to fund recreation facilities. The city has been divided into seven park districts. Staff has historically used the funds from developers for recreational facilities within the same district as the development that generated the fees. If desired, the City Council can direct staff to use Park Dedication Fees for qualified recreational purposes anywhere in the city. The following Districts have been established: Fund 170 Park District “A” Fund 171 Park District “B” Fund 172 Park District “C” Fund 173 Park District “D” Fund 174 Park District “E” Fund 175 Park District “F” Fund 176 Park District “G” Fund 177 Park District “H” Parks (Fund 163) This fund accounts for park-related revenue, such as franchise fees received from park-related activities. Capital Projects (Fund 160) This fund provides funding for capital needs within the city. The fund was established by the City Council to serve as the source of
capital funding for projects that have no other funding source. DEBT SERVICE FUND TYPE Debt Service Fund – City (Fund 300) The City has established one Debt Service Fund to accumulate assets for the repayment of City long-term debt, which includes outstanding bonds, notes, capital leases and tax revenue anticipation notes, and related costs. Funding is accumulated from interest income, developer reimbursements, and transfers from the General Fund and the Successor Agency.
PROPRIETARY FUND TYPES Proprietary Fund Types use the full accrual basis of accounting and operate as if they were private businesses. There are two categories of Proprietary Fund Types: 1) Internal Service Funds that provide services to departments within the City and 2) Enterprise Funds that provide services to other governmental and non-governmental entities, including individuals and businesses. The City has established the following proprietary funds: Internal Service Funds: Fleet Management (Fund 365) The maintenance division of the public works department operates the fleet management function for the City. Fleet management oversees the purchase, use, repair, and disposal of City vehicles and heavy equipment. Revenue for the fleet management fund is generated through charges to operating departments. Each department that operates assigned vehicles is charged based on the departmental usage of the vehicles, including depreciation costs. Fleet
15

management costs are reflected in each department’s line-item budget. Retiree Lump Sum Benefits (Fund 368) This fund was established to set aside lump sum benefits for retiring employees. Self-Insurance - Uninsured Loss (Fund 360) & Self-Insurance - General and Auto Liability (Fund 361) Self-Insurance - Workers’ Compensation (Fund 363) Insurance coverage is administered through the City’s risk management department. Funding for general/auto liability claims and uninsured losses is provided through a set charge per full-time employee and assessed on all operating departments. Funding for workers’ compensation is derived from a percentage charge of all salaries with different rates levied for the various employee categories. Vehicle Replacement (Fund 367) The City put surplus funds into this fund for the replacement of vehicles to update the fleet and save on maintenance costs. Enterprise Funds: Enterprise funds account for business type activities of a government entity. Police Enterprise (Fund 375) This fund accounts for the computer services provided by the police department to other public safety agencies for a fee. The programs are marketed to both public and private agencies. The program also provides these products and services to the West Covina Police Department.
Successor Agency to the City of West Covina Redevelopment
Agency Funds SA Redevelopment Obligation Retirement Fund (Fund 810) The City’s Redevelopment Agency was dissolved as a result of the passage of ABIX 26, and the Successor Agency was subsequently created for the purposes of winding down the affairs of the former Redevelopment Agency. The responsibilities of the successor agency are to (1) continue to make payments on the outstanding debt of the former Redevelopment Agency for items that are deemed to be “enforceable obligations”, and (2) wind down the activities of the Redevelopment Agency through the sale and disposition of assets and properties. The Successor Agency will receive allocations of property tax increment in amounts determined by the State Department of Finance and deposited into the Redevelopment Property Tax Trust Fund (RPTTF) by the county. Those RPTTF allocations will then be used to pay the enforceable obligations. SA Administrative Budget (Fund 815) This fund is for all allowable administrative expenses of the Successor Agency, including salaries and benefits, legal costs, appraisals, consultants, and other administration and overhead charges as well as support costs incurred for the Oversight Board. The Successor Agency receives an annual amount equal to 3% of the RPTTF allocation approved for payment of enforceable obligations.
16
SA Community Facilities District (Fund 853) This fund was established as part of the Fashion Plaza Expansion Project of the former Redevelopment Agency for the purpose of issuing bonds to assist in the expansion of the leasable square footage and parking facilities of a regional shopping mall. The fund collects revenues from a special tax assessment on the property, as well as sales and property tax increment revenues generated on the property. Those revenues are used to service the principal and interest payments, and related costs of the outstanding bonds.
Housing Successor Agency to the West Covina Redevelopment
Agency (West Covina Community Development Commission Housing
Authority)
Housing Successor Agency (Fund 820) Under ABXI 26, the housing functions were transferred to the West Covina Community Development Commission Housing Authority with the adoption of Resolution No. 2012-11 adopted by the West Covina City Council on January 17, 2012. Accordingly, all rights, powers, duties, and obligations related to the housing functions have been assumed by the Housing
Authority and it may enforce affordability covenants and perform related activities pursuant to the applicable provisions of the Community Redevelopment Law. ABIX 26 provides that the non-cash housing assets and obligations of dissolving redevelopment agencies ("RDAs") do not pass to the Successor Agencies formed to wind-down each RDA, but rather to the Housing Successor Agency. As such, decisions regarding such housing assets and obligations are not subject to approval by the Oversight Board of Successor Agency. This fund will accumulate loan repayments from homeowners and multi-family housing developers per agreements that were put in place using low and moderate income housing funds of the former Redevelopment Agency. Those funds, along with repayment of the Supplemental Educational Revenue Augmentation Fund loans that were previously made by the housing fund of the former Redevelopment Agency, will be used to continue to provide low and moderate income housing programs in compliance with state law regarding affordable housing.
17
07/01/13 INTERNALESTIMATED ESTIMATED SERVICE ESTIMATED
FUND REVENUES FUND TRANSFER AVAILABLEFUND#FUND DESCRIPTION BALANCE FY 13-14 CHARGES IN RESOURCES
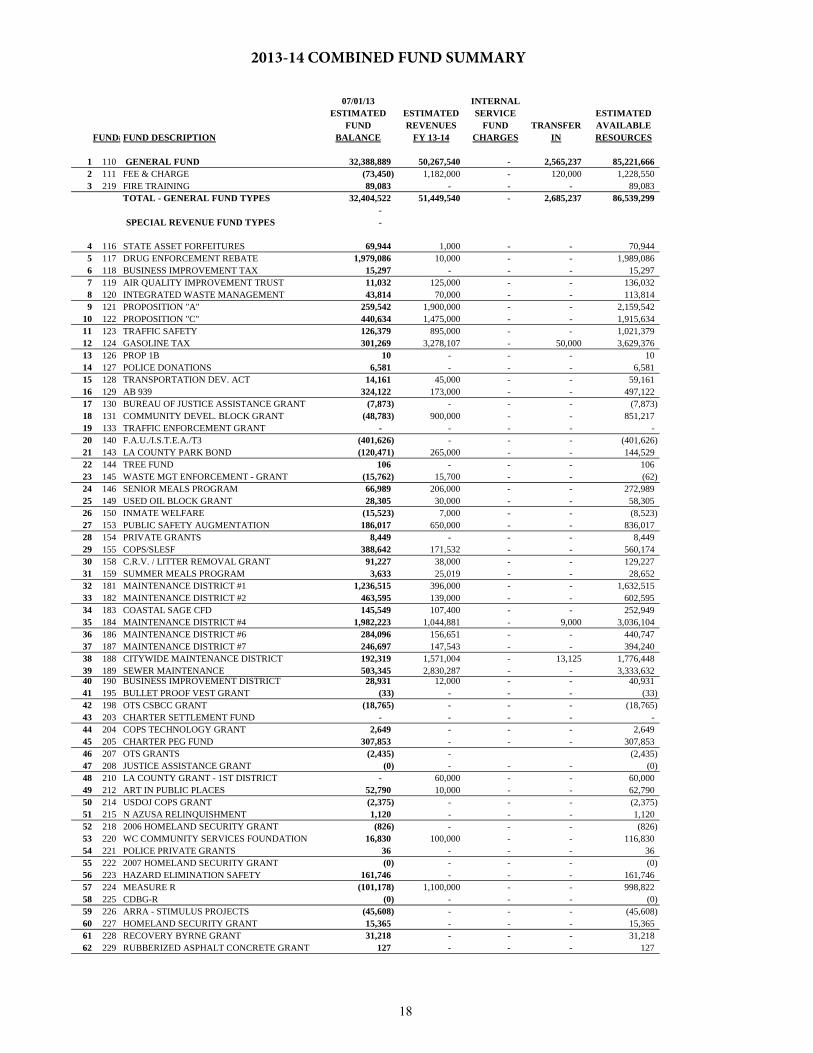
1 110 GENERAL FUND 32,388,889 50,267,540 - 2,565,237 85,221,666 2 111 FEE & CHARGE (73,450) 1,182,000 - 120,000 1,228,550 3 219 FIRE TRAINING 89,083 - - - 89,083
TOTAL - GENERAL FUND TYPES 32,404,522 51,449,540 - 2,685,237 86,539,299 -
SPECIAL REVENUE FUND TYPES -
4 116 STATE ASSET FORFEITURES 69,944 1,000 - - 70,944 5 117 DRUG ENFORCEMENT REBATE 1,979,086 10,000 - - 1,989,086 6 118 BUSINESS IMPROVEMENT TAX 15,297 - - - 15,297 7 119 AIR QUALITY IMPROVEMENT TRUST 11,032 125,000 - - 136,032 8 120 INTEGRATED WASTE MANAGEMENT 43,814 70,000 - - 113,814 9 121 PROPOSITION "A" 259,542 1,900,000 - - 2,159,542
10 122 PROPOSITION "C" 440,634 1,475,000 - - 1,915,634 11 123 TRAFFIC SAFETY 126,379 895,000 - - 1,021,379 12 124 GASOLINE TAX 301,269 3,278,107 - 50,000 3,629,376 13 126 PROP 1B 10 - - - 10 14 127 POLICE DONATIONS 6,581 - - - 6,581 15 128 TRANSPORTATION DEV. ACT 14,161 45,000 - - 59,161 16 129 AB 939 324,122 173,000 - - 497,122 17 130 BUREAU OF JUSTICE ASSISTANCE GRANT (7,873) - - - (7,873) 18 131 COMMUNITY DEVEL. BLOCK GRANT (48,783) 900,000 - - 851,217 19 133 TRAFFIC ENFORCEMENT GRANT - - - - - 20 140 F.A.U./I.S.T.E.A./T3 (401,626) - - - (401,626) 21 143 LA COUNTY PARK BOND (120,471) 265,000 - - 144,529 22 144 TREE FUND 106 - - - 106 23 145 WASTE MGT ENFORCEMENT - GRANT (15,762) 15,700 - - (62) 24 146 SENIOR MEALS PROGRAM 66,989 206,000 - - 272,989 25 149 USED OIL BLOCK GRANT 28,305 30,000 - - 58,305 26 150 INMATE WELFARE (15,523) 7,000 - - (8,523) 27 153 PUBLIC SAFETY AUGMENTATION 186,017 650,000 - - 836,017 28 154 PRIVATE GRANTS 8,449 - - - 8,449 29 155 COPS/SLESF 388,642 171,532 - - 560,174 30 158 C.R.V. / LITTER REMOVAL GRANT 91,227 38,000 - - 129,227 31 159 SUMMER MEALS PROGRAM 3,633 25,019 - - 28,652 32 181 MAINTENANCE DISTRICT #1 1,236,515 396,000 - - 1,632,515 33 182 MAINTENANCE DISTRICT #2 463,595 139,000 - - 602,595 34 183 COASTAL SAGE CFD 145,549 107,400 - - 252,949 35 184 MAINTENANCE DISTRICT #4 1,982,223 1,044,881 - 9,000 3,036,104 36 186 MAINTENANCE DISTRICT #6 284,096 156,651 - - 440,747 37 187 MAINTENANCE DISTRICT #7 246,697 147,543 - - 394,240 38 188 CITYWIDE MAINTENANCE DISTRICT 192,319 1,571,004 - 13,125 1,776,448 39 189 SEWER MAINTENANCE 503,345 2,830,287 - - 3,333,632 40 190 BUSINESS IMPROVEMENT DISTRICT 28,931 12,000 - - 40,931 41 195 BULLET PROOF VEST GRANT (33) - - - (33) 42 198 OTS CSBCC GRANT (18,765) - - - (18,765) 43 203 CHARTER SETTLEMENT FUND - - - - - 44 204 COPS TECHNOLOGY GRANT 2,649 - - - 2,649 45 205 CHARTER PEG FUND 307,853 - - - 307,853 46 207 OTS GRANTS (2,435) - (2,435) 47 208 JUSTICE ASSISTANCE GRANT (0) - - - (0) 48 210 LA COUNTY GRANT - 1ST DISTRICT - 60,000 - - 60,000 49 212 ART IN PUBLIC PLACES 52,790 10,000 - - 62,790 50 214 USDOJ COPS GRANT (2,375) - - - (2,375) 51 215 N AZUSA RELINQUISHMENT 1,120 - - - 1,120 52 218 2006 HOMELAND SECURITY GRANT (826) - - - (826) 53 220 WC COMMUNITY SERVICES FOUNDATION 16,830 100,000 - - 116,830 54 221 POLICE PRIVATE GRANTS 36 - - - 36 55 222 2007 HOMELAND SECURITY GRANT (0) - - - (0) 56 223 HAZARD ELIMINATION SAFETY 161,746 - - - 161,746 57 224 MEASURE R (101,178) 1,100,000 - - 998,822 58 225 CDBG-R (0) - - - (0) 59 226 ARRA - STIMULUS PROJECTS (45,608) - - - (45,608) 60 227 HOMELAND SECURITY GRANT 15,365 - - - 15,365 61 228 RECOVERY BYRNE GRANT 31,218 - - - 31,218 62 229 RUBBERIZED ASPHALT CONCRETE GRANT 127 - - - 127
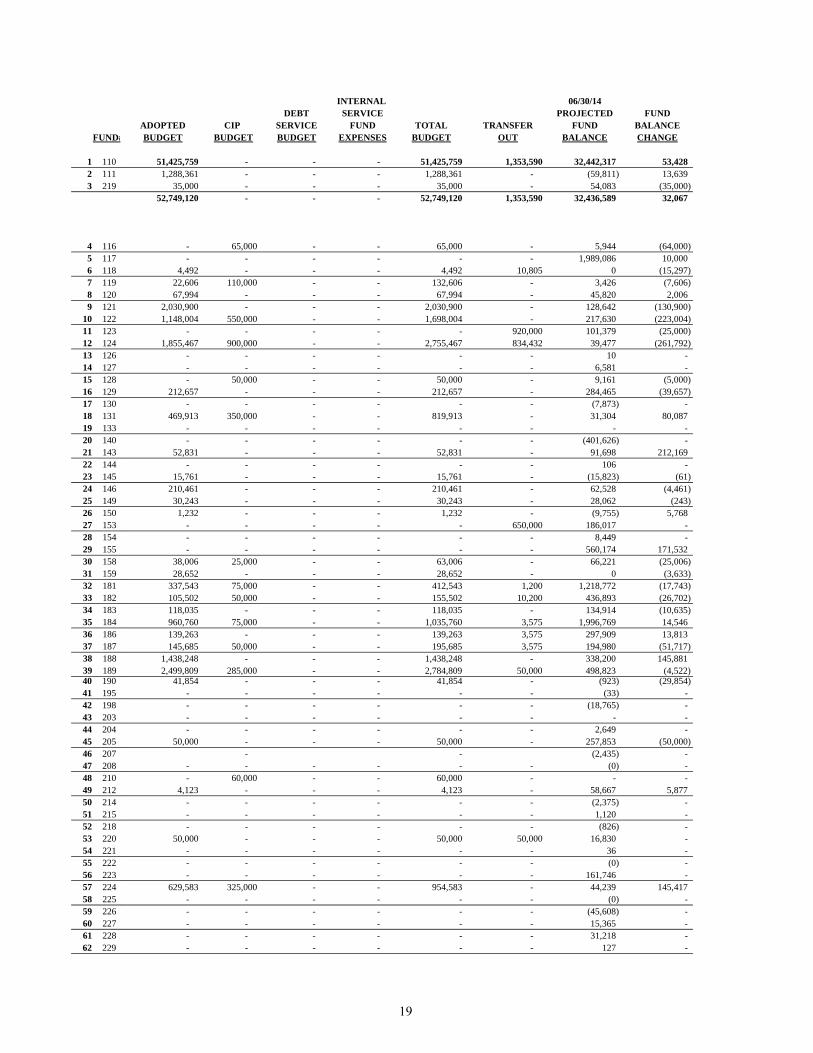
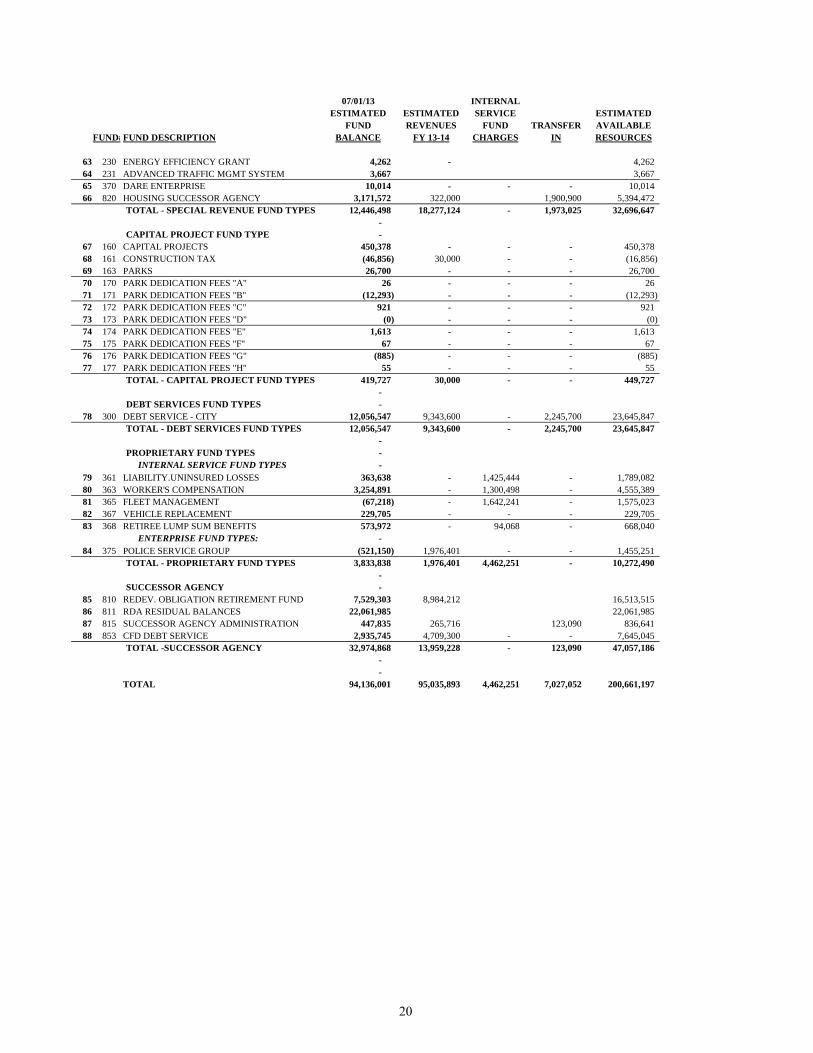
2013-14 COMBINED FUND SUMMARY
18
FUND#
1 110 2 111 3 219
4 116 5 117 6 118 7 119 8 120 9 121
10 122 11 123 12 124 13 126 14 127 15 128 16 129 17 130 18 131 19 133 20 140 21 143 22 144 23 145 24 146 25 149 26 150 27 153 28 154 29 155 30 158 31 159 32 181 33 182 34 183 35 184 36 186 37 187 38 188 39 189 40 190 41 195 42 198 43 203 44 204 45 205 46 207 47 208 48 210 49 212 50 214 51 215 52 218 53 220 54 221 55 222 56 223 57 224 58 225 59 226 60 227 61 228 62 229
INTERNAL 06/30/14DEBT SERVICE PROJECTED FUND
ADOPTED CIP SERVICE FUND TOTAL TRANSFER FUND BALANCEBUDGET BUDGET BUDGET EXPENSES BUDGET OUT BALANCE CHANGE
51,425,759 - - - 51,425,759 1,353,590 32,442,317 53,428 1,288,361 - - - 1,288,361 - (59,811) 13,639
35,000 - - - 35,000 - 54,083 (35,000) 52,749,120 - - - 52,749,120 1,353,590 32,436,589 32,067
- 65,000 - - 65,000 - 5,944 (64,000) - - - - - - 1,989,086 10,000
4,492 - - - 4,492 10,805 0 (15,297) 22,606 110,000 - - 132,606 - 3,426 (7,606) 67,994 - - - 67,994 - 45,820 2,006
2,030,900 - - - 2,030,900 - 128,642 (130,900) 1,148,004 550,000 - - 1,698,004 - 217,630 (223,004)
- - - - - 920,000 101,379 (25,000) 1,855,467 900,000 - - 2,755,467 834,432 39,477 (261,792)
- - - - - - 10 - - - - - - - 6,581 - - 50,000 - - 50,000 - 9,161 (5,000)
212,657 - - - 212,657 - 284,465 (39,657) - - - - - - (7,873) -
469,913 350,000 - - 819,913 - 31,304 80,087 - - - - - - - - - - - - - - (401,626) -
52,831 - - - 52,831 - 91,698 212,169 - - - - - - 106 -
15,761 - - - 15,761 - (15,823) (61) 210,461 - - - 210,461 - 62,528 (4,461) 30,243 - - - 30,243 - 28,062 (243)
1,232 - - - 1,232 - (9,755) 5,768 - - - - - 650,000 186,017 - - - - - - - 8,449 - - - - - - - 560,174 171,532
38,006 25,000 - - 63,006 - 66,221 (25,006) 28,652 - - - 28,652 - 0 (3,633)
337,543 75,000 - - 412,543 1,200 1,218,772 (17,743) 105,502 50,000 - - 155,502 10,200 436,893 (26,702) 118,035 - - - 118,035 - 134,914 (10,635) 960,760 75,000 - - 1,035,760 3,575 1,996,769 14,546 139,263 - - - 139,263 3,575 297,909 13,813 145,685 50,000 - - 195,685 3,575 194,980 (51,717)
1,438,248 - - - 1,438,248 - 338,200 145,881 2,499,809 285,000 - - 2,784,809 50,000 498,823 (4,522)
41,854 - - - 41,854 - (923) (29,854) - - - - - - (33) - - - - - - - (18,765) - - - - - - - - - - - - - - - 2,649 -
50,000 - - - 50,000 - 257,853 (50,000) - - (2,435) -
- - - - - - (0) - - 60,000 - - 60,000 - - -
4,123 - - - 4,123 - 58,667 5,877 - - - - - - (2,375) - - - - - - - 1,120 - - - - - - - (826) -
50,000 - - - 50,000 50,000 16,830 - - - - - - - 36 - - - - - - - (0) - - - - - - - 161,746 -
629,583 325,000 - - 954,583 - 44,239 145,417 - - - - - - (0) - - - - - - - (45,608) - - - - - - - 15,365 - - - - - - - 31,218 - - - - - - - 127 -
19
07/01/13 INTERNALESTIMATED ESTIMATED SERVICE ESTIMATED
FUND REVENUES FUND TRANSFER AVAILABLEFUND#FUND DESCRIPTION BALANCE FY 13-14 CHARGES IN RESOURCES
63 230 ENERGY EFFICIENCY GRANT 4,262 - 4,262 64 231 ADVANCED TRAFFIC MGMT SYSTEM 3,667 3,667 65 370 DARE ENTERPRISE 10,014 - - - 10,014 66 820 HOUSING SUCCESSOR AGENCY 3,171,572 322,000 1,900,900 5,394,472
TOTAL - SPECIAL REVENUE FUND TYPES 12,446,498 18,277,124 - 1,973,025 32,696,647 -
CAPITAL PROJECT FUND TYPE - 67 160 CAPITAL PROJECTS 450,378 - - - 450,378 68 161 CONSTRUCTION TAX (46,856) 30,000 - - (16,856) 69 163 PARKS 26,700 - - - 26,700 70 170 PARK DEDICATION FEES "A" 26 - - - 26 71 171 PARK DEDICATION FEES "B" (12,293) - - - (12,293) 72 172 PARK DEDICATION FEES "C" 921 - - - 921 73 173 PARK DEDICATION FEES "D" (0) - - - (0) 74 174 PARK DEDICATION FEES "E" 1,613 - - - 1,613 75 175 PARK DEDICATION FEES "F" 67 - - - 67 76 176 PARK DEDICATION FEES "G" (885) - - - (885) 77 177 PARK DEDICATION FEES "H" 55 - - - 55
TOTAL - CAPITAL PROJECT FUND TYPES 419,727 30,000 - - 449,727 -
DEBT SERVICES FUND TYPES - 78 300 DEBT SERVICE - CITY 12,056,547 9,343,600 - 2,245,700 23,645,847
TOTAL - DEBT SERVICES FUND TYPES 12,056,547 9,343,600 - 2,245,700 23,645,847 -
PROPRIETARY FUND TYPES - INTERNAL SERVICE FUND TYPES -
79 361 LIABILITY.UNINSURED LOSSES 363,638 - 1,425,444 - 1,789,082 80 363 WORKER'S COMPENSATION 3,254,891 - 1,300,498 - 4,555,389 81 365 FLEET MANAGEMENT (67,218) - 1,642,241 - 1,575,023 82 367 VEHICLE REPLACEMENT 229,705 - - - 229,705 83 368 RETIREE LUMP SUM BENEFITS 573,972 - 94,068 - 668,040
ENTERPRISE FUND TYPES: - 84 375 POLICE SERVICE GROUP (521,150) 1,976,401 - - 1,455,251
TOTAL - PROPRIETARY FUND TYPES 3,833,838 1,976,401 4,462,251 - 10,272,490 -
SUCCESSOR AGENCY - 85 810 REDEV. OBLIGATION RETIREMENT FUND 7,529,303 8,984,212 16,513,515 86 811 RDA RESIDUAL BALANCES 22,061,985 22,061,985 87 815 SUCCESSOR AGENCY ADMINISTRATION 447,835 265,716 123,090 836,641 88 853 CFD DEBT SERVICE 2,935,745 4,709,300 - - 7,645,045
TOTAL -SUCCESSOR AGENCY 32,974,868 13,959,228 - 123,090 47,057,186 - -
TOTAL 94,136,001 95,035,893 4,462,251 7,027,052 200,661,197
20

FUND#
63 230 64 231 65 370 66 820
67 160 68 161 69 163 70 170 71 171 72 172 73 173 74 174 75 175 76 176 77 177
78 300
79 361 80 363 81 365 82 367 83 368
84 375
85 810 86 811 87 815 88 853
INTERNAL 06/30/14DEBT SERVICE PROJECTED FUND
ADOPTED CIP SERVICE FUND TOTAL TRANSFER FUND BALANCEBUDGET BUDGET BUDGET EXPENSES BUDGET OUT BALANCE CHANGE
- 4,262 - - 3,667 -
- - - - - - 10,014 - 635,016 - - - 635,016 - 4,759,456 1,587,884
13,344,640 2,970,000 - - 16,314,640 2,537,362 13,844,645 1,398,147
- - - - - - 450,378 - 5,000 - - - 5,000 - (21,856) 25,000
- - - - - - 26,700 - - - - - - - 26 - - - - - - - (12,293) - - - - - - - 921 - - - - - - - (0) - - - - - - - 1,613 - - - - - - - 67 - - - - - - - (885) - - - - - - - 55 -
5,000 - - - 5,000 - 444,727 25,000
- - 11,904,320 - 11,904,320 - 11,741,527 (315,020) - - 11,904,320 - 11,904,320 - 11,741,527 (315,020)
- - - 1,324,300 1,324,300 - 464,782 101,144 - - - 1,334,211 1,334,211 - 3,221,178 (33,713) - - - 1,639,315 1,639,315 - (64,292) 2,926 - 90,000 - - 90,000 - 139,705 (90,000) - - - 37,800 37,800 - 630,240 56,268
- 1,637,461 - - - 1,637,461 100,000 (282,210) 238,940 1,637,461 90,000 - 4,335,626 6,063,087 100,000 4,109,403 275,565
2,355,028 - 5,236,200 - 7,591,228 3,036,100 5,886,187 (1,643,116) - - 22,061,985 -
392,993 - - - 392,993 - 443,648 (4,187) 25,000 - 4,635,900 - 4,660,900 - 2,984,145 48,400
2,773,021 - 9,872,100 - 12,645,121 3,036,100 31,375,965 (1,598,903)
70,509,242 3,060,000 21,776,420 4,335,626 99,681,288 7,027,052 93,952,857 (183,144)
21

2010 2011 2012 2013 2014FUND# FUND DESCRIPTION Actuals Actuals Actuals Estimated Adopted
110 GENERAL FUND 31,567,951 29,542,172 28,670,341 32,388,889 32,442,317 111 FEE & CHARGE (66,269) (50,444) (43,476) (73,450) (59,811) 219 FIRE TRAINING 73,978 121,551 141,105 89,083 54,083
TOTAL - GENERAL FUND TYPES 31,575,660 29,613,279 28,767,970 32,404,522 32,436,589
SPECIAL REVENUE FUNDS116 STATE ASSET FORFEITURES 60,348 66,921 68,744 69,944 5,944 117 DRUG ENFORCEMENT REBATE 518,941 631,249 2,584,990 1,979,086 1,989,086 118 BUSINESS IMPROVEMENT TAX 32,923 31,790 29,639 15,297 -119 AIR QUALITY IMPROVEMENT TRUST 104,136 96,469 209,272 11,032 3,426 120 INTEGRATED WASTE MANAGEMENT 763 13,218 33,694 43,814 45,820 121 PROPOSITION "A" 132,855 207,761 485,442 259,542 128,642 122 PROPOSITION "C" 2,248,890 2,327,707 922,423 440,634 217,630 123 TRAFFIC SAFETY 531,562 290,509 268,760 126,379 101,379 124 GASOLINE TAX 278,158 1,906,248 2,316,785 301,269 39,477 125 TRAFFIC CONGESTION (PROP 42) 397,018 - - - -126 PROP 1B 13,755 9,027 9,076 10 10 127 POLICE DONATIONS 10,362 21,307 23,533 6,581 6,581 128 TRANSPORTATION DEV. ACT (25,210) (32,093) (30,839) 14,161 9,161 129 AB 939 308,910 360,081 319,171 324,122 284,465 130 BUREAU OF JUSTICE ASSISTANCE GRANT - - - (7,873) (7,873)131 COMMUNITY DEVEL. BLOCK GRANT 52,022 (62,067) (48,574) (48,783) 31,304 133 TRAFFIC ENFORCEMENT GRANT - - - - -134 COPS SCHOOL BASED PARTNERSHIP - - - - -135 BJA BLOCK GRANT 97-99 - - - - -136 COP UHP GRANT - - - - -137 EMERGENCY SERVICES FUND - - - - -138 ABC TRAFFIC SAFETY GRANT - - - - -139 FEMA GRANT - - - - -140 F.A.U./I.S.T.E.A./T21 43,233 (119,144) (420,885) (401,626) (401,626) 141 G.R.E.A.T. GRANT - - - - -142 OCJP DOMESTIC VIOLENCE GRANT - - - - -143 LA COUNTY PARK BOND 154,706 27,954 (13,195) (120,471) 91,698 144 TREE FUND 26 1,100 1,106 106 106 145 WASTE MGT ENFORCEMENT - GRANT (15,770) (15,765) (15,760) (15,762) (15,823) 146 SENIOR MEALS PROGRAM 64,622 79,759 64,633 66,989 62,528 147 USED OIL GRANT - - - - -148 SCAQMD ELEC. VEH. CORRIDOR GRANT - - - - -149 USED OIL BLOCK GRANT (12,652) 10,538 29,140 28,305 28,062 150 INMATE WELFARE (107) (6,010) (15,291) (15,523) (9,755)151 COPS/MORE - - - - -152 BKK COMMUNITY - - - - -153 PUBLIC SAFETY AUGMENTATION 55,944 83,660 136,017 186,017 186,017 154 PRIVATE GRANTS 8,325 8,384 8,429 8,449 8,449 155 COPS/SLES 206,824 190,901 348,548 388,642 560,174 157 ELECTRIC VEHICLE AQMD - - - - -158 C.R.V. / LITTER REMOVAL GRANT 56,263 70,590 88,985 91,227 66,221 159 SUMMER MEALS PROGRAM (1,037) 64 6,551 3,633 -169 STATE PARK BOND GRANT - - - - -181 MAINTENANCE DISTRICT #1 1,183,121 1,244,996 1,276,394 1,236,515 1,218,772 182 MAINTENANCE DISTRICT #2 447,340 431,794 460,983 463,595 436,893 183 WEST COVINA COASTAL SAGE & SCRUB CFD 93,065 117,326 157,086 145,549 134,914 184 MAINTENANCE DISTRICT #4 1,650,044 1,820,740 1,949,742 1,982,223 1,996,769 186 MAINTENANCE DISTRICT #6 161,795 216,656 263,014 284,096 297,909 187 MAINTENANCE DISTRICT #7 243,974 253,809 256,557 246,697 194,980 188 CITYWIDE MAINTENANCE DISTRICT (81,904) (2,403) 79,092 192,319 338,200 189 SEWER MAINTENANCE 12,874 200,505 474,683 503,345 498,823 190 BUSINESS IMPROVEMENT DISTRICT 37,284 38,933 58,615 28,931 (923)192 BJA LLEBG 2004 - - - - -193 BJA LLEBG 2000-2002 - - - - -194 OCPJ CLETEP GRANT - - - - -195 BULLET PROOF VEST GRANT (4,609) (33) (33) (33) (33)196 STATE DOMESTIC PREP EQUIP GRANT - - - - -197 COPS/SRO GRANT - - - - -198 OTS CSBCC GRANT (29,471) (18,765) (18,765) (18,765) (18,765) 199 TRANSPORTATION (PROP A) GRANT - - - - -201 BJA LLEBG 2003 - - - - -202 COPS HOMELAND SECURITY OT PRGM - - - - -203 CHARTER SETTLEMENT FUND 21,692 - - - -204 COPS TECHNOLOGY GRANT 2,617 2,635 2,649 2,649 2,649 205 CHARTER PEG FUND 416,942 411,625 382,253 307,853 257,853 206 2004 HOMELAND SECURITY GRANT - - - - -207 OTS GRANTS - (2,346) (211) (2,435) (2,435)208 JUSTICE ASSISTANCE GRANT 31,128 2,981 (6,491) - -209 RIVERS & WATER CONSERVATION - - - - -210 LA COUNTY 5TH DISTRICT GRANT - - - - -211 LAND & WATER CONSERVATION - - - - -212 ART IN PUBLIC PLACES 57,359 80,002 93,669 52,790 58,667
FUND BALANCE
22

2010 2011 2012 2013 2014FUND# FUND DESCRIPTION Actuals Actuals Actuals Estimated Adopted
213 STATE HOMELAND SECURITY GRANT - - - - -214 USDOJ COPS GRANT (12,784) (1,805) (7,953) (2,375) (2,375)215 N AZUSA RELINQUISHMENT 411,299 408,385 410,576 1,120 1,120 216 SAFE ROUTES TO SCHOOLS GRANT - - - - -217 BUFFER ZONE PROTECTION PROGRAM - - - - -218 2006 HOMELAND SECURITY GRANT (826) (826) (826) (826) (826)220 WC COMMUNITY SERVICES FOUNDATION 45,052 71,937 107,189 16,830 16,830 221 POLICE PRIVATE GRANTS 10,473 8,116 8,829 36 36 222 2007 HOMELAND SECURITY GRANT - - - - -223 HAZARD ELIMINATION SAFETY GRANT (66,078) (8,643) (8,643) 161,746 161,746 224 MEASURE R 554,409 919,981 532,380 (101,178) 44,239 225 CDBG-R (5,522) (17,012) (15,337) - -226 ARRA - STIMULUS PROJECTS 44,730 219,779 94,289 (45,608) (45,608) 227 HOMELAND SECURITY GRANT (123,839) (280,066) - 15,365 15,365 228 RECOVERY BRYNE GRANT (17,251) (33,726) 86 31,218 31,218 229 RUBBERIZED ASPHALT CONCRETE GRANT - 23,717 127 127 127 230 ENERGY EFFICIENCY GRANT (57) (20,732) 4,262 4,262 231 ADVANCED TRAFFIC MGMT SYSTEM - - 653,295 3,667 3,667 370 DARE 9,870 9,941 9,994 10,014 10,014 820 SUCCESSOR HOUSING AGENCY 2,307,501 3,171,572 4,759,456
TOTAL-SPECIAL REVENUE FUND TYPES 10,318,594 12,318,334 16,910,406 12,446,500 13,844,647
CAPITAL PROJECT FUND TYPES160 CAPITAL PROJECTS 1,356,922 1,300,258 1,156,254 450,378 450,378 161 CONSTRUCTION TAX 225,923 197,812 17,216 (46,856) (21,856) 163 PARKS 149,570 149,570 114,073 26,700 26,700 170 PDF A - DEL NORTE 15,043 8,128 26 26 26 171 PDF B - PALM VIEW 26,245 6,428 (8,187) (12,293) (12,293) 172 PDF C - ORANGEWOOD - CA 131,510 125,304 91,430 921 921 173 PDF D - WALMERADO-CAM 577 81 - - -174 PDF E - CORTEZ 39,199 32,872 5,022 1,613 1,613 175 PDF F - GALSTER-WDGROV-CAM 14,917 15,024 67 67 67 176 PDF G - SHADOW OAK/GING/SHAKESPEARE 172,816 129,336 2,445 (885) (885)177 PDF H - FRIENDSHIP 275 132 55 55 55
TOTAL- CAPITAL PROJECT FUND TYPES 2,132,997 1,964,945 1,378,401 419,726 444,726
DEBT SERVICE FUND TYPES300 DEBT SRVICE- CITY 2,592,778 16,144,442 11,909,022 12,056,547 11,741,527
TOTAL - DEBT SERVICE FUND TYPES 2,592,778 16,144,442 11,909,022 12,056,547 11,741,527
PROPRIETARY FUND TYPES INERNAL SERVICE FUND TYPES
360 SELF-INSURANCE-- UNINSURED LOSS - - - - -361 SELF-INSURANCE -GEN/AUTO LIABILITY 3,490,762 2,753,014 978,643 363,638 464,782 363 SELF-INSURANCE-- WORKERS COMPENSATION 3,738,426 3,291,008 2,754,683 3,254,891 3,221,178 365 FLEET MANAGEMENT (207,417) (4,710) (51,122) (67,218) (64,292) 367 VEHICLE REPLACEMENT 432,275 227,783 229,305 229,705 139,705 368 RETIREE LUMP SUM BENEFIT 429,463 481,132 488,137 573,972 630,240
ENTERPRISE SERVICE FUND TYPES375 POLICE ENTERPRISE (885,602) (787,339) (848,830) (521,150) (282,210)
TOTAL - PROPRIETARY FUND TYPES 6,997,907 5,960,888 3,550,816 3,833,838 4,109,403
SUCCESSOR AGENCY810 REDEV. OBLIGATION RETIREMENT FUND - - 6,504,469 7,529,303 5,886,187 811 RDA RESIDUAL BALANCES - - 23,951,951 22,061,985 22,061,985 815 SUCCESSOR AGENCY ADMINISTRATION - - 212,093 447,835 443,648 853 CFD DEBT SERVICE - - 2,972,745 2,935,745 2,984,145
- - 33,641,258 32,974,868 31,375,965
COMMUNITY DEVELOPMENT COMMISSION CDC CAPITAL PROJECT FUND TYPES
862 HOUSING SET ASIDE 8,061,730 4,753,663 - - -863 H.O.M.E. PROGRAM - - - - -876 MERGED PROJ AREA CAPITAL PROJECT 3,549,187 2,757,640 - - -877 CITYWIDE PROJ AREA CAPITAL PROJECT 2,692,421 2,494,837 - - -
CDC DEBT SERVICE FUNDS -853 CFD DEBT SERVICE 2,670,447 2,915,792 - - -882 MERGED PROJ AREA DEBT SERVICE 4,218,021 6,120,462 - - -883 CITYWIDE PROJ AREA DEBT SERVICE 908,334 408,832 - - -
TOTAL- CDC 22,100,140 19,451,226 - - -
GRAND TOTAL 75,718,076 85,453,114 96,157,873 94,136,001 93,952,857
23
2010 2011 2012 2013 2014FUND# FUND DESCRIPTION Actuals Actuals Actuals Estimated Adopted
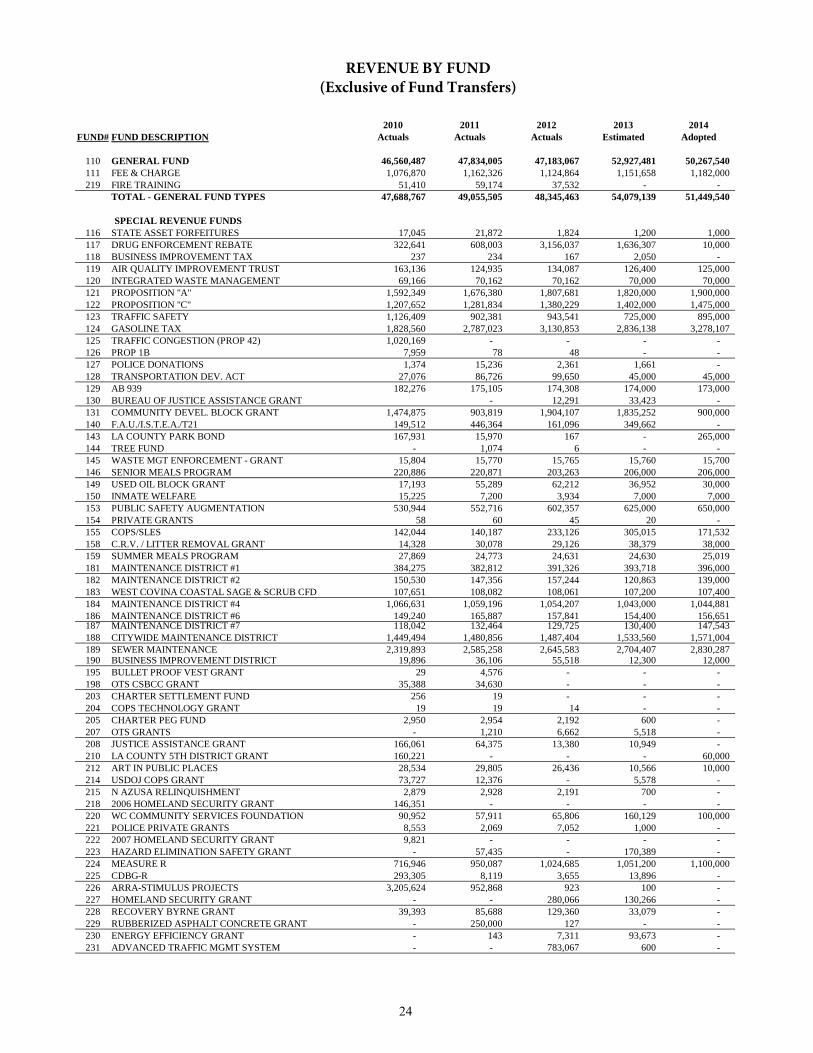
110 GENERAL FUND 46,560,487 47,834,005 47,183,067 52,927,481 50,267,540 111 FEE & CHARGE 1,076,870 1,162,326 1,124,864 1,151,658 1,182,000 219 FIRE TRAINING 51,410 59,174 37,532 - -
TOTAL - GENERAL FUND TYPES 47,688,767 49,055,505 48,345,463 54,079,139 51,449,540
SPECIAL REVENUE FUNDS116 STATE ASSET FORFEITURES 17,045 21,872 1,824 1,200 1,000 117 DRUG ENFORCEMENT REBATE 322,641 608,003 3,156,037 1,636,307 10,000 118 BUSINESS IMPROVEMENT TAX 237 234 167 2,050 - 119 AIR QUALITY IMPROVEMENT TRUST 163,136 124,935 134,087 126,400 125,000 120 INTEGRATED WASTE MANAGEMENT 69,166 70,162 70,162 70,000 70,000 121 PROPOSITION "A" 1,592,349 1,676,380 1,807,681 1,820,000 1,900,000 122 PROPOSITION "C" 1,207,652 1,281,834 1,380,229 1,402,000 1,475,000 123 TRAFFIC SAFETY 1,126,409 902,381 943,541 725,000 895,000 124 GASOLINE TAX 1,828,560 2,787,023 3,130,853 2,836,138 3,278,107 125 TRAFFIC CONGESTION (PROP 42) 1,020,169 - - - - 126 PROP 1B 7,959 78 48 - - 127 POLICE DONATIONS 1,374 15,236 2,361 1,661 - 128 TRANSPORTATION DEV. ACT 27,076 86,726 99,650 45,000 45,000 129 AB 939 182,276 175,105 174,308 174,000 173,000 130 BUREAU OF JUSTICE ASSISTANCE GRANT - 12,291 33,423 - 131 COMMUNITY DEVEL. BLOCK GRANT 1,474,875 903,819 1,904,107 1,835,252 900,000 140 F.A.U./I.S.T.E.A./T21 149,512 446,364 161,096 349,662 - 143 LA COUNTY PARK BOND 167,931 15,970 167 - 265,000 144 TREE FUND - 1,074 6 - - 145 WASTE MGT ENFORCEMENT - GRANT 15,804 15,770 15,765 15,760 15,700 146 SENIOR MEALS PROGRAM 220,886 220,871 203,263 206,000 206,000 149 USED OIL BLOCK GRANT 17,193 55,289 62,212 36,952 30,000 150 INMATE WELFARE 15,225 7,200 3,934 7,000 7,000 153 PUBLIC SAFETY AUGMENTATION 530,944 552,716 602,357 625,000 650,000 154 PRIVATE GRANTS 58 60 45 20 - 155 COPS/SLES 142,044 140,187 233,126 305,015 171,532 158 C.R.V. / LITTER REMOVAL GRANT 14,328 30,078 29,126 38,379 38,000 159 SUMMER MEALS PROGRAM 27,869 24,773 24,631 24,630 25,019 181 MAINTENANCE DISTRICT #1 384,275 382,812 391,326 393,718 396,000 182 MAINTENANCE DISTRICT #2 150,530 147,356 157,244 120,863 139,000 183 WEST COVINA COASTAL SAGE & SCRUB CFD 107,651 108,082 108,061 107,200 107,400 184 MAINTENANCE DISTRICT #4 1,066,631 1,059,196 1,054,207 1,043,000 1,044,881 186 MAINTENANCE DISTRICT #6 149,240 165,887 157,841 154,400 156,651 187 MAINTENANCE DISTRICT #7 118,042 132,464 129,725 130,400 147,543 188 CITYWIDE MAINTENANCE DISTRICT 1,449,494 1,480,856 1,487,404 1,533,560 1,571,004 189 SEWER MAINTENANCE 2,319,893 2,585,258 2,645,583 2,704,407 2,830,287 190 BUSINESS IMPROVEMENT DISTRICT 19,896 36,106 55,518 12,300 12,000 195 BULLET PROOF VEST GRANT 29 4,576 - - - 198 OTS CSBCC GRANT 35,388 34,630 - - - 203 CHARTER SETTLEMENT FUND 256 19 - - - 204 COPS TECHNOLOGY GRANT 19 19 14 - - 205 CHARTER PEG FUND 2,950 2,954 2,192 600 - 207 OTS GRANTS - 1,210 6,662 5,518 - 208 JUSTICE ASSISTANCE GRANT 166,061 64,375 13,380 10,949 - 210 LA COUNTY 5TH DISTRICT GRANT 160,221 - - - 60,000 212 ART IN PUBLIC PLACES 28,534 29,805 26,436 10,566 10,000 214 USDOJ COPS GRANT 73,727 12,376 - 5,578 - 215 N AZUSA RELINQUISHMENT 2,879 2,928 2,191 700 - 218 2006 HOMELAND SECURITY GRANT 146,351 - - - - 220 WC COMMUNITY SERVICES FOUNDATION 90,952 57,911 65,806 160,129 100,000 221 POLICE PRIVATE GRANTS 8,553 2,069 7,052 1,000 - 222 2007 HOMELAND SECURITY GRANT 9,821 - - - - 223 HAZARD ELIMINATION SAFETY GRANT - 57,435 - 170,389 - 224 MEASURE R 716,946 950,087 1,024,685 1,051,200 1,100,000 225 CDBG-R 293,305 8,119 3,655 13,896 - 226 ARRA-STIMULUS PROJECTS 3,205,624 952,868 923 100 - 227 HOMELAND SECURITY GRANT - - 280,066 130,266 - 228 RECOVERY BYRNE GRANT 39,393 85,688 129,360 33,079 - 229 RUBBERIZED ASPHALT CONCRETE GRANT - 250,000 127 - - 230 ENERGY EFFICIENCY GRANT - 143 7,311 93,673 - 231 ADVANCED TRAFFIC MGMT SYSTEM - - 783,067 600 -
REVENUE BY FUND(Exclusive of Fund Transfers)
24
2010 2011 2012 2013 2014FUND# FUND DESCRIPTION Actuals Actuals Actuals Estimated Adopted
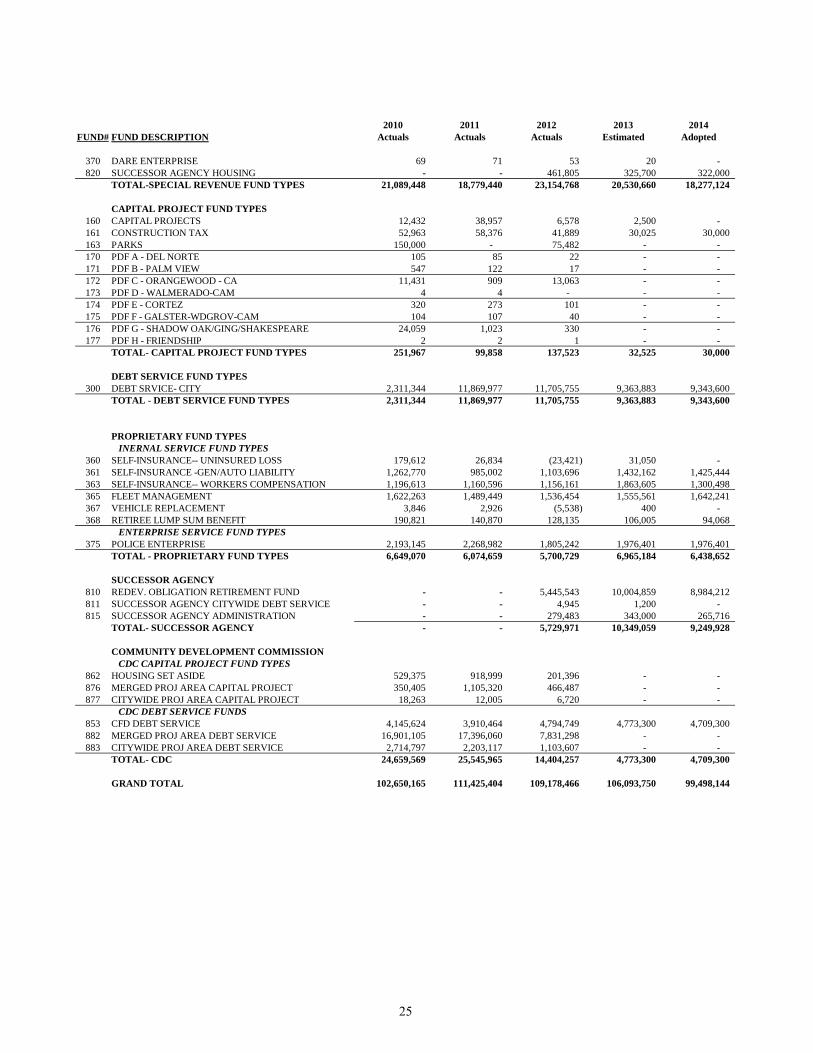
370 DARE ENTERPRISE 69 71 53 20 - 820 SUCCESSOR AGENCY HOUSING - - 461,805 325,700 322,000
TOTAL-SPECIAL REVENUE FUND TYPES 21,089,448 18,779,440 23,154,768 20,530,660 18,277,124
CAPITAL PROJECT FUND TYPES160 CAPITAL PROJECTS 12,432 38,957 6,578 2,500 - 161 CONSTRUCTION TAX 52,963 58,376 41,889 30,025 30,000 163 PARKS 150,000 - 75,482 - - 170 PDF A - DEL NORTE 105 85 22 - - 171 PDF B - PALM VIEW 547 122 17 - - 172 PDF C - ORANGEWOOD - CA 11,431 909 13,063 - - 173 PDF D - WALMERADO-CAM 4 4 - - - 174 PDF E - CORTEZ 320 273 101 - - 175 PDF F - GALSTER-WDGROV-CAM 104 107 40 - - 176 PDF G - SHADOW OAK/GING/SHAKESPEARE 24,059 1,023 330 - - 177 PDF H - FRIENDSHIP 2 2 1 - -
TOTAL- CAPITAL PROJECT FUND TYPES 251,967 99,858 137,523 32,525 30,000
DEBT SERVICE FUND TYPES300 DEBT SRVICE- CITY 2,311,344 11,869,977 11,705,755 9,363,883 9,343,600
TOTAL - DEBT SERVICE FUND TYPES 2,311,344 11,869,977 11,705,755 9,363,883 9,343,600
PROPRIETARY FUND TYPES INERNAL SERVICE FUND TYPES
360 SELF-INSURANCE-- UNINSURED LOSS 179,612 26,834 (23,421) 31,050 - 361 SELF-INSURANCE -GEN/AUTO LIABILITY 1,262,770 985,002 1,103,696 1,432,162 1,425,444 363 SELF-INSURANCE-- WORKERS COMPENSATION 1,196,613 1,160,596 1,156,161 1,863,605 1,300,498 365 FLEET MANAGEMENT 1,622,263 1,489,449 1,536,454 1,555,561 1,642,241 367 VEHICLE REPLACEMENT 3,846 2,926 (5,538) 400 - 368 RETIREE LUMP SUM BENEFIT 190,821 140,870 128,135 106,005 94,068
ENTERPRISE SERVICE FUND TYPES375 POLICE ENTERPRISE 2,193,145 2,268,982 1,805,242 1,976,401 1,976,401
TOTAL - PROPRIETARY FUND TYPES 6,649,070 6,074,659 5,700,729 6,965,184 6,438,652
SUCCESSOR AGENCY810 REDEV. OBLIGATION RETIREMENT FUND - - 5,445,543 10,004,859 8,984,212 811 SUCCESSOR AGENCY CITYWIDE DEBT SERVICE - - 4,945 1,200 - 815 SUCCESSOR AGENCY ADMINISTRATION - - 279,483 343,000 265,716
TOTAL- SUCCESSOR AGENCY - - 5,729,971 10,349,059 9,249,928
COMMUNITY DEVELOPMENT COMMISSION CDC CAPITAL PROJECT FUND TYPES
862 HOUSING SET ASIDE 529,375 918,999 201,396 - - 876 MERGED PROJ AREA CAPITAL PROJECT 350,405 1,105,320 466,487 - - 877 CITYWIDE PROJ AREA CAPITAL PROJECT 18,263 12,005 6,720 - -
CDC DEBT SERVICE FUNDS853 CFD DEBT SERVICE 4,145,624 3,910,464 4,794,749 4,773,300 4,709,300 882 MERGED PROJ AREA DEBT SERVICE 16,901,105 17,396,060 7,831,298 - - 883 CITYWIDE PROJ AREA DEBT SERVICE 2,714,797 2,203,117 1,103,607 - -
TOTAL- CDC 24,659,569 25,545,965 14,404,257 4,773,300 4,709,300
GRAND TOTAL 102,650,165 111,425,404 109,178,466 106,093,750 99,498,144
25
2010 2011 2012 2013 2014FUND# FUND DESCRIPTION Actuals Actuals Actuals Estimated Adopted
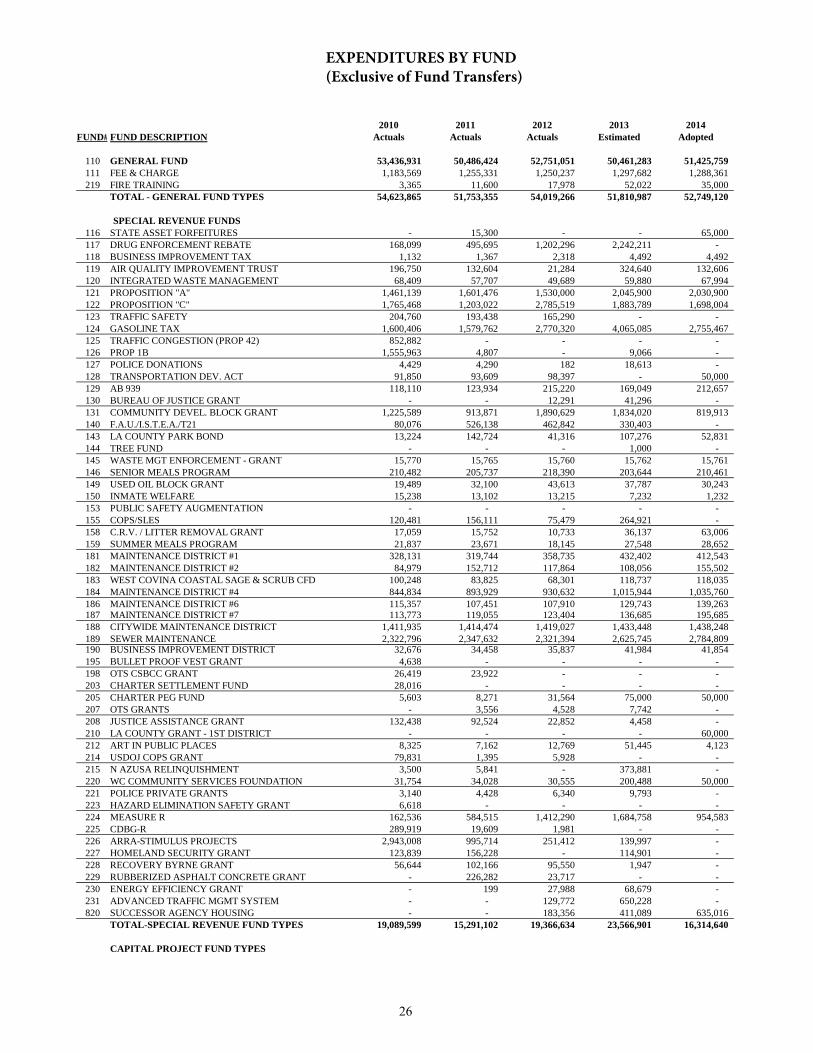
110 GENERAL FUND 53,436,931 50,486,424 52,751,051 50,461,283 51,425,759 111 FEE & CHARGE 1,183,569 1,255,331 1,250,237 1,297,682 1,288,361 219 FIRE TRAINING 3,365 11,600 17,978 52,022 35,000
TOTAL - GENERAL FUND TYPES 54,623,865 51,753,355 54,019,266 51,810,987 52,749,120
SPECIAL REVENUE FUNDS116 STATE ASSET FORFEITURES - 15,300 - - 65,000 117 DRUG ENFORCEMENT REBATE 168,099 495,695 1,202,296 2,242,211 - 118 BUSINESS IMPROVEMENT TAX 1,132 1,367 2,318 4,492 4,492 119 AIR QUALITY IMPROVEMENT TRUST 196,750 132,604 21,284 324,640 132,606 120 INTEGRATED WASTE MANAGEMENT 68,409 57,707 49,689 59,880 67,994 121 PROPOSITION "A" 1,461,139 1,601,476 1,530,000 2,045,900 2,030,900 122 PROPOSITION "C" 1,765,468 1,203,022 2,785,519 1,883,789 1,698,004 123 TRAFFIC SAFETY 204,760 193,438 165,290 - - 124 GASOLINE TAX 1,600,406 1,579,762 2,770,320 4,065,085 2,755,467 125 TRAFFIC CONGESTION (PROP 42) 852,882 - - - - 126 PROP 1B 1,555,963 4,807 - 9,066 - 127 POLICE DONATIONS 4,429 4,290 182 18,613 - 128 TRANSPORTATION DEV. ACT 91,850 93,609 98,397 - 50,000 129 AB 939 118,110 123,934 215,220 169,049 212,657 130 BUREAU OF JUSTICE GRANT - - 12,291 41,296 - 131 COMMUNITY DEVEL. BLOCK GRANT 1,225,589 913,871 1,890,629 1,834,020 819,913 140 F.A.U./I.S.T.E.A./T21 80,076 526,138 462,842 330,403 - 143 LA COUNTY PARK BOND 13,224 142,724 41,316 107,276 52,831 144 TREE FUND - - - 1,000 - 145 WASTE MGT ENFORCEMENT - GRANT 15,770 15,765 15,760 15,762 15,761 146 SENIOR MEALS PROGRAM 210,482 205,737 218,390 203,644 210,461 149 USED OIL BLOCK GRANT 19,489 32,100 43,613 37,787 30,243 150 INMATE WELFARE 15,238 13,102 13,215 7,232 1,232 153 PUBLIC SAFETY AUGMENTATION - - - - - 155 COPS/SLES 120,481 156,111 75,479 264,921 - 158 C.R.V. / LITTER REMOVAL GRANT 17,059 15,752 10,733 36,137 63,006 159 SUMMER MEALS PROGRAM 21,837 23,671 18,145 27,548 28,652 181 MAINTENANCE DISTRICT #1 328,131 319,744 358,735 432,402 412,543 182 MAINTENANCE DISTRICT #2 84,979 152,712 117,864 108,056 155,502 183 WEST COVINA COASTAL SAGE & SCRUB CFD 100,248 83,825 68,301 118,737 118,035 184 MAINTENANCE DISTRICT #4 844,834 893,929 930,632 1,015,944 1,035,760 186 MAINTENANCE DISTRICT #6 115,357 107,451 107,910 129,743 139,263 187 MAINTENANCE DISTRICT #7 113,773 119,055 123,404 136,685 195,685 188 CITYWIDE MAINTENANCE DISTRICT 1,411,935 1,414,474 1,419,027 1,433,448 1,438,248 189 SEWER MAINTENANCE 2,322,796 2,347,632 2,321,394 2,625,745 2,784,809 190 BUSINESS IMPROVEMENT DISTRICT 32,676 34,458 35,837 41,984 41,854 195 BULLET PROOF VEST GRANT 4,638 - - - - 198 OTS CSBCC GRANT 26,419 23,922 - - - 203 CHARTER SETTLEMENT FUND 28,016 - - - - 205 CHARTER PEG FUND 5,603 8,271 31,564 75,000 50,000 207 OTS GRANTS - 3,556 4,528 7,742 - 208 JUSTICE ASSISTANCE GRANT 132,438 92,524 22,852 4,458 - 210 LA COUNTY GRANT - 1ST DISTRICT - - - - 60,000 212 ART IN PUBLIC PLACES 8,325 7,162 12,769 51,445 4,123 214 USDOJ COPS GRANT 79,831 1,395 5,928 - - 215 N AZUSA RELINQUISHMENT 3,500 5,841 - 373,881 - 220 WC COMMUNITY SERVICES FOUNDATION 31,754 34,028 30,555 200,488 50,000 221 POLICE PRIVATE GRANTS 3,140 4,428 6,340 9,793 - 223 HAZARD ELIMINATION SAFETY GRANT 6,618 - - - - 224 MEASURE R 162,536 584,515 1,412,290 1,684,758 954,583 225 CDBG-R 289,919 19,609 1,981 - - 226 ARRA-STIMULUS PROJECTS 2,943,008 995,714 251,412 139,997 - 227 HOMELAND SECURITY GRANT 123,839 156,228 - 114,901 - 228 RECOVERY BYRNE GRANT 56,644 102,166 95,550 1,947 - 229 RUBBERIZED ASPHALT CONCRETE GRANT - 226,282 23,717 - - 230 ENERGY EFFICIENCY GRANT - 199 27,988 68,679 - 231 ADVANCED TRAFFIC MGMT SYSTEM - - 129,772 650,228 - 820 SUCCESSOR AGENCY HOUSING - - 183,356 411,089 635,016
TOTAL-SPECIAL REVENUE FUND TYPES 19,089,599 15,291,102 19,366,634 23,566,901 16,314,640
CAPITAL PROJECT FUND TYPES
EXPENDITURES BY FUND (Exclusive of Fund Transfers)
26
2010 2011 2012 2013 2014FUND# FUND DESCRIPTION Actuals Actuals Actuals Estimated Adopted
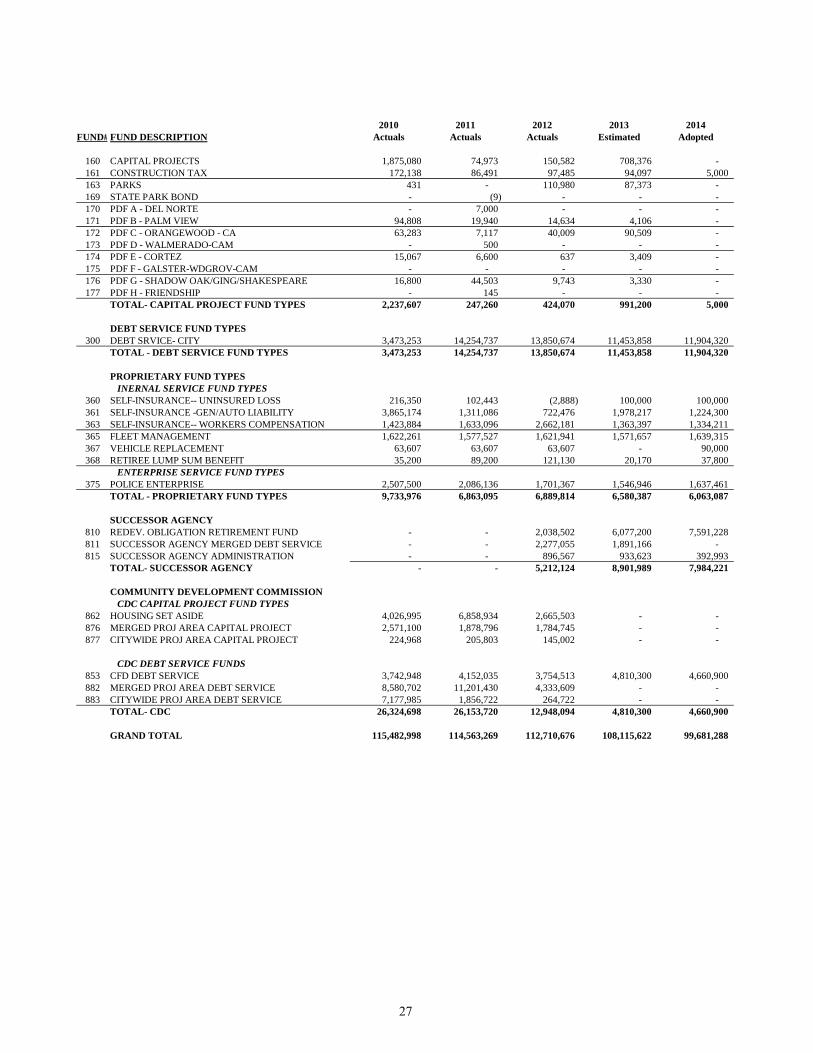
160 CAPITAL PROJECTS 1,875,080 74,973 150,582 708,376 - 161 CONSTRUCTION TAX 172,138 86,491 97,485 94,097 5,000 163 PARKS 431 - 110,980 87,373 - 169 STATE PARK BOND - (9) - - - 170 PDF A - DEL NORTE - 7,000 - - - 171 PDF B - PALM VIEW 94,808 19,940 14,634 4,106 - 172 PDF C - ORANGEWOOD - CA 63,283 7,117 40,009 90,509 - 173 PDF D - WALMERADO-CAM - 500 - - - 174 PDF E - CORTEZ 15,067 6,600 637 3,409 - 175 PDF F - GALSTER-WDGROV-CAM - - - - - 176 PDF G - SHADOW OAK/GING/SHAKESPEARE 16,800 44,503 9,743 3,330 - 177 PDF H - FRIENDSHIP - 145 - - -
TOTAL- CAPITAL PROJECT FUND TYPES 2,237,607 247,260 424,070 991,200 5,000
DEBT SERVICE FUND TYPES300 DEBT SRVICE- CITY 3,473,253 14,254,737 13,850,674 11,453,858 11,904,320
TOTAL - DEBT SERVICE FUND TYPES 3,473,253 14,254,737 13,850,674 11,453,858 11,904,320
PROPRIETARY FUND TYPES INERNAL SERVICE FUND TYPES
360 SELF-INSURANCE-- UNINSURED LOSS 216,350 102,443 (2,888) 100,000 100,000 361 SELF-INSURANCE -GEN/AUTO LIABILITY 3,865,174 1,311,086 722,476 1,978,217 1,224,300 363 SELF-INSURANCE-- WORKERS COMPENSATION 1,423,884 1,633,096 2,662,181 1,363,397 1,334,211 365 FLEET MANAGEMENT 1,622,261 1,577,527 1,621,941 1,571,657 1,639,315 367 VEHICLE REPLACEMENT 63,607 63,607 63,607 - 90,000 368 RETIREE LUMP SUM BENEFIT 35,200 89,200 121,130 20,170 37,800
ENTERPRISE SERVICE FUND TYPES375 POLICE ENTERPRISE 2,507,500 2,086,136 1,701,367 1,546,946 1,637,461
TOTAL - PROPRIETARY FUND TYPES 9,733,976 6,863,095 6,889,814 6,580,387 6,063,087
SUCCESSOR AGENCY810 REDEV. OBLIGATION RETIREMENT FUND - - 2,038,502 6,077,200 7,591,228 811 SUCCESSOR AGENCY MERGED DEBT SERVICE - - 2,277,055 1,891,166 - 815 SUCCESSOR AGENCY ADMINISTRATION - - 896,567 933,623 392,993
TOTAL- SUCCESSOR AGENCY - - 5,212,124 8,901,989 7,984,221
COMMUNITY DEVELOPMENT COMMISSION CDC CAPITAL PROJECT FUND TYPES
862 HOUSING SET ASIDE 4,026,995 6,858,934 2,665,503 - - 876 MERGED PROJ AREA CAPITAL PROJECT 2,571,100 1,878,796 1,784,745 - - 877 CITYWIDE PROJ AREA CAPITAL PROJECT 224,968 205,803 145,002 - -
CDC DEBT SERVICE FUNDS853 CFD DEBT SERVICE 3,742,948 4,152,035 3,754,513 4,810,300 4,660,900 882 MERGED PROJ AREA DEBT SERVICE 8,580,702 11,201,430 4,333,609 - - 883 CITYWIDE PROJ AREA DEBT SERVICE 7,177,985 1,856,722 264,722 - -
TOTAL- CDC 26,324,698 26,153,720 12,948,094 4,810,300 4,660,900
GRAND TOTAL 115,482,998 114,563,269 112,710,676 108,115,622 99,681,288
27
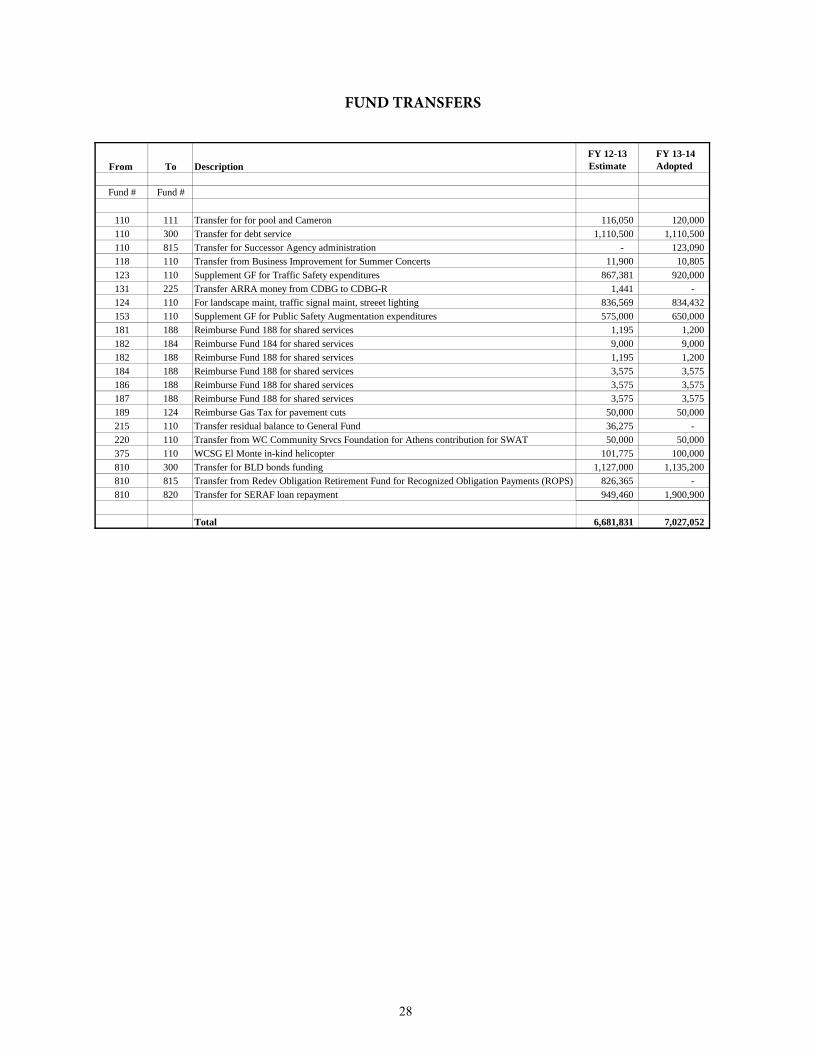
From To DescriptionFY 12-13 Estimate
FY 13-14Adopted
Fund # Fund #
110 111 Transfer for for pool and Cameron 116,050 120,000 110 300 Transfer for debt service 1,110,500 1,110,500 110 815 Transfer for Successor Agency administration - 123,090 118 110 Transfer from Business Improvement for Summer Concerts 11,900 10,805 123 110 Supplement GF for Traffic Safety expenditures 867,381 920,000 131 225 Transfer ARRA money from CDBG to CDBG-R 1,441 - 124 110 For landscape maint, traffic signal maint, streeet lighting 836,569 834,432 153 110 Supplement GF for Public Safety Augmentation expenditures 575,000 650,000 181 188 Reimburse Fund 188 for shared services 1,195 1,200 182 184 Reimburse Fund 184 for shared services 9,000 9,000 182 188 Reimburse Fund 188 for shared services 1,195 1,200 184 188 Reimburse Fund 188 for shared services 3,575 3,575 186 188 Reimburse Fund 188 for shared services 3,575 3,575 187 188 Reimburse Fund 188 for shared services 3,575 3,575 189 124 Reimburse Gas Tax for pavement cuts 50,000 50,000 215 110 Transfer residual balance to General Fund 36,275 - 220 110 Transfer from WC Community Srvcs Foundation for Athens contribution for SWAT 50,000 50,000 375 110 WCSG El Monte in-kind helicopter 101,775 100,000 810 300 Transfer for BLD bonds funding 1,127,000 1,135,200 810 815 Transfer from Redev Obligation Retirement Fund for Recognized Obligation Payments (ROPS) 826,365 - 810 820 Transfer for SERAF loan repayment 949,460 1,900,900
Total 6,681,831 7,027,052
FUND TRANSFERS
28

WORKFORCE SUMMARY
These tables summarize the number of full-time and part-time staff in the City's workforce from FY 11 through FY 14. A full-time position is equivalent to 2,922 hours for fire-sworn personnel and 2,080 hours for all other personnel.
For details of staffing changes over five fiscal years, please refer to the department’s section in this book.
Full-Time Part-Time Full-Time Part-Time Full-Time Part-Time Full-Time Part-Time
Administration 7 0.04 6.5 0.04 6.5 0.04 7.0 0.04 City Clerk 3 0.70 3.0 0.70 3.0 - 3.0 - Finance 1) 19 1.76 19.5 - 15.5 0.46 - - Human Resources/ Risk 1) 4 0.62 3.0 0.62 5.0 - - - Risk Management 2) 3 - 3.0 - - - - - Finance & Administrative Srvcs - - - - - - 22.0 0.46 Planning 6 1.50 6.0 - 5.0 - 5.0 - CDC / Successor Agency 3) 9 2.00 8.0 2.00 2.0 - - - Police Dept 4) 182 20.50 166.0 20.50 153.0 20.50 153.0 20.50 Fire Dept 5) 72 6.80 77.0 0.80 79.0 0.80 70.0 0.80 Public Works 71 4.75 67.0 4.46 60.0 4.46 60.0 4.46 Community Services 12 32.41 12.0 32.41 9.0 32.41 10.0 32.41
Total 388 71.08 371 61.53 338 58.67 330 58.67
1) Reorganization in FY 13-142) Merged with HR in FY 12-133) Moved to Administration in FY 13-14
4) Sworn Police Officers 112 98 90 90 5) Sworn Firefighters 68 74 76 67
FY 13-14FY 12-13Department
FY 11-12FY 10-11
29
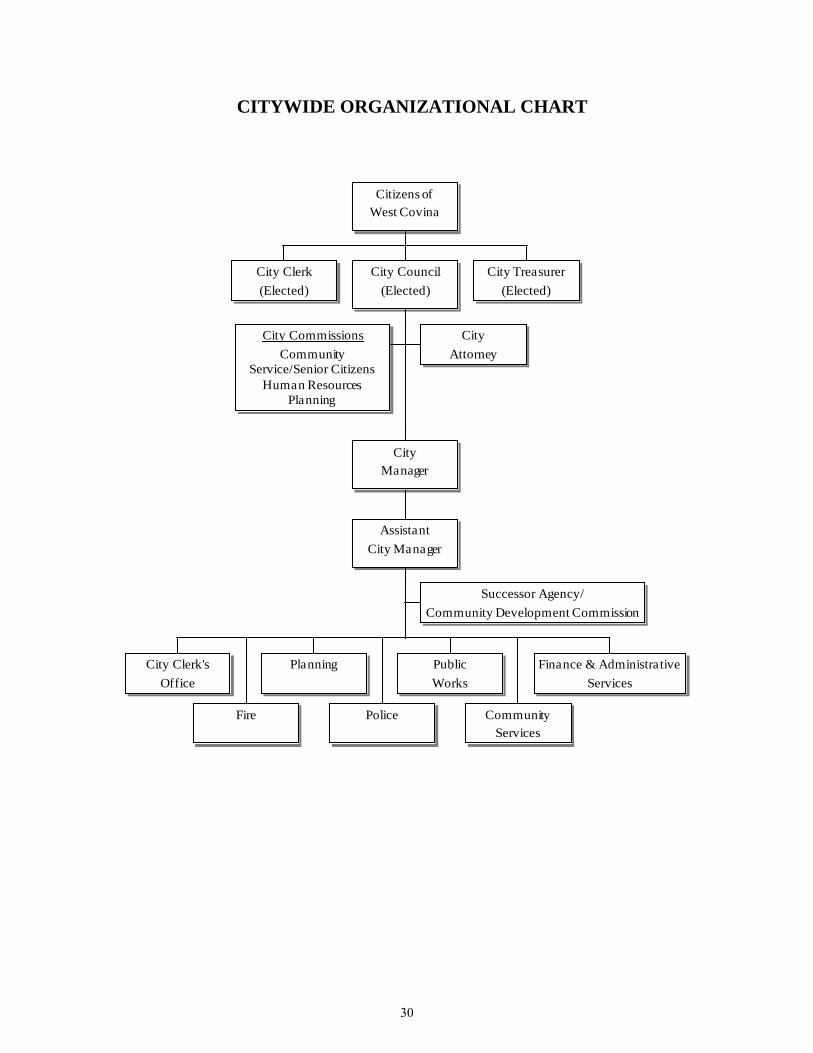
CITYWIDE ORGANIZATIONAL CHART
Citizens ofWest Covina
City Clerk(Elected)
City Council(Elected)
City CommissionsCommunity
Service/Senior CitizensHuman Resources
Planning
CityAttorney
CityManager
AssistantCity Manager
Successor Agency/Community Development Commission
City Clerk'sOffice
Fire
Planning
Police
PublicWorks
CommunityServices
Finance & AdministrativeServices
City Treasurer(Elected)
30
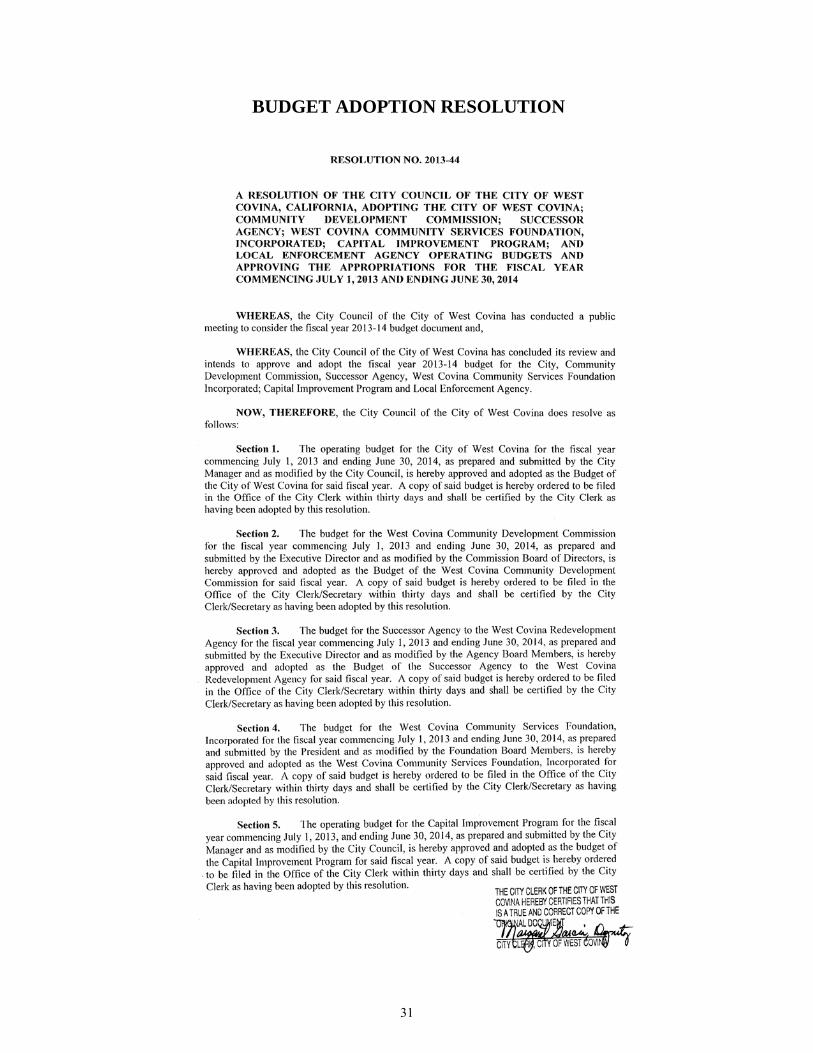
BUDGET ADOPTION RESOLUTION
31

32
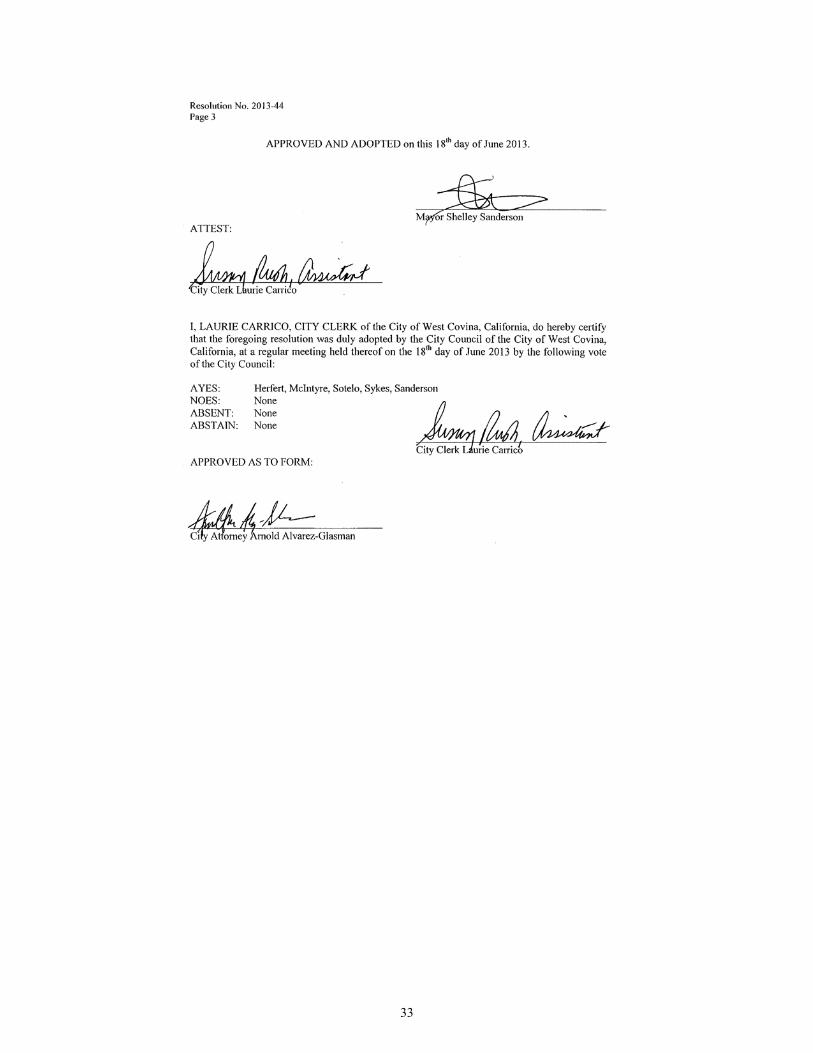
33
APPROPRIATIONS LIMIT RESOLUTION
34
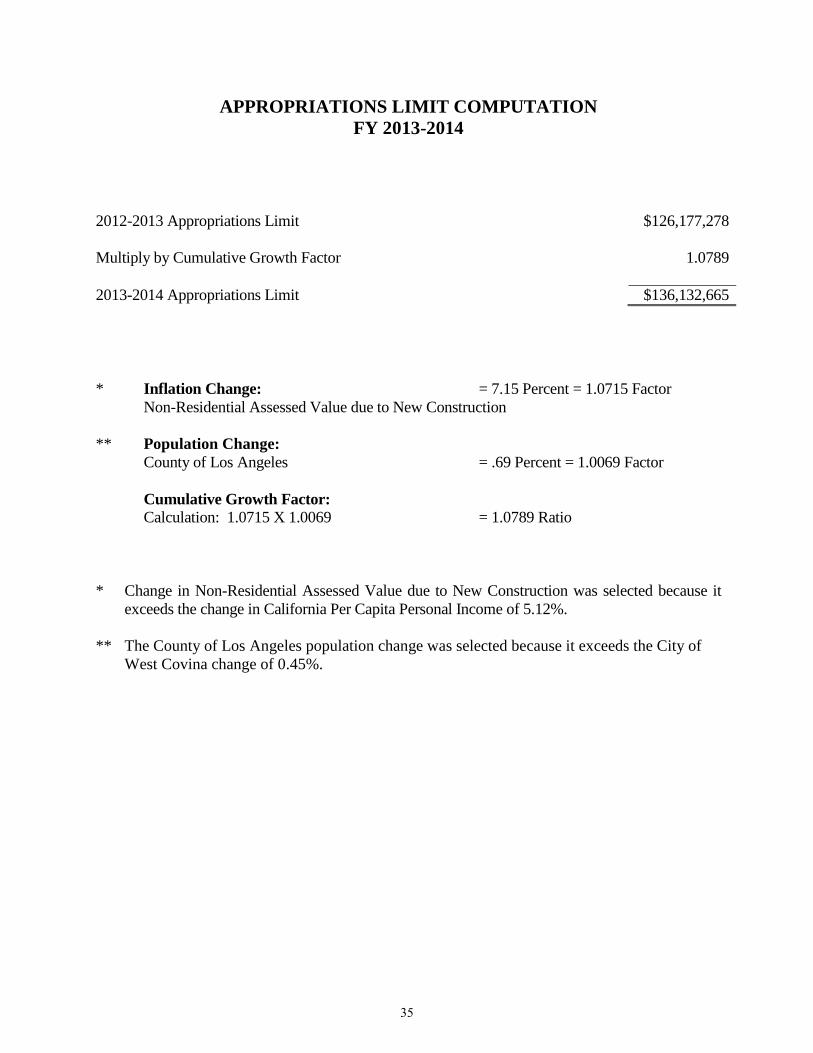
APPROPRIATIONS LIMIT COMPUTATION FY 2013-2014
2012-2013 Appropriations Limit $126,177,278
Multiply by Cumulative Growth Factor 1.0789
2013-2014 Appropriations Limit $136,132,665
* Inflation Change: = 7.15 Percent = 1.0715 Factor Non-Residential Assessed Value due to New Construction
** Population Change:County of Los Angeles = .69 Percent = 1.0069 Factor
Cumulative Growth Factor:Calculation: 1.0715 X 1.0069 = 1.0789 Ratio
* Change in Non-Residential Assessed Value due to New Construction was selected because itexceeds the change in California Per Capita Personal Income of 5.12%.
** The County of Los Angeles population change was selected because it exceeds the City of West Covina change of 0.45%.
35

OPERATING BUDGET CALENDAR 2013-2014
Date Dept. Description
2/4/13 – 2/21/13 Finance Finance completes FY 13 year-end estimates FY 14 preliminary personnel budget.
2/19/2013 Finance 2012-2013 fiscal year mid-year budget update.
1/21/13 - 3/7/13 Finance Finance completes FY 13 year-end estimates and FY 14 preliminary M&O expenditure and revenue budget.
3/11/13 – 3/18/13 Finance Finance prepares FY 13-14 Preliminary budget, Combined Summary, department budget documents .
3/25/2013 Finance Finance provides CIP fund availability to Public Works.
3/25/2013 Finance Preliminary budget distributed to Department Heads
4/1/2013 All CIP requests, suggested funding sources and justifications due to public works analyst.
4/8/11 – 4/30/13 All Departments meet with Finance to review budgets, refine year-end estimates, discuss budget cuts, discuss supplemental budget requests (if any).
4/15/13 –4/23/13 All Departments prepare budget narratives.
4/15/13 - 4/30/13 Finance Finance finalizes Preliminary budget based on department meetings
4/23/2013 Public Works Public works project manager completes final review & cost estimates of CIP.
5/1/13 – 5/30/13 CMO City Manager reviews Preliminary Budget with departments.
5/13/13 Depts & CM Meeting with CM on CIPs
6/1/13 – 6/13/13 CMO / Finance Finalize proposed FY 13-14 budget
6/18/2013 Council 2013-2014 Budget Adopted
36
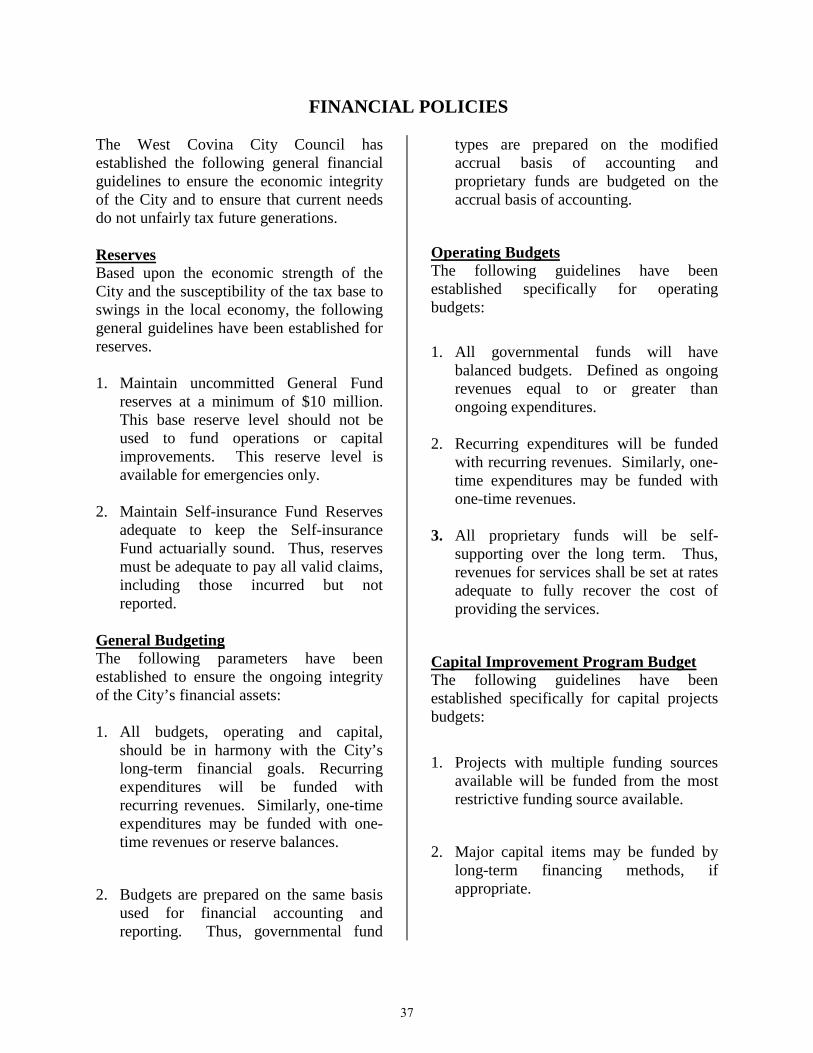
FINANCIAL POLICIES
The West Covina City Council has established the following general financial guidelines to ensure the economic integrity of the City and to ensure that current needs do not unfairly tax future generations.
Reserves Based upon the economic strength of the City and the susceptibility of the tax base to swings in the local economy, the following general guidelines have been established for reserves.
1. Maintain uncommitted General Fundreserves at a minimum of $10 million.This base reserve level should not beused to fund operations or capitalimprovements. This reserve level isavailable for emergencies only.
2. Maintain Self-insurance Fund Reservesadequate to keep the Self-insuranceFund actuarially sound. Thus, reservesmust be adequate to pay all valid claims,including those incurred but notreported.
General Budgeting The following parameters have been established to ensure the ongoing integrity of the City’s financial assets:
1. All budgets, operating and capital,should be in harmony with the City’slong-term financial goals. Recurringexpenditures will be funded withrecurring revenues. Similarly, one-timeexpenditures may be funded with one-time revenues or reserve balances.
2. Budgets are prepared on the same basisused for financial accounting andreporting. Thus, governmental fund
types are prepared on the modified accrual basis of accounting and proprietary funds are budgeted on the accrual basis of accounting.
Operating Budgets The following guidelines have been established specifically for operating budgets:
1. All governmental funds will havebalanced budgets. Defined as ongoingrevenues equal to or greater thanongoing expenditures.
2. Recurring expenditures will be fundedwith recurring revenues. Similarly, one-time expenditures may be funded withone-time revenues.
3. All proprietary funds will be self-supporting over the long term. Thus,revenues for services shall be set at ratesadequate to fully recover the cost ofproviding the services.
Capital Improvement Program Budget The following guidelines have been established specifically for capital projects budgets:
1. Projects with multiple funding sourcesavailable will be funded from the mostrestrictive funding source available.
2. Major capital items may be funded bylong-term financing methods, ifappropriate.
37
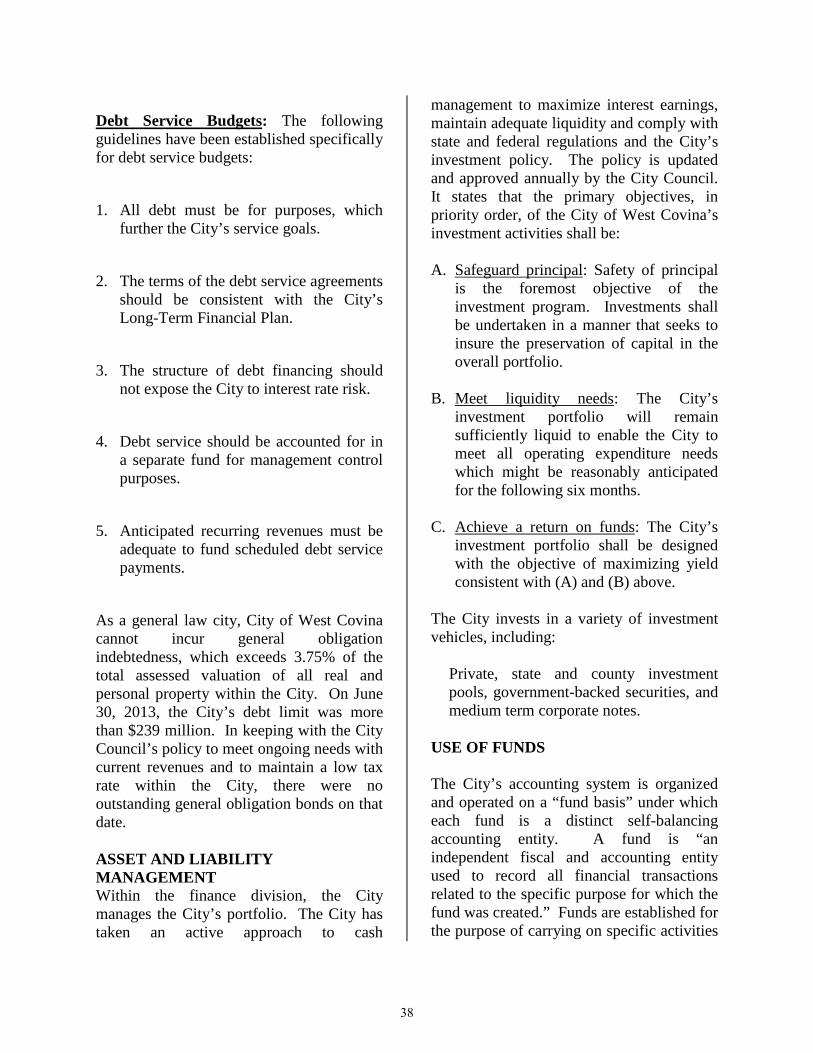
Debt Service Budgets: The following guidelines have been established specifically for debt service budgets:
1. All debt must be for purposes, which
further the City’s service goals.
2. The terms of the debt service agreements
should be consistent with the City’s Long-Term Financial Plan.
3. The structure of debt financing should
not expose the City to interest rate risk.
4. Debt service should be accounted for in
a separate fund for management control purposes.
5. Anticipated recurring revenues must be
adequate to fund scheduled debt service payments.
As a general law city, City of West Covina cannot incur general obligation indebtedness, which exceeds 3.75% of the total assessed valuation of all real and personal property within the City. On June 30, 2013, the City’s debt limit was more than $239 million. In keeping with the City Council’s policy to meet ongoing needs with current revenues and to maintain a low tax rate within the City, there were no outstanding general obligation bonds on that date. ASSET AND LIABILITY MANAGEMENT Within the finance division, the City manages the City’s portfolio. The City has taken an active approach to cash
management to maximize interest earnings, maintain adequate liquidity and comply with state and federal regulations and the City’s investment policy. The policy is updated and approved annually by the City Council. It states that the primary objectives, in priority order, of the City of West Covina’s investment activities shall be: A. Safeguard principal: Safety of principal
is the foremost objective of the investment program. Investments shall be undertaken in a manner that seeks to insure the preservation of capital in the overall portfolio.
B. Meet liquidity needs: The City’s
investment portfolio will remain sufficiently liquid to enable the City to meet all operating expenditure needs which might be reasonably anticipated for the following six months.
C. Achieve a return on funds: The City’s
investment portfolio shall be designed with the objective of maximizing yield consistent with (A) and (B) above.
The City invests in a variety of investment vehicles, including:
Private, state and county investment pools, government-backed securities, and medium term corporate notes.
USE OF FUNDS The City’s accounting system is organized and operated on a “fund basis” under which each fund is a distinct self-balancing accounting entity. A fund is “an independent fiscal and accounting entity used to record all financial transactions related to the specific purpose for which the fund was created.” Funds are established for the purpose of carrying on specific activities
38
or attaining certain objectives in accordance with special regulations, legal restrictions, or limitations. The fund balance is the amount that remains in a fund at the end of the fiscal year after revenues have been received and expenditures have been paid. In the case of restricted special funds, it is not unusual for large one-time capital expenditures to exceed one-year revenues. This is because some of these funds take a number of years to build up a balance adequate to pay for large projects. Differences in fund reporting found in the budget versus financial statements: The budget distinguishes between several
different general fund types designated at various times by the City Council. In the financial statements, these are consolidated into a single fund. The internal services funds are also combined. The financial statements also include trust funds, which are not found in the budget document. These are monies held in trust for an outside party such as developer deposits and are not a part of the budgeting process. FINANCIAL GOALS A discussion of short and long-term financial goals can be found in the budget message.
39
CITYWIDE GOALS In January 2005, the City council identified the citywide goals listed below. Staff was directed to use these goals in setting departmental priorities and developing their own goals during the budget process. While attaining these goals has been much more challenging in recent years as a result of the recession and state action that have eliminated or reduced many of the City’s revenue sources, these goals remain the main focus when preparing City budgets. These goals are identified below: • Balance the Budget
o Implement changes to balance the budget, including promoting economic and redevelopment development to increase revenues and reduction in operational expenses.
• Wind Down the Former Redevelopment
Agency o Continue to prepare semi-annual
Recognized Obligations Payment Schedule to secure funding to pay outstanding obligations of the former Redevelopment Agency.
o Take necessary steps to protect City loans to the former Redevelopment Agency as valid agreements and a necessary source of funds for the City’s General Fund.
o Ensure the proper transfer of real property owned by the former Redevelopment Agency to the appropriate public or private entity.
• Downtown Revitalization
o Explore development options for the downtown corridor, including mixed-use projects.
• Economic Development o Promote economic development
throughout the community to increase needed revenue for the City.
o Assist property owners in re-tenanting the many vacancies left by the recession by ensuring a smooth and efficient entitlement and building inspection process.
• Complete development at the former
BKK Landfill Site o Evaluate potential development
options for the two remaining commercial sites (700/750 pads) located above the Big League Dreams Sports Park.
o Continue to market and evaluate potential projects for the top deck of the landfill and surrounding area that was originally slated for development of an 18-hole public golf course and recreational facility.
• Improve Infrastructure
o Work with CalTrans to mitigate the impacts of the I-10 freeway widening on the community and achieve proper compensation for City/Redevelopment Agency owned property to be taken for this purpose.
o Construct new median, curb and gutter, and street improvements throughout the community.
• Preserve Public Safety
o Secure additional grants to pay for public safety capital and personnel costs.
o Maintain the excellent level of service that residents have come to expect.
40
REVENUE
PROJECTIONS
Assumptions and Trends Revenue projections for the 2013-14 fiscal year are based upon economic forecasts for the area, information supplied by other agencies, City Council policies and direction, and service levels projected by the various departments within the City. The City utilizes information from various outside agencies, such as the Federal Department of the Treasury, State Department of Finance, State Board of Equalization, and the Los Angeles County Assessor’s Office, to predict revenues for entitlements, grants, state subventions, sales tax, and property tax. City staff project fee and charge revenues, including many related to development. Once this general information has been collected, the Finance and Administrative Services Department develops specific estimates for each revenue source by taking into account past performance and expected future events. These assumptions and projections are documented so that they can be evaluated during the year as part of the ongoing fiscal monitoring process. They are modified as needed for the following year’s revenue estimates. During fiscal year 2004-05, the City’s revenue structure changed dramatically due to actions taken at the state level. The first change is the “triple flip” which was adopted as part of the state fiscal recovery bonds approved by California voters in March 2004. Under the triple flip, one quarter of the City’s sales tax revenue is swapped for a like amount of property tax.
The amount of property tax revenues received under this swap is directly tied to sales tax revenues. This swap will remain in place as long as the fiscal recovery bonds are outstanding. The second major change in the revenue structure was the result of an agreement between the state and local governments. It involves the elimination of the backfill portion of the vehicle license fee (VLF) revenues. As with the sales tax swap, the loss of VLF revenues was replaced with a like amount of property tax revenues. This is a permanent shift and changes for this revenue source are now tied to changes in assessed valuation in the City. Elimination of Redevelopment With the elimination of redevelopment in 2012, the City of West Covina’s Successor Agency to the West Covina Redevelopment Agency (Successor Agency) was established to unwind the operations of the former redevelopment agency, as dictated under the redevelopment elimination legislation (ABx1 26 and AB 1484). The Community Development Commission (CDC) provides administrative support to the Successor Agency, which is charged with selling assets, repaying existing indebtedness, completing performance of existing contractual obligations, and otherwise winding down operations and preserving agency assets for the benefit of taxing agencies. The actions of the Successor Agency are regulated by an Oversight Board. The CDC still retains its economic development function to bring tax generating businesses to the City.
41

Major General Fund Revenue Sources Sales Taxes: Sales tax revenues represent 30.0% of General Fund revenues for fiscal year 2013-14. Estimated revenue for fiscal year 2013-14 is projected to complete the year 9.9% higher, or $1,389,000, when compared to the prior year’s projected revenue. The continued moderate growth and the addition of new commercial and retail outlets have been factored into the budget estimate for fiscal year 2013-14. Sales tax revenues will finally reach the prior peak of fiscal year 2006-07. Property Taxes: Property tax revenues represent 38.1% of General Fund revenues for fiscal year 2013-14. Because the previous decline in property taxes was less severe than that of sales taxes, property tax revenues are projected to remain static with less than a 1% increase, after adjusting 2012-13 for the one-time Property Tax Administration Fee (PTAF) settlement. This revenue category includes the City’s share of residual tax increment revenues from the former redevelopment agency in the amount of $750,000. Franchise Taxes: This revenue source includes franchise fees collected on trash, cable television, and utilities operating within the city. These revenues are based on a percentage of gross income of the various companies and are estimated to increase only modestly. Business License Taxes: Business License taxes automatically increase by the consumer price index in January of each year. Business license taxes declined in 2011-12 after years of solid growth due to legislative changes which prevent the City from collecting certain license fees. In 2013-14, this revenue is expected to further decline from the previous year’s level, and remain lower in future years.
Ambulance Service: The City provides ambulance transport service as part of its emergency response service. The majority of the revenues collected for transports are reimbursement from private insurance, Medi-care and Medi-Cal. Ambulance rates are based on the county rate. The revenue fluctuates from year to year based on collection rates of outstanding accounts. The estimate is expected to be the same as in the prior year. Interest Income from Community Development Commission (CDC): One of the major impacts to the City from the elimination of redevelopment agencies was the determination by the State Department of Finance (DOF) that the loans from the City to the Redevelopment Agency are currently invalid. While subsequent legislation included a provision that could make these loans valid in the future, the immediate impact is that these loans ceased to exist as of February 1, 2012. This caused the loss of approximately $800,000 in interest income in 2011-12 and the loss of $1.8 million annually in future years. If the City meets the criteria under the subsequent legislation to have these loans deemed valid in future years, they will have to be restructured to calculate interest at the rate paid by the state Local Agency Investment Fund (LAIF), rather than the higher rates previously paid by the Redevelopment Agency. This repayment would also be limited by a calculation of available growth in future tax increment per the legislation. The City is also considering its legal options against the state regarding the invalidation of loans as previously negotiated between the City and the Redevelopment Agency.
42

Sales Tax Reimbursement Agreement: Another casualty of the elimination of the Redevelopment Agency is the determination by DOF that this Sales Tax Reimbursement Agreement is also invalid. Pursuant to an agreement in 1990, the City has pledged sales tax revenues as security for the Community Facilities District (CFD) bonds used to expand the West Covina Plaza shopping mall. The City annually shifts sales tax revenues to pay debt service on the bonds. The City and the Redevelopment Agency entered into an agreement in which the RDA would reimburse the City for those sales tax amounts used to pay debt service on the CFD bonds. This agreement includes all past payments from sales tax revenues as well as future payments from sales tax revenues. While this is also an agreement that could be considered valid in the future, it has been removed from projected revenues in the 2013-14 fiscal year. The elimination of this revenue source has cost the City in excess of $1.2 million in annual lost revenue. Transient Occupancy Taxes: The City’s hotel tax is at 10%. This revenue source has grown rapidly since it decreased to $647,000 in 2009-10, due to the resurgence in the hospitality market and the addition of a new hotel. Transient Occupancy Tax revenues for 2013-14 are projected to generate $1,250,000.
Proposition A Fund Exchange: The City plans to exchange approximately $2 million Proposition A Transportation funds with other cities in exchange for $1,500,000 in General Fund Revenues as part of the 2013-14 Adopted Budget. This will be the sixth year the City has exchanged these funds, as this revenue source has been used to offset some of the other revenue losses due to the recession and state action. The following table summarizes the major revenue sources in the General Fund by revenue source (exclusive of fund transfers):
REVENUE SOURCE 2013-14 ADOPTED
Property tax $19,625,000 Sales tax 15,425,000 Franchise tax 3,350,000 Business license tax 1,750,000 Ambulance service 1,800,000 Prop A exchanges 1,500,000 Charges for services 2,377,900 Transient occupancy tax 1,250,000 Licenses and permits 940,000 Other revenues 3,431,640 TOTAL REVENUE $51,449,540
The General Fund is the recipient of several inter-fund transfers:
• Fines and forfeitures from the Traffic Safety Fund in the amount of $920,000.
• Revenues from the Gas Tax in the
amount of $834,432 to fund street landscape maintenance, traffic signal maintenance, and street lighting.
43
• Revenues from the Public Safety Augmentation Fund established by the State of California to supplement public safety efforts by local agencies in the amount of $650,000.
• In-kind service revenue from the
West Covina Services Group where they provide services to the City of El Monte in exchange for a like value of helicopter service in the amount of $100,000.
• Other transfers include $50,000 from the West Covina Community Services Foundation for a public safety contribution and $10,805 from the Business Improvement District to support summer concerts.
The following schedule depicts actual revenue information for fiscal years 2009-2010 through 2011-12. Projected revenues for fiscal year 2012-13 and fiscal year 2013-14 are presented for comparison.
44
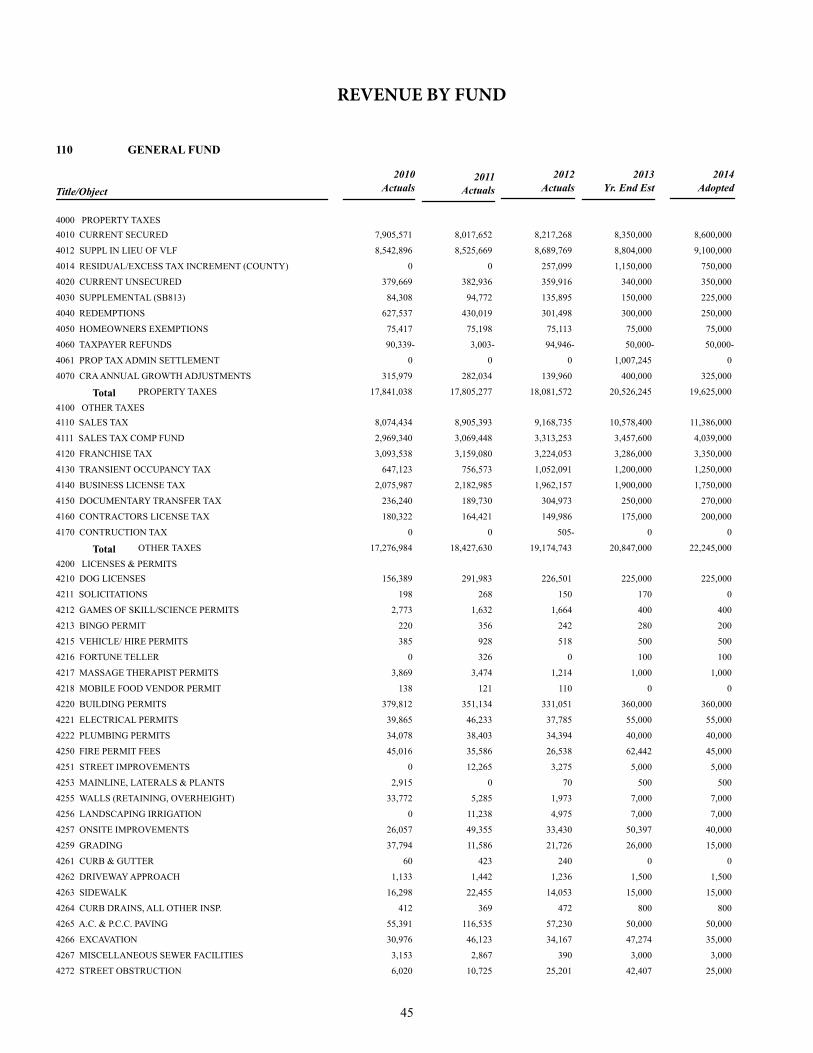
110 GENERAL FUND
2010
ActualsTitle/Object
2013
Yr. End Est
2012
Actuals
2014
Adopted 2011
Actuals
4000 PROPERTY TAXES
4010 CURRENT SECURED 7,905,571 8,017,652 8,217,268 8,350,000 8,600,000
4012 SUPPL IN LIEU OF VLF 8,542,896 8,525,669 8,689,769 8,804,000 9,100,000
4014 RESIDUAL/EXCESS TAX INCREMENT (COUNTY) 0 0 257,099 1,150,000 750,000
4020 CURRENT UNSECURED 379,669 382,936 359,916 340,000 350,000
4030 SUPPLEMENTAL (SB813) 84,308 94,772 135,895 150,000 225,000
4040 REDEMPTIONS 627,537 430,019 301,498 300,000 250,000
4050 HOMEOWNERS EXEMPTIONS 75,417 75,198 75,113 75,000 75,000
4060 TAXPAYER REFUNDS 90,339- 3,003- 94,946- 50,000- 50,000-
4061 PROP TAX ADMIN SETTLEMENT 0 0 0 1,007,245 0
4070 CRA ANNUAL GROWTH ADJUSTMENTS 315,979 282,034 139,960 400,000 325,000
Total 17,841,038 17,805,277 18,081,572 20,526,245 19,625,000 PROPERTY TAXES
4100 OTHER TAXES
4110 SALES TAX 8,074,434 8,905,393 9,168,735 10,578,400 11,386,000
4111 SALES TAX COMP FUND 2,969,340 3,069,448 3,313,253 3,457,600 4,039,000
4120 FRANCHISE TAX 3,093,538 3,159,080 3,224,053 3,286,000 3,350,000
4130 TRANSIENT OCCUPANCY TAX 647,123 756,573 1,052,091 1,200,000 1,250,000
4140 BUSINESS LICENSE TAX 2,075,987 2,182,985 1,962,157 1,900,000 1,750,000
4150 DOCUMENTARY TRANSFER TAX 236,240 189,730 304,973 250,000 270,000
4160 CONTRACTORS LICENSE TAX 180,322 164,421 149,986 175,000 200,000
4170 CONTRUCTION TAX 0 0 505- 0 0
Total 17,276,984 18,427,630 19,174,743 20,847,000 22,245,000 OTHER TAXES
4200 LICENSES & PERMITS
4210 DOG LICENSES 156,389 291,983 226,501 225,000 225,000
4211 SOLICITATIONS 198 268 150 170 0
4212 GAMES OF SKILL/SCIENCE PERMITS 2,773 1,632 1,664 400 400
4213 BINGO PERMIT 220 356 242 280 200
4215 VEHICLE/ HIRE PERMITS 385 928 518 500 500
4216 FORTUNE TELLER 0 326 0 100 100
4217 MASSAGE THERAPIST PERMITS 3,869 3,474 1,214 1,000 1,000
4218 MOBILE FOOD VENDOR PERMIT 138 121 110 0 0
4220 BUILDING PERMITS 379,812 351,134 331,051 360,000 360,000
4221 ELECTRICAL PERMITS 39,865 46,233 37,785 55,000 55,000
4222 PLUMBING PERMITS 34,078 38,403 34,394 40,000 40,000
4250 FIRE PERMIT FEES 45,016 35,586 26,538 62,442 45,000
4251 STREET IMPROVEMENTS 0 12,265 3,275 5,000 5,000
4253 MAINLINE, LATERALS & PLANTS 2,915 0 70 500 500
4255 WALLS (RETAINING, OVERHEIGHT) 33,772 5,285 1,973 7,000 7,000
4256 LANDSCAPING IRRIGATION 0 11,238 4,975 7,000 7,000
4257 ONSITE IMPROVEMENTS 26,057 49,355 33,430 50,397 40,000
4259 GRADING 37,794 11,586 21,726 26,000 15,000
4261 CURB & GUTTER 60 423 240 0 0
4262 DRIVEWAY APPROACH 1,133 1,442 1,236 1,500 1,500
4263 SIDEWALK 16,298 22,455 14,053 15,000 15,000
4264 CURB DRAINS, ALL OTHER INSP. 412 369 472 800 800
4265 A.C. & P.C.C. PAVING 55,391 116,535 57,230 50,000 50,000
4266 EXCAVATION 30,976 46,123 34,167 47,274 35,000
4267 MISCELLANEOUS SEWER FACILITIES 3,153 2,867 390 3,000 3,000
4272 STREET OBSTRUCTION 6,020 10,725 25,201 42,407 25,000
REVENUE BY FUND
45
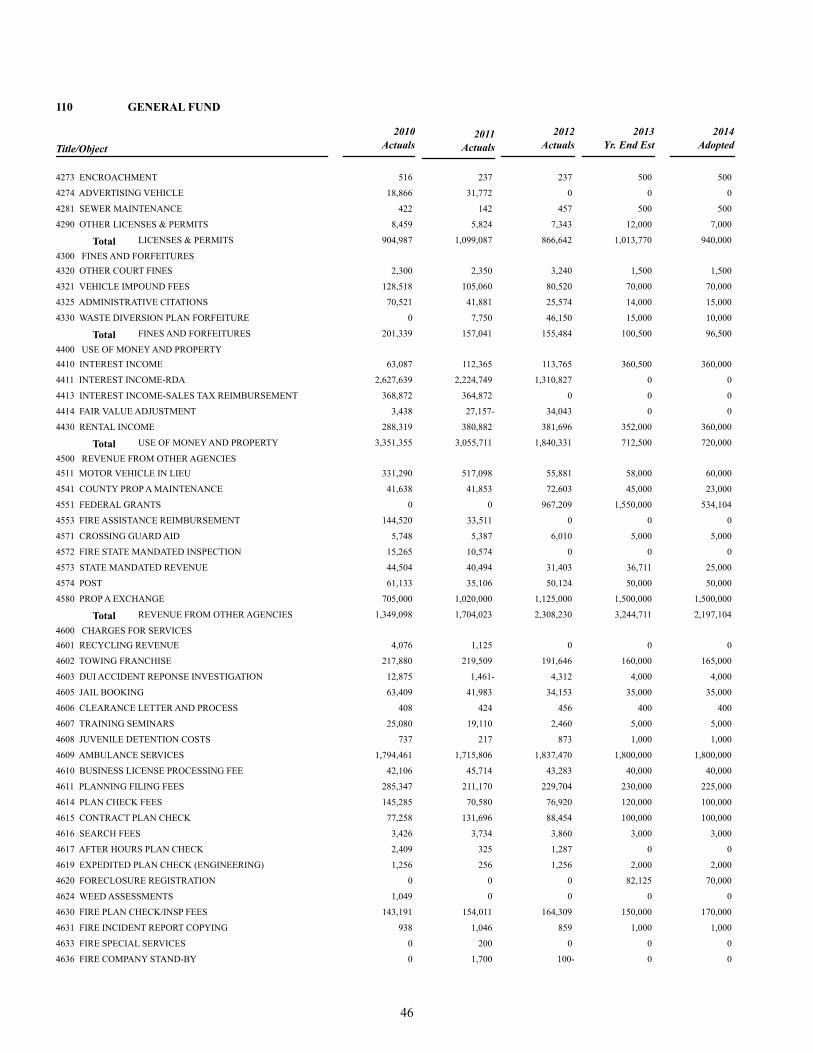
110 GENERAL FUND
2010
ActualsTitle/Object
2013
Yr. End Est
2012
Actuals
2014
Adopted 2011
Actuals
4273 ENCROACHMENT 516 237 237 500 500
4274 ADVERTISING VEHICLE 18,866 31,772 0 0 0
4281 SEWER MAINTENANCE 422 142 457 500 500
4290 OTHER LICENSES & PERMITS 8,459 5,824 7,343 12,000 7,000
Total 904,987 1,099,087 866,642 1,013,770 940,000 LICENSES & PERMITS
4300 FINES AND FORFEITURES
4320 OTHER COURT FINES 2,300 2,350 3,240 1,500 1,500
4321 VEHICLE IMPOUND FEES 128,518 105,060 80,520 70,000 70,000
4325 ADMINISTRATIVE CITATIONS 70,521 41,881 25,574 14,000 15,000
4330 WASTE DIVERSION PLAN FORFEITURE 0 7,750 46,150 15,000 10,000
Total 201,339 157,041 155,484 100,500 96,500 FINES AND FORFEITURES
4400 USE OF MONEY AND PROPERTY
4410 INTEREST INCOME 63,087 112,365 113,765 360,500 360,000
4411 INTEREST INCOME-RDA 2,627,639 2,224,749 1,310,827 0 0
4413 INTEREST INCOME-SALES TAX REIMBURSEMENT 368,872 364,872 0 0 0
4414 FAIR VALUE ADJUSTMENT 3,438 27,157- 34,043 0 0
4430 RENTAL INCOME 288,319 380,882 381,696 352,000 360,000
Total 3,351,355 3,055,711 1,840,331 712,500 720,000 USE OF MONEY AND PROPERTY
4500 REVENUE FROM OTHER AGENCIES
4511 MOTOR VEHICLE IN LIEU 331,290 517,098 55,881 58,000 60,000
4541 COUNTY PROP A MAINTENANCE 41,638 41,853 72,603 45,000 23,000
4551 FEDERAL GRANTS 0 0 967,209 1,550,000 534,104
4553 FIRE ASSISTANCE REIMBURSEMENT 144,520 33,511 0 0 0
4571 CROSSING GUARD AID 5,748 5,387 6,010 5,000 5,000
4572 FIRE STATE MANDATED INSPECTION 15,265 10,574 0 0 0
4573 STATE MANDATED REVENUE 44,504 40,494 31,403 36,711 25,000
4574 POST 61,133 35,106 50,124 50,000 50,000
4580 PROP A EXCHANGE 705,000 1,020,000 1,125,000 1,500,000 1,500,000
Total 1,349,098 1,704,023 2,308,230 3,244,711 2,197,104 REVENUE FROM OTHER AGENCIES
4600 CHARGES FOR SERVICES
4601 RECYCLING REVENUE 4,076 1,125 0 0 0
4602 TOWING FRANCHISE 217,880 219,509 191,646 160,000 165,000
4603 DUI ACCIDENT REPONSE INVESTIGATION 12,875 1,461- 4,312 4,000 4,000
4605 JAIL BOOKING 63,409 41,983 34,153 35,000 35,000
4606 CLEARANCE LETTER AND PROCESS 408 424 456 400 400
4607 TRAINING SEMINARS 25,080 19,110 2,460 5,000 5,000
4608 JUVENILE DETENTION COSTS 737 217 873 1,000 1,000
4609 AMBULANCE SERVICES 1,794,461 1,715,806 1,837,470 1,800,000 1,800,000
4610 BUSINESS LICENSE PROCESSING FEE 42,106 45,714 43,283 40,000 40,000
4611 PLANNING FILING FEES 285,347 211,170 229,704 230,000 225,000
4614 PLAN CHECK FEES 145,285 70,580 76,920 120,000 100,000
4615 CONTRACT PLAN CHECK 77,258 131,696 88,454 100,000 100,000
4616 SEARCH FEES 3,426 3,734 3,860 3,000 3,000
4617 AFTER HOURS PLAN CHECK 2,409 325 1,287 0 0
4619 EXPEDITED PLAN CHECK (ENGINEERING) 1,256 256 1,256 2,000 2,000
4620 FORECLOSURE REGISTRATION 0 0 0 82,125 70,000
4624 WEED ASSESSMENTS 1,049 0 0 0 0
4630 FIRE PLAN CHECK/INSP FEES 143,191 154,011 164,309 150,000 170,000
4631 FIRE INCIDENT REPORT COPYING 938 1,046 859 1,000 1,000
4633 FIRE SPECIAL SERVICES 0 200 0 0 0
4636 FIRE COMPANY STAND-BY 0 1,700 100- 0 0
46

110 GENERAL FUND
2010
ActualsTitle/Object
2013
Yr. End Est
2012
Actuals
2014
Adopted 2011
Actuals
4640 FALSE ALARMS 90,805 80,277 76,567 69,009 80,000
4641 PHOTOCOPYING 1,349 2,991 1,179 1,000 1,000
4642 RETURNED CHECK FEE 1,400 675 745 1,000 1,000
4643 ADDRESS CHANGE 768 960 384 500 500
4644 PASSPORT SERVICES 26,368 17,182 16,605 22,000 20,000
4645 POLICE REIMBURSEMENTS 190,923 163,123 32,340 10,000 10,000
4646 GRAFFITI RESTITUTION 38,380 48,980 28,969 12,000 12,000
4647 MISC REIMBURSEMENT 52,078 151,193 156,501 90,000 75,000
4648 FIRE SAFETY INSPECTIONS 6,267 7,150 4,950 5,000 5,000
4649 SPECIAL EVENTS 5,787 7,520 6,065 5,000 5,000
4655 ADMIN COST RECOVERY FEE 0 21,025 24,294 20,000 20,000
4656 PASSPORT PHOTOS 5,879 4,215 4,156 6,000 5,000
4657 AMBULANCE SUBSCRIPTION FEE 9,600 14,538 15,266 16,000 18,000
4658 PAID PARKING - CIVIC CENTER 34,730 67,315 62,810 70,000 70,000
Total 3,285,525 3,204,289 3,112,033 3,061,034 3,043,900 CHARGES FOR SERVICES
4700 INTERFUND CHARGES
4750 OVERHEAD CHARGEBACKS 1,610,642 1,383,362 1,449,306 1,254,070 1,254,136
4790 SALES TAX REIMBURSEMENT 585,461 851,273 0 0 0
Total 2,196,103 2,234,635 1,449,306 1,254,070 1,254,136 INTERFUND CHARGES
4800 OTHER REVENUES
4810 ADVERTISING REVENUE 0 0 30,080 55,000 40,000
4811 SALE REAL/PERSONAL PROP 0 0 36,018 0 0
4813 SALE MAPS/PLANS/DOCUMENTS 3,536 3,762 3,790 3,500 3,500
4814 PROCEEDS FROM AUCTION 5,024 19,505 24,859 10,000 10,000
4816 FINAL MAP 0 0 1,204 2,500 1,000
4818 MISCELLANEOUS 20,376 75,070 48,575 2,048,251 45,000
4820 LANDSCAPING - COUNTY 52,134 38,047 38,047 38,000 38,000
4821 POOL MAINT - SCHOOL DIST 60,263 0 0 0 0
4822 CONTRACTUAL REIMBURSEMENT 12,620 9,928 11,178 10,000 8,000
4829 MISC RESTITUTION 0 0 500 0 0
4840 CIVIL SUBPOENAS 75 0 0 400 400
4853 DEBT PROCEEDS 0 0 475 0 0
4862 DONATIONS 30 0 0 0 0
Total 154,058 146,312 194,726 2,167,651 145,900 OTHER REVENUES
Total 46,560,487 47,834,005 47,183,067 52,927,481 50,267,540 GENERAL FUND
111 FEE & CHARGE
2010
ActualsTitle/Object
2013
Yr. End Est
2012
Actuals
2014
Adopted 2011
Actuals
4400 USE OF MONEY AND PROPERTY
4410 INTEREST INCOME 12 0 0 0 0
Total 12 0 0 0 0 USE OF MONEY AND PROPERTY
4600 CHARGES FOR SERVICES
4650 AFTERSCHOOL PROGRAM-CALIFORNIA 68,956 80,672 81,933 80,000 80,000
4651 AFTERSCHOOL PROGRAM-WESCOVE 70,878 88,729 85,056 85,000 90,000
4653 AFTERSCHOOL PROGRAMS-VINE 161,324 169,009 163,786 160,000 160,000
4654 AFTERSCHOOL PROGRAM-ORANGEWOOD 47,885 48,248 79,827 65,000 75,000
4661 RECREATION CLASSES/PROGRAMS - CCC 136,815 116,553 98,189 100,000 100,000
47

111 FEE & CHARGE
2010
ActualsTitle/Object
2013
Yr. End Est
2012
Actuals
2014
Adopted 2011
Actuals
4662 SPORTS - CCC 37,582 39,047 47,278 32,000 35,000
4663 FACILITY RENTAL - CCC 106,665 108,425 122,151 130,000 135,000
4664 RECREATION CLASSES 152,401 129,205 100,062 85,000 90,000
4675 PALM VIEW AFTER SCHOOL PROGRAM 51,431 67,633 53,835 98,538 99,000
4681 RENTAL - ROLLER HOCKEY 49,397 63,322 55,063 65,000 65,000
4682 FACILITY RENTALS 48,592 71,936 64,001 65,000 65,000
4689 SENIOR DONATIONS 12,325 11,512 6,999 7,000 7,000
4690 SENIOR CENTER RENTALS 40,248 43,161 40,346 40,000 40,000
4691 MEALS PROGRAM DONATION 0 0 240 0 0
4693 SENIOR EXCURSIONS 5,809 7,025 8,589 8,000 8,000
4695 SENIOR CLASSES 189 0 66 120 0
4699 MUNICIPAL POOL 86,198 86,299 81,610 85,000 85,000
Total 1,076,695 1,130,776 1,089,031 1,105,658 1,134,000 CHARGES FOR SERVICES
4800 OTHER REVENUES
4818 MISCELLANEOUS 163 0 0 0 0
4821 POOL MAINT - SCHOOL DIST 0 31,550 35,833 46,000 48,000
Total 163 31,550 35,833 46,000 48,000 OTHER REVENUES
Total 1,076,870 1,162,326 1,124,864 1,151,658 1,182,000 FEE & CHARGE
112 RDA PROJECTS
2010
ActualsTitle/Object
2013
Yr. End Est
2012
Actuals
2014
Adopted 2011
Actuals
4400 USE OF MONEY AND PROPERTY
Total 0 0 0 0 0 USE OF MONEY AND PROPERTY
Total 0 0 0 0 0 RDA PROJECTS
113 WATER SALE
2010
ActualsTitle/Object
2013
Yr. End Est
2012
Actuals
2014
Adopted 2011
Actuals
4400 USE OF MONEY AND PROPERTY
Total 0 0 0 0 0 USE OF MONEY AND PROPERTY
4800 OTHER REVENUES
Total 0 0 0 0 0 OTHER REVENUES
Total 0 0 0 0 0 WATER SALE
114 COMMUNITY ENHANCEMENT
2010
ActualsTitle/Object
2013
Yr. End Est
2012
Actuals
2014
Adopted 2011
Actuals
4400 USE OF MONEY AND PROPERTY
Total 0 0 0 0 0 USE OF MONEY AND PROPERTY
4500 REVENUE FROM OTHER AGENCIES
Total 0 0 0 0 0 REVENUE FROM OTHER AGENCIES
48
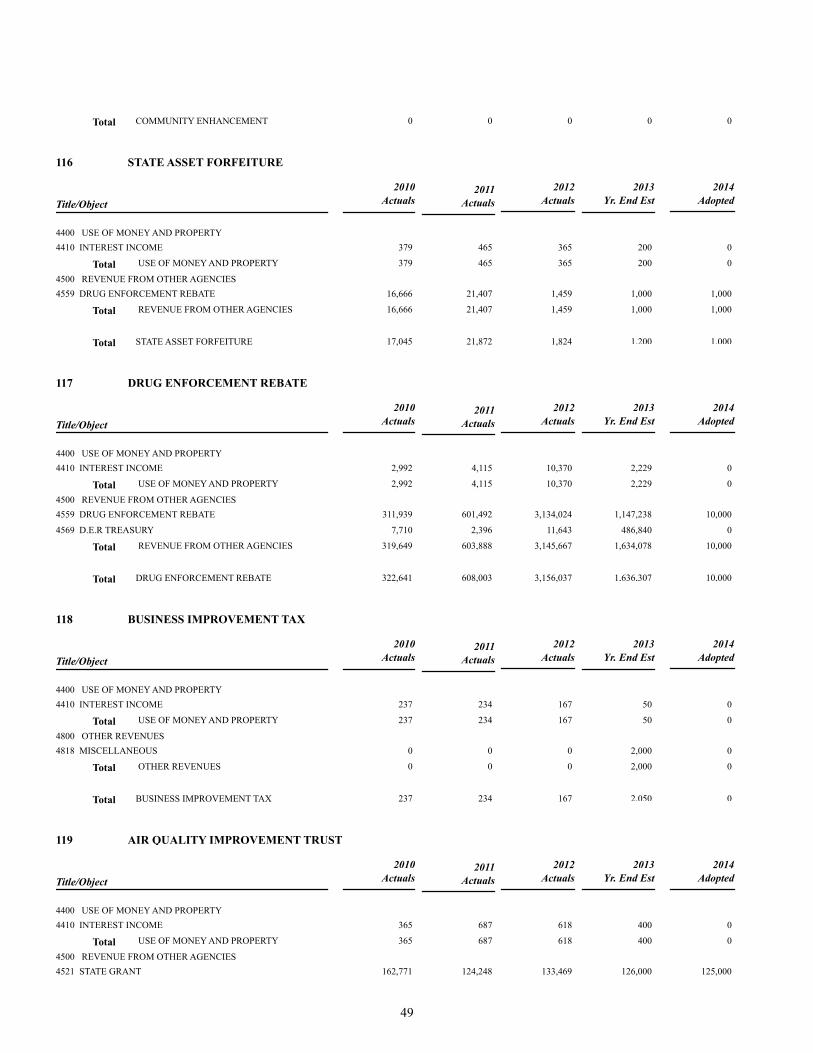
Total 0 0 0 0 0 COMMUNITY ENHANCEMENT
116 STATE ASSET FORFEITURE
2010
ActualsTitle/Object
2013
Yr. End Est
2012
Actuals
2014
Adopted 2011
Actuals
4400 USE OF MONEY AND PROPERTY
4410 INTEREST INCOME 379 465 365 200 0
Total 379 465 365 200 0 USE OF MONEY AND PROPERTY
4500 REVENUE FROM OTHER AGENCIES
4559 DRUG ENFORCEMENT REBATE 16,666 21,407 1,459 1,000 1,000
Total 16,666 21,407 1,459 1,000 1,000 REVENUE FROM OTHER AGENCIES
Total 17,045 21,872 1,824 1,200 1,000 STATE ASSET FORFEITURE
117 DRUG ENFORCEMENT REBATE
2010
ActualsTitle/Object
2013
Yr. End Est
2012
Actuals
2014
Adopted 2011
Actuals
4400 USE OF MONEY AND PROPERTY
4410 INTEREST INCOME 2,992 4,115 10,370 2,229 0
Total 2,992 4,115 10,370 2,229 0 USE OF MONEY AND PROPERTY
4500 REVENUE FROM OTHER AGENCIES
4559 DRUG ENFORCEMENT REBATE 311,939 601,492 3,134,024 1,147,238 10,000
4569 D.E.R TREASURY 7,710 2,396 11,643 486,840 0
Total 319,649 603,888 3,145,667 1,634,078 10,000 REVENUE FROM OTHER AGENCIES
Total 322,641 608,003 3,156,037 1,636,307 10,000 DRUG ENFORCEMENT REBATE
118 BUSINESS IMPROVEMENT TAX
2010
ActualsTitle/Object
2013
Yr. End Est
2012
Actuals
2014
Adopted 2011
Actuals
4400 USE OF MONEY AND PROPERTY
4410 INTEREST INCOME 237 234 167 50 0
Total 237 234 167 50 0 USE OF MONEY AND PROPERTY
4800 OTHER REVENUES
4818 MISCELLANEOUS 0 0 0 2,000 0
Total 0 0 0 2,000 0 OTHER REVENUES
Total 237 234 167 2,050 0 BUSINESS IMPROVEMENT TAX
119 AIR QUALITY IMPROVEMENT TRUST
2010
ActualsTitle/Object
2013
Yr. End Est
2012
Actuals
2014
Adopted 2011
Actuals
4400 USE OF MONEY AND PROPERTY
4410 INTEREST INCOME 365 687 618 400 0
Total 365 687 618 400 0 USE OF MONEY AND PROPERTY
4500 REVENUE FROM OTHER AGENCIES
4521 STATE GRANT 162,771 124,248 133,469 126,000 125,000
49

119 AIR QUALITY IMPROVEMENT TRUST
2010
ActualsTitle/Object
2013
Yr. End Est
2012
Actuals
2014
Adopted 2011
Actuals
Total 162,771 124,248 133,469 126,000 125,000 REVENUE FROM OTHER AGENCIES
Total 163,136 124,935 134,087 126,400 125,000 AIR QUALITY IMPROVEMENT TRUST
120 INTEGRATED WASTE MANAGEMENT
2010
ActualsTitle/Object
2013
Yr. End Est
2012
Actuals
2014
Adopted 2011
Actuals
4400 USE OF MONEY AND PROPERTY
Total 0 0 0 0 0 USE OF MONEY AND PROPERTY
4600 CHARGES FOR SERVICES
4628 WASTE MANAGEMENT FEES 69,166 70,162 70,162 70,000 70,000
Total 69,166 70,162 70,162 70,000 70,000 CHARGES FOR SERVICES
Total 69,166 70,162 70,162 70,000 70,000 INTEGRATED WASTE MANAGEMENT
121 PROP A
2010
ActualsTitle/Object
2013
Yr. End Est
2012
Actuals
2014
Adopted 2011
Actuals
4100 OTHER TAXES
4110 SALES TAX 1,433,416 1,523,535 1,649,657 1,700,000 1,775,000
Total 1,433,416 1,523,535 1,649,657 1,700,000 1,775,000 OTHER TAXES
4400 USE OF MONEY AND PROPERTY
4410 INTEREST INCOME 6 34 265 0 0
Total 6 34 265 0 0 USE OF MONEY AND PROPERTY
4500 REVENUE FROM OTHER AGENCIES
4530 TRANSPORTATION GRANT - MTA 158,885 0 0 0 0
4565 PROP A DISCRETIONARY INCENTIVE 0 150,699 157,759 120,000 125,000
Total 158,885 150,699 157,759 120,000 125,000 REVENUE FROM OTHER AGENCIES
4600 CHARGES FOR SERVICES
4692 RTD BUS PASS S.C.C. 42 412 0 0 0
Total 42 412 0 0 0 CHARGES FOR SERVICES
4800 OTHER REVENUES
4810 ADVERTISING REVENUE 0 1,700 0 0 0
Total 0 1,700 0 0 0 OTHER REVENUES
Total 1,592,349 1,676,380 1,807,681 1,820,000 1,900,000 PROP A
122 PROP C
2010
ActualsTitle/Object
2013
Yr. End Est
2012
Actuals
2014
Adopted 2011
Actuals
4100 OTHER TAXES
4110 SALES TAX 1,189,080 1,265,690 1,370,700 1,400,000 1,475,000
Total 1,189,080 1,265,690 1,370,700 1,400,000 1,475,000 OTHER TAXES
4400 USE OF MONEY AND PROPERTY
4410 INTEREST INCOME 18,572 16,144 9,529 2,000 0
50
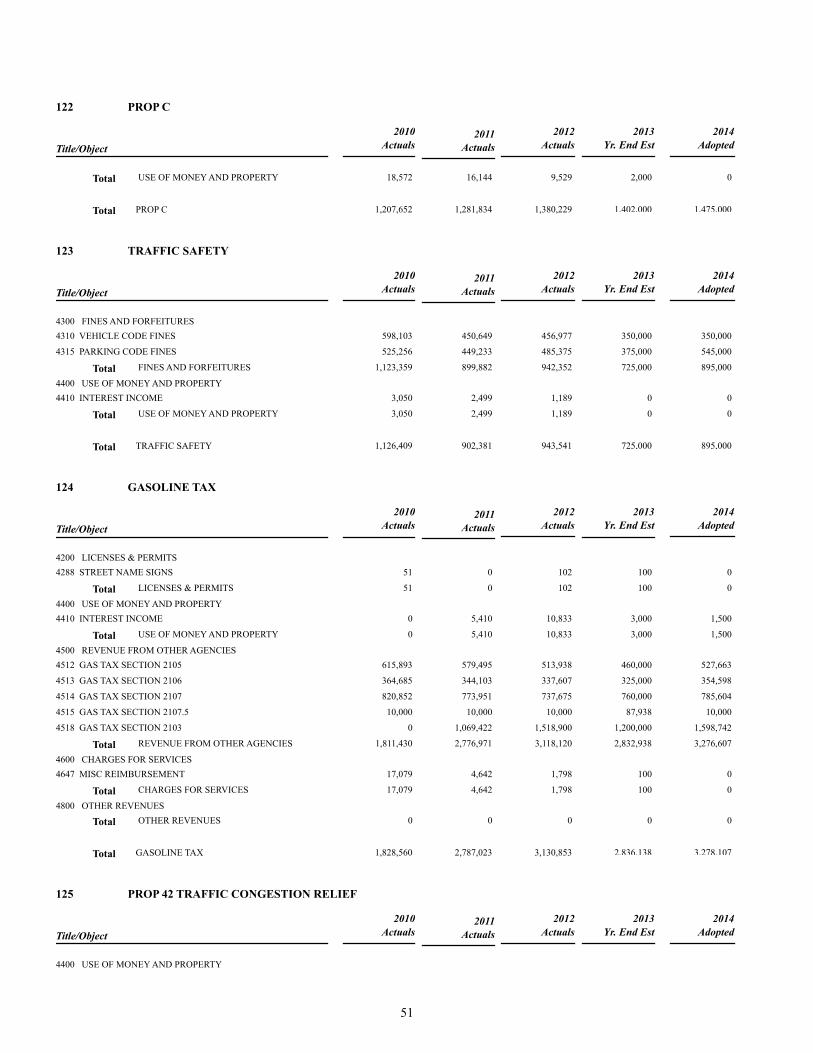
122 PROP C
2010
ActualsTitle/Object
2013
Yr. End Est
2012
Actuals
2014
Adopted 2011
Actuals
Total 18,572 16,144 9,529 2,000 0 USE OF MONEY AND PROPERTY
Total 1,207,652 1,281,834 1,380,229 1,402,000 1,475,000 PROP C
123 TRAFFIC SAFETY
2010
ActualsTitle/Object
2013
Yr. End Est
2012
Actuals
2014
Adopted 2011
Actuals
4300 FINES AND FORFEITURES
4310 VEHICLE CODE FINES 598,103 450,649 456,977 350,000 350,000
4315 PARKING CODE FINES 525,256 449,233 485,375 375,000 545,000
Total 1,123,359 899,882 942,352 725,000 895,000 FINES AND FORFEITURES
4400 USE OF MONEY AND PROPERTY
4410 INTEREST INCOME 3,050 2,499 1,189 0 0
Total 3,050 2,499 1,189 0 0 USE OF MONEY AND PROPERTY
Total 1,126,409 902,381 943,541 725,000 895,000 TRAFFIC SAFETY
124 GASOLINE TAX
2010
ActualsTitle/Object
2013
Yr. End Est
2012
Actuals
2014
Adopted 2011
Actuals
4200 LICENSES & PERMITS
4288 STREET NAME SIGNS 51 0 102 100 0
Total 51 0 102 100 0 LICENSES & PERMITS
4400 USE OF MONEY AND PROPERTY
4410 INTEREST INCOME 0 5,410 10,833 3,000 1,500
Total 0 5,410 10,833 3,000 1,500 USE OF MONEY AND PROPERTY
4500 REVENUE FROM OTHER AGENCIES
4512 GAS TAX SECTION 2105 615,893 579,495 513,938 460,000 527,663
4513 GAS TAX SECTION 2106 364,685 344,103 337,607 325,000 354,598
4514 GAS TAX SECTION 2107 820,852 773,951 737,675 760,000 785,604
4515 GAS TAX SECTION 2107.5 10,000 10,000 10,000 87,938 10,000
4518 GAS TAX SECTION 2103 0 1,069,422 1,518,900 1,200,000 1,598,742
Total 1,811,430 2,776,971 3,118,120 2,832,938 3,276,607 REVENUE FROM OTHER AGENCIES
4600 CHARGES FOR SERVICES
4647 MISC REIMBURSEMENT 17,079 4,642 1,798 100 0
Total 17,079 4,642 1,798 100 0 CHARGES FOR SERVICES
4800 OTHER REVENUES
Total 0 0 0 0 0 OTHER REVENUES
Total 1,828,560 2,787,023 3,130,853 2,836,138 3,278,107 GASOLINE TAX
125 PROP 42 TRAFFIC CONGESTION RELIEF
2010
ActualsTitle/Object
2013
Yr. End Est
2012
Actuals
2014
Adopted 2011
Actuals
4400 USE OF MONEY AND PROPERTY
51

125 PROP 42 TRAFFIC CONGESTION RELIEF
2010
ActualsTitle/Object
2013
Yr. End Est
2012
Actuals
2014
Adopted 2011
Actuals
4410 INTEREST INCOME 876 0 0 0 0
Total 876 0 0 0 0 USE OF MONEY AND PROPERTY
4500 REVENUE FROM OTHER AGENCIES
4521 STATE GRANT 1,019,293 0 0 0 0
Total 1,019,293 0 0 0 0 REVENUE FROM OTHER AGENCIES
Total 1,020,169 0 0 0 0 PROP 42 TRAFFIC CONGESTION RELIEF
126 PROP 1B
2010
ActualsTitle/Object
2013
Yr. End Est
2012
Actuals
2014
Adopted 2011
Actuals
4400 USE OF MONEY AND PROPERTY
4410 INTEREST INCOME 7,959 78 48 0 0
Total 7,959 78 48 0 0 USE OF MONEY AND PROPERTY
4500 REVENUE FROM OTHER AGENCIES
Total 0 0 0 0 0 REVENUE FROM OTHER AGENCIES
Total 7,959 78 48 0 0 PROP 1B
127 POLICE DONATIONS
2010
ActualsTitle/Object
2013
Yr. End Est
2012
Actuals
2014
Adopted 2011
Actuals
4400 USE OF MONEY AND PROPERTY
4410 INTEREST INCOME 74 98 121 0 0
Total 74 98 121 0 0 USE OF MONEY AND PROPERTY
4800 OTHER REVENUES
4831 POLICE EXPLORER DONATIONS 0 25 0 0 0
4832 SHOP DONATIONS 0 1,576 1,890 1,061 0
4833 EVERY 15 MINUTES REVENUE 1,000 275 0 0 0
4835 MOUNTED ENFORCEMENT TEAM 0 10,612 0 0 0
4838 MISC POLICE DONATIONS 300 2,650 350 600 0
Total 1,300 15,138 2,240 1,661 0 OTHER REVENUES
Total 1,374 15,236 2,361 1,661 0 POLICE DONATIONS
128 TRANSPORTATION DEVELOPMENT ACT
2010
ActualsTitle/Object
2013
Yr. End Est
2012
Actuals
2014
Adopted 2011
Actuals
4400 USE OF MONEY AND PROPERTY
4410 INTEREST INCOME 78 0 0 0 0
Total 78 0 0 0 0 USE OF MONEY AND PROPERTY
4500 REVENUE FROM OTHER AGENCIES
4521 STATE GRANT 26,998 86,726 99,650 45,000 45,000
Total 26,998 86,726 99,650 45,000 45,000 REVENUE FROM OTHER AGENCIES
52
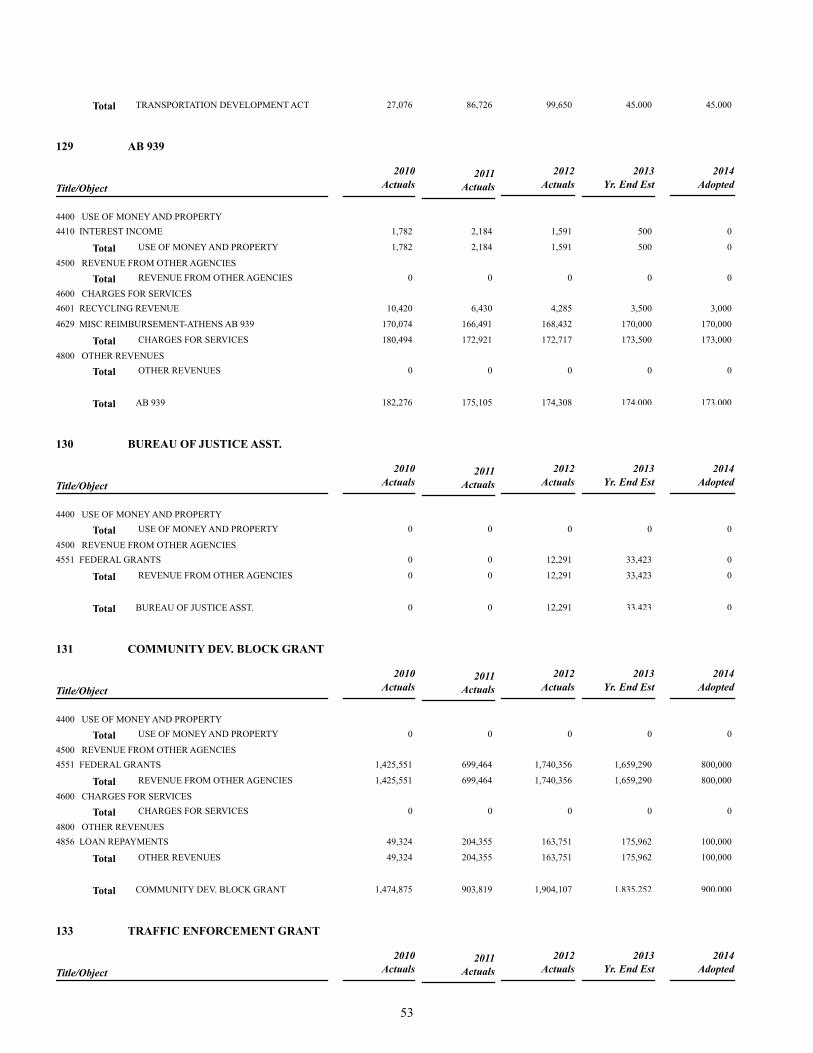
Total 27,076 86,726 99,650 45,000 45,000 TRANSPORTATION DEVELOPMENT ACT
129 AB 939
2010
ActualsTitle/Object
2013
Yr. End Est
2012
Actuals
2014
Adopted 2011
Actuals
4400 USE OF MONEY AND PROPERTY
4410 INTEREST INCOME 1,782 2,184 1,591 500 0
Total 1,782 2,184 1,591 500 0 USE OF MONEY AND PROPERTY
4500 REVENUE FROM OTHER AGENCIES
Total 0 0 0 0 0 REVENUE FROM OTHER AGENCIES
4600 CHARGES FOR SERVICES
4601 RECYCLING REVENUE 10,420 6,430 4,285 3,500 3,000
4629 MISC REIMBURSEMENT-ATHENS AB 939 170,074 166,491 168,432 170,000 170,000
Total 180,494 172,921 172,717 173,500 173,000 CHARGES FOR SERVICES
4800 OTHER REVENUES
Total 0 0 0 0 0 OTHER REVENUES
Total 182,276 175,105 174,308 174,000 173,000 AB 939
130 BUREAU OF JUSTICE ASST.
2010
ActualsTitle/Object
2013
Yr. End Est
2012
Actuals
2014
Adopted 2011
Actuals
4400 USE OF MONEY AND PROPERTY
Total 0 0 0 0 0 USE OF MONEY AND PROPERTY
4500 REVENUE FROM OTHER AGENCIES
4551 FEDERAL GRANTS 0 0 12,291 33,423 0
Total 0 0 12,291 33,423 0 REVENUE FROM OTHER AGENCIES
Total 0 0 12,291 33,423 0 BUREAU OF JUSTICE ASST.
131 COMMUNITY DEV. BLOCK GRANT
2010
ActualsTitle/Object
2013
Yr. End Est
2012
Actuals
2014
Adopted 2011
Actuals
4400 USE OF MONEY AND PROPERTY
Total 0 0 0 0 0 USE OF MONEY AND PROPERTY
4500 REVENUE FROM OTHER AGENCIES
4551 FEDERAL GRANTS 1,425,551 699,464 1,740,356 1,659,290 800,000
Total 1,425,551 699,464 1,740,356 1,659,290 800,000 REVENUE FROM OTHER AGENCIES
4600 CHARGES FOR SERVICES
Total 0 0 0 0 0 CHARGES FOR SERVICES
4800 OTHER REVENUES
4856 LOAN REPAYMENTS 49,324 204,355 163,751 175,962 100,000
Total 49,324 204,355 163,751 175,962 100,000 OTHER REVENUES
Total 1,474,875 903,819 1,904,107 1,835,252 900,000 COMMUNITY DEV. BLOCK GRANT
133 TRAFFIC ENFORCEMENT GRANT
2010
ActualsTitle/Object
2013
Yr. End Est
2012
Actuals
2014
Adopted 2011
Actuals
53
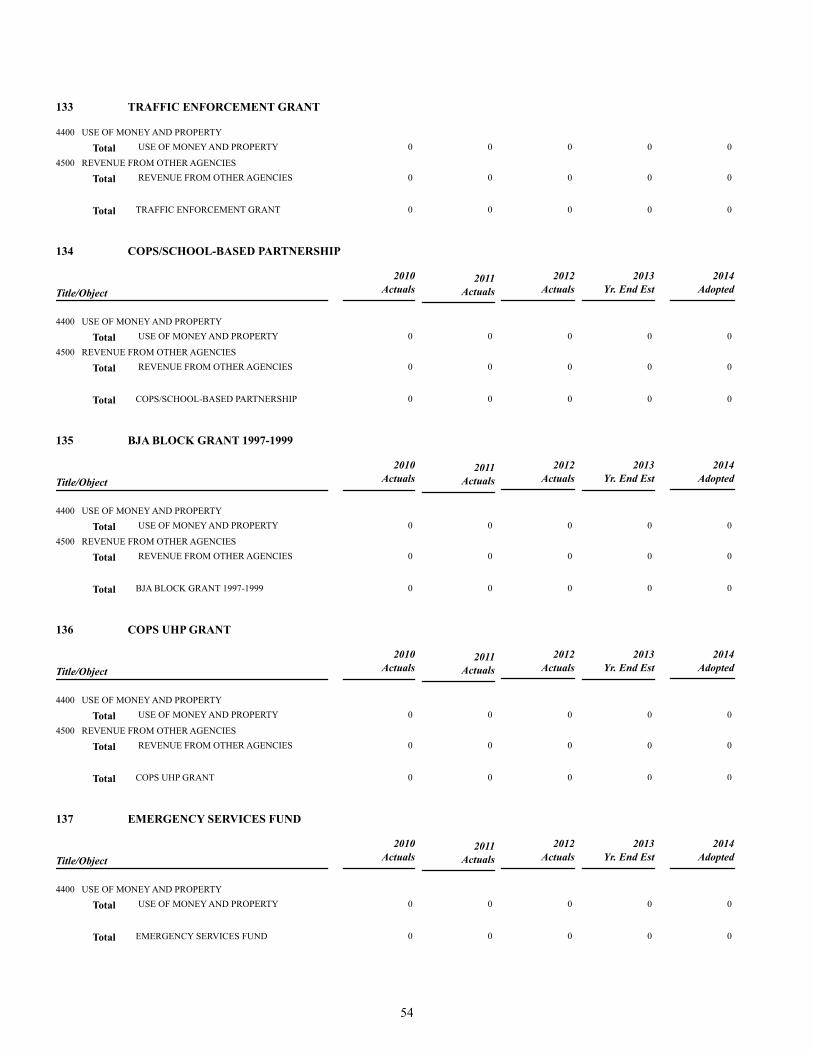
133 TRAFFIC ENFORCEMENT GRANT
4400 USE OF MONEY AND PROPERTY
Total 0 0 0 0 0 USE OF MONEY AND PROPERTY
4500 REVENUE FROM OTHER AGENCIES
Total 0 0 0 0 0 REVENUE FROM OTHER AGENCIES
Total 0 0 0 0 0 TRAFFIC ENFORCEMENT GRANT
134 COPS/SCHOOL-BASED PARTNERSHIP
2010
ActualsTitle/Object
2013
Yr. End Est
2012
Actuals
2014
Adopted 2011
Actuals
4400 USE OF MONEY AND PROPERTY
Total 0 0 0 0 0 USE OF MONEY AND PROPERTY
4500 REVENUE FROM OTHER AGENCIES
Total 0 0 0 0 0 REVENUE FROM OTHER AGENCIES
Total 0 0 0 0 0 COPS/SCHOOL-BASED PARTNERSHIP
135 BJA BLOCK GRANT 1997-1999
2010
ActualsTitle/Object
2013
Yr. End Est
2012
Actuals
2014
Adopted 2011
Actuals
4400 USE OF MONEY AND PROPERTY
Total 0 0 0 0 0 USE OF MONEY AND PROPERTY
4500 REVENUE FROM OTHER AGENCIES
Total 0 0 0 0 0 REVENUE FROM OTHER AGENCIES
Total 0 0 0 0 0 BJA BLOCK GRANT 1997-1999
136 COPS UHP GRANT
2010
ActualsTitle/Object
2013
Yr. End Est
2012
Actuals
2014
Adopted 2011
Actuals
4400 USE OF MONEY AND PROPERTY
Total 0 0 0 0 0 USE OF MONEY AND PROPERTY
4500 REVENUE FROM OTHER AGENCIES
Total 0 0 0 0 0 REVENUE FROM OTHER AGENCIES
Total 0 0 0 0 0 COPS UHP GRANT
137 EMERGENCY SERVICES FUND
2010
ActualsTitle/Object
2013
Yr. End Est
2012
Actuals
2014
Adopted 2011
Actuals
4400 USE OF MONEY AND PROPERTY
Total 0 0 0 0 0 USE OF MONEY AND PROPERTY
Total 0 0 0 0 0 EMERGENCY SERVICES FUND
54
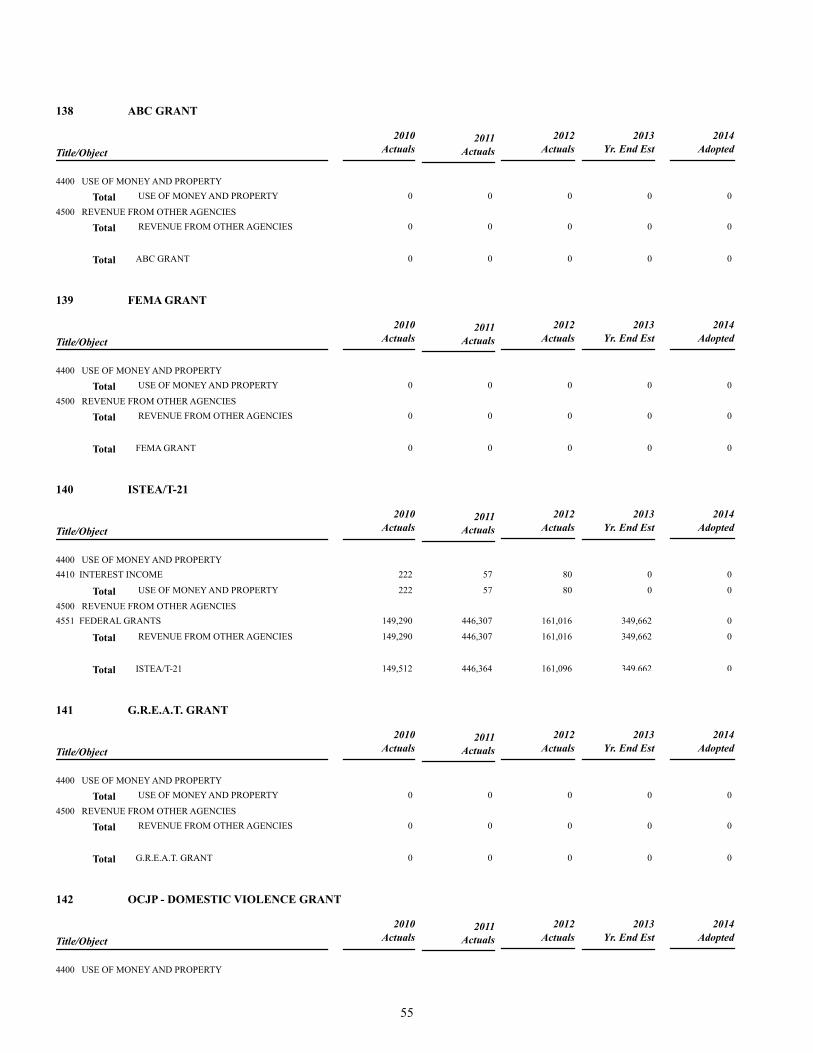
138 ABC GRANT
2010
ActualsTitle/Object
2013
Yr. End Est
2012
Actuals
2014
Adopted 2011
Actuals
4400 USE OF MONEY AND PROPERTY
Total 0 0 0 0 0 USE OF MONEY AND PROPERTY
4500 REVENUE FROM OTHER AGENCIES
Total 0 0 0 0 0 REVENUE FROM OTHER AGENCIES
Total 0 0 0 0 0 ABC GRANT
139 FEMA GRANT
2010
ActualsTitle/Object
2013
Yr. End Est
2012
Actuals
2014
Adopted 2011
Actuals
4400 USE OF MONEY AND PROPERTY
Total 0 0 0 0 0 USE OF MONEY AND PROPERTY
4500 REVENUE FROM OTHER AGENCIES
Total 0 0 0 0 0 REVENUE FROM OTHER AGENCIES
Total 0 0 0 0 0 FEMA GRANT
140 ISTEA/T-21
2010
ActualsTitle/Object
2013
Yr. End Est
2012
Actuals
2014
Adopted 2011
Actuals
4400 USE OF MONEY AND PROPERTY
4410 INTEREST INCOME 222 57 80 0 0
Total 222 57 80 0 0 USE OF MONEY AND PROPERTY
4500 REVENUE FROM OTHER AGENCIES
4551 FEDERAL GRANTS 149,290 446,307 161,016 349,662 0
Total 149,290 446,307 161,016 349,662 0 REVENUE FROM OTHER AGENCIES
Total 149,512 446,364 161,096 349,662 0 ISTEA/T-21
141 G.R.E.A.T. GRANT
2010
ActualsTitle/Object
2013
Yr. End Est
2012
Actuals
2014
Adopted 2011
Actuals
4400 USE OF MONEY AND PROPERTY
Total 0 0 0 0 0 USE OF MONEY AND PROPERTY
4500 REVENUE FROM OTHER AGENCIES
Total 0 0 0 0 0 REVENUE FROM OTHER AGENCIES
Total 0 0 0 0 0 G.R.E.A.T. GRANT
142 OCJP - DOMESTIC VIOLENCE GRANT
2010
ActualsTitle/Object
2013
Yr. End Est
2012
Actuals
2014
Adopted 2011
Actuals
4400 USE OF MONEY AND PROPERTY
55
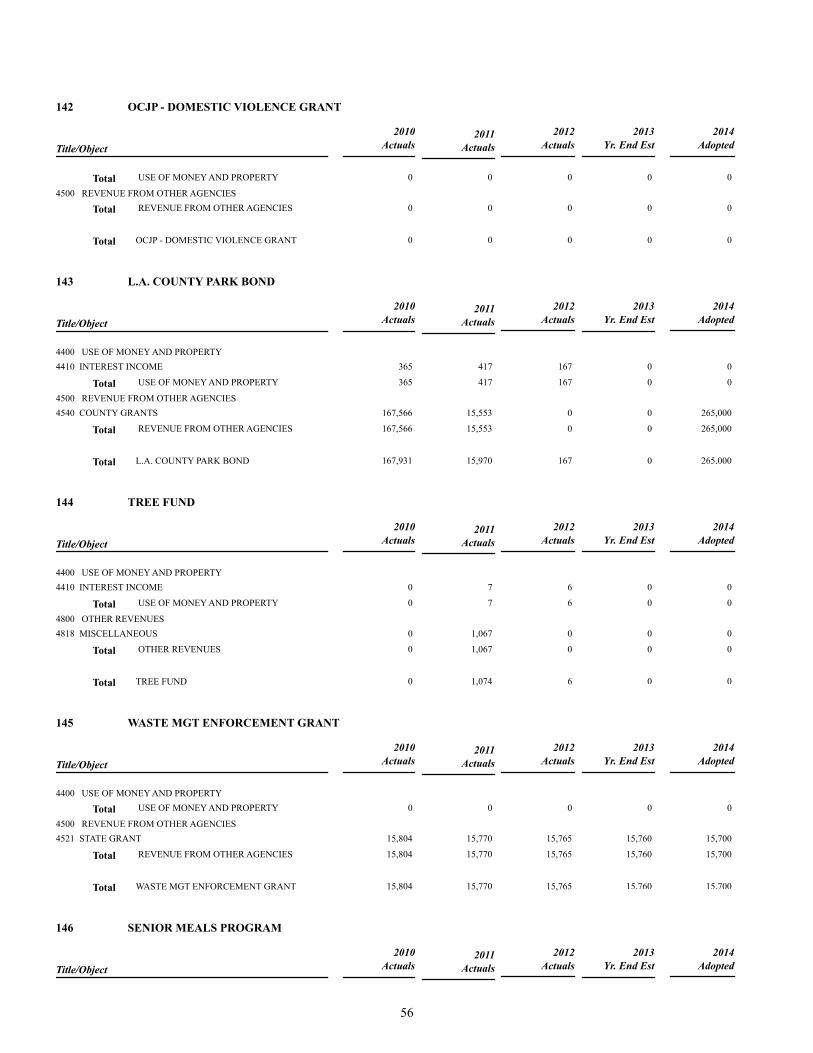
142 OCJP - DOMESTIC VIOLENCE GRANT
2010
ActualsTitle/Object
2013
Yr. End Est
2012
Actuals
2014
Adopted 2011
Actuals
Total 0 0 0 0 0 USE OF MONEY AND PROPERTY
4500 REVENUE FROM OTHER AGENCIES
Total 0 0 0 0 0 REVENUE FROM OTHER AGENCIES
Total 0 0 0 0 0 OCJP - DOMESTIC VIOLENCE GRANT
143 L.A. COUNTY PARK BOND
2010
ActualsTitle/Object
2013
Yr. End Est
2012
Actuals
2014
Adopted 2011
Actuals
4400 USE OF MONEY AND PROPERTY
4410 INTEREST INCOME 365 417 167 0 0
Total 365 417 167 0 0 USE OF MONEY AND PROPERTY
4500 REVENUE FROM OTHER AGENCIES
4540 COUNTY GRANTS 167,566 15,553 0 0 265,000
Total 167,566 15,553 0 0 265,000 REVENUE FROM OTHER AGENCIES
Total 167,931 15,970 167 0 265,000 L.A. COUNTY PARK BOND
144 TREE FUND
2010
ActualsTitle/Object
2013
Yr. End Est
2012
Actuals
2014
Adopted 2011
Actuals
4400 USE OF MONEY AND PROPERTY
4410 INTEREST INCOME 0 7 6 0 0
Total 0 7 6 0 0 USE OF MONEY AND PROPERTY
4800 OTHER REVENUES
4818 MISCELLANEOUS 0 1,067 0 0 0
Total 0 1,067 0 0 0 OTHER REVENUES
Total 0 1,074 6 0 0 TREE FUND
145 WASTE MGT ENFORCEMENT GRANT
2010
ActualsTitle/Object
2013
Yr. End Est
2012
Actuals
2014
Adopted 2011
Actuals
4400 USE OF MONEY AND PROPERTY
Total 0 0 0 0 0 USE OF MONEY AND PROPERTY
4500 REVENUE FROM OTHER AGENCIES
4521 STATE GRANT 15,804 15,770 15,765 15,760 15,700
Total 15,804 15,770 15,765 15,760 15,700 REVENUE FROM OTHER AGENCIES
Total 15,804 15,770 15,765 15,760 15,700 WASTE MGT ENFORCEMENT GRANT
146 SENIOR MEALS PROGRAM
2010
ActualsTitle/Object
2013
Yr. End Est
2012
Actuals
2014
Adopted 2011
Actuals
56
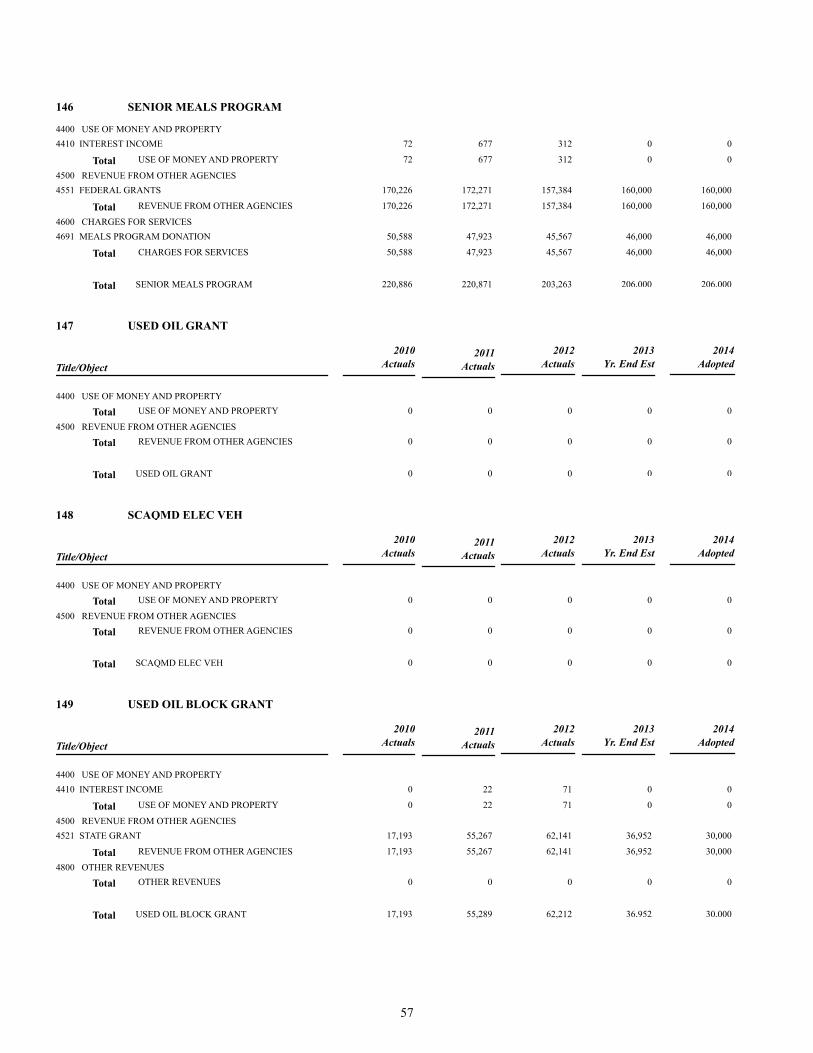
146 SENIOR MEALS PROGRAM
4400 USE OF MONEY AND PROPERTY
4410 INTEREST INCOME 72 677 312 0 0
Total 72 677 312 0 0 USE OF MONEY AND PROPERTY
4500 REVENUE FROM OTHER AGENCIES
4551 FEDERAL GRANTS 170,226 172,271 157,384 160,000 160,000
Total 170,226 172,271 157,384 160,000 160,000 REVENUE FROM OTHER AGENCIES
4600 CHARGES FOR SERVICES
4691 MEALS PROGRAM DONATION 50,588 47,923 45,567 46,000 46,000
Total 50,588 47,923 45,567 46,000 46,000 CHARGES FOR SERVICES
Total 220,886 220,871 203,263 206,000 206,000 SENIOR MEALS PROGRAM
147 USED OIL GRANT
2010
ActualsTitle/Object
2013
Yr. End Est
2012
Actuals
2014
Adopted 2011
Actuals
4400 USE OF MONEY AND PROPERTY
Total 0 0 0 0 0 USE OF MONEY AND PROPERTY
4500 REVENUE FROM OTHER AGENCIES
Total 0 0 0 0 0 REVENUE FROM OTHER AGENCIES
Total 0 0 0 0 0 USED OIL GRANT
148 SCAQMD ELEC VEH
2010
ActualsTitle/Object
2013
Yr. End Est
2012
Actuals
2014
Adopted 2011
Actuals
4400 USE OF MONEY AND PROPERTY
Total 0 0 0 0 0 USE OF MONEY AND PROPERTY
4500 REVENUE FROM OTHER AGENCIES
Total 0 0 0 0 0 REVENUE FROM OTHER AGENCIES
Total 0 0 0 0 0 SCAQMD ELEC VEH
149 USED OIL BLOCK GRANT
2010
ActualsTitle/Object
2013
Yr. End Est
2012
Actuals
2014
Adopted 2011
Actuals
4400 USE OF MONEY AND PROPERTY
4410 INTEREST INCOME 0 22 71 0 0
Total 0 22 71 0 0 USE OF MONEY AND PROPERTY
4500 REVENUE FROM OTHER AGENCIES
4521 STATE GRANT 17,193 55,267 62,141 36,952 30,000
Total 17,193 55,267 62,141 36,952 30,000 REVENUE FROM OTHER AGENCIES
4800 OTHER REVENUES
Total 0 0 0 0 0 OTHER REVENUES
Total 17,193 55,289 62,212 36,952 30,000 USED OIL BLOCK GRANT
57
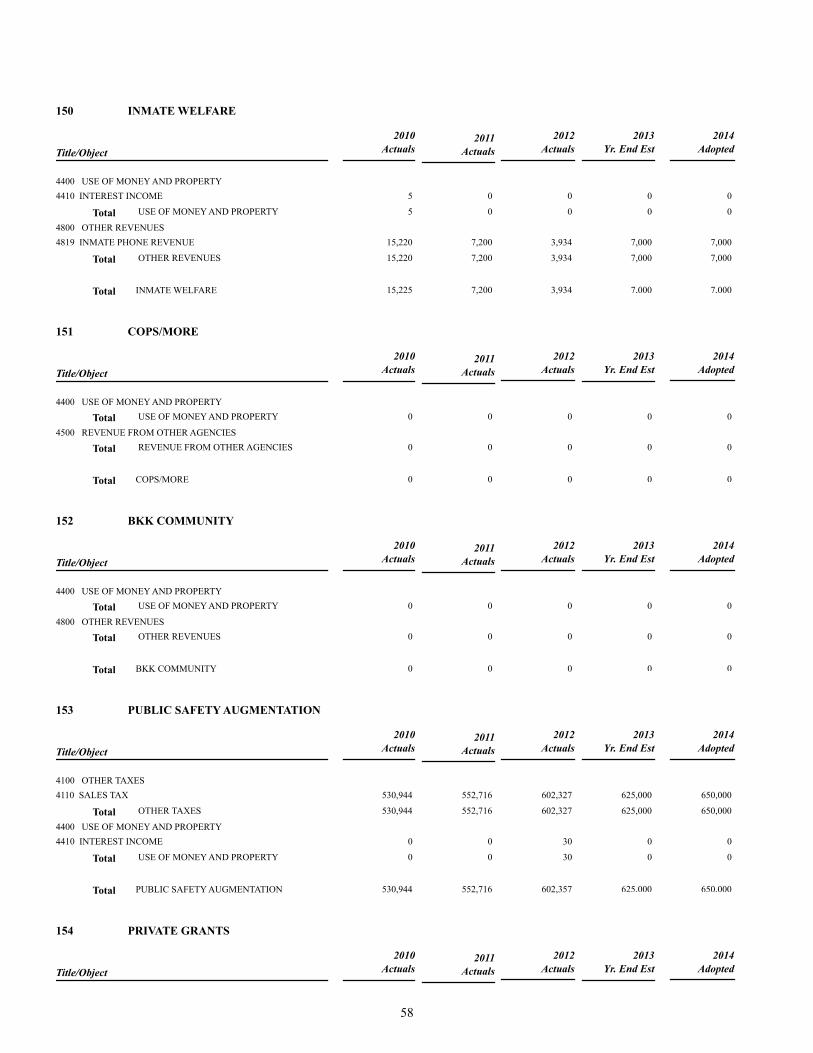
150 INMATE WELFARE
2010
ActualsTitle/Object
2013
Yr. End Est
2012
Actuals
2014
Adopted 2011
Actuals
4400 USE OF MONEY AND PROPERTY
4410 INTEREST INCOME 5 0 0 0 0
Total 5 0 0 0 0 USE OF MONEY AND PROPERTY
4800 OTHER REVENUES
4819 INMATE PHONE REVENUE 15,220 7,200 3,934 7,000 7,000
Total 15,220 7,200 3,934 7,000 7,000 OTHER REVENUES
Total 15,225 7,200 3,934 7,000 7,000 INMATE WELFARE
151 COPS/MORE
2010
ActualsTitle/Object
2013
Yr. End Est
2012
Actuals
2014
Adopted 2011
Actuals
4400 USE OF MONEY AND PROPERTY
Total 0 0 0 0 0 USE OF MONEY AND PROPERTY
4500 REVENUE FROM OTHER AGENCIES
Total 0 0 0 0 0 REVENUE FROM OTHER AGENCIES
Total 0 0 0 0 0 COPS/MORE
152 BKK COMMUNITY
2010
ActualsTitle/Object
2013
Yr. End Est
2012
Actuals
2014
Adopted 2011
Actuals
4400 USE OF MONEY AND PROPERTY
Total 0 0 0 0 0 USE OF MONEY AND PROPERTY
4800 OTHER REVENUES
Total 0 0 0 0 0 OTHER REVENUES
Total 0 0 0 0 0 BKK COMMUNITY
153 PUBLIC SAFETY AUGMENTATION
2010
ActualsTitle/Object
2013
Yr. End Est
2012
Actuals
2014
Adopted 2011
Actuals
4100 OTHER TAXES
4110 SALES TAX 530,944 552,716 602,327 625,000 650,000
Total 530,944 552,716 602,327 625,000 650,000 OTHER TAXES
4400 USE OF MONEY AND PROPERTY
4410 INTEREST INCOME 0 0 30 0 0
Total 0 0 30 0 0 USE OF MONEY AND PROPERTY
Total 530,944 552,716 602,357 625,000 650,000 PUBLIC SAFETY AUGMENTATION
154 PRIVATE GRANTS
2010
ActualsTitle/Object
2013
Yr. End Est
2012
Actuals
2014
Adopted 2011
Actuals
58
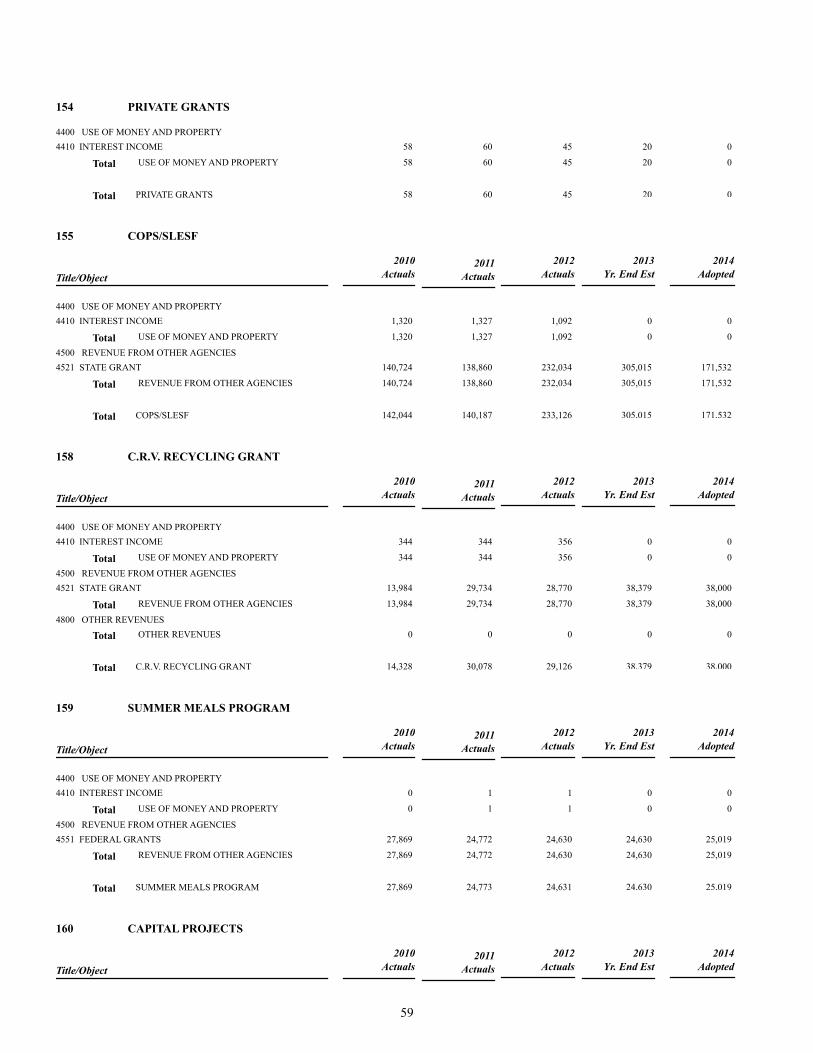
154 PRIVATE GRANTS
4400 USE OF MONEY AND PROPERTY
4410 INTEREST INCOME 58 60 45 20 0
Total 58 60 45 20 0 USE OF MONEY AND PROPERTY
Total 58 60 45 20 0 PRIVATE GRANTS
155 COPS/SLESF
2010
ActualsTitle/Object
2013
Yr. End Est
2012
Actuals
2014
Adopted 2011
Actuals
4400 USE OF MONEY AND PROPERTY
4410 INTEREST INCOME 1,320 1,327 1,092 0 0
Total 1,320 1,327 1,092 0 0 USE OF MONEY AND PROPERTY
4500 REVENUE FROM OTHER AGENCIES
4521 STATE GRANT 140,724 138,860 232,034 305,015 171,532
Total 140,724 138,860 232,034 305,015 171,532 REVENUE FROM OTHER AGENCIES
Total 142,044 140,187 233,126 305,015 171,532 COPS/SLESF
158 C.R.V. RECYCLING GRANT
2010
ActualsTitle/Object
2013
Yr. End Est
2012
Actuals
2014
Adopted 2011
Actuals
4400 USE OF MONEY AND PROPERTY
4410 INTEREST INCOME 344 344 356 0 0
Total 344 344 356 0 0 USE OF MONEY AND PROPERTY
4500 REVENUE FROM OTHER AGENCIES
4521 STATE GRANT 13,984 29,734 28,770 38,379 38,000
Total 13,984 29,734 28,770 38,379 38,000 REVENUE FROM OTHER AGENCIES
4800 OTHER REVENUES
Total 0 0 0 0 0 OTHER REVENUES
Total 14,328 30,078 29,126 38,379 38,000 C.R.V. RECYCLING GRANT
159 SUMMER MEALS PROGRAM
2010
ActualsTitle/Object
2013
Yr. End Est
2012
Actuals
2014
Adopted 2011
Actuals
4400 USE OF MONEY AND PROPERTY
4410 INTEREST INCOME 0 1 1 0 0
Total 0 1 1 0 0 USE OF MONEY AND PROPERTY
4500 REVENUE FROM OTHER AGENCIES
4551 FEDERAL GRANTS 27,869 24,772 24,630 24,630 25,019
Total 27,869 24,772 24,630 24,630 25,019 REVENUE FROM OTHER AGENCIES
Total 27,869 24,773 24,631 24,630 25,019 SUMMER MEALS PROGRAM
160 CAPITAL PROJECTS
2010
ActualsTitle/Object
2013
Yr. End Est
2012
Actuals
2014
Adopted 2011
Actuals
59
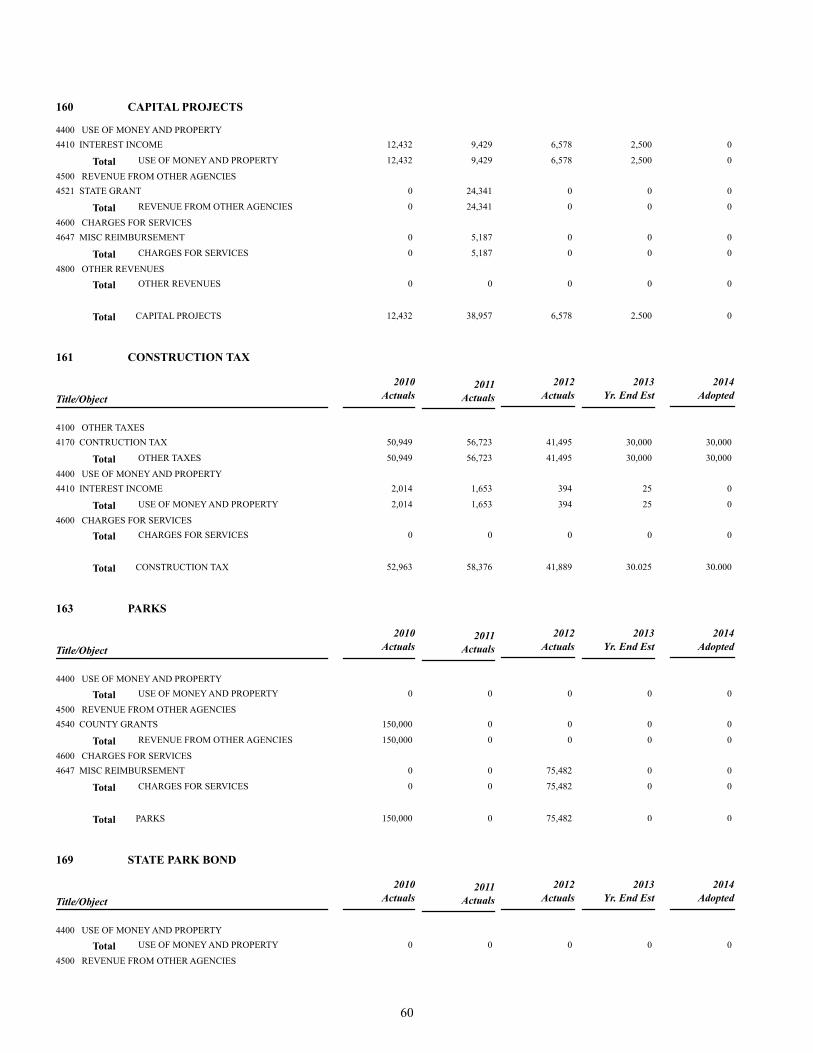
160 CAPITAL PROJECTS
4400 USE OF MONEY AND PROPERTY
4410 INTEREST INCOME 12,432 9,429 6,578 2,500 0
Total 12,432 9,429 6,578 2,500 0 USE OF MONEY AND PROPERTY
4500 REVENUE FROM OTHER AGENCIES
4521 STATE GRANT 0 24,341 0 0 0
Total 0 24,341 0 0 0 REVENUE FROM OTHER AGENCIES
4600 CHARGES FOR SERVICES
4647 MISC REIMBURSEMENT 0 5,187 0 0 0
Total 0 5,187 0 0 0 CHARGES FOR SERVICES
4800 OTHER REVENUES
Total 0 0 0 0 0 OTHER REVENUES
Total 12,432 38,957 6,578 2,500 0 CAPITAL PROJECTS
161 CONSTRUCTION TAX
2010
ActualsTitle/Object
2013
Yr. End Est
2012
Actuals
2014
Adopted 2011
Actuals
4100 OTHER TAXES
4170 CONTRUCTION TAX 50,949 56,723 41,495 30,000 30,000
Total 50,949 56,723 41,495 30,000 30,000 OTHER TAXES
4400 USE OF MONEY AND PROPERTY
4410 INTEREST INCOME 2,014 1,653 394 25 0
Total 2,014 1,653 394 25 0 USE OF MONEY AND PROPERTY
4600 CHARGES FOR SERVICES
Total 0 0 0 0 0 CHARGES FOR SERVICES
Total 52,963 58,376 41,889 30,025 30,000 CONSTRUCTION TAX
163 PARKS
2010
ActualsTitle/Object
2013
Yr. End Est
2012
Actuals
2014
Adopted 2011
Actuals
4400 USE OF MONEY AND PROPERTY
Total 0 0 0 0 0 USE OF MONEY AND PROPERTY
4500 REVENUE FROM OTHER AGENCIES
4540 COUNTY GRANTS 150,000 0 0 0 0
Total 150,000 0 0 0 0 REVENUE FROM OTHER AGENCIES
4600 CHARGES FOR SERVICES
4647 MISC REIMBURSEMENT 0 0 75,482 0 0
Total 0 0 75,482 0 0 CHARGES FOR SERVICES
Total 150,000 0 75,482 0 0 PARKS
169 STATE PARK BOND
2010
ActualsTitle/Object
2013
Yr. End Est
2012
Actuals
2014
Adopted 2011
Actuals
4400 USE OF MONEY AND PROPERTY
Total 0 0 0 0 0 USE OF MONEY AND PROPERTY
4500 REVENUE FROM OTHER AGENCIES
60
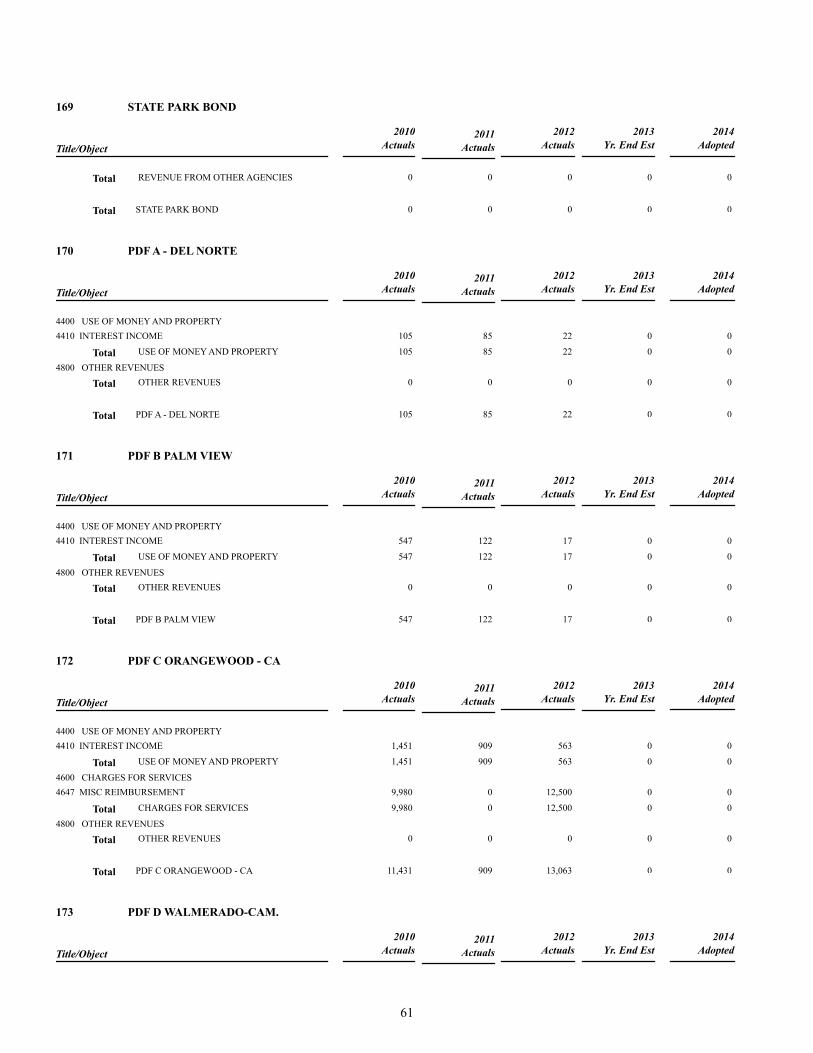
169 STATE PARK BOND
2010
ActualsTitle/Object
2013
Yr. End Est
2012
Actuals
2014
Adopted 2011
Actuals
Total 0 0 0 0 0 REVENUE FROM OTHER AGENCIES
Total 0 0 0 0 0 STATE PARK BOND
170 PDF A - DEL NORTE
2010
ActualsTitle/Object
2013
Yr. End Est
2012
Actuals
2014
Adopted 2011
Actuals
4400 USE OF MONEY AND PROPERTY
4410 INTEREST INCOME 105 85 22 0 0
Total 105 85 22 0 0 USE OF MONEY AND PROPERTY
4800 OTHER REVENUES
Total 0 0 0 0 0 OTHER REVENUES
Total 105 85 22 0 0 PDF A - DEL NORTE
171 PDF B PALM VIEW
2010
ActualsTitle/Object
2013
Yr. End Est
2012
Actuals
2014
Adopted 2011
Actuals
4400 USE OF MONEY AND PROPERTY
4410 INTEREST INCOME 547 122 17 0 0
Total 547 122 17 0 0 USE OF MONEY AND PROPERTY
4800 OTHER REVENUES
Total 0 0 0 0 0 OTHER REVENUES
Total 547 122 17 0 0 PDF B PALM VIEW
172 PDF C ORANGEWOOD - CA
2010
ActualsTitle/Object
2013
Yr. End Est
2012
Actuals
2014
Adopted 2011
Actuals
4400 USE OF MONEY AND PROPERTY
4410 INTEREST INCOME 1,451 909 563 0 0
Total 1,451 909 563 0 0 USE OF MONEY AND PROPERTY
4600 CHARGES FOR SERVICES
4647 MISC REIMBURSEMENT 9,980 0 12,500 0 0
Total 9,980 0 12,500 0 0 CHARGES FOR SERVICES
4800 OTHER REVENUES
Total 0 0 0 0 0 OTHER REVENUES
Total 11,431 909 13,063 0 0 PDF C ORANGEWOOD - CA
173 PDF D WALMERADO-CAM.
2010
ActualsTitle/Object
2013
Yr. End Est
2012
Actuals
2014
Adopted 2011
Actuals
61
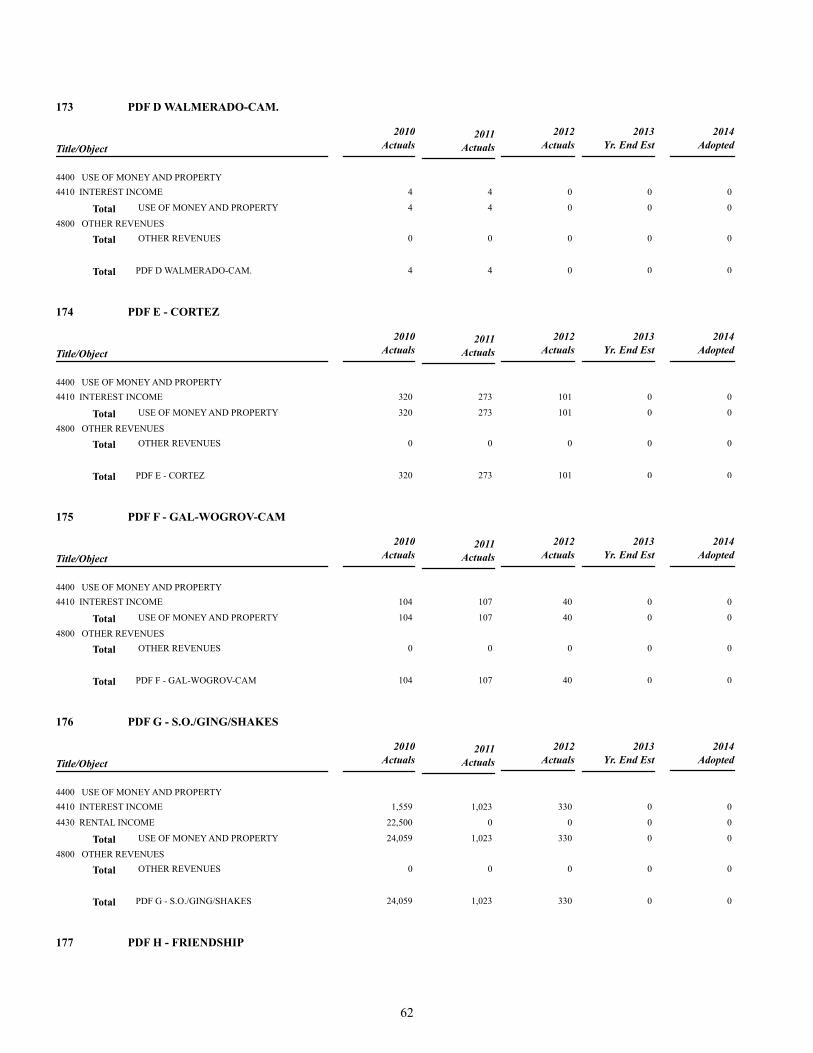
173 PDF D WALMERADO-CAM.
2010
ActualsTitle/Object
2013
Yr. End Est
2012
Actuals
2014
Adopted 2011
Actuals
4400 USE OF MONEY AND PROPERTY
4410 INTEREST INCOME 4 4 0 0 0
Total 4 4 0 0 0 USE OF MONEY AND PROPERTY
4800 OTHER REVENUES
Total 0 0 0 0 0 OTHER REVENUES
Total 4 4 0 0 0 PDF D WALMERADO-CAM.
174 PDF E - CORTEZ
2010
ActualsTitle/Object
2013
Yr. End Est
2012
Actuals
2014
Adopted 2011
Actuals
4400 USE OF MONEY AND PROPERTY
4410 INTEREST INCOME 320 273 101 0 0
Total 320 273 101 0 0 USE OF MONEY AND PROPERTY
4800 OTHER REVENUES
Total 0 0 0 0 0 OTHER REVENUES
Total 320 273 101 0 0 PDF E - CORTEZ
175 PDF F - GAL-WOGROV-CAM
2010
ActualsTitle/Object
2013
Yr. End Est
2012
Actuals
2014
Adopted 2011
Actuals
4400 USE OF MONEY AND PROPERTY
4410 INTEREST INCOME 104 107 40 0 0
Total 104 107 40 0 0 USE OF MONEY AND PROPERTY
4800 OTHER REVENUES
Total 0 0 0 0 0 OTHER REVENUES
Total 104 107 40 0 0 PDF F - GAL-WOGROV-CAM
176 PDF G - S.O./GING/SHAKES
2010
ActualsTitle/Object
2013
Yr. End Est
2012
Actuals
2014
Adopted 2011
Actuals
4400 USE OF MONEY AND PROPERTY
4410 INTEREST INCOME 1,559 1,023 330 0 0
4430 RENTAL INCOME 22,500 0 0 0 0
Total 24,059 1,023 330 0 0 USE OF MONEY AND PROPERTY
4800 OTHER REVENUES
Total 0 0 0 0 0 OTHER REVENUES
Total 24,059 1,023 330 0 0 PDF G - S.O./GING/SHAKES
177 PDF H - FRIENDSHIP
62
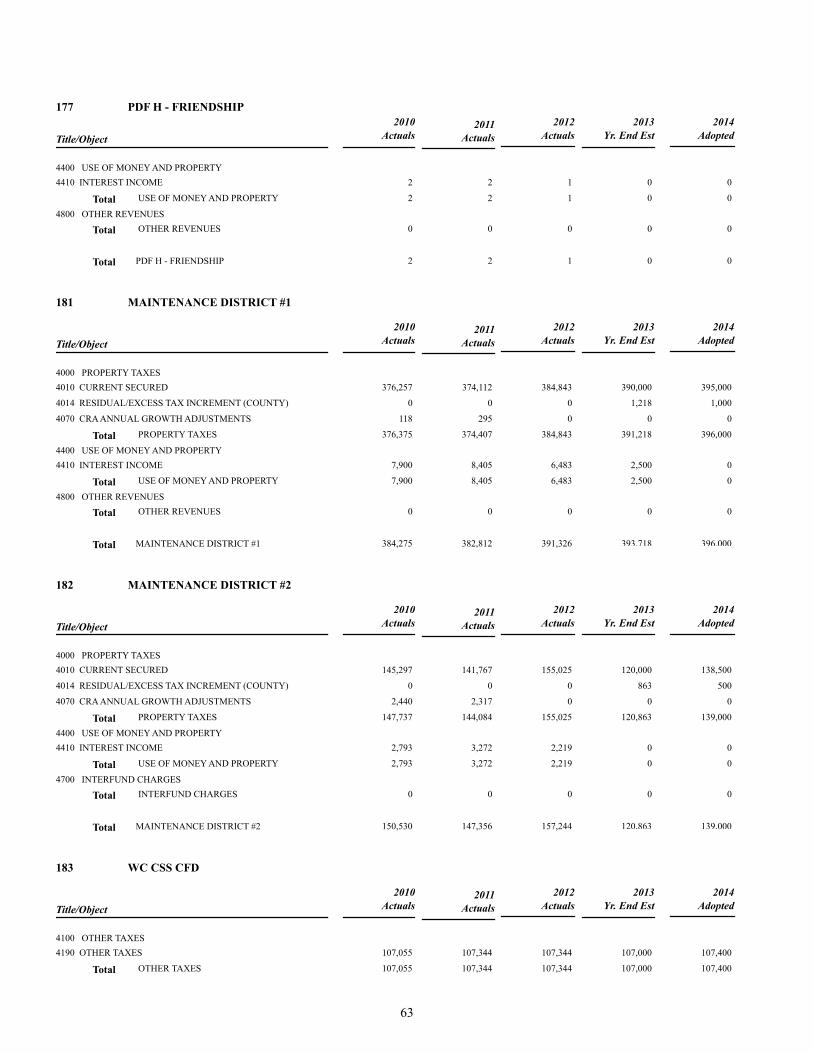
177 PDF H - FRIENDSHIP
2010
ActualsTitle/Object
2013
Yr. End Est
2012
Actuals
2014
Adopted 2011
Actuals
4400 USE OF MONEY AND PROPERTY
4410 INTEREST INCOME 2 2 1 0 0
Total 2 2 1 0 0 USE OF MONEY AND PROPERTY
4800 OTHER REVENUES
Total 0 0 0 0 0 OTHER REVENUES
Total 2 2 1 0 0 PDF H - FRIENDSHIP
181 MAINTENANCE DISTRICT #1
2010
ActualsTitle/Object
2013
Yr. End Est
2012
Actuals
2014
Adopted 2011
Actuals
4000 PROPERTY TAXES
4010 CURRENT SECURED 376,257 374,112 384,843 390,000 395,000
4014 RESIDUAL/EXCESS TAX INCREMENT (COUNTY) 0 0 0 1,218 1,000
4070 CRA ANNUAL GROWTH ADJUSTMENTS 118 295 0 0 0
Total 376,375 374,407 384,843 391,218 396,000 PROPERTY TAXES
4400 USE OF MONEY AND PROPERTY
4410 INTEREST INCOME 7,900 8,405 6,483 2,500 0
Total 7,900 8,405 6,483 2,500 0 USE OF MONEY AND PROPERTY
4800 OTHER REVENUES
Total 0 0 0 0 0 OTHER REVENUES
Total 384,275 382,812 391,326 393,718 396,000 MAINTENANCE DISTRICT #1
182 MAINTENANCE DISTRICT #2
2010
ActualsTitle/Object
2013
Yr. End Est
2012
Actuals
2014
Adopted 2011
Actuals
4000 PROPERTY TAXES
4010 CURRENT SECURED 145,297 141,767 155,025 120,000 138,500
4014 RESIDUAL/EXCESS TAX INCREMENT (COUNTY) 0 0 0 863 500
4070 CRA ANNUAL GROWTH ADJUSTMENTS 2,440 2,317 0 0 0
Total 147,737 144,084 155,025 120,863 139,000 PROPERTY TAXES
4400 USE OF MONEY AND PROPERTY
4410 INTEREST INCOME 2,793 3,272 2,219 0 0
Total 2,793 3,272 2,219 0 0 USE OF MONEY AND PROPERTY
4700 INTERFUND CHARGES
Total 0 0 0 0 0 INTERFUND CHARGES
Total 150,530 147,356 157,244 120,863 139,000 MAINTENANCE DISTRICT #2
183 WC CSS CFD
2010
ActualsTitle/Object
2013
Yr. End Est
2012
Actuals
2014
Adopted 2011
Actuals
4100 OTHER TAXES
4190 OTHER TAXES 107,055 107,344 107,344 107,000 107,400
Total 107,055 107,344 107,344 107,000 107,400 OTHER TAXES
63
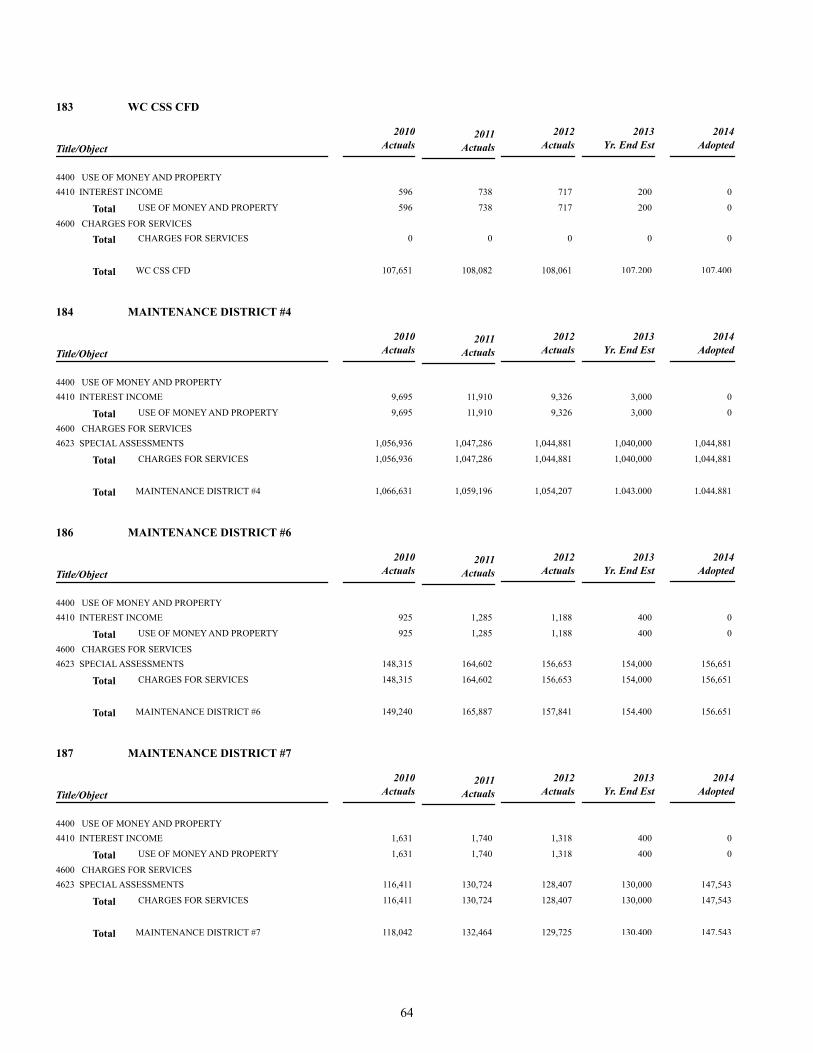
183 WC CSS CFD
2010
ActualsTitle/Object
2013
Yr. End Est
2012
Actuals
2014
Adopted 2011
Actuals
4400 USE OF MONEY AND PROPERTY
4410 INTEREST INCOME 596 738 717 200 0
Total 596 738 717 200 0 USE OF MONEY AND PROPERTY
4600 CHARGES FOR SERVICES
Total 0 0 0 0 0 CHARGES FOR SERVICES
Total 107,651 108,082 108,061 107,200 107,400 WC CSS CFD
184 MAINTENANCE DISTRICT #4
2010
ActualsTitle/Object
2013
Yr. End Est
2012
Actuals
2014
Adopted 2011
Actuals
4400 USE OF MONEY AND PROPERTY
4410 INTEREST INCOME 9,695 11,910 9,326 3,000 0
Total 9,695 11,910 9,326 3,000 0 USE OF MONEY AND PROPERTY
4600 CHARGES FOR SERVICES
4623 SPECIAL ASSESSMENTS 1,056,936 1,047,286 1,044,881 1,040,000 1,044,881
Total 1,056,936 1,047,286 1,044,881 1,040,000 1,044,881 CHARGES FOR SERVICES
Total 1,066,631 1,059,196 1,054,207 1,043,000 1,044,881 MAINTENANCE DISTRICT #4
186 MAINTENANCE DISTRICT #6
2010
ActualsTitle/Object
2013
Yr. End Est
2012
Actuals
2014
Adopted 2011
Actuals
4400 USE OF MONEY AND PROPERTY
4410 INTEREST INCOME 925 1,285 1,188 400 0
Total 925 1,285 1,188 400 0 USE OF MONEY AND PROPERTY
4600 CHARGES FOR SERVICES
4623 SPECIAL ASSESSMENTS 148,315 164,602 156,653 154,000 156,651
Total 148,315 164,602 156,653 154,000 156,651 CHARGES FOR SERVICES
Total 149,240 165,887 157,841 154,400 156,651 MAINTENANCE DISTRICT #6
187 MAINTENANCE DISTRICT #7
2010
ActualsTitle/Object
2013
Yr. End Est
2012
Actuals
2014
Adopted 2011
Actuals
4400 USE OF MONEY AND PROPERTY
4410 INTEREST INCOME 1,631 1,740 1,318 400 0
Total 1,631 1,740 1,318 400 0 USE OF MONEY AND PROPERTY
4600 CHARGES FOR SERVICES
4623 SPECIAL ASSESSMENTS 116,411 130,724 128,407 130,000 147,543
Total 116,411 130,724 128,407 130,000 147,543 CHARGES FOR SERVICES
Total 118,042 132,464 129,725 130,400 147,543 MAINTENANCE DISTRICT #7
64
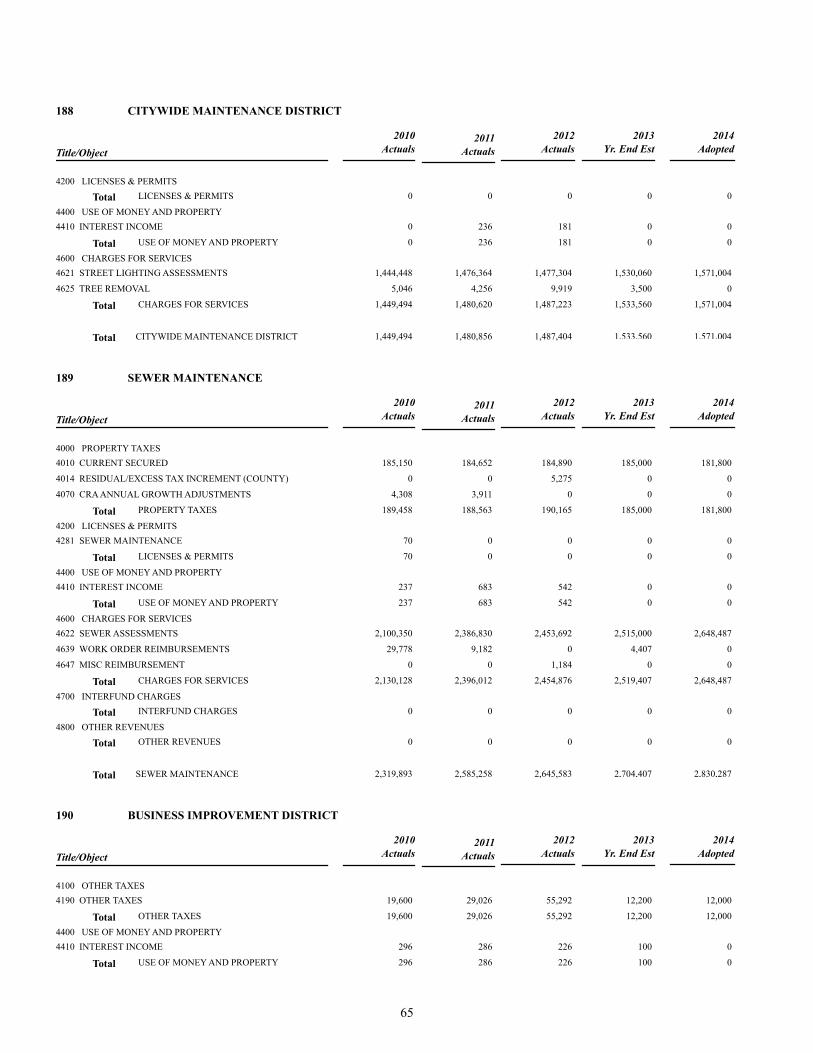
188 CITYWIDE MAINTENANCE DISTRICT
2010
ActualsTitle/Object
2013
Yr. End Est
2012
Actuals
2014
Adopted 2011
Actuals
4200 LICENSES & PERMITS
Total 0 0 0 0 0 LICENSES & PERMITS
4400 USE OF MONEY AND PROPERTY
4410 INTEREST INCOME 0 236 181 0 0
Total 0 236 181 0 0 USE OF MONEY AND PROPERTY
4600 CHARGES FOR SERVICES
4621 STREET LIGHTING ASSESSMENTS 1,444,448 1,476,364 1,477,304 1,530,060 1,571,004
4625 TREE REMOVAL 5,046 4,256 9,919 3,500 0
Total 1,449,494 1,480,620 1,487,223 1,533,560 1,571,004 CHARGES FOR SERVICES
Total 1,449,494 1,480,856 1,487,404 1,533,560 1,571,004 CITYWIDE MAINTENANCE DISTRICT
189 SEWER MAINTENANCE
2010
ActualsTitle/Object
2013
Yr. End Est
2012
Actuals
2014
Adopted 2011
Actuals
4000 PROPERTY TAXES
4010 CURRENT SECURED 185,150 184,652 184,890 185,000 181,800
4014 RESIDUAL/EXCESS TAX INCREMENT (COUNTY) 0 0 5,275 0 0
4070 CRA ANNUAL GROWTH ADJUSTMENTS 4,308 3,911 0 0 0
Total 189,458 188,563 190,165 185,000 181,800 PROPERTY TAXES
4200 LICENSES & PERMITS
4281 SEWER MAINTENANCE 70 0 0 0 0
Total 70 0 0 0 0 LICENSES & PERMITS
4400 USE OF MONEY AND PROPERTY
4410 INTEREST INCOME 237 683 542 0 0
Total 237 683 542 0 0 USE OF MONEY AND PROPERTY
4600 CHARGES FOR SERVICES
4622 SEWER ASSESSMENTS 2,100,350 2,386,830 2,453,692 2,515,000 2,648,487
4639 WORK ORDER REIMBURSEMENTS 29,778 9,182 0 4,407 0
4647 MISC REIMBURSEMENT 0 0 1,184 0 0
Total 2,130,128 2,396,012 2,454,876 2,519,407 2,648,487 CHARGES FOR SERVICES
4700 INTERFUND CHARGES
Total 0 0 0 0 0 INTERFUND CHARGES
4800 OTHER REVENUES
Total 0 0 0 0 0 OTHER REVENUES
Total 2,319,893 2,585,258 2,645,583 2,704,407 2,830,287 SEWER MAINTENANCE
190 BUSINESS IMPROVEMENT DISTRICT
2010
ActualsTitle/Object
2013
Yr. End Est
2012
Actuals
2014
Adopted 2011
Actuals
4100 OTHER TAXES
4190 OTHER TAXES 19,600 29,026 55,292 12,200 12,000
Total 19,600 29,026 55,292 12,200 12,000 OTHER TAXES
4400 USE OF MONEY AND PROPERTY
4410 INTEREST INCOME 296 286 226 100 0
Total 296 286 226 100 0 USE OF MONEY AND PROPERTY
65
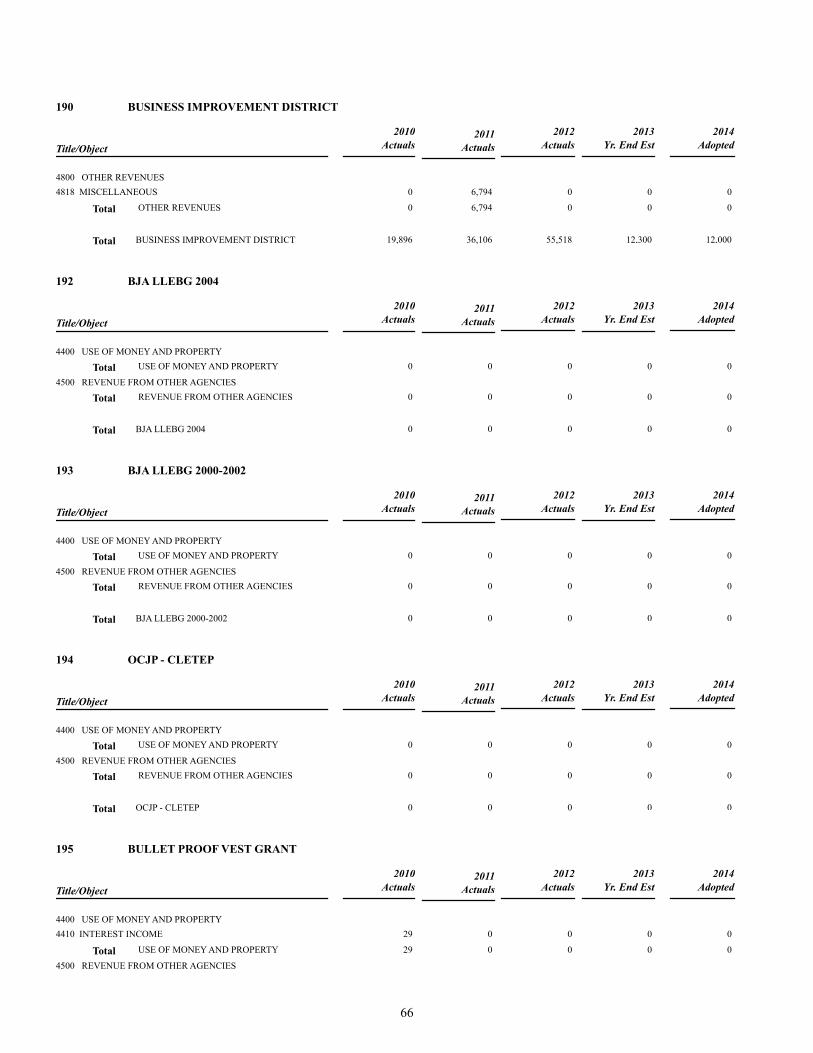
190 BUSINESS IMPROVEMENT DISTRICT
2010
ActualsTitle/Object
2013
Yr. End Est
2012
Actuals
2014
Adopted 2011
Actuals
4800 OTHER REVENUES
4818 MISCELLANEOUS 0 6,794 0 0 0
Total 0 6,794 0 0 0 OTHER REVENUES
Total 19,896 36,106 55,518 12,300 12,000 BUSINESS IMPROVEMENT DISTRICT
192 BJA LLEBG 2004
2010
ActualsTitle/Object
2013
Yr. End Est
2012
Actuals
2014
Adopted 2011
Actuals
4400 USE OF MONEY AND PROPERTY
Total 0 0 0 0 0 USE OF MONEY AND PROPERTY
4500 REVENUE FROM OTHER AGENCIES
Total 0 0 0 0 0 REVENUE FROM OTHER AGENCIES
Total 0 0 0 0 0 BJA LLEBG 2004
193 BJA LLEBG 2000-2002
2010
ActualsTitle/Object
2013
Yr. End Est
2012
Actuals
2014
Adopted 2011
Actuals
4400 USE OF MONEY AND PROPERTY
Total 0 0 0 0 0 USE OF MONEY AND PROPERTY
4500 REVENUE FROM OTHER AGENCIES
Total 0 0 0 0 0 REVENUE FROM OTHER AGENCIES
Total 0 0 0 0 0 BJA LLEBG 2000-2002
194 OCJP - CLETEP
2010
ActualsTitle/Object
2013
Yr. End Est
2012
Actuals
2014
Adopted 2011
Actuals
4400 USE OF MONEY AND PROPERTY
Total 0 0 0 0 0 USE OF MONEY AND PROPERTY
4500 REVENUE FROM OTHER AGENCIES
Total 0 0 0 0 0 REVENUE FROM OTHER AGENCIES
Total 0 0 0 0 0 OCJP - CLETEP
195 BULLET PROOF VEST GRANT
2010
ActualsTitle/Object
2013
Yr. End Est
2012
Actuals
2014
Adopted 2011
Actuals
4400 USE OF MONEY AND PROPERTY
4410 INTEREST INCOME 29 0 0 0 0
Total 29 0 0 0 0 USE OF MONEY AND PROPERTY
4500 REVENUE FROM OTHER AGENCIES
66
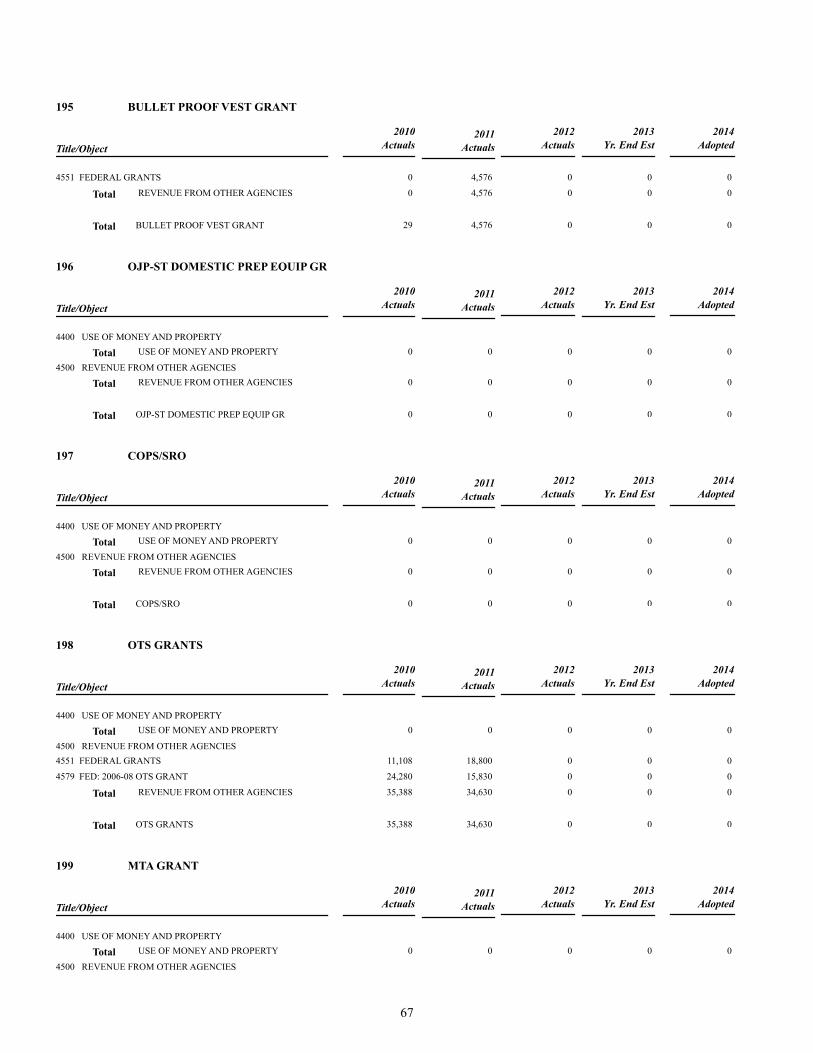
195 BULLET PROOF VEST GRANT
2010
ActualsTitle/Object
2013
Yr. End Est
2012
Actuals
2014
Adopted 2011
Actuals
4551 FEDERAL GRANTS 0 4,576 0 0 0
Total 0 4,576 0 0 0 REVENUE FROM OTHER AGENCIES
Total 29 4,576 0 0 0 BULLET PROOF VEST GRANT
196 OJP-ST DOMESTIC PREP EQUIP GR
2010
ActualsTitle/Object
2013
Yr. End Est
2012
Actuals
2014
Adopted 2011
Actuals
4400 USE OF MONEY AND PROPERTY
Total 0 0 0 0 0 USE OF MONEY AND PROPERTY
4500 REVENUE FROM OTHER AGENCIES
Total 0 0 0 0 0 REVENUE FROM OTHER AGENCIES
Total 0 0 0 0 0 OJP-ST DOMESTIC PREP EQUIP GR
197 COPS/SRO
2010
ActualsTitle/Object
2013
Yr. End Est
2012
Actuals
2014
Adopted 2011
Actuals
4400 USE OF MONEY AND PROPERTY
Total 0 0 0 0 0 USE OF MONEY AND PROPERTY
4500 REVENUE FROM OTHER AGENCIES
Total 0 0 0 0 0 REVENUE FROM OTHER AGENCIES
Total 0 0 0 0 0 COPS/SRO
198 OTS GRANTS
2010
ActualsTitle/Object
2013
Yr. End Est
2012
Actuals
2014
Adopted 2011
Actuals
4400 USE OF MONEY AND PROPERTY
Total 0 0 0 0 0 USE OF MONEY AND PROPERTY
4500 REVENUE FROM OTHER AGENCIES
4551 FEDERAL GRANTS 11,108 18,800 0 0 0
4579 FED: 2006-08 OTS GRANT 24,280 15,830 0 0 0
Total 35,388 34,630 0 0 0 REVENUE FROM OTHER AGENCIES
Total 35,388 34,630 0 0 0 OTS GRANTS
199 MTA GRANT
2010
ActualsTitle/Object
2013
Yr. End Est
2012
Actuals
2014
Adopted 2011
Actuals
4400 USE OF MONEY AND PROPERTY
Total 0 0 0 0 0 USE OF MONEY AND PROPERTY
4500 REVENUE FROM OTHER AGENCIES
67
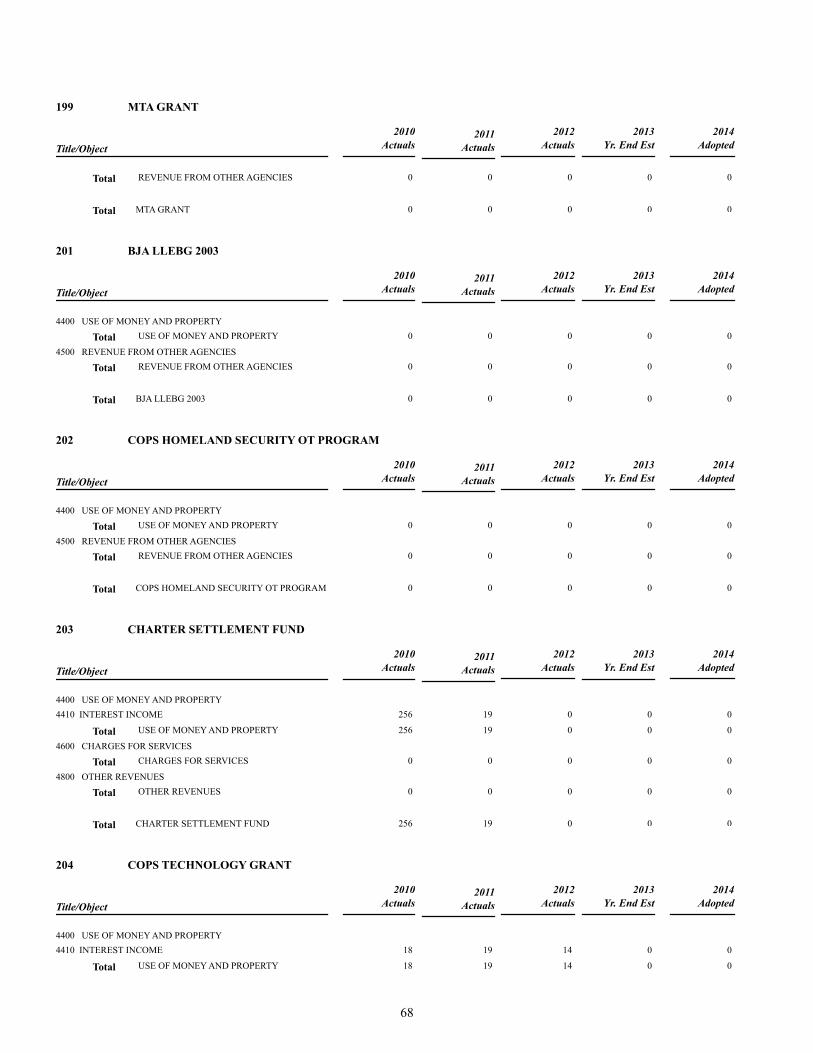
199 MTA GRANT
2010
ActualsTitle/Object
2013
Yr. End Est
2012
Actuals
2014
Adopted 2011
Actuals
Total 0 0 0 0 0 REVENUE FROM OTHER AGENCIES
Total 0 0 0 0 0 MTA GRANT
201 BJA LLEBG 2003
2010
ActualsTitle/Object
2013
Yr. End Est
2012
Actuals
2014
Adopted 2011
Actuals
4400 USE OF MONEY AND PROPERTY
Total 0 0 0 0 0 USE OF MONEY AND PROPERTY
4500 REVENUE FROM OTHER AGENCIES
Total 0 0 0 0 0 REVENUE FROM OTHER AGENCIES
Total 0 0 0 0 0 BJA LLEBG 2003
202 COPS HOMELAND SECURITY OT PROGRAM
2010
ActualsTitle/Object
2013
Yr. End Est
2012
Actuals
2014
Adopted 2011
Actuals
4400 USE OF MONEY AND PROPERTY
Total 0 0 0 0 0 USE OF MONEY AND PROPERTY
4500 REVENUE FROM OTHER AGENCIES
Total 0 0 0 0 0 REVENUE FROM OTHER AGENCIES
Total 0 0 0 0 0 COPS HOMELAND SECURITY OT PROGRAM
203 CHARTER SETTLEMENT FUND
2010
ActualsTitle/Object
2013
Yr. End Est
2012
Actuals
2014
Adopted 2011
Actuals
4400 USE OF MONEY AND PROPERTY
4410 INTEREST INCOME 256 19 0 0 0
Total 256 19 0 0 0 USE OF MONEY AND PROPERTY
4600 CHARGES FOR SERVICES
Total 0 0 0 0 0 CHARGES FOR SERVICES
4800 OTHER REVENUES
Total 0 0 0 0 0 OTHER REVENUES
Total 256 19 0 0 0 CHARTER SETTLEMENT FUND
204 COPS TECHNOLOGY GRANT
2010
ActualsTitle/Object
2013
Yr. End Est
2012
Actuals
2014
Adopted 2011
Actuals
4400 USE OF MONEY AND PROPERTY
4410 INTEREST INCOME 18 19 14 0 0
Total 18 19 14 0 0 USE OF MONEY AND PROPERTY
68
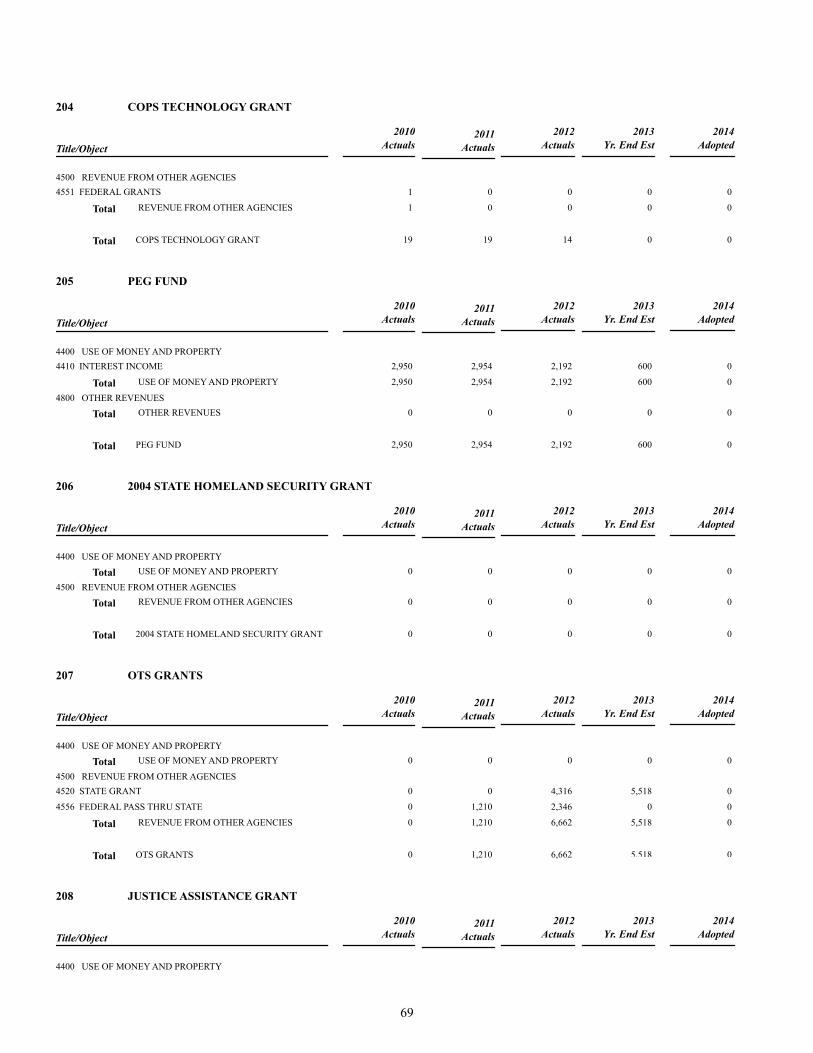
204 COPS TECHNOLOGY GRANT
2010
ActualsTitle/Object
2013
Yr. End Est
2012
Actuals
2014
Adopted 2011
Actuals
4500 REVENUE FROM OTHER AGENCIES
4551 FEDERAL GRANTS 1 0 0 0 0
Total 1 0 0 0 0 REVENUE FROM OTHER AGENCIES
Total 19 19 14 0 0 COPS TECHNOLOGY GRANT
205 PEG FUND
2010
ActualsTitle/Object
2013
Yr. End Est
2012
Actuals
2014
Adopted 2011
Actuals
4400 USE OF MONEY AND PROPERTY
4410 INTEREST INCOME 2,950 2,954 2,192 600 0
Total 2,950 2,954 2,192 600 0 USE OF MONEY AND PROPERTY
4800 OTHER REVENUES
Total 0 0 0 0 0 OTHER REVENUES
Total 2,950 2,954 2,192 600 0 PEG FUND
206 2004 STATE HOMELAND SECURITY GRANT
2010
ActualsTitle/Object
2013
Yr. End Est
2012
Actuals
2014
Adopted 2011
Actuals
4400 USE OF MONEY AND PROPERTY
Total 0 0 0 0 0 USE OF MONEY AND PROPERTY
4500 REVENUE FROM OTHER AGENCIES
Total 0 0 0 0 0 REVENUE FROM OTHER AGENCIES
Total 0 0 0 0 0 2004 STATE HOMELAND SECURITY GRANT
207 OTS GRANTS
2010
ActualsTitle/Object
2013
Yr. End Est
2012
Actuals
2014
Adopted 2011
Actuals
4400 USE OF MONEY AND PROPERTY
Total 0 0 0 0 0 USE OF MONEY AND PROPERTY
4500 REVENUE FROM OTHER AGENCIES
4520 STATE GRANT 0 0 4,316 5,518 0
4556 FEDERAL PASS THRU STATE 0 1,210 2,346 0 0
Total 0 1,210 6,662 5,518 0 REVENUE FROM OTHER AGENCIES
Total 0 1,210 6,662 5,518 0 OTS GRANTS
208 JUSTICE ASSISTANCE GRANT
2010
ActualsTitle/Object
2013
Yr. End Est
2012
Actuals
2014
Adopted 2011
Actuals
4400 USE OF MONEY AND PROPERTY
69
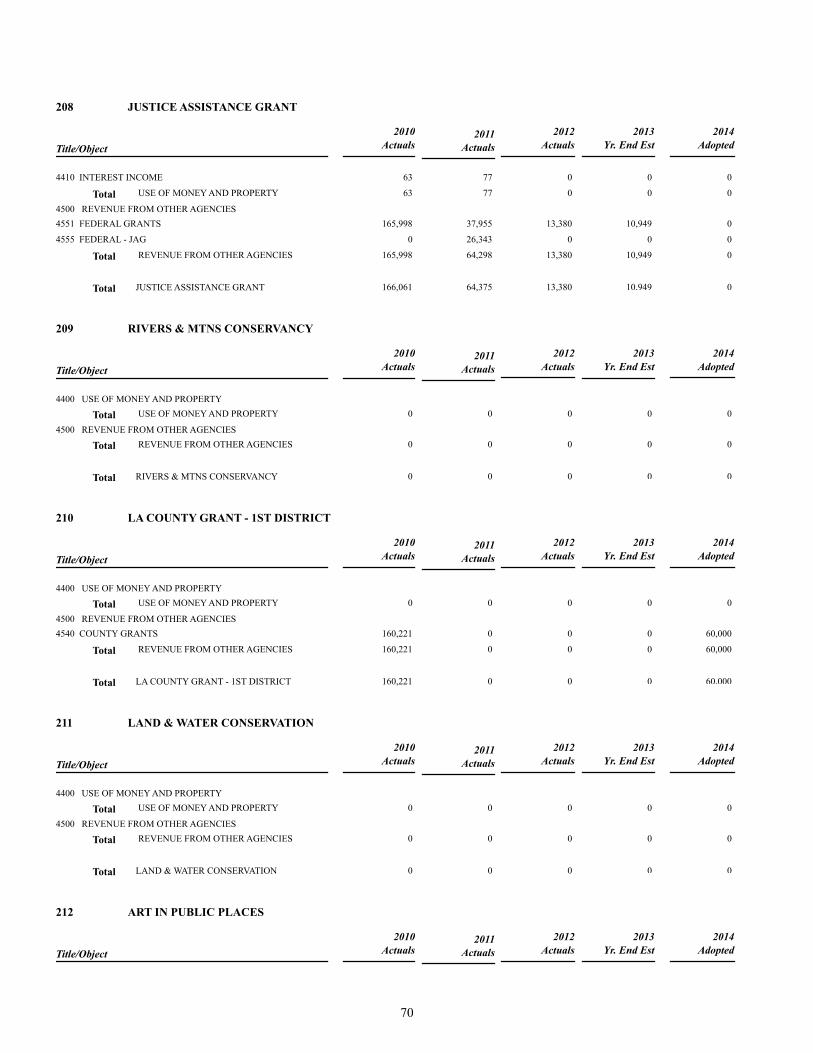
208 JUSTICE ASSISTANCE GRANT
2010
ActualsTitle/Object
2013
Yr. End Est
2012
Actuals
2014
Adopted 2011
Actuals
4410 INTEREST INCOME 63 77 0 0 0
Total 63 77 0 0 0 USE OF MONEY AND PROPERTY
4500 REVENUE FROM OTHER AGENCIES
4551 FEDERAL GRANTS 165,998 37,955 13,380 10,949 0
4555 FEDERAL - JAG 0 26,343 0 0 0
Total 165,998 64,298 13,380 10,949 0 REVENUE FROM OTHER AGENCIES
Total 166,061 64,375 13,380 10,949 0 JUSTICE ASSISTANCE GRANT
209 RIVERS & MTNS CONSERVANCY
2010
ActualsTitle/Object
2013
Yr. End Est
2012
Actuals
2014
Adopted 2011
Actuals
4400 USE OF MONEY AND PROPERTY
Total 0 0 0 0 0 USE OF MONEY AND PROPERTY
4500 REVENUE FROM OTHER AGENCIES
Total 0 0 0 0 0 REVENUE FROM OTHER AGENCIES
Total 0 0 0 0 0 RIVERS & MTNS CONSERVANCY
210 LA COUNTY GRANT - 1ST DISTRICT
2010
ActualsTitle/Object
2013
Yr. End Est
2012
Actuals
2014
Adopted 2011
Actuals
4400 USE OF MONEY AND PROPERTY
Total 0 0 0 0 0 USE OF MONEY AND PROPERTY
4500 REVENUE FROM OTHER AGENCIES
4540 COUNTY GRANTS 160,221 0 0 0 60,000
Total 160,221 0 0 0 60,000 REVENUE FROM OTHER AGENCIES
Total 160,221 0 0 0 60,000 LA COUNTY GRANT - 1ST DISTRICT
211 LAND & WATER CONSERVATION
2010
ActualsTitle/Object
2013
Yr. End Est
2012
Actuals
2014
Adopted 2011
Actuals
4400 USE OF MONEY AND PROPERTY
Total 0 0 0 0 0 USE OF MONEY AND PROPERTY
4500 REVENUE FROM OTHER AGENCIES
Total 0 0 0 0 0 REVENUE FROM OTHER AGENCIES
Total 0 0 0 0 0 LAND & WATER CONSERVATION
212 ART IN PUBLIC PLACES
2010
ActualsTitle/Object
2013
Yr. End Est
2012
Actuals
2014
Adopted 2011
Actuals
70

212 ART IN PUBLIC PLACES
2010
ActualsTitle/Object
2013
Yr. End Est
2012
Actuals
2014
Adopted 2011
Actuals
4400 USE OF MONEY AND PROPERTY
4410 INTEREST INCOME 242 513 471 0 0
Total 242 513 471 0 0 USE OF MONEY AND PROPERTY
4800 OTHER REVENUES
4859 ART IN PUBLIC PLACES 28,292 29,292 25,965 10,566 10,000
Total 28,292 29,292 25,965 10,566 10,000 OTHER REVENUES
Total 28,534 29,805 26,436 10,566 10,000 ART IN PUBLIC PLACES
213 ST HOMELAND SECURITY - 2005
2010
ActualsTitle/Object
2013
Yr. End Est
2012
Actuals
2014
Adopted 2011
Actuals
4400 USE OF MONEY AND PROPERTY
Total 0 0 0 0 0 USE OF MONEY AND PROPERTY
4500 REVENUE FROM OTHER AGENCIES
Total 0 0 0 0 0 REVENUE FROM OTHER AGENCIES
Total 0 0 0 0 0 ST HOMELAND SECURITY - 2005
214 USDOJ COPS GRANT
2010
ActualsTitle/Object
2013
Yr. End Est
2012
Actuals
2014
Adopted 2011
Actuals
4400 USE OF MONEY AND PROPERTY
4410 INTEREST INCOME 7 0 0 0 0
Total 7 0 0 0 0 USE OF MONEY AND PROPERTY
4500 REVENUE FROM OTHER AGENCIES
4551 FEDERAL GRANTS 73,720 12,376 0 5,578 0
Total 73,720 12,376 0 5,578 0 REVENUE FROM OTHER AGENCIES
Total 73,727 12,376 0 5,578 0 USDOJ COPS GRANT
215 N. AZUSA RELINQUISHMENT
2010
ActualsTitle/Object
2013
Yr. End Est
2012
Actuals
2014
Adopted 2011
Actuals
4400 USE OF MONEY AND PROPERTY
4410 INTEREST INCOME 2,879 2,928 2,191 700 0
Total 2,879 2,928 2,191 700 0 USE OF MONEY AND PROPERTY
4500 REVENUE FROM OTHER AGENCIES
Total 0 0 0 0 0 REVENUE FROM OTHER AGENCIES
Total 2,879 2,928 2,191 700 0 N. AZUSA RELINQUISHMENT
216 SAFE ROUTES TO SCHOOLS GRANT
71
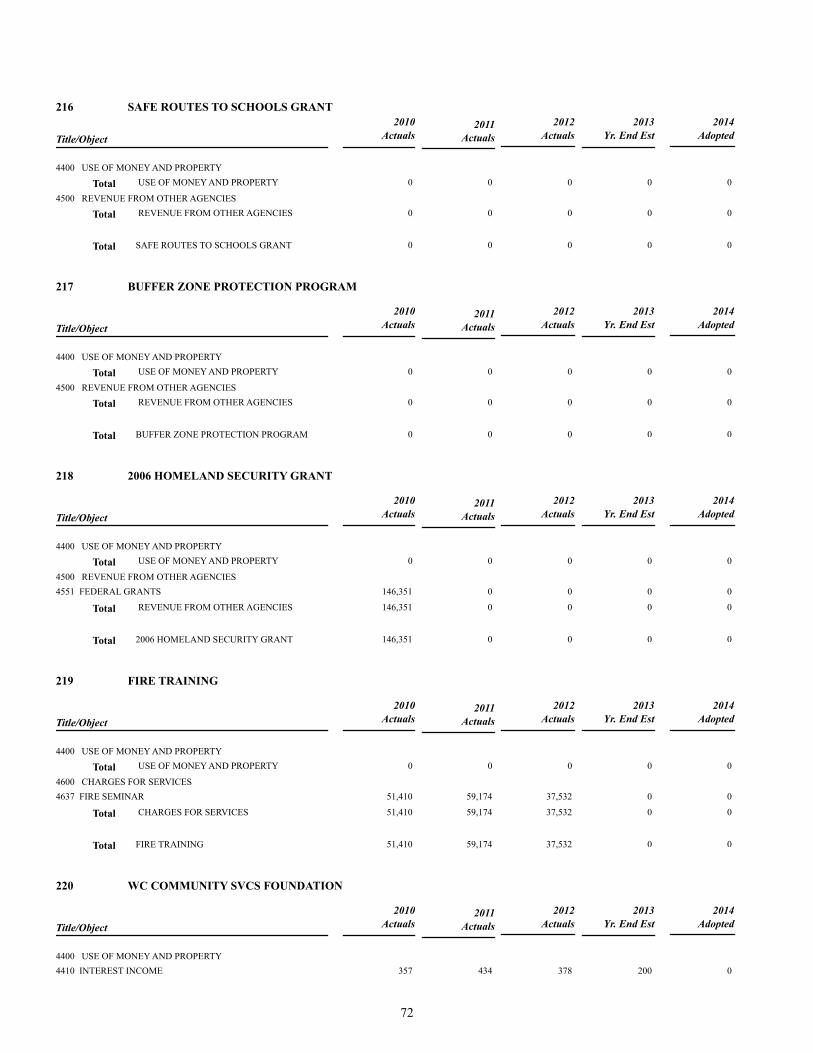
216 SAFE ROUTES TO SCHOOLS GRANT
2010
ActualsTitle/Object
2013
Yr. End Est
2012
Actuals
2014
Adopted 2011
Actuals
4400 USE OF MONEY AND PROPERTY
Total 0 0 0 0 0 USE OF MONEY AND PROPERTY
4500 REVENUE FROM OTHER AGENCIES
Total 0 0 0 0 0 REVENUE FROM OTHER AGENCIES
Total 0 0 0 0 0 SAFE ROUTES TO SCHOOLS GRANT
217 BUFFER ZONE PROTECTION PROGRAM
2010
ActualsTitle/Object
2013
Yr. End Est
2012
Actuals
2014
Adopted 2011
Actuals
4400 USE OF MONEY AND PROPERTY
Total 0 0 0 0 0 USE OF MONEY AND PROPERTY
4500 REVENUE FROM OTHER AGENCIES
Total 0 0 0 0 0 REVENUE FROM OTHER AGENCIES
Total 0 0 0 0 0 BUFFER ZONE PROTECTION PROGRAM
218 2006 HOMELAND SECURITY GRANT
2010
ActualsTitle/Object
2013
Yr. End Est
2012
Actuals
2014
Adopted 2011
Actuals
4400 USE OF MONEY AND PROPERTY
Total 0 0 0 0 0 USE OF MONEY AND PROPERTY
4500 REVENUE FROM OTHER AGENCIES
4551 FEDERAL GRANTS 146,351 0 0 0 0
Total 146,351 0 0 0 0 REVENUE FROM OTHER AGENCIES
Total 146,351 0 0 0 0 2006 HOMELAND SECURITY GRANT
219 FIRE TRAINING
2010
ActualsTitle/Object
2013
Yr. End Est
2012
Actuals
2014
Adopted 2011
Actuals
4400 USE OF MONEY AND PROPERTY
Total 0 0 0 0 0 USE OF MONEY AND PROPERTY
4600 CHARGES FOR SERVICES
4637 FIRE SEMINAR 51,410 59,174 37,532 0 0
Total 51,410 59,174 37,532 0 0 CHARGES FOR SERVICES
Total 51,410 59,174 37,532 0 0 FIRE TRAINING
220 WC COMMUNITY SVCS FOUNDATION
2010
ActualsTitle/Object
2013
Yr. End Est
2012
Actuals
2014
Adopted 2011
Actuals
4400 USE OF MONEY AND PROPERTY
4410 INTEREST INCOME 357 434 378 200 0
72
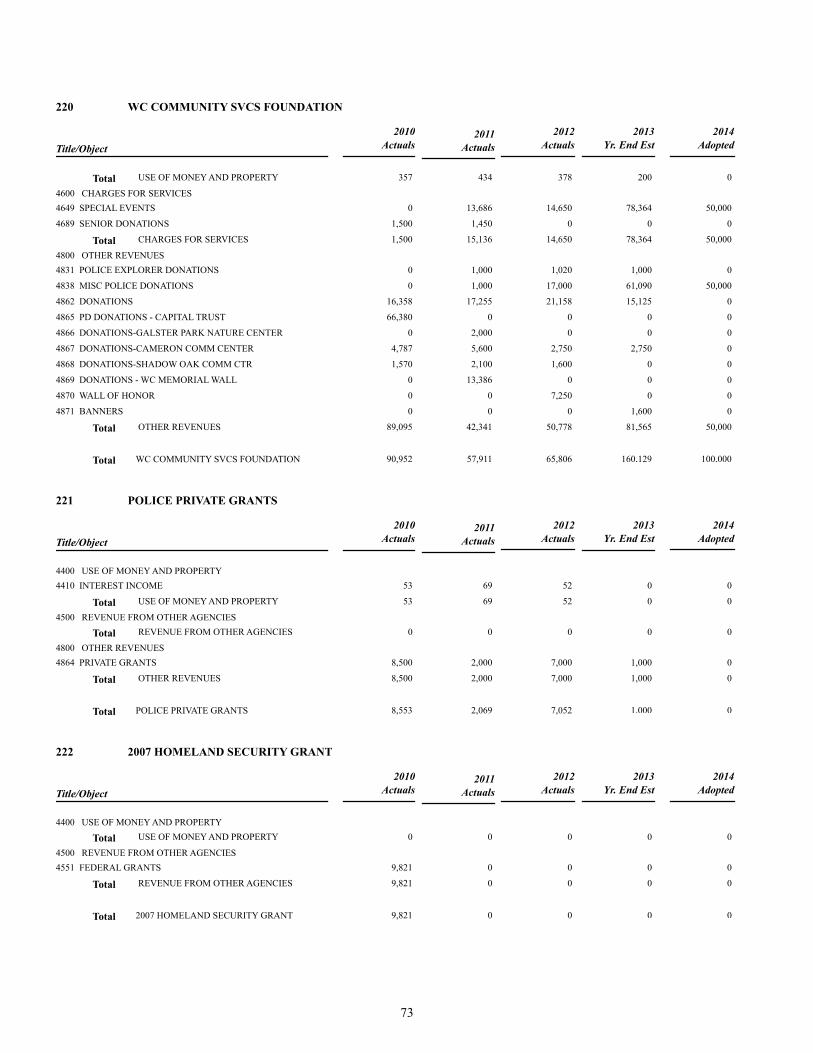
220 WC COMMUNITY SVCS FOUNDATION
2010
ActualsTitle/Object
2013
Yr. End Est
2012
Actuals
2014
Adopted 2011
Actuals
Total 357 434 378 200 0 USE OF MONEY AND PROPERTY
4600 CHARGES FOR SERVICES
4649 SPECIAL EVENTS 0 13,686 14,650 78,364 50,000
4689 SENIOR DONATIONS 1,500 1,450 0 0 0
Total 1,500 15,136 14,650 78,364 50,000 CHARGES FOR SERVICES
4800 OTHER REVENUES
4831 POLICE EXPLORER DONATIONS 0 1,000 1,020 1,000 0
4838 MISC POLICE DONATIONS 0 1,000 17,000 61,090 50,000
4862 DONATIONS 16,358 17,255 21,158 15,125 0
4865 PD DONATIONS - CAPITAL TRUST 66,380 0 0 0 0
4866 DONATIONS-GALSTER PARK NATURE CENTER 0 2,000 0 0 0
4867 DONATIONS-CAMERON COMM CENTER 4,787 5,600 2,750 2,750 0
4868 DONATIONS-SHADOW OAK COMM CTR 1,570 2,100 1,600 0 0
4869 DONATIONS - WC MEMORIAL WALL 0 13,386 0 0 0
4870 WALL OF HONOR 0 0 7,250 0 0
4871 BANNERS 0 0 0 1,600 0
Total 89,095 42,341 50,778 81,565 50,000 OTHER REVENUES
Total 90,952 57,911 65,806 160,129 100,000 WC COMMUNITY SVCS FOUNDATION
221 POLICE PRIVATE GRANTS
2010
ActualsTitle/Object
2013
Yr. End Est
2012
Actuals
2014
Adopted 2011
Actuals
4400 USE OF MONEY AND PROPERTY
4410 INTEREST INCOME 53 69 52 0 0
Total 53 69 52 0 0 USE OF MONEY AND PROPERTY
4500 REVENUE FROM OTHER AGENCIES
Total 0 0 0 0 0 REVENUE FROM OTHER AGENCIES
4800 OTHER REVENUES
4864 PRIVATE GRANTS 8,500 2,000 7,000 1,000 0
Total 8,500 2,000 7,000 1,000 0 OTHER REVENUES
Total 8,553 2,069 7,052 1,000 0 POLICE PRIVATE GRANTS
222 2007 HOMELAND SECURITY GRANT
2010
ActualsTitle/Object
2013
Yr. End Est
2012
Actuals
2014
Adopted 2011
Actuals
4400 USE OF MONEY AND PROPERTY
Total 0 0 0 0 0 USE OF MONEY AND PROPERTY
4500 REVENUE FROM OTHER AGENCIES
4551 FEDERAL GRANTS 9,821 0 0 0 0
Total 9,821 0 0 0 0 REVENUE FROM OTHER AGENCIES
Total 9,821 0 0 0 0 2007 HOMELAND SECURITY GRANT
73
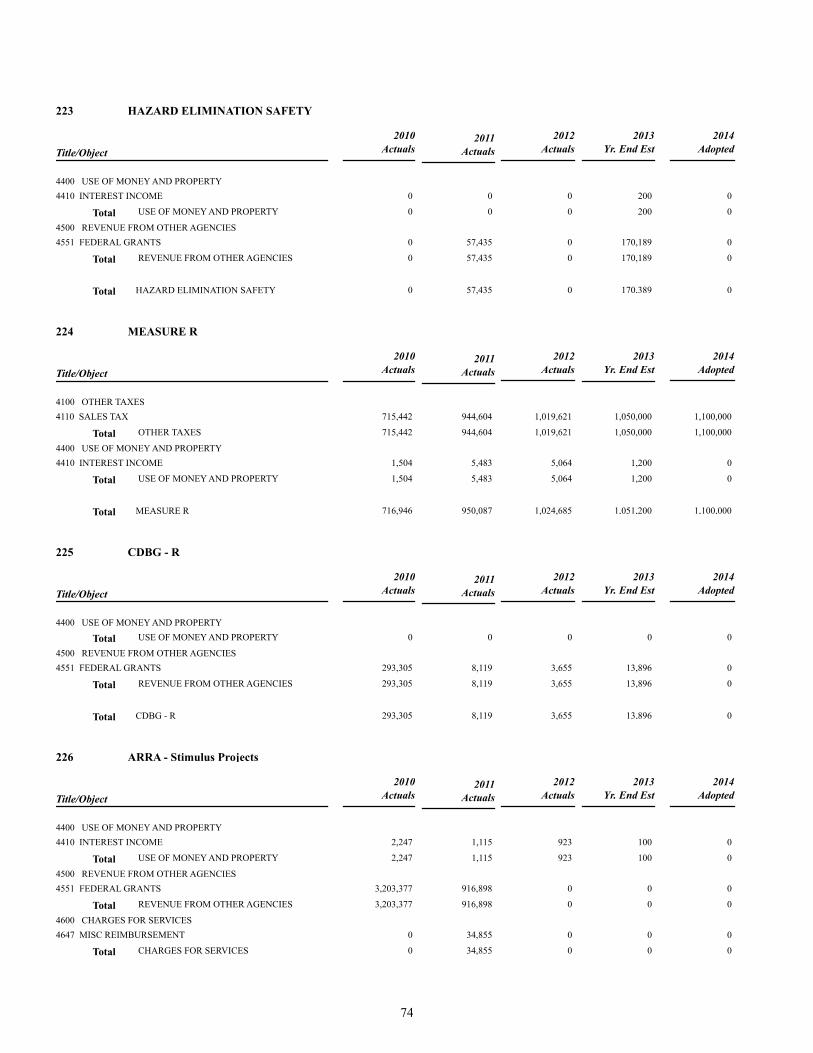
223 HAZARD ELIMINATION SAFETY
2010
ActualsTitle/Object
2013
Yr. End Est
2012
Actuals
2014
Adopted 2011
Actuals
4400 USE OF MONEY AND PROPERTY
4410 INTEREST INCOME 0 0 0 200 0
Total 0 0 0 200 0 USE OF MONEY AND PROPERTY
4500 REVENUE FROM OTHER AGENCIES
4551 FEDERAL GRANTS 0 57,435 0 170,189 0
Total 0 57,435 0 170,189 0 REVENUE FROM OTHER AGENCIES
Total 0 57,435 0 170,389 0 HAZARD ELIMINATION SAFETY
224 MEASURE R
2010
ActualsTitle/Object
2013
Yr. End Est
2012
Actuals
2014
Adopted 2011
Actuals
4100 OTHER TAXES
4110 SALES TAX 715,442 944,604 1,019,621 1,050,000 1,100,000
Total 715,442 944,604 1,019,621 1,050,000 1,100,000 OTHER TAXES
4400 USE OF MONEY AND PROPERTY
4410 INTEREST INCOME 1,504 5,483 5,064 1,200 0
Total 1,504 5,483 5,064 1,200 0 USE OF MONEY AND PROPERTY
Total 716,946 950,087 1,024,685 1,051,200 1,100,000 MEASURE R
225 CDBG - R
2010
ActualsTitle/Object
2013
Yr. End Est
2012
Actuals
2014
Adopted 2011
Actuals
4400 USE OF MONEY AND PROPERTY
Total 0 0 0 0 0 USE OF MONEY AND PROPERTY
4500 REVENUE FROM OTHER AGENCIES
4551 FEDERAL GRANTS 293,305 8,119 3,655 13,896 0
Total 293,305 8,119 3,655 13,896 0 REVENUE FROM OTHER AGENCIES
Total 293,305 8,119 3,655 13,896 0 CDBG - R
226 ARRA - Stimulus Projects
2010
ActualsTitle/Object
2013
Yr. End Est
2012
Actuals
2014
Adopted 2011
Actuals
4400 USE OF MONEY AND PROPERTY
4410 INTEREST INCOME 2,247 1,115 923 100 0
Total 2,247 1,115 923 100 0 USE OF MONEY AND PROPERTY
4500 REVENUE FROM OTHER AGENCIES
4551 FEDERAL GRANTS 3,203,377 916,898 0 0 0
Total 3,203,377 916,898 0 0 0 REVENUE FROM OTHER AGENCIES
4600 CHARGES FOR SERVICES
4647 MISC REIMBURSEMENT 0 34,855 0 0 0
Total 0 34,855 0 0 0 CHARGES FOR SERVICES
74

Total 3,205,624 952,868 923 100 0 ARRA - Stimulus Projects
227 HOMELAND SECURITY GRANT
2010
ActualsTitle/Object
2013
Yr. End Est
2012
Actuals
2014
Adopted 2011
Actuals
4400 USE OF MONEY AND PROPERTY
Total 0 0 0 0 0 USE OF MONEY AND PROPERTY
4500 REVENUE FROM OTHER AGENCIES
4551 FEDERAL GRANTS 0 0 280,066 130,266 0
Total 0 0 280,066 130,266 0 REVENUE FROM OTHER AGENCIES
Total 0 0 280,066 130,266 0 HOMELAND SECURITY GRANT
228 RECOVERY BYRNE GRANT
2010
ActualsTitle/Object
2013
Yr. End Est
2012
Actuals
2014
Adopted 2011
Actuals
4400 USE OF MONEY AND PROPERTY
Total 0 0 0 0 0 USE OF MONEY AND PROPERTY
4500 REVENUE FROM OTHER AGENCIES
4551 FEDERAL GRANTS 39,393 85,688 129,360 33,079 0
Total 39,393 85,688 129,360 33,079 0 REVENUE FROM OTHER AGENCIES
Total 39,393 85,688 129,360 33,079 0 RECOVERY BYRNE GRANT
229 RUBBERIZED ASPHALT CONCRETE GRANT (RAC)
2010
ActualsTitle/Object
2013
Yr. End Est
2012
Actuals
2014
Adopted 2011
Actuals
4400 USE OF MONEY AND PROPERTY
4410 INTEREST INCOME 0 0 127 0 0
Total 0 0 127 0 0 USE OF MONEY AND PROPERTY
4500 REVENUE FROM OTHER AGENCIES
4551 FEDERAL GRANTS 0 250,000 0 0 0
Total 0 250,000 0 0 0 REVENUE FROM OTHER AGENCIES
Total 0 250,000 127 0 0 RUBBERIZED ASPHALT CONCRETE GRANT (RAC)
230 ENERGY EFFICIENCY GRANT
2010
ActualsTitle/Object
2013
Yr. End Est
2012
Actuals
2014
Adopted 2011
Actuals
4400 USE OF MONEY AND PROPERTY
Total 0 0 0 0 0 USE OF MONEY AND PROPERTY
4500 REVENUE FROM OTHER AGENCIES
4520 STATE GRANT 0 143 4,941 35,998 0
4521 STATE GRANT 0 0 2,370 0 0
4524 STATE GRANT - SGV ENERGY WISE PARTNRSHP 0 0 0 57,675 0
Total 0 143 7,311 93,673 0 REVENUE FROM OTHER AGENCIES
Total 0 143 7,311 93,673 0 ENERGY EFFICIENCY GRANT
75
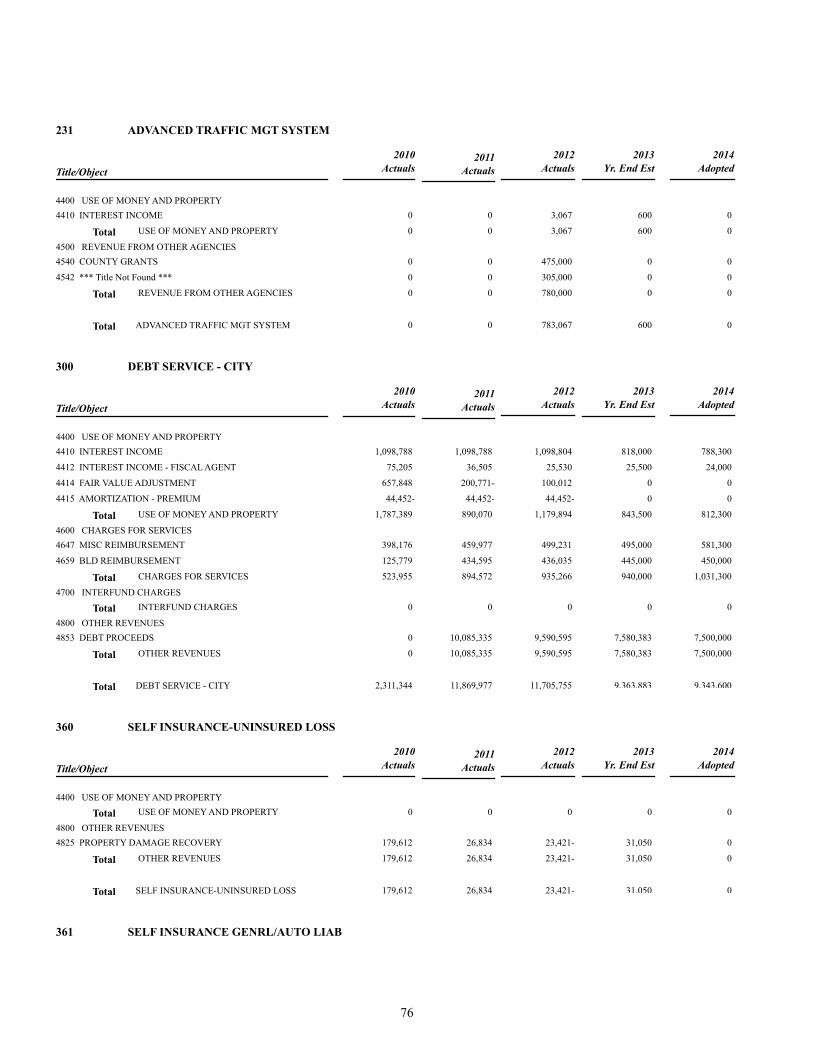
231 ADVANCED TRAFFIC MGT SYSTEM
2010
ActualsTitle/Object
2013
Yr. End Est
2012
Actuals
2014
Adopted 2011
Actuals
4400 USE OF MONEY AND PROPERTY
4410 INTEREST INCOME 0 0 3,067 600 0
Total 0 0 3,067 600 0 USE OF MONEY AND PROPERTY
4500 REVENUE FROM OTHER AGENCIES
4540 COUNTY GRANTS 0 0 475,000 0 0
4542 *** Title Not Found *** 0 0 305,000 0 0
Total 0 0 780,000 0 0 REVENUE FROM OTHER AGENCIES
Total 0 0 783,067 600 0 ADVANCED TRAFFIC MGT SYSTEM
300 DEBT SERVICE - CITY
2010
ActualsTitle/Object
2013
Yr. End Est
2012
Actuals
2014
Adopted 2011
Actuals
4400 USE OF MONEY AND PROPERTY
4410 INTEREST INCOME 1,098,788 1,098,788 1,098,804 818,000 788,300
4412 INTEREST INCOME - FISCAL AGENT 75,205 36,505 25,530 25,500 24,000
4414 FAIR VALUE ADJUSTMENT 657,848 200,771- 100,012 0 0
4415 AMORTIZATION - PREMIUM 44,452- 44,452- 44,452- 0 0
Total 1,787,389 890,070 1,179,894 843,500 812,300 USE OF MONEY AND PROPERTY
4600 CHARGES FOR SERVICES
4647 MISC REIMBURSEMENT 398,176 459,977 499,231 495,000 581,300
4659 BLD REIMBURSEMENT 125,779 434,595 436,035 445,000 450,000
Total 523,955 894,572 935,266 940,000 1,031,300 CHARGES FOR SERVICES
4700 INTERFUND CHARGES
Total 0 0 0 0 0 INTERFUND CHARGES
4800 OTHER REVENUES
4853 DEBT PROCEEDS 0 10,085,335 9,590,595 7,580,383 7,500,000
Total 0 10,085,335 9,590,595 7,580,383 7,500,000 OTHER REVENUES
Total 2,311,344 11,869,977 11,705,755 9,363,883 9,343,600 DEBT SERVICE - CITY
360 SELF INSURANCE-UNINSURED LOSS
2010
ActualsTitle/Object
2013
Yr. End Est
2012
Actuals
2014
Adopted 2011
Actuals
4400 USE OF MONEY AND PROPERTY
Total 0 0 0 0 0 USE OF MONEY AND PROPERTY
4800 OTHER REVENUES
4825 PROPERTY DAMAGE RECOVERY 179,612 26,834 23,421- 31,050 0
Total 179,612 26,834 23,421- 31,050 0 OTHER REVENUES
Total 179,612 26,834 23,421- 31,050 0 SELF INSURANCE-UNINSURED LOSS
361 SELF INSURANCE GENRL/AUTO LIAB
76
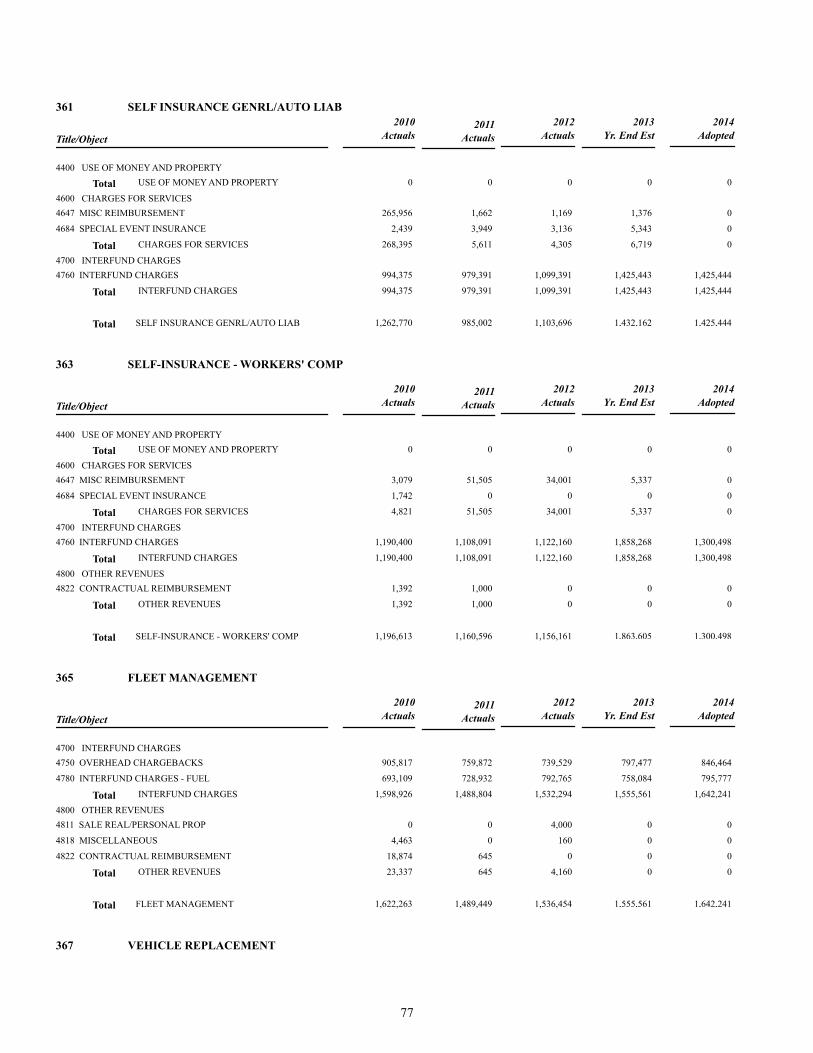
361 SELF INSURANCE GENRL/AUTO LIAB
2010
ActualsTitle/Object
2013
Yr. End Est
2012
Actuals
2014
Adopted 2011
Actuals
4400 USE OF MONEY AND PROPERTY
Total 0 0 0 0 0 USE OF MONEY AND PROPERTY
4600 CHARGES FOR SERVICES
4647 MISC REIMBURSEMENT 265,956 1,662 1,169 1,376 0
4684 SPECIAL EVENT INSURANCE 2,439 3,949 3,136 5,343 0
Total 268,395 5,611 4,305 6,719 0 CHARGES FOR SERVICES
4700 INTERFUND CHARGES
4760 INTERFUND CHARGES 994,375 979,391 1,099,391 1,425,443 1,425,444
Total 994,375 979,391 1,099,391 1,425,443 1,425,444 INTERFUND CHARGES
Total 1,262,770 985,002 1,103,696 1,432,162 1,425,444 SELF INSURANCE GENRL/AUTO LIAB
363 SELF-INSURANCE - WORKERS' COMP
2010
ActualsTitle/Object
2013
Yr. End Est
2012
Actuals
2014
Adopted 2011
Actuals
4400 USE OF MONEY AND PROPERTY
Total 0 0 0 0 0 USE OF MONEY AND PROPERTY
4600 CHARGES FOR SERVICES
4647 MISC REIMBURSEMENT 3,079 51,505 34,001 5,337 0
4684 SPECIAL EVENT INSURANCE 1,742 0 0 0 0
Total 4,821 51,505 34,001 5,337 0 CHARGES FOR SERVICES
4700 INTERFUND CHARGES
4760 INTERFUND CHARGES 1,190,400 1,108,091 1,122,160 1,858,268 1,300,498
Total 1,190,400 1,108,091 1,122,160 1,858,268 1,300,498 INTERFUND CHARGES
4800 OTHER REVENUES
4822 CONTRACTUAL REIMBURSEMENT 1,392 1,000 0 0 0
Total 1,392 1,000 0 0 0 OTHER REVENUES
Total 1,196,613 1,160,596 1,156,161 1,863,605 1,300,498 SELF-INSURANCE - WORKERS' COMP
365 FLEET MANAGEMENT
2010
ActualsTitle/Object
2013
Yr. End Est
2012
Actuals
2014
Adopted 2011
Actuals
4700 INTERFUND CHARGES
4750 OVERHEAD CHARGEBACKS 905,817 759,872 739,529 797,477 846,464
4780 INTERFUND CHARGES - FUEL 693,109 728,932 792,765 758,084 795,777
Total 1,598,926 1,488,804 1,532,294 1,555,561 1,642,241 INTERFUND CHARGES
4800 OTHER REVENUES
4811 SALE REAL/PERSONAL PROP 0 0 4,000 0 0
4818 MISCELLANEOUS 4,463 0 160 0 0
4822 CONTRACTUAL REIMBURSEMENT 18,874 645 0 0 0
Total 23,337 645 4,160 0 0 OTHER REVENUES
Total 1,622,263 1,489,449 1,536,454 1,555,561 1,642,241 FLEET MANAGEMENT
367 VEHICLE REPLACEMENT
77
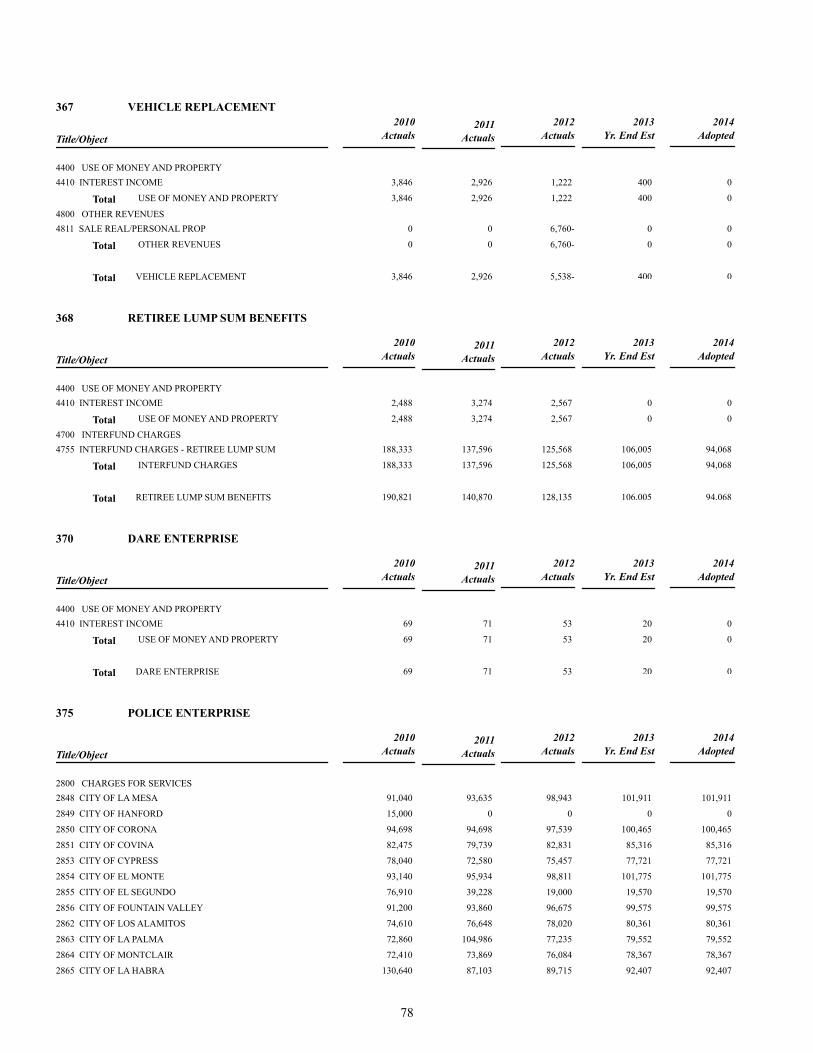
367 VEHICLE REPLACEMENT
2010
ActualsTitle/Object
2013
Yr. End Est
2012
Actuals
2014
Adopted 2011
Actuals
4400 USE OF MONEY AND PROPERTY
4410 INTEREST INCOME 3,846 2,926 1,222 400 0
Total 3,846 2,926 1,222 400 0 USE OF MONEY AND PROPERTY
4800 OTHER REVENUES
4811 SALE REAL/PERSONAL PROP 0 0 6,760- 0 0
Total 0 0 6,760- 0 0 OTHER REVENUES
Total 3,846 2,926 5,538- 400 0 VEHICLE REPLACEMENT
368 RETIREE LUMP SUM BENEFITS
2010
ActualsTitle/Object
2013
Yr. End Est
2012
Actuals
2014
Adopted 2011
Actuals
4400 USE OF MONEY AND PROPERTY
4410 INTEREST INCOME 2,488 3,274 2,567 0 0
Total 2,488 3,274 2,567 0 0 USE OF MONEY AND PROPERTY
4700 INTERFUND CHARGES
4755 INTERFUND CHARGES - RETIREE LUMP SUM 188,333 137,596 125,568 106,005 94,068
Total 188,333 137,596 125,568 106,005 94,068 INTERFUND CHARGES
Total 190,821 140,870 128,135 106,005 94,068 RETIREE LUMP SUM BENEFITS
370 DARE ENTERPRISE
2010
ActualsTitle/Object
2013
Yr. End Est
2012
Actuals
2014
Adopted 2011
Actuals
4400 USE OF MONEY AND PROPERTY
4410 INTEREST INCOME 69 71 53 20 0
Total 69 71 53 20 0 USE OF MONEY AND PROPERTY
Total 69 71 53 20 0 DARE ENTERPRISE
375 POLICE ENTERPRISE
2010
ActualsTitle/Object
2013
Yr. End Est
2012
Actuals
2014
Adopted 2011
Actuals
2800 CHARGES FOR SERVICES
2848 CITY OF LA MESA 91,040 93,635 98,943 101,911 101,911
2849 CITY OF HANFORD 15,000 0 0 0 0
2850 CITY OF CORONA 94,698 94,698 97,539 100,465 100,465
2851 CITY OF COVINA 82,475 79,739 82,831 85,316 85,316
2853 CITY OF CYPRESS 78,040 72,580 75,457 77,721 77,721
2854 CITY OF EL MONTE 93,140 95,934 98,811 101,775 101,775
2855 CITY OF EL SEGUNDO 76,910 39,228 19,000 19,570 19,570
2856 CITY OF FOUNTAIN VALLEY 91,200 93,860 96,675 99,575 99,575
2862 CITY OF LOS ALAMITOS 74,610 76,648 78,020 80,361 80,361
2863 CITY OF LA PALMA 72,860 104,986 77,235 79,552 79,552
2864 CITY OF MONTCLAIR 72,410 73,869 76,084 78,367 78,367
2865 CITY OF LA HABRA 130,640 87,103 89,715 92,407 92,407
78

375 POLICE ENTERPRISE
2010
ActualsTitle/Object
2013
Yr. End Est
2012
Actuals
2014
Adopted 2011
Actuals
2870 CITY OF SEAL BEACH 68,660 71,660 72,780 74,963 74,963
2871 CITY OF PORTERVILLE 71,510 71,500 73,644 75,853 75,853
2872 CITY OF SPARKS, NV 41,900 38,757 39,919 41,117 41,117
2873 CITY OF TUSTIN 124,140 92,768 95,550 98,417 98,417
2877 CITY OF CHINO 92,069 99,095 97,535 100,461 100,461
2880 CITY OF TRACY 88,840 91,369 94,109 96,932 96,932
2882 CITY OF MAYWOOD 89,440 0 0 0 0
2883 CITY OF SAN MARINO 101,095 82,849 119,151 122,726 122,726
2884 CITY OF MONTCLAIR 2,500 0 0 0 0
2885 CITY OF ALHAMBRA 92,995 95,575 98,620 101,579 101,579
2887 SALES - DOS PALOS 57,517 56,949 56,587 58,285 58,285
2888 SALES - KNOWLEDGE COMPUTING CORP 20,000 0 0 0 0
2889 SALES - WC FIRE DEPT 26,250 26,250 27,037 27,848 27,848
2890 SALES - OC PARKS 40,000 32,000 0 0 0
2891 SALES - PASADENA 303,098 597,930 140,000 144,200 144,200
2892 SALES - HEMET 0 0 0 117,000 117,000
Total 2,193,037 2,268,982 1,805,242 1,976,401 1,976,401 CHARGES FOR SERVICES
4400 USE OF MONEY AND PROPERTY
4410 INTEREST INCOME 108 0 0 0 0
Total 108 0 0 0 0 USE OF MONEY AND PROPERTY
4800 OTHER REVENUES
Total 0 0 0 0 0 OTHER REVENUES
Total 2,193,145 2,268,982 1,805,242 1,976,401 1,976,401 POLICE ENTERPRISE
810 REDEVELOPMENT OBLIGATION RETIREMENT FUND
2010
ActualsTitle/Object
2013
Yr. End Est
2012
Actuals
2014
Adopted 2011
Actuals
4000 PROPERTY TAXES
4010 CURRENT SECURED 0 0 5,374,891 9,867,859 8,857,212
Total 0 0 5,374,891 9,867,859 8,857,212 PROPERTY TAXES
4100 OTHER TAXES
Total 0 0 0 0 0 OTHER TAXES
4400 USE OF MONEY AND PROPERTY
4410 INTEREST INCOME 0 0 5,102 25,000 15,000
4412 INTEREST INCOME - FISCAL AGENT 0 0 31,053 62,000 62,000
4414 FAIR VALUE ADJUSTMENT 0 0 21,997 0 0
4430 RENTAL INCOME 0 0 12,500 50,000 50,000
Total 0 0 70,652 137,000 127,000 USE OF MONEY AND PROPERTY
4800 OTHER REVENUES
Total 0 0 0 0 0 OTHER REVENUES
Total 0 0 5,445,543 10,004,859 8,984,212 REDEVELOPMENT OBLIGATION RETIREMENT FUND
811 SUCCESSOR AGENCY MERGED DS
2010
ActualsTitle/Object
2013
Yr. End Est
2012
Actuals
2014
Adopted 2011
Actuals
79

811 SUCCESSOR AGENCY MERGED DS
2010
ActualsTitle/Object
2013
Yr. End Est
2012
Actuals
2014
Adopted 2011
Actuals
4000 PROPERTY TAXES
Total 0 0 0 0 0 PROPERTY TAXES
4100 OTHER TAXES
Total 0 0 0 0 0 OTHER TAXES
4400 USE OF MONEY AND PROPERTY
4410 INTEREST INCOME 0 0 4,945 1,200 0
Total 0 0 4,945 1,200 0 USE OF MONEY AND PROPERTY
4800 OTHER REVENUES
Total 0 0 0 0 0 OTHER REVENUES
Total 0 0 4,945 1,200 0 SUCCESSOR AGENCY MERGED DS
812 SUCCESSOR AGENCY CITYWIDE DS
2010
ActualsTitle/Object
2013
Yr. End Est
2012
Actuals
2014
Adopted 2011
Actuals
4000 PROPERTY TAXES
Total 0 0 0 0 0 PROPERTY TAXES
4400 USE OF MONEY AND PROPERTY
Total 0 0 0 0 0 USE OF MONEY AND PROPERTY
Total 0 0 0 0 0 SUCCESSOR AGENCY CITYWIDE DS
815 SUCCESSOR AGENCY ADMINISTRATION
2010
ActualsTitle/Object
2013
Yr. End Est
2012
Actuals
2014
Adopted 2011
Actuals
4000 PROPERTY TAXES
4010 CURRENT SECURED 0 0 250,000 343,000 265,716
Total 0 0 250,000 343,000 265,716 PROPERTY TAXES
4100 OTHER TAXES
Total 0 0 0 0 0 OTHER TAXES
4400 USE OF MONEY AND PROPERTY
4410 INTEREST INCOME 0 0 4,483 0 0
Total 0 0 4,483 0 0 USE OF MONEY AND PROPERTY
4800 OTHER REVENUES
4818 MISCELLANEOUS 0 0 25,000 0 0
Total 0 0 25,000 0 0 OTHER REVENUES
Total 0 0 279,483 343,000 265,716 SUCCESSOR AGENCY ADMINISTRATION
820 SUCCESSOR HOUSING AGENCY
2010
ActualsTitle/Object
2013
Yr. End Est
2012
Actuals
2014
Adopted 2011
Actuals
4400 USE OF MONEY AND PROPERTY
4410 INTEREST INCOME 0 0 894 5,700 7,000
Total 0 0 894 5,700 7,000 USE OF MONEY AND PROPERTY
80
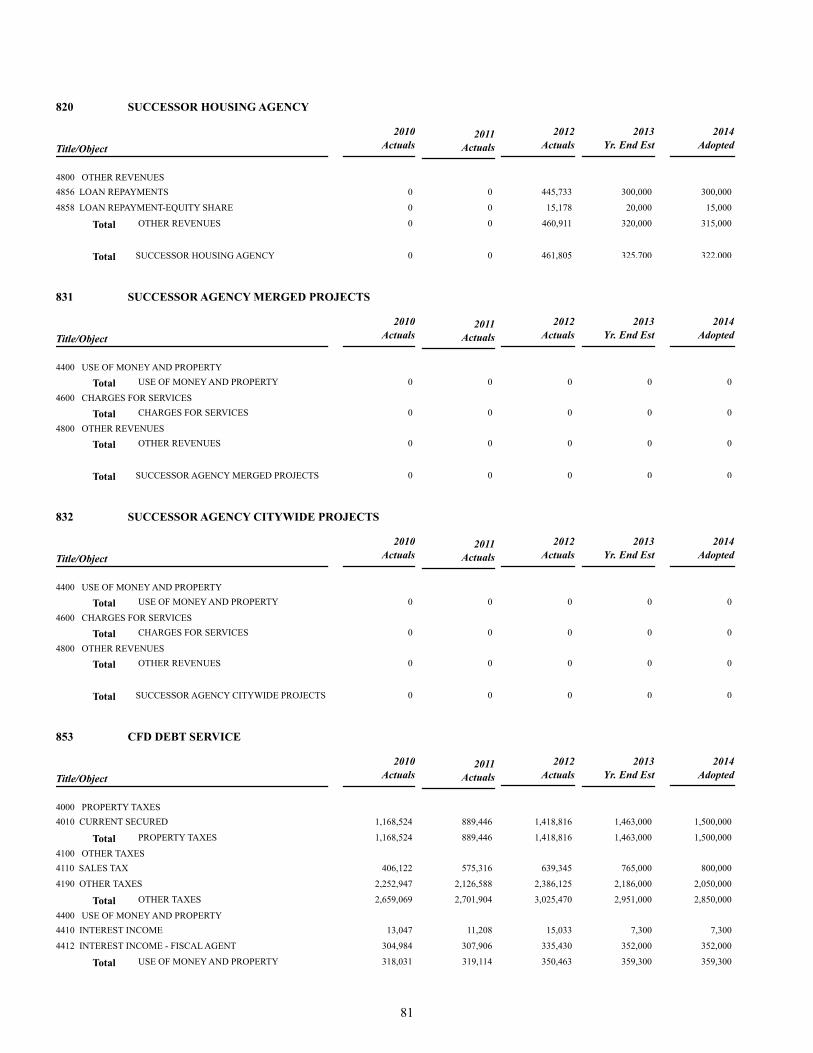
820 SUCCESSOR HOUSING AGENCY
2010
ActualsTitle/Object
2013
Yr. End Est
2012
Actuals
2014
Adopted 2011
Actuals
4800 OTHER REVENUES
4856 LOAN REPAYMENTS 0 0 445,733 300,000 300,000
4858 LOAN REPAYMENT-EQUITY SHARE 0 0 15,178 20,000 15,000
Total 0 0 460,911 320,000 315,000 OTHER REVENUES
Total 0 0 461,805 325,700 322,000 SUCCESSOR HOUSING AGENCY
831 SUCCESSOR AGENCY MERGED PROJECTS
2010
ActualsTitle/Object
2013
Yr. End Est
2012
Actuals
2014
Adopted 2011
Actuals
4400 USE OF MONEY AND PROPERTY
Total 0 0 0 0 0 USE OF MONEY AND PROPERTY
4600 CHARGES FOR SERVICES
Total 0 0 0 0 0 CHARGES FOR SERVICES
4800 OTHER REVENUES
Total 0 0 0 0 0 OTHER REVENUES
Total 0 0 0 0 0 SUCCESSOR AGENCY MERGED PROJECTS
832 SUCCESSOR AGENCY CITYWIDE PROJECTS
2010
ActualsTitle/Object
2013
Yr. End Est
2012
Actuals
2014
Adopted 2011
Actuals
4400 USE OF MONEY AND PROPERTY
Total 0 0 0 0 0 USE OF MONEY AND PROPERTY
4600 CHARGES FOR SERVICES
Total 0 0 0 0 0 CHARGES FOR SERVICES
4800 OTHER REVENUES
Total 0 0 0 0 0 OTHER REVENUES
Total 0 0 0 0 0 SUCCESSOR AGENCY CITYWIDE PROJECTS
853 CFD DEBT SERVICE
2010
ActualsTitle/Object
2013
Yr. End Est
2012
Actuals
2014
Adopted 2011
Actuals
4000 PROPERTY TAXES
4010 CURRENT SECURED 1,168,524 889,446 1,418,816 1,463,000 1,500,000
Total 1,168,524 889,446 1,418,816 1,463,000 1,500,000 PROPERTY TAXES
4100 OTHER TAXES
4110 SALES TAX 406,122 575,316 639,345 765,000 800,000
4190 OTHER TAXES 2,252,947 2,126,588 2,386,125 2,186,000 2,050,000
Total 2,659,069 2,701,904 3,025,470 2,951,000 2,850,000 OTHER TAXES
4400 USE OF MONEY AND PROPERTY
4410 INTEREST INCOME 13,047 11,208 15,033 7,300 7,300
4412 INTEREST INCOME - FISCAL AGENT 304,984 307,906 335,430 352,000 352,000
Total 318,031 319,114 350,463 359,300 359,300 USE OF MONEY AND PROPERTY
81
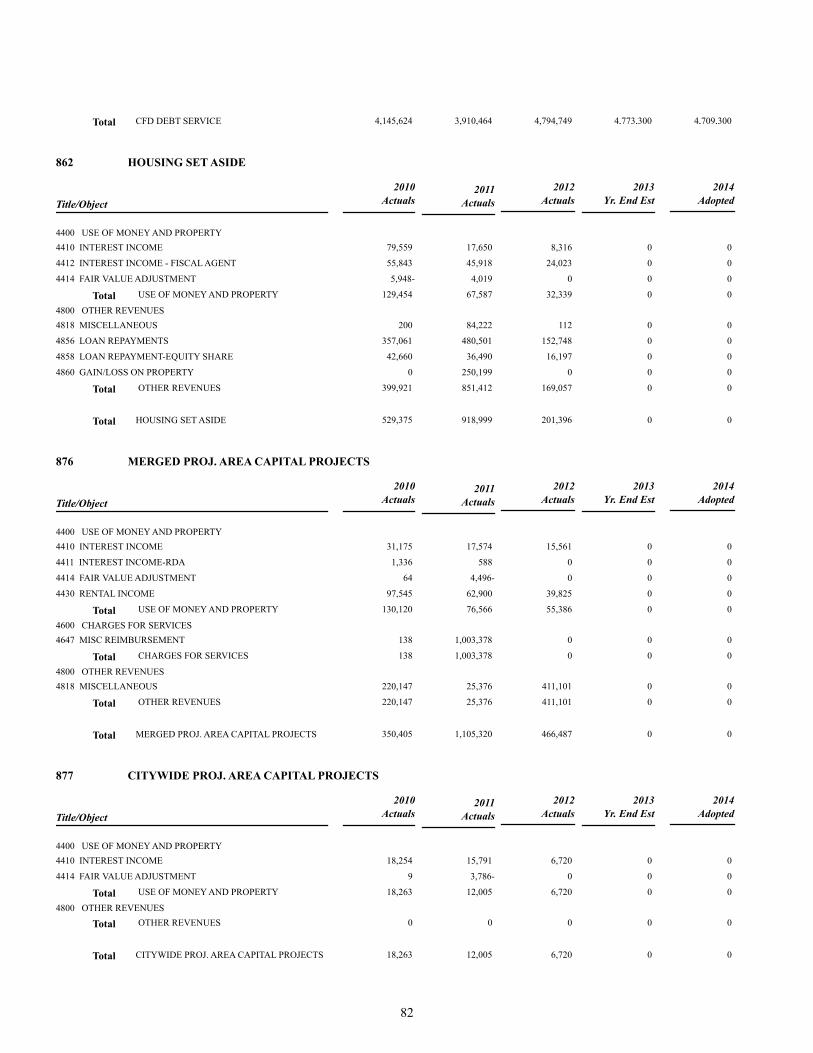
Total 4,145,624 3,910,464 4,794,749 4,773,300 4,709,300 CFD DEBT SERVICE
862 HOUSING SET ASIDE
2010
ActualsTitle/Object
2013
Yr. End Est
2012
Actuals
2014
Adopted 2011
Actuals
4400 USE OF MONEY AND PROPERTY
4410 INTEREST INCOME 79,559 17,650 8,316 0 0
4412 INTEREST INCOME - FISCAL AGENT 55,843 45,918 24,023 0 0
4414 FAIR VALUE ADJUSTMENT 5,948- 4,019 0 0 0
Total 129,454 67,587 32,339 0 0 USE OF MONEY AND PROPERTY
4800 OTHER REVENUES
4818 MISCELLANEOUS 200 84,222 112 0 0
4856 LOAN REPAYMENTS 357,061 480,501 152,748 0 0
4858 LOAN REPAYMENT-EQUITY SHARE 42,660 36,490 16,197 0 0
4860 GAIN/LOSS ON PROPERTY 0 250,199 0 0 0
Total 399,921 851,412 169,057 0 0 OTHER REVENUES
Total 529,375 918,999 201,396 0 0 HOUSING SET ASIDE
876 MERGED PROJ. AREA CAPITAL PROJECTS
2010
ActualsTitle/Object
2013
Yr. End Est
2012
Actuals
2014
Adopted 2011
Actuals
4400 USE OF MONEY AND PROPERTY
4410 INTEREST INCOME 31,175 17,574 15,561 0 0
4411 INTEREST INCOME-RDA 1,336 588 0 0 0
4414 FAIR VALUE ADJUSTMENT 64 4,496- 0 0 0
4430 RENTAL INCOME 97,545 62,900 39,825 0 0
Total 130,120 76,566 55,386 0 0 USE OF MONEY AND PROPERTY
4600 CHARGES FOR SERVICES
4647 MISC REIMBURSEMENT 138 1,003,378 0 0 0
Total 138 1,003,378 0 0 0 CHARGES FOR SERVICES
4800 OTHER REVENUES
4818 MISCELLANEOUS 220,147 25,376 411,101 0 0
Total 220,147 25,376 411,101 0 0 OTHER REVENUES
Total 350,405 1,105,320 466,487 0 0 MERGED PROJ. AREA CAPITAL PROJECTS
877 CITYWIDE PROJ. AREA CAPITAL PROJECTS
2010
ActualsTitle/Object
2013
Yr. End Est
2012
Actuals
2014
Adopted 2011
Actuals
4400 USE OF MONEY AND PROPERTY
4410 INTEREST INCOME 18,254 15,791 6,720 0 0
4414 FAIR VALUE ADJUSTMENT 9 3,786- 0 0 0
Total 18,263 12,005 6,720 0 0 USE OF MONEY AND PROPERTY
4800 OTHER REVENUES
Total 0 0 0 0 0 OTHER REVENUES
Total 18,263 12,005 6,720 0 0 CITYWIDE PROJ. AREA CAPITAL PROJECTS
82
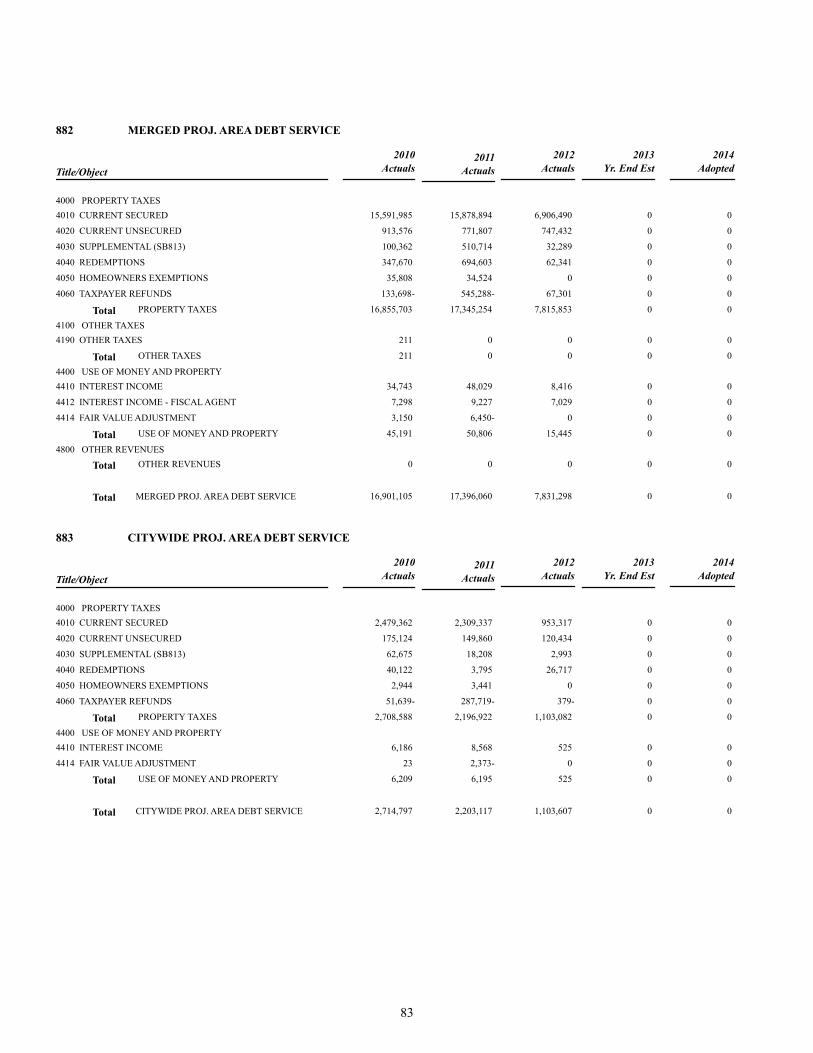
882 MERGED PROJ. AREA DEBT SERVICE
2010
ActualsTitle/Object
2013
Yr. End Est
2012
Actuals
2014
Adopted 2011
Actuals
4000 PROPERTY TAXES
4010 CURRENT SECURED 15,591,985 15,878,894 6,906,490 0 0
4020 CURRENT UNSECURED 913,576 771,807 747,432 0 0
4030 SUPPLEMENTAL (SB813) 100,362 510,714 32,289 0 0
4040 REDEMPTIONS 347,670 694,603 62,341 0 0
4050 HOMEOWNERS EXEMPTIONS 35,808 34,524 0 0 0
4060 TAXPAYER REFUNDS 133,698- 545,288- 67,301 0 0
Total 16,855,703 17,345,254 7,815,853 0 0 PROPERTY TAXES
4100 OTHER TAXES
4190 OTHER TAXES 211 0 0 0 0
Total 211 0 0 0 0 OTHER TAXES
4400 USE OF MONEY AND PROPERTY
4410 INTEREST INCOME 34,743 48,029 8,416 0 0
4412 INTEREST INCOME - FISCAL AGENT 7,298 9,227 7,029 0 0
4414 FAIR VALUE ADJUSTMENT 3,150 6,450- 0 0 0
Total 45,191 50,806 15,445 0 0 USE OF MONEY AND PROPERTY
4800 OTHER REVENUES
Total 0 0 0 0 0 OTHER REVENUES
Total 16,901,105 17,396,060 7,831,298 0 0 MERGED PROJ. AREA DEBT SERVICE
883 CITYWIDE PROJ. AREA DEBT SERVICE
2010
ActualsTitle/Object
2013
Yr. End Est
2012
Actuals
2014
Adopted 2011
Actuals
4000 PROPERTY TAXES
4010 CURRENT SECURED 2,479,362 2,309,337 953,317 0 0
4020 CURRENT UNSECURED 175,124 149,860 120,434 0 0
4030 SUPPLEMENTAL (SB813) 62,675 18,208 2,993 0 0
4040 REDEMPTIONS 40,122 3,795 26,717 0 0
4050 HOMEOWNERS EXEMPTIONS 2,944 3,441 0 0 0
4060 TAXPAYER REFUNDS 51,639- 287,719- 379- 0 0
Total 2,708,588 2,196,922 1,103,082 0 0 PROPERTY TAXES
4400 USE OF MONEY AND PROPERTY
4410 INTEREST INCOME 6,186 8,568 525 0 0
4414 FAIR VALUE ADJUSTMENT 23 2,373- 0 0 0
Total 6,209 6,195 525 0 0 USE OF MONEY AND PROPERTY
Total 2,714,797 2,203,117 1,103,607 0 0 CITYWIDE PROJ. AREA DEBT SERVICE
83

2010 ActualsTitle/Object
2013 Yr. End Est
2012 Actuals Actuals
2011 2014 Adopted
Grand Totals
2800 CHARGES FOR SERVICES
2848 CITY OF LA MESA 91,040 93,635 98,943 101,911 101,911
2849 CITY OF HANFORD 15,000 0 0 0 0
2850 CITY OF CORONA 94,698 94,698 97,539 100,465 100,465
2851 CITY OF COVINA 82,475 79,739 82,831 85,316 85,316
2853 CITY OF CYPRESS 78,040 72,580 75,457 77,721 77,721
2854 CITY OF EL MONTE 93,140 95,934 98,811 101,775 101,775
2855 CITY OF EL SEGUNDO 76,910 39,228 19,000 19,570 19,570
2856 CITY OF FOUNTAIN VALLEY 91,200 93,860 96,675 99,575 99,575
2862 CITY OF LOS ALAMITOS 74,610 76,648 78,020 80,361 80,361
2863 CITY OF LA PALMA 72,860 104,986 77,235 79,552 79,552
2864 CITY OF MONTCLAIR 72,410 73,869 76,084 78,367 78,367
2865 CITY OF LA HABRA 130,640 87,103 89,715 92,407 92,407
2870 CITY OF SEAL BEACH 68,660 71,660 72,780 74,963 74,963
2871 CITY OF PORTERVILLE 71,510 71,500 73,644 75,853 75,853
2872 CITY OF SPARKS, NV 41,900 38,757 39,919 41,117 41,117
2873 CITY OF TUSTIN 124,140 92,768 95,550 98,417 98,417
2877 CITY OF CHINO 92,069 99,095 97,535 100,461 100,461
2880 CITY OF TRACY 88,840 91,369 94,109 96,932 96,932
2882 CITY OF MAYWOOD 89,440 0 0 0 0
2883 CITY OF SAN MARINO 101,095 82,849 119,151 122,726 122,726
2884 CITY OF MONTCLAIR 2,500 0 0 0 0
2885 CITY OF ALHAMBRA 92,995 95,575 98,620 101,579 101,579
2887 SALES - DOS PALOS 57,517 56,949 56,587 58,285 58,285
2888 SALES - KNOWLEDGE COMPUTING CORP 20,000 0 0 0 0
2889 SALES - WC FIRE DEPT 26,250 26,250 27,037 27,848 27,848
2890 SALES - OC PARKS 40,000 32,000 0 0 0
2891 SALES - PASADENA 303,098 597,930 140,000 144,200 144,200
2892 SALES - HEMET 0 0 0 117,000 117,000
Total 2,193,037 2,268,982 1,805,242 1,976,401 1,976,401 CHARGES FOR SERVICES
4000 PROPERTY TAXES
4010 CURRENT SECURED 27,852,146 27,795,860 23,845,540 20,718,859 19,938,228
4012 SUPPL IN LIEU OF VLF 8,542,896 8,525,669 8,689,769 8,804,000 9,100,000
4014 RESIDUAL/EXCESS TAX INCREMENT (COUNTY) 0 0 262,374 1,152,081 751,500
4020 CURRENT UNSECURED 1,468,369 1,304,603 1,227,782 340,000 350,000
4030 SUPPLEMENTAL (SB813) 247,345 623,694 171,177 150,000 225,000
4040 REDEMPTIONS 1,015,329 1,128,417 390,556 300,000 250,000
4050 HOMEOWNERS EXEMPTIONS 114,169 113,163 75,113 75,000 75,000
4060 TAXPAYER REFUNDS 275,676- 836,010- 28,024- 50,000- 50,000-
4061 PROP TAX ADMIN SETTLEMENT 0 0 0 1,007,245 0
4070 CRA ANNUAL GROWTH ADJUSTMENTS 322,845 288,557 139,960 400,000 325,000
Total 39,287,423 38,943,953 34,774,247 32,897,185 30,964,728 PROPERTY TAXES
4100 OTHER TAXES
4110 SALES TAX 12,349,438 13,767,254 14,450,385 16,118,400 17,186,000
4111 SALES TAX COMP FUND 2,969,340 3,069,448 3,313,253 3,457,600 4,039,000
4120 FRANCHISE TAX 3,093,538 3,159,080 3,224,053 3,286,000 3,350,000
4130 TRANSIENT OCCUPANCY TAX 647,123 756,573 1,052,091 1,200,000 1,250,000
4140 BUSINESS LICENSE TAX 2,075,987 2,182,985 1,962,157 1,900,000 1,750,000
4150 DOCUMENTARY TRANSFER TAX 236,240 189,730 304,973 250,000 270,000
1:51:31PM
84
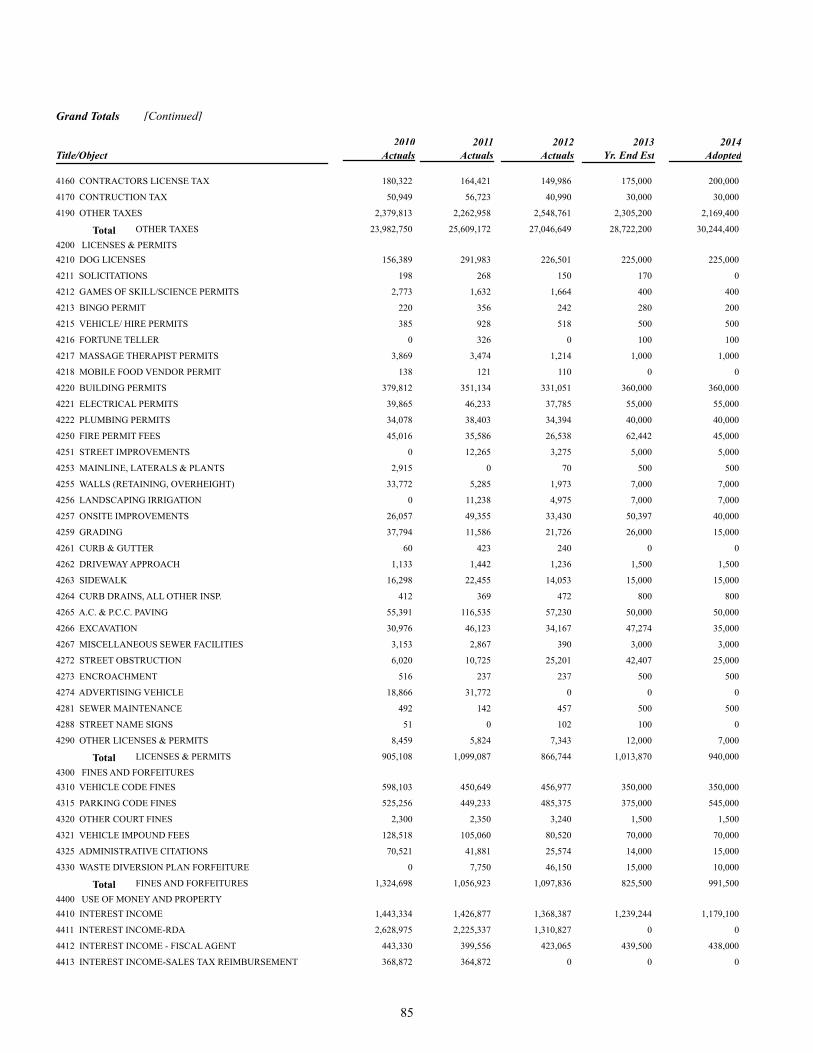
2010 ActualsTitle/Object
2013 Yr. End Est
2012 Actuals Actuals
2011 2014 Adopted
Grand Totals [Continued]
4160 CONTRACTORS LICENSE TAX 180,322 164,421 149,986 175,000 200,000
4170 CONTRUCTION TAX 50,949 56,723 40,990 30,000 30,000
4190 OTHER TAXES 2,379,813 2,262,958 2,548,761 2,305,200 2,169,400
Total 23,982,750 25,609,172 27,046,649 28,722,200 30,244,400 OTHER TAXES
4200 LICENSES & PERMITS
4210 DOG LICENSES 156,389 291,983 226,501 225,000 225,000
4211 SOLICITATIONS 198 268 150 170 0
4212 GAMES OF SKILL/SCIENCE PERMITS 2,773 1,632 1,664 400 400
4213 BINGO PERMIT 220 356 242 280 200
4215 VEHICLE/ HIRE PERMITS 385 928 518 500 500
4216 FORTUNE TELLER 0 326 0 100 100
4217 MASSAGE THERAPIST PERMITS 3,869 3,474 1,214 1,000 1,000
4218 MOBILE FOOD VENDOR PERMIT 138 121 110 0 0
4220 BUILDING PERMITS 379,812 351,134 331,051 360,000 360,000
4221 ELECTRICAL PERMITS 39,865 46,233 37,785 55,000 55,000
4222 PLUMBING PERMITS 34,078 38,403 34,394 40,000 40,000
4250 FIRE PERMIT FEES 45,016 35,586 26,538 62,442 45,000
4251 STREET IMPROVEMENTS 0 12,265 3,275 5,000 5,000
4253 MAINLINE, LATERALS & PLANTS 2,915 0 70 500 500
4255 WALLS (RETAINING, OVERHEIGHT) 33,772 5,285 1,973 7,000 7,000
4256 LANDSCAPING IRRIGATION 0 11,238 4,975 7,000 7,000
4257 ONSITE IMPROVEMENTS 26,057 49,355 33,430 50,397 40,000
4259 GRADING 37,794 11,586 21,726 26,000 15,000
4261 CURB & GUTTER 60 423 240 0 0
4262 DRIVEWAY APPROACH 1,133 1,442 1,236 1,500 1,500
4263 SIDEWALK 16,298 22,455 14,053 15,000 15,000
4264 CURB DRAINS, ALL OTHER INSP. 412 369 472 800 800
4265 A.C. & P.C.C. PAVING 55,391 116,535 57,230 50,000 50,000
4266 EXCAVATION 30,976 46,123 34,167 47,274 35,000
4267 MISCELLANEOUS SEWER FACILITIES 3,153 2,867 390 3,000 3,000
4272 STREET OBSTRUCTION 6,020 10,725 25,201 42,407 25,000
4273 ENCROACHMENT 516 237 237 500 500
4274 ADVERTISING VEHICLE 18,866 31,772 0 0 0
4281 SEWER MAINTENANCE 492 142 457 500 500
4288 STREET NAME SIGNS 51 0 102 100 0
4290 OTHER LICENSES & PERMITS 8,459 5,824 7,343 12,000 7,000
Total 905,108 1,099,087 866,744 1,013,870 940,000 LICENSES & PERMITS
4300 FINES AND FORFEITURES
4310 VEHICLE CODE FINES 598,103 450,649 456,977 350,000 350,000
4315 PARKING CODE FINES 525,256 449,233 485,375 375,000 545,000
4320 OTHER COURT FINES 2,300 2,350 3,240 1,500 1,500
4321 VEHICLE IMPOUND FEES 128,518 105,060 80,520 70,000 70,000
4325 ADMINISTRATIVE CITATIONS 70,521 41,881 25,574 14,000 15,000
4330 WASTE DIVERSION PLAN FORFEITURE 0 7,750 46,150 15,000 10,000
Total 1,324,698 1,056,923 1,097,836 825,500 991,500 FINES AND FORFEITURES
4400 USE OF MONEY AND PROPERTY
4410 INTEREST INCOME 1,443,334 1,426,877 1,368,387 1,239,244 1,179,100
4411 INTEREST INCOME-RDA 2,628,975 2,225,337 1,310,827 0 0
4412 INTEREST INCOME - FISCAL AGENT 443,330 399,556 423,065 439,500 438,000
4413 INTEREST INCOME-SALES TAX REIMBURSEMENT 368,872 364,872 0 0 0
85

2010 ActualsTitle/Object
2013 Yr. End Est
2012 Actuals Actuals
2011 2014 Adopted
Grand Totals [Continued]
4414 FAIR VALUE ADJUSTMENT 658,584 241,014- 156,052 0 0
4415 AMORTIZATION - PREMIUM 44,452- 44,452- 44,452- 0 0
4430 RENTAL INCOME 408,364 443,782 434,021 402,000 410,000
Total 5,907,007 4,574,958 3,647,900 2,080,744 2,027,100 USE OF MONEY AND PROPERTY
4500 REVENUE FROM OTHER AGENCIES
4511 MOTOR VEHICLE IN LIEU 331,290 517,098 55,881 58,000 60,000
4512 GAS TAX SECTION 2105 615,893 579,495 513,938 460,000 527,663
4513 GAS TAX SECTION 2106 364,685 344,103 337,607 325,000 354,598
4514 GAS TAX SECTION 2107 820,852 773,951 737,675 760,000 785,604
4515 GAS TAX SECTION 2107.5 10,000 10,000 10,000 87,938 10,000
4518 GAS TAX SECTION 2103 0 1,069,422 1,518,900 1,200,000 1,598,742
4520 STATE GRANT 0 143 9,257 41,516 0
4521 STATE GRANT 1,396,767 474,946 574,199 567,106 425,232
4524 STATE GRANT - SGV ENERGY WISE PARTNRSHP 0 0 0 57,675 0
4530 TRANSPORTATION GRANT - MTA 158,885 0 0 0 0
4540 COUNTY GRANTS 477,787 15,553 475,000 0 325,000
4541 COUNTY PROP A MAINTENANCE 41,638 41,853 72,603 45,000 23,000
4542 *** Title Not Found *** 0 0 305,000 0 0
4551 FEDERAL GRANTS 5,716,010 2,734,661 3,489,347 4,140,962 1,519,123
4553 FIRE ASSISTANCE REIMBURSEMENT 144,520 33,511 0 0 0
4555 FEDERAL - JAG 0 26,343 0 0 0
4556 FEDERAL PASS THRU STATE 0 1,210 2,346 0 0
4559 DRUG ENFORCEMENT REBATE 328,605 622,899 3,135,483 1,148,238 11,000
4565 PROP A DISCRETIONARY INCENTIVE 0 150,699 157,759 120,000 125,000
4569 D.E.R TREASURY 7,710 2,396 11,643 486,840 0
4571 CROSSING GUARD AID 5,748 5,387 6,010 5,000 5,000
4572 FIRE STATE MANDATED INSPECTION 15,265 10,574 0 0 0
4573 STATE MANDATED REVENUE 44,504 40,494 31,403 36,711 25,000
4574 POST 61,133 35,106 50,124 50,000 50,000
4579 FED: 2006-08 OTS GRANT 24,280 15,830 0 0 0
4580 PROP A EXCHANGE 705,000 1,020,000 1,125,000 1,500,000 1,500,000
Total 11,270,572 8,525,674 12,619,175 11,089,986 7,344,962 REVENUE FROM OTHER AGENCIES
4600 CHARGES FOR SERVICES
4601 RECYCLING REVENUE 14,496 7,555 4,285 3,500 3,000
4602 TOWING FRANCHISE 217,880 219,509 191,646 160,000 165,000
4603 DUI ACCIDENT REPONSE INVESTIGATION 12,875 1,461- 4,312 4,000 4,000
4605 JAIL BOOKING 63,409 41,983 34,153 35,000 35,000
4606 CLEARANCE LETTER AND PROCESS 408 424 456 400 400
4607 TRAINING SEMINARS 25,080 19,110 2,460 5,000 5,000
4608 JUVENILE DETENTION COSTS 737 217 873 1,000 1,000
4609 AMBULANCE SERVICES 1,794,461 1,715,806 1,837,470 1,800,000 1,800,000
4610 BUSINESS LICENSE PROCESSING FEE 42,106 45,714 43,283 40,000 40,000
4611 PLANNING FILING FEES 285,347 211,170 229,704 230,000 225,000
4614 PLAN CHECK FEES 145,285 70,580 76,920 120,000 100,000
4615 CONTRACT PLAN CHECK 77,258 131,696 88,454 100,000 100,000
4616 SEARCH FEES 3,426 3,734 3,860 3,000 3,000
4617 AFTER HOURS PLAN CHECK 2,409 325 1,287 0 0
4619 EXPEDITED PLAN CHECK (ENGINEERING) 1,256 256 1,256 2,000 2,000
4620 FORECLOSURE REGISTRATION 0 0 0 82,125 70,000
4621 STREET LIGHTING ASSESSMENTS 1,444,448 1,476,364 1,477,304 1,530,060 1,571,004
86
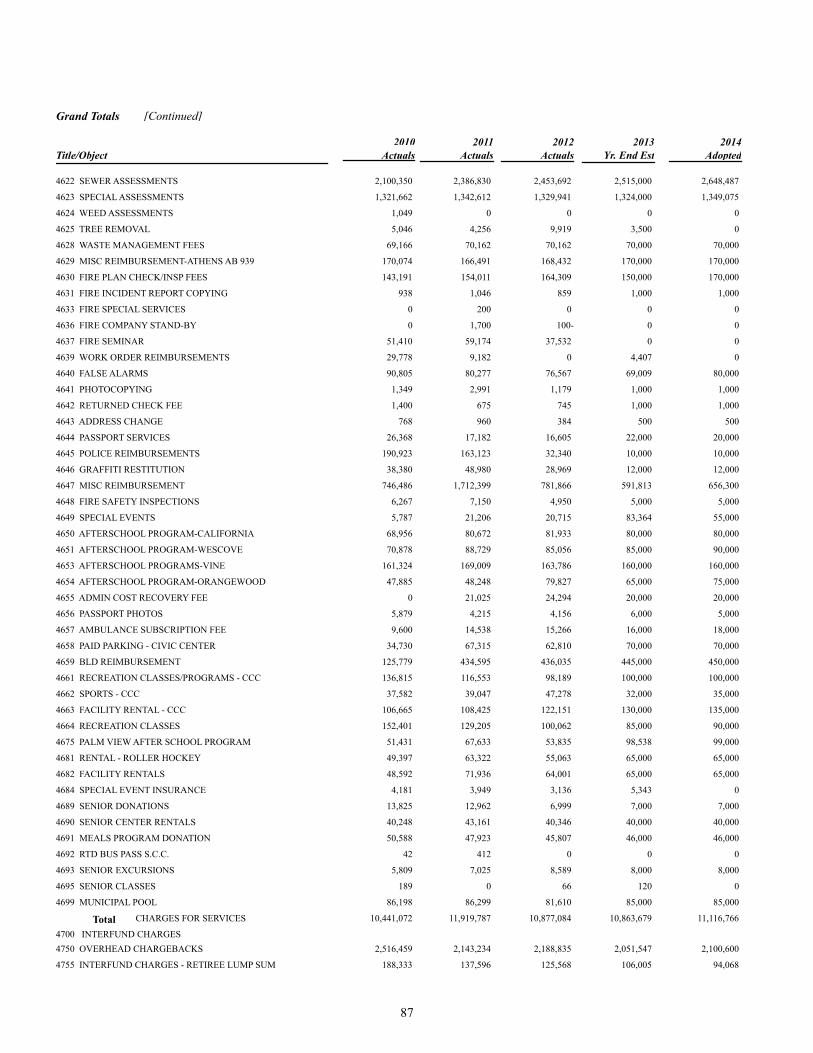
2010 ActualsTitle/Object
2013 Yr. End Est
2012 Actuals Actuals
2011 2014 Adopted
Grand Totals [Continued]
4622 SEWER ASSESSMENTS 2,100,350 2,386,830 2,453,692 2,515,000 2,648,487
4623 SPECIAL ASSESSMENTS 1,321,662 1,342,612 1,329,941 1,324,000 1,349,075
4624 WEED ASSESSMENTS 1,049 0 0 0 0
4625 TREE REMOVAL 5,046 4,256 9,919 3,500 0
4628 WASTE MANAGEMENT FEES 69,166 70,162 70,162 70,000 70,000
4629 MISC REIMBURSEMENT-ATHENS AB 939 170,074 166,491 168,432 170,000 170,000
4630 FIRE PLAN CHECK/INSP FEES 143,191 154,011 164,309 150,000 170,000
4631 FIRE INCIDENT REPORT COPYING 938 1,046 859 1,000 1,000
4633 FIRE SPECIAL SERVICES 0 200 0 0 0
4636 FIRE COMPANY STAND-BY 0 1,700 100- 0 0
4637 FIRE SEMINAR 51,410 59,174 37,532 0 0
4639 WORK ORDER REIMBURSEMENTS 29,778 9,182 0 4,407 0
4640 FALSE ALARMS 90,805 80,277 76,567 69,009 80,000
4641 PHOTOCOPYING 1,349 2,991 1,179 1,000 1,000
4642 RETURNED CHECK FEE 1,400 675 745 1,000 1,000
4643 ADDRESS CHANGE 768 960 384 500 500
4644 PASSPORT SERVICES 26,368 17,182 16,605 22,000 20,000
4645 POLICE REIMBURSEMENTS 190,923 163,123 32,340 10,000 10,000
4646 GRAFFITI RESTITUTION 38,380 48,980 28,969 12,000 12,000
4647 MISC REIMBURSEMENT 746,486 1,712,399 781,866 591,813 656,300
4648 FIRE SAFETY INSPECTIONS 6,267 7,150 4,950 5,000 5,000
4649 SPECIAL EVENTS 5,787 21,206 20,715 83,364 55,000
4650 AFTERSCHOOL PROGRAM-CALIFORNIA 68,956 80,672 81,933 80,000 80,000
4651 AFTERSCHOOL PROGRAM-WESCOVE 70,878 88,729 85,056 85,000 90,000
4653 AFTERSCHOOL PROGRAMS-VINE 161,324 169,009 163,786 160,000 160,000
4654 AFTERSCHOOL PROGRAM-ORANGEWOOD 47,885 48,248 79,827 65,000 75,000
4655 ADMIN COST RECOVERY FEE 0 21,025 24,294 20,000 20,000
4656 PASSPORT PHOTOS 5,879 4,215 4,156 6,000 5,000
4657 AMBULANCE SUBSCRIPTION FEE 9,600 14,538 15,266 16,000 18,000
4658 PAID PARKING - CIVIC CENTER 34,730 67,315 62,810 70,000 70,000
4659 BLD REIMBURSEMENT 125,779 434,595 436,035 445,000 450,000
4661 RECREATION CLASSES/PROGRAMS - CCC 136,815 116,553 98,189 100,000 100,000
4662 SPORTS - CCC 37,582 39,047 47,278 32,000 35,000
4663 FACILITY RENTAL - CCC 106,665 108,425 122,151 130,000 135,000
4664 RECREATION CLASSES 152,401 129,205 100,062 85,000 90,000
4675 PALM VIEW AFTER SCHOOL PROGRAM 51,431 67,633 53,835 98,538 99,000
4681 RENTAL - ROLLER HOCKEY 49,397 63,322 55,063 65,000 65,000
4682 FACILITY RENTALS 48,592 71,936 64,001 65,000 65,000
4684 SPECIAL EVENT INSURANCE 4,181 3,949 3,136 5,343 0
4689 SENIOR DONATIONS 13,825 12,962 6,999 7,000 7,000
4690 SENIOR CENTER RENTALS 40,248 43,161 40,346 40,000 40,000
4691 MEALS PROGRAM DONATION 50,588 47,923 45,807 46,000 46,000
4692 RTD BUS PASS S.C.C. 42 412 0 0 0
4693 SENIOR EXCURSIONS 5,809 7,025 8,589 8,000 8,000
4695 SENIOR CLASSES 189 0 66 120 0
4699 MUNICIPAL POOL 86,198 86,299 81,610 85,000 85,000
Total 10,441,072 11,919,787 10,877,084 10,863,679 11,116,766 CHARGES FOR SERVICES
4700 INTERFUND CHARGES
4750 OVERHEAD CHARGEBACKS 2,516,459 2,143,234 2,188,835 2,051,547 2,100,600
4755 INTERFUND CHARGES - RETIREE LUMP SUM 188,333 137,596 125,568 106,005 94,068
87

2010 ActualsTitle/Object
2013 Yr. End Est
2012 Actuals Actuals
2011 2014 Adopted
Grand Totals [Continued]
4760 INTERFUND CHARGES 2,184,775 2,087,482 2,221,551 3,283,711 2,725,942
4780 INTERFUND CHARGES - FUEL 693,109 728,932 792,765 758,084 795,777
4790 SALES TAX REIMBURSEMENT 585,461 851,273 0 0 0
Total 6,168,137 5,948,517 5,328,719 6,199,347 5,716,387 INTERFUND CHARGES
4800 OTHER REVENUES
4810 ADVERTISING REVENUE 0 1,700 30,080 55,000 40,000
4811 SALE REAL/PERSONAL PROP 0 0 33,258 0 0
4813 SALE MAPS/PLANS/DOCUMENTS 3,536 3,762 3,790 3,500 3,500
4814 PROCEEDS FROM AUCTION 5,024 19,505 24,859 10,000 10,000
4816 FINAL MAP 0 0 1,204 2,500 1,000
4818 MISCELLANEOUS 245,349 192,529 484,948 2,050,251 45,000
4819 INMATE PHONE REVENUE 15,220 7,200 3,934 7,000 7,000
4820 LANDSCAPING - COUNTY 52,134 38,047 38,047 38,000 38,000
4821 POOL MAINT - SCHOOL DIST 60,263 31,550 35,833 46,000 48,000
4822 CONTRACTUAL REIMBURSEMENT 32,886 11,573 11,178 10,000 8,000
4825 PROPERTY DAMAGE RECOVERY 179,612 26,834 23,421- 31,050 0
4829 MISC RESTITUTION 0 0 500 0 0
4831 POLICE EXPLORER DONATIONS 0 1,025 1,020 1,000 0
4832 SHOP DONATIONS 0 1,576 1,890 1,061 0
4833 EVERY 15 MINUTES REVENUE 1,000 275 0 0 0
4835 MOUNTED ENFORCEMENT TEAM 0 10,612 0 0 0
4838 MISC POLICE DONATIONS 300 3,650 17,350 61,690 50,000
4840 CIVIL SUBPOENAS 75 0 0 400 400
4853 DEBT PROCEEDS 0 10,085,335 9,591,070 7,580,383 7,500,000
4856 LOAN REPAYMENTS 406,385 684,856 762,232 475,962 400,000
4858 LOAN REPAYMENT-EQUITY SHARE 42,660 36,490 31,375 20,000 15,000
4859 ART IN PUBLIC PLACES 28,292 29,292 25,965 10,566 10,000
4860 GAIN/LOSS ON PROPERTY 0 250,199 0 0 0
4862 DONATIONS 16,388 17,255 21,158 15,125 0
4864 PRIVATE GRANTS 8,500 2,000 7,000 1,000 0
4865 PD DONATIONS - CAPITAL TRUST 66,380 0 0 0 0
4866 DONATIONS-GALSTER PARK NATURE CENTER 0 2,000 0 0 0
4867 DONATIONS-CAMERON COMM CENTER 4,787 5,600 2,750 2,750 0
4868 DONATIONS-SHADOW OAK COMM CTR 1,570 2,100 1,600 0 0
4869 DONATIONS - WC MEMORIAL WALL 0 13,386 0 0 0
4870 WALL OF HONOR 0 0 7,250 0 0
4871 BANNERS 0 0 0 1,600 0
Total 1,170,361 11,478,351 11,114,870 10,424,838 8,175,900 OTHER REVENUES
Grand Totals 102,650,165 111,425,404 109,178,466 106,093,750 99,498,144
88
CITY COUNCIL & CITY MANAGER’S OFFICE
MISSION STATEMENT: To provide policy leadership for the community and administration on all issues that affect the health, safety, and welfare of City of West Covina
he West Covina City Council is the governing body with the authority to adopt and enforce municipal laws and
regulations. They are elected at-large to serve a four-year term. They consist of four City Councilmembers and the Mayor who is appointed by the City Council to serve a one-year term. The appointment is made on a rotating basis, based on seniority. There are no term limits for Councilmembers. City Council appoints members of the community to serve on the City’s various boards and commissions to ensure that a wide cross-section of the community is represented in city government. The City Council also appoints the City Manager and City Attorney. The City Manager is the Chief Administrative Officer and is responsible for the operations of the City. The City Attorney serves as the City’s chief legal officer.
FY 2012-2013 ACCOMPLISHMENTS
• Completed numerous energy efficiency
upgrades to City facilities to reduce the amount of greenhouse gases generated by the City and to reduce the City’s energy cost. Southern California Edison awarded the City with the Platinum Achievement Award. West Covina is the only City in all of Southern California Edison’s service area to have received this prestigious recognition.
• Authorized over $4.5 million of Capital Improvement Projects to strengthen the City’s infrastructure, facilities, and parks.
• Selected as a Playful City USA honoree
by KaBoom. • Represented the City at numerous
community events and on eleven regional boards and committees.
• Inducted 15 honorees into the West
Covina “Walk of Fame” at Big League Dreams for their success both on and off the sports field.
• Hosted several e-waste collection events,
Christmas tree recycle program, and planted new trees in the community to become a “greener” City. The City was awarded Tree City USA for the 31st consecutive year.
• Celebrated the opening of the City’s first
dog park “Central Bark” and Splashpad playground at Del Norte Park.
• Installed new tot-lot playgrounds at
Palmview and Del Norte Parks. • Assisted Westfield America with
improvements and renovations to the Westfield Mall of over 100,000 square feet of additional retail space. New businesses include: Paris Baguette, Minato Seafood Buffet, Altus Mirus
T
89
Tutoring Center, Chipotle, Amapola Grocery store, and Lucille’s Smokehouse Bar-B-Que Restaurant.
• Assisted Cole Real Estate Investments in
marketing and entitlement assistance to Eastland Center, with the opening of WalMart, DSW, Chase Bank, and Ashley Furniture.
• Assisted The McIntyre Company in
completing rehabilitation, façade improvements, and new construction at the 6.37-acre McIntyre Square (formerly the Country Club Center). New business include: Oto Oto Restaurant, Five Star Nails, 85C Bakery Cafe, Gelatissimo, KBJ Home Design Center, Vincenzo’s Terraza Restaurant, AccuVision Optometry, The Face Shop, Guppy House, A&J Hotpot, Canaan Noodle House, Orlando Entertainment Karaoke, Cathay Bank, and Pho Island restaurant.
• Completed over 15 grand opening and
ribbon cutting events welcoming new businesses into West Covina.
FY 2013-2014
GOALS AND OBJECTIVES • Provide excellent customer service to
serve the City Council, residents and business community of West Covina.
• Implement structural reorganizations to
combine the Finance and Human Resources Departments into the Finance and Administrative Services Department, and place the Community Development Commission under the City Manager’s Office. This will allow
the City greater opportunities to promote economic development and generate significant cost savings to the City.
• Continue to promote “business friendly
environment” in the City. • Continue negotiations with the
California Department of Transportation to mitigate the impacts on residents and businesses on the proposed design and construction of the Interstate 10 carpool lane through West Covina.
• Utilize federal grant funds to complete
the Azusa/Amar intersection improvements to relieve traffic congestion at the City’s busiest intersection.
• Facilitate the future transfer of non-
housing assets back to the City for governmental use under AB 1484.
• Continue to administer development
agreements, owner participation agreements, bond agreements, reciprocal easement agreements, CC&R’s, and covenants of the former redevelopment agency.
• Continue legal challenges against the
State of California for illegal takeaway of State’s invalidating of Agency/City loans.
• Continue to assist West Covina
businesses and prospective tenants through the entitlement process, site location, marketing, and grand openings.
90

ADMINISTRATION MISSION STATEMENT: To provide administrative leadership and management for the daily operations of the City government under the direction of the City Council
Office of the City Manager
The City Manager is appointed by the City Council and serves as the administrative head of the City and the key staff advisor to the City Council. His responsibilities are to implement policies as directed by the City Council and to enforce all municipal laws and regulations for the benefit of the community. His duties are to direct and supervise the departments, prepare and administer the annual City budget, and plan and implement key projects.
City Attorney
The City Attorney represents and advises the City Council, boards, commissions, officers, and employees in all matters of law pertaining to their offices and official activities; prepares all proposed ordinances, resolutions and amendments; prepares or approves the form of all other legal documents; and represents the City in litigation to which the City is a party.
City attorney services are provided on a contractual basis. This budget also includes expenditures for the City Prosecutor and other attorneys hired by the City for designated cases.
Community Development Commission (CDC)
As a cost saving measure, the CDC was incorporated into the City Manager’s Office. The CDC was originally established to eliminate blight, develop affordable housing,
and vitalize the economic environment of the City.
With the elimination of redevelopment in 2011, the City of West Covina’s Successor Agency of the West Covina Redevelopment (Successor Agency) was established to unwind the operations of the former redevelopment agency, as dictated under the redevelopment elimination legislation (AB 1x26 and AB 1484).
The CDC provides administrative support to the Successor Agency, which is charged with selling assets, repaying existing indebtedness, completing performance of existing contractual obligations, and otherwise winding down operations and preserving agency assets for the benefit of taxing agencies. The actions of the Successor Agency are regulated by an Oversight Board.
The CDC still retains its economic development function to bring tax generating businesses to the City.
The CDC has several housing agreements with long term affordability covenants, which would need to be monitored and enforced to ensure compliance with the affordability guidelines and maximum rent charged as set forth in the various housing agreements and state affordable housing requirements.
91
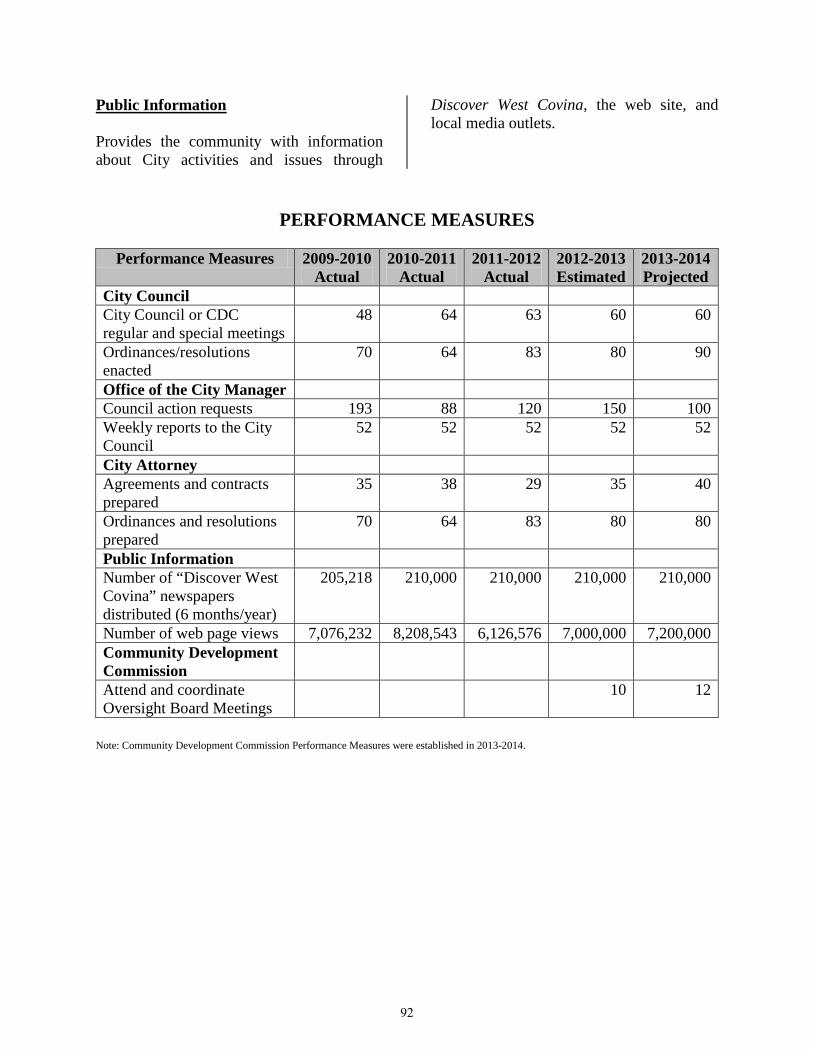
Public Information Provides the community with information about City activities and issues through
Discover West Covina, the web site, and local media outlets.
PERFORMANCE MEASURES
Performance Measures 2009-2010 Actual
2010-2011 Actual
2011-2012 Actual
2012-2013 Estimated
2013-2014 Projected
City Council City Council or CDC regular and special meetings
48 64 63 60 60
Ordinances/resolutions enacted
70 64 83 80 90
Office of the City Manager Council action requests 193 88 120 150 100 Weekly reports to the City Council
52
52 52 52 52
City Attorney Agreements and contracts prepared
35 38 29 35 40
Ordinances and resolutions prepared
70 64 83 80 80
Public Information Number of “Discover West Covina” newspapers distributed (6 months/year)
205,218 210,000 210,000 210,000 210,000
Number of web page views 7,076,232 8,208,543 6,126,576 7,000,000 7,200,000 Community Development Commission
Attend and coordinate Oversight Board Meetings
10 12
Note: Community Development Commission Performance Measures were established in 2013-2014.
92

APPROVED POSITIONS
Title FY 09-10 FY 10-11 FY 11-12 FY 12-13 FY 13-14
Full -Time Positions( CDC absorbed in City Manager's Office starting FY 13-14)City Manager 1.00 1.00 1.00 1.00 1.00 Assistant City Manager / CDC Director - - - - 1.00 Assistant City Manager / Finance Director 0.50 0.50 0.50 0.50 - Deputy City Manager 1.00 1.00 1.00 1.00 - Management Analyst II (PIO) 1.00 1.00 1.00 1.00 1.00 Executive Asst to the City Manager 1.00 1.00 1.00 1.00 1.00 Sr Administrative Assistant 1.00 1.00 1.00 1.00 1.00 CDC Redevelopment Project Manager - - - - 1.00 CMO Administrative Assistant I 1.00 1.00 1.00 1.00 - CDC Administrative Asst I - - - - 1.00
Sub-Total 6.50 6.50 6.50 6.50 7.00
Former CDC:CDC Director 1.00 1.00 1.00 1.00 - Assistant CDC Director 1.00 1.00 1.00 1.00 - Management Analyst II 1.00 1.00 - - - Redevelopment Manager 1.00 1.00 1.00 - - Redevelopment Project Manager 1.00 1.00 1.00 - - Senior Redevelopment Project Manager 3.00 - - - - Sr Administrative Assistant 1.00 1.00 1.00 - - Administrative Asst I 1.00 1.00 1.00 - - Housing Program Coordinator 1.00 1.00 1.00 - - Redevelopment Project Coordinator 2.00 1.00 1.00 - -
Sub-Total 13.00 9.00 8.00 2.00 -
Full-Time Total 19.50 15.50 14.50 8.50 7.00
Full-time Equivalent (FTE)Administrative Aide 0.04 0.04 0.04 0.04 0.04 Planning Intern - CDC 2.00 2.00 2.00 - - FTE Total 2.04 2.04 2.04 0.04 0.04
Department Total 21.54 17.54 16.54 8.54 7.04
93
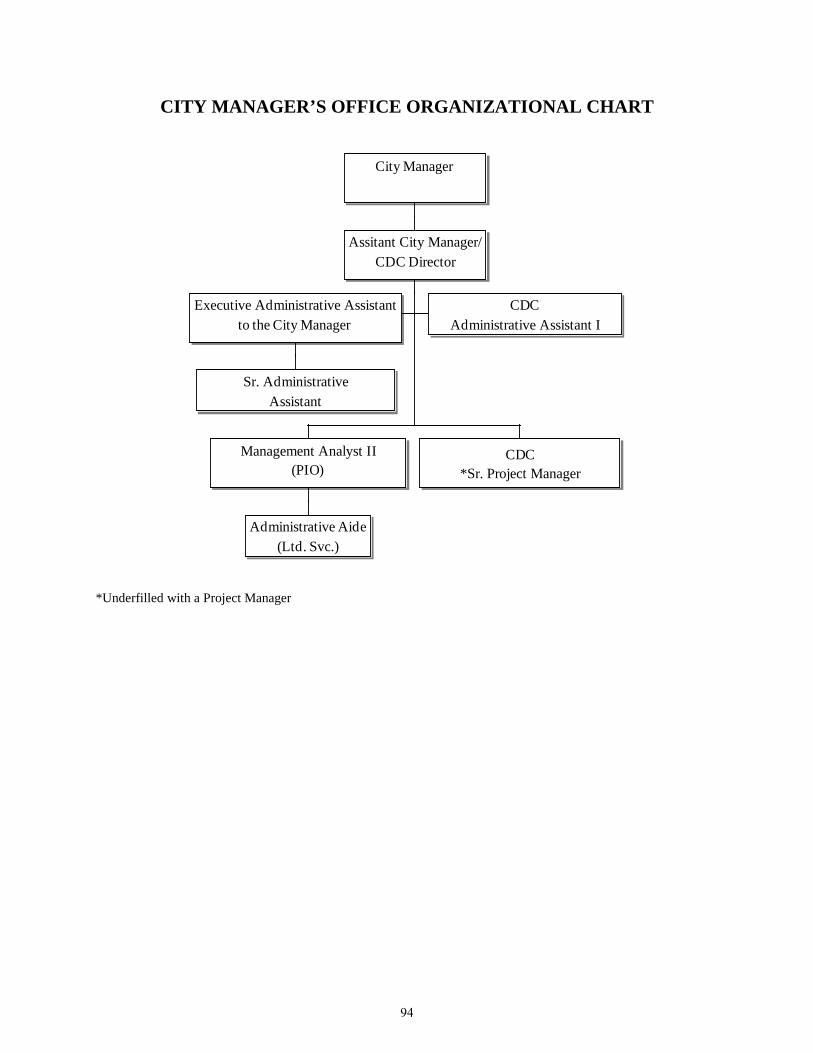
CITY MANAGER’S OFFICE ORGANIZATIONAL CHART
City Manager
Assitant City Manager/CDC Director
Executive Administrative Assistantto the City Manager
Sr. AdministrativeAssistant
CDCAdministrative Assistant I
Management Analyst II(PIO)
Administrative Aide(Ltd. Svc.)
CDC*Sr. Project Manager
*Underfilled with a Project Manager
94

ACTIVITY TREE
City Manager
City AttorneyRepresentative of City & CDC (legal opinions, records request, etc.)City Prosecutor's OfficeOther Legal Representation Litigation Personnel Matters
AdministrationSupport City Council Operations Arrange Meetings, prepare updates, letters, etcSupervise DepartmentsLegislative LiaisonImplement Key ProjectsManage the Agenda ProcessConstituent requests for information Walk-ins Telephone RequestsPrepare & Administer City BudgetAdministrative Support for Successor AgencyEconomic Development for the CityAdminister former CDC Housing loans and agreements
Public InformationMedia Relations and Press Releases"Discover West Covina" NewsletterCity Website
95
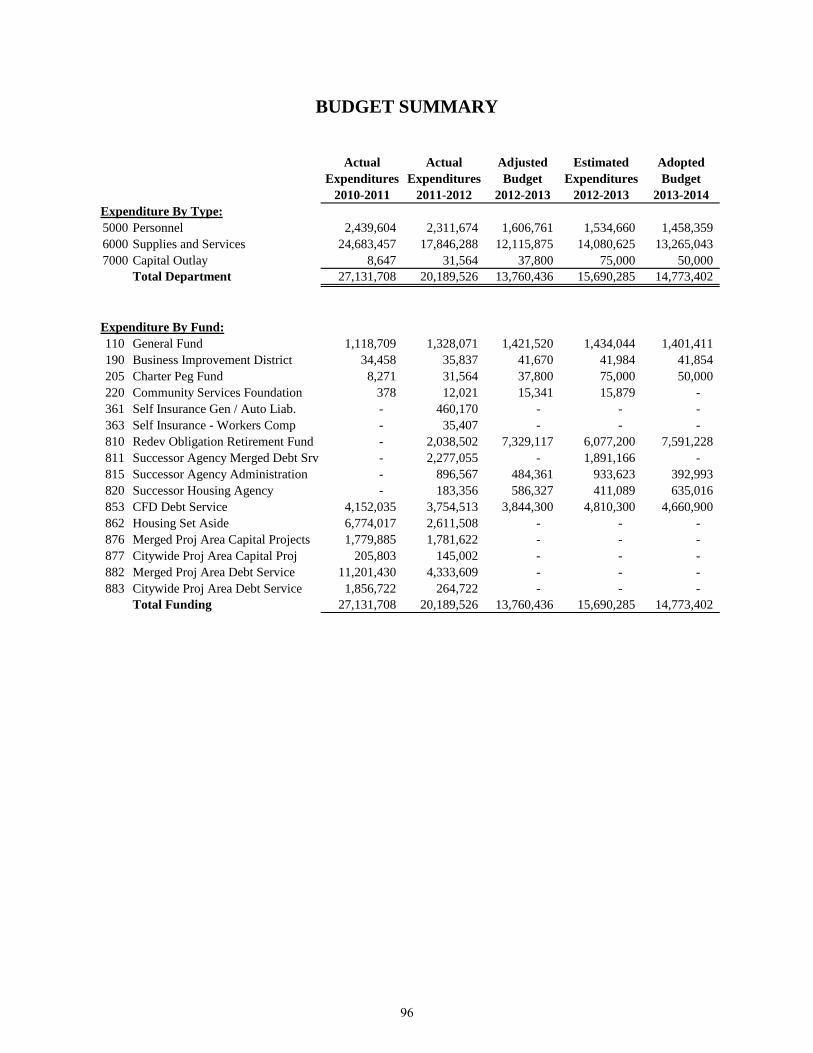
BUDGET SUMMARY
Actual Actual Adjusted Estimated AdoptedExpenditures Expenditures Budget Expenditures Budget
2010-2011 2011-2012 2012-2013 2012-2013 2013-2014Expenditure By Type:5000 Personnel 2,439,604 2,311,674 1,606,761 1,534,660 1,458,359 6000 Supplies and Services 24,683,457 17,846,288 12,115,875 14,080,625 13,265,043 7000 Capital Outlay 8,647 31,564 37,800 75,000 50,000
Total Department 27,131,708 20,189,526 13,760,436 15,690,285 14,773,402
Expenditure By Fund:110 General Fund 1,118,709 1,328,071 1,421,520 1,434,044 1,401,411 190 Business Improvement District 34,458 35,837 41,670 41,984 41,854 205 Charter Peg Fund 8,271 31,564 37,800 75,000 50,000 220 Community Services Foundation 378 12,021 15,341 15,879 - 361 Self Insurance Gen / Auto Liab. - 460,170 - - - 363 Self Insurance - Workers Comp - 35,407 - - - 810 Redev Obligation Retirement Fund - 2,038,502 7,329,117 6,077,200 7,591,228 811 Successor Agency Merged Debt Srv - 2,277,055 - 1,891,166 - 815 Successor Agency Administration - 896,567 484,361 933,623 392,993 820 Successor Housing Agency - 183,356 586,327 411,089 635,016 853 CFD Debt Service 4,152,035 3,754,513 3,844,300 4,810,300 4,660,900 862 Housing Set Aside 6,774,017 2,611,508 - - - 876 Merged Proj Area Capital Projects 1,779,885 1,781,622 - - - 877 Citywide Proj Area Capital Proj 205,803 145,002 - - - 882 Merged Proj Area Debt Service 11,201,430 4,333,609 - - - 883 Citywide Proj Area Debt Service 1,856,722 264,722 - - -
Total Funding 27,131,708 20,189,526 13,760,436 15,690,285 14,773,402
96
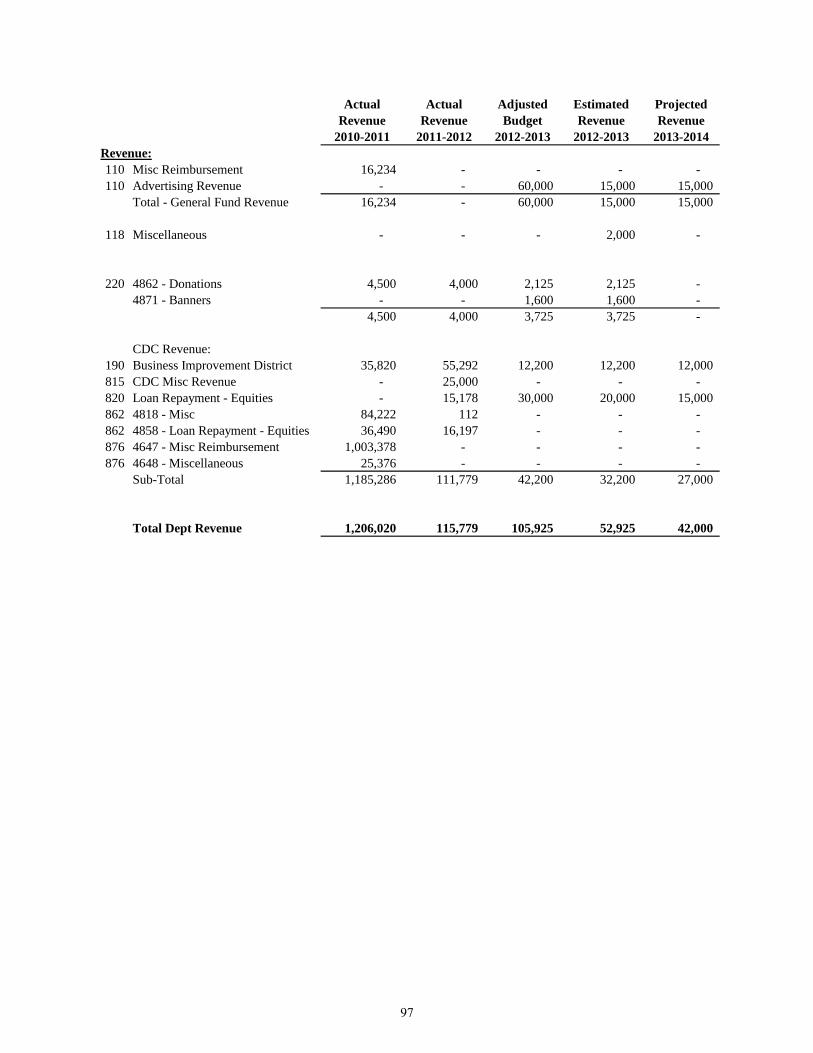
Actual Actual Adjusted Estimated ProjectedRevenue Revenue Budget Revenue Revenue
2010-2011 2011-2012 2012-2013 2012-2013 2013-2014Revenue:110 Misc Reimbursement 16,234 - - - - 110 Advertising Revenue - - 60,000 15,000 15,000
Total - General Fund Revenue 16,234 - 60,000 15,000 15,000
118 Miscellaneous - - - 2,000 -
220 4862 - Donations 4,500 4,000 2,125 2,125 - 4871 - Banners - - 1,600 1,600 -
4,500 4,000 3,725 3,725 -
CDC Revenue:190 Business Improvement District 35,820 55,292 12,200 12,200 12,000 815 CDC Misc Revenue - 25,000 - - - 820 Loan Repayment - Equities - 15,178 30,000 20,000 15,000 862 4818 - Misc 84,222 112 - - - 862 4858 - Loan Repayment - Equities 36,490 16,197 - - - 876 4647 - Misc Reimbursement 1,003,378 - - - - 876 4648 - Miscellaneous 25,376 - - - -
Sub-Total 1,185,286 111,779 42,200 32,200 27,000
Total Dept Revenue 1,206,020 115,779 105,925 52,925 42,000
97

Page Intentionally Left Blank
98
CITY CLERK’S OFFICE MISSION STATEMENT: To ensure the preservation and integrity of all official City records, including the legislative record; maintain an effective records management system; and provide professional service and support to all City departments, staff, and the citizens of West Covina
he City Clerk’s Office is a support department that provides support to the City Council, Administration,
other City departments and the public. The department consists of three full time employees. The City Clerk is an elected official; the Assistant City Clerk is the Department Head managing the day-to-day office activities. The City Clerk’s Office maintains custody, control, and storage of official City documents and records pertaining to the operation of City government.
Administration The City Clerk’s Office is in charge of the preparation, publication, and distribution of all agenda material for the City Council, Community Development Commission, the Successor Agency to the West Covina Redevelopment Agency, and the Public Financing Authority including the recordation of all meeting minutes. The department ensures that actions are in compliance with all federal, state, and local statutes and regulations, and that all actions are properly executed, recorded, and archived. The department certifies and distributes ordinances and resolutions as appropriate, publishes and posts legal notices as required, and codifies ordinance into West Covina Municipal Code. The department also receives and opens Capital Improvement bids; receives claims, subpoenas and lawsuits, and records documents with the Los Angeles County Registrar Recorders Office. The Assistant City Clerk serves as the secretary to the
Oversight Board of the Successor Agency to the West Covina Redevelopment Agency preparing the agenda material and related documents.
Elections The City Clerk’s Office coordinates all City elections for elective office, initiatives, referenda, and recalls. The City’s general municipal elections are consolidated with the Los Angeles County Elections Division and are held in November of odd numbered years.
Political Reform Act Pursuant to the Political Reform Act, the City Clerk serves as the filing officer/official for Campaign Disclosure Statements for elected officials, candidates, and committees; and for Statement of Economic Interests filed by public officials and designated employees. The City’s Conflict of Interest Code is reviewed and updated on a bi-annual basis.
Public Records Act & Public Information The City Clerk’s Office provides public information and responds to requests for documents pursuant to the provisions of the California Public Records Act. The department also assists staff with research of legislative history and actions.
Commissions The City Clerk’s office oversees the appointment process for the City’s Commissions and Advisory Boards. The office facilitates all required noticing
T
99
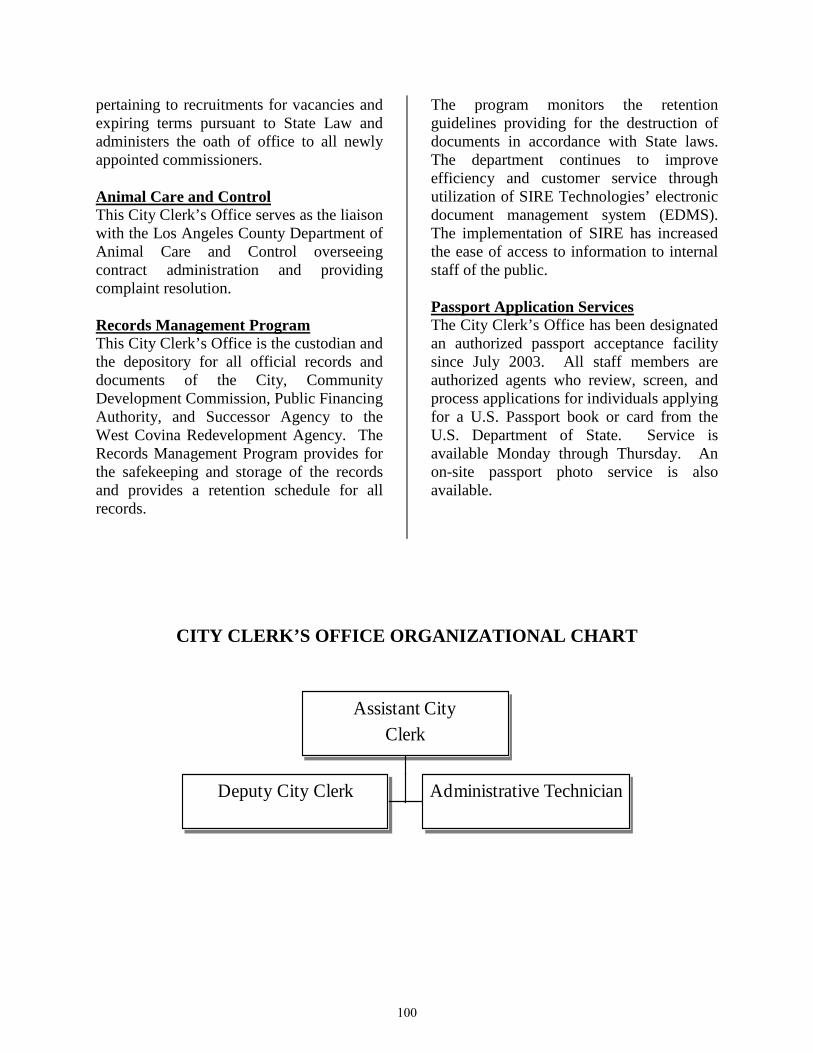
pertaining to recruitments for vacancies and expiring terms pursuant to State Law and administers the oath of office to all newly appointed commissioners. Animal Care and Control This City Clerk’s Office serves as the liaison with the Los Angeles County Department of Animal Care and Control overseeing contract administration and providing complaint resolution. Records Management Program This City Clerk’s Office is the custodian and the depository for all official records and documents of the City, Community Development Commission, Public Financing Authority, and Successor Agency to the West Covina Redevelopment Agency. The Records Management Program provides for the safekeeping and storage of the records and provides a retention schedule for all records.
The program monitors the retention guidelines providing for the destruction of documents in accordance with State laws. The department continues to improve efficiency and customer service through utilization of SIRE Technologies’ electronic document management system (EDMS). The implementation of SIRE has increased the ease of access to information to internal staff of the public. Passport Application Services The City Clerk’s Office has been designated an authorized passport acceptance facility since July 2003. All staff members are authorized agents who review, screen, and process applications for individuals applying for a U.S. Passport book or card from the U.S. Department of State. Service is available Monday through Thursday. An on-site passport photo service is also available.
CITY CLERK’S OFFICE ORGANIZATIONAL CHART
Assistant CityClerk
Deputy City Clerk Administrative Technician
100
FY 2012-2013 ACCOMPLISHMENTS
• Prepared, published, and distributed
agendas and agenda packets for the City Council, Community Development Commission, Successor Agency to the West Covina Redevelopment Agency, Public Financing Authority, and Oversight Board meetings; published and posted required legal notices; prepared minutes; and maintained the legislative action of such meetings.
• Reviewed and revised Commissioner
Handbook.
• Prepared comprehensive Candidate Information Handbook and Resource Guide for upcoming November 5, 2013 general municipal election.
• Coordinated and conducted the
recruitment process for all expiring Commission terms and to fill vacancies.
• Executed, indexed, and distributed all
resolutions, ordinances, contracts, and recorded documents approved by the Council.
• Maintained electronic document
management system. • Received, processed and responded to
verbal and written Public Records Act requests, claims, subpoenas, and summons.
• Provided support to City departments
and staff as requested, researching legislative actions, and providing copies as requested.
• Received and reviewed campaign
disclosure statements from elected
officials and committees pursuant to the Political Reform Act.
• Received and reviewed Statements of
Economic Interests for elected officials, city commissioners, and designated employees pursuant to the Political Reform Act.
• Processed approximately 700 passport
applications and 400 passport photos. • Updated over 80 West Covina Municipal
Code books and reviewed all Code books for completeness. Newly adopted ordinances are posted on the website so current code information is continually available.
• Reviewed non-essential, obsolete
records for prepared for destruction.
• Coordinated AB 1234 Local Ethics Training for election and appointed officials.
• Conducted biennial review and update of City’s and all other City agencies Conflict of Interest Codes.
FY 2013-2014
GOALS AND OBJECTIVES • Successfully manage the November 5,
2013 Municipal election for the offices of three Councilmembers, City Clerk and City Treasurer in coordination with the County.
• Facilitate nominations process for all
Councilmember, City Clerk and City Treasurer candidates. Issue and received candidate nomination papers and related documents
101

• Continue with the daily operations of the City Clerk’s Office and maintain the accurate recording and legislative action of the proceedings of the City Council, Community Development Commission, Successor Agency to the West Covina Redevelopment Agency, Public Financing Authority, and Oversight Board.
• Provide continued support to the City
Council, staff and the public. • Continue conversion of official City
documents to electronic format on an on-going basis.
• Update the process used to monitor and track Public Records Request.
• Review Records Management and
Retention Manual for revision and update
• Develop a “Citizens Guide to Your City
Council Meeting”, a guide that will assist residents with general information and procedures in which public business is transacted at a City Council meeting.
• Research for implementation SIRE’s electronic workflow application and SIRE’s Agenda to Go.
PERFORMANCE MEASURES For all Agencies - City, Community Development Commission, Public Financing Authority, Successor Agency and Oversight Board
Performance Measures 2009-2010 Actual
2010-2011 Actual
2011-2012 Actual
2012-2013 Actual
2013-2014 Projected
Agendas and packets 48 40 40 65 48 Minutes prepared 70 40 40 65 48 Documents for recordation processed and indexed
80
68
18
60
50
Resolutions and ordinances processed and indexed
70
72
71
90
85
Contracts/Agreements processed and indexed
35
67
85
35
40
Municipal elections conducted or assisted
1
0
1
0
1
Claims/subpoenas/summons received and indexed
135
130
153
100
100
Passport applications accepted and processed
1,053
1,053
669
900
1000
Passport photos taken 445 445 389 480 550
102
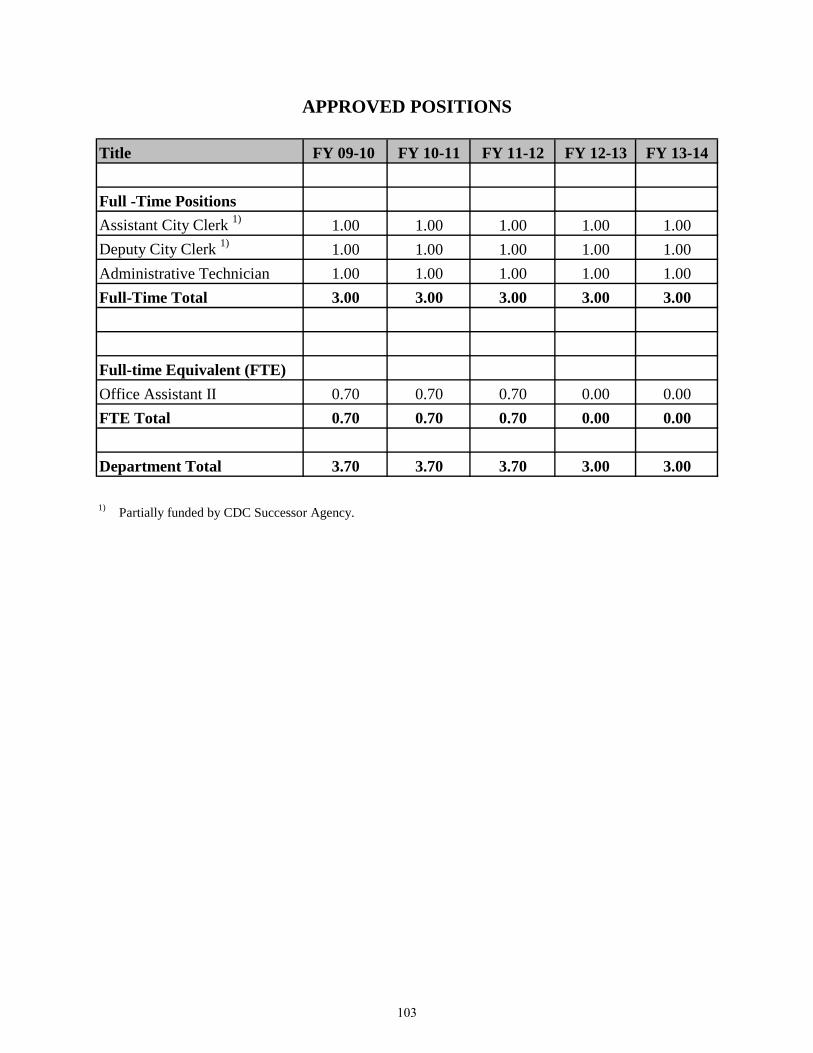
APPROVED POSITIONS
Title FY 09-10 FY 10-11 FY 11-12 FY 12-13 FY 13-14
Full -Time PositionsAssistant City Clerk 1) 1.00 1.00 1.00 1.00 1.00Deputy City Clerk 1) 1.00 1.00 1.00 1.00 1.00Administrative Technician 1.00 1.00 1.00 1.00 1.00Full-Time Total 3.00 3.00 3.00 3.00 3.00
Full-time Equivalent (FTE)Office Assistant II 0.70 0.70 0.70 0.00 0.00FTE Total 0.70 0.70 0.70 0.00 0.00
Department Total 3.70 3.70 3.70 3.00 3.00
1) Partially funded by CDC Successor Agency.
103
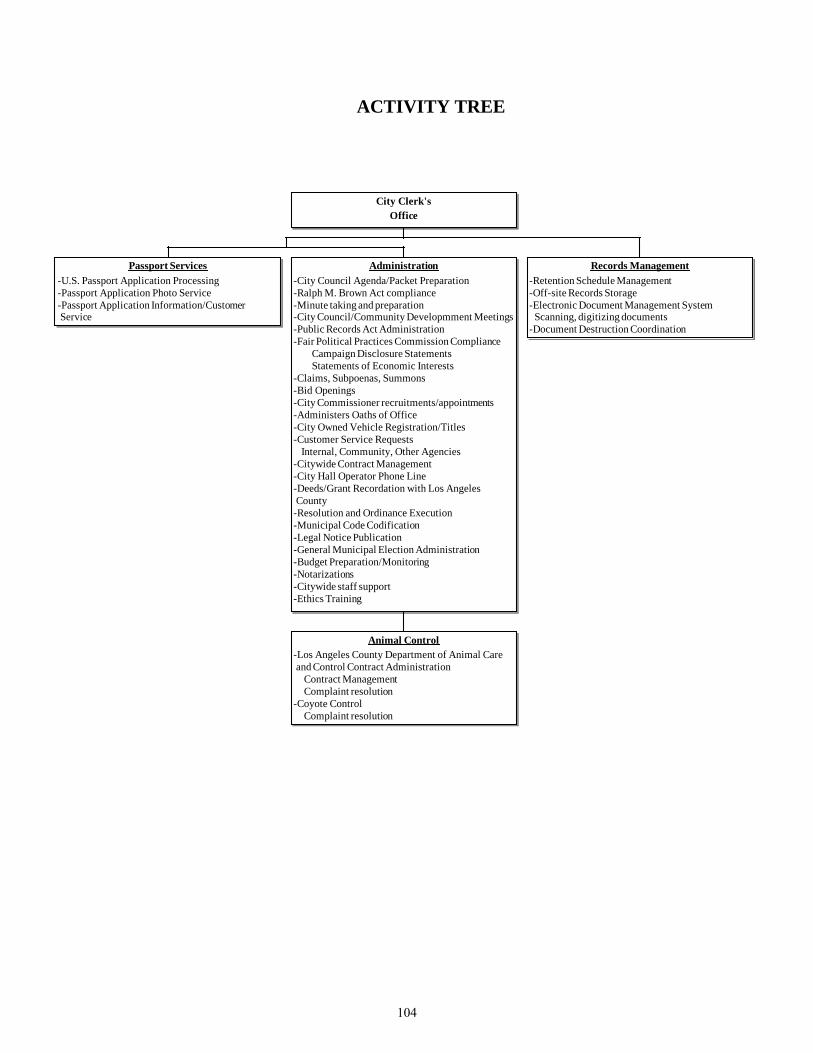
ACTIVITY TREE
City Clerk'sOffice
Passport Services-U.S. Passport Application Processing-Passport Application Photo Service-Passport Application Information/Customer Service
Administration-City Council Agenda/Packet Preparation-Ralph M. Brown Act compliance-Minute taking and preparation-City Council/Community Developmment Meetings-Public Records Act Administration-Fair Political Practices Commission Compliance Campaign Disclosure Statements Statements of Economic Interests-Claims, Subpoenas, Summons-Bid Openings-City Commissioner recruitments/appointments-Administers Oaths of Office-City Owned Vehicle Registration/Titles-Customer Service Requests Internal, Community, Other Agencies-Citywide Contract Management-City Hall Operator Phone Line-Deeds/Grant Recordation with Los Angeles County-Resolution and Ordinance Execution-Municipal Code Codification-Legal Notice Publication-General Municipal Election Administration-Budget Preparation/Monitoring-Notarizations-Citywide staff support-Ethics Training
Animal Control-Los Angeles County Department of Animal Care and Control Contract Administration Contract Management Complaint resolution-Coyote Control Complaint resolution
Records Management-Retention Schedule Management-Off-site Records Storage-Electronic Document Management System Scanning, digitizing documents-Document Destruction Coordination
104
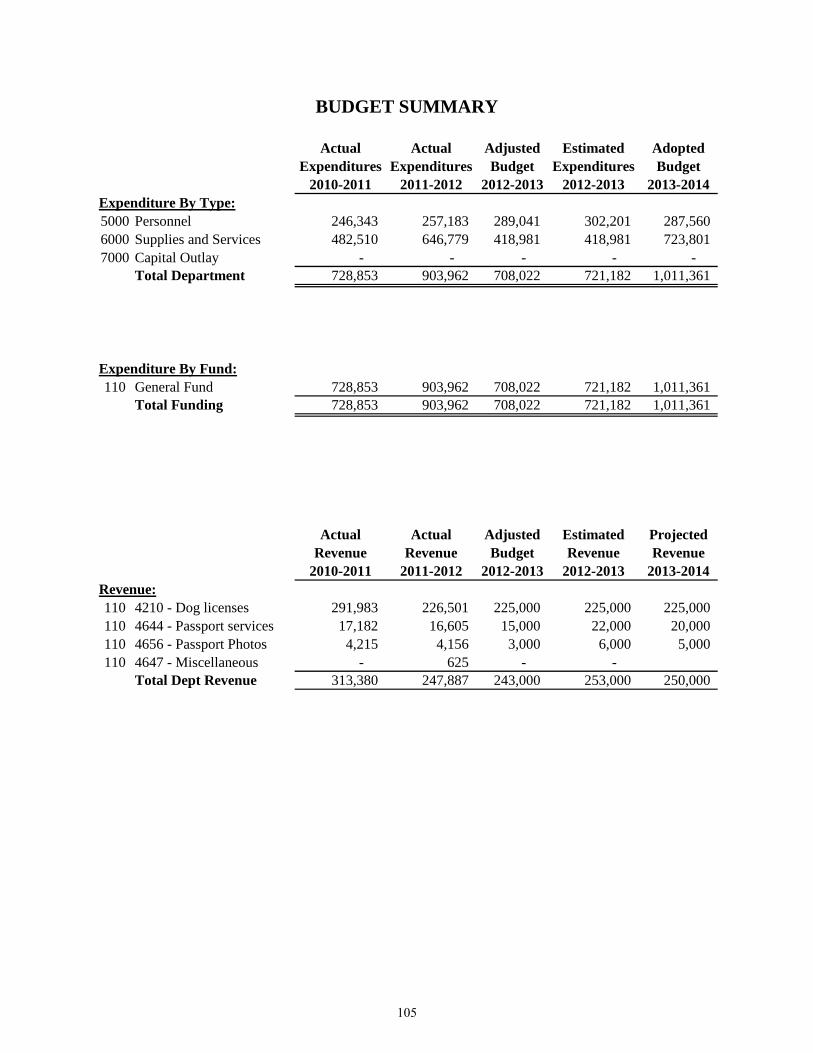
BUDGET SUMMARY
Actual Actual Adjusted Estimated AdoptedExpenditures Expenditures Budget Expenditures Budget
2010-2011 2011-2012 2012-2013 2012-2013 2013-2014Expenditure By Type:5000 Personnel 246,343 257,183 289,041 302,201 287,560 6000 Supplies and Services 482,510 646,779 418,981 418,981 723,801 7000 Capital Outlay - - - - -
Total Department 728,853 903,962 708,022 721,182 1,011,361
Expenditure By Fund:110 General Fund 728,853 903,962 708,022 721,182 1,011,361
Total Funding 728,853 903,962 708,022 721,182 1,011,361
Actual Actual Adjusted Estimated ProjectedRevenue Revenue Budget Revenue Revenue
2010-2011 2011-2012 2012-2013 2012-2013 2013-2014Revenue:110 4210 - Dog licenses 291,983 226,501 225,000 225,000 225,000 110 4644 - Passport services 17,182 16,605 15,000 22,000 20,000 110 4656 - Passport Photos 4,215 4,156 3,000 6,000 5,000 110 4647 - Miscellaneous - 625 - -
Total Dept Revenue 313,380 247,887 243,000 253,000 250,000
105

Page Intentionally Left Blank
106

FINANCE & ADMINISTRATIVE SERVICES MISSION STATEMENT: To manage and to protect the City’s financial resources by applying generally accepted accounting and investment principles, to provide reliable information systems services to internal users, and to enforce the City’s business license and purchasing ordinances as outlined in the West Covina Municipal Code. To hire quality employees who meet the needs of the City, enhance the workplace for all employees and to identify and minimize exposures that could result in financial loss to the City through creative and cost-effective human resource and risk management.
his department is responsible for all financial affairs of the City of West Covina. The goal of the Finance and
Administrative Services Department is to maintain financial stability, to provide accurate and timely financial information and recommendations to the City’s decision makers, and to protect the City’s assets through the establishment of effective internal controls. The department also strives to provide valuable and responsive support services to the other City departments. The department consists of four divisions with a total of 22 employees.
Administrative Services Division
The administrative services division oversees all aspects of the finance function and is responsible for the City’s budget preparation. This division is also responsible for administration of citywide telecommunications including supervision of the part time telecommunications coordinator, management of the 9-1-1 system and dispatch databases, the City’s telephone system, and City cell phones.
This division also serves 338 full-time and approximately 150 part-time staff. The department provides consultation and management services in the areas of training, recruitment, and selection; benefits
management; employee and labor relations; workers’ compensation, general and auto liability; insurance procurement; loss prevention including claims management, organizational development, classification, and compensation; employee evaluation, training, safety, grievance, and discipline; compliance with state and federal laws; equal employment opportunity; collective bargaining and contract management; comprehensive employee records management; employee verification of employment; and support to the Human Resources Commission.
Under the direction of the Administrative Services Manager, regular full-time staff includes one safety and claims manager, one administrative assistant II, two human resources technicians and a management analyst II.
Human Resources Commission
The Human Resources Commission was created by the City Council to perform the following duties:
• Act in an advisory capacity to the CityCouncil and the Human ResourcesOfficer on personnel matters notspecifically delegated by law to otherparties in the City service.
T
107

• Review the recruitment and selection process for the classified service, including the certification of eligible candidates for appointment; review the City’s Position Classification System, and make comments and recommendations regarding such processes to the Human Resources Officer of the Council.
• When requested by the City Council or
the Human Resources Officer, hold hearings and make other recommendations on any matters of personnel administration within the limits of the request by the City Council or the city manager.
• Receive and hear appeals submitted by
any person in the city service relative to any dismissal, demotion, reduction in pay or alleged violation of the classification and salary resolution or the personnel rules; and to certify its findings and recommendations as provided in this chapter.
• In any investigation or hearing
conducted by the commission, it shall have the power to examine witnesses under oath and compel attendance or the production of evidence before it by subpoenas, issued in the name of the City and attested by the city clerk. It shall be the duty of the Chief of Police to cause all such subpoenas to be served. Refusal of a person to attend or testify in answer to such subpoena shall subject such person to prosecution, in the same manner set forth by law for failure to appear before the City Council in response to a subpoena issued by the City Council. Each member of the Human Resources Commission shall have the power to administer oaths to witnesses.
Revenue Management Division This division manages debt and cash activity for the City, and is responsible for the receipt, deposit, accounts receivable and investment of funds. It also oversees the business license function that is responsible for ensuring that all businesses maintain a current business license and pay applicable taxes. The city treasurer is elected by the community at large and reviews monthly investment reports and cash flows. The Finance and Administrative Services Director is responsible for managing the day-to-day investment operations. Surplus funds are invested for maximum safety, liquidity, and yield in compliance with the City’s investment policy and the California Government Code. Accounting Division The accounting division includes the payroll, accounts payable, general accounting, financial reporting, and fixed assets functions. This division monitors various lease and loan payments due to the City and the CDC Housing Successor; maintains financial records; complies with various federal, state, and local reporting requirements; coordinates and serves as liaison for financial audits; provides monthly budget reports to departments; assists employees with payroll issues; evaluates internal controls; and provides oversight of the financial accounting software. It also oversees the purchasing section that is responsible for maximizing cost effectiveness and controlling purchases through centralized purchasing, assisting City departments in vendor selection for equipment and service purchases, and ensuring that City purchasing policies are followed. The purchasing division reviews
108
City contracts to ensure they are in compliance with the terms and conditions in the Request for Proposal (RFP) specifications. Information Systems Division The information systems division provides software and hardware maintenance for the City’s automated systems, supports computer users in all departments, maintains the citywide and local area networks, and assists departments in the selection of
software systems. The division also coordinates training of City staff on new computer equipment and software, and develops office automation standards. Plus is coordinates the reprographics section that provides citywide shipping and mailing, photocopying, printing, binding, and desktop publishing services. This division also provides supplies such as envelopes, letterhead, NCR forms, four-color certificates, business cards, and the paper used in all department copiers.
109

FINANCE DEPARTMENT ORGANIZATIONAL CHART
Director of Finance &Administrative Services
Sr. AdministrativeAssistant
TelecommnicationsCoordinator (Part-time)
AccountingManager
Accountant
Management Analyst IPurchasing
Accounting TechnicianPayroll (2)
Sr. AccountClerk
RevenueManager
Business LicenseInspector
Sr. Account ClerkAccounts Receivable
Sr. Account ClerkBusiness License
Sr. Account ClerkCashier
AdministrativeServices Manager
Safety & ClaimsManager
Management Analyst IIBudget Analyst
Human ResourcesTechnician (2)
Computer SystemsAdministrator
Computer ServicesTechnician (2)
ReprographicsTechnician
110
FY 2012-2013 ACCOMPLISHMENTS
• Managed the City’s investment portfolio
by investing funds in accordance with the adopted investment policy.
• Continued the on-going comprehensive
evaluation of internal controls to effectively safeguard the City’s assets and to compile sufficient reliable information for the preparation of the City’s financial statements in conformity with generally accepted accounting principles.
• Continued to streamline department
workflow while maintaining proper segregation of duties.
• Coordinated the financial aspects of the
dissolution of the West Covina Redevelopment Agency.
• As a result of the redevelopment agency
dissolution, prepared, the semi-annual Recognized Obligation payment Schedule (ROPS) for the periods January to June 2013, July – December 2013 and January to June 2014.
• Corresponded with State Department of
Finance and County Auditor Controller’s Office regarding redevelopment agency dissolution.
• Coordinated the preparation of the two
Due Diligence Reviews of the former Redevelopment Agency pursuant to AB1484.
• Revised all budget chargebacks to more adequately address cost recovery.
• Selected a new vendor and oversaw the installation and training for the City’s new pay telephone system in the jail.
• Continued to review all phone bills for
accuracy and areas to streamline costs.
• Coordinated phone moves, adds or changes for numerous departments: Fire Administration, Fire Prevention, Community Services, Police Administration, West Covina Service Group, Detective Bureau, Traffic, Planning, Human Resources, Public Works, Maintenance, CDC, Risk Management, and City Clerk.
• Coordinated purchasing, training, and
changing out cell phones or landline phones for all City departments.
• Oversaw installation of upgrade for
Police and Maintenance phone switch from SX 2000 to SX 3300.
• Continued to ensure the 9-1-1 database
is up to date for West Covina and Verizon Master Street Address Guide.
• Converted City Hall and Maintenance
Internet access to new provider, Charter, resulting in lower costs and better speed.
• Converted three phone switch
connection to new provider, Charter, resulting in lower costs
• Managed contract administration and
grant monitoring. • Assisted departments with use of the
budget preparation and requisitioning modules of the financial software.
• Adjusted business license fees by
Consumer Price Index increase.
111
• Started accepting parking citation payments via web and telephone.
• Implemented tobacco retail license
(TRL) ordinance.
• Completed $2.0 million in Proposition A exchanges with two different cities.
• Published the annual budget and CIP
document for the 2012-13 fiscal year in both electronic and hardcopy format.
• Completed issuance of $7.6 million in
tax revenue anticipation notes for cash flow purposes.
• Substituted letters of credit on two bond
issues greatly reducing interest expense. • Cross-training efforts were continued
within the department, particularly in the accounts payable, payroll, and business license functions.
• Developed desk procedure manuals. • Prepared a Comprehensive Annual
Financial Report (CAFR) for the year ended June 30, 2012 and submitted the CAFR to the Government Finance Officers’ Association Certificate of Achievement for Excellence in Financial Reporting Award program.
• Prepared financial reports required by
federal, state, and county agencies.
• Continued to provide assistance to the Human Resources department with the “Human Resources” module of the Eden software.
• Continued to improve departmental
efficiencies through technology advances such as establishing on-line
access with governmental agencies, certain vendors, and payroll benefit providers.
• Coordinated implementation of new
myCalPERS software system with the California Public Employee Retirement System.
• Administered billing and collection
component of the City’s police false alarm ordinance.
• Maintained a web link on the City’s
web page where specifications for formal Requests for Proposals can be downloaded.
• Worked with outside vendors to perform
operational cost analysis for citywide printing needs and fleet services to reduce operational costs.
• Assisted departments with computer purchase and configuration.
• Cleaned computer viruses and spyware
on infected computers • Consolidated more servers on the
storage area network (SAN) to reduce the number of physical servers.
• Replaced the computer network’s main
firewall. • Changed the Internet service provider to
Charter Communications and implemented the changeover.
• Tested and repaired old network cables. • Installed power-save power strips
throughout the city hall and fire stations. The Southern California Edison
112

provided and installed the strips free of charge.
• Coordinated with Public Works and LA County to implement the Traffic Controll System. The system is located in Public Works department.
• Conducted 24 full and part-time
recruitments in fiscal year 2012/13. • Completed negotiations and
implemented the provisions of the Memorandum of Understanding (MOU’s) for five miscellaneous bargaining units (Confidential, General, Maintenance & Crafts, Mid-Management, and Non-Sworn Public Safety).
• Continued to weigh organizational needs
and liabilities against the ever-changing insurance market while managing approximately 60 active liability claims, 133 workers’ compensation cases, and 50 new uninsured losses each year
• Successfully processed a variety of
employee and labor relations issues. • Updated various City Administrative
Policies, including the City’s Policy Against Discrimination, Harassment, and Retaliation in order to be in compliance with current law.
• Coordinated staff participation in the
Local Government Leadership Academy (LGLA) training program, organized by the College of Extended University at Cal Poly Pomona, to educate and develop supervisory and leadership skills.
• Coordinated staff participation in four
training workshops, conducted by
outside firms, on topics such as discipline, labor negotiations, leaves of absence, performance management, and other current legal employment issues.
• Coordinated recruitments resulting in 13
full-time and 43 part-time new hires, 58 full-time and six part-time promotions.
• Assisted approximately 18 full-time and
41 part-time employees who separated from City service.
• Completed the Air Quality Investment
Program Annual Report and citywide employee rideshare survey as required by the South Coast Air Quality Management District (SCAQMD).
• Continued to improve our processing of
employee benefit enrollments and changes by participating in an online process of managing employee medical dental, and vision insurance.
• Continued our efforts to enhance and
streamline our recruitment process by posting all open and competitive recruitments on web-based job sites.
• Continued to post all job
announcements, class specs, memorandums of understanding (MOU’s), and salary ranges on the City’s website to provide a cost savings on print advertising, and to present a more effective (green) way of providing public information.
FY 2013-2014 GOALS AND OBJECTIVES
• Develop, recommend, and implement
fiscal policies and procedures to guarantee the financial integrity and
113

solvency of the City and its related agencies.
o Continue to recommend budget
solutions to the City Council in response to ongoing fiscal challenges.
o Work closely with City departments to identify new revenue sources and methods to reduce costs.
o Re-evaluate the fees and charges for City-provided services to ensure the fees are reasonable and fully recover the cost of providing those services.
o Monitor all current revenue sources and perform audits of various revenues to ensure the City is receiving all the existing revenues to which it is entitled.
o Effectively manage the City’s cash and investment portfolio to maximize revenues while adhering to the primary goals of safety and liquidity of the City’s cash reserves.
o Continue financial responsibility for the Successor Agency of the West Covina Redevelopment Agency and Housing Successor Agency.
o Continue dialog and correspondence with the State Department of Finance and County Auditor Controller regarding the dissolution of the former redevelopment agency.
o Continue ongoing administration of the Oversight Board as needed.
o Coordinated the implementation of the Health Care Reform Affordable Care Act.
o Continue to work with outside vendors to investigate reducing operational costs by performing cost analyses.
o Continue to review all phone bills for accuracy and areas to streamline costs.
o needs.
o Review debt for refinancing and credit enhancement opportunities.
• Provide outstanding customer service to
City departments to assist them in performing their department operations. o Establish parameters for legal ads
with the City Attorney’s office, and educate City departments on minimum legal ad requirements that will result in decreasing the cost of legal ads.
o Continue to work with public works in developing purchasing guidelines for public works projects that comply with the Uniform Public Construction Cost Accounting procedures.
o Provide timely and accurate financial information to departments and policy decision makers to enable them to effectively monitor budgets and make informed decisions regarding financial matters.
o Coordinate customer support issues. o Assist department users with specific
questions related to the City’s financial software system to increase their ability to understand and utilize the system.
o Continue to work with senior administrative assistants to update the City directory.
• Ensure that all financial reporting meets
professional standards and that generally accepted accounting principles are adhered to.
o Prepare/submit a Comprehensive
Annual Financial Report to the Government Finance Officer’s Association award program which ensures the report is prepared to the highest industry standards and
114

demonstrates to external organizations that the City is committed to disclosing financial information in a professional and fiscally responsible manner.
o Provide assistance to external auditors in their task of confirming that the City’s accounting records are maintained in a fiscally responsible and professional manner, and that grant funds were spent in accordance with the governing regulations.
o Prepare and timely file the compensation report with the State Controller’s Office to ensure transparency of compensation for all employees and elected officials of the City.
• Streamline Police False Alarm billing and collection processes.
• Continue to develop a professional and
well-trained staff in order to provide the highest level of quality and cost-effective service.
• Upgrade Windows Server to the latest
version. • Upgrade Microsoft Office and Exchange
email to the latest version. • Install and configure the network
management and help desk tool.
• Install and manage the power-save software on desktop computers throughout the city hall and fire stations. Public Works department pays for the software with the grant.
• Participate in planning and building a smart-training room at fire station 4. This project is funded by the grant.
• Implement the SCE-paid power management system to reduce power consumption when computers are not in use.
• Reduce the use of paper Citywide and
decentralize the reprographic function. • Inspect businesses operating within the
city to ensure business license compliance and increase revenue.
• Continue online tracking of collections
activity for departments. • Expand the use of on-line business
license renewal payments. • Reduce City-wide telephone expenses by
continuing to review and seek lower costs for line and usage.
• Telecommunications coordinator will
cross-train with accounts payable so that all City phones and False Alarm billings continue in a timely fashion during any absences.
• Convert Police Internet to new provider
Charter, resulting in costs savings and better signal.
• Continue to meet the needs of the
organization by creatively managing recruitments.
• Integrate the operations of the human
resources and risk management functions.
• Complete negotiations and implement
the provisions of the Memorandums of Understanding (MOU’s) for the five miscellaneous bargaining units: Confidential, General, Maintenance & Crafts, Mid-Management, and Non-
115
Sworn Public Safety as well as the four safety bargaining units: Police Officers’ Association, Police Management Association, Firefighters’ Association, and Fire Management Association.
• Continue to assist departments with employee investigations, grievances, discipline, and Americans with Disability Act (ADA) issues.
• To protect public and employee safety. • To recommend changes to all
departments to remove City from any possible liability.
• To stay current in knowledge of
principles, practices, and methods of safety and loss prevention, also state and federal laws relating to health and safety, including CAL/OSHA.
• To continue with Safety Committee to
communicate safe work practices throughout the organization.
• To provide the City insurance coverage without interruption throughout the upcoming fiscal year.
• Coordinate the City’s sexual harassment training in compliance with AB 1825.
• Review current City policies, Personnel
Rules, as well as various forms and work with employee bargaining units to update as needed.
• Review insurance carriers to ensure cost
effective benefits being offered to employees.
• Complete the Air Quality Investment
Program Annual Report and citywide employee rideshare survey as required by the South Coast Air Quality Management District (SCAQMD).
• Implement NeoGov for applicant
tracking and processing of recruitments. • Continue to work with departments to
revise the recruitment process to meet their needs.
116
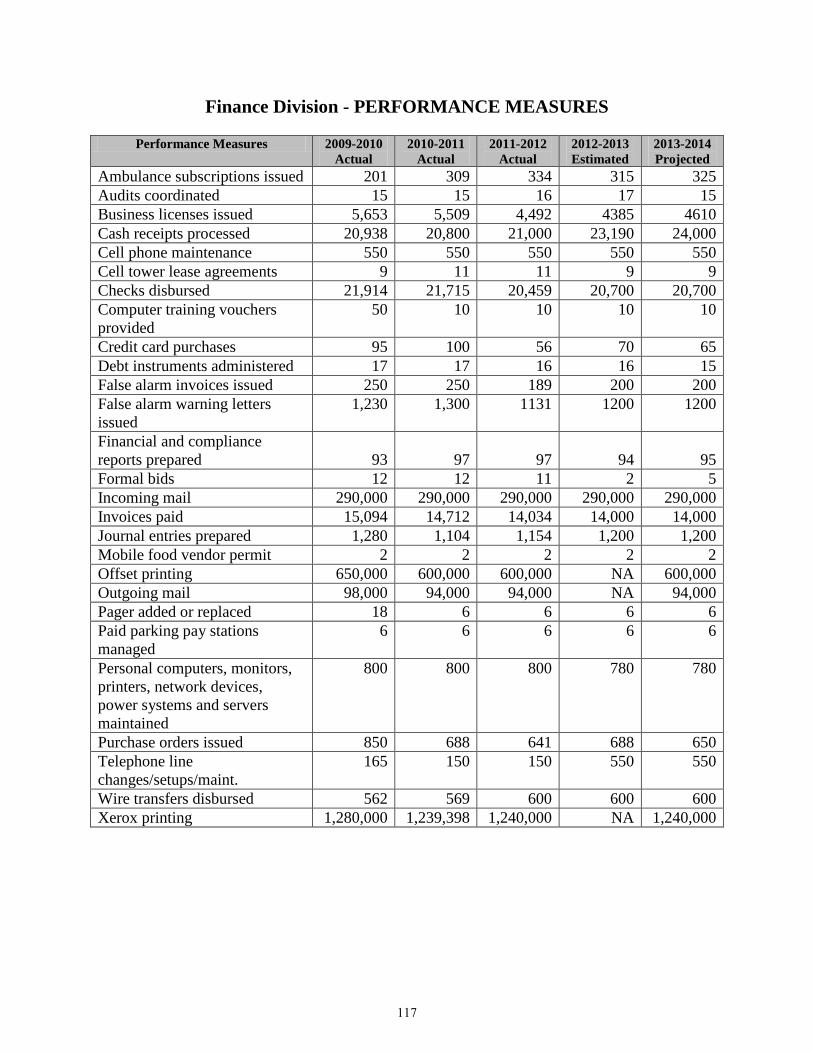
Finance Division - PERFORMANCE MEASURES
Performance Measures 2009-2010 Actual
2010-2011 Actual
2011-2012 Actual
2012-2013 Estimated
2013-2014 Projected
Ambulance subscriptions issued 201 309 334 315 325 Audits coordinated 15 15 16 17 15 Business licenses issued 5,653 5,509 4,492 4385 4610 Cash receipts processed 20,938 20,800 21,000 23,190 24,000 Cell phone maintenance 550 550 550 550 550 Cell tower lease agreements 9 11 11 9 9 Checks disbursed 21,914 21,715 20,459 20,700 20,700 Computer training vouchers provided
50 10 10 10 10
Credit card purchases 95 100 56 70 65 Debt instruments administered 17 17 16 16 15 False alarm invoices issued 250 250 189 200 200 False alarm warning letters issued
1,230 1,300 1131 1200 1200
Financial and compliance reports prepared
93
97
97
94
95
Formal bids 12 12 11 2 5 Incoming mail 290,000 290,000 290,000 290,000 290,000 Invoices paid 15,094 14,712 14,034 14,000 14,000 Journal entries prepared 1,280 1,104 1,154 1,200 1,200 Mobile food vendor permit 2 2 2 2 2 Offset printing 650,000 600,000 600,000 NA 600,000 Outgoing mail 98,000 94,000 94,000 NA 94,000 Pager added or replaced 18 6 6 6 6 Paid parking pay stations managed
6 6 6 6 6
Personal computers, monitors, printers, network devices, power systems and servers maintained
800 800 800 780 780
Purchase orders issued 850 688 641 688 650 Telephone line changes/setups/maint.
165 150 150 550 550
Wire transfers disbursed 562 569 600 600 600 Xerox printing 1,280,000 1,239,398 1,240,000 NA 1,240,000
117
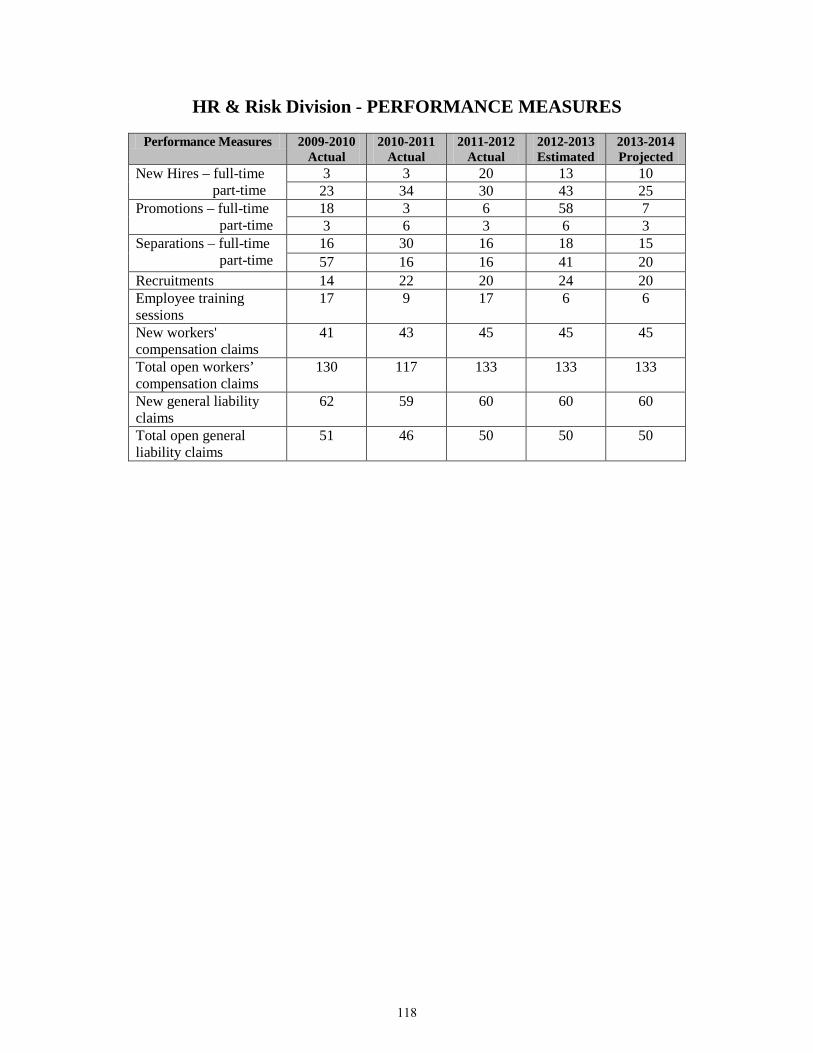
HR & Risk Division - PERFORMANCE MEASURES
Performance Measures 2009-2010 Actual
2010-2011 Actual
2011-2012 Actual
2012-2013 Estimated
2013-2014 Projected
New Hires – full-time part-time
3 3 20 13 10 23 34 30 43 25
Promotions – full-time part-time
18 3 6 58 7 3 6 3 6 3
Separations – full-time part-time
16 30 16 18 15 57 16 16 41 20
Recruitments 14 22 20 24 20 Employee training sessions
17 9 17 6 6
New workers' compensation claims
41 43 45 45 45
Total open workers’ compensation claims
130 117 133 133 133
New general liability claims
62 59 60 60 60
Total open general liability claims
51 46 50 50 50
118
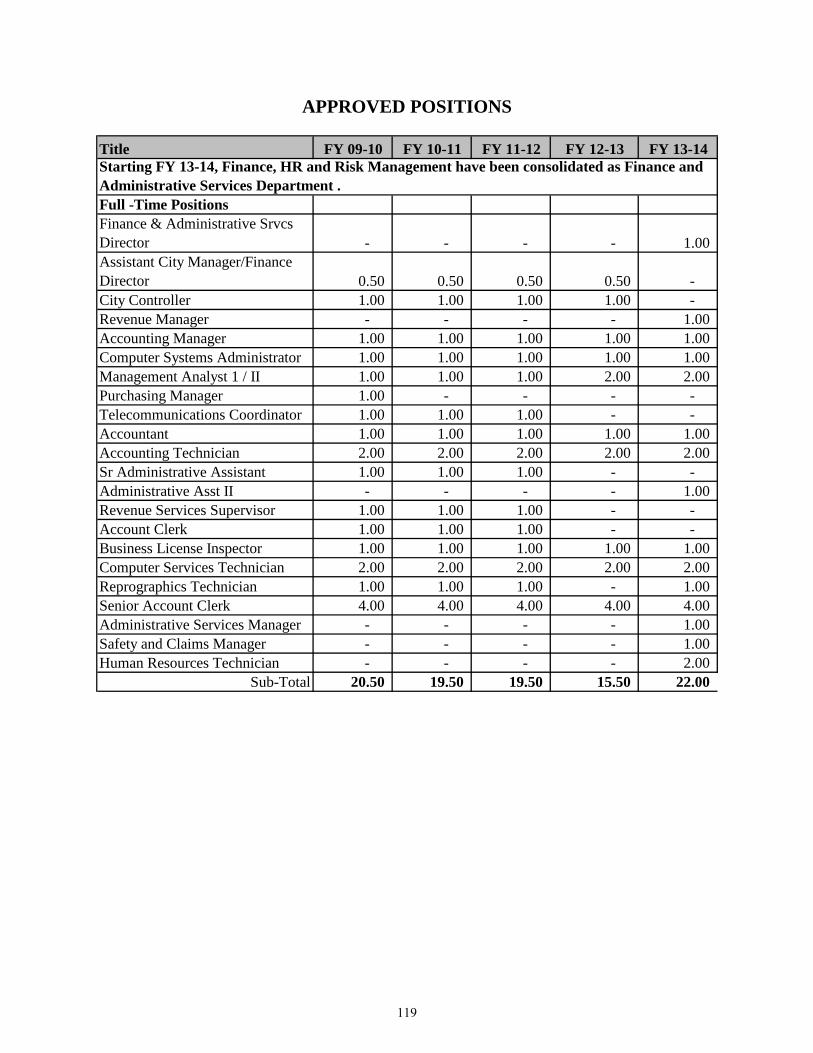
APPROVED POSITIONS
Title FY 09-10 FY 10-11 FY 11-12 FY 12-13 FY 13-14
Full -Time PositionsFinance & Administrative Srvcs Director - - - - 1.00 Assistant City Manager/Finance Director 0.50 0.50 0.50 0.50 - City Controller 1.00 1.00 1.00 1.00 - Revenue Manager - - - - 1.00 Accounting Manager 1.00 1.00 1.00 1.00 1.00 Computer Systems Administrator 1.00 1.00 1.00 1.00 1.00 Management Analyst 1 / II 1.00 1.00 1.00 2.00 2.00 Purchasing Manager 1.00 - - - - Telecommunications Coordinator 1.00 1.00 1.00 - - Accountant 1.00 1.00 1.00 1.00 1.00 Accounting Technician 2.00 2.00 2.00 2.00 2.00 Sr Administrative Assistant 1.00 1.00 1.00 - - Administrative Asst II - - - - 1.00 Revenue Services Supervisor 1.00 1.00 1.00 - - Account Clerk 1.00 1.00 1.00 - - Business License Inspector 1.00 1.00 1.00 1.00 1.00 Computer Services Technician 2.00 2.00 2.00 2.00 2.00 Reprographics Technician 1.00 1.00 1.00 - 1.00 Senior Account Clerk 4.00 4.00 4.00 4.00 4.00 Administrative Services Manager - - - - 1.00 Safety and Claims Manager - - - - 1.00 Human Resources Technician - - - - 2.00
Sub-Total 20.50 19.50 19.50 15.50 22.00
Starting FY 13-14, Finance, HR and Risk Management have been consolidated as Finance and Administrative Services Department .
119
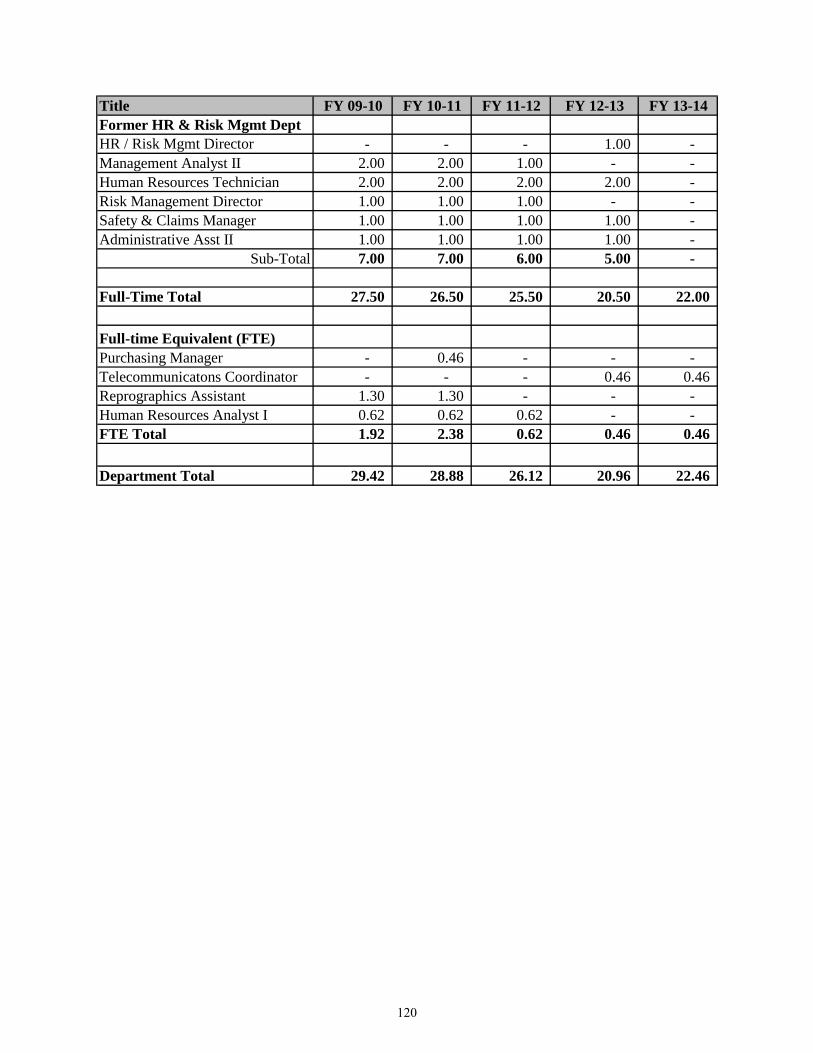
Title FY 09-10 FY 10-11 FY 11-12 FY 12-13 FY 13-14Former HR & Risk Mgmt DeptHR / Risk Mgmt Director - - - 1.00 - Management Analyst II 2.00 2.00 1.00 - - Human Resources Technician 2.00 2.00 2.00 2.00 - Risk Management Director 1.00 1.00 1.00 - - Safety & Claims Manager 1.00 1.00 1.00 1.00 - Administrative Asst II 1.00 1.00 1.00 1.00 -
Sub-Total 7.00 7.00 6.00 5.00 -
Full-Time Total 27.50 26.50 25.50 20.50 22.00
Full-time Equivalent (FTE)Purchasing Manager - 0.46 - - - Telecommunicatons Coordinator - - - 0.46 0.46 Reprographics Assistant 1.30 1.30 - - - Human Resources Analyst I 0.62 0.62 0.62 - - FTE Total 1.92 2.38 0.62 0.46 0.46
Department Total 29.42 28.88 26.12 20.96 22.46
120
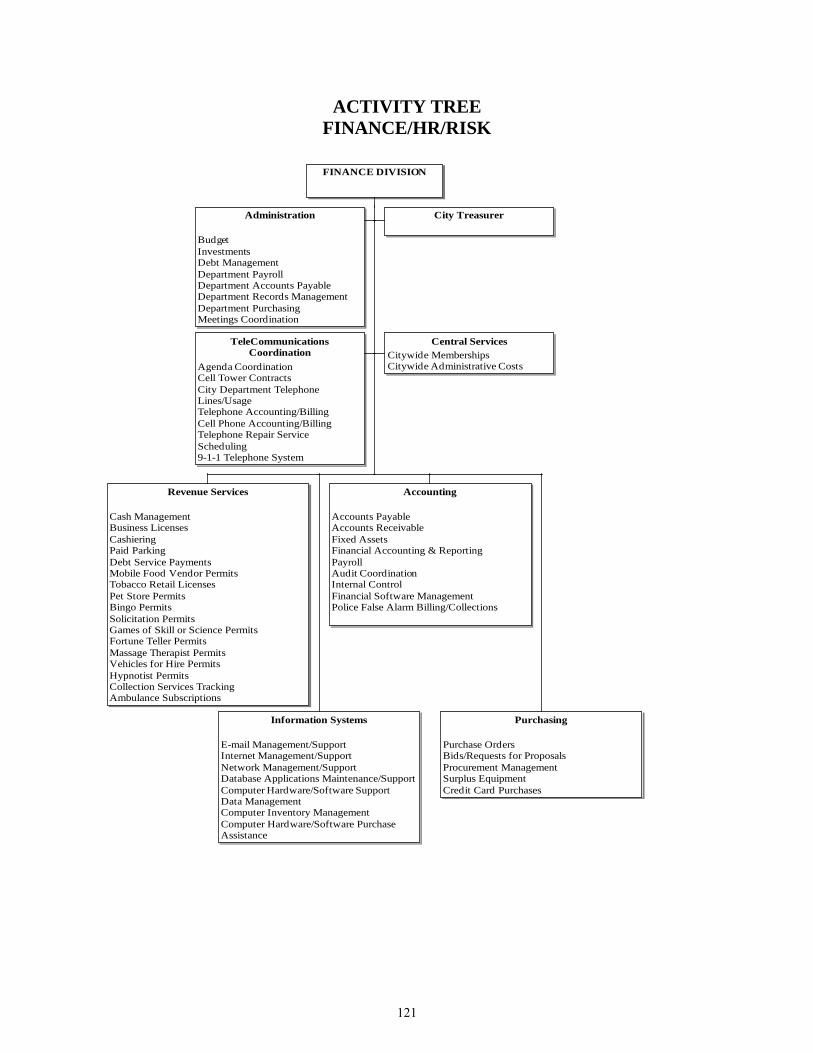
ACTIVITY TREE FINANCE/HR/RISK
FINANCE DIVISION
Administration
BudgetInvestmentsDebt ManagementDepartment PayrollDepartment Accounts PayableDepartment Records ManagementDepartment PurchasingMeetings Coordination
City Treasurer
TeleCommunications Coordination
Agenda CoordinationCell Tower ContractsCity Department Telephone Lines/UsageTelephone Accounting/BillingCell Phone Accounting/BillingTelephone Repair Service Scheduling9-1-1 Telephone System
Central ServicesCitywide MembershipsCitywide Administrative Costs
Revenue Services
Cash ManagementBusiness LicensesCashieringPaid ParkingDebt Service PaymentsMobile Food Vendor PermitsTobacco Retail LicensesPet Store PermitsBingo PermitsSolicitation PermitsGames of Skill or Science PermitsFortune Teller PermitsMassage Therapist PermitsVehicles for Hire PermitsHypnotist PermitsCollection Services TrackingAmbulance Subscriptions
Information Systems
E-mail Management/SupportInternet Management/SupportNetwork Management/SupportDatabase Applications Maintenance/SupportComputer Hardware/Software SupportData ManagementComputer Inventory ManagementComputer Hardware/Software Purchase Assistance
Accounting
Accounts PayableAccounts ReceivableFixed AssetsFinancial Accounting & ReportingPayrollAudit CoordinationInternal ControlFinancial Software ManagementPolice False Alarm Billing/Collections
Purchasing
Purchase OrdersBids/Requests for ProposalsProcurement ManagementSurplus EquipmentCredit Card Purchases
121
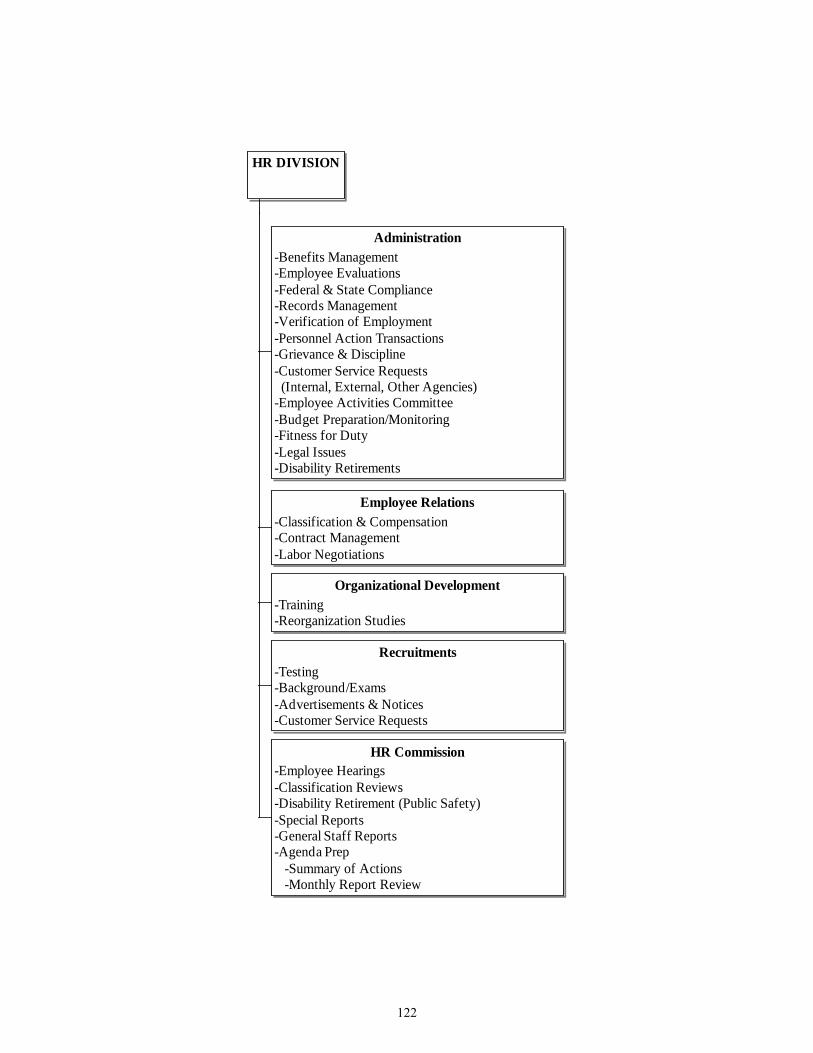
HR DIVISION
Administration-Benefits Management-Employee Evaluations-Federal & State Compliance-Records Management-Verification of Employment-Personnel Action Transactions-Grievance & Discipline-Customer Service Requests (Internal, External, Other Agencies)-Employee Activities Committee-Budget Preparation/Monitoring-Fitness for Duty-Legal Issues-Disability Retirements
Employee Relations-Classification & Compensation-Contract Management-Labor Negotiations
Organizational Development-Training-Reorganization Studies
Recruitments-Testing-Background/Exams-Advertisements & Notices-Customer Service Requests
HR Commission-Employee Hearings-Classification Reviews-Disability Retirement (Public Safety)-Special Reports-General Staff Reports-Agenda Prep -Summary of Actions -Monthly Report Review
122
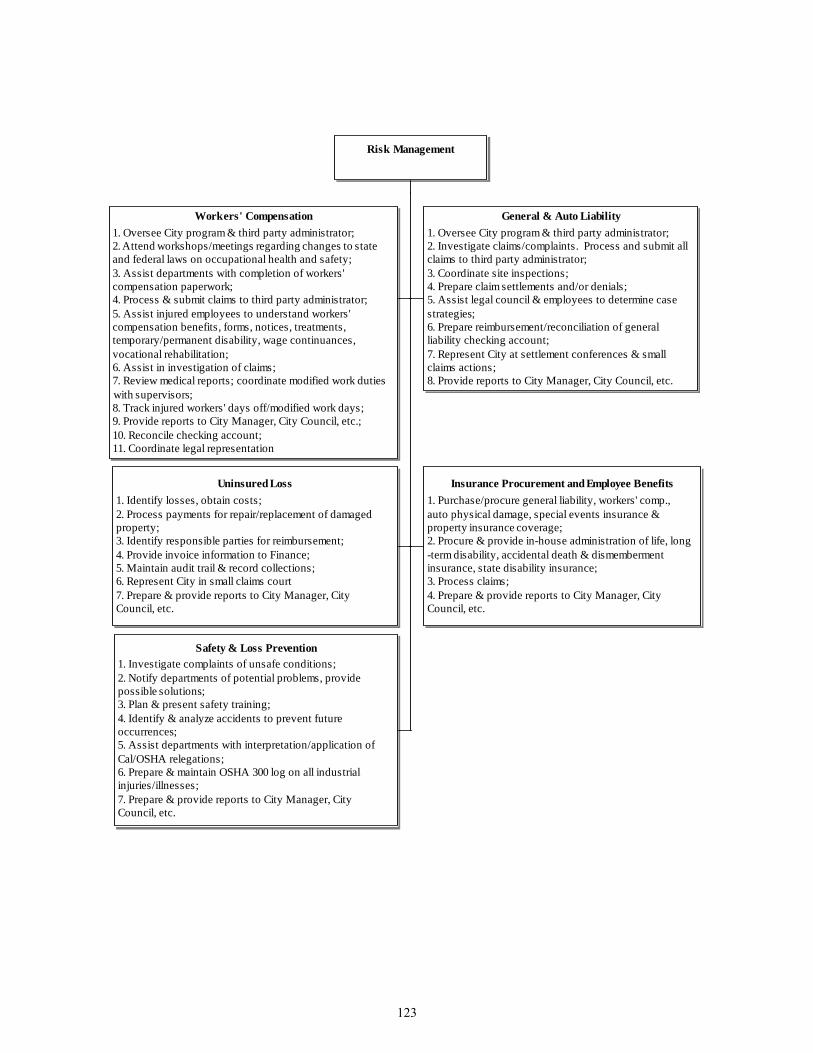
Risk Management
Workers' Compensation1. Oversee City program & third party administrator;2. Attend workshops/meetings regarding changes to state and federal laws on occupational health and safety;3. Assist departments with completion of workers' compensation paperwork;4. Process & submit claims to third party administrator;5. Assist injured employees to understand workers' compensation benefits, forms, notices, treatments, temporary/permanent disability, wage continuances, vocational rehabilitation;6. Assist in investigation of claims;7. Review medical reports; coordinate modified work duties with supervisors;8. Track injured workers' days off/modified work days;9. Provide reports to City Manager, City Council, etc.;10. Reconcile checking account;11. Coordinate legal representation
General & Auto Liability1. Oversee City program & third party administrator;2. Investigate claims/complaints. Process and submit all claims to third party administrator;3. Coordinate site inspections;4. Prepare claim settlements and/or denials;5. Assist legal council & employees to determine case strategies;6. Prepare reimbursement/reconciliation of general liability checking account;7. Represent City at settlement conferences & small claims actions;8. Provide reports to City Manager, City Council, etc.
Uninsured Loss1. Identify losses, obtain costs;2. Process payments for repair/replacement of damaged property;3. Identify responsible parties for reimbursement;4. Provide invoice information to Finance;5. Maintain audit trail & record collections;6. Represent City in small claims court7. Prepare & provide reports to City Manager, City Council, etc.
Insurance Procurement and Employee Benefits1. Purchase/procure general liability, workers' comp., auto physical damage, special events insurance & property insurance coverage;2. Procure & provide in-house administration of life, long-term disability, accidental death & dismemberment insurance, state disability insurance;3. Process claims;4. Prepare & provide reports to City Manager, City Council, etc.
Safety & Loss Prevention1. Investigate complaints of unsafe conditions;2. Notify departments of potential problems, provide possible solutions;3. Plan & present safety training;4. Identify & analyze accidents to prevent future occurrences;5. Assist departments with interpretation/application of Cal/OSHA relegations;6. Prepare & maintain OSHA 300 log on all industrial injuries/illnesses;7. Prepare & provide reports to City Manager, City Council, etc.
123
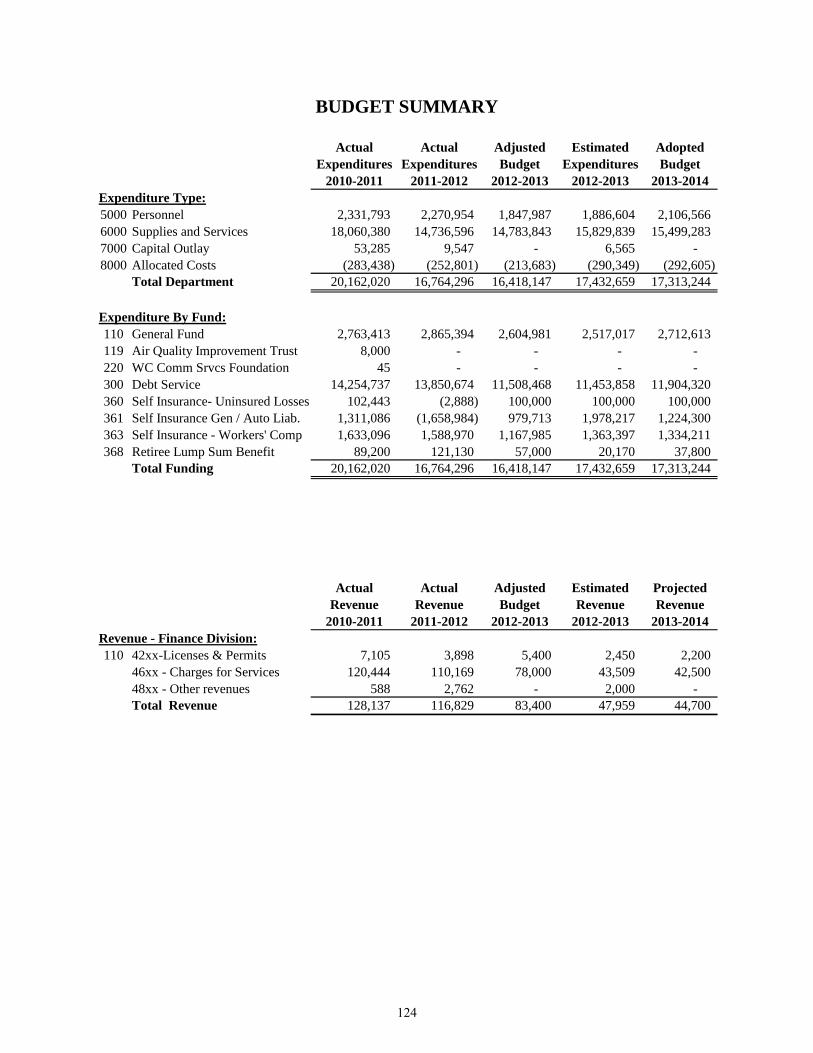
BUDGET SUMMARY
Actual Actual Adjusted Estimated AdoptedExpenditures Expenditures Budget Expenditures Budget
2010-2011 2011-2012 2012-2013 2012-2013 2013-2014Expenditure Type:5000 Personnel 2,331,793 2,270,954 1,847,987 1,886,604 2,106,566 6000 Supplies and Services 18,060,380 14,736,596 14,783,843 15,829,839 15,499,283 7000 Capital Outlay 53,285 9,547 - 6,565 - 8000 Allocated Costs (283,438) (252,801) (213,683) (290,349) (292,605)
Total Department 20,162,020 16,764,296 16,418,147 17,432,659 17,313,244
Expenditure By Fund:110 General Fund 2,763,413 2,865,394 2,604,981 2,517,017 2,712,613 119 Air Quality Improvement Trust 8,000 - - - - 220 WC Comm Srvcs Foundation 45 - - - - 300 Debt Service 14,254,737 13,850,674 11,508,468 11,453,858 11,904,320 360 Self Insurance- Uninsured Losses 102,443 (2,888) 100,000 100,000 100,000 361 Self Insurance Gen / Auto Liab. 1,311,086 (1,658,984) 979,713 1,978,217 1,224,300 363 Self Insurance - Workers' Comp 1,633,096 1,588,970 1,167,985 1,363,397 1,334,211 368 Retiree Lump Sum Benefit 89,200 121,130 57,000 20,170 37,800
Total Funding 20,162,020 16,764,296 16,418,147 17,432,659 17,313,244
Actual Actual Adjusted Estimated ProjectedRevenue Revenue Budget Revenue Revenue
2010-2011 2011-2012 2012-2013 2012-2013 2013-2014Revenue - Finance Division:110 42xx-Licenses & Permits 7,105 3,898 5,400 2,450 2,200
46xx - Charges for Services 120,444 110,169 78,000 43,509 42,500 48xx - Other revenues 588 2,762 - 2,000 - Total Revenue 128,137 116,829 83,400 47,959 44,700
124
PLANNING DEPARTMENT MISSION STATEMENT: To make West Covina a positive, interesting, and enjoyable place in which to live and work by stressing the maintenance and development of stable neighborhoods and a strong business community, while providing professional customer service to residents and business operators
his department administers the long-range planning projects, such as the Housing Element update as well as
the processing of land development applications. Its central focus is to implement the General Plan and other adopted City Council policies through the review of the various development applications. The current planning function is implemented through the application of the City’s zoning code. All zoning and land use permit approvals in the City require an environmental clearance under the City’s Environmental Review Guidelines and under the California Environmental Quality Act (CEQA).
Planning for the future of the City of West Covina involves the coordination of different agencies. One of these activities is congestion management to assure compliance with applicable regional, state, and federal transportation, and air quality mandates. The planning department’s staff also coordinates with other City departments
to ensure that all activities support economic development.
This department provides professional assistance to the Planning Commission and City Council in decision-making efforts involving physical development in the City. The department strives to improve the City’s environment for all segments of the community, both residential and commercial, by adherence to the principles of good design, and applicable codes and regulations.
The department is currently staffed by five full-time positions and maintains liaisons with other cities and planning agencies to address problems of mutual concern consistent with reasonable and sound planning practices.
The department administers the Art in Public Places program as well as the preservation program for historic resources.
T
125
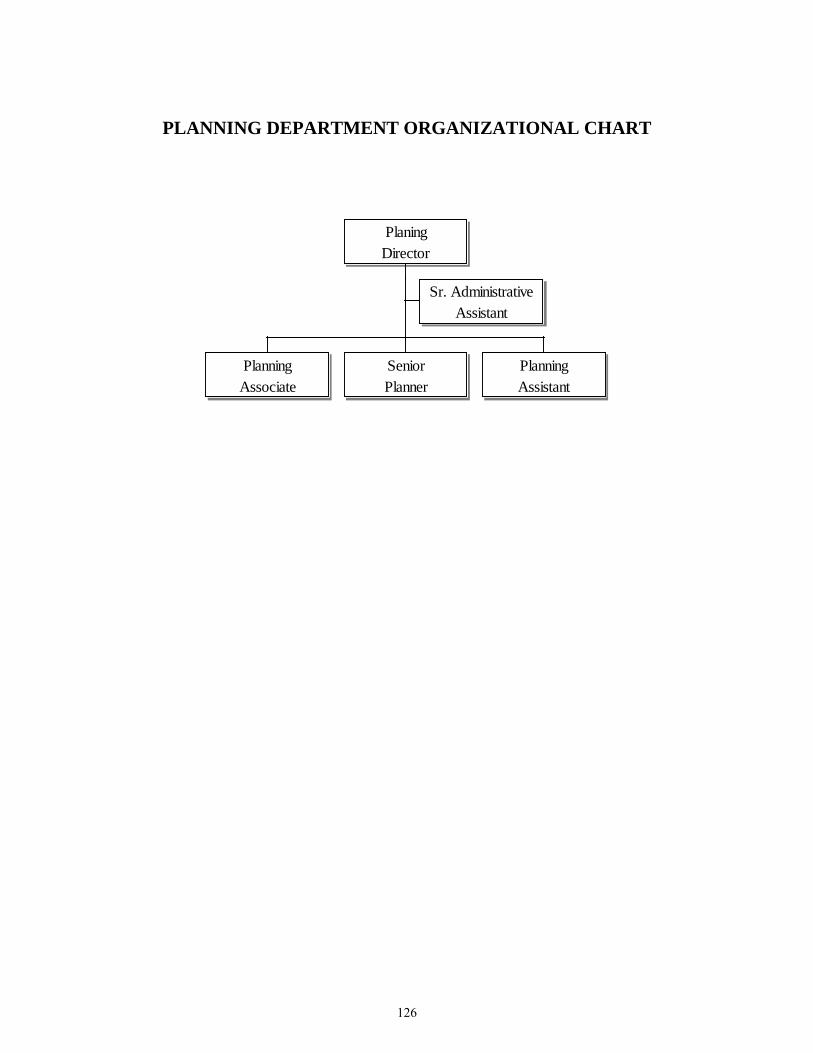
PLANNING DEPARTMENT ORGANIZATIONAL CHART
PlaningDirector
Sr. AdministrativeAssistant
PlanningAssociate
SeniorPlanner
PlanningAssistant
126

FY 2012-2013 ACCOMPLISHMENTS
• Prepared and processed 12 municipal
code amendments, General Plan amendments and zone changes.
• Processed 37 development applications
through the Planning Commission, including conditional use permits, planned community developments, precise plans, variances, tentative tract and parcel maps, and art in public places applications.
• Processed 250 administrative
applications, including temporary use permits, special event permits, administrative modifications, planning director’s modifications, slight modifications, and film permits.
• Completed 164 building, grading, and
landscape plan checks. • Completed 160 counter reviews for
improvements such as patio covers, air conditioners, swimming pools, and small room additions.
• Completed review of 205 business
license applications. • Processed 44 single-family house
improvements for review by the Planning Commission Subcommittee for Design Review.
• Completed processing and approval of
residential and commercial development projects. Residential projects included a 19-unit single family development at 512 S. Valinda Avenue (portion of Immanuel First Lutheran Church) and a 135-unit multi-family residential at 1611, 1623, and 1733 W. San
Bernardino Rd. Major commercial development projects processed include a 45,000-square foot LA Fitness at Restaurant Row on E. Garvey Avenue North, a McDonalds and El Pollo Loco at 501 S. Vincent Avenue, a remodel of North-West College at 2121 W. Garvey Avenue North, the remodel and addition for a 24,000-square foot shopping center at Valley Boulevard and Nogales Street, and the conversion of a warehouse/office building to a medical office building at 131 N. Lang Avenue.
• Code amendments processed include
establishing standards revisions to the standards for freestanding pylon signs, the creation of a mixed use overlay zone, the creation of standards for emergency shelters, the creation of standards for efficiency units, and the revision of standards for automobile sales.
• Completion of the General Plan Housing
Element update for planning period of 2008 through 2014.
• Processing of the General Plan Housing
Element update for planning period of 2014 through 2021.
FY 2013-2014
GOALS AND OBJECTIVES • Provide excellent customer service.
o Respond to all questions and inquiries in a polite, courteous manner.
o Provide options to allow applicants to achieve their needs.
• Address applications to provide a
business friendly environment.
127
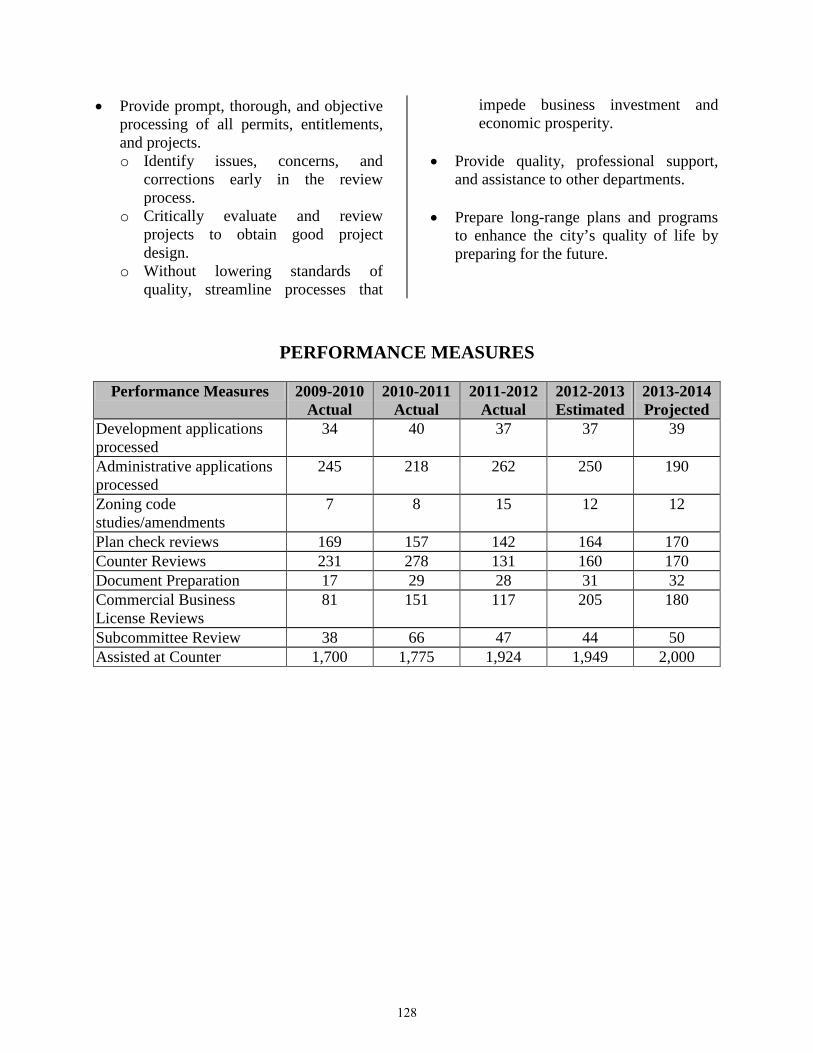
• Provide prompt, thorough, and objective processing of all permits, entitlements, and projects. o Identify issues, concerns, and
corrections early in the review process.
o Critically evaluate and review projects to obtain good project design.
o Without lowering standards of quality, streamline processes that
impede business investment and economic prosperity.
• Provide quality, professional support,
and assistance to other departments. • Prepare long-range plans and programs
to enhance the city’s quality of life by preparing for the future.
PERFORMANCE MEASURES
Performance Measures 2009-2010 Actual
2010-2011 Actual
2011-2012 Actual
2012-2013 Estimated
2013-2014 Projected
Development applications processed
34 40 37 37 39
Administrative applications processed
245 218 262 250 190
Zoning code studies/amendments
7 8 15 12 12
Plan check reviews 169 157 142 164 170 Counter Reviews 231 278 131 160 170 Document Preparation 17 29 28 31 32 Commercial Business License Reviews
81 151 117 205 180
Subcommittee Review 38 66 47 44 50 Assisted at Counter 1,700 1,775 1,924 1,949 2,000
128
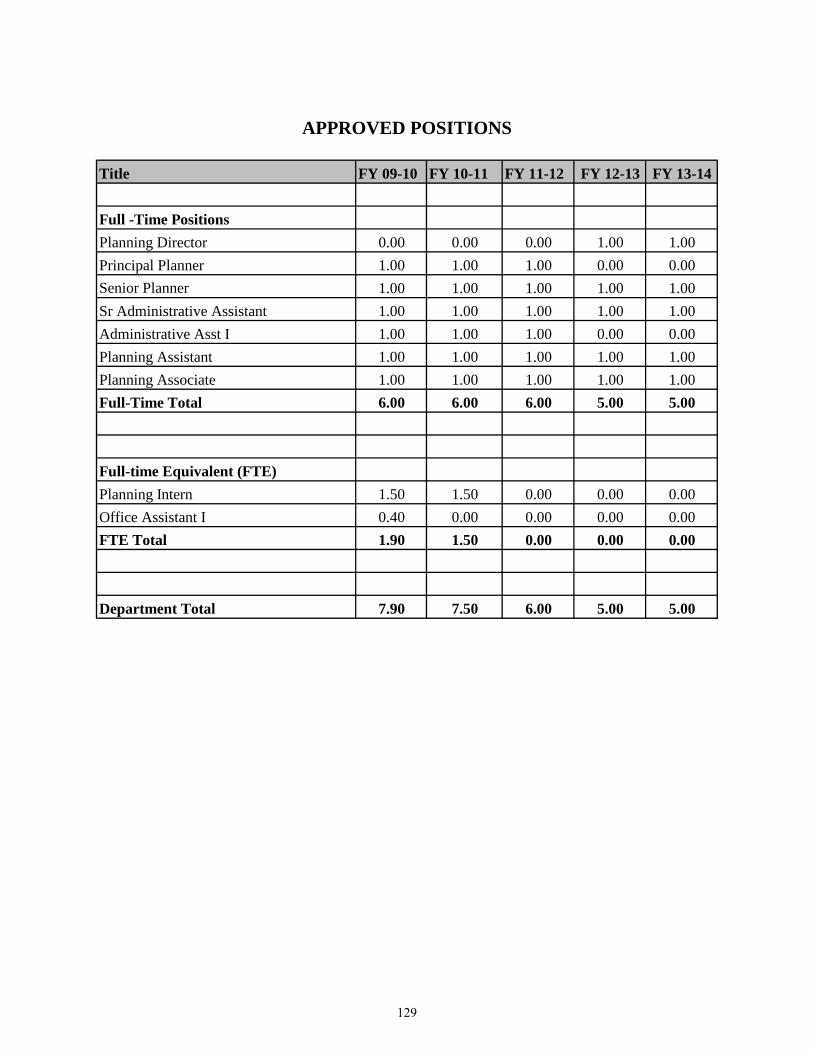
APPROVED POSITIONS
Title FY 09-10 FY 10-11 FY 11-12 FY 12-13 FY 13-14
Full -Time PositionsPlanning Director 0.00 0.00 0.00 1.00 1.00Principal Planner 1.00 1.00 1.00 0.00 0.00Senior Planner 1.00 1.00 1.00 1.00 1.00Sr Administrative Assistant 1.00 1.00 1.00 1.00 1.00Administrative Asst I 1.00 1.00 1.00 0.00 0.00Planning Assistant 1.00 1.00 1.00 1.00 1.00Planning Associate 1.00 1.00 1.00 1.00 1.00Full-Time Total 6.00 6.00 6.00 5.00 5.00
Full-time Equivalent (FTE)Planning Intern 1.50 1.50 0.00 0.00 0.00Office Assistant I 0.40 0.00 0.00 0.00 0.00FTE Total 1.90 1.50 0.00 0.00 0.00
Department Total 7.90 7.50 6.00 5.00 5.00
129

BUDGET ISSUES The State of California requires that the City update the Housing Element of the General Plan to ensure that West Covina provides for additional population growth. The state is requiring that the Housing Element Update be completed for the period from 2014 to 2021. The cost of the Housing Element update is estimated at $30,000. The state does not mandate how often the General Plan must be updated, however, it does require that a General Plan be updated periodically so that it remains a true reflection of a community’s values and goals. Since adoption of the General Plan in 1985, there has been no comprehensive assessment of the goals, policies, and
programs in the General Plan except for those in the Housing Element. The General Plan provides a long-term vision for development for the City considering potential development for the next 20 years. The cost of the preparation of a comprehensive General Plan by an outside consultant is estimated to be $250,000 to $500,000. In terms of facilities, the department is in need of maintenance. The ceiling tiles and window blinds need replacing, with a given priority to the areas that are visible to the public. The public counter needs refinishing with a new formica cover. In the kitchen area of the department, the kitchen cabinets need refinishing along with a new top counter and sink.
ACTIVITY TREE
PlanningDepartment
CurrentPlanning
Development ProjectsEnvironmental ReviewTransportations PlanningRedevelopment ProjectsHistoric ResourcesArt in Public Places
AdvancePlanning
Code AmendmentsZone ChangesGeneral Plan AmendmentsHousing/Master Plan Studies
ConstructionSupport Services
Plan CheckInspectionsCode Enforcement Support
CustomerService
Public InformationBusiness License Review
130
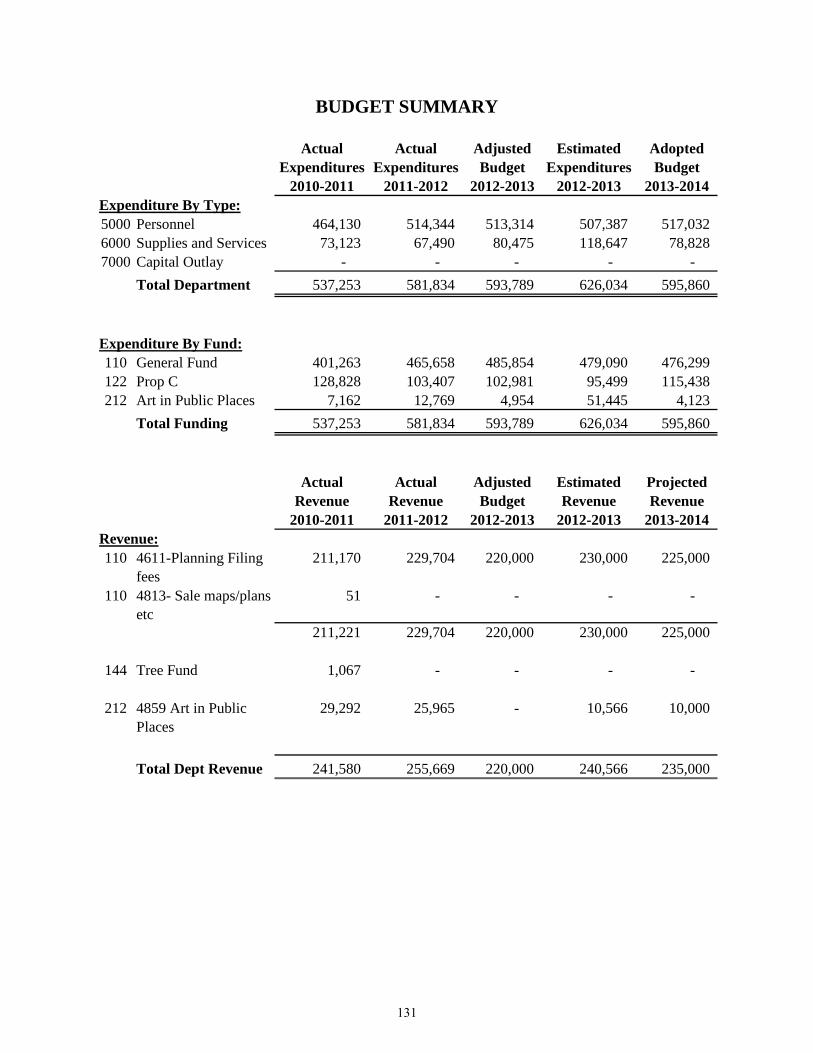
BUDGET SUMMARY
Actual Actual Adjusted Estimated AdoptedExpenditures Expenditures Budget Expenditures Budget
2010-2011 2011-2012 2012-2013 2012-2013 2013-2014Expenditure By Type:5000 Personnel 464,130 514,344 513,314 507,387 517,032 6000 Supplies and Services 73,123 67,490 80,475 118,647 78,828 7000 Capital Outlay - - - - -
Total Department 537,253 581,834 593,789 626,034 595,860
Expenditure By Fund:110 General Fund 401,263 465,658 485,854 479,090 476,299 122 Prop C 128,828 103,407 102,981 95,499 115,438 212 Art in Public Places 7,162 12,769 4,954 51,445 4,123
Total Funding 537,253 581,834 593,789 626,034 595,860
Actual Actual Adjusted Estimated ProjectedRevenue Revenue Budget Revenue Revenue
2010-2011 2011-2012 2012-2013 2012-2013 2013-2014Revenue:110 4611-Planning Filing
fees211,170 229,704 220,000 230,000 225,000
110 4813- Sale maps/plans etc
51 - - - -
211,221 229,704 220,000 230,000 225,000
144 Tree Fund 1,067 - - - -
212 4859 Art in Public Places
29,292 25,965 - 10,566 10,000
Total Dept Revenue 241,580 255,669 220,000 240,566 235,000
131

Page Intentionally Left Blank
132

POLICE DEPARTMENT MISSION STATEMENT: To provide the highest level of service and protection to the community and to cooperatively enhance public safety as the department progresses into the future
he police department has a proud history of integrity and service. The police department has an authorized
2013-2014 full-time workforce of 90 sworn officers and 68 civilians, including 17 dispatchers. Several authorized civilian positions had their funding suspended last year. There are also 55 part-time positions including reserve officers, crossing guards, and other support staff. The department also utilizes volunteer programs, which are a very important part of the overall public safety effort.
Although focused on front-line law enforcement, the department is also engaged in important community partnerships with schools, businesses, and citizen organizations. The department has garnered outside awards honoring many sworn officers, our SHOP senior volunteer program, our domestic violence victim advocate, and our overall excellence in community policing.
The men and women of the department strive to provide the highest level of service, focusing on our four core values of community responsiveness, integrity, teamwork, and effort. To that end, the department is divided into the following divisions:
Patrol Division
About two-thirds of all sworn officers work in this division, which focuses on patrolling city streets, answering calls for service, and identifying potential crime problems. In addition to patrol officers, this division includes reserve officers, and award-winning Seniors Helping Our Police (SHOP) volunteers who perform non-hazardous duties to free up sworn officers. Under the Community Service Area Policing program, four dedicated lieutenants and their crews are assigned a specific quadrant of the city and tasked with resolving public safety concerns for residents, neighborhoods, and businesses. This division also incorporates several subdivisions:
• Traffic Unit – This unit providesenforcement of traffic laws, targetedenforcement at schools and other sites,parking enforcement, crossing guardservices, and traffic investigations.
• Communications – Formerly a separateCity department, the police and fireemergency dispatch unit was absorbedinto the police department in fiscal year2008-09, and handles all emergencydispatch operations.
• Jail Operations - This unit processes allarrests, oversees all prisoners, andcoordinates all jail operations.
T
133
• Simulator & Hands-on Driving Program - This provides West Covina police officers (and outside agency clients) with cost-efficient Driving and Use-of-Force training.
Investigative & Administrative Division In fiscal year 2010-2011, two divisions were combined into one. This division is responsible for providing investigation and follow-up services associated with all major crimes and, as well overseeing the centralized administrative functions of the police department. Investigations and Support Services: For almost any crime victim to obtain justice in our courts (i.e., for a suspect to be convicted), the detectives have to conduct intensive follow-up and prepare cases for the district attorney. Certain officers are involved in specialized interagency task forces, and the department’s award-winning domestic violence victim advocate is assigned here. Investigations incorporates a subdivision:
• Special Enforcement Team (SET) - This team works irregular schedules dictated by the demands of their specialized investigations, which include narcotics, surveillance, interagency intelligence, and other targeted enforcement.
Administration: Focusing on the centralized administrative functions of the police department, Administration includes the Records department, the Professional Standards and Training (PS&T) section, and the Property and Evidence unit. Administration incorporates one subdivision: • West Covina Service Group (WCSG) -
This group supplies Computer Aided Dispatch and Records Management System (CAD/RMS) service to West Covina and client agencies, as a revenue generating enterprise.
134
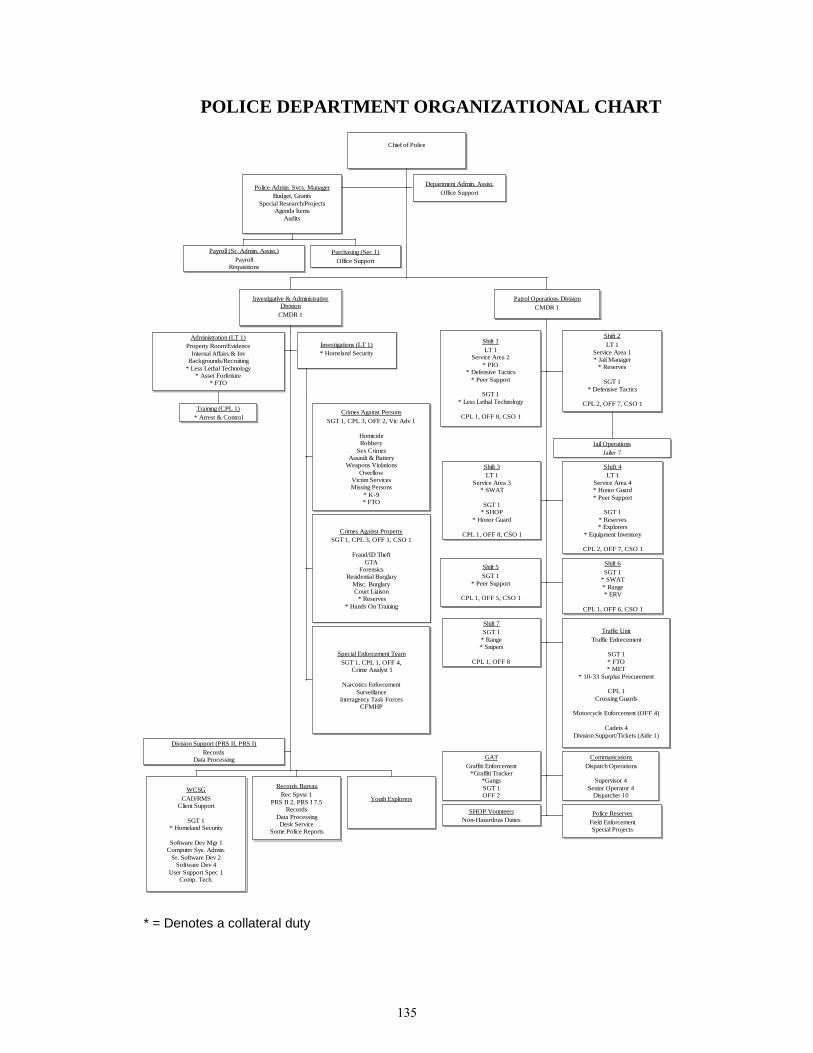
POLICE DEPARTMENT ORGANIZATIONAL CHART
* = Denotes a collateral duty
Chief of Police
Police Admin. Svcs. ManagerBudget, Grants
Special Research/ProjectsAgenda Items
Audits
Payroll (Sr. Admin. Assist.)Payroll
Requisitions
Purchasing (Sec 1)Office Support
Department Admin. Assist.Office Support
Investigative & Administrative Division
CMDR 1
Administration (LT 1)Property Room/Evidence
Internal Affairs & InvBackgrounds/Recruiting
* Less Lethal Technology* Asset Forfeiture
* FTO
Training (CPL 1)* Arrest & Control
Investigations (LT 1)* Homeland Security
Crimes Against PersonsSGT 1, CPL 3, OFF 2, Vic Adv 1
HomicideRobbery
Sex CrimesAssault & Battery
Weapons ViolationsOverflow
Victim ServicesMissing Persons
* K-9* FTO
Crimes Against PropertySGT 1, CPL 3, OFF 1, CSO 1
Fraud/ID TheftGTA
ForensicsResidential Burglary
Misc. BurglaryCourt Liaison * Reserves
* Hands On Training
Special Enforcement TeamSGT 1, CPL 1, OFF 4,
Crime Analyst 1
Narcotics EnforcementSurveillance
Interagency Task ForcesCFMHP
Division Support (PRS II, PRS I)Records
Data Processing
WCSGCAD/RMS
Client Support
SGT 1* Homeland Security
Software Dev Mgr 1Computer Sys. Admin.
Sr. Software Dev 2Software Dev 4
User Support Spec 1Comp. Tech.
Records BureauRec Spvsr 1
PRS II 2, PRS I 7.5Records
Data ProcessingDesk Service
Some Police Reports
Youth Explorers
Patrol Operations DivisionCMDR 1
Shift 1LT 1
Service Area 2* PIO
* Defensive Tactics* Peer Support
SGT 1* Less Lethal Technology
CPL 1, OFF 8, CSO 1
Shift 2LT 1
Service Area 1* Jail Manager
* Reserves
SGT 1* Defensive Tactics
CPL 2, OFF 7, CSO 1
Jail OperationsJailer 7
Shift 3LT 1
Service Area 3 * SWAT
SGT 1* SHOP
* Honor Guard
CPL 1, OFF 8, CSO 1
Shift 4LT 1
Service Area 4* Honor Guard* Peer Support
SGT 1* Reserves* Explorers
* Equipment Inventory
CPL 2, OFF 7, CSO 1
Shift 5SGT 1
* Peer Support
CPL 1, OFF 5, CSO 1
Shift 6SGT 1
* SWAT* Range* ERV
CPL 1, OFF 6, CSO 1
Shift 7SGT 1
* Range* Snipers
CPL 1, OFF 8
Traffic UnitTraffic Enforcement
SGT 1* FTO* MET
* 10-33 Surplus Procurement
CPL 1Crossing Guards
Motorcycle Enforcement (OFF 4)
Cadets 4Division Support/Tickets (Aide 1)
GATGraffiti Enforcement
*Graffiti Tracker*GangsSGT 1OFF 2
CommunicationsDispatch Operations
Supervisor 4Senior Operator 4
Dispatcher 10
SHOP VounteersNon-Hazardous Duties
Police ReservesField EnforcementSpecial Projects
135
FY 2012-2013 ACCOMPLISHMENTS
• Continued to focus on front-line law
enforcement and crime prevention activities to improve public safety. Last year, crime in West Covina was down to a 19-year low. This year, while property crime has shown a slight increase, violent crime has been further reduced.
• West Covina police officers work
extraordinarily efficiently and effectively. They actively respond to over 200 calls a day, ranking among the busiest in Los Angeles County. The department’s per capita cost of providing police services is among the lowest in Los Angeles County.
• West Covina police officers also tailored
operations to meet the needs of the city. With reduced staffing, the department continued special enforcement targeting graffiti. One dedicated graffiti Officer continued to utilize specialized tools including tracking software and enforcement items, our local graffiti administrative citation to swiftly penalize offenders, and our successful community based graffiti rewards program. The City received court ordered graffiti restitution funds totaling $12,610.
• Police personnel continued to focus on
assertive law enforcement. Police officers implemented special patrol deployments at key shopping locations during holidays. Traffic officers participated in regional grant-funded operations throughout the year.
• The community enjoyed improved ability to connect to the police
department. The department offered graffiti reporting, access to traffic accident reports, as well as the ability to dispute parking, noise, and graffiti citations—all online. These expanded services saved both residents and staff valuable time. Additionally, the West Covina Police Department was the first agency in Los Angeles County to offer a direct cell phone text messaging service (by texting TIPWCPD and your tip to TIP411).
• The Special Enforcement Team seized
an estimated $58,000,000 worth of illegal narcotics. During FY 2012-2013, the SET team brought in about over $1,700,000 in asset forfeiture revenue and interagency reimbursements, which helped fund department needs such as vehicles and technology projects.
• The West Covina Service Group
provided comprehensive Dispatch and Records services to about two dozen agencies, and generated $1.9 million in revenue for operational costs and development.
• The department’s award-winning SHOP
program, which has saved the City about $million date, continued to keep costs down by channeling the efforts of dedicated senior volunteers to perform non-hazardous public safety duties that would otherwise burden field officers. The department’s award winning Victim Advocate continued to assist victims and their families. The department also continued its excellent record of obtaining grants, funding items including vehicles, supplemental overtime to address community concerns, vehicles, financial crimes training, tactical and surveillance gear,
136
graffiti analysis software, youth explorer items, weapons components, and a range of frontline police equipment.
FY 2013-2014
GOALS AND OBJECTIVES The department’s operational goals and the specific objectives they encompass are all geared toward the City Council’s goal of maintaining public safety. • Work to reduce crime by a percentage
greater than the state and regional average for similar sized communities o Focus on front-line police programs
and required skills/training o Avoid fads and trendy programs
unless their crime reduction or public safety value, along with cost effectiveness, has been clearly demonstrated
• Continue to focus on the core mission of
providing front-line law enforcement services to the community, adapting to reductions in local and state funding o Utilize part-time and volunteer
positions to aid officers and civilian personnel
o Continue specialized graffiti enforcement in light of reduced staffing
o Utilize non-General Fund sources to the highest possible degree
• Maintain traffic safety citywide
o Work to provide quality traffic enforcement and safety services in light of reduced staffing
o Target problematic intersections for special enforcement
o Maintain hazardous traffic citations and parking citations despite staff reductions
• Reduce the likelihood of violent crimes through narcotics enforcements, surveillance, and asset seizure efforts o Continue aggressive enforcement
and monitoring efforts led by the Special Enforcement Team (SET)
o Quickly resolve neighborhood crime problems with tailored responses as they arise
• Pursue grant opportunities to address
department needs o Continue the department’s excellent
record and expertise in the area of obtaining grants from multiple sources
o Continue to fully leverage multiple funding sources
• Wisely use limited funds to maintain
standards of training excellence o Prioritize training needs through the
chain of command, determining what is mandatory, vital, and cost-effective
o Continue to maximize training reimbursements from Peace Officer Standards and Training (POST)
• Work to improve the effectiveness and
efficiency of the department’s performance, focusing on factors including staffing levels versus the high number of calls for service o Implement features of the strategic
plan, concentrating on improvements in organizational efficiency and effectiveness at the operational level
o Refine timely deployment of police resources to address neighborhood crime trends utilizing CompStat
o Utilize computerized Department policy manual
137
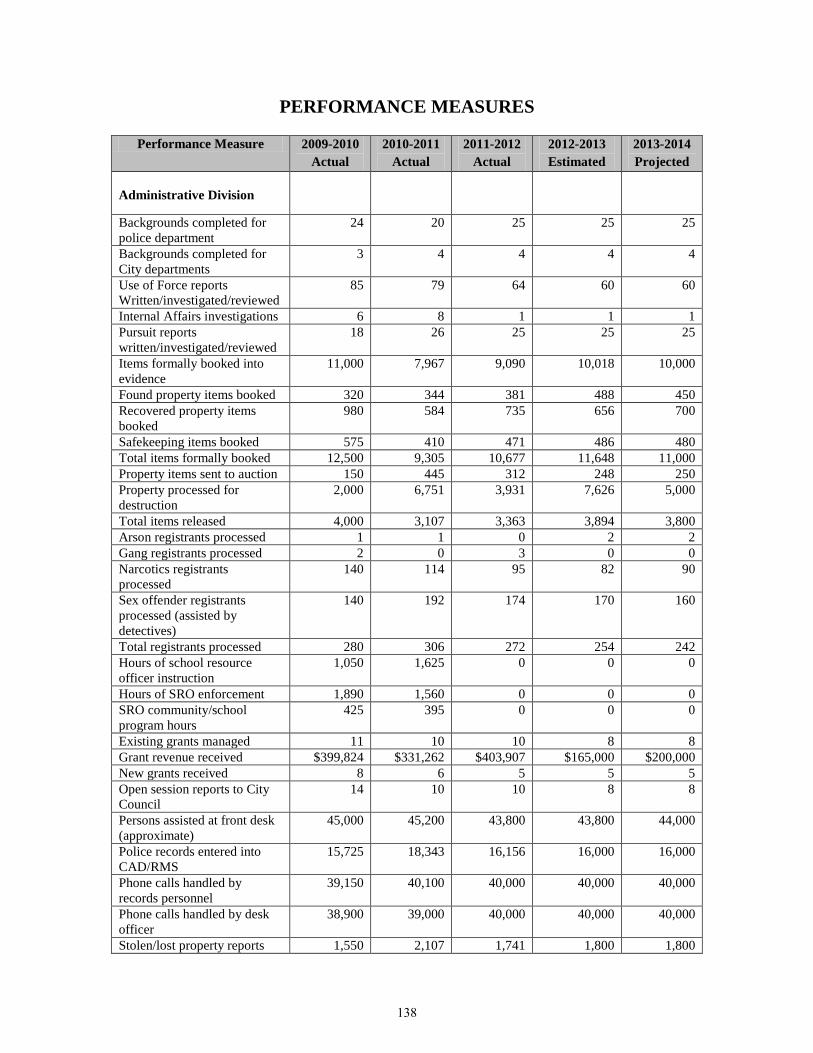
PERFORMANCE MEASURES
Performance Measure 2009-2010 Actual
2010-2011 Actual
2011-2012 Actual
2012-2013 Estimated
2013-2014 Projected
Administrative Division
Backgrounds completed for police department
24 20 25 25 25
Backgrounds completed for City departments
3 4 4 4 4
Use of Force reports Written/investigated/reviewed
85 79 64 60 60
Internal Affairs investigations 6 8 1 1 1 Pursuit reports written/investigated/reviewed
18 26 25 25 25
Items formally booked into evidence
11,000 7,967 9,090 10,018 10,000
Found property items booked 320 344 381 488 450 Recovered property items booked
980 584 735 656 700
Safekeeping items booked 575 410 471 486 480 Total items formally booked 12,500 9,305 10,677 11,648 11,000 Property items sent to auction 150 445 312 248 250 Property processed for destruction
2,000 6,751 3,931 7,626 5,000
Total items released 4,000 3,107 3,363 3,894 3,800 Arson registrants processed 1 1 0 2 2 Gang registrants processed 2 0 3 0 0 Narcotics registrants processed
140 114 95 82 90
Sex offender registrants processed (assisted by detectives)
140 192 174 170 160
Total registrants processed 280 306 272 254 242 Hours of school resource officer instruction
1,050 1,625 0 0 0
Hours of SRO enforcement 1,890 1,560 0 0 0 SRO community/school program hours
425 395 0 0 0
Existing grants managed 11 10 10 8 8 Grant revenue received $399,824 $331,262 $403,907 $165,000 $200,000 New grants received 8 6 5 5 5 Open session reports to City Council
14 10 10 8 8
Persons assisted at front desk (approximate)
45,000 45,200 43,800 43,800 44,000
Police records entered into CAD/RMS
15,725 18,343 16,156 16,000 16,000
Phone calls handled by records personnel
39,150 40,100 40,000 40,000 40,000
Phone calls handled by desk officer
38,900 39,000 40,000 40,000 40,000
Stolen/lost property reports 1,550 2,107 1,741 1,800 1,800
138

Performance Measure 2009-2010 Actual
2010-2011 Actual
2011-2012 Actual
2012-2013 Estimated
2013-2014 Adopted
taken State/federal mandated records verification reports
12 12 12 12 12
Towing franchise revenue $217,880 $219,509 $191,646 $210,000 $210,000 Firing range usage reimbursement
$7,500 $7,800 $9,050 $9,000 $9,000
Police reimbursements including Forensic Services, and formerly School Resource Officer (General Fund)
$190,923 $163,123 $25,255 $10,000 $10,000
Jail Unit
Prisoners booked (includes booking paperwork, fingerprinting, administering phone calls, photographing prisoner, advising prisoner of rights and obtaining signatures, prisoner property inventory and storage)
2,821 3,209 2,843 2,790 2,800
Prisoner checks (per state mandate)
18,500 18,500 17,520 18,000 18,000
Prisoner meals served (complying with state regulations)
9,000 9,000 8,529 8,900 8,900
Inspections (complying with multiple mandates)
5 5 5 5 5
Jail telephone revenue (Inmate Welfare Fund)
$15,220 $7,200 $3,932 $7,000 $7,000
Jail booking revenue (General Fund)
$63,409 $41,983 $34,153 $35,000 $35,000
West Covina Service Group Measures
Client agencies receiving comprehensive CAD/RMS services
23 24 24 24 22
Revenue $2,193,037 $2,268,982 $1,805,242 $1,979,796 $1,782,403 Patrol Division
Total calls for service (generating incident number)
76,126 71,449 65,659 67,020 70,000
Number of above requiring 2 or more units
19,083 18,346 18,620 18,750 18,750
911 calls responded to 11,727 10,689 11,572 13,458 13,000 Number of self-initiated reports (includes actions by special enforcement team)
32,824 31,336 23,308 22,538 23,000
Traffic accidents responded to 1,531 1,500 1,542 1,562 1,500
139
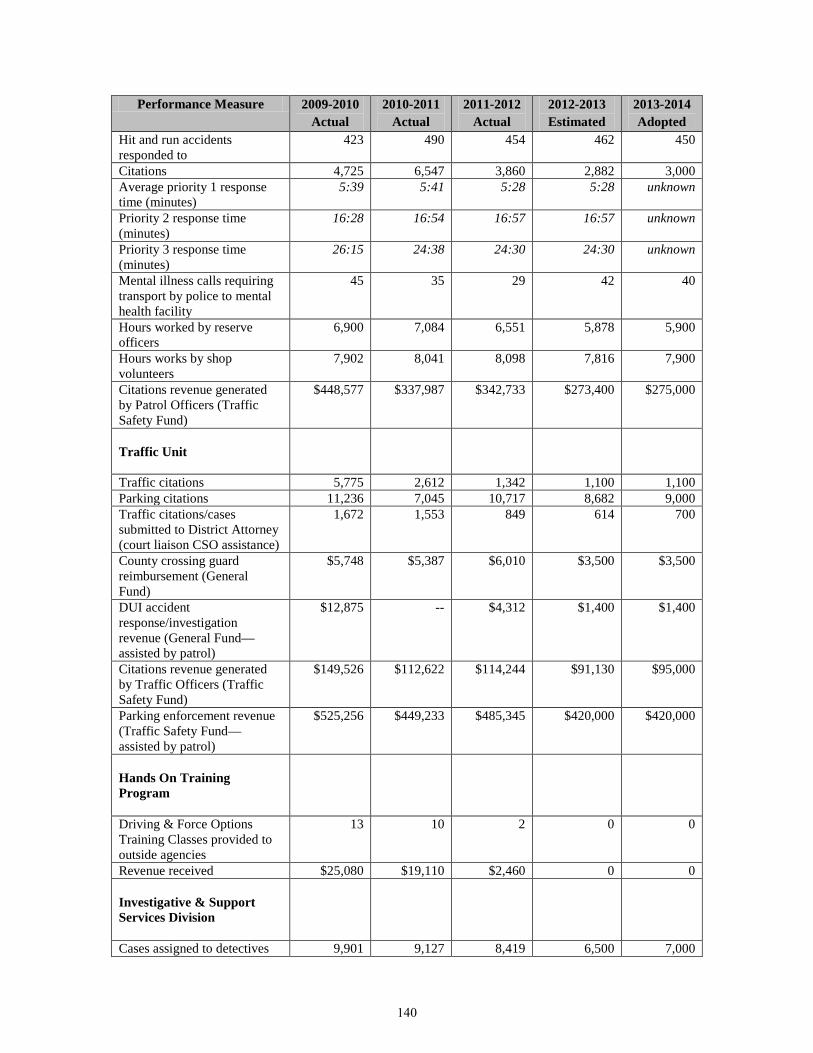
Performance Measure 2009-2010 Actual
2010-2011 Actual
2011-2012 Actual
2012-2013 Estimated
2013-2014 Adopted
Hit and run accidents responded to
423 490 454 462 450
Citations 4,725 6,547 3,860 2,882 3,000 Average priority 1 response time (minutes)
5:39 5:41 5:28 5:28 unknown
Priority 2 response time (minutes)
16:28 16:54 16:57 16:57 unknown
Priority 3 response time (minutes)
26:15 24:38 24:30 24:30 unknown
Mental illness calls requiring transport by police to mental health facility
45 35 29 42 40
Hours worked by reserve officers
6,900 7,084 6,551 5,878 5,900
Hours works by shop volunteers
7,902 8,041 8,098 7,816 7,900
Citations revenue generated by Patrol Officers (Traffic Safety Fund)
$448,577 $337,987 $342,733 $273,400 $275,000
Traffic Unit
Traffic citations 5,775 2,612 1,342 1,100 1,100 Parking citations 11,236 7,045 10,717 8,682 9,000 Traffic citations/cases submitted to District Attorney (court liaison CSO assistance)
1,672 1,553 849 614 700
County crossing guard reimbursement (General Fund)
$5,748 $5,387 $6,010 $3,500 $3,500
DUI accident response/investigation revenue (General Fund—assisted by patrol)
$12,875 -- $4,312 $1,400 $1,400
Citations revenue generated by Traffic Officers (Traffic Safety Fund)
$149,526 $112,622 $114,244 $91,130 $95,000
Parking enforcement revenue (Traffic Safety Fund—assisted by patrol)
$525,256 $449,233 $485,345 $420,000 $420,000
Hands On Training Program
Driving & Force Options Training Classes provided to outside agencies
13 10 2 0 0
Revenue received $25,080 $19,110 $2,460 0 0 Investigative & Support Services Division
Cases assigned to detectives 9,901 9,127 8,419 6,500 7,000
140

Performance Measure 2009-2010 Actual
2010-2011 Actual
2011-2012 Actual
2012-2013 Estimated
2013-2014 Adopted
Average number of cases assigned to each detective
367 507 417 414 450
Arrests by detectives 407 292 325 198 200 Criminal cases presented to District Attorney’s Office (includes traffic/juvenile cases)
4,779 4,456 3,854 3,432 3,500
Criminal cases resulting in filings
4,697 4,501 3,824 3,418 3,500
Cases cleared 3,800 3,531 1,895 3,527 3,500 Detective bureau clearance rate
27% 38% 25% 30% 30%
Identity theft cases 217 235 239 274 270 Domestic violence cases 331 332 287 316 315 Service contacts with Domestic Violence Victims
1,687 1,800 1,984 1,813 1,850
Individual Victim Advocate Counseling sessions
238 240 228 140 150
Domestic violence classes/groups
115 110 110 94 95
Victim Advocate court accompaniments
34 25 17 24 25
After-hours detective call-outs 225 200 184 210 210 Search warrants served by detectives
73 79 78 58 60
Sex offenders interviewed by detectives
167 162 140 150 150
Evidence items processed by forensics
1,125 788 890 2,000 2,000
Latent print cards of named suspects examined
650 885 590 900 900
Latent print cards obtained at crime scene and entered into automated system
1,600 1,529 1,750 2,800 2,500
Fingerprint identifications made
90 119 150 400 400
Special Enforcement Team (SET)
Search warrants served by SET
48 46 59 130 130
Arrests by SET 120 143 79 140 140 Field interviews by SET 90 83 32 80 80 Gang members contacted (assisted by Patrol)
900 1,150 641 576 580
Narcotics investigations 150 107 97 95 95 Surveillance hours 4,000 3,200 1,733 2,000 2,000 Estimated street value of drugs seized
$20,000,000 $30,000,000 $58,000,000 $50,000,000 $50,000,000
Number of “Knock and Talks” (assistance by
92 25 32 50 50
141

Performance Measure 2009-2010 Actual
2010-2011 Actual
2011-2012 Actual
2012-2013 Estimated
2013-2014 Adopted
patrol/investigations) Cumulative reduction in calls for service from CFMHP apartment complexes
47% 53% 47% 42% 42%
Cumulative reduction in criminal complaints from CFMHP apartment complexes
55% 57% 57% 49% 49%
Task Force and service deployment overtime reimbursements
$169,922
$152,608
$115,208
$66,000 $65,000
Department-wide Measures
Crimes against persons 318 288 271 302 300 Crimes against property 2,979 2,882 3,397 3,166 3,200 Total part 1 crimes 3,297 3,170 3,668 3,468 3,500 Adult arrests 2,703 2,776 2,468 2,490 2,500 Juvenile arrests 483 417 375 300 300 Total arrests 3,186 3,193 2,844 2,7900 2,800 In-Service training days 32 31 28 22 22 Outside source training days 176 177 252 542 500 Total training events 208 218 140 182 180 Total training hours 12,179 9,678 7,798 12,142 12,000 Adult graffiti arrests 106 68 39 16 16 Juvenile graffiti arrests 91 65 41 14 14 Extra K-9 Call-out Deployments
40 27 38 35 35
Federal asset forfeiture revenue
$319,648 $603,888 $3,120,297 $1,700,000 $7,000
State asset forfeiture revenue $16,666 $21,407 $1,459 $1,000 $1,000 Community donations for police programs
$1,300 $20,138 $27,509 $64,800 $2,000
Public Safety Augmentation Revenue
$530,944 $552,716 $541,491 $508,000 $650,000
Miscellaneous General Fund revenue (includes court fines, vehicle impound fees, administrative citations, state mandated revenue, POST training reimbursements, false alarm fines, clearance letter processing, search fees, graffiti restitution, and civil subpoenas)
$313,273 $280,327 $250,170 $170,000 $170,000
142
BUDGET COMMENTS
Several duties and functions previously assigned to other City departments have been absorbed into the police department with no additional sworn or supervisory staffing. These functions include emergency dispatch operations and the management of the City’s graffiti removal contract. Historically, overtime has been under-budgeted relative to actual expenditures, with full-time authorized vacancies previously generating unspent savings sufficient to balance the over-expenditure. With sworn positions eliminated such that few or no vacancies are projected, this budgetary solution will no longer occur. The department has many unmet or deferred equipment needs. Due to spending restrictions, these cannot all be met using grant funds or asset forfeiture. Foremost among these needs is the regular replacement of the police patrol fleet. Although feasible as a short-term money saving tactic, the City cannot indefinitely defer the purchase of patrol vehicles while running patrol operations. Patrol vehicles are run round the clock in very hard conditions, often in strenuous pursuits, and have a limited lifespan before they must be rotated to other divisions while they are still functionally sound.
BUDGET ISSUES Police department staffing is a serious issue. Several years ago, West Covina was already ranked in the lowest 4% nationally in its police officer to citizen population standing (based on city crime figures collected in 2006 and published in 2008 by the Congressional Quarterly Press), and was over 25 officers below the state average for similar sized cities, and over 55 officers behind the LA County average. Our civilian ranking was similar. Additionally, a 2009 survey of 17 cities revealed that West Covina was tied for the second lowest ranking of supervisory police staff to sworn officers. Since 2007, West Covina has lost a total of 37 sworn positions. This understaffing is both a public safety and customer service issue, as residents have to wait longer for responses to non-emergency calls, and supervisory span of control has been reduced. Exercising proper management oversight of complex, often versatile and high risk activities is increasingly difficult. Adding vitally needed front-line operational policing positions and supervisors to move West Covina closer to regional service level standards should be considered a top priority in the future. Installing digital video cameras in patrol cars would benefit West Covina. As utilized by many police departments across the nation, these cameras capture true accounts of what actually occurs during traffic stops, pursuits, etc., to counter any allegations of misconduct. Additionally, cameras would witness and record actions of specific interest to the courts, as well as any officer-involved uses of force.
143
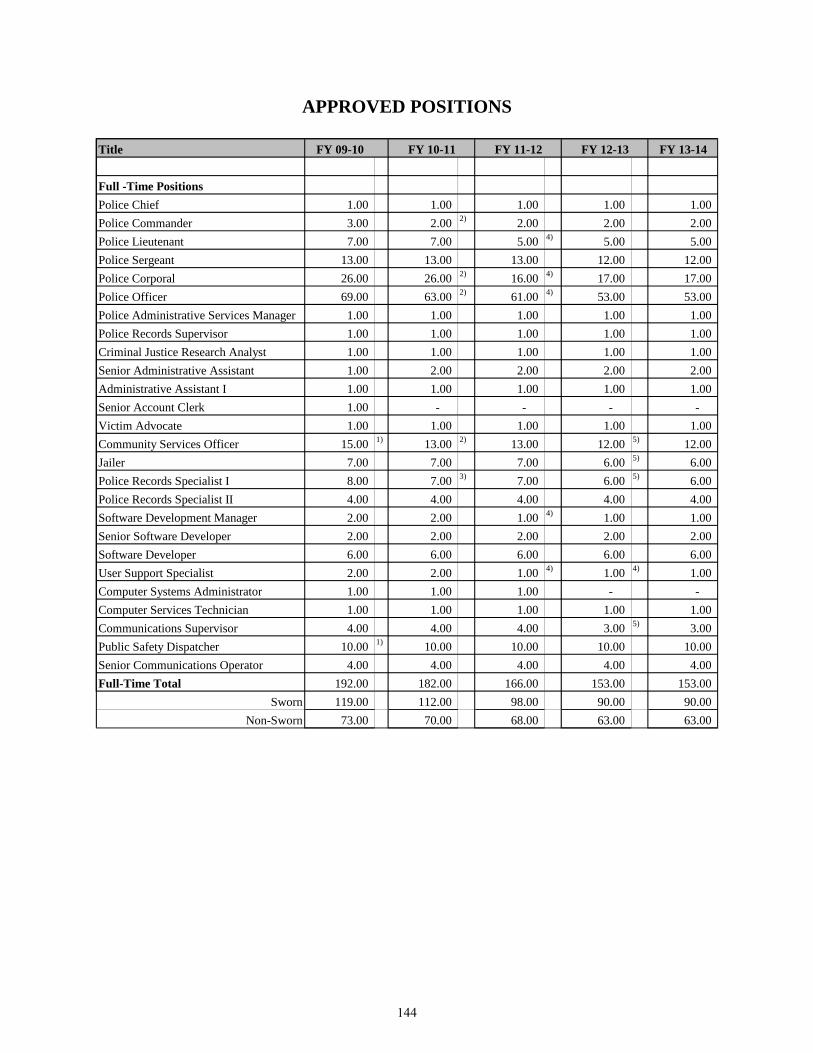
APPROVED POSITIONS
Title FY 09-10 FY 13-14
Full -Time PositionsPolice Chief 1.00 1.00 1.00 1.00 1.00 Police Commander 3.00 2.00 2) 2.00 2.00 2.00 Police Lieutenant 7.00 7.00 5.00 4) 5.00 5.00 Police Sergeant 13.00 13.00 13.00 12.00 12.00 Police Corporal 26.00 26.00 2) 16.00 4) 17.00 17.00 Police Officer 69.00 63.00 2) 61.00 4) 53.00 53.00 Police Administrative Services Manager 1.00 1.00 1.00 1.00 1.00 Police Records Supervisor 1.00 1.00 1.00 1.00 1.00 Criminal Justice Research Analyst 1.00 1.00 1.00 1.00 1.00 Senior Administrative Assistant 1.00 2.00 2.00 2.00 2.00 Administrative Assistant I 1.00 1.00 1.00 1.00 1.00 Senior Account Clerk 1.00 - - - - Victim Advocate 1.00 1.00 1.00 1.00 1.00 Community Services Officer 15.00 1) 13.00 2) 13.00 12.00 5) 12.00 Jailer 7.00 7.00 7.00 6.00 5) 6.00 Police Records Specialist I 8.00 7.00 3) 7.00 6.00 5) 6.00 Police Records Specialist II 4.00 4.00 4.00 4.00 4.00 Software Development Manager 2.00 2.00 1.00 4) 1.00 1.00 Senior Software Developer 2.00 2.00 2.00 2.00 2.00 Software Developer 6.00 6.00 6.00 6.00 6.00 User Support Specialist 2.00 2.00 1.00 4) 1.00 4) 1.00 Computer Systems Administrator 1.00 1.00 1.00 - - Computer Services Technician 1.00 1.00 1.00 1.00 1.00 Communications Supervisor 4.00 4.00 4.00 3.00 5) 3.00 Public Safety Dispatcher 10.00 1) 10.00 10.00 10.00 10.00 Senior Communications Operator 4.00 4.00 4.00 4.00 4.00 Full-Time Total 192.00 182.00 166.00 153.00 153.00
Sworn 119.00 112.00 98.00 90.00 90.00 Non-Sworn 73.00 70.00 68.00 63.00 63.00
FY 11-12FY 10-11 FY 12-13
144
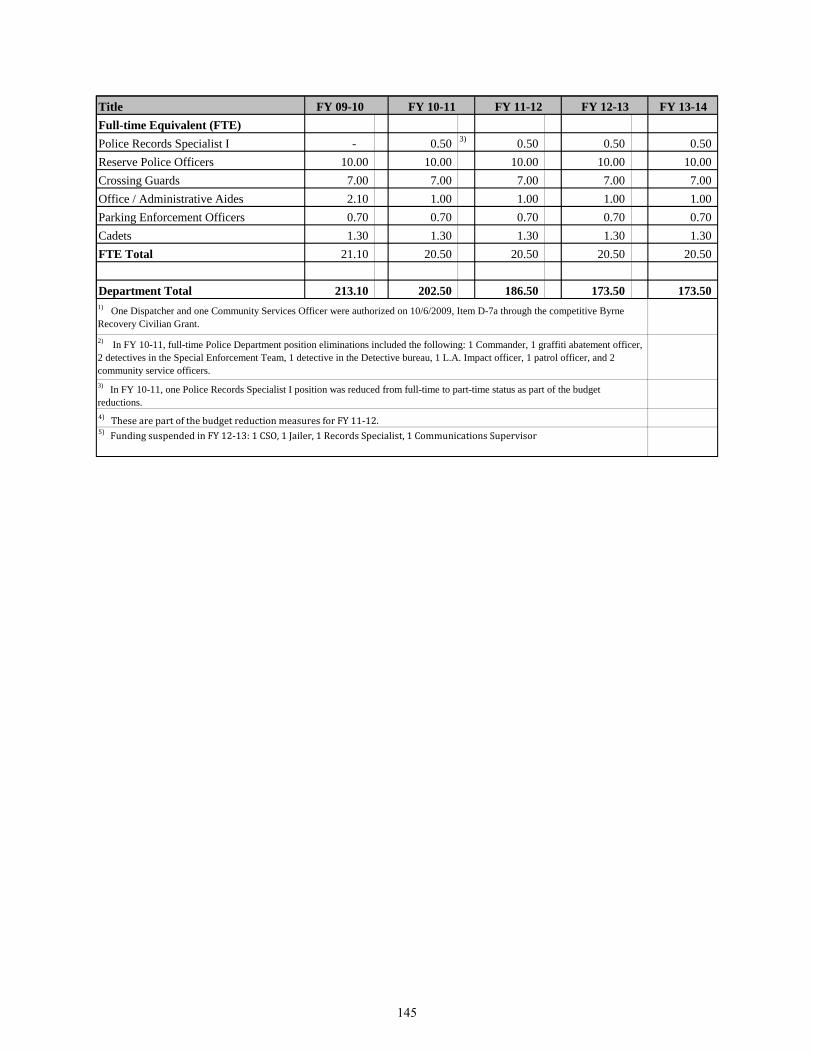
Title FY 09-10 FY 13-14Full-time Equivalent (FTE)Police Records Specialist I - 0.50 3) 0.50 0.50 0.50 Reserve Police Officers 10.00 10.00 10.00 10.00 10.00 Crossing Guards 7.00 7.00 7.00 7.00 7.00 Office / Administrative Aides 2.10 1.00 1.00 1.00 1.00 Parking Enforcement Officers 0.70 0.70 0.70 0.70 0.70 Cadets 1.30 1.30 1.30 1.30 1.30 FTE Total 21.10 20.50 20.50 20.50 20.50
Department Total 213.10 202.50 186.50 173.50 173.50
FY 11-12
2) In FY 10-11, full-time Police Department position eliminations included the following: 1 Commander, 1 graffiti abatement officer, 2 detectives in the Special Enforcement Team, 1 detective in the Detective bureau, 1 L.A. Impact officer, 1 patrol officer, and 2 community service officers.3) In FY 10-11, one Police Records Specialist I position was reduced from full-time to part-time status as part of the budget reductions.4) These are part of the budget reduction measures for FY 11-12.5) Funding suspended in FY 12-13: 1 CSO, 1 Jailer, 1 Records Specialist, 1 Communications Supervisor
FY 10-11
1) One Dispatcher and one Community Services Officer were authorized on 10/6/2009, Item D-7a through the competitive Byrne Recovery Civilian Grant.
FY 12-13
145

ACTIVITY TREE
POLICE DEPARTMENT
PatrolDivision
Traffic Unit
Communications/Dispatch
Jail Operations
Simulator/DrivingProgram
Investigative & Admin.Division
Special EnforcementTeam
West CovinaService Group
146
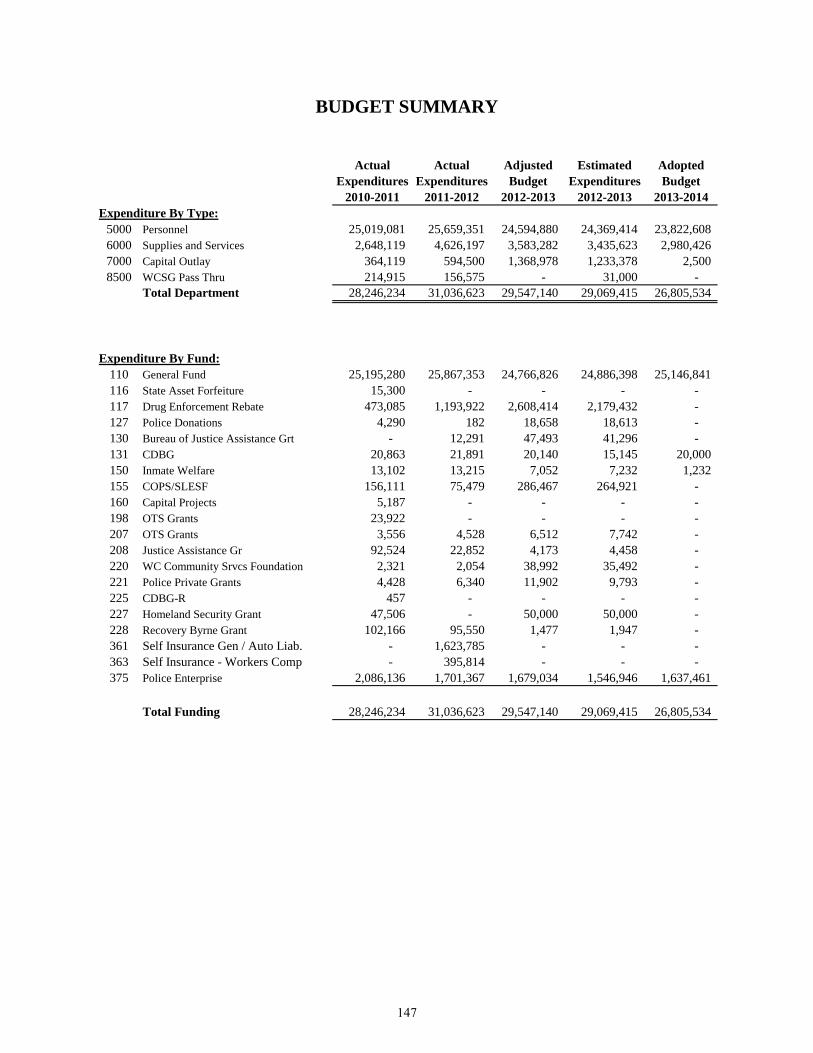
BUDGET SUMMARY
Actual Actual Adjusted Estimated AdoptedExpenditures Expenditures Budget Expenditures Budget
2010-2011 2011-2012 2012-2013 2012-2013 2013-2014Expenditure By Type:
5000 Personnel 25,019,081 25,659,351 24,594,880 24,369,414 23,822,608 6000 Supplies and Services 2,648,119 4,626,197 3,583,282 3,435,623 2,980,426 7000 Capital Outlay 364,119 594,500 1,368,978 1,233,378 2,500 8500 WCSG Pass Thru 214,915 156,575 - 31,000 -
Total Department 28,246,234 31,036,623 29,547,140 29,069,415 26,805,534
Expenditure By Fund:110 General Fund 25,195,280 25,867,353 24,766,826 24,886,398 25,146,841 116 State Asset Forfeiture 15,300 - - - - 117 Drug Enforcement Rebate 473,085 1,193,922 2,608,414 2,179,432 - 127 Police Donations 4,290 182 18,658 18,613 - 130 Bureau of Justice Assistance Grt - 12,291 47,493 41,296 - 131 CDBG 20,863 21,891 20,140 15,145 20,000 150 Inmate Welfare 13,102 13,215 7,052 7,232 1,232 155 COPS/SLESF 156,111 75,479 286,467 264,921 - 160 Capital Projects 5,187 - - - - 198 OTS Grants 23,922 - - - - 207 OTS Grants 3,556 4,528 6,512 7,742 - 208 Justice Assistance Gr 92,524 22,852 4,173 4,458 - 220 WC Community Srvcs Foundation 2,321 2,054 38,992 35,492 - 221 Police Private Grants 4,428 6,340 11,902 9,793 - 225 CDBG-R 457 - - - - 227 Homeland Security Grant 47,506 - 50,000 50,000 - 228 Recovery Byrne Grant 102,166 95,550 1,477 1,947 - 361 Self Insurance Gen / Auto Liab. - 1,623,785 - - - 363 Self Insurance - Workers Comp - 395,814 - - - 375 Police Enterprise 2,086,136 1,701,367 1,679,034 1,546,946 1,637,461
Total Funding 28,246,234 31,036,623 29,547,140 29,069,415 26,805,534
147
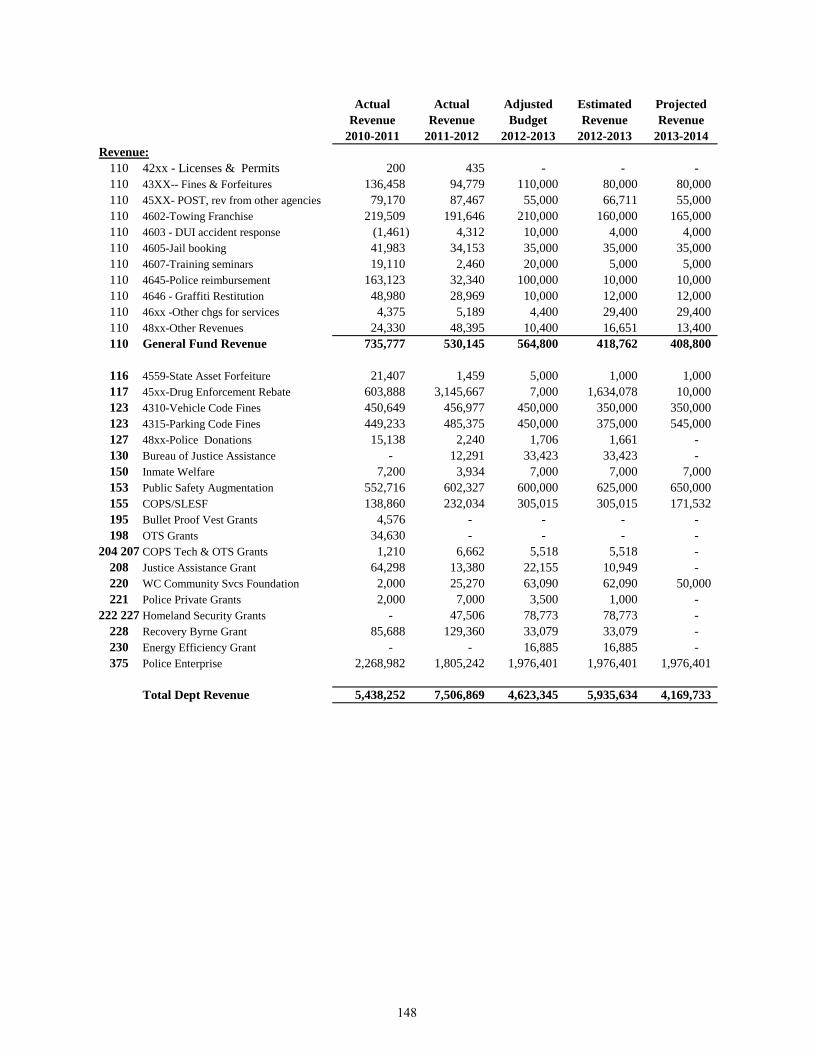
Actual Actual Adjusted Estimated ProjectedRevenue Revenue Budget Revenue Revenue
2010-2011 2011-2012 2012-2013 2012-2013 2013-2014Revenue:
110 42xx - Licenses & Permits 200 435 - - - 110 43XX-- Fines & Forfeitures 136,458 94,779 110,000 80,000 80,000 110 45XX- POST, rev from other agencies 79,170 87,467 55,000 66,711 55,000 110 4602-Towing Franchise 219,509 191,646 210,000 160,000 165,000 110 4603 - DUI accident response (1,461) 4,312 10,000 4,000 4,000 110 4605-Jail booking 41,983 34,153 35,000 35,000 35,000 110 4607-Training seminars 19,110 2,460 20,000 5,000 5,000 110 4645-Police reimbursement 163,123 32,340 100,000 10,000 10,000 110 4646 - Graffiti Restitution 48,980 28,969 10,000 12,000 12,000 110 46xx -Other chgs for services 4,375 5,189 4,400 29,400 29,400 110 48xx-Other Revenues 24,330 48,395 10,400 16,651 13,400 110 General Fund Revenue 735,777 530,145 564,800 418,762 408,800
116 4559-State Asset Forfeiture 21,407 1,459 5,000 1,000 1,000 117 45xx-Drug Enforcement Rebate 603,888 3,145,667 7,000 1,634,078 10,000 123 4310-Vehicle Code Fines 450,649 456,977 450,000 350,000 350,000 123 4315-Parking Code Fines 449,233 485,375 450,000 375,000 545,000 127 48xx-Police Donations 15,138 2,240 1,706 1,661 - 130 Bureau of Justice Assistance - 12,291 33,423 33,423 - 150 Inmate Welfare 7,200 3,934 7,000 7,000 7,000 153 Public Safety Augmentation 552,716 602,327 600,000 625,000 650,000 155 COPS/SLESF 138,860 232,034 305,015 305,015 171,532 195 Bullet Proof Vest Grants 4,576 - - - - 198 OTS Grants 34,630 - - - -
204 207 COPS Tech & OTS Grants 1,210 6,662 5,518 5,518 - 208 Justice Assistance Grant 64,298 13,380 22,155 10,949 - 220 WC Community Svcs Foundation 2,000 25,270 63,090 62,090 50,000 221 Police Private Grants 2,000 7,000 3,500 1,000 -
222 227 Homeland Security Grants - 47,506 78,773 78,773 - 228 Recovery Byrne Grant 85,688 129,360 33,079 33,079 - 230 Energy Efficiency Grant - - 16,885 16,885 - 375 Police Enterprise 2,268,982 1,805,242 1,976,401 1,976,401 1,976,401
Total Dept Revenue 5,438,252 7,506,869 4,623,345 5,935,634 4,169,733
148

FIRE DEPARTMENT MISSION STATEMENT: To provide the highest level of life and property safety in a caring and cost effective manner, and to continually strive to provide quality customer service for the community, the City, and to one another
his department is comprised of a combination of dedicated career firefighters and civilian staff. The
members of the department take extreme pride in serving the citizens and visitors with the utmost respect and compassion. The City’s firefighters are highly competent in performing firefighting, rescue, and emergency medical services.
Utilizing resources provided by the city, firefighters make every last effort to:
• respond quickly,• treat people with respect and dignity,• utilize experience and training to assist
in the “most appropriate” manner, and• look for additional opportunities to make
the community “safer.”
From the period of January 1, 2012 to December 31, 2012, the fire department had an increase of unit responses, which totaled 15,903 for this period. These responses were for 7,602 reported emergency incidents. They included 5,635 medical emergencies, 1,806 public assistance/hazardous conditions/fire alarms/false alarms, and 161 hostile fires, and unfortunately resulting in 2 fatalities and 7 reported injuries. The total fire loss for the 12-month period amounted to an increase over $2,000,000 to $5,444,960.
The department serves the community by responding from the following five community fire stations:
• Station No. 1819 S. Sunset Avenue
• Station No. 22441 E. Cortez Avenue
• Station No. 31433 W. Puente Avenue
• Station No. 41815 S. Azusa Avenue
• Station No. 52650 E. Shadow Oak Drive
Operational Services
This functional area is responsible for overseeing fleet, facility, and equipment maintenance for the fire department. In addition, staff provides oversight for purchasing, and acts as a liaison for communication and mutual aid operations. Through support and deployment, operations personnel are committed to maintaining the functional capabilities of the department.
• Emergency Operations – This is the coreof the department’s fire and life safetyprotection services. Emergencyoperations are delivered 24 hours a day,365 days a year, by two paramedic- assessment fire engine companies, oneparamedic assessment light force(combination fire engine and laddertruck), two basic life support fireengines, three paramedic ambulances,and one assistant fire chief. Theseprofessional and highly skilled
T
149
firefighters are cross-trained to respond to medical emergencies, fires of all types and sizes, transportation accidents, hazardous materials spills, and other emergency service calls. Emergency personnel respond quickly and are able to mitigate and solve the problem effectively regardless of the nature of the emergency. West Covina’s firefighters consistently provide high quality customer service.
The City’s firefighters utilize aggressive interior-attack firefighting to control fires quickly and increase the life safety of trapped occupants whenever possible. Using a deployment of firefighting resources, the community experiences a relatively low annual fire loss. In addition to medical emergencies and fires, the department annually responds to more than 1,800 additional calls for service ranging from infants locked in vehicles, chemical and product spills, inadvertent fire alarm activations, and responses to assist in adjacent communities through Automatic and Mutual Aid agreements.
Management Services In an effort to provide appropriate leadership, management, and standard operating procedures, an assistant fire chief is responsible for overseeing all personnel related functions. Included in these functions are the department’s labor relations, staffing, recruiting, public education, and promotional exams. Also provided is oversight of the California Department of Motor Vehicle requirements and Risk Management documents. • Emergency Preparedness - Fiscal
challenges have reduced the dedication of resources for emergency planning.
This program is now an ancillary function for fire administration staff only when required. All firefighters receive specialized first-responder training for response to natural disasters and terrorism incidents.
In addition, the assigned assistant fire chief oversees the delivery of Emergency Medical Services (EMS). • Paramedic Ambulance Services –
Approximately 74 percent of the department's activity is directed towards emergency medical services. The department delivers extremely high-level advanced life support medical treatment. The department assists approximately 5,600 patients each year. About one half of these individuals are in severe medical distress and require paramedic level care. On an annual basis, approximately 4,000 patients are transported to area hospitals in one of the three fire department ambulances, and are assessed fees for medical treatment and transportation services. Staff oversees ambulance billing and EMS training for the City’s firefighters. EMS quality assurance is ensured through periodic quality control audits. A nurse educator is provided on contract from UCLA, and provides continuing education training to all Emergency Medical Technicians and paramedic personnel. City paramedics are trained to the highest standards and are participating in several new cutting-edge life-saving skills that the County of Los Angeles EMS Agency has implemented.
Administrative Services In a continued effort to streamline costs, an assistant fire chief of administration had been vacated and those responsibilities are
150
currently being performed by the fire chief. This vacancy continues to require the fire chief to assume the position of fire marshal. Managing and enforcing all City of West Covina fire codes and ordinances, and providing these services in a timely manner are critical. The Fire Prevention Bureau uses consultants to review building plans to ensure proposed designs meet contemporary fire codes. Inspecting occupancies during the various stages of construction is a critical component of ensuring that fire and life safety systems are adequate. A specially trained deputy fire marshal inspects fire sprinkler systems, fire alarm systems, hazardous storage, and ensures that fire exits, emergency lighting, means of egress and extinguishing equipment are provided and maintained. Fire prevention personnel spend a great deal of time assisting private developers with various fire code compliance options in the design and construction of fire safe buildings. The services provided to contractors and developers are designed to be cost effective for the city and businesses. In fiscal year 2012-2013, these services provided revenue in the amount of approximately $200,000. The deputy fire marshal manages the annual inspections of all existing business and commercial occupancies within the city. Fire prevention personnel coordinate with the city's building, planning, and community development departments to ensure all planned developments meet fire code standards and that all educational occupancies are designed with life safety as the primary concern. • Public Education – The department
works with the community to provide fire and life safety education. Firefighters provide demonstrations and offers tours to local schools and groups. The department encourages community
participation and involvement and uses events like Fire Prevention Week, Every 15 Minutes, and the Red Ribbon Rally to educate the residents about fire and life safety and drowning prevention.
Support Services The department remains committed to providing training and professional development opportunities for first responders that are in-line with the delivery of state-of-the-art fire suppression, rescue, and property conservation services. • Fire Investigators – The assistant chief
of support services is responsible for overseeing the department's fire investigation unit. Trained fire investigators work diligently to identify the cause and origin of fires in the city. They work closely with detectives from the police department to identify, arrest, and prosecute arson suspects.
• Training – Frequent quality training allows the city’s firefighters to remain prepared to respond to various emergencies. Department members receive all mandated training through in-house manipulative and classroom drills, formalized workshops and seminars, and train-the-trainer academies. City firefighters pride themselves on building realistic props for training, and conducting pre-fire planning on city buildings and target hazards.
151
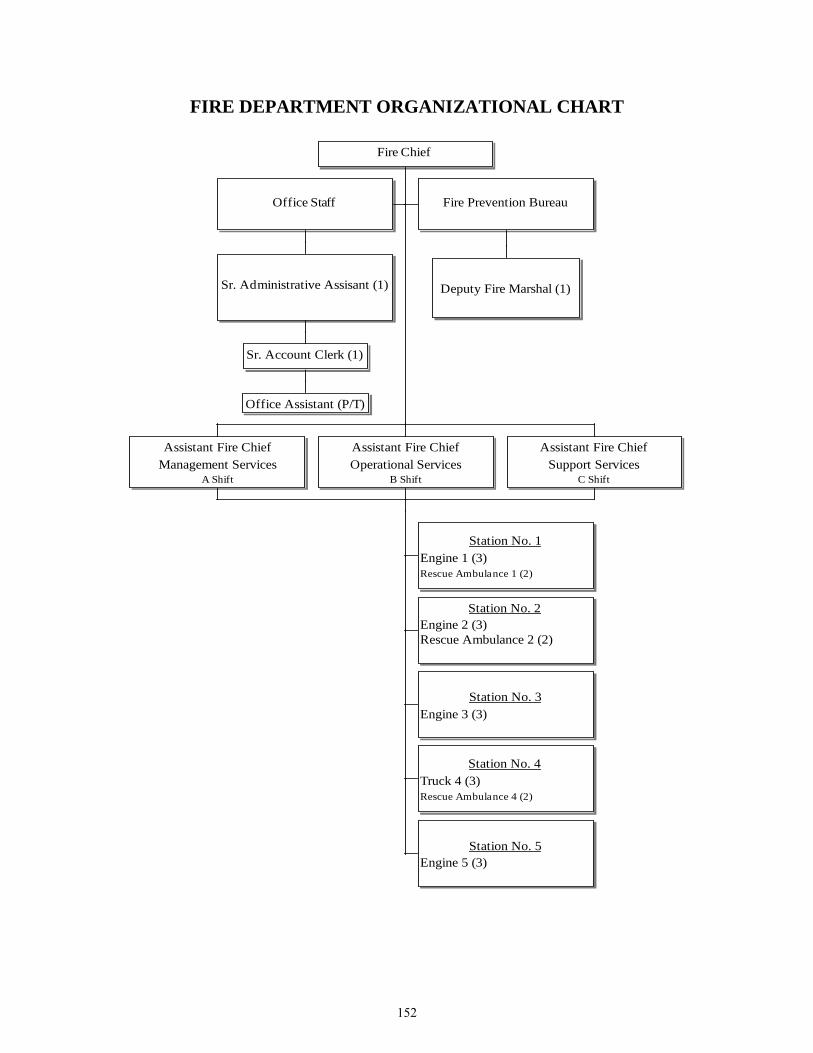
FIRE DEPARTMENT ORGANIZATIONAL CHART
Fire Chief
Office Staff
Sr. Administrative Assisant (1)
Sr. Account Clerk (1)
Office Assistant (P/T)
Fire Prevention Bureau
Deputy Fire Marshal (1)
Station No. 1Engine 1 (3)Rescue Ambulance 1 (2)
Station No. 2Engine 2 (3)Rescue Ambulance 2 (2)
Station No. 3Engine 3 (3)
Station No. 4Truck 4 (3)Rescue Ambulance 4 (2)
Station No. 5Engine 5 (3)
Assistant Fire ChiefManagement Services
A Shift
Assistant Fire ChiefOperational Services
B Shift
Assistant Fire ChiefSupport Services
C Shift
152
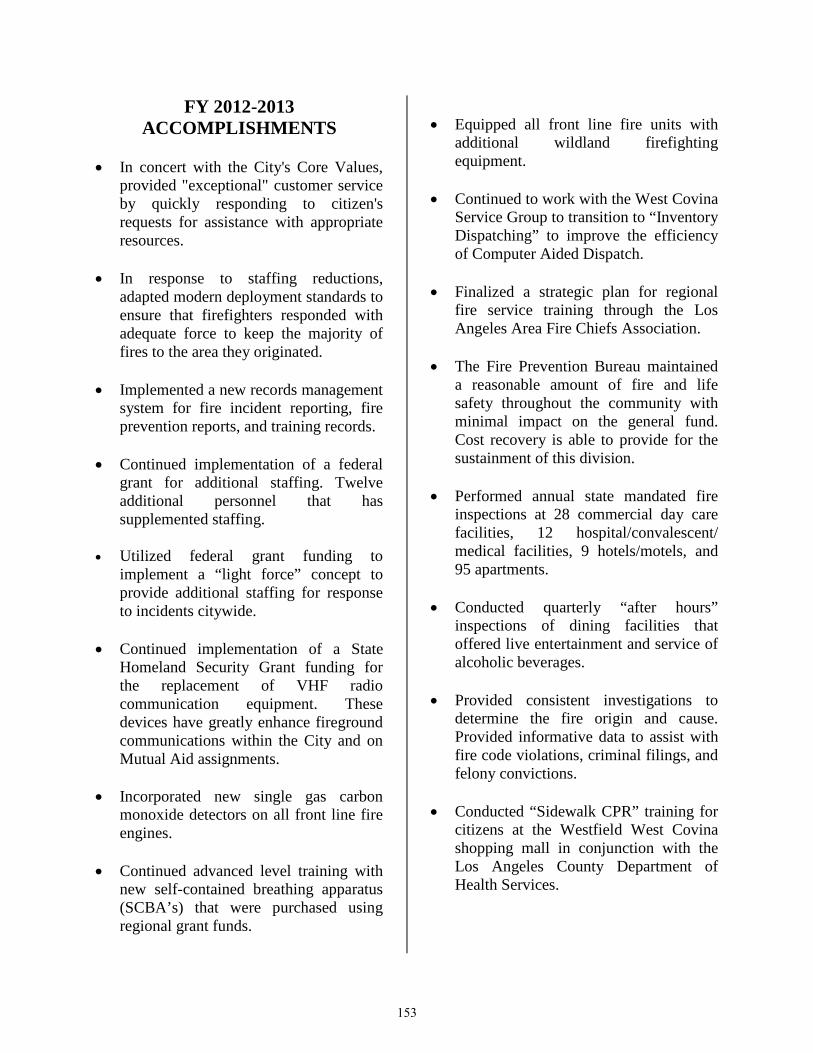
FY 2012-2013 ACCOMPLISHMENTS
• In concert with the City's Core Values,
provided "exceptional" customer service by quickly responding to citizen's requests for assistance with appropriate resources.
• In response to staffing reductions,
adapted modern deployment standards to ensure that firefighters responded with adequate force to keep the majority of fires to the area they originated.
• Implemented a new records management
system for fire incident reporting, fire prevention reports, and training records.
• Continued implementation of a federal
grant for additional staffing. Twelve additional personnel that has supplemented staffing.
• Utilized federal grant funding to
implement a “light force” concept to provide additional staffing for response to incidents citywide.
• Continued implementation of a State
Homeland Security Grant funding for the replacement of VHF radio communication equipment. These devices have greatly enhance fireground communications within the City and on Mutual Aid assignments.
• Incorporated new single gas carbon
monoxide detectors on all front line fire engines.
• Continued advanced level training with
new self-contained breathing apparatus (SCBA’s) that were purchased using regional grant funds.
• Equipped all front line fire units with
additional wildland firefighting equipment.
• Continued to work with the West Covina
Service Group to transition to “Inventory Dispatching” to improve the efficiency of Computer Aided Dispatch.
• Finalized a strategic plan for regional
fire service training through the Los Angeles Area Fire Chiefs Association.
• The Fire Prevention Bureau maintained
a reasonable amount of fire and life safety throughout the community with minimal impact on the general fund. Cost recovery is able to provide for the sustainment of this division.
• Performed annual state mandated fire
inspections at 28 commercial day care facilities, 12 hospital/convalescent/ medical facilities, 9 hotels/motels, and 95 apartments.
• Conducted quarterly “after hours”
inspections of dining facilities that offered live entertainment and service of alcoholic beverages.
• Provided consistent investigations to determine the fire origin and cause. Provided informative data to assist with fire code violations, criminal filings, and felony convictions.
• Conducted “Sidewalk CPR” training for
citizens at the Westfield West Covina shopping mall in conjunction with the Los Angeles County Department of Health Services.
153
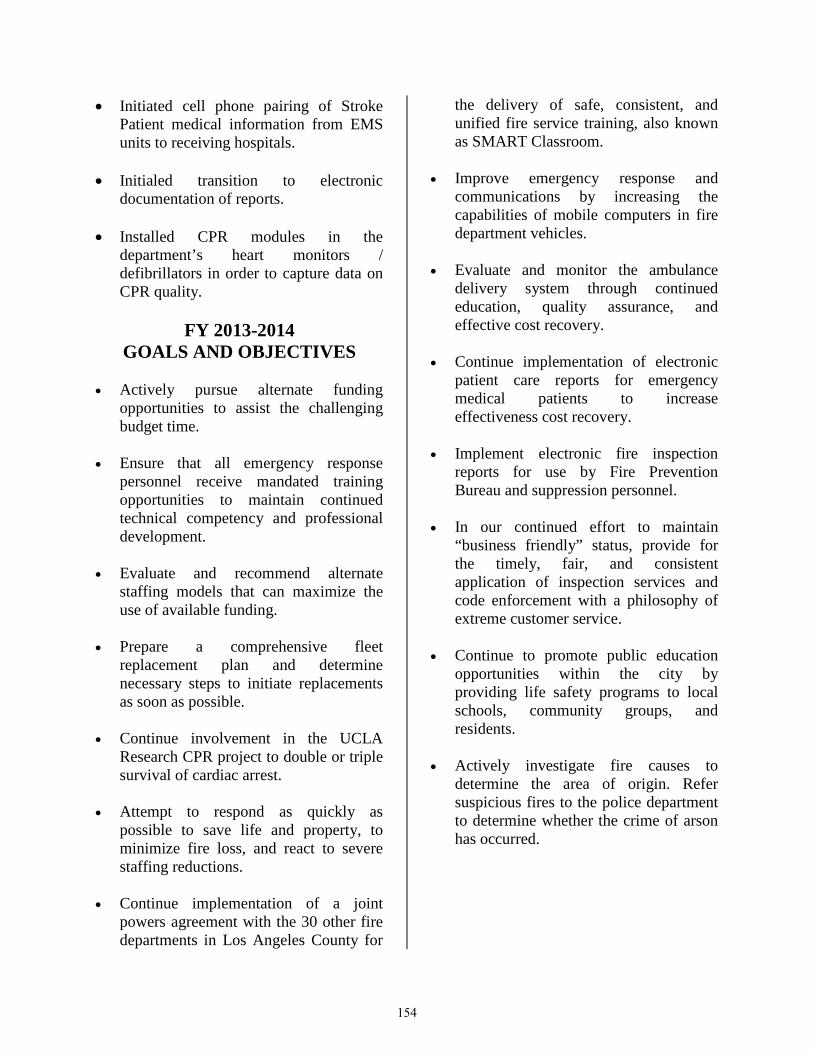
• Initiated cell phone pairing of Stroke Patient medical information from EMS units to receiving hospitals.
• Initialed transition to electronic documentation of reports.
• Installed CPR modules in the
department’s heart monitors / defibrillators in order to capture data on CPR quality.
FY 2013-2014
GOALS AND OBJECTIVES • Actively pursue alternate funding
opportunities to assist the challenging budget time.
• Ensure that all emergency response personnel receive mandated training opportunities to maintain continued technical competency and professional development.
• Evaluate and recommend alternate staffing models that can maximize the use of available funding.
• Prepare a comprehensive fleet
replacement plan and determine necessary steps to initiate replacements as soon as possible.
• Continue involvement in the UCLA
Research CPR project to double or triple survival of cardiac arrest.
• Attempt to respond as quickly as
possible to save life and property, to minimize fire loss, and react to severe staffing reductions.
• Continue implementation of a joint
powers agreement with the 30 other fire departments in Los Angeles County for
the delivery of safe, consistent, and unified fire service training, also known as SMART Classroom.
• Improve emergency response and
communications by increasing the capabilities of mobile computers in fire department vehicles.
• Evaluate and monitor the ambulance
delivery system through continued education, quality assurance, and effective cost recovery.
• Continue implementation of electronic
patient care reports for emergency medical patients to increase effectiveness cost recovery.
• Implement electronic fire inspection
reports for use by Fire Prevention Bureau and suppression personnel.
• In our continued effort to maintain
“business friendly” status, provide for the timely, fair, and consistent application of inspection services and code enforcement with a philosophy of extreme customer service.
• Continue to promote public education
opportunities within the city by providing life safety programs to local schools, community groups, and residents.
• Actively investigate fire causes to
determine the area of origin. Refer suspicious fires to the police department to determine whether the crime of arson has occurred.
154

BUDGET COMMENTS/ISSUES The cities significant budget shortfalls, in recent years, have postponed the purchasing of specialized equipment for the fire department. This deferment of large capital purchases has resulted in an aging fleet of fire apparatus. Due to limited resources, the department has not been able to commit to a Standard Apparatus Replacement Plan; and the department’s change to its current service model has placed additional adversity on some of the equipment. The “light force” concept has assisted in cost savings in the personnel area of the fire department’s budget, however, the tradeoff has resulted in an increase usage of the ladder truck and an engine. For this reason, maintenance costs have increased and more importantly premature wear of highly specialized and expensive equipment.
The reduced staffing of the administration section of the fire department has created various efficiency and effectiveness difficulties within the department. Despite an extremely dedicated workforce and managerial changes to improve productivity, the department will continue to be challenged in billing processes and customer service until additional staffing is acquired.
The Department has searched and received grants to assist in the funding of the city’s fire department. It will continue to be diligent in aggressively pursuing alternative funding sources to assist in financing its operations. The fire department has had a long history of using its funding wisely and will remain assiduous in being effective and efficient with its resources.
155
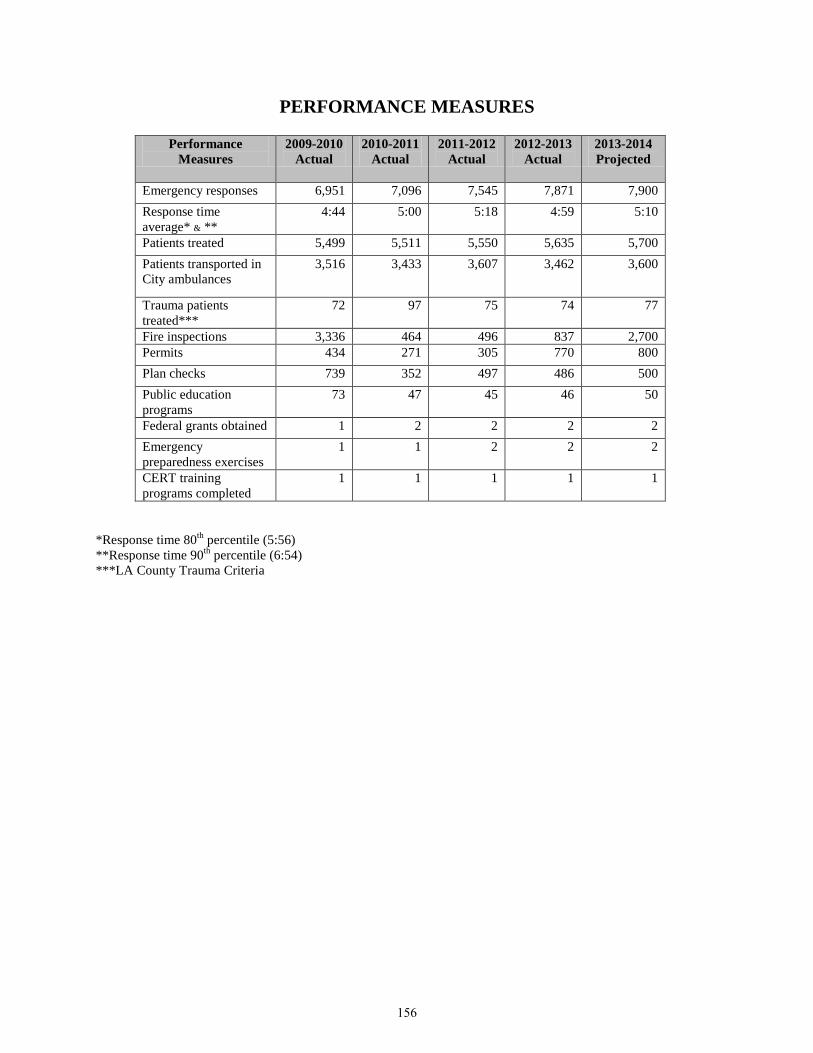
PERFORMANCE MEASURES
Performance Measures
2009-2010 Actual
2010-2011 Actual
2011-2012 Actual
2012-2013 Actual
2013-2014 Projected
Emergency responses 6,951 7,096 7,545 7,871 7,900 Response time average* & **
4:44 5:00 5:18 4:59 5:10
Patients treated 5,499 5,511 5,550 5,635 5,700 Patients transported in City ambulances
3,516 3,433 3,607 3,462 3,600
Trauma patients treated***
72 97 75 74 77
Fire inspections 3,336 464 496 837 2,700 Permits 434 271 305 770 800 Plan checks 739 352 497 486 500 Public education programs
73 47 45 46 50
Federal grants obtained 1 2 2 2 2 Emergency preparedness exercises
1 1 2 2 2
CERT training programs completed
1 1 1 1 1
*Response time 80th percentile (5:56) **Response time 90th percentile (6:54) ***LA County Trauma Criteria
156
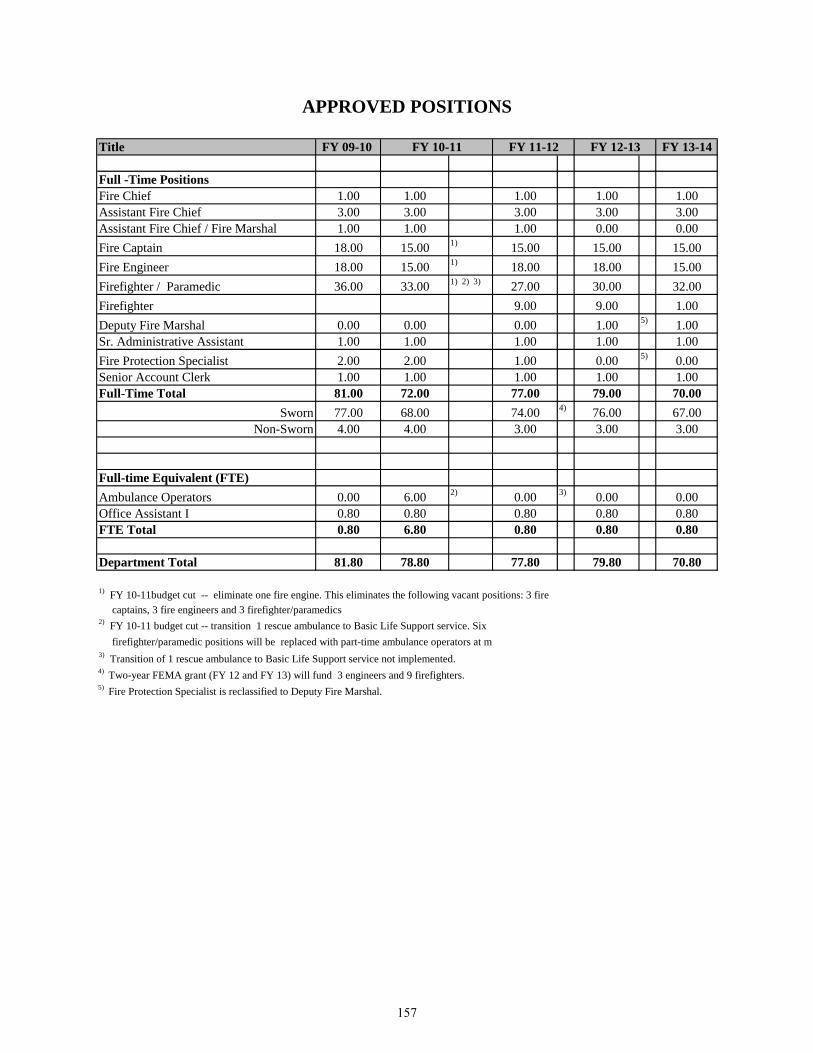
APPROVED POSITIONS
Title FY 09-10 FY 13-14
Full -Time PositionsFire Chief 1.00 1.00 1.00 1.00 1.00Assistant Fire Chief 3.00 3.00 3.00 3.00 3.00Assistant Fire Chief / Fire Marshal 1.00 1.00 1.00 0.00 0.00Fire Captain 18.00 15.00 1) 15.00 15.00 15.00Fire Engineer 18.00 15.00 1) 18.00 18.00 15.00Firefighter / Paramedic 36.00 33.00 1) 2) 3) 27.00 30.00 32.00Firefighter 9.00 9.00 1.00Deputy Fire Marshal 0.00 0.00 0.00 1.00 5) 1.00Sr. Administrative Assistant 1.00 1.00 1.00 1.00 1.00Fire Protection Specialist 2.00 2.00 1.00 0.00 5) 0.00Senior Account Clerk 1.00 1.00 1.00 1.00 1.00Full-Time Total 81.00 72.00 77.00 79.00 70.00
Sworn 77.00 68.00 74.00 4) 76.00 67.00Non-Sworn 4.00 4.00 3.00 3.00 3.00
Full-time Equivalent (FTE)Ambulance Operators 0.00 6.00 2) 0.00 3) 0.00 0.00Office Assistant I 0.80 0.80 0.80 0.80 0.80FTE Total 0.80 6.80 0.80 0.80 0.80
Department Total 81.80 78.80 77.80 79.80 70.80
1) FY 10-11budget cut -- eliminate one fire engine. This eliminates the following vacant positions: 3 fire
5) Fire Protection Specialist is reclassified to Deputy Fire Marshal.
FY 12-13
4) Two-year FEMA grant (FY 12 and FY 13) will fund 3 engineers and 9 firefighters.
FY 11-12
3) Transition of 1 rescue ambulance to Basic Life Support service not implemented.
FY 10-11
2) FY 10-11 budget cut -- transition 1 rescue ambulance to Basic Life Support service. Six captains, 3 fire engineers and 3 firefighter/paramedics
firefighter/paramedic positions will be replaced with part-time ambulance operators at mi
157
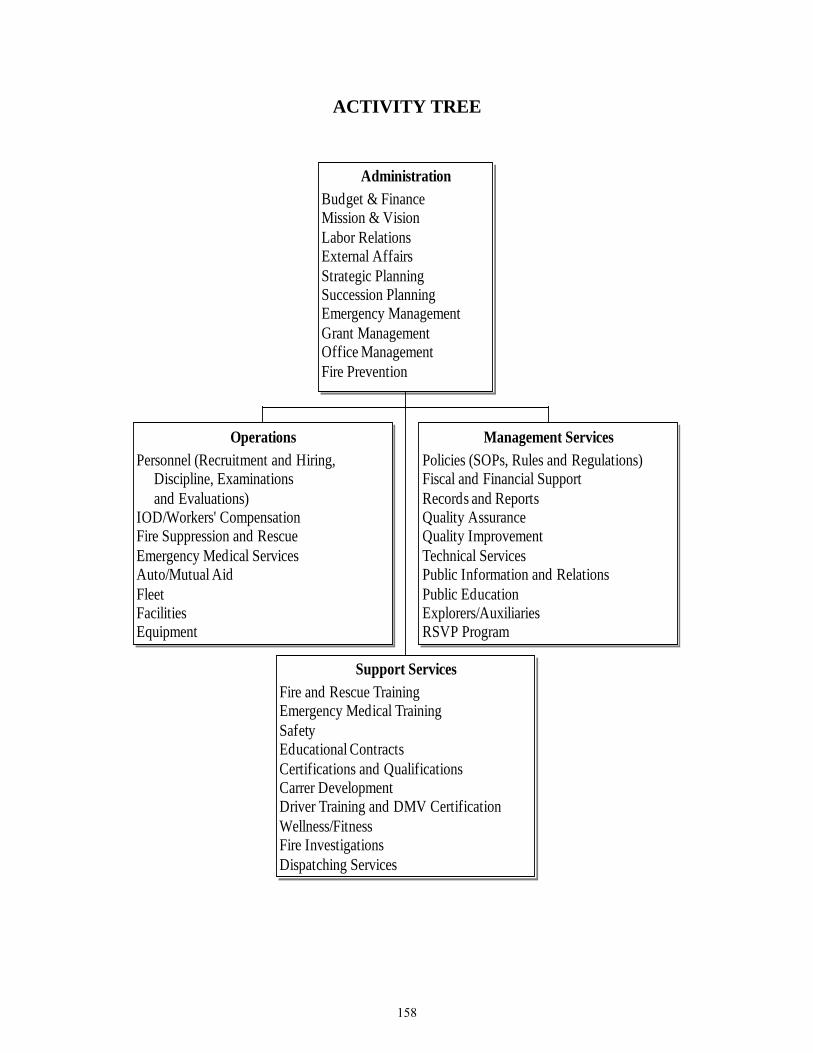
ACTIVITY TREE
AdministrationBudget & FinanceMission & VisionLabor RelationsExternal AffairsStrategic PlanningSuccession PlanningEmergency ManagementGrant ManagementOffice ManagementFire Prevention
OperationsPersonnel (Recruitment and Hiring, Discipline, Examinations and Evaluations)IOD/Workers' CompensationFire Suppression and Rescue Emergency Medical ServicesAuto/Mutual AidFleetFacilitiesEquipment
Support ServicesFire and Rescue TrainingEmergency Medical TrainingSafetyEducational ContractsCertifications and QualificationsCarrer DevelopmentDriver Training and DMV CertificationWellness/FitnessFire InvestigationsDispatching Services
Management ServicesPolicies (SOPs, Rules and Regulations)Fiscal and Financial SupportRecords and ReportsQuality AssuranceQuality ImprovementTechnical ServicesPublic Information and RelationsPublic EducationExplorers/AuxiliariesRSVP Program
158
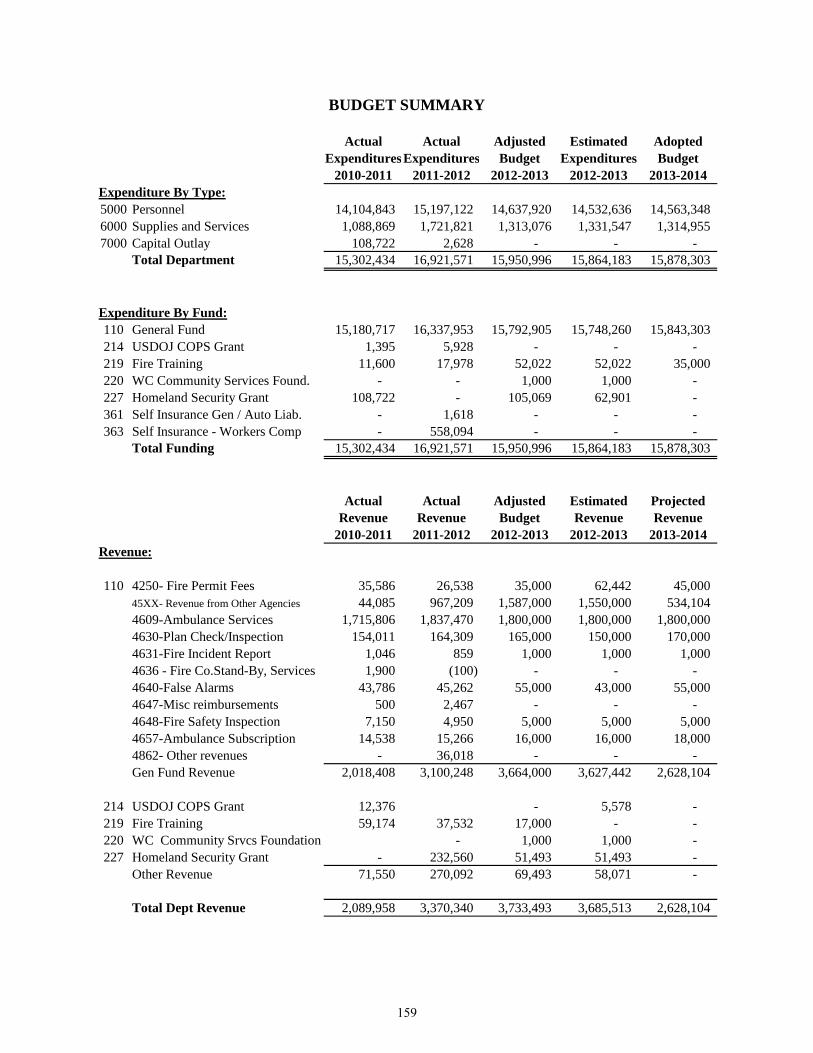
BUDGET SUMMARY
Actual Actual Adjusted Estimated AdoptedExpendituresExpenditures Budget Expenditures Budget
2010-2011 2011-2012 2012-2013 2012-2013 2013-2014Expenditure By Type:5000 Personnel 14,104,843 15,197,122 14,637,920 14,532,636 14,563,348 6000 Supplies and Services 1,088,869 1,721,821 1,313,076 1,331,547 1,314,955 7000 Capital Outlay 108,722 2,628 - - -
Total Department 15,302,434 16,921,571 15,950,996 15,864,183 15,878,303
Expenditure By Fund:110 General Fund 15,180,717 16,337,953 15,792,905 15,748,260 15,843,303 214 USDOJ COPS Grant 1,395 5,928 - - - 219 Fire Training 11,600 17,978 52,022 52,022 35,000 220 WC Community Services Found. - - 1,000 1,000 - 227 Homeland Security Grant 108,722 - 105,069 62,901 - 361 Self Insurance Gen / Auto Liab. - 1,618 - - - 363 Self Insurance - Workers Comp - 558,094 - - -
Total Funding 15,302,434 16,921,571 15,950,996 15,864,183 15,878,303
Actual Actual Adjusted Estimated ProjectedRevenue Revenue Budget Revenue Revenue
2010-2011 2011-2012 2012-2013 2012-2013 2013-2014Revenue:
110 4250- Fire Permit Fees 35,586 26,538 35,000 62,442 45,000 45XX- Revenue from Other Agencies 44,085 967,209 1,587,000 1,550,000 534,104 4609-Ambulance Services 1,715,806 1,837,470 1,800,000 1,800,000 1,800,000 4630-Plan Check/Inspection 154,011 164,309 165,000 150,000 170,000 4631-Fire Incident Report 1,046 859 1,000 1,000 1,000 4636 - Fire Co.Stand-By, Services 1,900 (100) - - - 4640-False Alarms 43,786 45,262 55,000 43,000 55,000 4647-Misc reimbursements 500 2,467 - - - 4648-Fire Safety Inspection 7,150 4,950 5,000 5,000 5,000 4657-Ambulance Subscription 14,538 15,266 16,000 16,000 18,000 4862- Other revenues - 36,018 - - - Gen Fund Revenue 2,018,408 3,100,248 3,664,000 3,627,442 2,628,104
214 USDOJ COPS Grant 12,376 - 5,578 - 219 Fire Training 59,174 37,532 17,000 - - 220 WC Community Srvcs Foundation - 1,000 1,000 - 227 Homeland Security Grant - 232,560 51,493 51,493 -
Other Revenue 71,550 270,092 69,493 58,071 -
Total Dept Revenue 2,089,958 3,370,340 3,733,493 3,685,513 2,628,104
159

Page Intentionally Left Blank
160
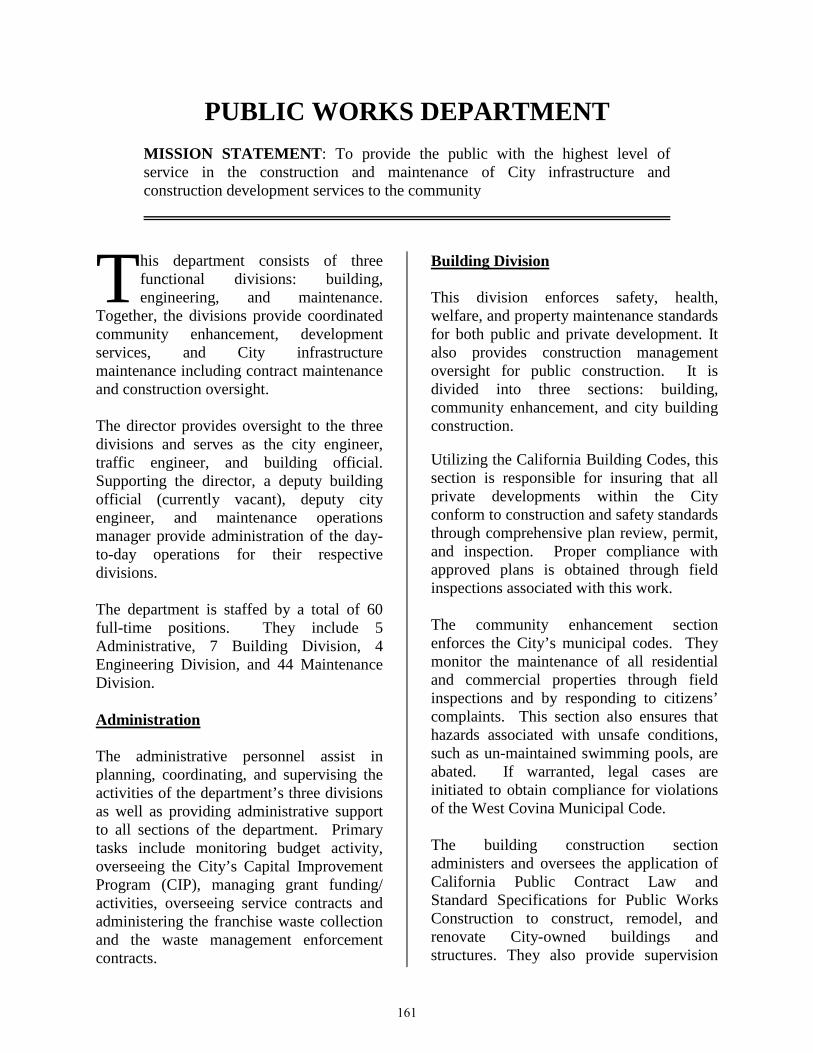
PUBLIC WORKS DEPARTMENT MISSION STATEMENT: To provide the public with the highest level of service in the construction and maintenance of City infrastructure and construction development services to the community
his department consists of three functional divisions: building, engineering, and maintenance.
Together, the divisions provide coordinated community enhancement, development services, and City infrastructure maintenance including contract maintenance and construction oversight.
The director provides oversight to the three divisions and serves as the city engineer, traffic engineer, and building official. Supporting the director, a deputy building official (currently vacant), deputy city engineer, and maintenance operations manager provide administration of the day-to-day operations for their respective divisions.
The department is staffed by a total of 60 full-time positions. They include 5 Administrative, 7 Building Division, 4 Engineering Division, and 44 Maintenance Division.
Administration
The administrative personnel assist in planning, coordinating, and supervising the activities of the department’s three divisions as well as providing administrative support to all sections of the department. Primary tasks include monitoring budget activity, overseeing the City’s Capital Improvement Program (CIP), managing grant funding/ activities, overseeing service contracts and administering the franchise waste collection and the waste management enforcement contracts.
Building Division
This division enforces safety, health, welfare, and property maintenance standards for both public and private development. It also provides construction management oversight for public construction. It is divided into three sections: building, community enhancement, and city building construction.
Utilizing the California Building Codes, this section is responsible for insuring that all private developments within the City conform to construction and safety standards through comprehensive plan review, permit, and inspection. Proper compliance with approved plans is obtained through field inspections associated with this work.
The community enhancement section enforces the City’s municipal codes. They monitor the maintenance of all residential and commercial properties through field inspections and by responding to citizens’ complaints. This section also ensures that hazards associated with unsafe conditions, such as un-maintained swimming pools, are abated. If warranted, legal cases are initiated to obtain compliance for violations of the West Covina Municipal Code.
The building construction section administers and oversees the application of California Public Contract Law and Standard Specifications for Public Works Construction to construct, remodel, and renovate City-owned buildings and structures. They also provide supervision
T
161
and back-up for building inspectors and are the lead workforce for energy efficiency projects. Engineering Division The engineering division is responsible for the oversight of street construction projects/developments, traffic safety, assessment engineering, and sewer/storm water compliance. It is divided into two sections: engineering services, and traffic and lighting services. The engineering services section prepares plans and specifications. It provides field inspections for all engineering CIP projects and processes all related documents. This section also ensures that private developments conform to Conditions of Approval imposed by the Planning Commission and City Council, and adopted City standards through comprehensive plan review. They conduct field inspections and provide assessment district engineering. This section maintains city mapping and processes assessment districts renewals for street lighting, landscaping, and sewers. Additionally, they perform data collection, analysis, and evaluation of the street system, maintenance, and rehabilitation needs, National Pollution Discharge Elimination System (NPDES) compliance, and Sewer System Management Plan (SSMP) as well as contract administration of street projects. In an effort to maintain optimal traffic flow and safety throughout the City, the traffic and lighting section performs traffic safety studies, designs traffic signals, and reviews street lighting designs by private developers. It also maintains and enhances computer operations for both engineering activities
and the City’s computerized traffic signal network system. Other activities include subdivision regulation and right-of-way acquisition, review of lot line adjustments and easements, and annual budget preparation. Maintenance Division This division is responsible for maintaining the infrastructure of the City. The division is divided into five sections: streets/ wastewater, parks, equipment maintenance, environmental services, and electronics maintenance. The street/sewer section repairs and maintains streets, sidewalks, traffic signals, lighting, and sewer/storm drains. It provides street sign fabrication and installation, contract administration for the street sweeping program, and assists other City departments with various projects, such as moving furniture and equipment for civic events. The parks section provides contract administration for the maintenance of parks, landscaped and natural open spaces, and landscaped portions of rights-of-way, medians, street trees, and the Civic Center open areas. It also provides water conservation services and janitorial/building maintenance for all City buildings, including park restrooms and recreation facilities. The equipment maintenance section oversees purchasing and maintenance of all City vehicles and equipment, and manages storage and disposal of hazardous material. It also includes a welding and fabrication shop, the City warehouse, and a facility for compressed fuels.
162
The electronics maintenance section is responsible for the maintenance of all City-owned electronic communications equipment and telephone systems. This includes radios, public address systems, closed circuit TV’s alarms, safety vehicle emergency lighting, sirens, and other electron-mechanical systems. The environmental services section provides assistance to residents and businesses regarding waste collection and the low-
income senior citizen discount program. They also coordinate and promote waste reduction, reuse, and recycling events such as Clean Up Saturdays, Christmas tree recycling, Earth Day, Arbor Day, America Recycles Day, beverage container recycling/litter reduction, used oil/oil filter recycling, bi-monthly electronic waste collections, “sharps” container collection, and annual household hazardous waste roundups.
163
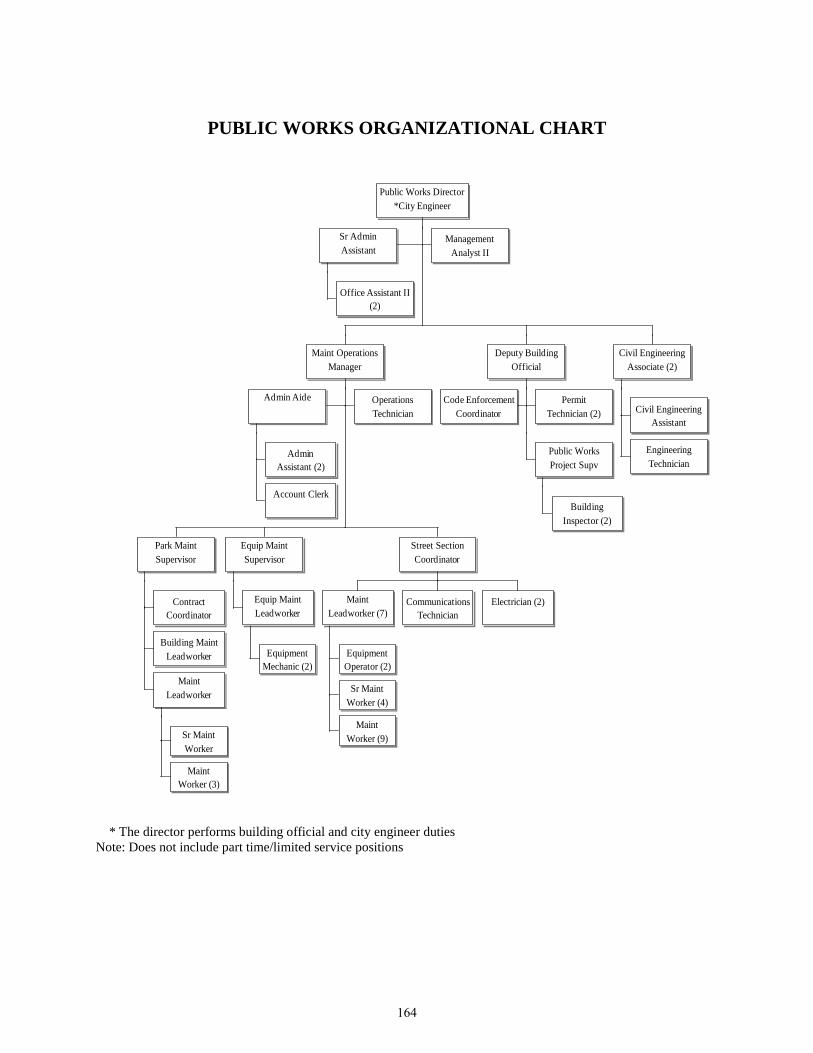
PUBLIC WORKS ORGANIZATIONAL CHART
* The director performs building official and city engineer duties Note: Does not include part time/limited service positions
Public Works Director*City Engineer
Sr AdminAssistant
Office Assistant II(2)
ManagementAnalyst II
Maint OperationsManager
Admin Aide
AdminAssistant (2)
Account Clerk
OperationsTechnician
Park MaintSupervisor
ContractCoordinator
Building MaintLeadworker
MaintLeadworker
Sr MaintWorker
MaintWorker (3)
Equip MaintSupervisor
Equip MaintLeadworker
EquipmentMechanic (2)
Street SectionCoordinator
MaintLeadworker (7)
EquipmentOperator (2)
Sr MaintWorker (4)
MaintWorker (9)
CommunicationsTechnician
Electrician (2)
Deputy BuildingOfficial
Code EnforcementCoordinator
PermitTechnician (2)
Public WorksProject Supv
BuildingInspector (2)
Civil EngineeringAssociate (2)
Civil EngineeringAssistant
EngineeringTechnician
164
FY 2012-2013 ACCOMPLISHMENTS
Administration • Handled over 29,000 outside calls. • West Covina facilities have reduced
their electricity costs by more than $184,000 annually by installing energy saving equipment.
• Obtained EA 22 Local Enforcement
Agency Grant, totaling $15,720, from the California Integrated Waste Management Board for the solid waste permit and inspection program for the BKK Landfill.
• Applied for and received “Tree City
USA” recertification for the 31st consecutive year and the 9th Growth Award from the National Arbor Day Foundation.
• Applied for and awarded $60,000 grant
from Los Angeles County Competitive Tree Planting Grant Program to plant trees lost in windstorm, trees that were lost due to vandalism, and trees needed to shade existing recreation areas.
• Applied for and awarded $300,000
MSRC Clean Transportation Grant Funding to upgrade City’s compressed natural gas (CNG) station.
• Coordinated the 32nd annual Arbor Day
celebration with the assistance of West Covina Beautiful held at Galster Park.
Building Division • Provided plan review and inspection
services for construction activity in the City of over $33,000,000 valuation
includes construction at the Eastland Center (major projects include redevelopment of the old Mervyns space into Walmart, old Babies R Us into Ashley Furniture, transforming abandoned satellite building into 3 dining establishments, and a wireless phone store).
• Provided oversight to development of
tenant spaces at Westfield for Off Broadway shoes, Paris Baguette, Sketchers, Cotton On, and many other retail stores.
• Provided oversight to development of
Chase bank on north Azusa. • Provided in-house plans review service
to save approximately $165,000 in fees for the City that would have gone to an outside consultant.
• An expedited plan check process is
ongoing and has been very successful in providing developers an opportunity to have their plans reviewed and returned within seven to ten business days in most cases.
• Secured "Platinum" & "Beacon" awards
for energy efficiency and conservation projects and savings.
• Performed audits for sports field lighting
and sports buildings.
• Performed audit and retrofit of city-owned streetlights.
• Completed Energy Efficiency
Conservation Block Grant (EECBG) prime contracts.
• Completed Green-House Gas survey and
City's new Energy Action Plan.
165

• Replaced Electric Vehicle Charging stations at City Hall & Westfield Mall.
• Performed Efficiency upgrades at
Edgewood swimming pool.
• Designed and installation of Enterprise Energy Management Information System (EEMIS) energy-use tracking system.
• Managed and completed numerous City CIP projects such as: construction of Provide ADA upgrades of the City pool, construction of Tot Lot at Del Norte Park, construction of Dog Park at Del Norte Park, and repairing Nature Trail at Galster Park. Developing plans and specifications to repair Nature Trail at Heritage Park.
• Community enhancement received over
2,600 calls and assisted in resolving over 1,300 properties and zoning violations. The administrative citation process and voluntary compliance statistics are resulting in less than 2 percent of the cases being sent to the city prosecutor. Due to staffing and the load of property complaints, very little proactive code enforcement can be conducted.
Engineering Division • Completed the design and inspection of
12 capital improvement projects at a combined cost of about $5.3 million. The projects consisted of rehabilitating about 6.3 miles of major and residential roadways, including sidewalk and curb and gutter replacement and repair, installation of wheelchair ramps, striping, and modification of traffic signals.
• Provided plan review and inspection services for construction activity in the City to include L.A. Fitness, McDonalds, El Pollo Loco, Brandywines Homes development, Centre Lake Imaging Lab, and six minor private residential and commercial grading projects.
• Implements and manage all ongoing
National Pollutant Discharge Elimination System (NPDES) and Sanitary Sewer Management Plan (SSMP) requirements.
• Completed final design and federal grant
requirements for the Amar Road rehabilitation. Project consists of A.C. pavement resurfacing, curb and gutter and sidewalk repairs
• The traffic section has completed several
traffic volume and speed studies, needed to complete the evaluation of vehicular and pedestrian safety issues, and several surveys to establish restricted parking zones as requested by residents.
• Traffic studies for various developments
were reviewed to determine the impact from vehicular traffic generated by the new developments on existing facilities.
• Completed modification of the traffic
signal at the intersection of Puente Avenue and Lark Ellen Avenue.
• Applied for a Safe Routes to School
grant to encourage students to walk and bike to school by providing a safer environment along the routes to school.
• Coordinated with Los Angeles County
on the San Gabriel Valley Traffic Signal Synchronization Project (TSSP) for several identified locations.
166
• Coordinated with Los Angeles County on the Traffic System Management program to implement MTA’s Intelligent Transportation Systems for regional arterials to improve traffic flow and enhance arterial capacity in a cost effective way.
Maintenance Division
• Received over 3,000 residential service requests for issues such as potholes, tree maintenance, raised sidewalks, graffiti, trash service, and sewer issues.
• Upgrade of sewer pump station at Police Department
• Repaired 20 sewer manholes.
• Repaired 50 sewer mainline locations. • Cleaned 130 miles of sewer main lines. • Inspected 50-miles of sewer main lines.
• Repaired 5 miles of broken sewer line
with new trenchless sewer repair.
• Pavement striping city streets in 4 grids. • Repaired damaged asphalt at major
intersections. • Repaired lifted sidewalks in 3 grids.
• Obtained California Beverage Container
Recycling and Litter Reduction Grants, totaling $27,931, from CalRecycle for promotion of bottle/can recycling and litter reduction. Continuing to promote the CRV program for youth teams.
• Obtained Used Oil Payment Program OPP3 totaling $30,243 from CalRecycle
for promotion and operation of the used oil and used oil filter recycling program. Expended $31,170 to promote the recycling of used oil and used oil filter. Initiated a new oil filter exchange program in coordination with local Certified Collection Centers.
• Hosted the City's Earth Day / Arbor Day
celebration in coordination with West Covina Beautiful and the YMCA, with over 300 attendees, to promote community awareness of the importance of recycling and purchasing recycled-content products.
• Serviced over 300 residents with our
Sharps collection unit. Collecting over 770 lbs of sharps.
• Collected over 57,000 lbs of electronic
waste at bi-monthly collection events.
• Approved, renewed, and processed over 680 low-income senior citizen waste
collection discount applications.
167

FY 2013-2014 GOALS AND OBJECTIVES
Administration • Oversee department operations to ensure
essential services are provided and the City’s infrastructure is maintained.
• Work with CalTrans on the implementation of HOV Lane on the IS-10 Freeway.
• Capital Improvement Projects: o Maintain monthly status of hours
charged to capital improvement projects.
o Review project and budget status on monthly basis with CIP committee.
• Review public works operating budget
on a monthly basis and make mid-year adjustments when warranted.
• Continue to explore potential budget reductions that have minimal impact on the department and community.
• Research grant opportunities to fund
street, park, landscape, safety, conservation, and environmental programs/projects as well as alternative fuel vehicles and fueling stations.
• Manage and monitor AQMD (AB2766)
subvention funds. o Define funding availability, and
establish budget and potential projects.
o Compile and submit annual report. o Monitor revenue and expenses.
• Compile and submit Annual Rule 2202
Air Quality Improvement Program compliance Registration Form to AQMD.
• Manage and monitor Local Enforcement Agency Grant. o Compile and submit grant
application for funding. o Compile and submit annual report. o Monitor revenue and expenses.
• Submit application for Tree City USA Recertification.
Building Division • Develop Energy Efficient program
objectives for City facilities utilizing federal grants.
• Develop ADA Action Plan to upgrade
city facilities to meet the requirements of the 2010 ADA standards for design.
• Maintain two-week plan check turn-around and next-day building inspection schedule, and monitor plan check log and construction projects to minimize delays.
• Continue in-house plan review to curb
department expenses. • Develop new handouts and policies to
assist the public in understanding code requirements and the permitting process.
• Maintain standard (45 per week) for
weekly field inspections per community enhancement officer.
• Revise standard for follow-up
inspections on code enforcement complaints and administrative fines within four days of due date due to staffing shortage.
• Reduce total city prosecutor referrals for
code enforcement cases - less than 5% of total caseload per month.
168
Engineering Division • Curb and gutter program.
o Identify location for improvements – September 2013.
o Field survey locations – October 2013.
o Prepare plans and specification – December 2013.
o Advertise for bids, review bids award contract – February 2014.
o Complete installation of improvements – April 2014.
• Sidewalk installation.
o Obtain budget approval – August 2013.
o Field survey – September 2013. o Prepare plans and specification –
November 2013. o Advertise for bids, review bids,
award contract – December 2013. o Complete installation of
improvements – March 2014.
• Residential streets rehabilitation and barrier removal. o Identify location for improvements
– November 2013. o Prepare plans and specification –
December 2013. o Advertise for bids, review bids,
award contract – February 2014. o Complete installation of
improvements – April 2014.
• Major Street Rehabilitation. o Budget approval – August 2013. o Street selection – December
2013. o Field Survey – February 2014. o Prepare plans and specifications
– March 2014. o Advertise for bids, review bids
award contract – April 2014.
o Complete construction – July 2014.
• Street widening and traffic signal
modification at Azusa Avenue and Amar Road.
o Complete construction of improvements – September 2013.
• Installation of new Traffic Management
Center (TMC). o Install new hardware and software
for TMC October 2013. • Installation of bus shelters and Big Belly
Solar at eight locations with high bus ridership.
o Budget approval – August 2013. o Prepare plans and specifications
– September 2013. o Obtain for quotes, – November
2013. o Complete construction – March
2014.
• Maintain two-week plan check turn-around and next-day inspection schedule, and monitor plan check log.
• Continue in-house plan review to curb
department expenses. Maintenance Division • Install overflow sensor at Quail Valley
sewer lift station
• Repair 30 sewer manholes.
• Repair 75 sewer mainline locations.
• Clean 130 miles of sewer main line locations.
• Inspect 45 miles of sewer mainlines.
169
• Continue trenchless sewer repair citywide.
• Repair lifted sidewalks in three grids.
• Pavement striping of streets citywide in 3 grids.
• Install 10 storm drain screens.
• Increase the number of used oil and oil filter recycling education events and public participation by 10% through attendance at community events and collection center promotions.
• Continue to fulfill the communities’ need with further promotion of the Sharps collection unit.
• Continue to promote the Low-Income
Senior Citizen Waste Collection and Dog License Discount programs.
• Continue to promote the CRV program
for youth and other community groups.
• Implement a city supported and recognized volunteer program whose goals are to recruit active participation of citizens in our community to promote a clean, green, and healthy West Covina.
170
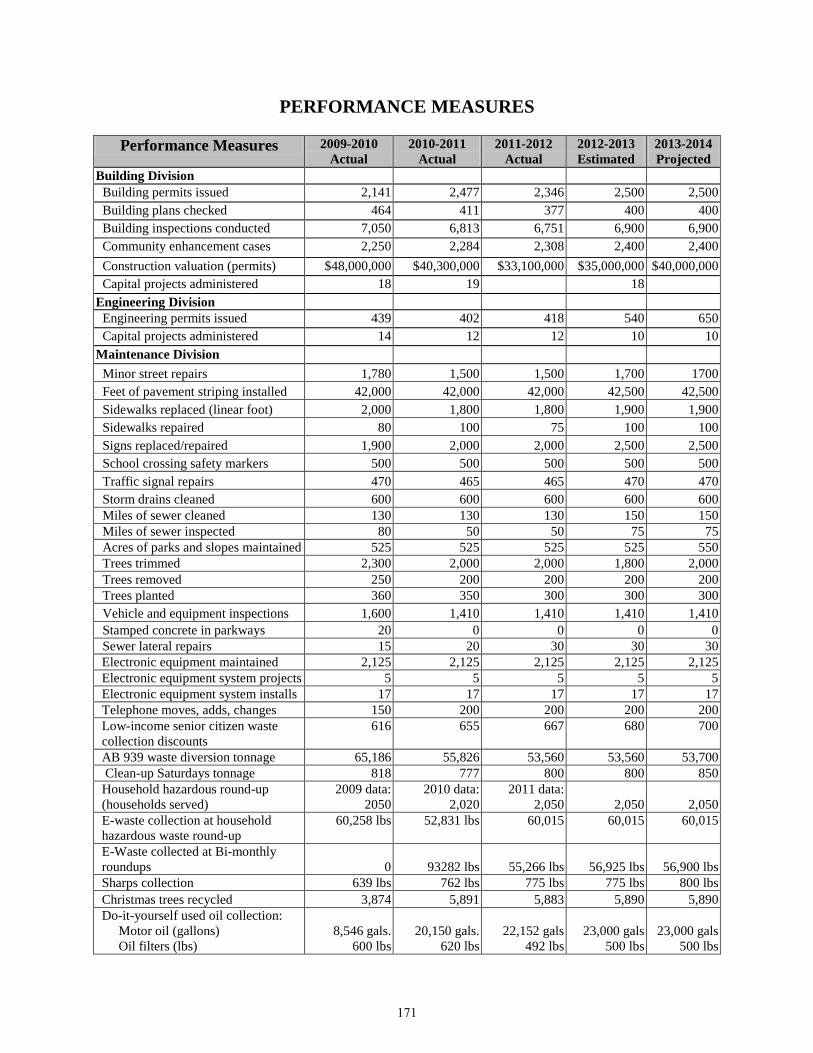
PERFORMANCE MEASURES
Performance Measures 2009-2010 Actual
2010-2011 Actual
2011-2012 Actual
2012-2013 Estimated
2013-2014 Projected
Building Division Building permits issued 2,141 2,477 2,346 2,500 2,500 Building plans checked 464 411 377 400 400 Building inspections conducted 7,050 6,813 6,751 6,900 6,900 Community enhancement cases 2,250 2,284 2,308 2,400 2,400 Construction valuation (permits) $48,000,000 $40,300,000 $33,100,000 $35,000,000 $40,000,000 Capital projects administered 18 19 18 Engineering Division Engineering permits issued 439 402 418 540 650 Capital projects administered 14 12 12 10 10 Maintenance Division Minor street repairs 1,780 1,500 1,500 1,700 1700 Feet of pavement striping installed 42,000 42,000 42,000 42,500 42,500 Sidewalks replaced (linear foot) 2,000 1,800 1,800 1,900 1,900 Sidewalks repaired 80 100 75 100 100 Signs replaced/repaired 1,900 2,000 2,000 2,500 2,500 School crossing safety markers 500 500 500 500 500 Traffic signal repairs 470 465 465 470 470 Storm drains cleaned 600 600 600 600 600 Miles of sewer cleaned 130 130 130 150 150 Miles of sewer inspected 80 50 50 75 75 Acres of parks and slopes maintained 525 525 525 525 550 Trees trimmed 2,300 2,000 2,000 1,800 2,000 Trees removed 250 200 200 200 200 Trees planted 360 350 300 300 300 Vehicle and equipment inspections 1,600 1,410 1,410 1,410 1,410 Stamped concrete in parkways 20 0 0 0 0 Sewer lateral repairs 15 20 30 30 30 Electronic equipment maintained 2,125 2,125 2,125 2,125 2,125 Electronic equipment system projects 5 5 5 5 5 Electronic equipment system installs 17 17 17 17 17 Telephone moves, adds, changes 150 200 200 200 200 Low-income senior citizen waste collection discounts
616 655 667 680 700
AB 939 waste diversion tonnage 65,186 55,826 53,560 53,560 53,700 Clean-up Saturdays tonnage 818 777 800 800 850 Household hazardous round-up (households served)
2009 data: 2050
2010 data: 2,020
2011 data: 2,050 2,050 2,050
E-waste collection at household hazardous waste round-up
60,258 lbs 52,831 lbs 60,015 60,015 60,015
E-Waste collected at Bi-monthly roundups 0 93282 lbs 55,266 lbs 56,925 lbs 56,900 lbs Sharps collection 639 lbs 762 lbs 775 lbs 775 lbs 800 lbs Christmas trees recycled 3,874 5,891 5,883 5,890 5,890 Do-it-yourself used oil collection: Motor oil (gallons) Oil filters (lbs)
8,546 gals.
600 lbs
20,150 gals.
620 lbs
22,152 gals
492 lbs
23,000 gals
500 lbs
23,000 gals
500 lbs
171

APPROVED POSITIONS
Title
Administrative Division
Full -Time PositionsPublic Works Director/City Engineer (1) 1.00 1.00 1.00 1.00 1.00Management Analyst II 1.00 1.00 1.00 1.00 1.00Sr Administrative Assistant 1.00 1.00 1.00 1.00 1.00Administrative Asst I 1.00 1.00 1.00 1.00 1.00Office Assistant II 1.00 1.00 1.00 1.00 1.00Full-Time Total 5.00 5.00 5.00 5.00 5.00
Building Division
Full -Time PositionsBuilding Official 1) 0.00 0.00 0.00 0.00 0.00Deputy Building Official 1.00 1.00 1.00 1.00 1.00Public Works Project Supervisor 1.00 1.00 1.00 1.00 1.00Senior Community Enhancement Officer 1.00 1.00 1.00 0.00 10) 0.00 10)
Building Inspector 2.00 2.00 2.00 2.00 2.00Building Permit Technician 2.00 2.00 2.00 2.00 2.00Community Enhancement Officer 2.00 2.00 2.00 0.00 9) 0.00 9)
Code Enforcement Coordinator 0.00 0.00 0.00 1.00 9) 1.00 9)
Construction Coordinator 1.00 1.00 1.00 0.00 10) 0.00 10)
Engineering Technician 1.00 1.00 1.00 0.00 10) 0.00 10)
Full-Time Total 11.00 11.00 11.00 7.00 7.00
Full-time Equivalent (FTE)Office Aide III 0.75 0.75 0.75 0.75 0.75FTE Total 0.75 0.75 0.75 0.75 0.75
Building Division Total 11.75 11.75 11.75 7.75 7.75
FY 09-10 FY 10-11 FY 11-12 FY 12-13 FY 13-14
172
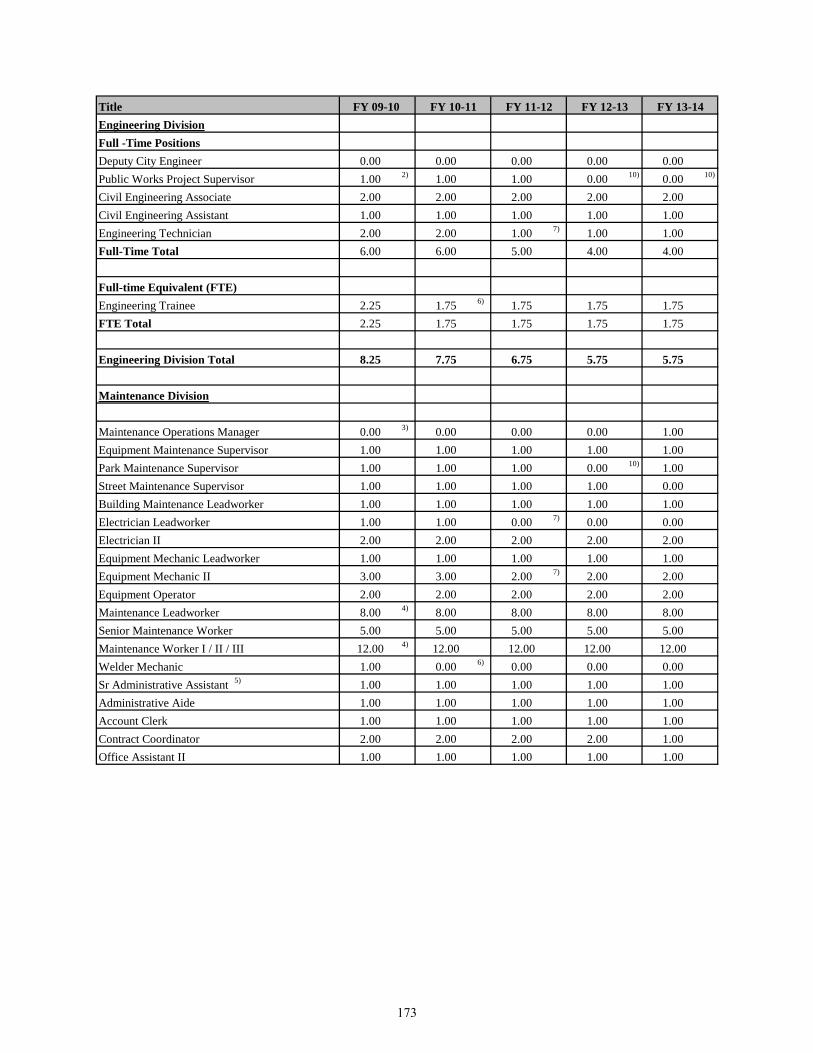
TitleEngineering DivisionFull -Time PositionsDeputy City Engineer 0.00 0.00 0.00 0.00 0.00Public Works Project Supervisor 1.00 2) 1.00 1.00 0.00 10) 0.00 10)
Civil Engineering Associate 2.00 2.00 2.00 2.00 2.00Civil Engineering Assistant 1.00 1.00 1.00 1.00 1.00Engineering Technician 2.00 2.00 1.00 7) 1.00 1.00Full-Time Total 6.00 6.00 5.00 4.00 4.00
Full-time Equivalent (FTE)Engineering Trainee 2.25 1.75 6) 1.75 1.75 1.75FTE Total 2.25 1.75 1.75 1.75 1.75
Engineering Division Total 8.25 7.75 6.75 5.75 5.75
Maintenance Division
Maintenance Operations Manager 0.00 3) 0.00 0.00 0.00 1.00Equipment Maintenance Supervisor 1.00 1.00 1.00 1.00 1.00Park Maintenance Supervisor 1.00 1.00 1.00 0.00 10) 1.00Street Maintenance Supervisor 1.00 1.00 1.00 1.00 0.00Building Maintenance Leadworker 1.00 1.00 1.00 1.00 1.00Electrician Leadworker 1.00 1.00 0.00 7) 0.00 0.00Electrician II 2.00 2.00 2.00 2.00 2.00Equipment Mechanic Leadworker 1.00 1.00 1.00 1.00 1.00Equipment Mechanic II 3.00 3.00 2.00 7) 2.00 2.00Equipment Operator 2.00 2.00 2.00 2.00 2.00Maintenance Leadworker 8.00 4) 8.00 8.00 8.00 8.00Senior Maintenance Worker 5.00 5.00 5.00 5.00 5.00Maintenance Worker I / II / III 12.00 4) 12.00 12.00 12.00 12.00Welder Mechanic 1.00 0.00 6) 0.00 0.00 0.00Sr Administrative Assistant 5) 1.00 1.00 1.00 1.00 1.00Administrative Aide 1.00 1.00 1.00 1.00 1.00Account Clerk 1.00 1.00 1.00 1.00 1.00Contract Coordinator 2.00 2.00 2.00 2.00 1.00Office Assistant II 1.00 1.00 1.00 1.00 1.00
FY 12-13FY 09-10 FY 10-11 FY 11-12 FY 13-14
173
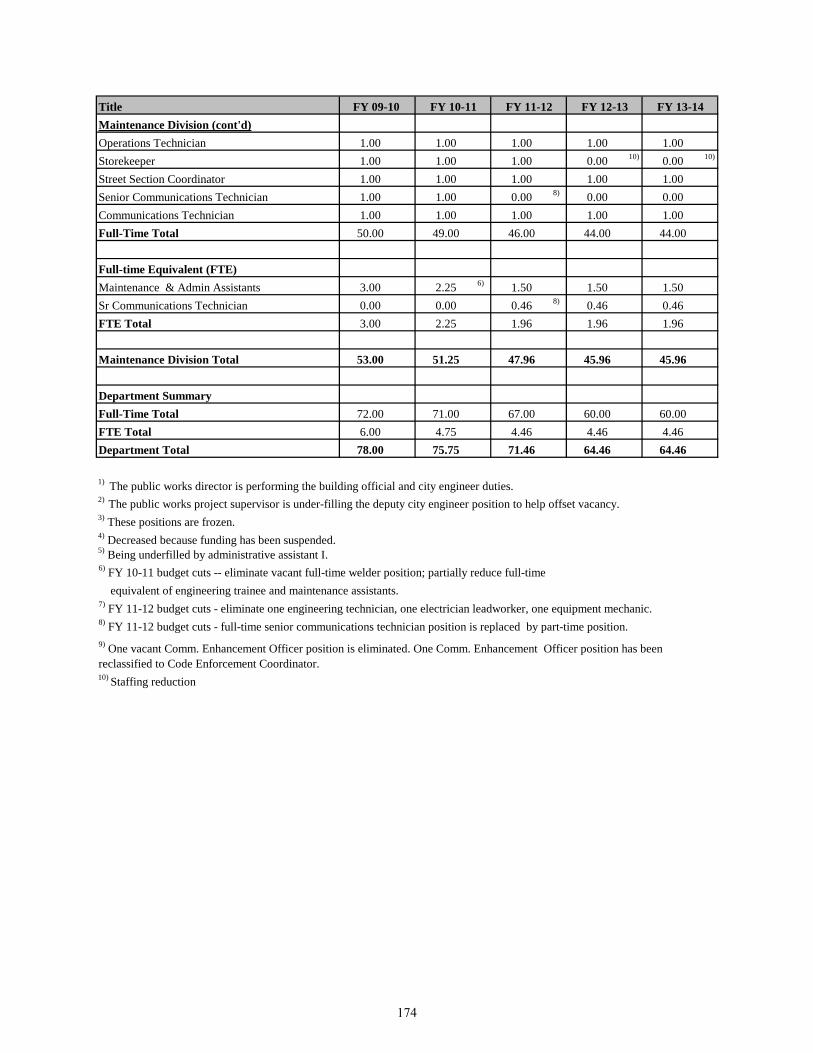
TitleMaintenance Division (cont'd)Operations Technician 1.00 1.00 1.00 1.00 1.00Storekeeper 1.00 1.00 1.00 0.00 10) 0.00 10)
Street Section Coordinator 1.00 1.00 1.00 1.00 1.00Senior Communications Technician 1.00 1.00 0.00 8) 0.00 0.00Communications Technician 1.00 1.00 1.00 1.00 1.00Full-Time Total 50.00 49.00 46.00 44.00 44.00
Full-time Equivalent (FTE)Maintenance & Admin Assistants 3.00 2.25 6) 1.50 1.50 1.50Sr Communications Technician 0.00 0.00 0.46 8) 0.46 0.46FTE Total 3.00 2.25 1.96 1.96 1.96
Maintenance Division Total 53.00 51.25 47.96 45.96 45.96
Department SummaryFull-Time Total 72.00 71.00 67.00 60.00 60.00FTE Total 6.00 4.75 4.46 4.46 4.46Department Total 78.00 75.75 71.46 64.46 64.46
1) The public works director is performing the building official and city engineer duties.
5) Being underfilled by administrative assistant I.6) FY 10-11 budget cuts -- eliminate vacant full-time welder position; partially reduce full-time
FY 09-10 FY 10-11 FY 11-12 FY 12-13
10) Staffing reduction
9) One vacant Comm. Enhancement Officer position is eliminated. One Comm. Enhancement Officer position has been reclassified to Code Enforcement Coordinator.
4) Decreased because funding has been suspended.
equivalent of engineering trainee and maintenance assistants.7) FY 11-12 budget cuts - eliminate one engineering technician, one electrician leadworker, one equipment mechanic.8) FY 11-12 budget cuts - full-time senior communications technician position is replaced by part-time position.
FY 13-14
2) The public works project supervisor is under-filling the deputy city engineer position to help offset vacancy.3) These positions are frozen.
174

BUDGET COMMENTS
This year is a “roll-over” budget with the exception of the notable increase in water costs over this past year. This is due to a large increase in water rates from the water purveyors as well as extra irrigating required due to drought conditions. All of the reductions in funding and services initiated in previous years will remain in effect this year and are shown under “Budget Issues.” The public works director continues to perform the duties of city engineer and building official as well as supervise code enforcement. The department budget continues to reallocate the funding sources of staff positions according to each person’s revised responsibilities. This is due to changes and/or additional job duties from vacancies. 14 vacant positions have been “unfunded” over the last couple years including:
• Community Enhancement Officer • Sr. Community Enhancement Officer • Contract Coordinator • Electrical Leadworker • (2) Engineering Technician • Equipment Mechanic • (2) Maintenance Workers • Maintenance Leadworker • Storekeeper • Street Maintenance Supervisor • Sr. Communications Technician • Welder Mechanic
The department is under-filling the street maintenance supervisor and a senior administrative assistant position. In addition, there are two part-time employees filling the
positions of senior communications technician and construction coordinator. The line item Special Assignment Pay (object 5126) is composed of personnel costs associated with CIP projects. It has been reduced due to a lack of funding for CIP projects and a reduction in number of staff charging to projects. The various line items are as follows: 110-4120 (building) $21,000 110-4144 (city buildings) $20,000 110-4130 (engineering) $8,000 122-4132 (pavement mgnt) $37,000 124-4131 (traffic engineering) $37,100 189-4133 (sewer district eng) $53,000 Total Cost $176,100
BUDGET ISSUES The department continues to undergo significant changes with the elimination of funding and staffing. Job duties have been combined and workloads have been increased significantly. Administrative staff has been assigned numerous job tasks previously performed by other City staff. This includes the (BKK) landfill permitting, inspect, and reporting (LEA) program for solid waste; the monitoring and reporting to SCAQMD in compliance with AB2766 and Rule 2202; and activities and programs related to the environment and waste reduction. Code enforcement caseload backlog has increased from 175 to 340 over the past year due to staff vacancies. With the elimination of a code enforcement officer and senior community enhancement officer, there is only one code enforcement coordinator available for the entire City. General standards for a City of this size range from five to eight officers.
175
Traffic safety funding was eliminated and personnel funding was reallocated to Fund 124 Gas Tax. One limited service engineering trainee assigned to traffic related duties was eliminated. The amount of time to review and investigation of residential requests for traffic related issues has increased. Base maps need to be continually updated. This work is labor intensive and has been delayed due to the elimination of numerous full-time and limited service positions. City’s Sewer System Management Plan (SSMP) as required by the State Water Resources Control Board has been approved and certified. The SSMP set goals and actions to be followed by the City that include evaluation, documentation, and evaluation of the sewer system. The evaluation of the sewer system identified eight segment of mainline that at their capacity and require upgrading. Those mainline segments equal about 19,000 linear feet with an estimated cost to upgrade at $7.25 million. The maintenance division has really been impacted by the reduction in funding and the reduction of 16 positions over the past couple years. Employees are taking on additional tasks and responsibilities, some non-vital work is being abridged, and more work is also being contracted out. All of these extra responsibilities and lack of time and personnel to complete some urgent jobs that would normally be performed during normal working hours has caused the maintenance operations manager, the acting street maintenance supervisor, and others to work overtime on weekends and after hours to perform striping jobs and emergency repair work.
Numerous crews have been eliminated including the weed abatement, pesticide, and concrete (curb & gutter) crew. Most of the work being done in-house is “reactive.” Some of this work is being contracted out and some of the work is performed in-house by breaking down other crews and reassigning them to other tasks. Citywide electrical costs have exceeded the amount being assessed. This has caused a reduction in the amount of Citywide funds available for tree maintenance services. This reduction has severely impacted grid trimming. Environmental services has been trying to expand their public outreach programs, most of which are to comply with SB 939 waste reduction requirements. However, the limited amount of staff available to assist with the programs has also limited the number of programs available to the public. The lack of funding and reduction of public works staff has resulted in numerous changes in the department’s services and operations such as: • Eliminated general fund overtime except
for emergencies. • Eliminated special/non-vital purchases,
increased in-house plan checks. • Reduced employee training. • Deferred maintenance of sports
facilities. • Eliminated non-vital purchases. • Eliminated holiday lighting. • Eliminated numerous cell phones,
reduced park/median maintenance, reduced janitorial services, and eliminated extra maintenance work for sports leagues.
• Elimination of internet access “Verizon Cards” on laptop field computers for community enhancement, building, and
176

engineering staff, taking away the ability to access and input pertinent data while in the field.
• Reduced median landscape maintenance contract.
• Reduced Civic Center and park landscape maintenance contract.
• Reduced watering in parks and medians. • Deferred building and facility
maintenance. • Deferred purchases of new vehicles and
equipment which results in more staff time and increased costs for repairs.
177

ACTIVITY TREE
Public Works Administration
Manage Building, Engineering Maintenance Divisions, Administration of Capital Improvement Program, Clerical
Support
Maintenance Division
Park Maintenance SectionContract Maintenance Parks Trees Medians Civic Center Maintenance Districts 1, 2, 4, 6, 7, CSS Building MaintenancePark Restroom MaintenanceIrrigation Maintenance/Water ConservationMunicipal Pool Maintenance
Equipment Maintenance SectionVehicle/Equipment Maintenance/RepairFuel Storage/Distribution/AdministrationCitywide Generator Service/RepairWelding/FabricationHazmat Storage/Disposal
Street Maintenance SectionStreet Sweeping Contract ManagementAsphalt Crew (1) Asphalt/Pothole RepairsConcrete Crews (2) Curb/Gutter Repair/Replace Sidewalk Repair/ReplaceSewer Crews (3) West Covina Sewer Maintenance Covina Sewer Maintenance Storm Drain Maintenance Freeway Lift Station Maintenance/RepairPaint/Sign Crew Street Sign Fabrication/Installation Street Pavement Striping/Legends Installation/Removal of Overhead Banners Graffiti AbatementUtility Crew Assisting With Special Events Assisting Dpts. Moving Furniture/Minor Repairs Assists Other CrewsPesticide Crew Weed Abatement Abatement of Standing WaterElectrical Crew Traffic Signal Maintenance Paseo Lighting Replacement/RepairsRight of Way Crew
Electronics Maintenance SectionPublic Safety/Public Works Radio/ComponentCity Facilities Security Camera/Alarm SystemCitywide Wireless NetworkCitywide Telephone Changes/MovesCitywide Telephone SystemPublic Safety Vehicle Electronic Warning SystemCell Tower Lease Management
Environmental Services SectionAir Quality Management District Program GrantFranchise Waste Collection/AB939 Waste ReductionUsed Oil Program GrantCRV Program GrantReuse, Recycle, Reduce Community Programs
Building Division
Plan CheckPermit IssuanceIn-House Plan ChecksContractual Plan ChecksAdministration
Building Construction/InspectionField InspectionsCapital Improvement Project Oversight
Community EnhancementMunicpal Code EnforcementZoning Code EnforcementReceivershipsNPDES Inspections/EnforcementSign Removal Contract AdministrationShopping Cart Retrival Contract Administration
Engineering Division
Engineering ServicesPrepare Plans and Specifications for CIP ProjectsProvide Field Inspection/Construction Mgt for CIPPrivate Development Plan Check and Field InspectionProvide Assessment EngineeringPavement ManagementNPDES Regulatory ManagementCustomer Service
Traffic/Lighting ServicesPrepare Plans and Specifications for CIP ProjectsPrivate Development Plan CheckConduct Traffic Studies/SurveysCustomer Service
178
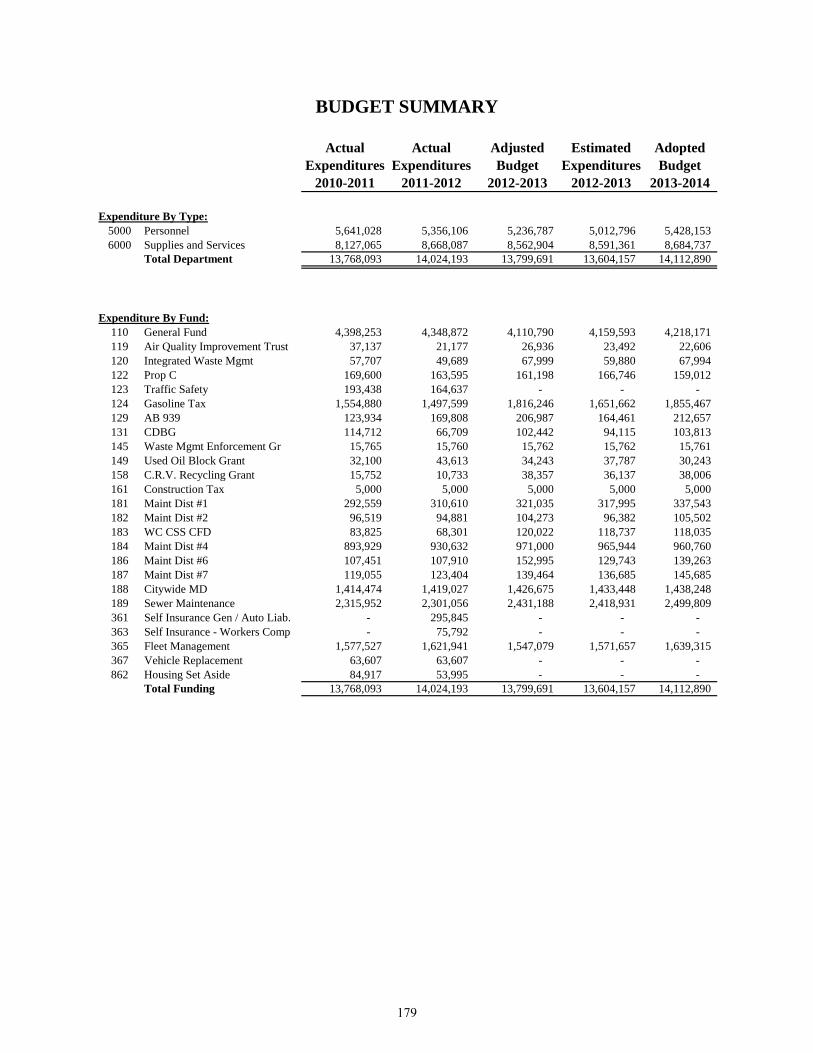
BUDGET SUMMARY
Actual Actual Adjusted Estimated AdoptedExpenditures Expenditures Budget Expenditures Budget
2010-2011 2011-2012 2012-2013 2012-2013 2013-2014
Expenditure By Type:5000 Personnel 5,641,028 5,356,106 5,236,787 5,012,796 5,428,153 6000 Supplies and Services 8,127,065 8,668,087 8,562,904 8,591,361 8,684,737
Total Department 13,768,093 14,024,193 13,799,691 13,604,157 14,112,890
Expenditure By Fund:110 General Fund 4,398,253 4,348,872 4,110,790 4,159,593 4,218,171 119 Air Quality Improvement Trust 37,137 21,177 26,936 23,492 22,606 120 Integrated Waste Mgmt 57,707 49,689 67,999 59,880 67,994 122 Prop C 169,600 163,595 161,198 166,746 159,012 123 Traffic Safety 193,438 164,637 - - - 124 Gasoline Tax 1,554,880 1,497,599 1,816,246 1,651,662 1,855,467 129 AB 939 123,934 169,808 206,987 164,461 212,657 131 CDBG 114,712 66,709 102,442 94,115 103,813 145 Waste Mgmt Enforcement Gr 15,765 15,760 15,762 15,762 15,761 149 Used Oil Block Grant 32,100 43,613 34,243 37,787 30,243 158 C.R.V. Recycling Grant 15,752 10,733 38,357 36,137 38,006 161 Construction Tax 5,000 5,000 5,000 5,000 5,000 181 Maint Dist #1 292,559 310,610 321,035 317,995 337,543 182 Maint Dist #2 96,519 94,881 104,273 96,382 105,502 183 WC CSS CFD 83,825 68,301 120,022 118,737 118,035 184 Maint Dist #4 893,929 930,632 971,000 965,944 960,760 186 Maint Dist #6 107,451 107,910 152,995 129,743 139,263 187 Maint Dist #7 119,055 123,404 139,464 136,685 145,685 188 Citywide MD 1,414,474 1,419,027 1,426,675 1,433,448 1,438,248 189 Sewer Maintenance 2,315,952 2,301,056 2,431,188 2,418,931 2,499,809 361 Self Insurance Gen / Auto Liab. - 295,845 - - - 363 Self Insurance - Workers Comp - 75,792 - - - 365 Fleet Management 1,577,527 1,621,941 1,547,079 1,571,657 1,639,315 367 Vehicle Replacement 63,607 63,607 - - - 862 Housing Set Aside 84,917 53,995 - - -
Total Funding 13,768,093 14,024,193 13,799,691 13,604,157 14,112,890
179
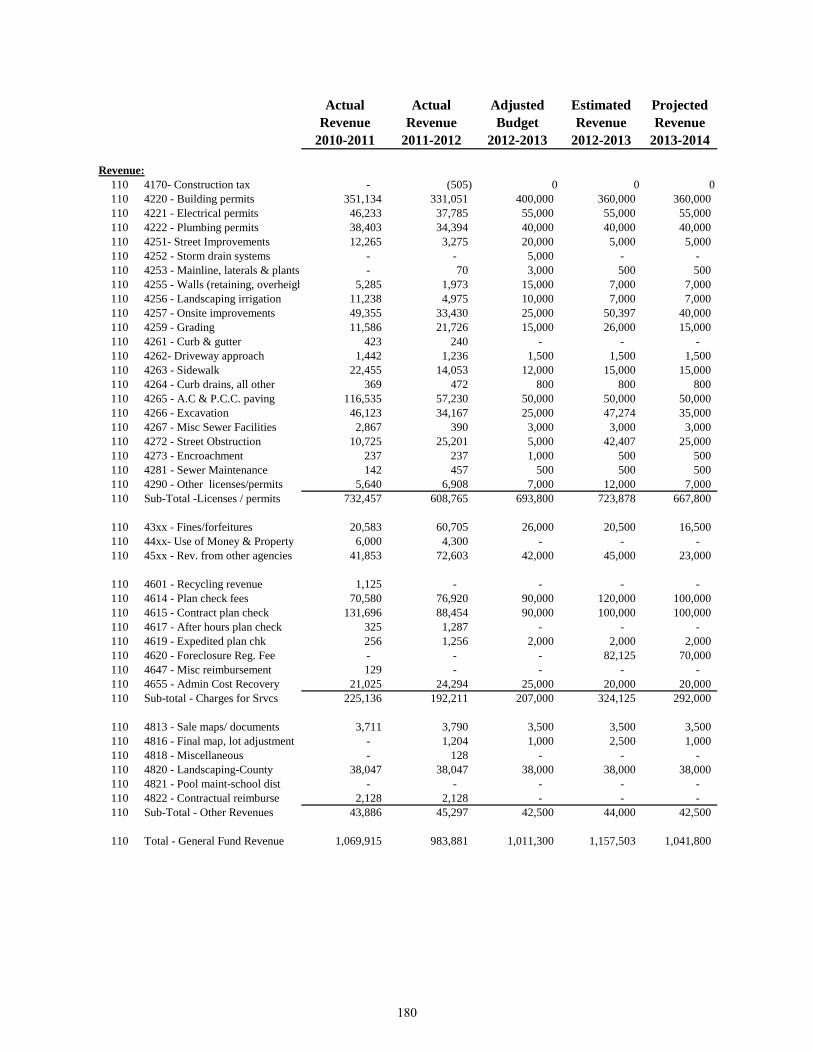
Actual Actual Adjusted Estimated ProjectedRevenue Revenue Budget Revenue Revenue
2010-2011 2011-2012 2012-2013 2012-2013 2013-2014
Revenue:110 4170- Construction tax - (505) 0 0 0110 4220 - Building permits 351,134 331,051 400,000 360,000 360,000 110 4221 - Electrical permits 46,233 37,785 55,000 55,000 55,000 110 4222 - Plumbing permits 38,403 34,394 40,000 40,000 40,000 110 4251- Street Improvements 12,265 3,275 20,000 5,000 5,000 110 4252 - Storm drain systems - - 5,000 - - 110 4253 - Mainline, laterals & plants - 70 3,000 500 500 110 4255 - Walls (retaining, overheigh 5,285 1,973 15,000 7,000 7,000 110 4256 - Landscaping irrigation 11,238 4,975 10,000 7,000 7,000 110 4257 - Onsite improvements 49,355 33,430 25,000 50,397 40,000 110 4259 - Grading 11,586 21,726 15,000 26,000 15,000 110 4261 - Curb & gutter 423 240 - - - 110 4262- Driveway approach 1,442 1,236 1,500 1,500 1,500 110 4263 - Sidewalk 22,455 14,053 12,000 15,000 15,000 110 4264 - Curb drains, all other 369 472 800 800 800 110 4265 - A.C & P.C.C. paving 116,535 57,230 50,000 50,000 50,000 110 4266 - Excavation 46,123 34,167 25,000 47,274 35,000 110 4267 - Misc Sewer Facilities 2,867 390 3,000 3,000 3,000 110 4272 - Street Obstruction 10,725 25,201 5,000 42,407 25,000 110 4273 - Encroachment 237 237 1,000 500 500 110 4281 - Sewer Maintenance 142 457 500 500 500 110 4290 - Other licenses/permits 5,640 6,908 7,000 12,000 7,000 110 Sub-Total -Licenses / permits 732,457 608,765 693,800 723,878 667,800
110 43xx - Fines/forfeitures 20,583 60,705 26,000 20,500 16,500 110 44xx- Use of Money & Property 6,000 4,300 - - - 110 45xx - Rev. from other agencies 41,853 72,603 42,000 45,000 23,000
110 4601 - Recycling revenue 1,125 - - - - 110 4614 - Plan check fees 70,580 76,920 90,000 120,000 100,000 110 4615 - Contract plan check 131,696 88,454 90,000 100,000 100,000 110 4617 - After hours plan check 325 1,287 - - - 110 4619 - Expedited plan chk 256 1,256 2,000 2,000 2,000 110 4620 - Foreclosure Reg. Fee - - - 82,125 70,000 110 4647 - Misc reimbursement 129 - - - - 110 4655 - Admin Cost Recovery 21,025 24,294 25,000 20,000 20,000 110 Sub-total - Charges for Srvcs 225,136 192,211 207,000 324,125 292,000
110 4813 - Sale maps/ documents 3,711 3,790 3,500 3,500 3,500 110 4816 - Final map, lot adjustment - 1,204 1,000 2,500 1,000 110 4818 - Miscellaneous - 128 - - - 110 4820 - Landscaping-County 38,047 38,047 38,000 38,000 38,000 110 4821 - Pool maint-school dist - - - - - 110 4822 - Contractual reimburse 2,128 2,128 - - - 110 Sub-Total - Other Revenues 43,886 45,297 42,500 44,000 42,500
110 Total - General Fund Revenue 1,069,915 983,881 1,011,300 1,157,503 1,041,800
180
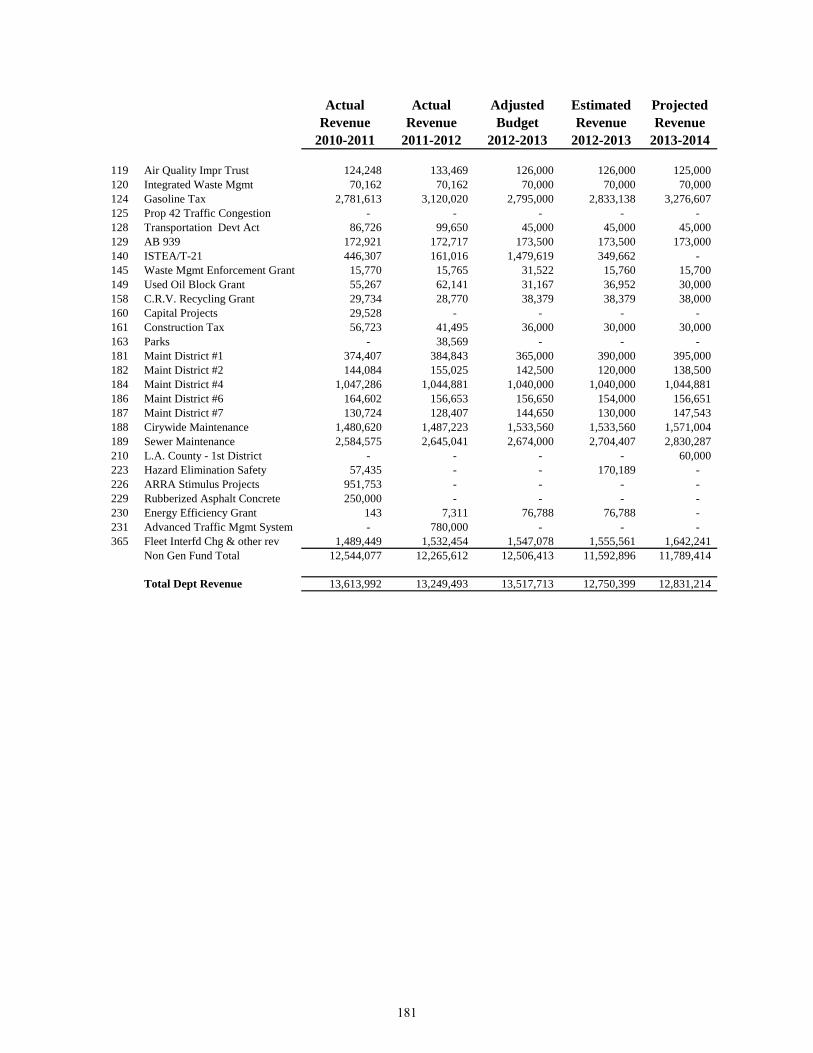
Actual Actual Adjusted Estimated ProjectedRevenue Revenue Budget Revenue Revenue
2010-2011 2011-2012 2012-2013 2012-2013 2013-2014
119 Air Quality Impr Trust 124,248 133,469 126,000 126,000 125,000 120 Integrated Waste Mgmt 70,162 70,162 70,000 70,000 70,000 124 Gasoline Tax 2,781,613 3,120,020 2,795,000 2,833,138 3,276,607 125 Prop 42 Traffic Congestion - - - - - 128 Transportation Devt Act 86,726 99,650 45,000 45,000 45,000 129 AB 939 172,921 172,717 173,500 173,500 173,000 140 ISTEA/T-21 446,307 161,016 1,479,619 349,662 - 145 Waste Mgmt Enforcement Grant 15,770 15,765 31,522 15,760 15,700 149 Used Oil Block Grant 55,267 62,141 31,167 36,952 30,000 158 C.R.V. Recycling Grant 29,734 28,770 38,379 38,379 38,000 160 Capital Projects 29,528 - - - - 161 Construction Tax 56,723 41,495 36,000 30,000 30,000 163 Parks - 38,569 - - - 181 Maint District #1 374,407 384,843 365,000 390,000 395,000 182 Maint District #2 144,084 155,025 142,500 120,000 138,500 184 Maint District #4 1,047,286 1,044,881 1,040,000 1,040,000 1,044,881 186 Maint District #6 164,602 156,653 156,650 154,000 156,651 187 Maint District #7 130,724 128,407 144,650 130,000 147,543 188 Cirywide Maintenance 1,480,620 1,487,223 1,533,560 1,533,560 1,571,004 189 Sewer Maintenance 2,584,575 2,645,041 2,674,000 2,704,407 2,830,287 210 L.A. County - 1st District - - - - 60,000 223 Hazard Elimination Safety 57,435 - - 170,189 - 226 ARRA Stimulus Projects 951,753 - - - - 229 Rubberized Asphalt Concrete 250,000 - - - - 230 Energy Efficiency Grant 143 7,311 76,788 76,788 - 231 Advanced Traffic Mgmt System - 780,000 - - - 365 Fleet Interfd Chg & other rev 1,489,449 1,532,454 1,547,078 1,555,561 1,642,241
Non Gen Fund Total 12,544,077 12,265,612 12,506,413 11,592,896 11,789,414
Total Dept Revenue 13,613,992 13,249,493 13,517,713 12,750,399 12,831,214
181

Page Intentionally Left Blank
182

COMMUNITY SERVICES DEPARTMENT MISSION STATEMENT: To create community and enhance the quality of life in West Covina through people, facilities, programs and partnerships
his department offers social and recreational programming, advocacy, child-care, special events, and
transportation. In addition, the department serves as a City liaison to numerous youth sport groups and community organizations, while helping mediate activities such as community planning, collaboration, and coordination for many capital projects and senior services. Grant management programs are also assigned to the department and include the administration of the Community Development Block Grant (CDBG) and Community Development Block Grant-Recovery (CDBG-R) Program, the Area Agency on Aging Grant for senior meals, Summer Food Service Program, County Park Bond grant program, Proposition A and C as well as Measure R Local Return funds, and the department pursues competitive grants in community service areas. In an effort to raise funds for the community’s benefit, the department also provides a 501(c)3 non profit called the Community Services Foundation.
In fiscal year 2013-2014, the department will use federal and local monies, fees, grants, and General Fund resources to provide a variety of services.
The department has 41.41 full-time equivalents, of which nine are full time to provide the many programs and services offered to the community, and to manage the appropriate expenditures of the budget. The majority of the positions are part-time and seasonal, providing comprehensive job training and career development opportunities for diverse ethnic and
economic groups throughout the community.
A continuing emphasis for the department is to advocate for the importance of community services and quality of life in West Covina; and to maximize services by partnering with school districts, other government agencies, community-based organizations, volunteers, and the business community. The department operates one nature center, one senior center, four licensed day cares, one licensed preschool, three community centers, one aquatic center, one equestrian center, one splashpad, one skate park, one roller hockey center, and ten athletic facilities, as well as a Big League Dreams complex via contract. Department staff strives to involve the whole community in their programs and activities to enrich people’s lives at all ages.
In order to further integrate services for all residents, the department addresses the social and recreational needs of youth, families, adults, seniors, and the disabled. The department also handles issues related to homelessness, housing, transportation, and low-income assistance.
The department creates community through people, parks, and programs. Department staff is responsible for planning, developing, coordinating, and implementing a variety of leisure activities, such as youth and adult sports, aquatic programs, equestrian activities, fitness, cultural, dance and art classes, nature programs, tiny tot programs, and the youth assistance program. The CDBG-funded Youth Assistance Program
T
183
(YAP) subsidizes the cost of youth recreational programs for eligible West Covina residents. The department also manages the CDBG program and coordinates the facility use rental program for Shadow Oak Park Community Center, Cameron Park Community Center, a Public Equestrian Center, athletic fields, picnic pavilions, and the Municipal Pool. The department operates and administers the Galster Nature Center, the Public Equestrian Center, Municipal Pool, Shadow Oak Community Center, and Cameron Park Community Center. This includes the training and scheduling of staff, supervision of participants, programming, marketing, maintenance, and upkeep of the facilities. Staff also works in cooperation with West Covina High School and Cameron Elementary in regard to the Parking Master Plan and the annual calendar of events, as well as hosting certain school events. The department works cooperatively with other departments on special projects such as park master plans, administration of various grants as well as Regional Open Space District funding. It manages contracts and agreements with community user groups, youth leagues, school districts, and public recreation operators. It provides support and scheduling to sport leagues. It also collaborates with the maintenance division and the building division of the public works department for the operations, improvement, and maintenance of facilities, as well as the City’s Capital Improvement Programs (CIP). The department acts as a liaison to the Sports Council. The Sports Council meets monthly and is comprised of eleven (11) volunteer youth sports organizations including: football/cheer, softball, basketball, soccer, and seven baseball
leagues. Department staff works closely with City/School district maintenance divisions regarding field safety, repair, and maintenance, on 10 City and 18 district properties (West Covina-11, Covina-6, and Rowland-1). Annual youth participation in sports programs over 3,600. The department oversees the management of several program and service contracts including: Big League Dreams, California Street Hockey, San Gabriel Valley Mountains Regional Conservancy, and California Vending Service. The department also provides a variety of family, cultural, and community oriented programs and events. Staff works to increase community participation through marketing, press relations, and collaboration with community organizations and non-profit groups which raise funds for various causes such as: the Muscular Dystrophy Association (MDA), and the National Association for the Advancement of Colored People (NAACP), as well as school groups. The department oversees four licensed child-care programs and one licensed preschool program throughout the city, serving an average of 200 children per week. The CDBG-funded Careship Program subsidizes the cost of childcare for eligible West Covina residents enrolled in City programs. The department operates the West Covina Senior Center. Programs promote independence by offering services and programs adapted to the specialized and changing needs and interests of senior citizens, including case management and daily nutrition.
184

Additionally, the department administers transportation services. Specific responsibilities include: oversight of Proposition A and C; Measure R Local Tax Return Funds for transportation, recreation, and education transit; Westco Dial-A-Ride; and West Covina Shuttle Services. The department oversees the operation of the Summer Lunch Program held at Cameron Park and acts as a liaison to the Youth Council. The department also provides the general administration to direct, oversee, and support all operations of the department, including:
• Development and monitoring of the department budget.
• Grant writing. • Oversight and administration of AB
2404 (Gender Equity) compliance throughout department programs and affiliated athletic groups.
• Production of the Community Recreation Guide.
• Involvement in localized and regional homeless services advocacy organizations.
• Providing support to Community and Senior Services Commission.
Community and Senior Services Commission The Community and Senior Services Commission (CSSC) was created by the
City Council. It is comprised of 10 commissioners to aid and advise the City Council on matters that pertain to the community service needs of the citizens of West Covina relating to (a) public recreational services, (b) cultural activities and special events, (c) youth services, (d) public transportation, (e) neighborhood and human relations, and (f) human rights. There are four Ad-Hoc Committees designed to provide in-depth review of certain project areas:
1. CDBG 2. CIP 3. Sports Council
During fiscal year 2012-2013, the CSSC was instrumental in:
• Reviewing and recommending CIP
Projects within the City of West Covina.
• Reviewing and recommending CDBG funding allocations.
• Selecting the Community Services Volunteers of the Year.
• Reviewing and recommending Sports Council compliancy issues.
• Recommending improvements to the senior center facility.
• Facilitating open communication with individuals and groups that utilize the senior center.
• Selecting the Senior Citizen’s Volunteer of the Year.
185

COMMUNITY SERVICES ORGANIZATIONAL CHART
* Shading denotes limited service staff
Community ServicesDirector
Community ServicesManager
AdministrativeAssistant I
Recreation Supervisor
Day CareDirectors (5)
Day CareSupport Staff
Senior Citizens ServicesSupervisor
SeniorAccount Clerk
HeadCook
AssistantCook
AccountClerk
Senior CenterSite Coordinators
Kitchen & FacilitySupport Staff
RecreationSupervisor
Shadow Oak Comm.Center Coordinators
RentalCoordinators
RecreationSupervisor
PoolManager
Cameron Comm.Center Coordinators
Facility & RentalSupport Staff
PoolMaintenance
ManagementAnalyst II
186
FY 2012-2013 ACCOMPLISHMENTS
• Selected as a Playful City USA Honoree. • Staff successfully executed 15 events, as
well as the Hallow’s Eve event at Galster Park that attracted more than 600 people.
• Staff increased the sports fields revenue
stream by increasing the rentals to local teams and tournaments at Sunset Field and Shadow Oak Park.
• The department sought and received
several donations totaling more than $40,000 for programming through the City’s 501(c)3 Community Services Foundation.
• The 2012 Independence Day event
collected $24,523 in sponsorships and gate revenues to offset the City’s cost.
• In an effort to offset the challenge of
decreased staffing, the department is working with Title V workers, which is a county-funded program that provides skilled labor at no cost to the City. This has saved thousands of dollars in staffing costs annually.
• The department continued to work with
volunteers who assist in the delivery of services at community centers, helping to reduce thousands of dollars in part- time staffing costs.
• The Senior Center has a collaborative
partnership with YWCA Intervale Senior Services of San Gabriel Valley to provide case management. This action resulted in a general fund savings of approximately $20,000 annually.
• Staff collaborated with the San Gabriel Valley NAACP on the 14th annual Martin Luther King, Jr. celebration in January. The event took place at the West Covina civic center and drew a diverse audience, including numerous key local and state legislators.
• The 2012 annual Independence Day
Celebration, co-sponsored with the West Covina Elks, was hosted at Edgewood Middle School. The event included a carnival, game and food booths, entertainment, and a spectacular fireworks show. Proceeds from the event were donated to the Muscular Dystrophy Association.
• The annual Cherry Blossom Festival was
held in conjunction with the East San Gabriel Valley Japanese Community Center. The event featured a traditional tea ceremony, demonstrations and entertainment celebrating the Japanese culture. In addition, a variety of food, information, game and craft booths were available for the public to enjoy.
• Staff collaborated with a wide variety of
community organizations throughout the year to provide other special events for the community; organizations include West Covina Beautiful, West Covina Council PTA, West Covina Library, Arbor Day, Relay For Life, Red Ribbon Rally, and Earth Day.
• The department conducted grand
openings of three new recreation facilities: (1) A new playground and outdoor fitness area was constructed at Palm View Park, providing a fit place to play for the entire family, (2) a new splash pad at Del Norte Park, and (3) a new Dog Park at Del Norte Park.
187

• The Go West Shuttle provided service to over 104,402 passengers. The Westco Dial-A-Ride service provided over 23,148 rides to West Covina residents. The department continues to utilize transit vehicles for public service announcements to promote City events and programs.
• Approximately 150 trips were offered
financial assistance through the Recreation Transit program, which discounts transit fees for qualifying school field trips and resident excursions.
• The Senior Center, Senior Meals
Program was awarded the AAA Silver Thermometer Award for meeting the highest standards for serving safe food.
• Staff served as City liaisons to the East San Gabriel Valley Consortium on Homelessness and the Housing and Homeless Coordinating Council, which meet monthly to share information and work collaboratively to address the needs of homelessness in the region.
• Monitored community partnerships and
contracts: o San Gabriel Mountain Regional
Conservancy (SGMRC) o Amigos de los Rios Emerald
Necklace Accord o West Covina Big League Dreams o California Street Hockey o California Vending Service o Green City Partnership CLEO
Program (new) o Network For A Healthy California
(new) o West Covina Unified School District
– Municipal Pool
• A Department staff member maintains certification by the American Heart Association to teach CPR, First Aid and AED (Automatic External Defibrillator), which resulted in the certification of all recreation department staff.
• Held the 2013 Spring Egg Hunt at
Cameron Park.
• Staff served as the City’s liaison to the U.S. Department of Housing and Urban Development (HUD) to ensure the City’s Community Development Block Grant (CDBG) program complies with federal requirements.
• Staff administered agreements and
provided technical assistance to the City’s 12 fiscal year 2012-2013 CDBG-funded sub-recipients, which include services such as: food banks, meals on wheels, fair housing services, senior nutrition, senior case management, homeless services, and subsidies for child care and recreation.
• Completed and submitted the CDBG
One-Year Action Plan (2013-2014). • Coordinated with other City departments
to expend CDBG funds in a timely fashion as required by HUD.
• Completed projects at Del Norte Park:
the Dog Park – “Central Bark” and Playground Improvements project.
• Completed upgrades at Municipal Pool,
including energy efficiency projects to save City funds.
• Partnered with GWC to co-host a golf
tournament celebrating the City’s 90th Anniversary.
188
FY 2013-2014 GOALS AND OBJECTIVES
• Continue to provide the highest level of
service while maintaining fiscal responsibility by adhering to expenses and achieving revenue projections. The department has made significant reductions in personnel, special events, materials, supplies, equipment, marketing, and transportation. In addition to this, staff has maximized the use of special funds (non-general fund sources) to further offset the costs of department operations.
• Provide new community events (i.e.,
Play Day, Food Truck Festival, etc.)
• Provide a “Movies in the Park” series during the Summer of 2013.
• Partner with GWC to provide a Summer Concert Series.
• Relocate the 2013 Summer Lunch
Program to Cameron Park. • A new vendor will be contracted to
provide transit services for the City’s Shuttle and Dial-A-Ride. The fleet used for the service will be upgraded from the existing vehicles.
• Increase revenue at the Senior Center by securing new agreements for on-going rentals of the Center.
189
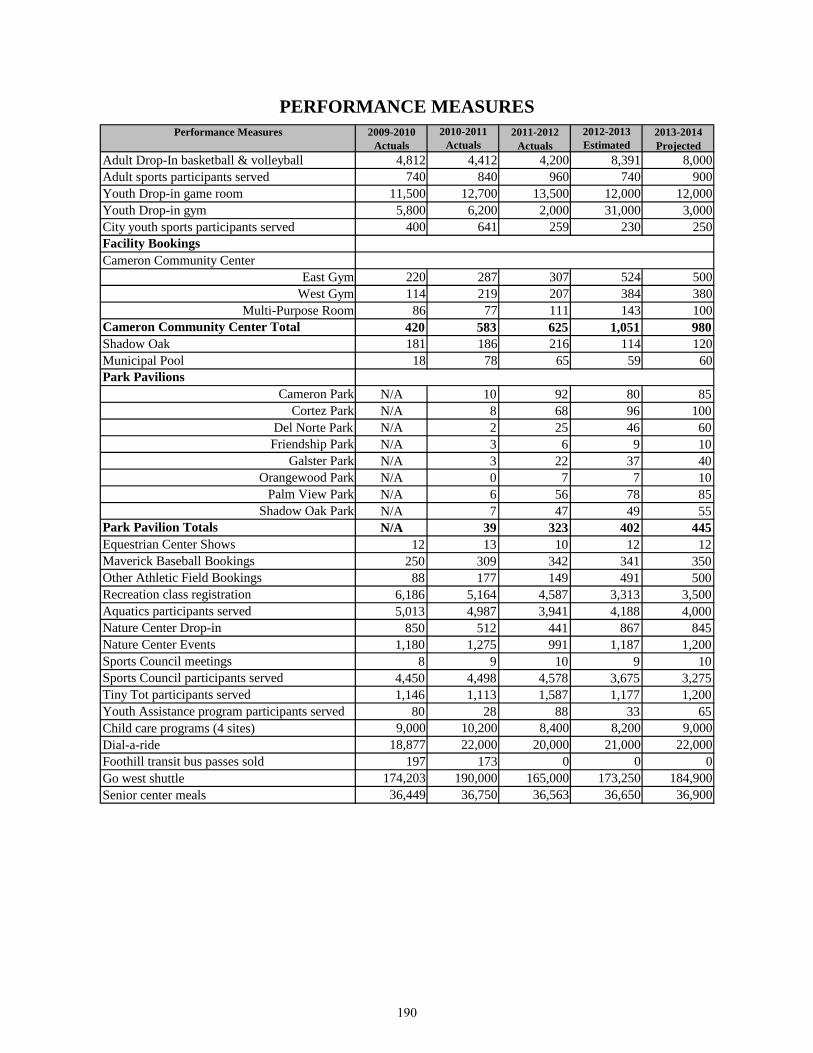
PERFORMANCE MEASURES
2009-2010 2010-2011 2012-2013Actuals Actuals Estimated
Adult Drop-In basketball & volleyball 4,812 4,412 4,200 8,391 8,000Adult sports participants served 740 840 960 740 900Youth Drop-in game room 11,500 12,700 13,500 12,000 12,000Youth Drop-in gym 5,800 6,200 2,000 31,000 3,000City youth sports participants served 400 641 259 230 250Facility BookingsCameron Community Center
East Gym 220 287 307 524 500West Gym 114 219 207 384 380
Multi-Purpose Room 86 77 111 143 100Cameron Community Center Total 420 583 625 1,051 980Shadow Oak 181 186 216 114 120Municipal Pool 18 78 65 59 60Park Pavilions
Cameron Park N/A 10 92 80 85Cortez Park N/A 8 68 96 100
Del Norte Park N/A 2 25 46 60Friendship Park N/A 3 6 9 10
Galster Park N/A 3 22 37 40Orangewood Park N/A 0 7 7 10
Palm View Park N/A 6 56 78 85Shadow Oak Park N/A 7 47 49 55
Park Pavilion Totals N/A 39 323 402 445Equestrian Center Shows 12 13 10 12 12Maverick Baseball Bookings 250 309 342 341 350Other Athletic Field Bookings 88 177 149 491 500Recreation class registration 6,186 5,164 4,587 3,313 3,500Aquatics participants served 5,013 4,987 3,941 4,188 4,000Nature Center Drop-in 850 512 441 867 845Nature Center Events 1,180 1,275 991 1,187 1,200Sports Council meetings 8 9 10 9 10Sports Council participants served 4,450 4,498 4,578 3,675 3,275Tiny Tot participants served 1,146 1,113 1,587 1,177 1,200Youth Assistance program participants served 80 28 88 33 65Child care programs (4 sites) 9,000 10,200 8,400 8,200 9,000Dial-a-ride 18,877 22,000 20,000 21,000 22,000Foothill transit bus passes sold 197 173 0 0 0Go west shuttle 174,203 190,000 165,000 173,250 184,900Senior center meals 36,449 36,750 36,563 36,650 36,900
2013-2014 Projected
Performance Measures 2011-2012 Actuals
190
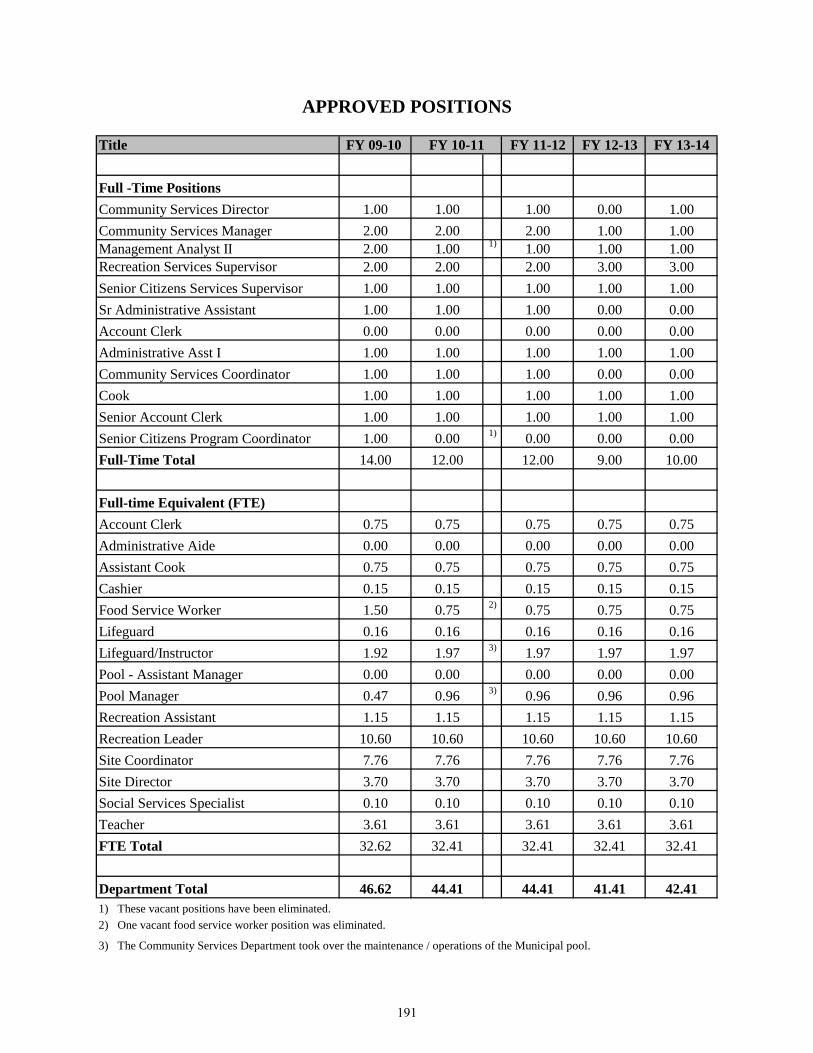
APPROVED POSITIONS Title FY 09-10 FY 11-12 FY 12-13 FY 13-14
Full -Time PositionsCommunity Services Director 1.00 1.00 1.00 0.00 1.00Community Services Manager 2.00 2.00 2.00 1.00 1.00Management Analyst II 2.00 1.00 1) 1.00 1.00 1.00Recreation Services Supervisor 2.00 2.00 2.00 3.00 3.00Senior Citizens Services Supervisor 1.00 1.00 1.00 1.00 1.00Sr Administrative Assistant 1.00 1.00 1.00 0.00 0.00Account Clerk 0.00 0.00 0.00 0.00 0.00Administrative Asst I 1.00 1.00 1.00 1.00 1.00Community Services Coordinator 1.00 1.00 1.00 0.00 0.00Cook 1.00 1.00 1.00 1.00 1.00Senior Account Clerk 1.00 1.00 1.00 1.00 1.00Senior Citizens Program Coordinator 1.00 0.00 1) 0.00 0.00 0.00Full-Time Total 14.00 12.00 12.00 9.00 10.00
Full-time Equivalent (FTE)Account Clerk 0.75 0.75 0.75 0.75 0.75Administrative Aide 0.00 0.00 0.00 0.00 0.00Assistant Cook 0.75 0.75 0.75 0.75 0.75Cashier 0.15 0.15 0.15 0.15 0.15Food Service Worker 1.50 0.75 2) 0.75 0.75 0.75Lifeguard 0.16 0.16 0.16 0.16 0.16Lifeguard/Instructor 1.92 1.97 3) 1.97 1.97 1.97Pool - Assistant Manager 0.00 0.00 0.00 0.00 0.00Pool Manager 0.47 0.96 3) 0.96 0.96 0.96Recreation Assistant 1.15 1.15 1.15 1.15 1.15Recreation Leader 10.60 10.60 10.60 10.60 10.60Site Coordinator 7.76 7.76 7.76 7.76 7.76Site Director 3.70 3.70 3.70 3.70 3.70Social Services Specialist 0.10 0.10 0.10 0.10 0.10Teacher 3.61 3.61 3.61 3.61 3.61FTE Total 32.62 32.41 32.41 32.41 32.41
Department Total 46.62 44.41 44.41 41.41 42.411) These vacant positions have been eliminated.
3) The Community Services Department took over the maintenance / operations of the Municipal pool.
2) One vacant food service worker position was eliminated.
FY 10-11
191
BUDGET ISSUES • The department has prepared a budget
with significant reductions in general fund spending for fiscal year 2013-2014, including: reductions in full and part time personnel, special events, materials, supplies, equipment, marketing, and transportation. In addition to this, staff has maximized the use of special funds (non-general fund sources) to further offset the costs of department operations. The department has withstood these changes and will move forward into the new year with an intent to deliver high quality service and programs to residents.
• In an effort to offset the challenge of
decreased staffing, the department has begun working with Title V workers, which is a county-funded program that provides skilled labor at no cost to the City. While this is helpful, the arrangement does present additional challenges specifically related to ongoing training and retention.
• CDBG fiscal year 2013-2014 allocation
is 6.9% less than that of fiscal year 2012-2013. This will impact the City’s CDBG resources and its ability to fund eligible projects.
• The department’s five day care
programs, located primarily at school sites, saw a tremendous impact after the school district allowed the grant-funded ACES program to enter campuses throughout West Covina. While the program has benefits for local residents, the day cares are unable to compete with ACES rate of $25 per month. Staff will
continue to work through this challenge into the new fiscal year.
• In the event that an increased level of
service is requested and implemented outside of the approved community services department budget, an appropriation of funds (or an alternate financial source) would need to be determined in order for community services to bear the additional costs associated to such items.
• The City has had a strong relationship
with a number of non-profit providers over the past decade. This relationship has afforded certain benefits to non-profits by way of facility and park fee waivers under special circumstances. The department manages over $250,000 in fee waivers annually; while this has helped local non-profits it has also impacted the department’s ability to generate needed revenue.
• Department staff will continue to
maintain the new Del Norte Park Splash Pad with Los Angeles County Regional Parks and Open Space District reimbursing costs for the staff time to perform these duties.
• Department has two vacant Recreation
Supervisor positions. These positions will be underfilled in FY 13-14, generating additional budgetary savings.
192
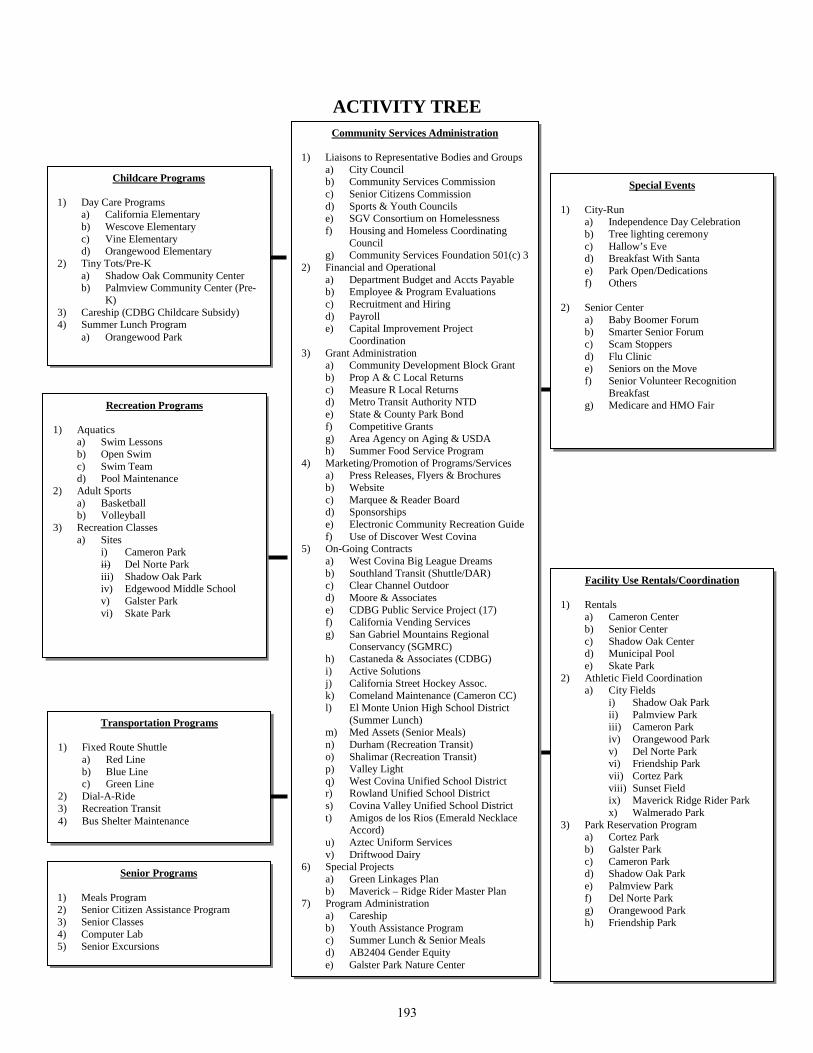
ACTIVITY TREE
Community Services Administration
1) Liaisons to Representative Bodies and Groups a) City Council b) Community Services Commission c) Senior Citizens Commission d) Sports & Youth Councils e) SGV Consortium on Homelessness f) Housing and Homeless Coordinating
Council g) Community Services Foundation 501(c) 3
2) Financial and Operational a) Department Budget and Accts Payable b) Employee & Program Evaluations c) Recruitment and Hiring d) Payroll e) Capital Improvement Project
Coordination 3) Grant Administration
a) Community Development Block Grant b) Prop A & C Local Returns c) Measure R Local Returns d) Metro Transit Authority NTD e) State & County Park Bond f) Competitive Grants g) Area Agency on Aging & USDA h) Summer Food Service Program
4) Marketing/Promotion of Programs/Services a) Press Releases, Flyers & Brochures b) Website c) Marquee & Reader Board d) Sponsorships e) Electronic Community Recreation Guide f) Use of Discover West Covina
5) On-Going Contracts a) West Covina Big League Dreams b) Southland Transit (Shuttle/DAR) c) Clear Channel Outdoor d) Moore & Associates e) CDBG Public Service Project (17) f) California Vending Services g) San Gabriel Mountains Regional
Conservancy (SGMRC) h) Castaneda & Associates (CDBG) i) Active Solutions j) California Street Hockey Assoc. k) Comeland Maintenance (Cameron CC) l) El Monte Union High School District
(Summer Lunch) m) Med Assets (Senior Meals) n) Durham (Recreation Transit) o) Shalimar (Recreation Transit) p) Valley Light q) West Covina Unified School District r) Rowland Unified School District s) Covina Valley Unified School District t) Amigos de los Rios (Emerald Necklace
Accord) u) Aztec Uniform Services v) Driftwood Dairy
6) Special Projects a) Green Linkages Plan b) Maverick – Ridge Rider Master Plan
7) Program Administration a) Careship b) Youth Assistance Program c) Summer Lunch & Senior Meals d) AB2404 Gender Equity e) Galster Park Nature Center
Senior Programs
1) Meals Program 2) Senior Citizen Assistance Program 3) Senior Classes 4) Computer Lab 5) Senior Excursions
Transportation Programs
1) Fixed Route Shuttle a) Red Line b) Blue Line c) Green Line
2) Dial-A-Ride 3) Recreation Transit 4) Bus Shelter Maintenance
Facility Use Rentals/Coordination
1) Rentals a) Cameron Center b) Senior Center c) Shadow Oak Center d) Municipal Pool e) Skate Park
2) Athletic Field Coordination a) City Fields
i) Shadow Oak Park ii) Palmview Park iii) Cameron Park iv) Orangewood Park v) Del Norte Park vi) Friendship Park vii) Cortez Park viii) Sunset Field ix) Maverick Ridge Rider Park x) Walmerado Park
3) Park Reservation Program a) Cortez Park b) Galster Park c) Cameron Park d) Shadow Oak Park e) Palmview Park f) Del Norte Park g) Orangewood Park h) Friendship Park
Special Events
1) City-Run a) Independence Day Celebration b) Tree lighting ceremony c) Hallow’s Eve d) Breakfast With Santa e) Park Open/Dedications f) Others
2) Senior Center a) Baby Boomer Forum b) Smarter Senior Forum c) Scam Stoppers d) Flu Clinic e) Seniors on the Move f) Senior Volunteer Recognition
Breakfast g) Medicare and HMO Fair
Recreation Programs
1) Aquatics a) Swim Lessons b) Open Swim c) Swim Team d) Pool Maintenance
2) Adult Sports a) Basketball b) Volleyball
3) Recreation Classes a) Sites
i) Cameron Park ii) Del Norte Park iii) Shadow Oak Park iv) Edgewood Middle School v) Galster Park vi) Skate Park
Childcare Programs
1) Day Care Programs a) California Elementary b) Wescove Elementary c) Vine Elementary d) Orangewood Elementary
2) Tiny Tots/Pre-K a) Shadow Oak Community Center b) Palmview Community Center (Pre-
K) 3) Careship (CDBG Childcare Subsidy) 4) Summer Lunch Program
a) Orangewood Park
193

BUDGET SUMMARY
Actual Actual Adjusted Estimated AdoptedExpenditures Expenditures Budget Expenditures Budget
2010-2011 2011-2012 2012-2013 2012-2013 2013-2014Expenditure By Type:5000 Personnel 1,901,561 1,786,139 1,694,579 1,586,699 1,794,843 6000 Supplies and Services 3,643,706 3,754,046 4,507,695 4,361,413 4,334,851 7000 Capital Outlay - - 7,968 7,968 1,000
Total Department 5,545,267 5,540,185 6,210,242 5,956,080 6,130,694
Expenditure By Fund:110 General Fund 696,536 633,788 545,601 515,699 615,760 111 Fee and Charge 1,255,331 1,250,237 1,330,929 1,297,682 1,288,361 118 Business Improvement Tax 1,367 2,318 4,492 4,492 4,492 121 Prop A 1,601,476 1,530,000 2,030,900 2,030,900 2,030,900 122 Prop C 751,923 870,383 862,591 769,246 873,554 131 CDBG 376,404 349,015 331,808 299,845 346,100 143 L. A. County Park Bond - - 75,500 37,984 52,831 146 Senior Meals Program 205,737 218,390 208,421 203,644 210,461 159 Summer Meals Prog 23,671 18,145 28,791 27,548 28,652 220 WC Comm Services Foundation 31,284 16,480 188,091 148,117 50,000 224 Measure R 584,469 641,302 603,118 620,923 629,583 225 CDBG-R 17,069 1,981 - - - 361 Self Insurance Gen / Auto Liab. - 42 - - - 363 Self Insurance - Workers Comp - 8,104 - - -
Total Funding 5,545,267 5,540,185 6,210,242 5,956,080 6,130,694
Actual Actual Adjusted Estimated ProjectedRevenue Revenue Budget Revenue Revenue
2010-2011 2011-2012 2012-2013 2012-2013 2013-2014Revenue:
110 General Fund 39,276 36,145 35,000 45,000 30,000
111 Fee and Charge4650- California After School 80,672 81,933 80,000 80,000 80,000 4651-Wescove 88,729 85,056 90,173 85,000 90,000 4653-Vine 169,009 163,786 165,263 160,000 160,000 4654-Orangewood 48,248 79,827 80,000 65,000 75,000 4661- Rec classes CCC 116,553 98,189 167,050 100,000 100,000 4662- Sports CCC 39,047 47,278 45,000 32,000 35,000 4663- Facility rental CCC 108,425 122,151 100,000 130,000 135,000 4664- Rec classes 129,205 100,062 115,000 85,000 90,000 4675- Palmview 67,633 53,835 98,538 98,538 99,000
194
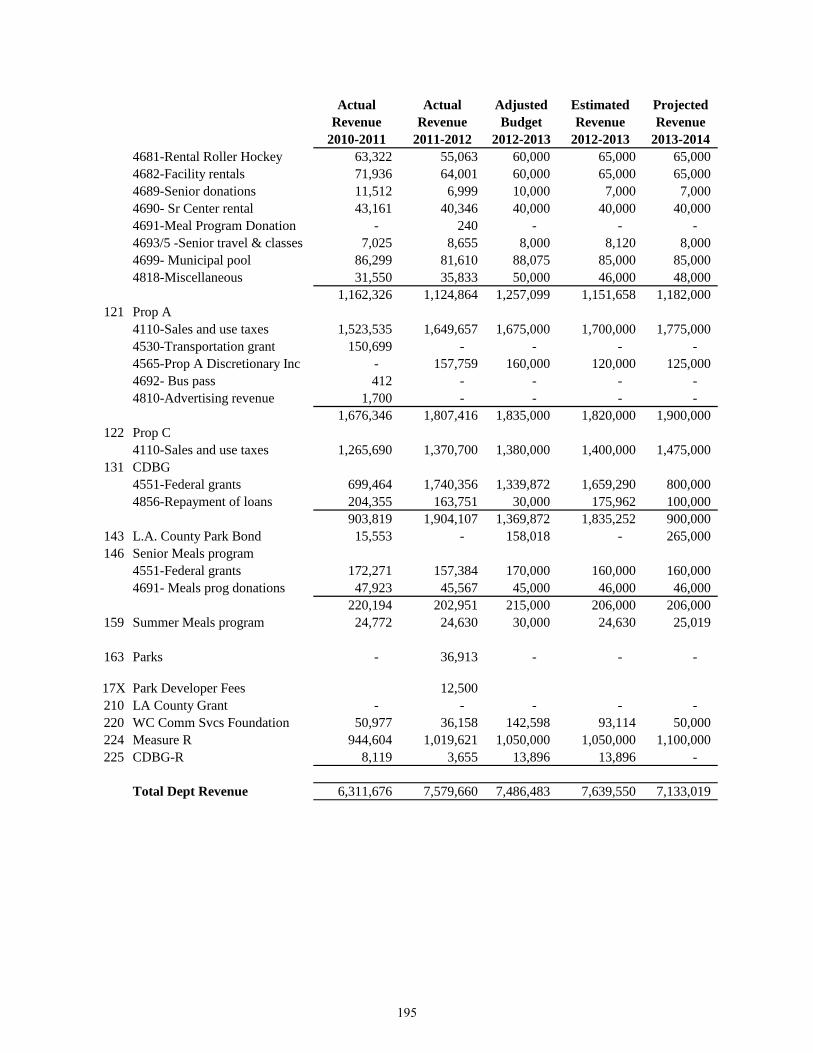
Actual Actual Adjusted Estimated ProjectedRevenue Revenue Budget Revenue Revenue
2010-2011 2011-2012 2012-2013 2012-2013 2013-20144681-Rental Roller Hockey 63,322 55,063 60,000 65,000 65,000 4682-Facility rentals 71,936 64,001 60,000 65,000 65,000 4689-Senior donations 11,512 6,999 10,000 7,000 7,000 4690- Sr Center rental 43,161 40,346 40,000 40,000 40,000 4691-Meal Program Donation - 240 - - - 4693/5 -Senior travel & classes 7,025 8,655 8,000 8,120 8,000 4699- Municipal pool 86,299 81,610 88,075 85,000 85,000 4818-Miscellaneous 31,550 35,833 50,000 46,000 48,000
1,162,326 1,124,864 1,257,099 1,151,658 1,182,000 121 Prop A
4110-Sales and use taxes 1,523,535 1,649,657 1,675,000 1,700,000 1,775,000 4530-Transportation grant 150,699 - - - - 4565-Prop A Discretionary Inc - 157,759 160,000 120,000 125,000 4692- Bus pass 412 - - - - 4810-Advertising revenue 1,700 - - - -
1,676,346 1,807,416 1,835,000 1,820,000 1,900,000 122 Prop C
4110-Sales and use taxes 1,265,690 1,370,700 1,380,000 1,400,000 1,475,000 131 CDBG
4551-Federal grants 699,464 1,740,356 1,339,872 1,659,290 800,000 4856-Repayment of loans 204,355 163,751 30,000 175,962 100,000
903,819 1,904,107 1,369,872 1,835,252 900,000 143 L.A. County Park Bond 15,553 - 158,018 - 265,000 146 Senior Meals program
4551-Federal grants 172,271 157,384 170,000 160,000 160,000 4691- Meals prog donations 47,923 45,567 45,000 46,000 46,000
220,194 202,951 215,000 206,000 206,000 159 Summer Meals program 24,772 24,630 30,000 24,630 25,019
163 Parks - 36,913 - - -
17X Park Developer Fees 12,500 210 LA County Grant - - - - - 220 WC Comm Svcs Foundation 50,977 36,158 142,598 93,114 50,000 224 Measure R 944,604 1,019,621 1,050,000 1,050,000 1,100,000 225 CDBG-R 8,119 3,655 13,896 13,896 -
Total Dept Revenue 6,311,676 7,579,660 7,486,483 7,639,550 7,133,019
195

Page Intentionally Left Blank
196
CA
PIT
AL
IMPR
OV
EM
ENT
PR
OG
RA
M
The
City
of
Wes
t C
ovin
a de
velo
ps a
fiv
e-ye
ar C
apita
l Im
prov
emen
t Pr
ogra
m (
CIP
) th
at c
onsi
sts
of a
n ex
tens
ive
list
of p
roje
cts
nece
ssar
y to
mai
ntai
n an
d im
prov
e th
e C
ity’s
inf
rast
ruct
ure.
Th
e C
ity d
efin
es a
CIP
as
havi
ng (
1) a
cap
ital
asse
t w
ith a
des
ired
min
imum
dol
lar a
mou
nt o
f $10
,000
, and
(2) a
n es
timat
ed u
sefu
l life
of t
hree
yea
rs o
r mor
e. A
mul
ti-ye
ar C
IP is
nec
essa
ry b
ecau
se it
is
impo
ssib
le to
fund
all
capi
tal p
roje
cts i
mm
edia
tely
. In
ord
er to
mee
t the
City
’s n
eeds
, it i
s im
pera
tive
that
the
City
con
tinue
s to
plan
an
d st
rate
gize
how
it w
ill a
lloca
te li
mite
d fin
anci
al re
sour
ces f
or c
apita
l pro
ject
s.
The
CIP
shou
ld n
ot b
e co
nfus
ed w
ith th
e ca
pita
l im
prov
emen
t bud
get.
The
cap
ital i
mpr
ovem
ent b
udge
t rep
rese
nts t
he fi
rst y
ear o
f the
C
IP t
hat
is r
evie
wed
and
ado
pted
by
the
City
Cou
ncil.
It
auth
oriz
es s
peci
fic p
roje
cts
and
appr
opria
tes
spec
ific
fund
ing
for
thos
e pr
ojec
ts.
The
capi
tal i
mpr
ovem
ent b
udge
t for
fisc
al y
ear 2
013-
2014
pro
vide
s $3.
06 m
illio
n fo
r new
pro
ject
s.
Proj
ects
and
fina
ncin
g so
urce
s lis
ted
in th
e C
IP fo
r yea
rs o
ther
than
yea
r one
(com
mon
ly c
alle
d “o
ut y
ears
”) a
re n
ot a
utho
rized
unt
il th
e an
nual
bud
get f
or th
ose
year
s is
ado
pted
by
the
City
Cou
ncil.
The
“ou
t yea
rs”
serv
e on
ly a
s a
guid
e fo
r fut
ure
plan
ning
and
are
su
bjec
t to
furth
er r
evie
w a
nd m
odifi
catio
n in
sub
sequ
ent y
ears
. Th
e C
ity C
ounc
il ad
opts
a f
ive-
year
CIP
to p
rovi
de a
sta
ndar
d by
w
hich
to:
•Pr
iorit
ize
the
incr
ease
d ne
eds o
f the
City
;•
Ana
lyze
the
vario
us fu
ndin
g so
urce
s;•
Mat
ch, a
s app
ropr
iate
, the
fund
s to
the
vario
us n
eeds
;•
Plan
to m
eet t
he C
ity’s
cap
ital n
eeds
ove
r an
exte
nded
per
iod
of ti
me,
as f
undi
ng b
ecom
es a
vaila
ble;
and
•H
elp
to e
limin
ate
defic
ienc
ies,
yet a
ccom
mod
ate
chan
ging
prio
ritie
s whi
le p
rogr
essi
ng to
war
d a
goal
.
CA
PIT
AL
IMPR
OV
EM
EN
T S
EL
EC
TIO
N P
RO
CE
SS
The
CIP
has
bee
n de
velo
ped
with
the
com
bine
d in
put f
rom
the
City
Cou
ncil,
City
sta
ff, C
omm
unity
Ser
vice
s C
omm
issi
on, a
nd s
ports
le
ague
rep
rese
ntat
ives
. R
eque
sts
are
subm
itted
to a
com
mitt
ee o
f C
ity s
taff
mem
bers
to r
evie
w a
long
with
just
ifica
tions
, sug
gest
ed
fund
ing
sour
ce(s
) an
d as
soci
ated
cos
ts i
nclu
ding
any
ong
oing
ope
ratin
g co
sts.
The
pro
ject
s ar
e ca
tego
rized
as
Bui
ldin
g, E
nerg
y Ef
ficie
ncy/
Con
serv
atio
n, G
ener
al, P
arks
, Stre
ets,
Traf
fic, U
tiliti
es, V
ehic
le, o
r You
th S
ports
. Th
ey a
re a
sses
sed
base
d on
the
fund
ing
avai
labi
lity
and
the
need
s an
d pr
iorit
ies
of th
e C
ity, t
hen
pres
ente
d to
the
City
Cou
ncil
for
cons
ider
atio
n an
d ap
prov
al.
Proj
ects
not
197
fund
ed in
the
curr
ent
fisca
l ye
ar a
re p
ut in
“ou
t ye
ars.”
C
onve
rsel
y, d
urin
g th
e bu
dget
yea
r th
ere
may
be
addi
tiona
l CIP
pro
ject
s ap
prov
ed b
y th
e C
ity C
ounc
il th
at w
ere
unfo
rese
en d
urin
g th
e bu
dget
ado
ptio
n pr
oces
s.
An
addi
tiona
l pro
cess
has
als
o be
en u
tiliz
ed b
y th
e C
omm
unity
Ser
vice
s sta
ff a
nd th
e sp
orts
leag
ue re
pres
enta
tives
for t
he C
IP p
roje
cts
asso
ciat
ed w
ith re
crea
tiona
l and
soci
al p
rogr
ams t
hat i
mpa
ct th
e en
tire
City
. Th
e C
IP re
ques
ts a
re fi
rst p
rese
nted
to a
subc
omm
ittee
of
the
Com
mun
ity S
ervi
ces
Com
mis
sion
for r
evie
w.
This
pro
cess
incl
udes
site
vis
its b
y th
e su
bcom
mitt
ee.
They
rate
eac
h pr
ojec
t with
an
“A
” th
roug
h “F
” ra
ting
then
subm
it th
eir r
atin
gs to
the
full
Com
mis
sion
for a
ppro
val.
The
CIP
bud
get f
or fi
scal
yea
r 201
3-20
14 is
$3,
060,
000.
Pen
ding
gra
nt fu
nded
CIP
pro
ject
s are
show
n in
“ou
t yea
rs”
and
fund
ing
will
be
app
ropr
iate
d w
hen
appr
oved
by
gran
tee.
Th
ere
are
no g
ener
al f
unds
app
ropr
iate
d fo
r an
y C
IP p
roje
cts.
The
re a
re n
o fu
nds
avai
labl
e fo
r “Y
outh
Spo
rts”
proj
ects
, and
onl
y fu
ndin
g fo
r tw
o A
DA
“B
uild
ing”
pro
ject
s. A
list
of a
ll th
e re
com
men
ded
proj
ects
is
show
n on
the
follo
win
g pa
ges.
Als
o in
clud
ed is
a li
st o
f unf
unde
d bu
ildin
g an
d pa
rk im
prov
emen
t pro
ject
s.
SPE
CIA
L C
OM
ME
NT
S
1.A
lthou
gh s
taff
has
mad
e ev
ery
atte
mpt
to a
dher
e to
the
defin
ition
of
a C
IP, t
here
are
som
e oc
casi
ons
whe
n pr
ojec
ts m
ay b
ebe
low
the
$10,
000
limit.
W
hile
thes
e pr
ojec
ts m
ay n
ot b
e cl
assi
fied
by m
ost a
genc
ies
as “
capi
tal p
roje
cts,”
they
hav
e be
enin
clud
ed d
ue t
o th
eir
uniq
uene
ss.
The
Gov
ernm
ent
Fina
nce
Off
icer
s’ A
ssoc
iatio
n de
fines
a c
apita
l as
set
as “
a ne
w o
rre
habi
litat
ed p
hysi
cal
asse
t th
at i
s no
nrec
urrin
g, h
as a
use
ful
life
of m
ore
than
thr
ee t
o fiv
e ye
ars,
and
is e
xpen
sive
to
purc
hase
.” T
he te
rm “
expe
nsiv
e” is
rela
tive
and
may
app
ear a
rbitr
ary
at f
irst;
how
ever
, a s
urve
y of
loca
l citi
es re
veal
ed th
atth
e m
ost c
omm
on d
olla
r fig
ure
used
to d
efin
e a
capi
tal a
sset
is $
10,0
00.
2.Th
ere
are
no g
ener
al f
unds
and
incr
easi
ngly
less
res
trict
ed f
unds
ava
ilabl
e fo
r C
IP p
roje
cts.
The
re a
re n
o av
aila
ble
Prop
A,
Con
stru
ctio
n Ta
x, P
ark
Ded
icat
ion
Fees
, or
Park
Fun
ds.
This
yea
r, $2
,130
,000
in
rest
ricte
d fu
ndin
g is
ava
ilabl
e fo
r st
reet
rela
ted
proj
ects
. The
re is
$40
5,00
0 re
ques
ted
for p
ark
rela
ted
proj
ects
. $2
50,0
00 o
f Par
k pr
ojec
ts is
for m
aint
enan
ce a
nd re
pair
wor
k in
Mai
nten
ance
Dis
trict
pas
eo a
reas
, and
the
rem
aini
ng $
155,
000
is fo
r AD
A c
ompl
ianc
e, a
Cou
nty
fund
ed tr
ee p
lant
ing
gran
t, an
d ne
w r
ecyc
led
mat
eria
l tra
sh c
onta
iner
s in
City
par
ks.
With
no
Park
or
fund
ing
avai
labl
e, th
ere
is n
o ot
her
spec
ial f
undi
ng fo
r par
k im
prov
emen
ts.
3.O
nly
$60,
000
is a
vaila
ble
for
(2)
AD
A B
uild
ing
proj
ects
. Th
is h
as c
reat
ed a
n ex
traor
dina
ry c
halle
nge
for
staf
f du
e to
the
num
erou
s pr
ojec
ts th
at a
re in
nee
d of
fund
ing.
Thi
s is
par
ticul
arly
trou
bles
ome
as m
any
of th
e C
ity’s
faci
litie
s an
d eq
uipm
ent
are
aged
and
in n
eed
of re
habi
litat
ion
or re
plac
emen
t. M
any
of th
e B
uild
ing
proj
ects
sho
wn
on th
e at
tach
ed C
IP li
st h
ave
been
198
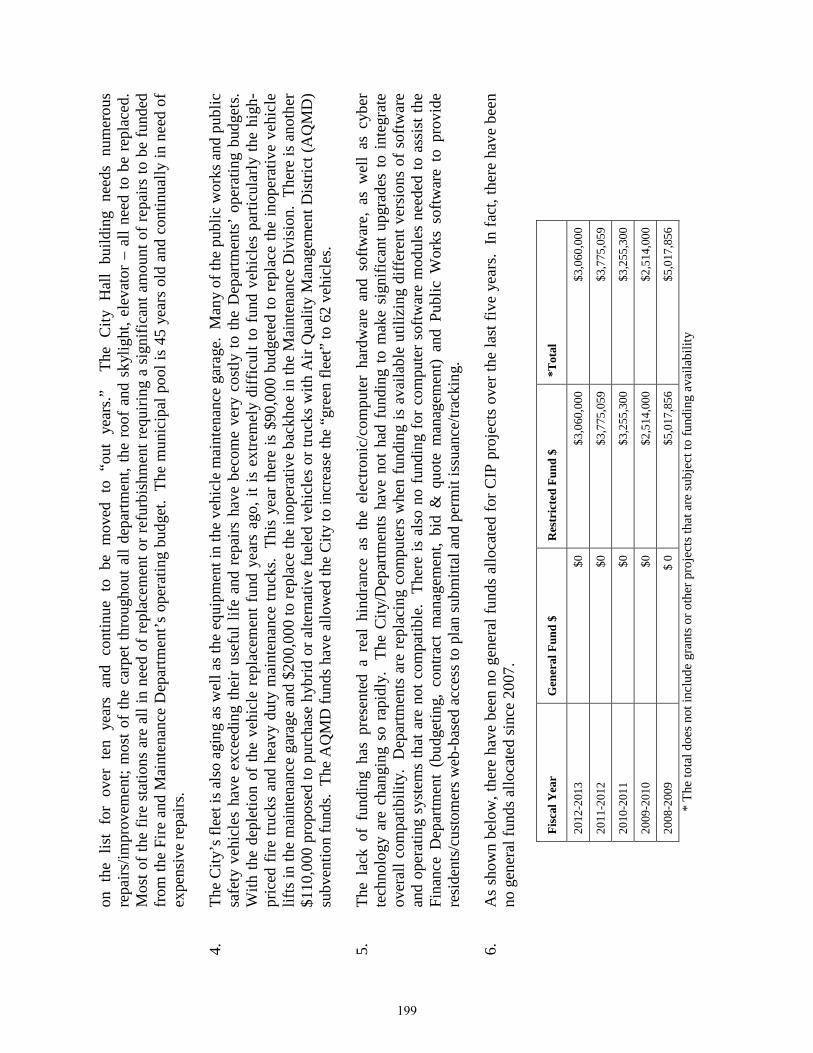
on t
he l
ist
for
over
ten
yea
rs a
nd c
ontin
ue t
o be
mov
ed t
o “o
ut y
ears
.”
The
City
Hal
l bu
ildin
g ne
eds
num
erou
s re
pairs
/impr
ovem
ent;
mos
t of
the
carp
et th
roug
hout
all
depa
rtmen
t, th
e ro
of a
nd s
kylig
ht, e
leva
tor
– al
l nee
d to
be
repl
aced
. M
ost o
f the
fire
sta
tions
are
all
in n
eed
of re
plac
emen
t or r
efur
bish
men
t req
uirin
g a
sign
ifica
nt a
mou
nt o
f rep
airs
to b
e fu
nded
fr
om th
e Fi
re a
nd M
aint
enan
ce D
epar
tmen
t’s o
pera
ting
budg
et.
The
mun
icip
al p
ool i
s 45
yea
rs o
ld a
nd c
ontin
ually
in n
eed
of
expe
nsiv
e re
pairs
.
4.Th
e C
ity’s
flee
t is a
lso
agin
g as
wel
l as t
he e
quip
men
t in
the
vehi
cle
mai
nten
ance
gar
age.
Man
y of
the
publ
ic w
orks
and
pub
licsa
fety
veh
icle
s ha
ve e
xcee
ding
thei
r us
eful
life
and
rep
airs
hav
e be
com
e ve
ry c
ostly
to th
e D
epar
tmen
ts’
oper
atin
g bu
dget
s.W
ith th
e de
plet
ion
of th
e ve
hicl
e re
plac
emen
t fun
d ye
ars
ago,
it is
ext
rem
ely
diff
icul
t to
fund
veh
icle
s pa
rticu
larly
the
high
-pr
iced
fire
truc
ks a
nd h
eavy
dut
y m
aint
enan
ce tr
ucks
. Th
is y
ear t
here
is $
90,0
00 b
udge
ted
to re
plac
e th
e in
oper
ativ
e ve
hicl
elif
ts in
the
mai
nten
ance
gar
age
and
$200
,000
to re
plac
e th
e in
oper
ativ
e ba
ckho
e in
the
Mai
nten
ance
Div
isio
n. T
here
is a
noth
er$1
10,0
00 p
ropo
sed
to p
urch
ase
hybr
id o
r alte
rnat
ive
fuel
ed v
ehic
les
or tr
ucks
with
Air
Qua
lity
Man
agem
ent D
istri
ct (A
QM
D)
subv
entio
n fu
nds.
The
AQ
MD
fund
s hav
e al
low
ed th
e C
ity to
incr
ease
the
“gre
en fl
eet”
to 6
2 ve
hicl
es.
5.Th
e la
ck o
f fu
ndin
g ha
s pr
esen
ted
a re
al h
indr
ance
as
the
elec
troni
c/co
mpu
ter
hard
war
e an
d so
ftwar
e, a
s w
ell
as c
yber
tech
nolo
gy a
re c
hang
ing
so r
apid
ly.
The
City
/Dep
artm
ents
hav
e no
t had
fun
ding
to m
ake
sign
ifica
nt u
pgra
des
to in
tegr
ate
over
all c
ompa
tibili
ty.
Dep
artm
ents
are
repl
acin
g co
mpu
ters
whe
n fu
ndin
g is
ava
ilabl
e ut
ilizi
ng d
iffer
ent v
ersi
ons
of s
oftw
are
and
oper
atin
g sy
stem
s th
at a
re n
ot c
ompa
tible
. Th
ere
is a
lso
no f
undi
ng f
or c
ompu
ter s
oftw
are
mod
ules
nee
ded
to a
ssis
t the
Fina
nce
Dep
artm
ent
(bud
getin
g, c
ontra
ct m
anag
emen
t, bi
d &
quo
te m
anag
emen
t) an
d Pu
blic
Wor
ks s
oftw
are
to p
rovi
dere
side
nts/
cust
omer
s web
-bas
ed a
cces
s to
plan
subm
ittal
and
per
mit
issu
ance
/trac
king
.
6.A
s sh
own
belo
w, t
here
hav
e be
en n
o ge
nera
l fun
ds a
lloca
ted
for C
IP p
roje
cts
over
the
last
five
yea
rs.
In fa
ct, t
here
hav
e be
enno
gen
eral
fund
s allo
cate
d si
nce
2007
.
Fisc
al Y
ear
Gen
eral
Fun
d $
Res
tric
ted
Fund
$
*Tot
al
2012
-201
3 $0
$3
,060
,000
$3
,060
,000
2011
-201
2 $0
$3
,775
,059
$3
,775
,059
2010
-201
1 $0
$3
,255
,300
$3
,255
,300
2009
-201
0 $0
$2
,514
,000
$2
,514
,000
2008
-200
9 $
0 $5
,017
,856
$5
,017
,856
*
The
tota
l doe
s not
incl
ude
gran
ts o
r oth
er p
roje
cts t
hat a
re su
bjec
t to
fund
ing
avai
labi
lity
199
7.En
ergy
eff
icie
nt p
roje
cts
have
bec
ome
a pr
iorit
y w
ithin
the
City
. N
umer
ous
proj
ects
hav
e be
en c
ompl
eted
ove
r th
e ye
ars
resu
lting
in a
sig
nific
ant
savi
ngs
to th
e C
ity’s
gen
eral
fun
d.
With
the
goal
to s
eek
addi
tiona
l ene
rgy
effic
ient
pro
ject
s th
atas
sist
in th
e re
duct
ion
of g
reen
hous
e ga
s em
issi
ons
as w
ell a
s at
tain
fur
ther
mon
etar
y sa
ving
s fo
r th
e C
ity, s
taff
has
wor
ked
aggr
essi
vely
to id
entif
y ne
w p
roje
cts.
A C
IP “
line
item
” bu
dget
pag
e na
med
Ene
rgy
Eff
icie
ncy
& C
onse
rvat
ion
Proj
ects
was
cre
ated
to id
entif
y th
ese
proj
ects
and
to in
corp
orat
e th
e C
ity E
nerg
y A
ctio
n Pl
an in
to th
e bu
dget
pla
nnin
g pr
oces
s. I
nad
ditio
n, th
e C
ity E
nerg
y A
ctio
n Pl
an w
ill b
e in
corp
orat
ed in
to th
e do
cum
ent t
he C
ity’s
new
Gen
eral
Pla
n R
ewrit
e.
8.Th
is C
IP is
pre
sent
ed to
the
City
Cou
ncil
as a
wor
king
doc
umen
t. T
he p
roje
cts
and
fund
ing
sour
ces
are
subj
ect t
o ch
ange
durin
g th
e bu
dget
yea
r to
bet
ter
refle
ct t
he p
riorit
ies
of t
he C
ity C
ounc
il.
The
City
is
com
mitt
ed t
o m
eetin
g its
cap
ital
impr
ovem
ent n
eeds
in a
fisc
ally
reas
onab
le m
anne
r and
is a
ggre
ssiv
ely
seek
ing
stra
tegi
c al
tern
ativ
es th
at w
ill a
llow
the
high
est
leve
l of
serv
ice
to th
e re
side
nts,
visi
tors
, and
bus
ines
ses
in th
e C
ity o
f W
est C
ovin
a.
Furth
er, s
taff
con
tinue
s to
sea
rch
and
appl
y fo
r gra
nts t
o as
sist
in th
e fu
ndin
g fo
r cap
ital p
roje
cts.
200
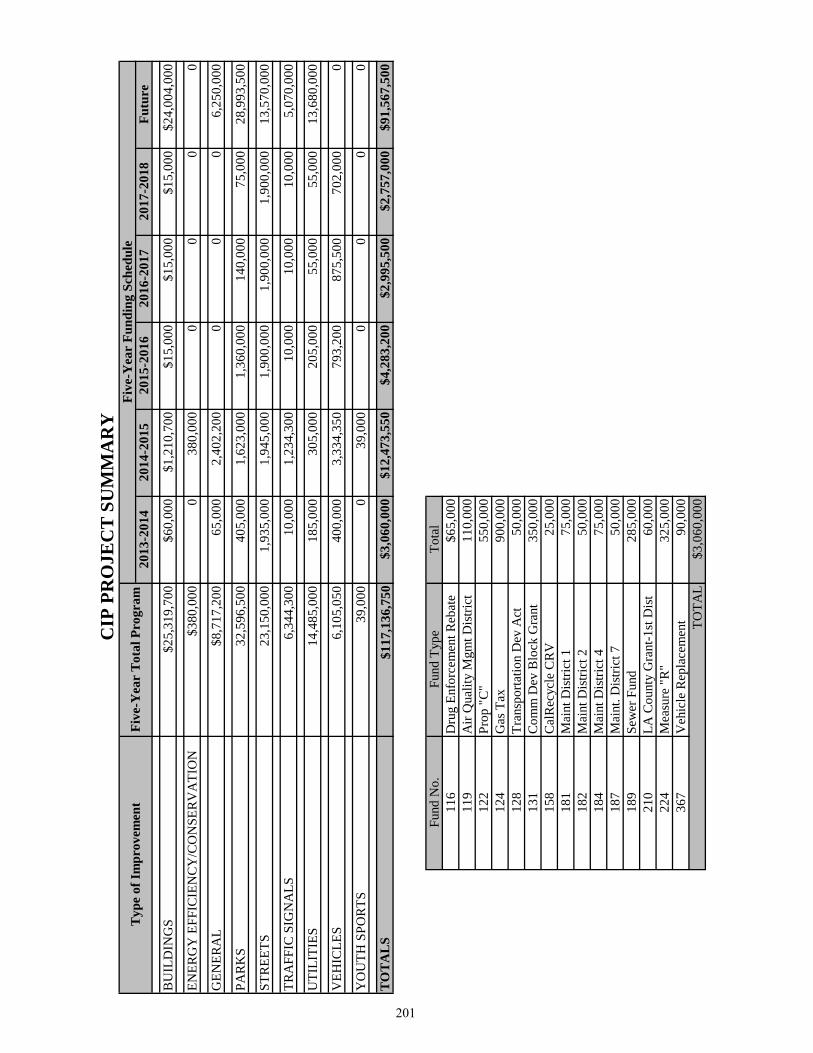
2013
-201
420
14-2
015
2015
-201
620
16-2
017
2017
-201
8Fu
ture
$25,
319,
700
$60,
000
$1,2
10,7
00$1
5,00
0$1
5,00
0$1
5,00
0$2
4,00
4,00
0
$380
,000
038
0,00
00
00
0
$8,7
17,2
0065
,000
2,40
2,20
00
00
6,25
0,00
0
32,5
96,5
0040
5,00
01,
623,
000
1,36
0,00
014
0,00
075
,000
28,9
93,5
00
23,1
50,0
001,
935,
000
1,94
5,00
01,
900,
000
1,90
0,00
01,
900,
000
13,5
70,0
00
6,34
4,30
010
,000
1,23
4,30
010
,000
10,0
0010
,000
5,07
0,00
0
14,4
85,0
0018
5,00
030
5,00
020
5,00
055
,000
55,0
0013
,680
,000
6,10
5,05
040
0,00
03,
334,
350
793,
200
875,
500
702,
000
0
39,0
000
39,0
000
00
0
$117
,136
,750
$3,0
60,0
00$1
2,47
3,55
0$4
,283
,200
$2,9
95,5
00$2
,757
,000
$91,
567,
500
Fu
nd N
o.Fu
nd T
ype
Tota
l11
6D
rug
Enfo
rcem
ent R
ebat
e$6
5,00
011
9A
ir Q
ualit
y M
gmt D
istri
ct11
0,00
012
2Pr
op "
C"
550,
000
124
Gas
Tax
900,
000
128
Tran
spor
tatio
n D
ev A
ct50
,000
131
Com
m D
ev B
lock
Gra
nt35
0,00
015
8C
alR
ecyc
le C
RV
25,0
0018
1M
aint
Dis
trict
175
,000
182
Mai
nt D
istri
ct 2
50,0
0018
4M
aint
Dis
trict
475
,000
187
Mai
nt. D
istri
ct 7
50,0
0018
9Se
wer
Fun
d28
5,00
021
0LA
Cou
nty
Gra
nt-1
st D
ist
60,0
0022
4M
easu
re "
R"
325,
000
367
Veh
icle
Rep
lace
men
t90
,000
$3,0
60,0
00
BU
ILD
ING
S
ENER
GY
EFF
ICIE
NC
Y/C
ON
SER
VA
TIO
N G
ENER
AL
PAR
KS
STR
EETS
TRA
FFIC
SIG
NA
LS
Five
-Yea
r T
otal
Pro
gram
CIP
PR
OJE
CT
SU
MM
AR
Y
Five
-Yea
r Fu
ndin
g Sc
hedu
leT
ype
of Im
prov
emen
t
TO
TA
LS
TOTA
L
UTI
LITI
ES V
EHIC
LES
YO
UTH
SPO
RTS
201

Fund
Num
ber
Fund
Typ
eFu
ndin
g A
vaila
ble
2013
-201
4 E
xpen
ditu
reR
emai
ning
Bal
ance
110
Gen
eral
Fun
d R
eser
ve (U
npro
gram
med
) 0
00
111
Fee
and
Cha
rge
00
011
6/11
7D
rug
Enfo
rcem
ent R
ebat
e65
,000
65,0
000
118
Bus
ines
s Im
prov
emen
t Tax
00
011
9A
QM
D11
0,00
011
0,00
00
121
Prop
ositi
on "A
"0
00
122
Prop
ositi
on "C
"75
0,00
055
0,00
020
0,00
012
3Tr
affic
Saf
ety
00
012
4G
asol
ine
Tax
900,
000
900,
000
0
125
Stat
e Pr
op 4
2 (C
ombi
ned
with
Fun
d 12
4)0
00
126
Prop
ositi
on "1
B"
00
012
8Tr
ansp
orta
tion
Dev
elop
men
t Act
50,0
0050
,000
012
9A
B 9
3924
0,00
00
240,
000
131
CD
BG
350,
000
350,
000
014
0ST
PL0
00
143
Park
Bon
d G
rant
00
014
4Tr
ee10
00
100
153
Publ
ic S
afet
y A
ugm
enta
tion
00
015
8C
alifo
rnia
Red
empt
ion
Val
ue (C
RV
)25
,000
25,0
000
160
Cap
ital P
roje
cts
425,
000
042
5,00
016
1C
onst
ruct
ion
Tax
00
016
3Pa
rk0
00
169
Stat
e Pa
rk B
ond
00
017
0Pa
rk D
edic
atio
n Fe
e "A
"0
00
171
Park
Ded
icat
ion
Fee
"B"
00
017
2*P
ark
Ded
icat
ion
Fee
"C"*
00
017
3Pa
rk D
edic
atio
n Fe
e "D
"0
00
174
Park
Ded
icat
ion
Fee
"E"
00
017
5Pa
rk D
edic
atio
n Fe
e "F
"0
00
176
Park
Ded
icat
ion
Fee
"G"
00
017
7Pa
rk D
edic
atio
n Fe
e "H
"0
00
181
Mai
nten
ance
Dis
trict
11,
250,
000
75,0
001,
175,
000
182
Mai
nten
ance
Dis
trict
245
0,00
050
,000
400,
000
183
WC
CSS
CFD
125,
000
012
5,00
0
2013
-14
CA
PIT
AL
IMPR
OV
EM
EN
T B
UD
GE
T P
RO
POSE
D F
UN
DIN
G S
OU
RC
ES
202
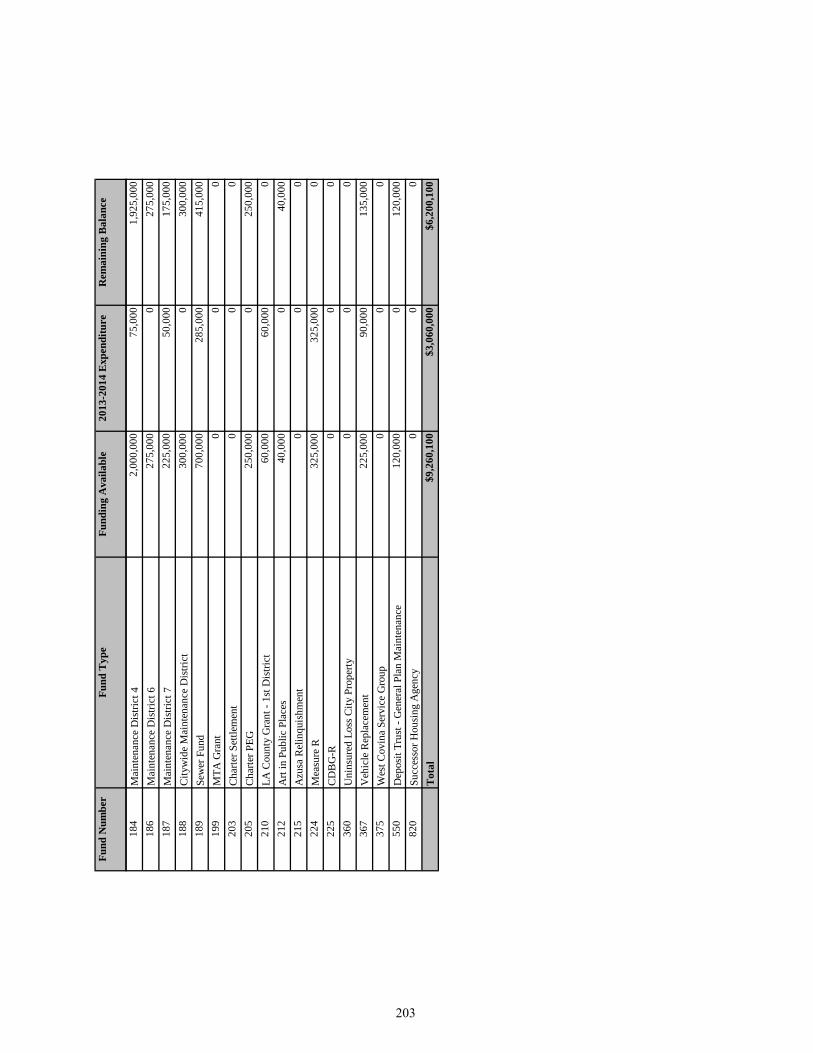
Fund
Num
ber
Fund
Typ
eFu
ndin
g A
vaila
ble
2013
-201
4 E
xpen
ditu
reR
emai
ning
Bal
ance
184
Mai
nten
ance
Dis
trict
42,
000,
000
75,0
001,
925,
000
186
Mai
nten
ance
Dis
trict
627
5,00
00
275,
000
187
Mai
nten
ance
Dis
trict
722
5,00
050
,000
175,
000
188
City
wid
e M
aint
enan
ce D
istri
ct30
0,00
00
300,
000
189
Sew
er F
und
700,
000
285,
000
415,
000
199
MTA
Gra
nt0
00
203
Cha
rter S
ettle
men
t0
00
205
Cha
rter P
EG
250,
000
025
0,00
021
0LA
Cou
nty
Gra
nt -
1st D
istri
ct60
,000
60,0
000
212
Art
in P
ublic
Pla
ces
40,0
000
40,0
0021
5A
zusa
Rel
inqu
ishm
ent
00
022
4M
easu
re R
325,
000
325,
000
022
5C
DB
G-R
00
036
0U
nins
ured
Los
s City
Pro
perty
00
036
7V
ehic
le R
epla
cem
ent
225,
000
90,0
0013
5,00
037
5W
est C
ovin
a Se
rvic
e G
roup
00
055
0D
epos
it Tr
ust -
Gen
eral
Pla
n M
aint
enan
ce
120,
000
012
0,00
082
0Su
cces
sor H
ousi
ng A
genc
y0
00
Tot
al$9
,260
,100
$3,0
60,0
00$6
,200
,100
203

FUN
D N
O.
FUN
DPR
OJE
CT
AM
OU
NT
116
DER
Polic
e Ja
il M
onito
ring
Syst
em$6
5,00
011
9A
QM
DPu
blic
Wor
ks -
Purc
hase
Hyb
rid o
r Alte
rnat
ive
Fuel
ed V
ehic
les/
Truc
ks11
0,00
012
2Pr
op C
Brid
ge R
epai
rs -
City
wid
e25
,000
122
Prop
CBu
s She
lters
- Pu
rcha
se (4
)50
,000
122
Prop
CC
oncr
ete
Bus P
ads P
rogr
am
80,0
0012
2Pr
op C
Stre
et R
ehab
ilita
tion
- Maj
or S
treet
s39
5,00
012
4G
TBr
idge
Rep
airs
- C
ityw
ide
25,0
0012
4G
TC
urb
and
Gut
ter R
epla
cem
ent P
rogr
am
50,0
0012
4G
TSt
reet
Reh
abili
tatio
n - A
nnua
l Pro
gram
Res
iden
tial S
treet
s and
CD
BG S
treet
s45
0,00
012
4G
TSt
reet
Reh
abili
tatio
n - M
ajor
Stre
ets
240,
000
124
GT
Urb
an F
ores
tatio
n Pr
ogra
m (T
ree
City
USA
)25
,000
124
GT
Batte
ry R
epla
cem
ent f
or T
raffi
c Si
gnal
Bat
tery
Bac
k-U
p Sy
stem
s10
,000
124
GT
Back
hoe
100,
000
128
TDA
Side
wal
ks &
Sta
mpe
d C
oncr
ete
50,0
0013
1C
DBG
City
Bui
ldin
gs -
AD
A B
uild
ing
Upg
rade
s30
,000
131
CD
BGA
DA
Insp
ectio
n R
epor
t30
,000
131
CD
BGA
DA
Com
plia
nce
- City
Fac
ilitie
s70
,000
131
CD
BGC
urb
and
Gut
ter R
epla
cem
ent P
rogr
am
50,0
0013
1C
DBG
Stre
et B
arrie
r Rem
oval
s, A
DA
Upg
rade
s85
,000
131
CD
BGSt
reet
Reh
abili
tatio
n - A
nnua
l Pro
gram
Res
iden
tial S
treet
s and
CD
BG S
treet
s85
,000
158
CR
VTr
ash
Rec
epta
cles
in C
ity P
arks
& F
acili
ties
25,0
0018
1M
D1
MD
1 - P
aseo
Lig
htin
g R
epai
r35
,000
181
MD
1M
D1
- Wal
kway
Rep
air/C
lean
ing
40,0
0018
2M
D2
MD
2 - L
ands
cape
& Ir
rigat
ion
Rep
airs
/Upg
rade
s25
,000
182
MD
2M
D2
- Wal
kway
Rep
air/C
lean
ing
25,0
0018
4M
D4
MD
4 - T
ree
Trim
min
g50
,000
184
MD
4M
D4
- Wal
kway
Rep
air/C
lean
ing
25,0
0018
7M
D7
MD
7 - L
ands
cape
& Ir
rigat
ion
Rep
airs
/Upg
rade
s50
,000
189
SF
Free
way
Und
erpa
ss P
ump
Stat
ion
Cle
an O
ut30
,000
189
SF
NPD
ES P
erm
it D
evel
opm
ent
85,0
0018
9SF
Se
wer
Mai
n Li
ne R
epai
rs25
,000
189
SF
Sew
er M
aint
enan
ce M
anag
emen
t Pla
n (S
SMP)
- U
pdat
e25
,000
189
SF
Stor
m D
rain
Cat
ch B
asin
Inse
rts20
,000
189
SF
Back
hoe
100,
000
210
LA C
o G
rant
LA C
ount
y G
rant
- 1s
t Dis
trict
60,0
0022
4M
easu
re R
Stre
et R
ehab
ilita
tion
- Maj
or S
treet
s32
5,00
036
7V
RC
ity Y
ard
Inst
all N
ew V
ehic
le L
ifts i
n Sh
op90
,000
TOTA
L$3
,060
,000
2013
-14
PRO
JEC
T S
UM
MA
RY
BY
FU
ND
NU
MB
ER
204
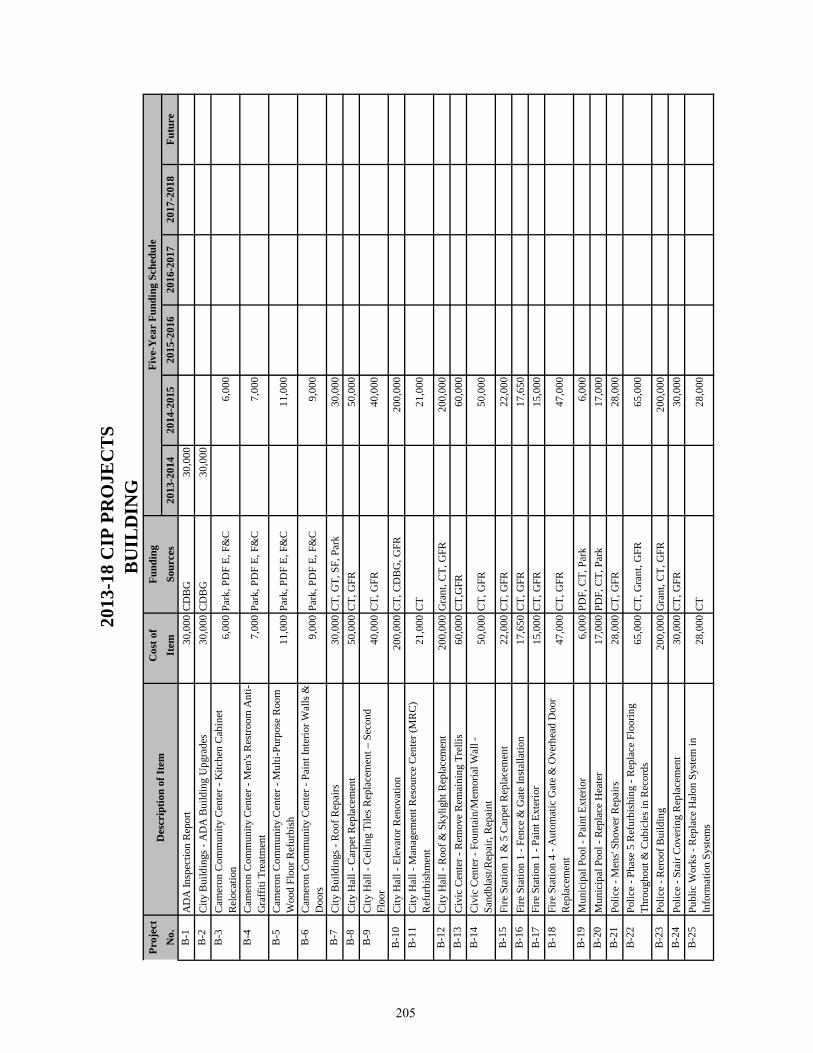
Proj
ect
Cos
t of
Fund
ing
No.
Ite
mSo
urce
s20
13-2
014
2014
-201
520
15-2
016
2016
-201
720
17-2
018
Futu
reB
-1A
DA
Insp
ectio
n R
epor
t30
,000
CD
BG
30,0
00B
-2C
ity B
uild
ings
- A
DA
Bui
ldin
g U
pgra
des
30,0
00C
DB
G30
,000
B-3
Cam
eron
Com
mun
ity C
ente
r - K
itche
n C
abin
et
Rel
ocat
ion
6,00
0Pa
rk, P
DF
E, F
&C
6,00
0
B-4
Cam
eron
Com
mun
ity C
ente
r - M
en's
Res
troom
Ant
i-G
raffi
ti Tr
eatm
ent
7,00
0Pa
rk, P
DF
E, F
&C
7,00
0
B-5
Cam
eron
Com
mun
ity C
ente
r - M
ulti-
Purp
ose
Roo
m
Woo
d Fl
oor R
efur
bish
11
,000
Park
, PD
F E,
F&
C11
,000
B-6
Cam
eron
Com
mun
ity C
ente
r - P
aint
Inte
rior W
alls
&
Doo
rs9,
000
Park
, PD
F E,
F&
C9,
000
B-7
City
Bui
ldin
gs -
Roo
f Rep
airs
30,0
00C
T, G
T, S
F, P
ark
30,0
00B
-8C
ity H
all -
Car
pet R
epla
cem
ent
50,0
00C
T, G
FR50
,000
B-9
City
Hal
l - C
eilin
g Ti
les R
epla
cem
ent –
Sec
ond
Floo
r40
,000
CT,
GFR
40,0
00
B-1
0C
ity H
all -
Ele
vato
r Ren
ovat
ion
200,
000
CT,
CD
BG
, GFR
200,
000
B-1
1C
ity H
all -
Man
agem
ent R
esou
rce
Cen
ter (
MR
C)
Ref
urbi
shm
ent
21,0
00C
T
21,0
00
B-1
2C
ity H
all -
Roo
f & S
kylig
ht R
epla
cem
ent
200,
000
Gra
nt, C
T, G
FR20
0,00
0
B-1
3C
ivic
Cen
ter -
Rem
ove
Rem
aini
ng T
relli
s60
,000
CT,
GFR
60,0
00B
-14
Civ
ic C
ente
r - F
ount
ain/
Mem
oria
l Wal
l -
Sand
blas
t/Rep
air,
Rep
aint
50,0
00C
T, G
FR50
,000
B-1
5Fi
re S
tatio
n 1
& 5
Car
pet R
epla
cem
ent
22,0
00C
T, G
FR22
,000
B-1
6Fi
re S
tatio
n 1
- Fen
ce &
Gat
e In
stal
latio
n17
,650
CT,
GFR
17,6
50B
-17
Fire
Sta
tion
1 - P
aint
Ext
erio
r15
,000
CT,
GFR
15,0
00B
-18
Fire
Sta
tion
4 - A
utom
atic
Gat
e &
Ove
rhea
d D
oor
Rep
lace
men
t47
,000
CT,
GFR
47,0
00
B-1
9M
unic
ipal
Poo
l - P
aint
Ext
erio
r6,
000
PDF,
CT,
Par
k6,
000
B-2
0M
unic
ipal
Poo
l - R
epla
ce H
eate
r17
,000
PDF,
CT,
Par
k17
,000
B-2
1Po
lice
- Men
s' Sh
ower
Rep
airs
28,0
00C
T, G
FR28
,000
B-2
2Po
lice
- Pha
se 5
Ref
urbi
shin
g - R
epla
ce F
loor
ing
Thro
ugho
ut &
Cub
icle
s in
Rec
ords
65,0
00C
T, G
rant
, GFR
65,0
00
B-2
3Po
lice
- Rer
oof B
uild
ing
200,
000
Gra
nt, C
T, G
FR20
0,00
0B
-24
Polic
e - S
tair
Cov
erin
g R
epla
cem
ent
30,0
00C
T, G
FR30
,000
B-2
5Pu
blic
Wor
ks -
Rep
lace
Hal
on S
yste
m in
In
form
atio
n Sy
stem
s28
,000
CT
28
,000
Five
-Yea
r Fu
ndin
g Sc
hedu
le
2013
-18
CIP
PR
OJE
CT
SB
UIL
DIN
G D
escr
iptio
n of
Item
205
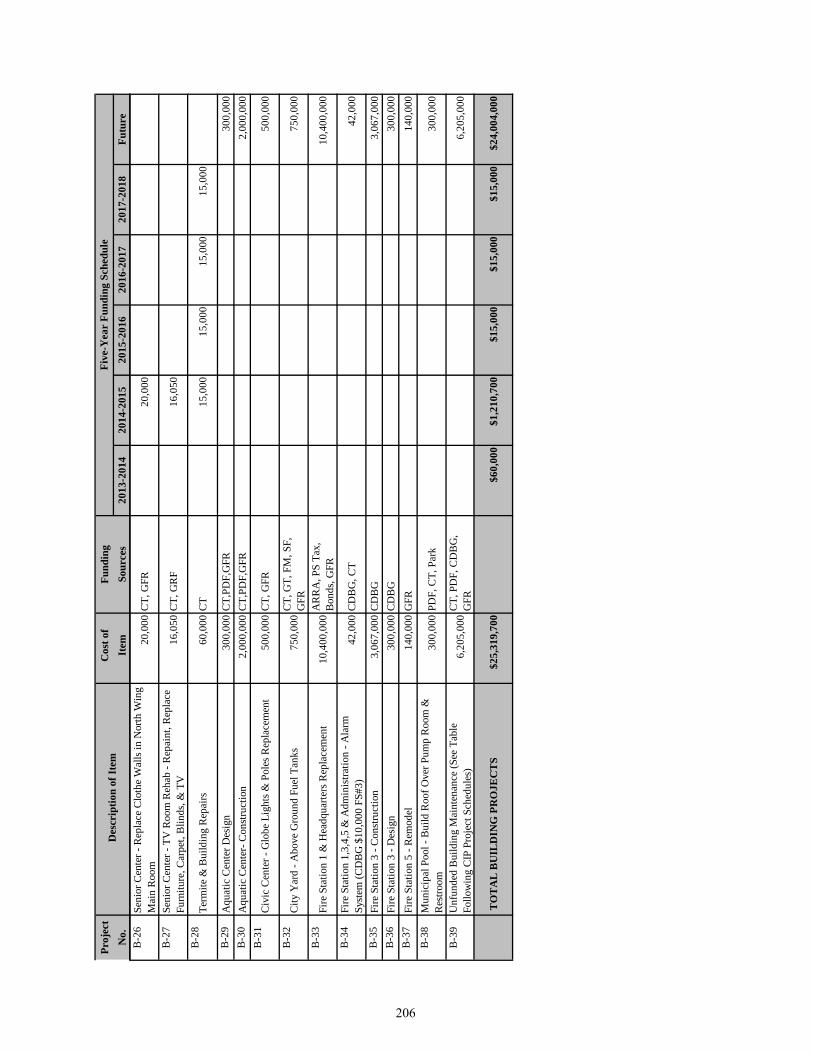
Proj
ect
Cos
t of
Fund
ing
No.
Ite
mSo
urce
s20
13-2
014
2014
-201
520
15-2
016
2016
-201
720
17-2
018
Futu
re
Five
-Yea
r Fu
ndin
g Sc
hedu
le D
escr
iptio
n of
Item
B-2
6Se
nior
Cen
ter -
Rep
lace
Clo
the
Wal
ls in
Nor
th W
ing
Mai
n R
oom
20,0
00C
T, G
FR20
,000
B-2
7Se
nior
Cen
ter -
TV
Roo
m R
ehab
- R
epai
nt, R
epla
ce
Furn
iture
, Car
pet,
Blin
ds, &
TV
16,0
50C
T, G
RF
16,0
50
B-2
8Te
rmite
& B
uild
ing
Rep
airs
60
,000
CT
15
,000
15,0
0015
,000
15,0
00
B-2
9A
quat
ic C
ente
r Des
ign
300,
000
CT,
PDF,
GFR
300,
000
B-3
0A
quat
ic C
ente
r- C
onst
ruct
ion
2,00
0,00
0C
T,PD
F,G
FR2,
000,
000
B-3
1C
ivic
Cen
ter -
Glo
be L
ight
s & P
oles
Rep
lace
men
t50
0,00
0C
T, G
FR
500,
000
B-3
2C
ity Y
ard
- Abo
ve G
roun
d Fu
el T
anks
750,
000
CT,
GT,
FM
, SF,
G
FR75
0,00
0
B-3
3Fi
re S
tatio
n 1
& H
eadq
uarte
rs R
epla
cem
ent
10,4
00,0
00A
RR
A, P
S Ta
x,
Bon
ds, G
FR10
,400
,000
B-3
4Fi
re S
tatio
n 1,
3,4,
5 &
Adm
inis
tratio
n - A
larm
Sy
stem
(CD
BG
$10
,000
FS#
3)42
,000
CD
BG
, CT
42,0
00
B-3
5Fi
re S
tatio
n 3
- Con
stru
ctio
n3,
067,
000
CD
BG
3,06
7,00
0B
-36
Fire
Sta
tion
3 - D
esig
n 30
0,00
0C
DB
G30
0,00
0B
-37
Fire
Sta
tion
5 - R
emod
el
140,
000
GFR
140,
000
B-3
8M
unic
ipal
Poo
l - B
uild
Roo
f Ove
r Pum
p R
oom
&
Res
troom
300,
000
PDF,
CT,
Par
k30
0,00
0
B-3
9U
nfun
ded
Bui
ldin
g M
aint
enan
ce (S
ee T
able
Fo
llow
ing
CIP
Pro
ject
Sch
edul
es)
6,20
5,00
0C
T, P
DF,
CD
BG
, G
FR6,
205,
000
TO
TA
L B
UIL
DIN
G P
RO
JEC
TS
$25,
319,
700
$60,
000
$1,2
10,7
00$1
5,00
0$1
5,00
0$1
5,00
0$2
4,00
4,00
0
206
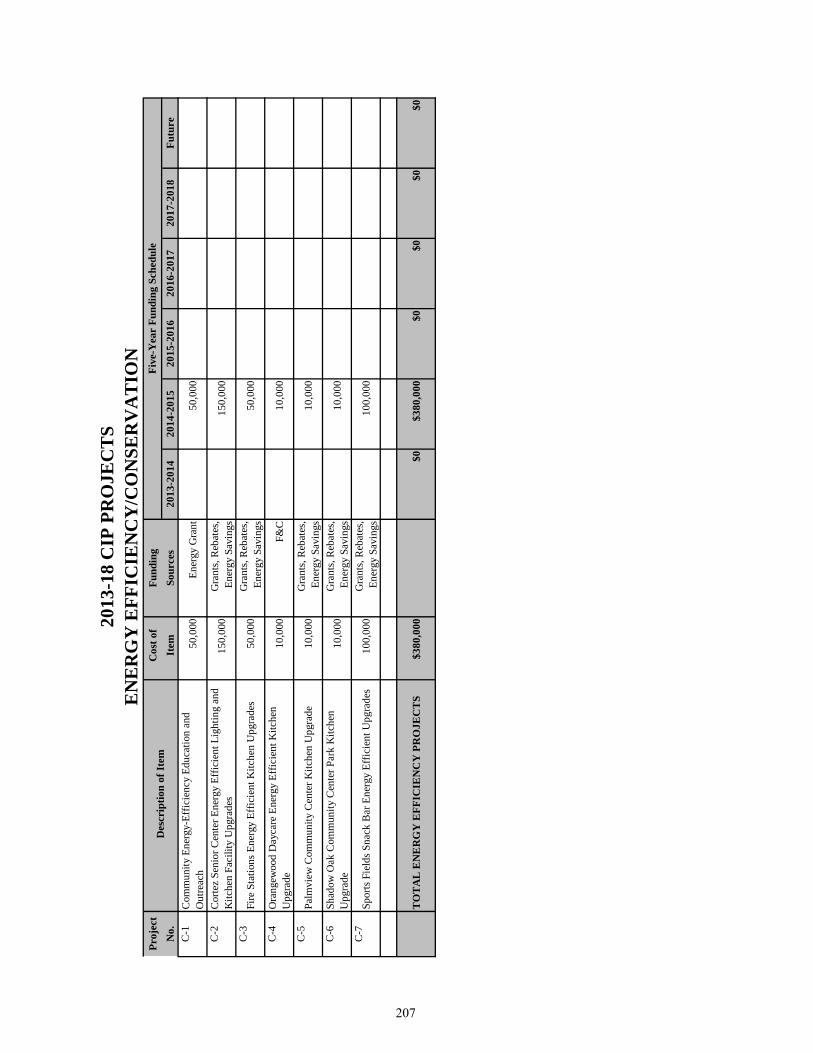
Proj
ect
Cos
t of
Fund
ing
No.
Ite
mSo
urce
s20
13-2
014
2014
-201
520
15-2
016
2016
-201
720
17-2
018
Futu
reC
-1C
omm
unity
Ene
rgy-
Effic
ienc
y Ed
ucat
ion
and
Out
reac
h50
,000
Ener
gy G
rant
50
,000
C-2
Cor
tez
Seni
or C
ente
r Ene
rgy
Effic
ient
Lig
htin
g an
d K
itche
n Fa
cilit
y U
pgra
des
150,
000
Gra
nts,
Reb
ates
, En
ergy
Sav
ings
150,
000
C-3
Fire
Sta
tions
Ene
rgy
Effic
ient
Kitc
hen
Upg
rade
s50
,000
Gra
nts,
Reb
ates
, En
ergy
Sav
ings
50,0
00
C-4
Ora
ngew
ood
Day
care
Ene
rgy
Effic
ient
Kitc
hen
Upg
rade
10,0
00F&
C10
,000
C-5
Palm
view
Com
mun
ity C
ente
r Kitc
hen
Upg
rade
10,0
00G
rant
s, R
ebat
es,
Ener
gy S
avin
gs
10,0
00
C-6
Shad
ow O
ak C
omm
unity
Cen
ter P
ark
Kitc
hen
Upg
rade
10,0
00G
rant
s, R
ebat
es,
Ener
gy S
avin
gs10
,000
C-7
Spor
ts F
ield
s Sna
ck B
ar E
nerg
y Ef
ficie
nt U
pgra
des
100,
000
Gra
nts,
Reb
ates
, En
ergy
Sav
ings
100,
000
TO
TA
L E
NE
RG
Y E
FFIC
IEN
CY
PR
OJE
CT
S$3
80,0
00$0
$380
,000
$0$0
$0$0
Des
crip
tion
of It
em
Five
-Yea
r Fu
ndin
g Sc
hedu
le
2013
-18
CIP
PR
OJE
CT
SE
NE
RG
Y E
FFIC
IEN
CY
/CO
NSE
RV
AT
ION
207
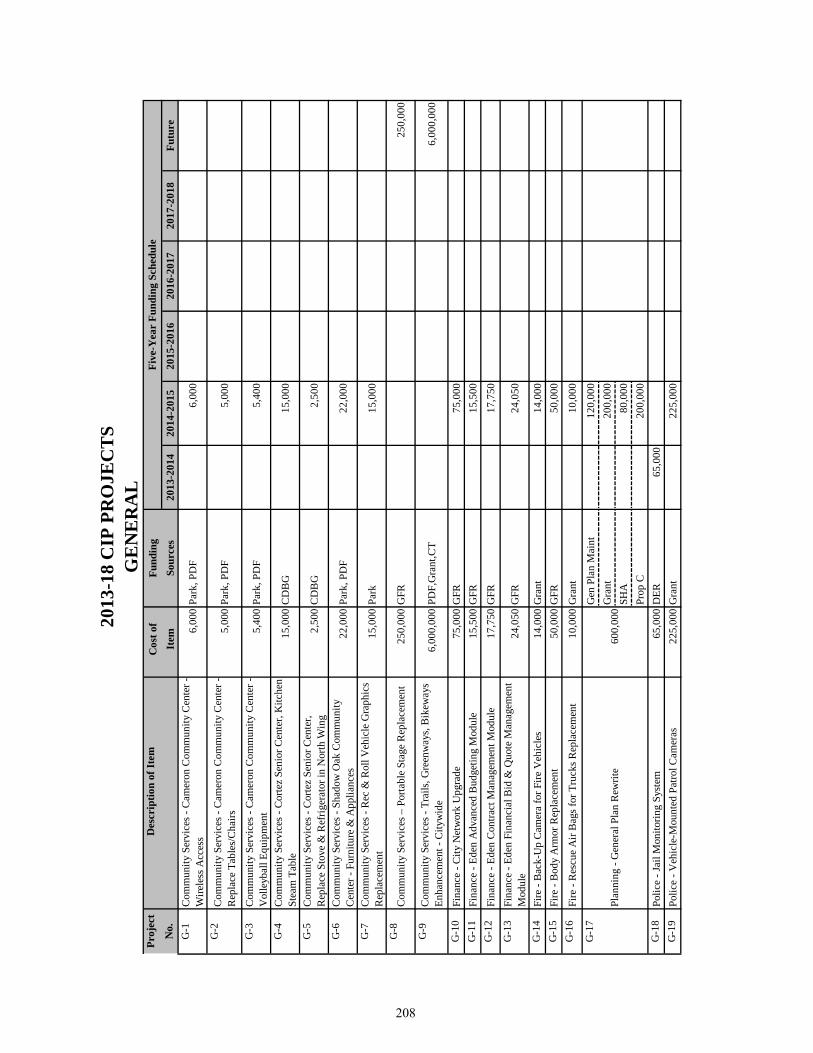
Proj
ect
Cos
t of
Fund
ing
No.
Ite
mSo
urce
s20
13-2
014
2014
-201
520
15-2
016
2016
-201
720
17-2
018
Futu
reG
-1C
omm
unity
Ser
vice
s - C
amer
on C
omm
unity
Cen
ter -
W
irele
ss A
cces
s6,
000
Park
, PD
F6,
000
G-2
Com
mun
ity S
ervi
ces -
Cam
eron
Com
mun
ity C
ente
r -
Rep
lace
Tab
les/
Cha
irs5,
000
Park
, PD
F5,
000
G-3
Com
mun
ity S
ervi
ces -
Cam
eron
Com
mun
ity C
ente
r -
Vol
leyb
all E
quip
men
t5,
400
Park
, PD
F5,
400
G-4
Com
mun
ity S
ervi
ces -
Cor
tez
Seni
or C
ente
r, K
itche
n St
eam
Tab
le15
,000
CD
BG
15,0
00
G-5
Com
mun
ity S
ervi
ces -
Cor
tez
Seni
or C
ente
r, R
epla
ce S
tove
& R
efrig
erat
or in
Nor
th W
ing
2,50
0C
DB
G2,
500
G-6
Com
mun
ity S
ervi
ces -
Sha
dow
Oak
Com
mun
ity
Cen
ter -
Fur
nitu
re &
App
lianc
es22
,000
Park
, PD
F22
,000
G-7
Com
mun
ity S
ervi
ces -
Rec
& R
oll V
ehic
le G
raph
ics
Rep
lace
men
t15
,000
Park
15,0
00
G-8
Com
mun
ity S
ervi
ces –
Por
tabl
e St
age
Rep
lace
men
t 25
0,00
0G
FR25
0,00
0
G-9
Com
mun
ity S
ervi
ces -
Tra
ils, G
reen
way
s, B
ikew
ays
Enha
ncem
ent -
City
wid
e 6,
000,
000
PDF,
Gra
nt,C
T6,
000,
000
G-1
0Fi
nanc
e - C
ity N
etw
ork
Upg
rade
75,0
00G
FR75
,000
G-1
1Fi
nanc
e - E
den
Adv
ance
d B
udge
ting
Mod
ule
15,5
00G
FR15
,500
G-1
2Fi
nanc
e - E
den
Con
tract
Man
agem
ent M
odul
e17
,750
GFR
17,7
50G
-13
Fina
nce
- Ede
n Fi
nanc
ial B
id &
Quo
te M
anag
emen
t M
odul
e24
,050
GFR
24,0
50
G-1
4Fi
re -
Bac
k-U
p C
amer
a fo
r Fire
Veh
icle
s14
,000
Gra
nt14
,000
G-1
5Fi
re -
Bod
y A
rmor
Rep
lace
men
t50
,000
GFR
50,0
00G
-16
Fire
- R
escu
e A
ir B
ags f
or T
ruck
s Rep
lace
men
t10
,000
Gra
nt10
,000
Gen
Pla
n M
aint
120,
000
Gra
nt20
0,00
0SH
A80
,000
Prop
C20
0,00
0G
-18
Polic
e - J
ail M
onito
ring
Syst
em65
,000
DER
65,0
00
G-1
9Po
lice
- Veh
icle
-Mou
nted
Pat
rol C
amer
as22
5,00
0G
rant
225,
000
2013
-18
CIP
PR
OJE
CT
SG
EN
ER
AL
Des
crip
tion
of It
em
Five
-Yea
r Fu
ndin
g Sc
hedu
le
G-1
7
Plan
ning
- G
ener
al P
lan
Rew
rite
600,
000
208
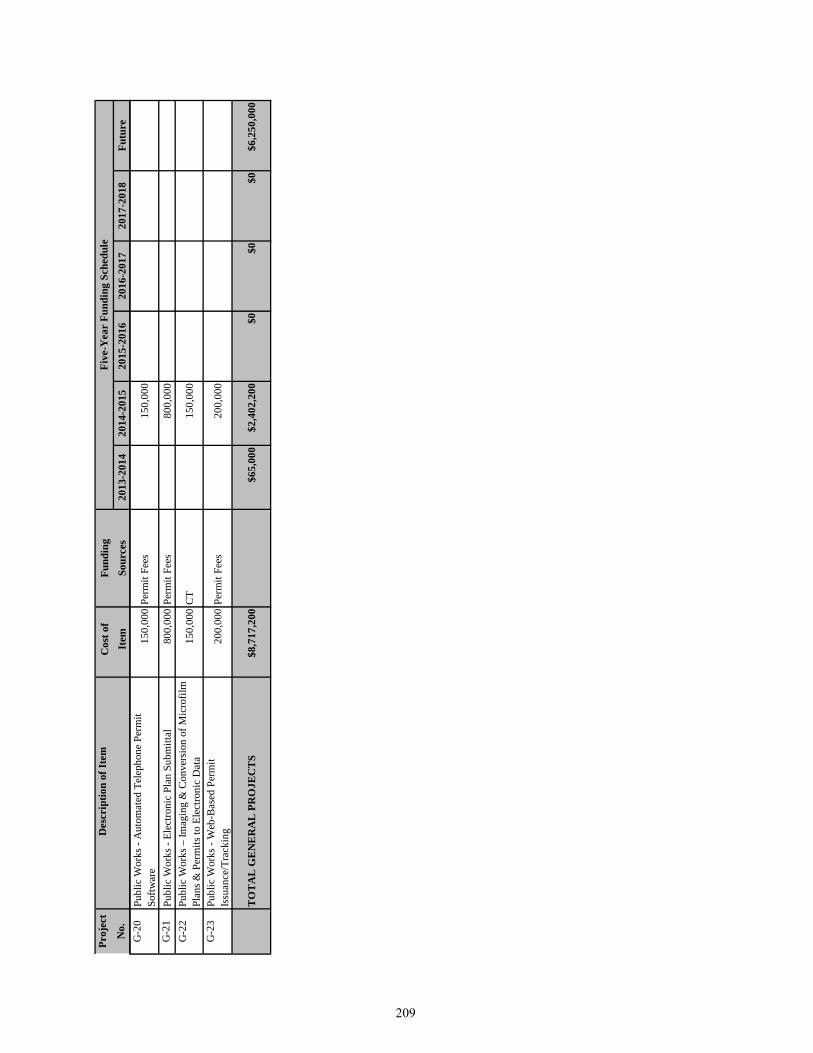
Proj
ect
Cos
t of
Fund
ing
No.
Ite
mSo
urce
s20
13-2
014
2014
-201
520
15-2
016
2016
-201
720
17-2
018
Futu
re
Des
crip
tion
of It
em
Five
-Yea
r Fu
ndin
g Sc
hedu
le
G-2
0Pu
blic
Wor
ks -
Aut
omat
ed T
elep
hone
Per
mit
Softw
are
150,
000
Perm
it Fe
es15
0,00
0
G-2
1Pu
blic
Wor
ks -
Elec
troni
c Pl
an S
ubm
ittal
800,
000
Perm
it Fe
es80
0,00
0G
-22
Publ
ic W
orks
– Im
agin
g &
Con
vers
ion
of M
icro
film
Pl
ans &
Per
mits
to E
lect
roni
c D
ata
150,
000
CT
150,
000
G-2
3Pu
blic
Wor
ks -
Web
-Bas
ed P
erm
it Is
suan
ce/T
rack
ing
200,
000
Perm
it Fe
es20
0,00
0
T
OT
AL
GE
NE
RA
L P
RO
JEC
TS
$8,7
17,2
00$6
5,00
0$2
,402
,200
$0$0
$0$6
,250
,000
209

Proj
ect
Cos
t of
Fund
ing
No.
Item
Sour
ces
2013
-201
420
14-2
015
2015
-201
620
16-2
017
2017
-201
8Fu
ture
G
EN
ER
AL
PA
RK
IMPR
OV
EM
EN
TS
P-1
Unf
unde
d C
ityw
ide
Park
Impr
ovem
ents
(See
Tab
le
Follo
win
g C
IP P
roje
ct S
ched
ules
)17
,533
,500
Unf
unde
d17
,533
,500
P-2
AD
A C
ompl
ianc
e - C
ity F
acili
ties
190,
000
CD
BG
70,0
0030
,000
30,0
0030
,000
30,0
00P-
3B
allfi
eld
Ligh
ting
- Bul
b R
epla
cem
ent
20,0
00C
T5,
000
5,00
05,
000
5,00
0P-
4M
isce
llane
ous P
ark
Impr
ovem
ents
120,
000
Park
30,0
0030
,000
30,0
0030
,000
P-
5Pa
rks P
arki
ng L
ot P
avin
g30
,000
CT,
PD
F, P
ark
30
,000
P-6
Spor
ts F
ield
Saf
ety
Net
ting
Rep
lace
men
t40
,000
Park
10
,000
10,0
0010
,000
10,0
00P-
7Tr
ash
Rec
epta
cles
in P
arks
& C
ity F
acili
ties
25,0
00C
RV
25,0
00
P-8
Tree
Pla
ntin
g - C
ount
y G
rant
60,0
00G
rant
60,0
00
AR
OM
A P
AR
KE
TT
E
P-9
Inst
all W
alkw
ay50
,000
F50
,000
C
AM
ER
ON
PA
RK
P-
10El
ectro
nic
Mar
quee
s55
,000
C55
,000
P-11
Rep
lace
Tot
lot*
220,
000
C
220,
000
C
OR
TE
Z PA
RK
P-
12Im
prov
emen
ts P
er M
aste
r Pla
n1,
800,
000
E1,
800,
000
P-13
Fenc
ing
Perim
eter
45,0
00PD
F E
45
,000
P-14
Dra
in R
epai
r Beh
ind
Snac
k B
ar -
Add
'l Fu
nds
15,0
00PD
F E
15
,000
P-15
Slur
ry S
eal &
Res
tripe
(3) P
arki
ng L
ots (
Sout
hsid
e of
Par
k)50
,000
E50
,000
D
EL
NO
RT
E
P-
16R
epla
ce T
enni
s Cou
rt W
ind-
Shee
n N
ettin
g10
,000
A
10,0
00
GA
LST
ER
PA
RK
P-17
Con
nect
ing
Trai
ls - E
IR/D
esig
n40
5,00
0G
rant
, PD
F F
25
5,00
085
,000
65,0
00
P-18
Con
nect
ing
Trai
ls - C
onst
ruct
ion
1,50
0,00
0G
rant
, PD
F F
1,50
0,00
0
2013
-18
CIP
PR
OJE
CT
SPA
RK
SFi
ve-Y
ear
Fund
ing
Sche
dule
Des
crip
tion
of It
em
210
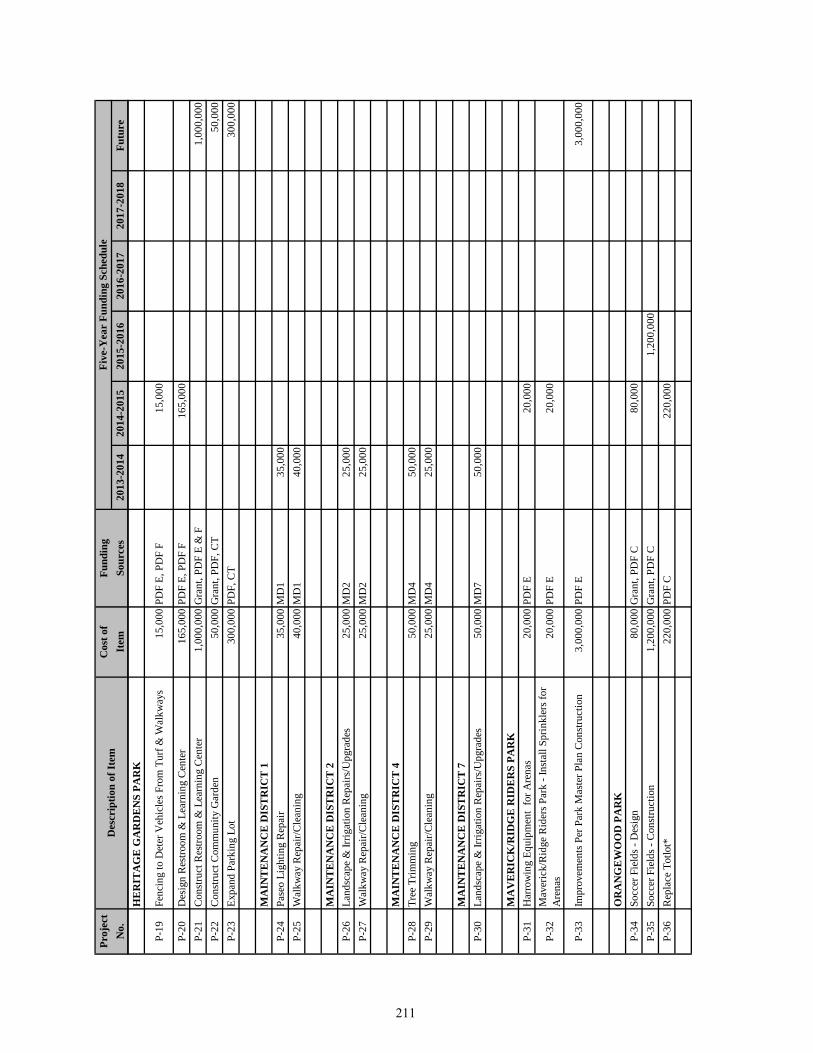
Proj
ect
Cos
t of
Fund
ing
No.
Item
Sour
ces
2013
-201
420
14-2
015
2015
-201
620
16-2
017
2017
-201
8Fu
ture
Five
-Yea
r Fu
ndin
g Sc
hedu
leD
escr
iptio
n of
Item
HE
RIT
AG
E G
AR
DE
NS
PAR
K
P-19
Fenc
ing
to D
eter
Veh
icle
s Fro
m T
urf &
Wal
kway
s15
,000
E, P
DF
F
15,0
00
P-20
Des
ign
Res
troom
& L
earn
ing
Cen
ter
165,
000
E, P
DF
F
165,
000
P-21
Con
stru
ct R
estro
om &
Lea
rnin
g C
ente
r1,
000,
000
Gra
nt, P
DF
E &
F1,
000,
000
P-22
Con
stru
ct C
omm
unity
Gar
den
50,0
00G
rant
, PD
F, C
T50
,000
P-23
Expa
nd P
arki
ng L
ot30
0,00
0PD
F, C
T30
0,00
0
MA
INT
EN
AN
CE
DIS
TR
ICT
1P-
24Pa
seo
Ligh
ting
Rep
air
35,0
00M
D1
35,0
00P-
25W
alkw
ay R
epai
r/Cle
anin
g40
,000
MD
140
,000
MA
INT
EN
AN
CE
DIS
TR
ICT
2P-
26La
ndsc
ape
& Ir
rigat
ion
Rep
airs
/Upg
rade
s25
,000
MD
225
,000
P-27
Wal
kway
Rep
air/C
lean
ing
25,0
00M
D2
25,0
00
MA
INT
EN
AN
CE
DIS
TR
ICT
4P-
28Tr
ee T
rimm
ing
50,0
00M
D4
50,0
00P-
29W
alkw
ay R
epai
r/Cle
anin
g25
,000
MD
425
,000
MA
INT
EN
AN
CE
DIS
TR
ICT
7P-
30La
ndsc
ape
& Ir
rigat
ion
Rep
airs
/Upg
rade
s50
,000
MD
750
,000
M
AV
ER
ICK
/RID
GE
RID
ER
S PA
RK
P-
31H
arro
win
g Eq
uipm
ent
for A
rena
s20
,000
E
20,0
00
P-32
Mav
eric
k/R
idge
Rid
ers P
ark
- Ins
tall
Sprin
kler
s for
A
rena
s20
,000
E20
,000
P-33
Impr
ovem
ents
Per
Par
k M
aste
r Pla
n C
onst
ruct
ion
3,00
0,00
0PD
F E
3,00
0,00
0
O
RA
NG
EW
OO
D P
AR
K
P-34
Socc
er F
ield
s - D
esig
n80
,000
Gra
nt, P
DF
C
80,0
00
P-35
Socc
er F
ield
s - C
onst
ruct
ion
1,20
0,00
0G
rant
, PD
F C
1,20
0,00
0
P-36
Rep
lace
Tot
lot*
220,
000
C
220,
000
211
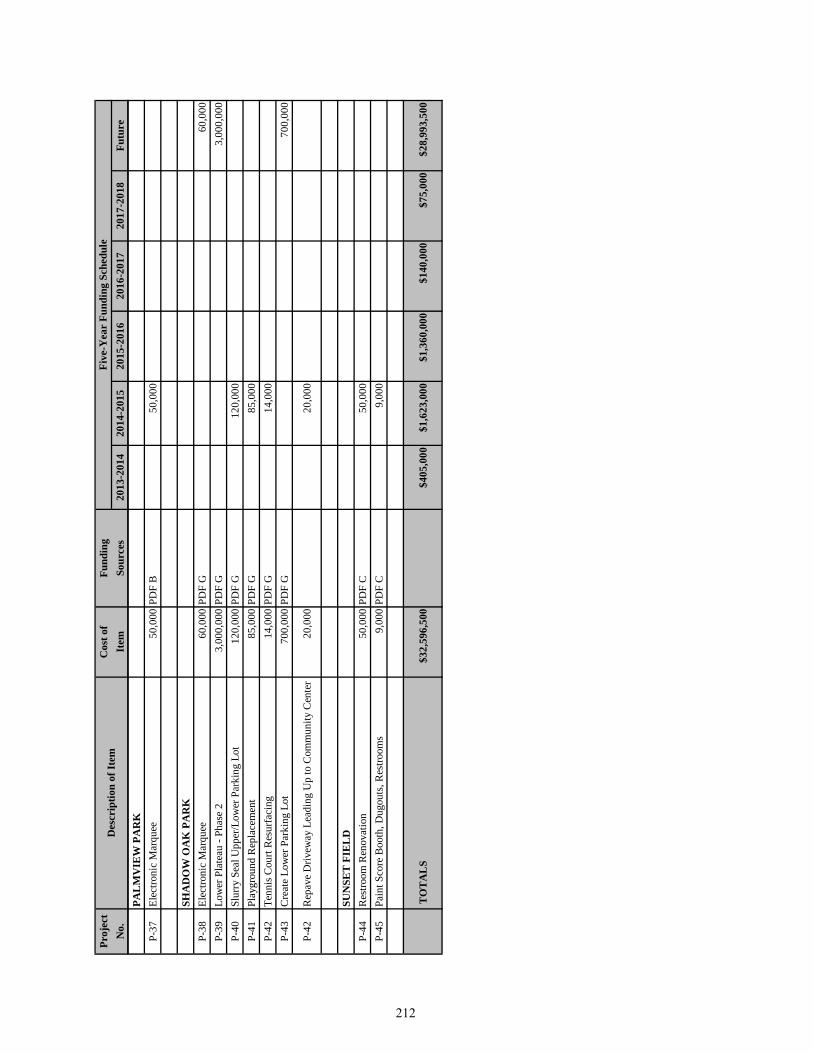
Proj
ect
Cos
t of
Fund
ing
No.
Item
Sour
ces
2013
-201
420
14-2
015
2015
-201
620
16-2
017
2017
-201
8Fu
ture
Five
-Yea
r Fu
ndin
g Sc
hedu
leD
escr
iptio
n of
Item
PAL
MV
IEW
PA
RK
P-
37El
ectro
nic
Mar
quee
50,0
00PD
F B
50
,000
SH
AD
OW
OA
K P
AR
K
P-38
Elec
troni
c M
arqu
ee60
,000
G60
,000
P-39
Low
er P
late
au -
Phas
e 2
3,00
0,00
0PD
F G
3,00
0,00
0P-
40Sl
urry
Sea
l Upp
er/L
ower
Par
king
Lot
120,
000
G12
0,00
0P-
41Pl
aygr
ound
Rep
lace
men
t85
,000
G85
,000
P-42
Tenn
is C
ourt
Res
urfa
cing
14,0
00PD
F G
14,0
00P-
43C
reat
e Lo
wer
Par
king
Lot
700,
000
G70
0,00
0
P-42
Rep
ave
Driv
eway
Lea
ding
Up
to C
omm
unity
Cen
ter
20,0
00
20,0
00
SUN
SET
FIE
LD
P-44
Res
troom
Ren
ovat
ion
50,0
00PD
F C
50
,000
P-45
Pain
t Sco
re B
ooth
, Dug
outs
, Res
troom
s9,
000
C
9,00
0
T
OT
AL
S $3
2,59
6,50
0$4
05,0
00$1
,623
,000
$1,3
60,0
00$1
40,0
00$7
5,00
0$2
8,99
3,50
0
212
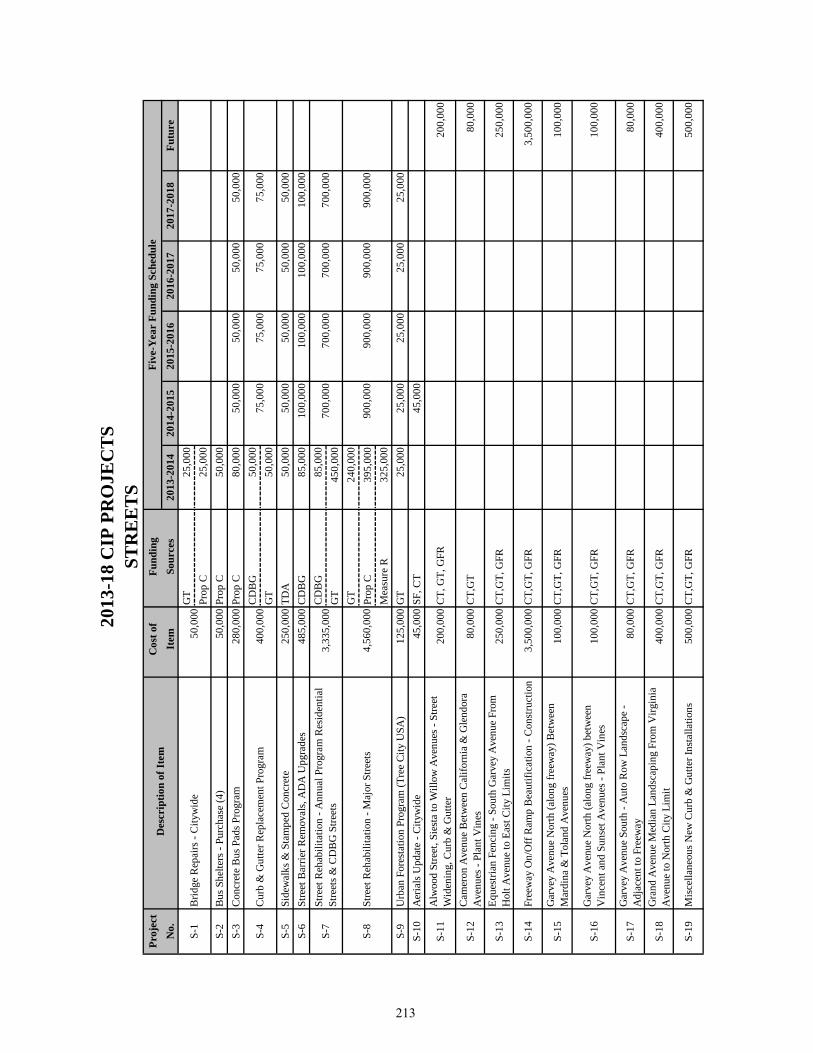
Proj
ect
Cos
t of
Fun
ding
N
o. I
tem
S
ourc
es
2013
-201
420
14-2
015
2015
-201
620
16-2
017
2017
-201
8Fu
ture
GT
25,0
00Pr
op C
25,0
00S-
2B
us S
helte
rs -
Purc
hase
(4)
50,0
00Pr
op C
50,0
00S-
3C
oncr
ete
Bus
Pad
s Pro
gram
28
0,00
0Pr
op C
80,0
0050
,000
50,0
0050
,000
50,0
00C
DB
G50
,000
GT
50,0
00S-
5Si
dew
alks
& S
tam
ped
Con
cret
e25
0,00
0TD
A50
,000
50,0
0050
,000
50,0
0050
,000
S-
6St
reet
Bar
rier R
emov
als,
AD
A U
pgra
des
485,
000
CD
BG
85,0
0010
0,00
010
0,00
010
0,00
010
0,00
0
CD
BG
85,0
00G
T45
0,00
0G
T24
0,00
0Pr
op C
395,
000
Mea
sure
R32
5,00
0S-
9U
rban
For
esta
tion
Prog
ram
(Tre
e C
ity U
SA)
125,
000
GT
25,0
0025
,000
25,0
0025
,000
25,0
00
S-10
Aer
ials
Upd
ate
- City
wid
e45
,000
SF, C
T
45,0
00
S-11
Alw
ood
Stre
et, S
iest
a to
Will
ow A
venu
es -
Stre
et
Wid
enin
g, C
urb
& G
utte
r20
0,00
0C
T, G
T, G
FR20
0,00
0
S-12
Cam
eron
Ave
nue
Bet
wee
n C
alifo
rnia
& G
lend
ora
Ave
nues
- Pl
ant V
ines
80,0
00C
T,G
T80
,000
S-13
Eque
stria
n Fe
ncin
g - S
outh
Gar
vey
Ave
nue
From
H
olt A
venu
e to
Eas
t City
Lim
its25
0,00
0C
T,G
T, G
FR25
0,00
0
S-14
Free
way
On/
Off
Ram
p B
eaut
ifica
tion
- Con
stru
ctio
n3,
500,
000
CT,
GT,
GFR
3,50
0,00
0
S-15
Gar
vey
Ave
nue
Nor
th (a
long
free
way
) Bet
wee
n M
ardi
na &
Tol
and
Ave
nues
100,
000
CT,
GT,
GFR
100,
000
S-16
Gar
vey
Ave
nue
Nor
th (a
long
free
way
) bet
wee
n V
ince
nt a
nd S
unse
t Ave
nues
- Pl
ant V
ines
100,
000
CT,
GT,
GFR
100,
000
S-17
Gar
vey
Ave
nue
Sout
h - A
uto
Row
Lan
dsca
pe -
Adj
acen
t to
Free
way
80,0
00C
T,G
T, G
FR80
,000
S-18
Gra
nd A
venu
e M
edia
n La
ndsc
apin
g Fr
om V
irgin
ia
Ave
nue
to N
orth
City
Lim
it 40
0,00
0C
T,G
T, G
FR40
0,00
0
S-19
Mis
cella
neou
s New
Cur
b &
Gut
ter I
nsta
llatio
ns50
0,00
0C
T,G
T, G
FR50
0,00
0
2013
-18
CIP
PR
OJE
CT
SST
RE
ET
S D
escr
iptio
n of
Item
Fi
ve-Y
ear
Fund
ing
Sche
dule
S-1
Brid
ge R
epai
rs -
City
wid
e50
,000
75,0
0075
,000
75,0
0075
,000
S-
4C
urb
& G
utte
r Rep
lace
men
t Pro
gram
40
0,00
0
S-7
900,
000
S-8
Stre
et R
ehab
ilita
tion
- Maj
or S
treet
s4,
560,
000
700,
000
900,
000
900,
000
900,
000
3,33
5,00
0St
reet
Reh
abili
tatio
n - A
nnua
l Pro
gram
Res
iden
tial
Stre
ets &
CD
BG
Stre
ets
700,
000
700,
000
700,
000
213

Proj
ect
Cos
t of
Fun
ding
N
o. I
tem
S
ourc
es
2013
-201
420
14-2
015
2015
-201
620
16-2
017
2017
-201
8Fu
ture
Des
crip
tion
of It
em
Five
-Yea
r Fu
ndin
g Sc
hedu
le
S-20
Mos
sber
g A
venu
e, S
outh
Gar
vey
to W
illow
Ave
nues
- S
treet
Wid
enin
g, C
urb
& G
utte
r17
5,00
0C
T,G
T, G
FR17
5,00
0
S-21
Nog
ales
Stre
et B
etw
een
Hol
lingw
orth
Stre
et &
V
alle
y V
iew
Ave
nue
- Pla
nt V
ines
on
East
Sid
e W
all
100,
000
CT,
GT,
GFR
100,
000
S-22
Paci
fic L
ane,
175
' eas
terly
of M
orris
Stre
et -
Stre
et
Wid
enin
g, C
urb
& G
utte
r75
,000
CT,
GT,
GFR
75,0
00
S-23
Stre
et R
ehab
ilita
tion
Bac
klog
6,
000,
000
CT,
GT,
Pro
p C
, C
DB
G, G
FR6,
000,
000
S-24
Suns
et A
venu
e M
edia
n La
ndsc
apin
g Fr
om M
erce
d to
Fai
rgro
ve A
venu
es
800,
000
CT,
GT,
GFR
800,
000
S-25
Suns
et A
venu
e M
edia
n La
ndsc
apin
g Fr
om P
uent
e A
venu
e to
Bad
illo
Stre
et
250,
000
CT,
GT,
GFR
250,
000
S-26
Suns
et A
venu
e W
est S
ide
Rel
ands
capi
ng o
f Slo
pe
Nor
th o
f Rou
te 1
0 60
,000
CT,
GT,
GFR
60,0
00
S-27
Val
ley
Bou
leva
rd M
edia
n - R
emov
e A
spha
lt &
In
stal
l Lan
dsca
ping
900,
000
Gra
nt
900,
000
T
OT
AL
S $2
3,15
0,00
0$1
,935
,000
$1,9
45,0
00$1
,900
,000
$1,9
00,0
00$1
,900
,000
$13,
570,
000
214
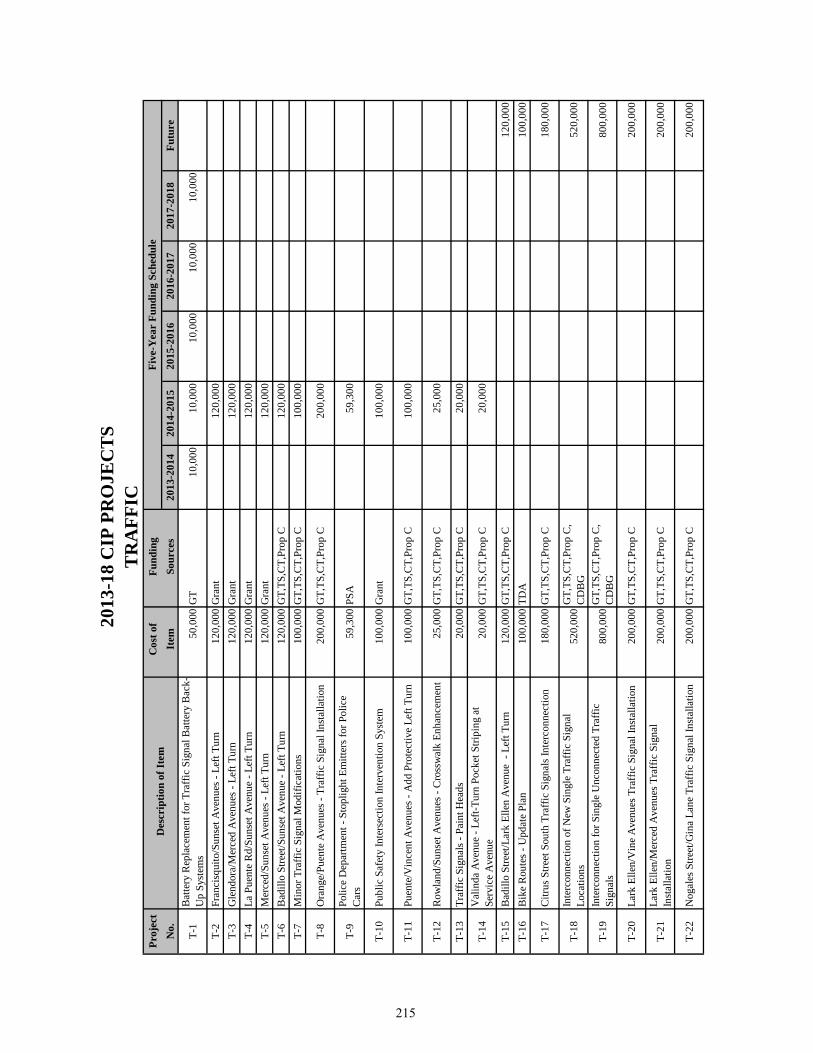
Proj
ect
Cos
t of
Fun
ding
N
o. I
tem
S
ourc
es
2013
-201
420
14-2
015
2015
-201
620
16-2
017
2017
-201
8Fu
ture
T-1
Bat
tery
Rep
lace
men
t for
Tra
ffic
Sign
al B
atte
ry B
ack-
Up
Syst
ems
50,0
00G
T10
,000
10,0
0010
,000
10,0
0010
,000
T-2
Fran
cisq
uito
/Sun
set A
venu
es -
Left
Turn
120,
000
Gra
nt
120,
000
T-3
Gle
ndor
a/M
erce
d A
venu
es -
Left
Turn
120,
000
Gra
nt
120,
000
T-4
La P
uent
e R
d/Su
nset
Ave
nue
- Lef
t Tur
n12
0,00
0G
rant
12
0,00
0T-
5M
erce
d/Su
nset
Ave
nues
- Le
ft Tu
rn12
0,00
0G
rant
12
0,00
0T-
6B
adill
o St
reet
/Sun
set A
venu
e - L
eft T
urn
120,
000
GT,
TS,C
T,Pr
op C
120,
000
T-7
Min
or T
raffi
c Si
gnal
Mod
ifica
tions
100,
000
GT,
TS,C
T,Pr
op C
100,
000
T-8
Ora
nge/
Puen
te A
venu
es -
Traf
fic S
igna
l Ins
talla
tion
200,
000
GT,
TS,C
T,Pr
op C
200,
000
T-9
Polic
e D
epar
tmen
t - S
topl
ight
Em
itter
s for
Pol
ice
Car
s59
,300
PSA
59,3
00
T-10
Publ
ic S
afet
y In
ters
ectio
n In
terv
entio
n Sy
stem
100,
000
Gra
nt10
0,00
0
T-11
Puen
te/V
ince
nt A
venu
es -
Add
Pro
tect
ive
Left
Turn
100,
000
GT,
TS,C
T,Pr
op C
100,
000
T-12
Row
land
/Sun
set A
venu
es -
Cro
ssw
alk
Enha
ncem
ent
25,0
00G
T,TS
,CT,
Prop
C
25,0
00
T-13
Traf
fic S
igna
ls - P
aint
Hea
ds20
,000
GT,
TS,C
T,Pr
op C
20,0
00
T-14
Val
inda
Ave
nue
- Lef
t-Tur
n Po
cket
Stri
ping
at
Serv
ice
Ave
nue
20,0
00G
T,TS
,CT,
Prop
C20
,000
T-15
Bad
illo
Stre
et/L
ark
Elle
n A
venu
e -
Left
Turn
120,
000
GT,
TS,C
T,Pr
op C
120,
000
T-16
Bik
e R
oute
s - U
pdat
e Pl
an10
0,00
0TD
A10
0,00
0
T-17
Citr
us S
treet
Sou
th T
raffi
c Si
gnal
s Int
erco
nnec
tion
180,
000
GT,
TS,C
T,Pr
op C
180,
000
T-18
Inte
rcon
nect
ion
of N
ew S
ingl
e Tr
affic
Sig
nal
Loca
tions
52
0,00
0G
T,TS
,CT,
Prop
C,
CD
BG
520,
000
T-19
Inte
rcon
nect
ion
for S
ingl
e U
ncon
nect
ed T
raffi
c Si
gnal
s 80
0,00
0G
T,TS
,CT,
Prop
C,
CD
BG
800,
000
T-20
Lark
Elle
n/V
ine
Ave
nues
Tra
ffic
Sign
al In
stal
latio
n20
0,00
0G
T,TS
,CT,
Prop
C20
0,00
0
T-21
Lark
Elle
n/M
erce
d A
venu
es T
raffi
c Si
gnal
In
stal
latio
n 20
0,00
0G
T,TS
,CT,
Prop
C20
0,00
0
T-22
Nog
ales
Stre
et/G
ina
Lane
Tra
ffic
Sign
al In
stal
latio
n 20
0,00
0G
T,TS
,CT,
Prop
C20
0,00
0
2013
-18
CIP
PR
OJE
CT
ST
RA
FFIC
Des
crip
tion
of It
em
Five
-Yea
r Fu
ndin
g Sc
hedu
le
215
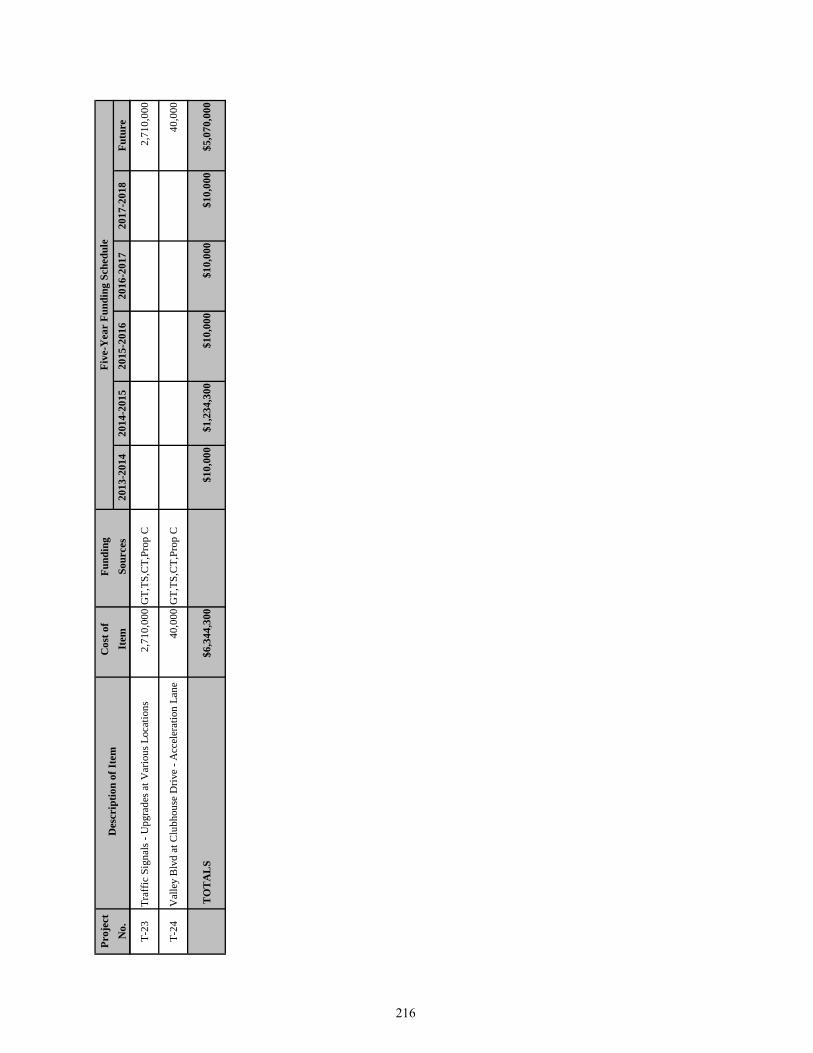
Proj
ect
Cos
t of
Fun
ding
N
o. I
tem
S
ourc
es
2013
-201
420
14-2
015
2015
-201
620
16-2
017
2017
-201
8Fu
ture
Des
crip
tion
of It
em
Five
-Yea
r Fu
ndin
g Sc
hedu
le
T-23
Traf
fic S
igna
ls - U
pgra
des a
t Var
ious
Loc
atio
ns2,
710,
000
GT,
TS,C
T,Pr
op C
2,71
0,00
0
T-24
Val
ley
Blv
d at
Clu
bhou
se D
rive
- Acc
eler
atio
n La
ne40
,000
GT,
TS,C
T,Pr
op C
40,0
00
TO
TA
LS
$6,3
44,3
00$1
0,00
0$1
,234
,300
$10,
000
$10,
000
$10,
000
$5,0
70,0
00
216

Proj
ect
Cos
t of
Fun
ding
N
o. I
tem
S
ourc
es
2013
-201
420
14-2
015
2015
-201
620
16-2
017
2017
-201
8Fu
ture
U-1
Free
way
Und
erpa
ss P
ump
Stat
ion
Cle
an O
ut15
0,00
0SF
30
,000
30,0
0030
,000
30,0
0030
,000
U
-2N
PDES
Per
mit
Dev
elop
men
t85
,000
SF
85,0
00U
-3Se
wer
Mai
n Li
ne R
epai
rs12
5,00
0SF
25
,000
25,0
0025
,000
25,0
0025
,000
U-4
Sew
er M
aint
enan
ce M
anag
emen
t Pla
n (S
SMP)
- U
pdat
e25
,000
SF
25,0
00
U-5
Stor
m D
rain
Cat
ch B
asin
Inse
rts (S
cree
ns)
20,0
00SF
20
,000
U-6
Cel
l Tow
er (B
KK
) - R
epai
ntin
g50
,000
CT
50
,000
U-7
Hill
war
d/N
orm
a A
venu
es -
Stor
m D
rain
C
onst
ruct
ion
50,0
00C
T, G
T
50,0
00
U-8
NPD
ES T
reat
men
t of S
torm
Wat
er a
t Azu
sa &
Pu
ente
Ave
nues
50,0
00G
T, C
T, S
F
50,0
00
U-9
Stor
m W
ater
Infil
tratio
n Pr
ojec
t10
0,00
0G
T, C
T10
0,00
0
U-1
0St
orm
Dra
in L
ater
al R
epai
r/Rep
lace
men
t (A
rom
a D
rive
& W
alnu
t Cre
ek P
kwy)
150,
000
GT,
CT
15
0000
U-1
1A
zusa
Ave
nue
From
Aro
ma
Driv
e to
Nor
th C
ity
Lim
its -
Und
ergr
ound
Util
ities
6,50
0,00
0R
ule
216,
500,
000
U-1
2A
zusa
Ave
nue
Stor
m D
rain
(Row
land
to B
adill
o)
incl
udin
g La
tera
ls in
Wor
kman
, Row
land
& P
uent
e A
venu
es –
LA
Co.
, Sta
te1,
800,
000
GT,
Rel
inqu
ish
Fund
s1,
800,
000
U-1
3C
alifo
rnia
Ave
nue
Dra
in (V
ine
to C
amer
on) &
Vin
e (C
alifo
rnia
to E
vanw
ood)
-LA
Co.
Sto
rm D
rain
900,
000
GT
900,
000
U-1
4G
arve
y, W
orkm
an, R
owla
nd &
Pue
nte
Ave
nues
St
orm
Dra
in L
ater
als o
ff V
ince
nt S
torm
Dra
in2,
000,
000
GT
2,00
0,00
0
U-1
5N
orth
of G
arve
y, W
est o
f Citr
us, S
outh
of W
orkm
an -
Und
ergr
ound
Util
ities
Bet
wee
n N
issa
n &
Maz
da
Dea
lers
hips
150,
000
CD
C15
0,00
0
U-1
6R
emai
ning
Mai
n Li
ne S
ewer
Ext
ensi
ons
530,
000
SF
530,
000
U-1
7V
ine
Ave
nue
Stor
m D
rain
Fro
m P
ima
Ave
nue
to
Gle
nvie
w R
oad
– LA
Co.
1,
100,
000
GT
1,10
0,00
0
U-1
8W
orkm
an, R
owla
nd &
Pue
nte
Ave
nues
Sto
rm D
rain
700,
000
GT
700,
000
TO
TA
LS
$14,
485,
000
$185
,000
$305
,000
$205
,000
$55,
000
$55,
000
$13,
680,
000
2013
-18
CIP
PR
OJE
CT
SU
TIL
ITIE
S D
escr
iptio
n of
Item
Fi
ve-Y
ear
Fund
ing
Sche
dule
217
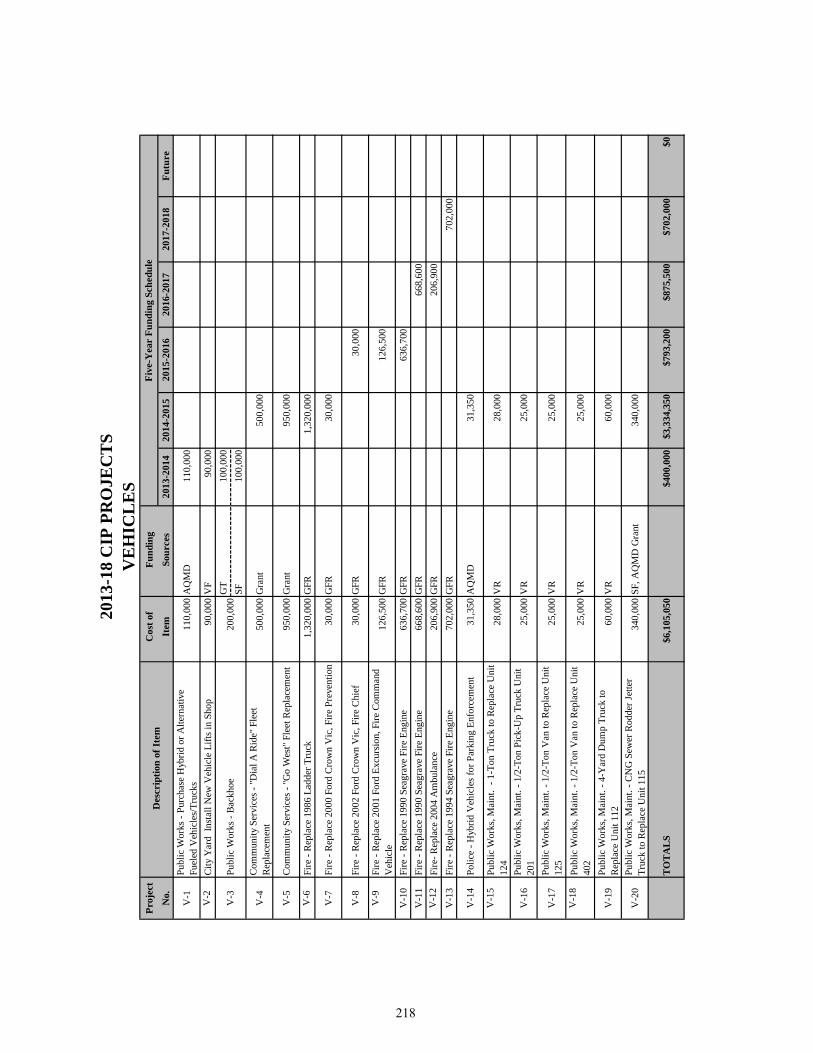
Proj
ect
Cos
t of
Fun
ding
No.
Ite
m
Sou
rces
20
13-2
014
2014
-201
520
15-2
016
2016
-201
720
17-2
018
Futu
re
V-1
Publ
ic W
orks
- Pu
rcha
se H
ybrid
or A
ltern
ativ
e Fu
eled
Veh
icle
s/Tr
ucks
110,
000
AQ
MD
110,
000
V-2
City
Yar
d In
stal
l New
Veh
icle
Lift
s in
Shop
90,0
00V
F90
,000
GT
100,
000
SF10
0,00
0
V-4
Com
mun
ity S
ervi
ces -
"Dia
l A R
ide"
Fle
et
Rep
lace
men
t50
0,00
0G
rant
50
0,00
0
V-5
Com
mun
ity S
ervi
ces -
"Go
Wes
t" Fl
eet R
epla
cem
ent
950,
000
Gra
nt
950,
000
V-6
Fire
- R
epla
ce 1
986
Ladd
er T
ruck
1,
320,
000
GFR
1,
320,
000
V-7
Fire
- R
epla
ce 2
000
Ford
Cro
wn
Vic
, Fire
Pre
vent
ion
30,0
00G
FR30
,000
V-8
Fire
- R
epla
ce 2
002
Ford
Cro
wn
Vic
, Fire
Chi
ef30
,000
GFR
30
,000
V-9
Fire
- R
epla
ce 2
001
Ford
Exc
ursi
on, F
ire C
omm
and
Veh
icle
126,
500
GFR
126,
500
V-1
0Fi
re -
Rep
lace
199
0 Se
agra
ve F
ire E
ngin
e63
6,70
0G
FR
636,
700
V-1
1Fi
re -
Rep
lace
199
0 Se
agra
ve F
ire E
ngin
e66
8,60
0G
FR66
8,60
0V
-12
Fire
- Rep
lace
200
4 A
mbu
lanc
e20
6,90
0G
FR20
6,90
0V
-13
Fire
- R
epla
ce 1
994
Seag
rave
Fire
Eng
ine
702,
000
GFR
702,
000
V-1
4Po
lice
- Hyb
rid V
ehic
les f
or P
arki
ng E
nfor
cem
ent
31,3
50A
QM
D31
,350
V-1
5Pu
blic
Wor
ks, M
aint
. - 1
-Ton
Tru
ck to
Rep
lace
Uni
t 12
428
,000
VR
28,0
00
V-1
6Pu
blic
Wor
ks, M
aint
. - 1
/2-T
on P
ick-
Up
Truc
k U
nit
201
25,0
00V
R25
,000
V-1
7Pu
blic
Wor
ks, M
aint
. - 1
/2-T
on V
an to
Rep
lace
Uni
t 12
525
,000
VR
25,0
00
V-1
8Pu
blic
Wor
ks, M
aint
. - 1
/2-T
on V
an to
Rep
lace
Uni
t 40
225
,000
VR
25,0
00
V-1
9Pu
blic
Wor
ks, M
aint
. - 4
-Yar
d D
ump
Truc
k to
R
epla
ce U
nit 1
1260
,000
VR
60,0
00
V-2
0Pu
blic
Wor
ks, M
aint
. - C
NG
Sew
er R
odde
r Jet
ter
Truc
k to
Rep
lace
Uni
t 115
340,
000
SF, A
QM
D G
rant
340,
000
TOTA
LS$6
,105
,050
$4
00,0
00$3
,334
,350
$793
,200
$875
,500
$702
,000
$0
2013
-18
CIP
PR
OJE
CT
SV
EH
ICL
ES
Des
crip
tion
of It
em
Five
-Yea
r Fu
ndin
g Sc
hedu
le
V-3
Publ
ic W
orks
- B
ackh
oe20
0,00
0
218
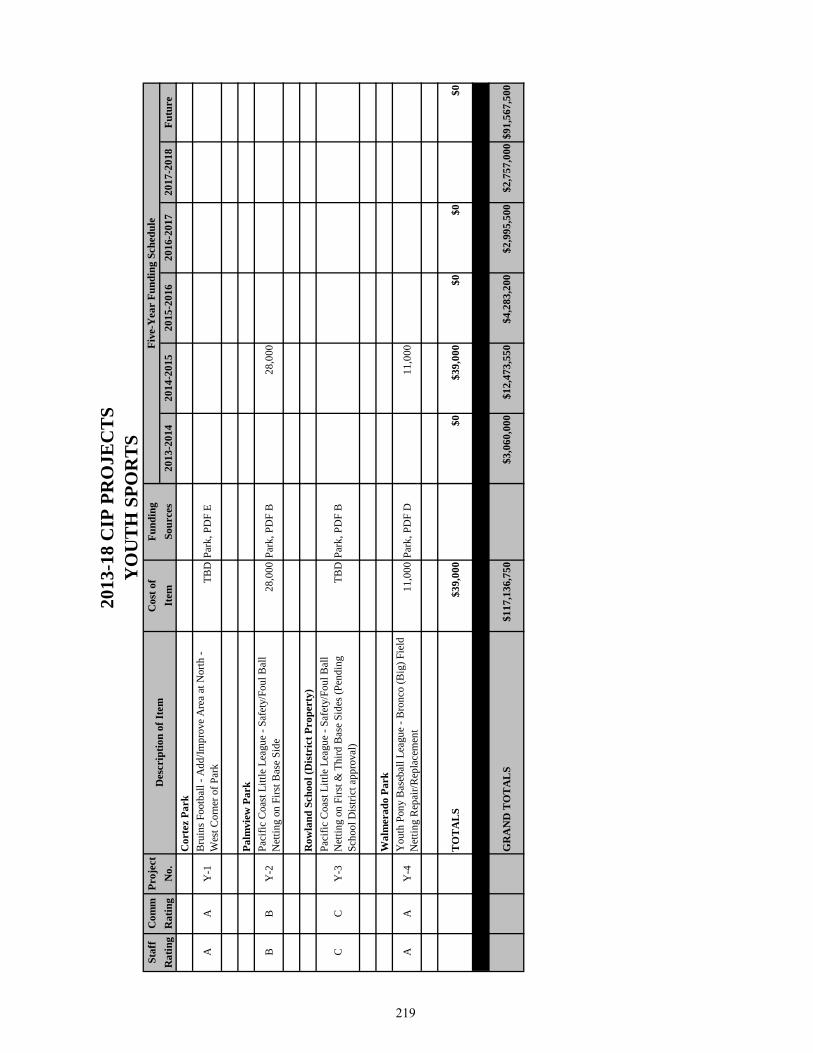
Staf
fC
omm
Proj
ect
Cos
t of
Fund
ing
Rat
ing
Rat
ing
No.
Item
Sour
ces
2013
-201
420
14-2
015
2015
-201
620
16-2
017
2017
-201
8Fu
ture
Cor
tez
Park
AA
Y-1
Bru
ins F
ootb
all -
Add
/Impr
ove
Are
a at
Nor
th -
Wes
t Cor
ner o
f Par
kTB
DPa
rk, P
DF
E
Palm
view
Par
k
BB
Y-2
Paci
fic C
oast
Litt
le L
eagu
e - S
afet
y/Fo
ul B
all
Net
ting
on F
irst B
ase
Side
28,0
00Pa
rk, P
DF
B
28,0
00
R
owla
nd S
choo
l (D
istr
ict P
rope
rty)
CC
Y-3
Paci
fic C
oast
Litt
le L
eagu
e - S
afet
y/Fo
ul B
all
Net
ting
on F
irst &
Thi
rd B
ase
Side
s (Pe
ndin
g Sc
hool
Dis
trict
app
rova
l)TB
DPa
rk, P
DF
B
Wal
mer
ado
Park
AA
Y-4
You
th P
ony
Bas
ebal
l Lea
gue
- Bro
nco
(Big
) Fie
ld
Net
ting
Rep
air/R
epla
cem
ent
11,0
00Pa
rk, P
DF
D
11,0
00
TO
TA
LS
$39,
000
$0$3
9,00
0$0
$0$0
GR
AN
D T
OT
AL
S$1
17,1
36,7
50$3
,060
,000
$12,
473,
550
$4,2
83,2
00$2
,995
,500
$2,7
57,0
00$9
1,56
7,50
0
2013
-18
CIP
PR
OJE
CT
SY
OU
TH
SPO
RT
SD
escr
iptio
n of
Item
Five
-Yea
r Fu
ndin
g Sc
hedu
le
219
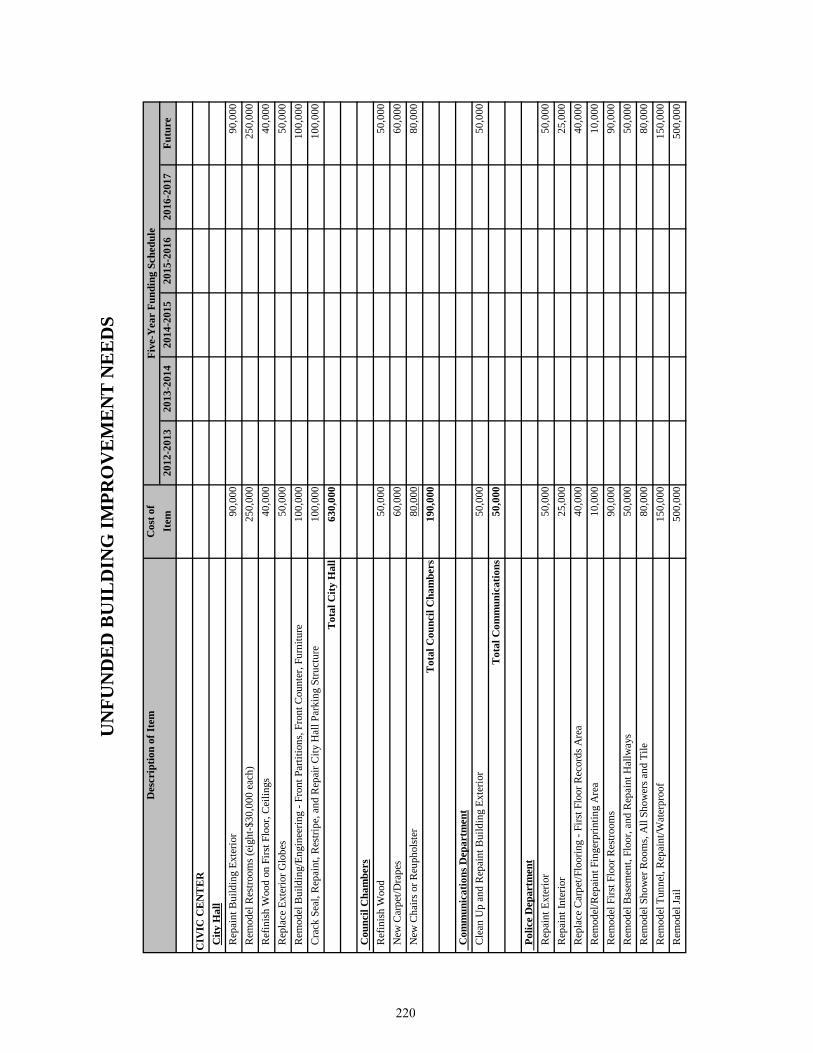
Cos
t of
Item
2012
-201
320
13-2
014
2014
-201
520
15-2
016
2016
-201
7Fu
ture
CIV
IC C
EN
TE
R C
ity H
all
Rep
aint
Bui
ldin
g Ex
terio
r90
,000
90,0
00 R
emod
el R
estro
oms (
eigh
t-$30
,000
eac
h)25
0,00
025
0,00
0 R
efin
ish
Woo
d on
Firs
t Flo
or, C
eilin
gs40
,000
40,0
00 R
epla
ce E
xter
ior G
lobe
s50
,000
50,0
00 R
emod
el B
uild
ing/
Engi
neer
ing
- Fro
nt P
artit
ions
, Fro
nt C
ount
er, F
urni
ture
100,
000
100,
000
Cra
ck S
eal,
Rep
aint
, Res
tripe
, and
Rep
air C
ity H
all P
arki
ng S
truct
ure
100,
000
100,
000
Tot
al C
ity H
all
630,
000
Cou
ncil
Cha
mbe
rs R
efin
ish
Woo
d50
,000
50,0
00 N
ew C
arpe
t/Dra
pes
60,0
0060
,000
New
Cha
irs o
r Reu
phol
ster
80,0
0080
,000
Tot
al C
ounc
il C
ham
bers
190,
000
Com
mun
icat
ions
Dep
artm
ent
Cle
an U
p an
d R
epai
nt B
uild
ing
Exte
rior
50,0
0050
,000
Tot
al C
omm
unic
atio
ns50
,000
Pol
ice
Dep
artm
ent
Rep
aint
Ext
erio
r50
,000
50,0
00 R
epai
nt In
terio
r25
,000
25,0
00 R
epla
ce C
arpe
t/Flo
orin
g - F
irst F
loor
Rec
ords
Are
a40
,000
40,0
00 R
emod
el/R
epai
nt F
inge
rprin
ting
Are
a10
,000
10,0
00 R
emod
el F
irst F
loor
Res
troom
s90
,000
90,0
00 R
emod
el B
asem
ent,
Floo
r, an
d R
epai
nt H
allw
ays
50,0
0050
,000
Rem
odel
Sho
wer
Roo
ms,
All
Show
ers a
nd T
ile80
,000
80,0
00 R
emod
el T
unne
l, R
epai
nt/W
ater
proo
f15
0,00
015
0,00
0 R
emod
el Ja
il50
0,00
050
0,00
0
Des
crip
tion
of It
emFi
ve-Y
ear
Fund
ing
Sche
dule
UN
FUN
DE
D B
UIL
DIN
G IM
PRO
VE
ME
NT
NE
ED
S
220
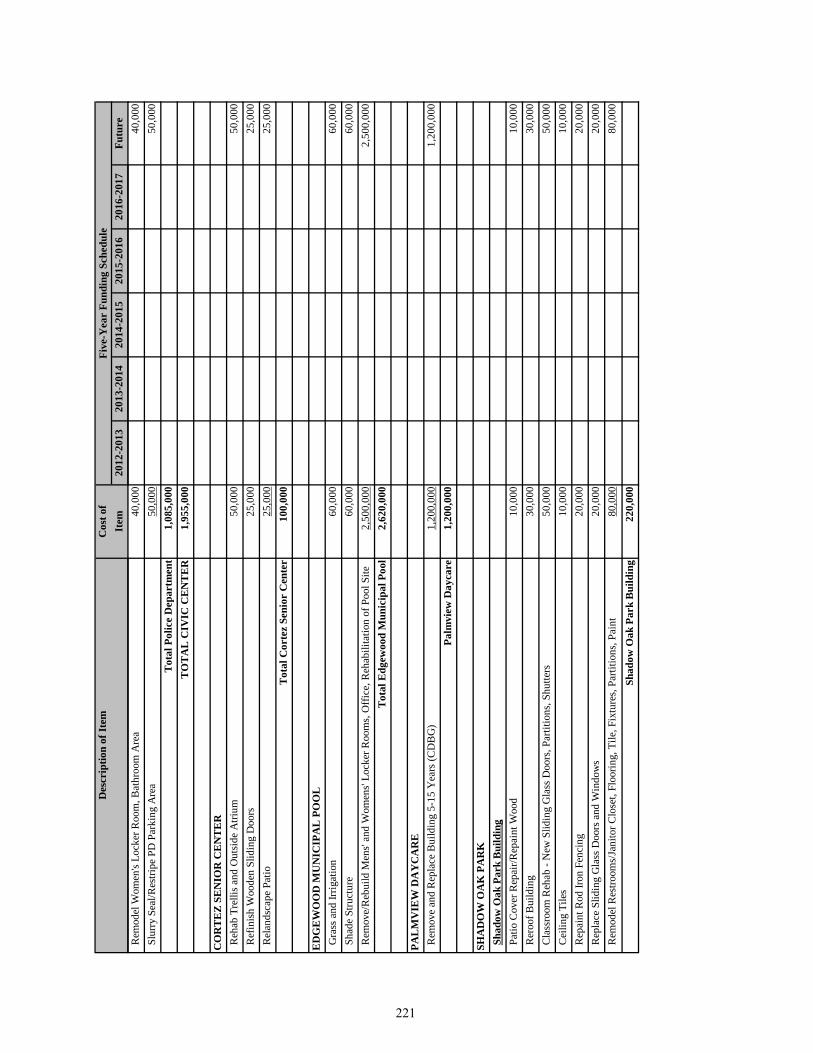
Cos
t of
Item
2012
-201
320
13-2
014
2014
-201
520
15-2
016
2016
-201
7Fu
ture
Des
crip
tion
of It
emFi
ve-Y
ear
Fund
ing
Sche
dule
Rem
odel
Wom
en's
Lock
er R
oom
, Bat
hroo
m A
rea
40,0
0040
,000
Slu
rry S
eal/R
estri
pe P
D P
arki
ng A
rea
50,0
0050
,000
Tot
al P
olic
e D
epar
tmen
t1,
085,
000
TO
TA
L C
IVIC
CE
NT
ER
1,95
5,00
0
CO
RT
EZ
SEN
IOR
CE
NT
ER
Reh
ab T
relli
s and
Out
side
Atri
um50
,000
50,0
00 R
efin
ish
Woo
den
Slid
ing
Doo
rs25
,000
25,0
00 R
elan
dsca
pe P
atio
25,0
0025
,000
Tot
al C
orte
z Se
nior
Cen
ter
100,
000
ED
GE
WO
OD
MU
NIC
IPA
L P
OO
L G
rass
and
Irrig
atio
n60
,000
60,0
00 S
hade
Stru
ctur
e60
,000
60,0
00 R
emov
e/R
ebui
ld M
ens'
and
Wom
ens'
Lock
er R
oom
s, O
ffice
, Reh
abili
tatio
n of
Poo
l Site
2,
500,
000
2,50
0,00
0T
otal
Edg
ewoo
d M
unic
ipal
Poo
l2,
620,
000
PAL
MV
IEW
DA
YC
AR
E R
emov
e an
d R
epla
ce B
uild
ing
5-15
Yea
rs (C
DB
G)
1,20
0,00
01,
200,
000
Palm
view
Day
care
1,20
0,00
0
SHA
DO
W O
AK
PA
RK
S
hado
w O
ak P
ark
Bui
ldin
g P
atio
Cov
er R
epai
r/Rep
aint
Woo
d10
,000
10,0
00 R
eroo
f Bui
ldin
g30
,000
30,0
00 C
lass
room
Reh
ab -
New
Slid
ing
Gla
ss D
oors
, Par
titio
ns, S
hutte
rs50
,000
50,0
00 C
eilin
g Ti
les
10,0
0010
,000
Rep
aint
Rod
Iron
Fen
cing
20,0
0020
,000
Rep
lace
Slid
ing
Gla
ss D
oors
and
Win
dow
s20
,000
20,0
00 R
emod
el R
estro
oms/
Jani
tor C
lose
t, Fl
oorin
g, T
ile, F
ixtu
res,
Parti
tions
, Pai
nt80
,000
80,0
00Sh
adow
Oak
Par
k B
uild
ing
220,
000
221
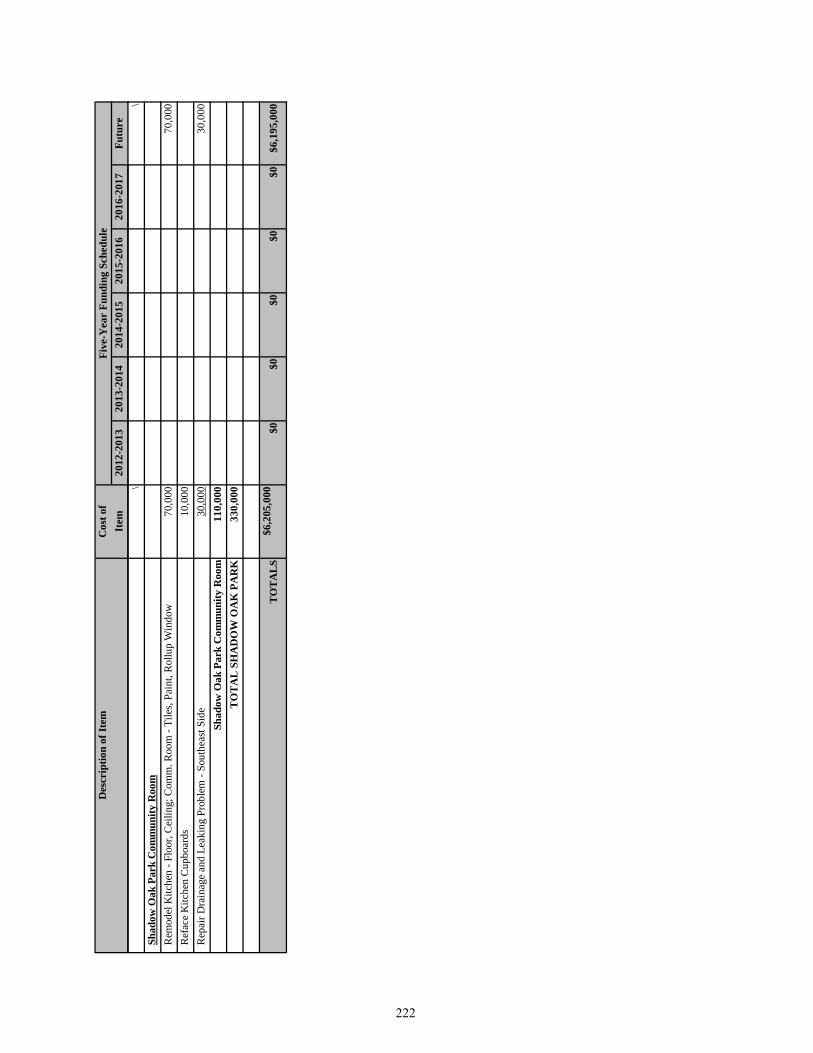
Cos
t of
Item
2012
-201
320
13-2
014
2014
-201
520
15-2
016
2016
-201
7Fu
ture
Des
crip
tion
of It
emFi
ve-Y
ear
Fund
ing
Sche
dule
\\
Sha
dow
Oak
Par
k C
omm
unity
Roo
m R
emod
el K
itche
n - F
loor
, Cei
ling;
Com
m. R
oom
- Ti
les,
Pain
t, R
ollu
p W
indo
w70
,000
70,0
00 R
efac
e K
itche
n C
upbo
ards
10,0
00 R
epai
r Dra
inag
e an
d Le
akin
g Pr
oble
m -
Sout
heas
t Sid
e30
,000
30,0
00Sh
adow
Oak
Par
k C
omm
unity
Roo
m11
0,00
0T
OT
AL
SH
AD
OW
OA
K P
AR
K33
0,00
0
TO
TA
LS
$6,2
05,0
00$0
$0$0
$0$0
$6,1
95,0
00
222
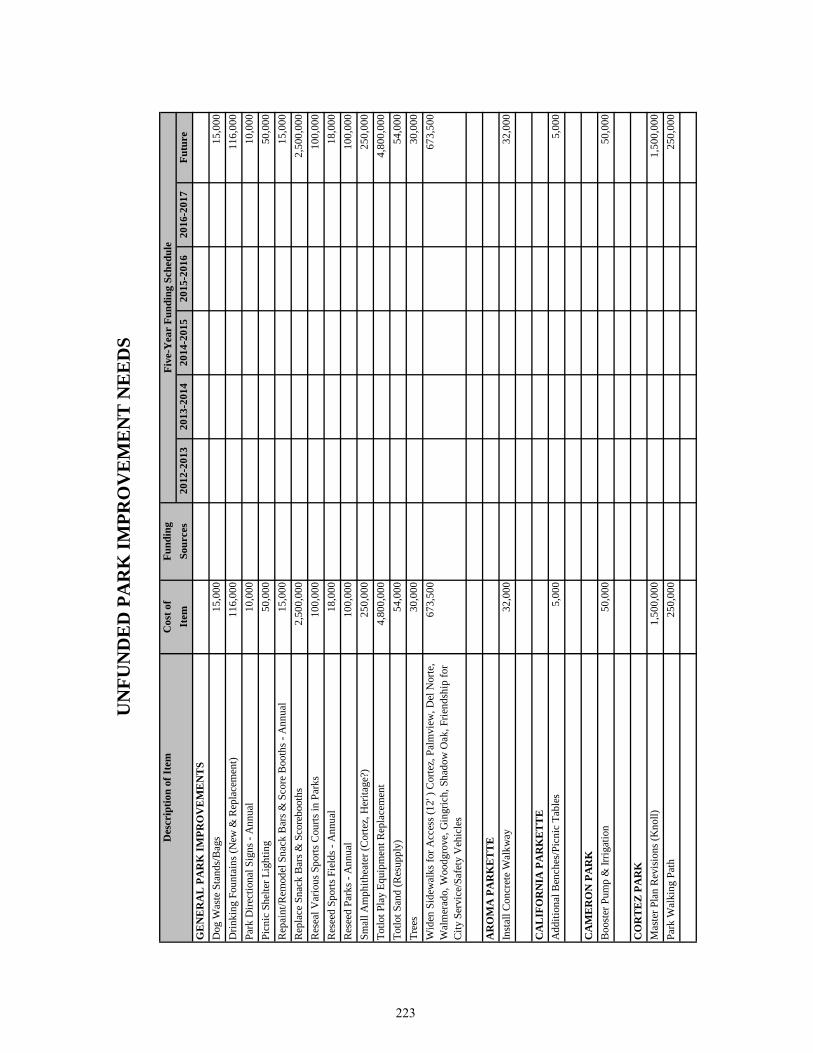
Cos
t of
Fund
ing
Item
Sour
ces
2012
-201
320
13-2
014
2014
-201
520
15-2
016
2016
-201
7Fu
ture
GE
NE
RA
L P
AR
K IM
PRO
VE
ME
NT
SD
og W
aste
Sta
nds/
Bag
s15
,000
15,0
00D
rinki
ng F
ount
ains
(New
& R
epla
cem
ent)
116,
000
116,
000
Park
Dire
ctio
nal S
igns
- A
nnua
l10
,000
10,0
00Pi
cnic
She
lter L
ight
ing
50,0
0050
,000
Rep
aint
/Rem
odel
Sna
ck B
ars &
Sco
re B
ooth
s - A
nnua
l15
,000
15,0
00R
epla
ce S
nack
Bar
s & S
core
boot
hs2,
500,
000
2,50
0,00
0R
esea
l Var
ious
Spo
rts C
ourts
in P
arks
100,
000
100,
000
Res
eed
Spor
ts F
ield
s - A
nnua
l18
,000
18,0
00R
esee
d Pa
rks -
Ann
ual
100,
000
100,
000
Smal
l Am
phith
eate
r (C
orte
z, H
erita
ge?)
250,
000
250,
000
Totlo
t Pla
y Eq
uipm
ent R
epla
cem
ent
4,80
0,00
04,
800,
000
Totlo
t San
d (R
esup
ply)
54,0
0054
,000
Tree
s30
,000
30,0
00W
iden
Sid
ewal
ks fo
r Acc
ess (
12' )
Cor
tez,
Pal
mvi
ew, D
el N
orte
, W
alm
erad
o, W
oodg
rove
, Gin
gric
h, S
hado
w O
ak, F
riend
ship
for
City
Ser
vice
/Saf
ety
Veh
icle
s
673,
500
673,
500
AR
OM
A P
AR
KE
TT
EIn
stal
l Con
cret
e W
alkw
ay32
,000
32,0
00
CA
LIF
OR
NIA
PA
RK
ET
TE
Add
ition
al B
ench
es/P
icni
c Ta
bles
5,00
05,
000
CA
ME
RO
N P
AR
KB
oost
er P
ump
& Ir
rigat
ion
50,0
0050
,000
CO
RT
EZ
PAR
KM
aste
r Pla
n R
evis
ions
(Kno
ll)1,
500,
000
1,50
0,00
0Pa
rk W
alki
ng P
ath
250,
000
250,
000
Des
crip
tion
of It
emFi
ve-Y
ear
Fund
ing
Sche
dule
UN
FUN
DE
D P
AR
K IM
PRO
VE
ME
NT
NE
ED
S
223

Cos
t of
Fund
ing
Item
Sour
ces
2012
-201
320
13-2
014
2014
-201
520
15-2
016
2016
-201
7Fu
ture
Des
crip
tion
of It
emFi
ve-Y
ear
Fund
ing
Sche
dule
DE
L N
OR
TE
PA
RK
Bal
lfiel
d N
ettin
g (S
choo
l)80
,000
80,0
00Te
nnis
Cou
rt R
ehab
ilita
tion
30,0
0030
,000
Land
scap
e (A
roun
d Ed
ison
Box
)30
,000
30,0
00
FRIE
ND
SHIP
PA
RK
Snac
kbar
Rem
odel
/Pai
nt10
,000
10,0
00Im
prov
e Tu
rnab
out
5,00
05,
000
Plan
t Slo
pe (R
emov
e Fe
nce)
40,0
0040
,000
Res
urfa
ce B
aske
tbal
l Cou
rt30
,000
30,0
00
GA
LST
ER
PA
RK
Wild
erne
ss C
amp
Rem
odel
500,
000
500,
000
Com
plet
e V
ista
Are
a75
,000
75,0
00
GIN
GR
ICH
PA
RK
Ret
aini
ng W
all/S
lope
Rep
air/L
ands
cape
80,0
0080
,000
Turf
Rep
air,
Dra
inag
e, R
esee
d10
0,00
010
0,00
0Pi
cnic
She
lters
(2)
100,
000
100,
000
MA
VE
RIC
K/R
IDG
E R
IDE
RS
PAR
KN
ew R
estro
om/S
nack
bar
350,
000
350,
000
Park
ing/
Roa
d50
0,00
050
0,00
0
OR
AN
GE
WO
OD
PA
RK
Ren
ovat
e Sn
ack
Bar
/Sco
re B
ooth
50,0
0050
,000
Mas
ter P
lan
Con
stru
ctio
n fo
r Soc
cer F
ield
s, Ex
pand
Par
king
Lot
4,00
0,00
04,
000,
000
Mas
ter P
lan
Am
endm
ent
TBD
TBD
PAL
MV
IEW
PA
RK
Bas
ketb
all C
ourts
50,0
0050
,000
Re-
Rou
te W
ater
Lin
e55
,000
55,0
00Sm
all A
mpi
thea
ter
250,
000
250,
000
224
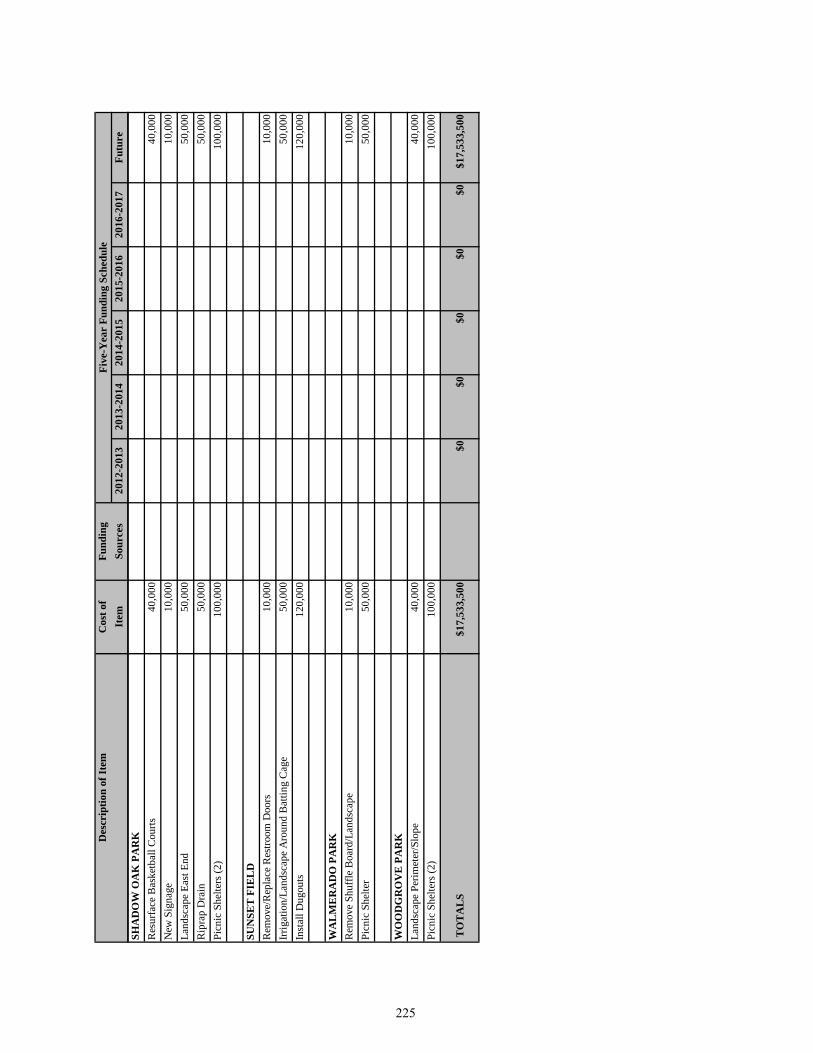
Cos
t of
Fund
ing
Item
Sour
ces
2012
-201
320
13-2
014
2014
-201
520
15-2
016
2016
-201
7Fu
ture
Des
crip
tion
of It
emFi
ve-Y
ear
Fund
ing
Sche
dule
SHA
DO
W O
AK
PA
RK
Res
urfa
ce B
aske
tbal
l Cou
rts40
,000
40,0
00N
ew S
igna
ge10
,000
10,0
00La
ndsc
ape
East
End
50,0
0050
,000
Rip
rap
Dra
in50
,000
50,0
00Pi
cnic
She
lters
(2)
100,
000
100,
000
SUN
SET
FIE
LD
Rem
ove/
Rep
lace
Res
troom
Doo
rs10
,000
10,0
00Irr
igat
ion/
Land
scap
e A
roun
d B
attin
g C
age
50,0
0050
,000
Inst
all D
ugou
ts12
0,00
012
0,00
0
WA
LM
ER
AD
O P
AR
KR
emov
e Sh
uffle
Boa
rd/L
ands
cape
10,0
0010
,000
Picn
ic S
helte
r50
,000
50,0
00
WO
OD
GR
OV
E P
AR
KLa
ndsc
ape
Perim
eter
/Slo
pe40
,000
40,0
00Pi
cnic
She
lters
(2)
100,
000
100,
000
TO
TA
LS
$17,
533,
500
$0$0
$0$0
$0$1
7,53
3,50
0
225

Page Intentionally Left Blank
226
DEBT SERVICE SCHEDULE
he City of West Covina, Community Development Commission, and Public Financing Authority (PFA) have issued debt instruments to finance capital projects and equipment. The three governmental units, although related, are distinct legal entities. The debt of the
Community Development Commission (the former Redevelopment Agency) has been assumed by the Successor Agency to the City of West Covina Redevelopment Agency (“Successor Agency”). The City has tax-based revenue from which to repay debt. The Successor Agency receives an allocation of property taxes from the Redevelopment Property Tax Trust Fund (RPTTF) in an amount sufficient to meet the annual debt services requirements. The PFA has no ability to generate revenues, other than through charges for the use of money and property. Accordingly, the issuer’s leases or notes receivable from the City, Successor Agency and project developers secure projects funded through the PFA. Debt between related governments has not been budgeted, as doing so would result in double-counting the debt and related revenues. Following is a summary of the debt issued and outstanding by the issuing entities.
DEBT ISSUED BY THE CITY OF WEST COVINA Notes Payable: Valencia Note - $ 1,215,000 This note for $1,215,000 began May 1, 2003 to be fully amortized and payable over 20 years, with monthly installments of principal and interest. The interest rate for the first 18 months was fixed at 5.31%. Every three years thereafter, interest is adjusted to the current 2-year Treasury bill plus 0.5%. The latest adjustment date was December 1, 2010 for an interest rate of 0.873%. The table below is based on this current rate. The next adjustment will be December 1, 2013.
Year-ending June 30
Principal
Interest
2014 67,512 5,805 2015 68,109 5,214 2016 68,706 4,617 2017 69,308 4,015 2018 69,915 3,408 2019-2023 352,611 7,741
Total 696,161 30,800
T
227

California Energy Commission (CEC) Note - $1,278,000 The City entered into a loan agreement from the CEC for $1,278,000 for heating, ventilation and air-conditioning. It is amortized over 15-years with a 4.5% annual interest rate. The intent is to pay this debt obligation using energy savings resulting from the use of more efficient systems.
Year-ending June 30
Principal
Interest
2014 78,148 42,442 2015 81,704 38,885 2016 85,329 35,261 2017 89,306 31,284 2018 93,370 27,220 2019-2023 534,529 68,421
Total 962,386 243,513 Master Lease Agreement with SunTrust Equipment - $3,050,000 The City entered into a Master Lease Agreement with SunTrust Equipment in 2008 for the acquisition of a new Public Safety Radio System. Financing is over a period of seven years at an annual interest rate of 3.92%.
Year-ending June 30
Principal
Interest
2014 469,475 32,979 2015 488,060 14,395
Total 957,535 47,374
228

DEBT ISSUED BY THE FORMER REDEVELOPMENT AGENCY Bonds Payable: With the elimination of redevelopment agencies in California, the bonded indebtedness of the former redevelopment agency the now the responsibility of the Successor Agency as follows: 1996 Special Tax Refunding Bonds Community Facilities District No. 1989-1 (The Fashion Plaza Project), Original Issue - $51,220,000 – A Special Tax levy, sales tax increment and property tax increment revenues secure repayment. Final maturity is in September 2022.
Year-ending June 30
Principal
Interest
2014 2,055,000 1,889,550 2015 2,340,000 1,757,700 2016 2,515,000 1,612,050 2017 2,790,000 1,452,900 2018 3,050,000 1,277,700 2019-2023 19,770,000 3,201,900
Total 32,520,000 11,191,800 1988 Lease Revenue Refunding Bonds (The Lakes Public Parking Project), Original Issue - $7,750,000 - A facilities lease with the property owner secures repayment. Final maturity is in August 2018. The bonds bear interest at a variable rate, which is paid monthly based upon the prevailing market conditions. The Community Development Commission and the Parking Authority jointly issued the bonds.
Year-ending June 30
Principal
Interest
2014 460,000 Variable 2015 495,000 Variable 2015 535,000 Variable 2017 575,000 Variable 2018 625,000 Variable 2019 670,000 Variable
Total 3,360,000 Variable
229
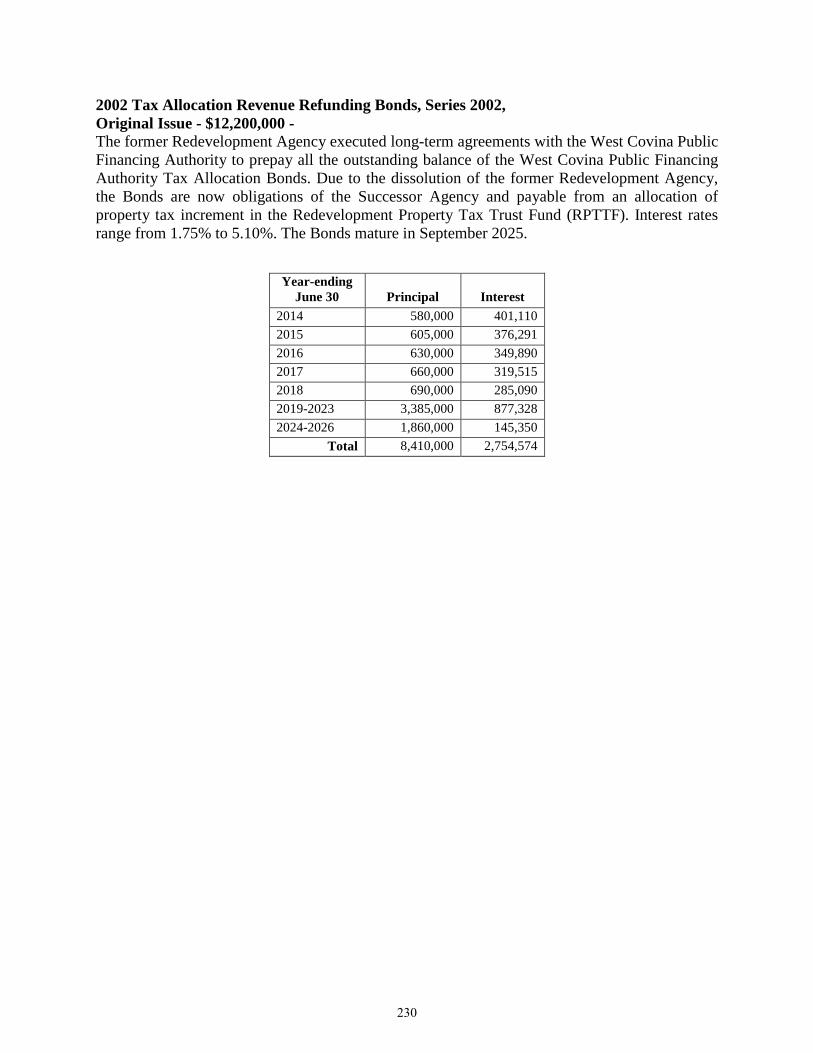
2002 Tax Allocation Revenue Refunding Bonds, Series 2002, Original Issue - $12,200,000 - The former Redevelopment Agency executed long-term agreements with the West Covina Public Financing Authority to prepay all the outstanding balance of the West Covina Public Financing Authority Tax Allocation Bonds. Due to the dissolution of the former Redevelopment Agency, the Bonds are now obligations of the Successor Agency and payable from an allocation of property tax increment in the Redevelopment Property Tax Trust Fund (RPTTF). Interest rates range from 1.75% to 5.10%. The Bonds mature in September 2025.
Year-ending June 30
Principal
Interest
2014 580,000 401,110 2015 605,000 376,291 2016 630,000 349,890 2017 660,000 319,515 2018 690,000 285,090 2019-2023 3,385,000 877,328 2024-2026 1,860,000 145,350
Total 8,410,000 2,754,574
230
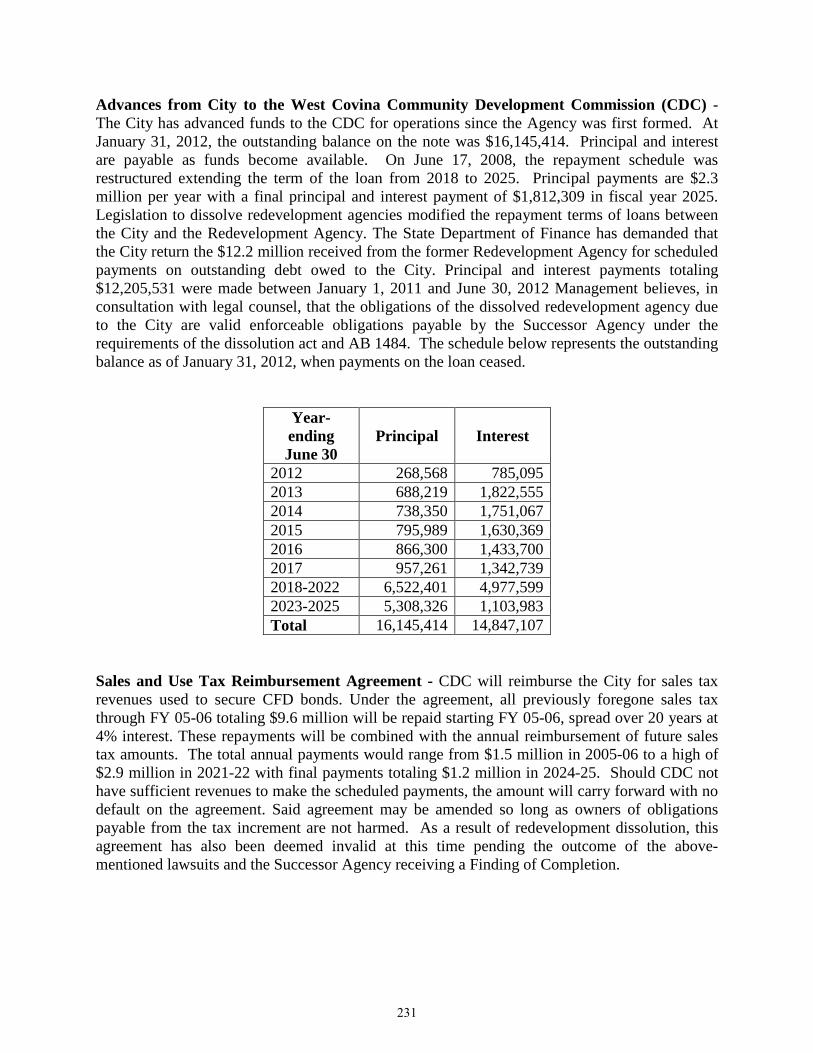
Advances from City to the West Covina Community Development Commission (CDC) - The City has advanced funds to the CDC for operations since the Agency was first formed. At January 31, 2012, the outstanding balance on the note was $16,145,414. Principal and interest are payable as funds become available. On June 17, 2008, the repayment schedule was restructured extending the term of the loan from 2018 to 2025. Principal payments are $2.3 million per year with a final principal and interest payment of $1,812,309 in fiscal year 2025. Legislation to dissolve redevelopment agencies modified the repayment terms of loans between the City and the Redevelopment Agency. The State Department of Finance has demanded that the City return the $12.2 million received from the former Redevelopment Agency for scheduled payments on outstanding debt owed to the City. Principal and interest payments totaling $12,205,531 were made between January 1, 2011 and June 30, 2012 Management believes, in consultation with legal counsel, that the obligations of the dissolved redevelopment agency due to the City are valid enforceable obligations payable by the Successor Agency under the requirements of the dissolution act and AB 1484. The schedule below represents the outstanding balance as of January 31, 2012, when payments on the loan ceased.
Year-ending June 30
Principal
Interest
2012 268,568 785,095 2013 688,219 1,822,555 2014 738,350 1,751,067 2015 795,989 1,630,369 2016 866,300 1,433,700 2017 957,261 1,342,739 2018-2022 6,522,401 4,977,599 2023-2025 5,308,326 1,103,983 Total 16,145,414 14,847,107
Sales and Use Tax Reimbursement Agreement - CDC will reimburse the City for sales tax revenues used to secure CFD bonds. Under the agreement, all previously foregone sales tax through FY 05-06 totaling $9.6 million will be repaid starting FY 05-06, spread over 20 years at 4% interest. These repayments will be combined with the annual reimbursement of future sales tax amounts. The total annual payments would range from $1.5 million in 2005-06 to a high of $2.9 million in 2021-22 with final payments totaling $1.2 million in 2024-25. Should CDC not have sufficient revenues to make the scheduled payments, the amount will carry forward with no default on the agreement. Said agreement may be amended so long as owners of obligations payable from the tax increment are not harmed. As a result of redevelopment dissolution, this agreement has also been deemed invalid at this time pending the outcome of the above-mentioned lawsuits and the Successor Agency receiving a Finding of Completion.
231
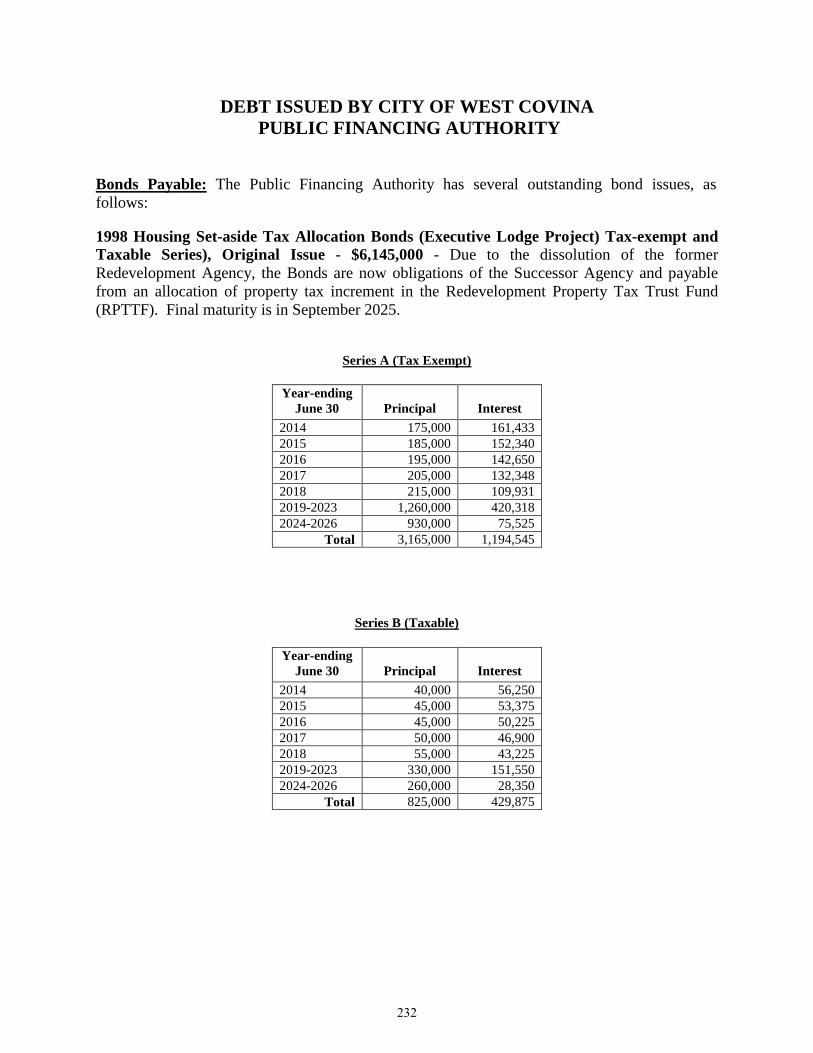
DEBT ISSUED BY CITY OF WEST COVINA PUBLIC FINANCING AUTHORITY
Bonds Payable: The Public Financing Authority has several outstanding bond issues, as follows: 1998 Housing Set-aside Tax Allocation Bonds (Executive Lodge Project) Tax-exempt and Taxable Series), Original Issue - $6,145,000 - Due to the dissolution of the former Redevelopment Agency, the Bonds are now obligations of the Successor Agency and payable from an allocation of property tax increment in the Redevelopment Property Tax Trust Fund (RPTTF). Final maturity is in September 2025.
Series A (Tax Exempt)
Year-ending June 30
Principal
Interest
2014 175,000 161,433 2015 185,000 152,340 2016 195,000 142,650 2017 205,000 132,348 2018 215,000 109,931 2019-2023 1,260,000 420,318 2024-2026 930,000 75,525
Total 3,165,000 1,194,545
Series B (Taxable)
Year-ending June 30
Principal
Interest
2014 40,000 56,250 2015 45,000 53,375 2016 45,000 50,225 2017 50,000 46,900 2018 55,000 43,225 2019-2023 330,000 151,550 2024-2026 260,000 28,350
Total 825,000 429,875
232
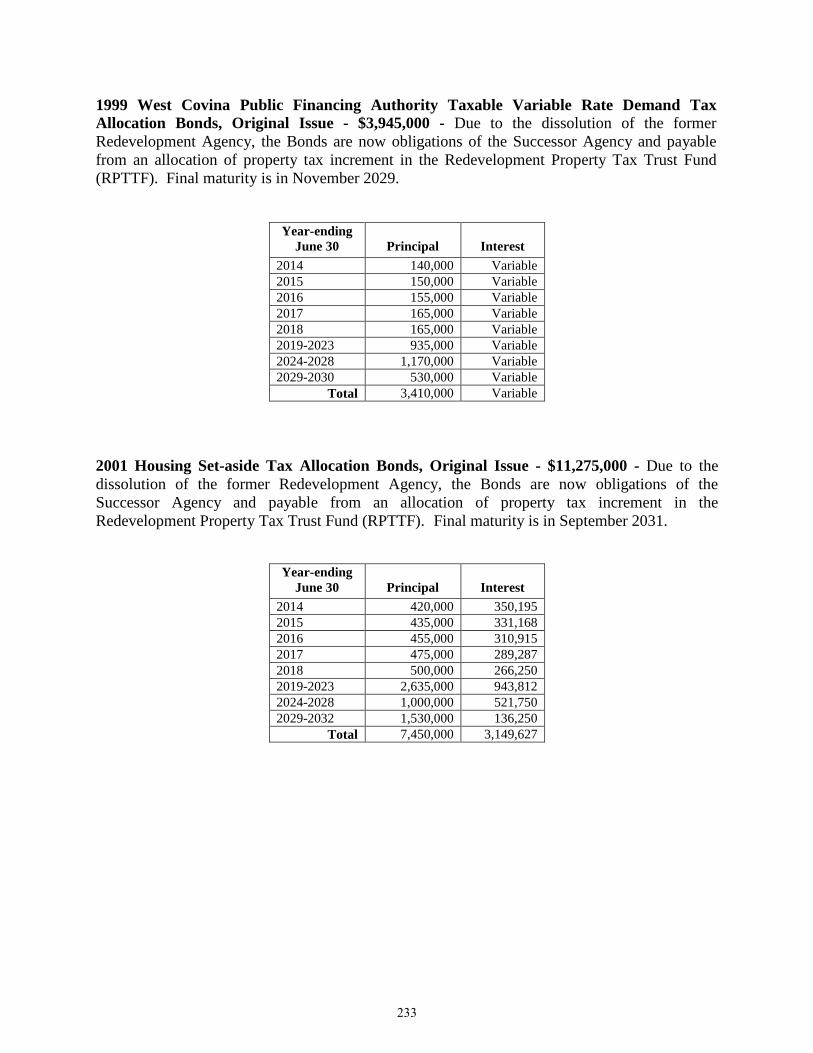
1999 West Covina Public Financing Authority Taxable Variable Rate Demand Tax Allocation Bonds, Original Issue - $3,945,000 - Due to the dissolution of the former Redevelopment Agency, the Bonds are now obligations of the Successor Agency and payable from an allocation of property tax increment in the Redevelopment Property Tax Trust Fund (RPTTF). Final maturity is in November 2029.
Year-ending June 30
Principal
Interest
2014 140,000 Variable 2015 150,000 Variable 2016 155,000 Variable 2017 165,000 Variable 2018 165,000 Variable 2019-2023 935,000 Variable 2024-2028 1,170,000 Variable 2029-2030 530,000 Variable
Total 3,410,000 Variable
2001 Housing Set-aside Tax Allocation Bonds, Original Issue - $11,275,000 - Due to the dissolution of the former Redevelopment Agency, the Bonds are now obligations of the Successor Agency and payable from an allocation of property tax increment in the Redevelopment Property Tax Trust Fund (RPTTF). Final maturity is in September 2031.
Year-ending June 30
Principal
Interest
2014 420,000 350,195 2015 435,000 331,168 2016 455,000 310,915 2017 475,000 289,287 2018 500,000 266,250 2019-2023 2,635,000 943,812 2024-2028 1,000,000 521,750 2029-2032 1,530,000 136,250
Total 7,450,000 3,149,627
233
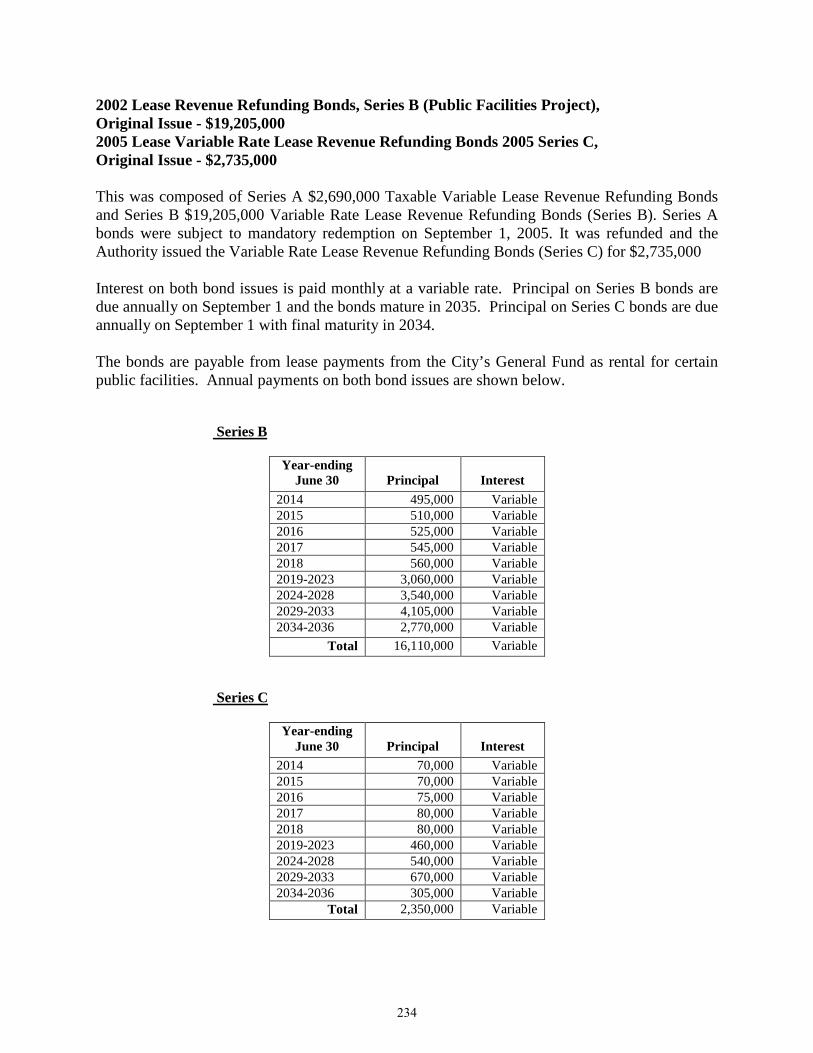
2002 Lease Revenue Refunding Bonds, Series B (Public Facilities Project), Original Issue - $19,205,000 2005 Lease Variable Rate Lease Revenue Refunding Bonds 2005 Series C, Original Issue - $2,735,000 This was composed of Series A $2,690,000 Taxable Variable Lease Revenue Refunding Bonds and Series B $19,205,000 Variable Rate Lease Revenue Refunding Bonds (Series B). Series A bonds were subject to mandatory redemption on September 1, 2005. It was refunded and the Authority issued the Variable Rate Lease Revenue Refunding Bonds (Series C) for $2,735,000 Interest on both bond issues is paid monthly at a variable rate. Principal on Series B bonds are due annually on September 1 and the bonds mature in 2035. Principal on Series C bonds are due annually on September 1 with final maturity in 2034. The bonds are payable from lease payments from the City’s General Fund as rental for certain public facilities. Annual payments on both bond issues are shown below. Series B
Year-ending June 30
Principal
Interest
2014 495,000 Variable 2015 510,000 Variable 2016 525,000 Variable 2017 545,000 Variable 2018 560,000 Variable 2019-2023 3,060,000 Variable 2024-2028 3,540,000 Variable 2029-2033 4,105,000 Variable 2034-2036 2,770,000 Variable
Total 16,110,000 Variable Series C
Year-ending June 30
Principal
Interest
2014 70,000 Variable 2015 70,000 Variable 2016 75,000 Variable 2017 80,000 Variable 2018 80,000 Variable 2019-2023 460,000 Variable 2024-2028 540,000 Variable 2029-2033 670,000 Variable 2034-2036 305,000 Variable
Total 2,350,000 Variable
234
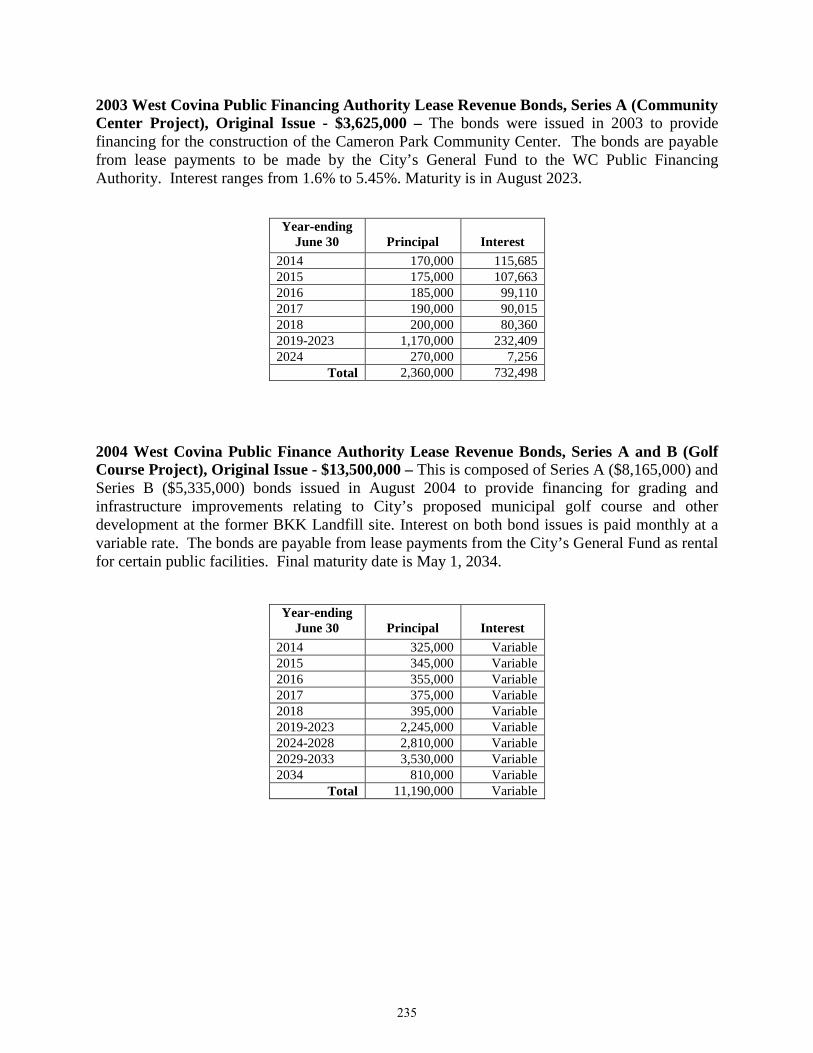
2003 West Covina Public Financing Authority Lease Revenue Bonds, Series A (Community Center Project), Original Issue - $3,625,000 – The bonds were issued in 2003 to provide financing for the construction of the Cameron Park Community Center. The bonds are payable from lease payments to be made by the City’s General Fund to the WC Public Financing Authority. Interest ranges from 1.6% to 5.45%. Maturity is in August 2023.
Year-ending June 30
Principal
Interest
2014 170,000 115,685 2015 175,000 107,663 2016 185,000 99,110 2017 190,000 90,015 2018 200,000 80,360 2019-2023 1,170,000 232,409 2024 270,000 7,256
Total 2,360,000 732,498 2004 West Covina Public Finance Authority Lease Revenue Bonds, Series A and B (Golf Course Project), Original Issue - $13,500,000 – This is composed of Series A ($8,165,000) and Series B ($5,335,000) bonds issued in August 2004 to provide financing for grading and infrastructure improvements relating to City’s proposed municipal golf course and other development at the former BKK Landfill site. Interest on both bond issues is paid monthly at a variable rate. The bonds are payable from lease payments from the City’s General Fund as rental for certain public facilities. Final maturity date is May 1, 2034.
Year-ending June 30
Principal
Interest
2014 325,000 Variable 2015 345,000 Variable 2016 355,000 Variable 2017 375,000 Variable 2018 395,000 Variable 2019-2023 2,245,000 Variable 2024-2028 2,810,000 Variable 2029-2033 3,530,000 Variable 2034 810,000 Variable
Total 11,190,000 Variable
235
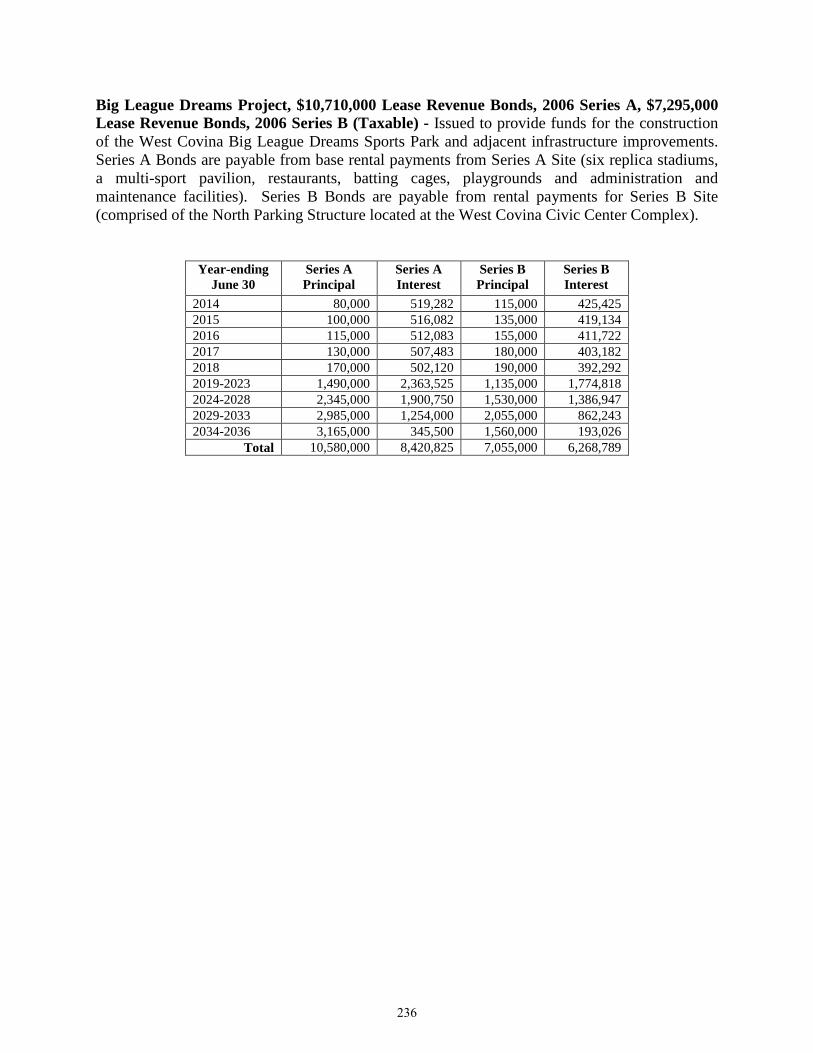
Big League Dreams Project, $10,710,000 Lease Revenue Bonds, 2006 Series A, $7,295,000 Lease Revenue Bonds, 2006 Series B (Taxable) - Issued to provide funds for the construction of the West Covina Big League Dreams Sports Park and adjacent infrastructure improvements. Series A Bonds are payable from base rental payments from Series A Site (six replica stadiums, a multi-sport pavilion, restaurants, batting cages, playgrounds and administration and maintenance facilities). Series B Bonds are payable from rental payments for Series B Site (comprised of the North Parking Structure located at the West Covina Civic Center Complex).
Year-ending June 30
Series A Principal
Series A Interest
Series B Principal
Series B Interest
2014 80,000 519,282 115,000 425,425 2015 100,000 516,082 135,000 419,134 2016 115,000 512,083 155,000 411,722 2017 130,000 507,483 180,000 403,182 2018 170,000 502,120 190,000 392,292 2019-2023 1,490,000 2,363,525 1,135,000 1,774,818 2024-2028 2,345,000 1,900,750 1,530,000 1,386,947 2029-2033 2,985,000 1,254,000 2,055,000 862,243 2034-2036 3,165,000 345,500 1,560,000 193,026
Total 10,580,000 8,420,825 7,055,000 6,268,789
236