west covina
TRANSCRIPT

Comprehensive Annual Financial Report
City of West Covina, California
Fiscal Year Ended June 30, 2016
WEST COVINA

City of West Covina, California
COMPREHENSIVE ANNUAL FINANCIAL REPORT
FOR THE FISCAL YEAR ENDED JUNE 30, 2016
Prepared by the West Covina Finance Department

This page intentionally left blank.
City of West Covina Comprehensive Annual Financial Report For the Year Ended June 30, 2016
TABLE OF CONTENTS INTRODUCTORY SECTION: Letter of Transmittal ................................................................................................................. i Organizational Chart .............................................................................................................. iv City Officials ............................................................................................................................ v FINANCIAL SECTION: Independent Auditor's Report ....................................................................................................... 1 Management's Discussion and Analysis ................................................................................. 4 Basic Financial Statements: Government-Wide Financial Statements: Statement of Net Position .......................................................................................... 16 Statement of Activities ............................................................................................... 17 Fund Financial Statements: Balance Sheet - Governmental Funds ...................................................................... 19 Reconciliation of the Balance Sheet of Governmental Funds to the Statement of Net Position .................................................................................... 21 Statement of Revenues, Expenditures, and Changes in Fund Balances - Governmental Funds .......................................................................................... 22 Reconciliation of the Statement of Revenues, Expenditures, and Changes in Fund Balances of Governmental Funds to the Statement of Activities ............... 24 Statement of Net Position - Proprietary Funds .......................................................... 25 Statement of Revenues, Expenses, and Changes in Fund Net Position - Proprietary Funds ............................................................................................... 26 Statement of Cash Flows - Proprietary Funds .......................................................... 27 Statement of Fiduciary Net Position - Fiduciary Funds ............................................. 29 Statement of Changes in Fiduciary Net Position - Fiduciary Funds .......................... 30 Notes to Basic Financial Statements .............................................................................. 31 Required Supplementary Information:
Schedule of Changes in Net Pension Liability and Related Ratios - CalPERS Pension Plan - Miscellaneous ........................................................... 124 Schedule of Plan Contributions - CalPERS Pension Plan - Miscellaneous ............ 125 Schedule of Changes in Net Pension Liability and Related Ratios - CalPERS Pension Plan - Safety ........................................................................ 126 Schedule of Plan Contributions - CalPERS Pension Plan - Safety ......................... 127 Schedule of Changes in Net Pension Liability and Related Ratios - CalPERS Pension Plan - EPMC Replacement Supplemental Retirement Plan ................ 128 Schedule of Plan Contributions - CalPERS Pension Plan - EPMC Replacement Supplemental Retirement Plan .......................................................................... 129 Schedule of Changes in Net Pension Liability and Related Ratios - CalPERS Pension Plan - Supplemental Retirement Plan for Executive Staff ... 130 Schedule of Plan Contributions - CalPERS Pension Plan - Supplemental Retirement Plan for Executive Staff ................................................................... 131 Schedule of Funding Progress – Other Post-Employment Benefits ........................ 132

City of West Covina Comprehensive Annual Financial Report For the Year Ended June 30, 2016
TABLE OF CONTENTS, (Continued) FINANCIAL SECTION, (Continued): Required Supplementary Information, (continued):
Schedule of Revenues, Expenditures, and Changes in Fund Balance - Budget and Actual (continued):
General Fund .................................................................................................. 134 West Covina Housing Authority Special Revenue Fund ................................ 136 Grants Special Revenue Fund ....................................................................... 137
Notes to Required Supplementary Information ....................................................... 138 Supplementary Information:
Schedule of Revenues, Expenditures, and Changes in Fund Balance - Budget and Actual: Major Fund - City Debt Service Fund .......................................................... 141 Non-Major Governmental Funds: Combining Balance Sheet ................................................................................. 143 Combining Statement of Revenues, Expenditures, and Changes in Fund Balance .............................................................................................. 144 Non-Major Special Revenue Funds: Combining Balance Sheet ................................................................................. 148 Combining Statement of Revenues, Expenditures, and Changes in Fund Balance .............................................................................................. 154 Schedule of Revenues, Expenditures, and Changes in Fund Balance - Budget and Actual: Drug Enforcement Rebate Special Revenue Fund ..................................... 160 Business Improvement Tax Special Revenue Fund .................................... 161 Air Quality Improvement Special Revenue Fund ......................................... 162 Proposition A Special Revenue Fund .......................................................... 163 Proposition C Special Revenue Fund .......................................................... 164 State Gas Tax Special Revenue Fund ........................................................ 165 Police Donations Special Revenue Fund .................................................... 166 Transportation Development Act Special Revenue Fund ............................ 167 AB939 Special Revenue Fund .................................................................... 168 Public Safety Augmentation Special Revenue Fund ................................... 169 COPS/SLESA Special Revenue Fund ........................................................ 170 Charter PEG Special Revenue Fund ........................................................... 171 Art in Public Places Special Revenue Fund ............................................... 172 Measure R Special Revenue Fund ............................................................. 173 Integrated Waste Management Special Revenue Fund ............................. 174 West Covina Community Services Foundation Special Revenue Fund ..... 175 Community Development Block Grant Special Revenue Fund .................. 176 SAFER Grant Special Revenue Fund ........................................................ 177 Maintenance District #1 Special Revenue Fund ......................................... 178 Maintenance District #2 Special Revenue Fund ......................................... 179 Coastal Sage Shrub Special Revenue Fund .............................................. 180

City of West Covina Comprehensive Annual Financial Report For the Year Ended June 30, 2016
TABLE OF CONTENTS, (Continued) FINANCIAL SECTION, (Continued): Supplementary Information, (continued):
Schedule of Revenues, Expenditures, and Changes in Fund Balance - Budget and Actual: Maintenance District #4 Special Revenue Fund ......................................... 181 Maintenance District #6 Special Revenue Fund ......................................... 182 Maintenance District #7 Special Revenue Fund ......................................... 183 Citywide Maintenance District Special Revenue Fund ............................... 184 Sewer Maintenance Special Revenue Fund .............................................. 185 Auto Plaza Improvement District Special Revenue Fund ........................... 186 Non-Major Capital Projects Funds: Combining Balance Sheet ................................................................................. 188 Combining Statement of Revenues, Expenditures, and Changes in Fund Balances ............................................................................................. 190 Schedule of Revenues, Expenditures, and Changes in Fund Balance - Budget and Actual: City Capital Projects Fund .......................................................................... 192 Construction Tax Capital Projects Fund ..................................................... 193 Information Technology Capital Projects Fund ............................................ 194 Park Development Capital Projects Fund .................................................... 195 Internal Service Funds: Combining Statement of Net Position ............................................................... 197 Combining Statement of Revenues, Expenses, and Changes in Net Position ............................................................................. 199 Combining Statement of Cash Flows ............................................................... 201 Pension Trust Funds: Combining Statement of Net Position ............................................................... 204 Combining Statement of Changes in Net Position ........................................... 205 Agency Fund: Statement of Changes in Assets and Liabilities ............................................... 207

City of West Covina Comprehensive Annual Financial Report For the Year Ended June 30, 2016
TABLE OF CONTENTS, (Continued) STATISTICAL SECTION (UNAUDITED): Net Position by Component ................................................................................................ 209 Changes in Net Position...................................................................................................... 211 Changes in Net Position - Governmental Activities ............................................................. 215 Changes in Net Position - Business-Type Activities ........................................................... 217 Fund Balances of Governmental Funds .............................................................................. 219 Changes in Fund Balances of Governmental Funds .......................................................... 221 Assessed Value and Estimated Actual Value of Taxable Property (1) ............................... 223 Direct and Overlapping Property Tax Rates (1) .................................................................. 225 Principal Property Taxpayers .............................................................................................. 227 Property Tax Levies and Collections ................................................................................... 228 Ratios of Outstanding Debt by Type ................................................................................... 230 Ratios of General Bonded Debt Outstanding ...................................................................... 232 Direct and Overlapping Debt ............................................................................................... 233 Legal Debt Margin Information ............................................................................................ 234 Pledged-Revenue Coverage ............................................................................................... 236 Demographic and Economic Statistics ................................................................................ 238 Principal Employers ............................................................................................................ 239 Full-time and Part-time City Employees .............................................................................. 240 Operating Indicators by Function (1) ................................................................................... 241 Capital Asset Statistics by Function/Program ..................................................................... 243

-i-
Finance Department
March 1, 2017 To the Members of the City Council, the City Manager, and the Citizens of the City of West Covina: It is a pleasure to submit the Comprehensive Annual Financial Report (CAFR) of the City of West Covina (City) for the fiscal year ended June 30, 2016. This report consists of management’s representations concerning the finances of the City. Management assumes full responsibility for the completeness and reliability of all the information presented in this report. To provide a reasonable basis for making these representations, management of the City has established a comprehensive internal control framework that is designed both to protect the City’s assets from loss, theft, or misuse and to compile sufficient reliable information for the preparation of the City’s financial statements in conformity with GAAP. Because the cost of internal controls should not outweigh their benefits, the City’s comprehensive framework of internal controls has been designed to provide reasonable rather than absolute assurance that the financial statements will be free from material misstatement. As management, we assert that, to the best of our knowledge and belief, this financial report is complete and reliable in all material respects. The City’s financial statements have been audited by Rogers, Anderson, Malody & Scott, LLP, a firm of certified public accountants. The auditors have issued an unmodified opinion on these financial statements, and they emphasized there was a restatement of fund balance at July 1, 2015. Their report is located at the front of the financial section of this report. The Management's Discussion and Analysis (MD&A) immediately follows the independent auditor's report and provides a narrative introduction, overview, and analysis of the basic financial statements. This letter of transmittal is designed to complement the MD&A and should be read in conjunction with it. Profile of the Government The City of West Covina is located in the San Gabriel Valley, 20 miles east of downtown Los Angeles and 15 miles north of Orange County. Incorporated as a general law city in 1923, the City's 16 square miles flourished with walnut groves and orange groves for many decades. The post-World War II building boom rapidly transformed the City, which experienced a significant population increase between 1950 and 1960, from less than 5,000 to more than 50,000 citizens. Subsequent to this rapid population increase, the City has continued to grow at a steady pace with a current population in excess of 110,000.

-ii-
The City’s location and access to major freeways makes West Covina close to many visitor attractions and an ideal business and commercial center. The City has over 32,000 housing units and offers the amenities of a big city location with a high standard of living for its community. Under the Council-Manager form of government, the five City Council members are elected at-large to overlapping four-year terms. The City Council selects a Mayor from one of its members each November to serve a one-year term. The City Council is responsible for, among other things, passing ordinances, adopting the budget, appointing committees, and hiring both the City Manager and City Attorney. The City Manager is responsible for carrying out the policies and ordinances of the City Council, for overseeing the day-to-day operations of the City, and for appointing the heads of the various departments. The City provides a full range of services to its citizens, including police, fire and emergency medical; construction and maintenance of streets, traffic signalization and other infrastructure; planning and building safety; and social, recreational and cultural activities and events. The City offers sixteen parks, four community centers, a Sports Complex and a county operated library. The City is financially accountable for the Successor Agency to the former Redevelopment Agency of the City of West Covina, a financing authority, and a housing authority, which are combined within the City’s financial statements. Additional information regarding all three of these legally separate entities can be found in the notes to the financial statements. The annual budget serves as a foundation for the City's financial planning and control. The City Council holds public hearings and adopts an annual budget for all funds. The budget appropriations are prepared by fund, function, and department. The City Manager is authorized to transfer budgeted amounts within departments to assure adequate and proper standards of service. Budgetary revisions, including supplemental appropriations which increase total appropriations in individual funds, must be approved by the City Council. Economic Outlook and Major Objectives From early in its history, the City of West Covina has been noted as a City of beautiful homes. Through its General Plan, City Council strives to maintain the City's high quality residential base and living environment. The City's identity is defined by carefully designed entry point elements, landmark areas, and open space areas. Known as the headquarters of the East San Gabriel Valley, the City strives to maintain a prosperous business and commercial climate. Despite the current challenging financial and economic environment, West Covina derives significant economic stability from the City's three major commercial districts: Plaza West Covina, Eastland Center, and The Lakes. Despite the challenging economic climate, our long-term economic outlook is bright. Much of the City's success is attributable to bold and innovative decisions that were made early in our history. The challenging economy has created opportunities in the business community to continually reinvent itself for the benefit of the City and its local surroundings.

Short-term and Long-term financial planning
Annually, the City adopts a budget covering operating revenues and expenditures, labor usage, capital expenditures, and other sources and uses of funds. For financial planning purposes, the City conducts comprehensive citywide financial forecasting in conjunction with its revenue consultants and other sources.
During the past few years, the City has utilized a range of temporary and permanent cost reduction initiatives, economic development, and revenue generation priorities, outside grants, and the use of fiscal reserves as necessary. As a result, the City has weathered the effects of the recession while providing critical services to the public in such areas as public safety, facility maintenance, parks maintenance, and infrastructure improvement. On June 29, 2015, the City Council adopted a fund balance policy with a plan to build its reserves back to 20%. The policy required the City to maintain a minimum unassigned fund balance of at least 10% of General Fund operating expenditures with a goal of bringing the total level of reserves up to 20% of operating expenditures. Since that time the City has exceeded that 20% reserve and amended the fund balance policy to maintain a minimum unassigned fund balance of at least 20% of General Fund operating expenditures.
Awards and Acknowledgements
The preparation of this report could not have been accomplished without the efficient and dedicated services of the entire staff of the finance department. I would like to express my appreciation to all members of the department who assisted and contributed to the preparation of this report. These are extremely challenging times for local government in which many difficult decisions must be made. Credit also must be given to City Council for their interest and support in planning and conducting the financial operations of the City in a responsible and progressive manner.
Respectfully submitted,
~~ Christa Buhagiar Finance Director

This page intentionally left blank.

-iv-
City of West Covina Organizational Chart
Citizens ofWest Covina
City Clerk(Elected)
City Council(Elected)
City CommissionsAudit Committee
Community and Senior ServicesHuman Resources
Planning
City
Attorney
CityManager
Deputy
City Manager
Successor Agency/
Community and Economic Development
City Clerk'sOffice
Fire
Planning
Police
PublicWorks
Community
Services
Finance
Human Resources
City Treasurer(Elected)

-v-
CITY OF WEST COVINA
City Officials
June 30, 2016
CITY COUNCIL
Mayor James Toma Mayor Pro Tem Corey Warshaw
Councilman Lloyd Johnson Councilman Mike Spence
Councilman Tony Wu
CITY MANAGER
Chris Freeland
EXECUTIVE MANAGEMENT
Kimberly Hall Barlow City Attorney
Rosalia Butler City Clerk
Laura Minnich Deputy City Manager
Christa Buhagiar Finance Director
Larry Whithorn Fire Chief
Tom Bokosky Human Resources Director
Jeff Anderson Planning Director
Dave Faulkner Police Chief
Chino Consunji Public Works Director

735 E. Carnegie Dr. Su ite I 00 San Bernardino. CA 92408 909 889 0871 T 9098895361 F
ramscpa .net
PARTNERS
Brenda L. Odle. CPA. MST
Terry P Shea. CPA
Kirk A. Franks. CPA
Scott W. Manno. CPA. CGMA
Leena Shanbhag. CPA. MST. CGMA
Bradferd A. Welebir. CPA. MBA. CGMA
Jay H Zercher. CPA (Partner Emeritus)
Phillip H. Waller. CPA (Partner Ementus)
MANAGERS 1 STAFF
Jenny Liu. CPA. MST
Seong-Hyea Lee. CPA. MBA
Charles De Simoni. CPA
Nathan Statham. CPA. MBA
Gardenva Duran. CPA Brianna Schultz. CPA L1s;i Donvue Guo. CPA MSA
MEMBERS Amenczm Institute of
Cert1f1ed Public Accountants
PCPS The A/CPA All1ance
fnr (PA FlfmS
Gnv<>rnmPntal Audit
Qunl1Cy Center
C;ilifom1a Society of Certified Puhllc Accountants
ROGERS, ANDERSON, MALODY & SCOT T , LLP
CERTIFIED PUBLIC ACCOUNTANTS. SINCE 1948
The Honorable City Council of the City of West Covina West Covina, California
INDEPENDENT AUDITOR'S REPORT
Report on the Financial Statements
We have audited the accompanying financial statements of the governmental activities, the business-type activities, each major fund, and the aggregate remaining fund information of the City of West Covina, California (City), as of and for the year ended June 30, 2016, and the related notes to the financial statements, which collectively comprise the City's basic financial statements as listed in the table of contents.
Management's Responsibility for the Financial Statements
Management is responsible for the preparation and fair presentation of these financial statements in accordance with accounting principles generally accepted in the United States of America; this includes the design, implementation, and maintenance of internal control relevant to the preparation and fair presentation of financial statements that are free from material misstatement, whether due to fraud or error.
Auditor's Responsibility
Our responsibility is to express opinions on these financial statements based on our audit. We conducted our audit in accordance with auditing standards generally accepted in the United States of America and the standards applicable to financial audits contained in Government Auditing Standards, issued by the Comptroller General of the United States. Those standards require that we plan and perform the audit to obtain reasonable assurance about whether the financial statements are free from material misstatement.
-1-
STABILITY. ACCURACY. TRUST.

-2-
An audit involves performing procedures to obtain audit evidence about the amounts and disclosures in the financial statements. The procedures selected depend on the auditor's judgment, including the assessment of the risks of material misstatement of the financial statements, whether due to fraud or error. In making those risk assessments, the auditor considers internal control relevant to the entity's preparation and fair presentation of the financial statements in order to design audit procedures that are appropriate in the circumstances, but not for the purpose of expressing an opinion on the effectiveness of the entity's internal control. Accordingly, we express no such opinion. An audit also includes evaluating the appropriateness of accounting policies used and the reasonableness of significant accounting estimates made by management, as well as evaluating the overall presentation of the financial statements. We believe that the audit evidence we have obtained is sufficient and appropriate to provide a basis for our audit opinions. Opinions In our opinion, the financial statements referred to above present fairly, in all material respects, the respective financial position of the governmental activities, the business-type activities, each major fund, and the aggregate remaining fund information of the City as of June 30, 2016, and the respective changes in financial position and, where applicable, cash flows thereof for the year then ended in accordance with accounting principles generally accepted in the United States of America. Other Matters Required Supplementary Information Accounting principles generally accepted in the United States of America require that required supplementary information, as listed in the table of contents, be presented to supplement the basic financial statements. Such information, although not a part of the basic financial statements, is required by the Governmental Accounting Standards Board who considers it to be an essential part of financial reporting for placing the basic financial statements in an appropriate operational, economic, or historical context. We have applied certain limited procedures to the required supplementary information in accordance with auditing standards generally accepted in the United States of America, which consisted of inquiries of management about the methods of preparing the information and comparing the information for consistency with management's responses to our inquiries, the basic financial statements, and other knowledge we obtained during our audit of the basic financial statements. We do not express an opinion or provide any assurance on the information because the limited procedures do not provide us with sufficient evidence to express an opinion or provide any assurance.

-3-
Other Information Our audit was conducted for the purpose of forming opinions on the financial statements that collectively comprise the City's basic financial statements. The introductory section, combining and individual nonmajor fund financial statements and schedules, and the statistical section are presented for purposes of additional analysis and are not a required part of the basic financial statements. The combining and individual nonmajor fund financial statements and schedules are the responsibility of management and were derived from and relate directly to the underlying accounting and other records used to prepare the basic financial statements. Such information has been subjected to the auditing procedures applied in the audit of the basic financial statements and certain additional procedures, including comparing and reconciling such information directly to the underlying accounting and other records used to prepare the basic financial statements or to the basic financial statements themselves, and other additional procedures in accordance with auditing standards generally accepted in the United States of America. In our opinion, the combining and individual nonmajor fund financial statements and the nonmajor fund budgetary comparison schedules are fairly stated, in all material respects, in relation to the basic financial statements as a whole. The introductory and statistical sections have not been subjected to the auditing procedures applied in the audit of the basic financial statements, and accordingly, we do not express an opinion or provide any assurance on it. Other Reporting Required by Government Auditing Standards In accordance with Government Auditing Standards, we have also issued our report dated March 1, 2017, on our consideration of the City’s internal control over financial reporting and on our tests of its compliance with certain provisions of laws, regulations, contracts, and grant agreements and other matters. The purpose of that report is to describe the scope of our testing of internal control over financial reporting and compliance and the results of that testing, and not to provide an opinion on internal control over financial reporting or on compliance. That report is an integral part of an audit performed in accordance with Government Auditing Standards in considering City's internal control over financial reporting and compliance.
San Bernardino, California March 1, 2017

This page intentionally left blank.

-4-
MANAGEMENT’S DISCUSSION AND ANALYSIS The following discussion and analysis of the financial performance of the City of West Covina provides an overview of the City’s financial activities for the fiscal year ended June 30, 2016. The information presented herein should be considered in conjunction with the transmittal letter and financial statements identified in the accompanying table of contents. FINANCIAL HIGHLIGHTS
As of June 30, 2016, the City’s total net position (assets plus deferred outflows of resources less liabilities and less deferred inflows of resources) is $67.6 million.
The City’s total net position increased $7.5 million from the prior year. This is comprised of governmental activities which increased by $7.8 million and business-type activities which decreased net position by $0.3 million. The net investment in capital assets in governmental activities increased by $4.8 million, primarily resulting from an increase in construction in progress due to new projects as well as the purchase of two new fire trucks and a quint which are being equipped for use. The City also had an increase in the net pension liabilities, primarily resulting in changes in actuarial assumptions discount rates for both Miscellaneous and Safety Pension Plans.
The City’s total governmental funds reported combined ending fund balances of $83.4 million, a decrease of $4.2 million in comparison with the prior fiscal year of $87.7 million (as restated). Of this, $12.4 million, or 15% of this total is nonspendable (not available for new spending). The restricted fund balance categories of $51 million or 62% is spendable for restricted purposes. The assigned fund balance of $5.1 million or 6% represents amounts that are intended to be used for specific purposes, but are not formally restricted or committed. The unassigned fund balance category of $14.5 million or 17% represents the City’s fund balance reserves.
As of June 30, 2016, the unassigned fund balance for the General Fund was $15.0 million, a decrease of $5 million from the prior year. The City adopted a fund balance policy which requires all internal service funds be funded every fiscal year to ensure there is no deficit at June 30th. As a result, the General Fund transferred $6 million to the Self-Insurance Internal Service Funds to eliminate their deficit net position.
The City’s business-type computer service enterprise activity (West Covina Service Group) had an operating loss for fiscal year (FY) 2015-16 of $225,459, compared with $227,345 in income in FY 2014-15. The total net position for the computer service enterprise fund is ($135,676). The net position in the prior year was $188,045.
OVERVIEW OF THE FINANCIAL STATEMENTS The annual report consists of four parts – management’s discussion and analysis (this section), the basic financial statements, required supplementary information, and an optional section that presents combining statements for non-major governmental funds and internal service funds. The basic financial statements include two kinds of statements that present different views of the City:
The first two statements are government-wide financial statements that provide both long-
term and short-term information about the City’s overall financial status.

-5-
The remaining statements are fund financial statements that focus on individual parts of the City government, reporting the City’s operations in more detail than the government-wide statements.
The governmental funds statements tell how general government services like public
safety were financed in the short-term as well as what remains for future spending.
Proprietary funds statements offer short- and long-term financial information about the activities that are operated like a business, such as the West Covina Service Group, the City’s computer service enterprise.
Fiduciary fund statements provide information about the fiduciary relationships – like the
agency funds of the City – in which the City acts solely as an agent or trustee for the benefit of others, to whom the resources in question belong.
The financial statements also include notes that provide additional information that is essential to a full understanding of the data provided in the government-wide and fund financial statements.
Reporting the City as a Whole The accompanying government-wide financial statements include two statements that present financial data for the City as a whole. The Statement of Net Position and the Statement of Activities report information about the City as a whole and about its activities. These statements include all assets and liabilities using the accrual basis of accounting, which is similar to the accounting used by most private-sector companies. All of the current year’s revenues and expenses are taken into account regardless of when cash is received or paid. These two statements report the City’s net position and changes in them. The City’s net position is one way to measure the City’s financial health, or financial position. Over time, increases and decreases in the City’s net position are one indicator of whether its financial health is improving or deteriorating. You will need to consider other non-financial factors, however, such as changes in the City’s property tax or sales tax base and the condition of the City’s roads, to assess the overall health of the City. The Statement of Net Position and the Statement of Activities are divided into two kinds of activities:
Governmental activities – Most of the City’s basic services such as public safety, streets and roads, economic development and parks and recreation, are reported here. Sales taxes, property taxes, state subventions, and other revenues finance most of these activities.
Business-type activities – The City charges a fee to customers to help it cover all or most of the cost of the services accounted for in these funds. These activities include the City’s computer service enterprise operation.
The government-wide financial statements include the West Covina Housing Authority, the West Covina Public Financing Authority, the Parking Authority of the City of West Covina and the West Covina Community Services Foundation (component units), along with the City of West Covina (the primary government). Although legally separate, these component units are important because the City is financially accountable for them. The activities of the Successor Agency of the former redevelopment agency can be found in the Fiduciary Fund Section of the Financial Statements in the Private Purpose Trust Fund.

-6-
Reporting the City’s Most Significant Funds The fund financial statements provide detailed information about the City’s most significant funds – not the City as a whole. Some funds are required to be established by State law or by bond covenants. However, City Council establishes many other funds to help it control and manage money for particular purposes or to show that it is meeting administrative responsibilities for using certain taxes, grants, or other money (like grants received). The City’s two kinds of funds – governmental and proprietary – use different accounting approaches.
Governmental funds – Most of the City’s basic services are reported in governmental funds, which focus on how money flows into and out of those funds and the balances left at year end that are available for spending. These funds are reported using the modified accrual accounting method, which measures cash and all other current financial assets that can readily be converted to cash. The governmental fund statements provide a detailed short-term view of the City’s general government operations and the basic services it provides. Governmental fund information helps you determine whether there are more or fewer financial resources that can be spent in the near future to finance the City’s programs. We describe the relationship or differences between governmental activities (reported in the Statement of Net Assets and the Statement of Activities) and governmental funds in reconciliations on the pages following the fund financial statements in this report.
Proprietary funds – When the City charges customers for the services it provides these
services are generally reported in proprietary funds. Proprietary funds are reported in the same way that all activities are reported in the Statement of Net Position and the Statement of Activities. In fact, the City’s enterprise funds are the same as the business-type activities we report in the government-wide statements but provide more detail and additional information, such as cash flows for proprietary funds. We use internal service funds (the other component of proprietary funds) to report activities that provide supplies and services for the City’s other programs and activities.
Reporting the City’s Fiduciary Responsibilities The City is an agent for certain assets held for, and under the control of, other organizations and individuals. All of the City’s fiduciary activities are reported in separate fiduciary funds. These activities are not included in the government-wide financial statements because the City cannot use these assets to finance its operations. The City is responsible for ensuring that the assets reported in these funds are used for their intended purposes. GOVERNMENT-WIDE FINANCIAL STATEMENTS Statement of Net Position As noted earlier, net position may serve over time as a useful indicator of a government’s financial position. At June 30, 2016, net position for the City of West Covina was $67.6 million. Compared to the prior year, the net position of the City increased by $7.5 million or 12.4%. The City’s net position of $67.6 million is made up of three components: Net investment in Capital Assets, Restricted Net Position and Unrestricted Net Position. The largest portion of the City’s net position, $149 million, reflects its net investment in capital assets (e.g., infrastructure, land, buildings, machinery, and equipment) less any related debt used to acquire those assets that is still outstanding. The City uses these capital assets to provide services to the community. As such, these assets are not available for spending. In addition, $57 million of the City’s net position represents resources that are subject to external restrictions on how they may be used. The

-7-
remaining deficit balance of unrestricted net position of $138 million is a result of the implementation of GASB 68. The table below reflects the Statement of Net Position for the fiscal year ended June 30, 2016, with the comparative data for the fiscal year ended June 30, 2015.

-8-
Changes in Net Position The City’s total revenues and transfers of $91.1 million for governmental activities are greater than the expenses of $83.3 million by $7.8 million. The increase is a result of a review of land held for resale in the Successor Agency which was subsequently identified as land held by the City. The land was transferred from the Successor Agency to the City. A summary of the government-wide statement of activities for the year ended June 30, 2016, with the comparative data for the fiscal year ended June 30, 2015, as follows:

-9-
Governmental Activities Some of the more significant changes in the revenues and expenses of the City’s governmental activities presented above are as follows:
Operating contributions and grants increased by $0.9 million, primarily due to a significant increase in the drug enforcement revenue and reimbursed costs relating to the Staffing for Adequate Fire and Emergency Response (SAFER) grant.
Capital contributions and grants decreased by $1.2 million due to a decrease in developer fees. Development fluctuates from year to year and several larger park developments began the prior fiscal year, primarily developments in South Hills Estates, Oak Creek, Magnolia, and Cadanera. In the prior fiscal year, the City also completed a major street improvement project that was federally funded.
Sales tax, the City’s second largest revenue source, increased $2.1 million with the final true up payments of the Sales Tax in Lieu (Triple Flip).
General government and public safety costs decreased by $0.7 million, $1.4 million, respectively. This decrease is primarily due to a decrease in the net pension liability due to the changes in actuarial assumptions. The discount rate was changed from 7.5 percent (net of administrative expenses) to 7.65 percent for the June 30, 2015, measurement date, for both the Miscellaneous and Safety Pension Plans.
Revenues by Source – Governmental Activities
-10-
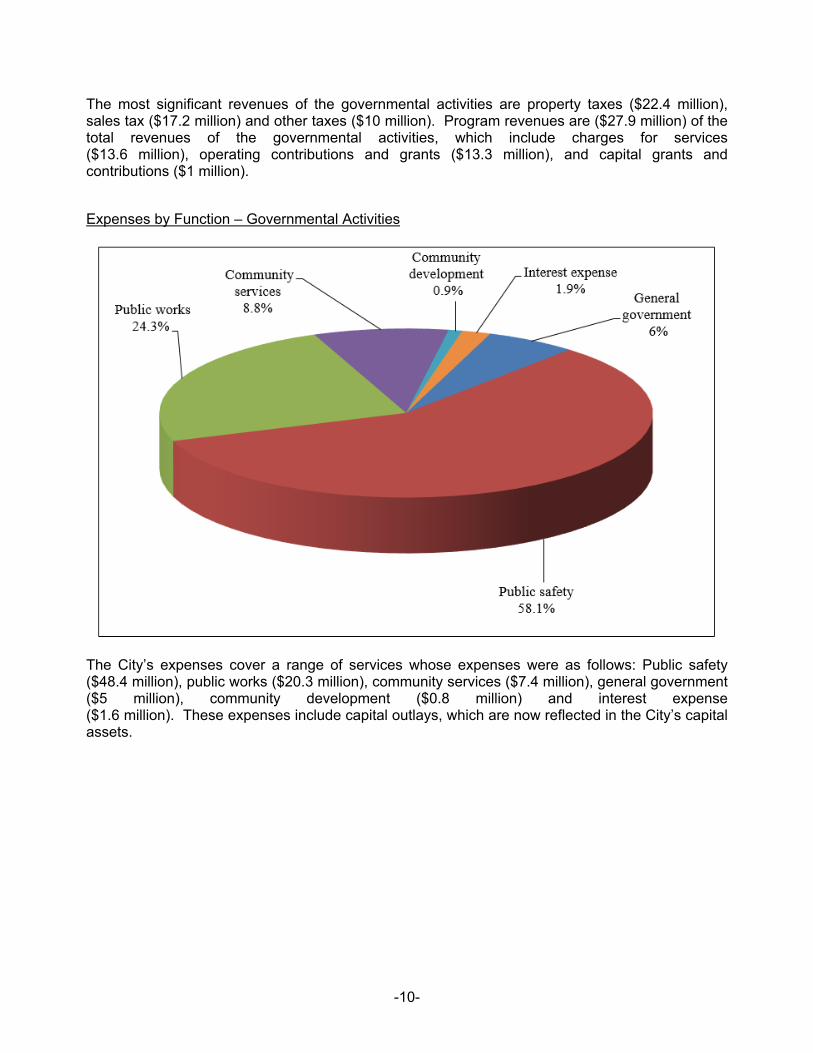
The most significant revenues of the governmental activities are property taxes ($22.4 million), sales tax ($17.2 million) and other taxes ($10 million). Program revenues are ($27.9 million) of the total revenues of the governmental activities, which include charges for services ($13.6 million), operating contributions and grants ($13.3 million), and capital grants and contributions ($1 million). Expenses by Function – Governmental Activities
The City’s expenses cover a range of services whose expenses were as follows: Public safety ($48.4 million), public works ($20.3 million), community services ($7.4 million), general government ($5 million), community development ($0.8 million) and interest expense ($1.6 million). These expenses include capital outlays, which are now reflected in the City’s capital assets.

-11-
Business-Type Activities The business-type activity is the West Covina Service Group, which provides dispatch and records management software and services to other police departments.
The business-type activity’s charges for services decreased by $242,020 or 17.1% from the prior fiscal year. Expenses and transfers out increased by $210,784 in fiscal year 2015-16 causing the decrease in net position of $323,721.

-12-
MAJOR FUNDS As noted earlier, the City uses fund accounting to provide proper financial management of the City’s resources and to demonstrate compliance with finance-related legal requirements. Major Governmental Funds The General Fund is the chief operating fund of the City. At the end of the current fiscal year, unassigned fund balance of the General Fund was $15.0 million, while total fund balance was $22.2 million. As a measure of the General Fund’s liquidity, it may be useful to compare both unassigned fund balance and total fund balance to total fund expenditures. Unassigned fund balance represents 25.2% of total general fund expenditures, while total fund balance represents 37.2% of that same amount. The nonspendable portion of fund balance in the amount of $6.6 million mainly consists of amounts currently owed to the City by the former redevelopment agency. The reasons for significant changes in the revenues and expenditures of the City’s General Fund from the prior year are as follows:
Total revenues, exclusive of fund transfers in, increased by $0.5 million while total expenditures, exclusive of fund transfers out, increased by $5.6 million.
Total taxes were up $3.1 million (7.1%) from the prior year. Property taxes increased by $1.2 million (5.3%) and sales tax revenues increased by $2.1 million (12.4%).
Public Safety expenditures increased by $4.9 million as a result of increasing PERS and overtime costs. In addition to that, the City also purchased two fire trucks and a quint, which are currently being equipped for operations, totaling $2.6 million.
The West Covina Housing Authority Fund provides for low and moderate income activities that were previously provided by the redevelopment agency. The Authority has outstanding loans receivable of $14.7 million and is due $5.5 million from the Successor Agency for amounts borrowed by the former redevelopment agency to fund the SERAF payments and 20% of the loans made to the former redevelopment agency by the City. The Grants Fund accounts for various Federal, State of California, and local grants. The fund finished the fiscal year with a total fund deficit of $849,395. The deficit will be eliminated through future grant revenue the City will receive during fiscal year 2016-17. The City Debt Service Fund finished the fiscal year with a total fund balance of $13 million, down $157,355 from the prior year. The majority of that amount is designated for payment of debt service on the City’s lease revenue bonds.

-13-
GENERAL FUND BUDGET There were numerous budget amendments throughout the fiscal year mostly due to clean up items, but the net effect to the General Fund budget was $6.4 million. Taxes in total exceeded the budget by $980,286, primarily from the increase in residual redevelopment property tax trust fund monies received during the fiscal year. The City budgeted conservatively for this source of revenue as it may fluctuate from year to year. Charges for services revenue exceeded the budget by $1.3 million, primarily from monies received from Ground Emergency Medical Transportation (GEMT) for services provided since fiscal year 2011-12. Public safety also exceeded the budget by $1.4 million, primarily due to several vacancies during the fiscal year that were backfilled with overtime. CAPITAL ASSETS
Capital Assets (net of depreciation)
The major additions to capital assets during the year ended June 30, 2016, are as follows: Construction in progress had a net increase of $3.3 million. The $4.3 million currently in
progress includes the following:
Two Fire Trucks and a Quint ($2.6 million) Traffic Signal Modifications ($550,000) General Plan Update ($270,000) Park Improvements ($390,000) Various Street Projects ($466,000)
Completed fixed asset additions of $2.8 million included:
Major Street Rehabilitation Projects ($2.5 million) Park Playground Improvements ($225,000) Facility Repairs/Improvements ($111,000)
Additional information on the City of West Covina’s capital assets can be found in note 6 of this report.

-14-
LONG-TERM DEBT At the end of the current fiscal year, the City had debt outstanding of $74.8 million. Of this amount, $46 million represents outstanding bonds and $28.8 million represents other debt such as compensated absences payable, claims and judgments payable, capital lease obligations, and Successor Agency note. All of the outstanding bonds are lease revenue bonds secured by leases from the General Fund.
Additional information on the City’s long-term debt can be found in the notes to the accompanying financial statements. Additional information on the City of West Covina’s long-term debt can be found in note 7 of this report. CONTACTING THE CITY’S FINANCIAL MANAGEMENT This financial report is designed to provide our citizens, taxpayers, customers, investors and creditors with a general overview of the City’s finances and to show the City’s accountability for the money it receives. If you have questions about this report or need additional financial information, contact the Finance Director, at City of West Covina, 1444 West Garvey Avenue South, West Covina, California 91790.

This page intentionally left blank.

-15-
BASIC FINANCIAL STATEMENTS

This page intentionally left blank.

City of West Covina Statement of Net Position June 30, 2016
The accompanying notes are an integral part of these financial statements. -16-
Governmental Business-TypeActivities Activities Total
ASSETSCash and investments 59,796,887$ 52,682$ 59,849,569$ Cash and investments with fiscal agent 2,089,969 - 2,089,969 Restricted cash and investments 501,028 - 501,028 Receivables, net:
Accounts 146,348 36,975 183,323 Taxes 5,335,607 - 5,335,607 Interest 38,288 30 38,318 Notes and loans 14,699,655 - 14,699,655 Other 1,307,665 - 1,307,665
8,308 - 8,308 Advances to Successor Agency 12,005,194 - 12,005,194 Due from other agencies 1,705,689 - 1,705,689
Inventories
Due from Successor Agency 1,863,597 - 1,863,597 Prepaids and other assets 401,788 - 401,788 Capital assets:
Non Depreciable 66,659,380 1,059,120 67,718,500 Depreciable, net 143,253,272 (1,059,120) 142,194,152
Total assets 309,812,675 89,687 309,902,362
DEFERRED OUTFLOWS OF RESOURCESDeferred amount from pension plan 10,615,982 - 10,615,982
LIABILITIESAccounts payable 2,485,537 1,997 2,487,534 Other accrued liabilities 1,966,829 21,262 1,988,091 Interest payable 90,138 - 90,138 Unearned revenues 215,280 84,983 300,263 Deposits 444,665 - 444,665 Long-term liabilities:
Other post-employment benefits obligation 22,490,383 - 22,490,383 Net pension liability 140,345,982 - 140,345,982 Due within one year 7,385,314 65,000 7,450,314 Due in more than one year 67,399,151 52,121 67,451,272
242,823,279 225,363 243,048,642 Total liabilities
DEFERRED INFLOWS OF RESOURCESDeferred amount from pension plans 9,875,864 - 9,875,864
NET POSITIONNet investment in capital assets 148,989,212 - 148,989,212 Restricted for:
Public safety 5,941,231 - 5,941,231 Public works 11,677,696 - 11,677,696 Community services 2,088,877 - 2,088,877 Affordable housing 24,312,047 - 24,312,047 Debt service 12,882,653 - 12,882,653
Unrestricted (138,162,202) (135,676) (138,297,878) Total net position 67,729,514$ (135,676)$ 67,593,838$

City of West Covina Statement of Activities For the Year Ended June 30, 2016
The accompanying notes are an integral part of these financial statements. -17-
Operating CapitalCharges for Grants and Grants and
Functions/Programs Expenses Services Contributions ContributionsGovernmental activities:
General government 4,963,302$ 400,051$ 5,162,809$ -$ Public safety 48,410,511 3,170,579 618,152 - Public works 20,259,279 8,271,744 635,793 10,338Community services 7,368,492 1,365,482 6,900,624 994,488Community development 753,721 425,013 - - Interest expense 1,572,645 - - -
Total governmental activities 83,327,950 13,632,869 13,317,378 1,004,826
Business-type activity:Computer service 1,638,573 1,413,114 - -
Total business-type activity 1,638,573 1,413,114 - -
Total 84,966,523$ 15,045,983$ 13,317,378$ 1,004,826$
General revenues: Taxes: Property taxes Sales taxes Franchise taxes Transient occupancy taxes Other taxes Investment income Other revenuesOther item:
Gain on transfer of land from Successor AgencyTransfers
Total general revenues and transfers
Change in net position
Net position - beginning of year, as restated
Net position - end of year
Program Revenues

-18-
Governmental Business-TypeActivities Activities Total
599,558$ -$ 599,558$ (44,621,780) - (44,621,780) (11,341,404) - (11,341,404)
1,892,102 - 1,892,102 (328,708) - (328,708)
(1,572,645) - (1,572,645)
(55,372,877) - (55,372,877)
- (225,459) (225,459)
- (225,459) (225,459)
(55,372,877) (225,459) (55,598,336)
22,352,163 - 22,352,163 17,228,237 - 17,228,237 3,540,011 - 3,540,011 1,840,553 - 1,840,553 4,644,841 - 4,644,841 (566,064) 3,513 (562,551)
4,236,920 - 4,236,920
9,789,266 - 9,789,266 101,775 (101,775) -
63,167,702 (98,262) 63,069,440
7,794,825 (323,721) 7,471,104
59,934,689 188,045 60,122,734
67,729,514$ (135,676)$ 67,593,838$
Net (Expense) Revenueand Changes in Net Position

City of West Covina Balance Sheet – Governmental Funds June 30, 2016
The accompanying notes are an integral part of these financial statements. -19-
West CovinaGeneral Housing
Fund Authority Grants
Cash and investments 9,321,651$ 4,110,034$ -$ Cash and investments with fiscal agent - - - Restricted cash and investments - - - Receivables, net:
Accounts 119,458 - - Taxes 5,097,365 - - Interest 11,249 2,531 79 Notes and loans - 14,699,655 - Other 1,131,964 - -
Due from other funds 1,373,928 - - Advances to Successor Agency 6,480,000 5,525,194 - Advances to other funds 523,582 - - Due from other agencies - - 989,978 Prepaid expenses 126,197 134,167 - Due from Successor Agency 1,863,597 - -
Total assets 26,048,991$ 24,471,581$ 990,057$
RESOURCES, AND FUND BALANCESLiabilities:
Accounts payable 1,029,671$ 20,027$ 59,738$ Other accrued liabilities 1,758,453 5,340 33,829 Due to other funds 128,817 - 605,197 Advances from other funds - - - Due to other governments 522,209 - - Deposits 444,665 - - Unearned revenue 2,787 - 173,803
Total liabilities 3,886,602 25,367 872,567
Unavailable revenue - - 966,885
Nonspendable 7,129,779 5,659,361 - Restricted:
Affordable housing - 18,786,853 - Debt service - - - Community services - - - Public safety - - - Public works - - -
Assigned - - - Unassigned 15,032,610 - (849,395)
Total fund balances (deficit) 22,162,389 24,446,214 (849,395)
Total liabilities, deferred inflows of resources,and fund balances 26,048,991$ 24,471,581$ 990,057$
LIABILITIES, DEFERRED INFLOWS OF
Deferred Inflows of Resources:
Fund Balances (Deficit):
ASSETS
Special Revenue Funds

-20-
City Non-Major TotalDebt Governmental Governmental
Service Fund Funds Funds
10,163,924$ 25,885,431$ 49,481,040$ 2,089,969 - 2,089,969
501,028 - 501,028
14,948 - 134,406 - 238,242 5,335,607
8,270 15,767 37,896 - - 14,699,655
126,235 49,466 1,307,665 - - 1,373,928 - - 12,005,194 - - 523,582 - 1,245,945 2,235,923
129,073 12,351 401,788 - - 1,863,597
13,033,447$ 27,447,202$ 91,991,278$
21,721$ 1,106,820$ 2,237,977$ - 156,870 1,954,492 - 690,548 1,424,562 - 523,582 523,582 - 8,025 530,234 - - 444,665 - 38,690 215,280
21,721 2,524,535 7,330,792
- 252,908 1,219,793
129,073 12,351 12,930,564
- - 18,786,853 12,882,653 - 12,882,653
- 2,179,015 2,179,015 - 5,941,231 5,941,231 - 11,677,696 11,677,696 - 5,065,065 5,065,065 - (205,599) 13,977,616
13,011,726 24,669,759 83,440,693
13,033,447$ 27,447,202$ 91,991,278$

This page intentionally left blank.

City of West Covina Reconciliation of the Balance Sheet of Governmental Funds to the Statement of Net Position June 30, 2016
The accompanying notes are an integral part of these financial statements. -21-
Fund balances for governmental funds 83,440,693$
Amounts reported for governmental activities in the Statement of Net Position are different because:
net capital assets of $382,842):Capital assets 396,979,157$ Accumulated depreciation (187,449,347) 209,529,810
Long-term debt and compensated absences applicable to the City's governmentalactivities are not due and payable in the current period and accordingly are notreported as fund liabilities. All liabilities, both current and long-term are reported in the Statement of Net Position balances at June 30, 2016, are:
Bonds payable (46,000,000) Compensated absences (4,155,112) Capital lease obligations (2,715,337) Notes payable (12,208,103) (65,078,552)
Accrued interest payable for the current portion of interest due on bonds payablehas not been reported in the governmental funds. (90,138)
Revenues that are measurable but not available are reported as unavailable revenuesunder the modified accrual basis of accounting. 1,219,793
OPEB obligations are not due and payable at year end; they are thereforenot reported in the governmental fund financial statements. (22,490,383)
Deferred outflows of resources and deferred inflows of resources related to pensionsare only reported in the Statement of Net Position as the changes in these amountseffects only the government-wide statements for governmental activities:
Deferred outflows of resources 10,615,982Deferred inflows of resources (9,875,864)Pension liability (140,345,982) (139,605,864)
804,155
Net position of governmental activities 67,729,514$
Pension related debt applicable to the City's governmental activities are not due andpayable in the current period and accordingly are not reported as fund liabilities.
Internal service funds were used by management to charge the costs of certainactivities, such as vehicle and equipment maintenance and replacement, theCity's self-insurance programs and retirement health benefits to individualfunds. The assets and liabilities of the internal service funds must be addedto the Statement of Net Position.
resources in the governmental funds (this does not include internal service fundCapital assets and accumulated depreciation, are not considered current financial

City of West Covina Statement of Revenues, Expenditures, and Changes in Fund Balances - Governmental Funds For the Year Ended June 30, 2016
The accompanying notes are an integral part of these financial statements. -22-
West CovinaGeneral Housing
Fund Authority GrantsREVENUES Taxes 47,452,961$ -$ -$
Special assessments - - - Licenses and permits 1,156,613 - - Fines and forfeitures 796,989 - - Investment income (569,996) 368,011 1,486 Rental income 529,833 - - Revenue from other agencies 1,566,549 - 273,497 Charges for services 7,032,594 - 54,715 Other revenues 167,787 100,000 162,247
Total revenues 58,133,330 468,011 491,945
EXPENDITURESCurrent:
General government 4,710,142 391,618 - Public safety 47,120,170 - 29,272 Public works 5,081,608 - 665,980 Community services 2,012,171 - 243,132 Community development 538,680 - -
Debt service:Principal 69,450 - - Interest and fiscal charges 6,021 - -
Total expenditures 59,538,242 391,618 938,384
Excess (deficiency) of revenues over(under) expenditures (1,404,912) 76,393 (446,439)
OTHER FINANCING SOURCES (USES)Acquisition under capital leases 2,568,446 - - Transfers in 2,341,924 - 570 Transfers out (8,523,516) - -
Total other financing sources (uses) (3,613,146) - 570
Net change in fund balances (5,018,058) 76,393 (445,869)
Fund balances (deficit), beginning of year, as restated 27,180,447 24,369,821 (403,526)
Fund balances (deficit), end of year 22,162,389$ 24,446,214$ (849,395)$
Special Revenue Funds

-23-
City Non-Major TotalDebt Governmental Governmental
Service Fund Funds Funds
-$ 6,784,688$ 54,237,649$ - 5,550,657 5,550,657 - - 1,156,613 - - 796,989
(513,461) 143,828 (570,132) - - 529,833
1,200,805 8,177,860 11,218,711 497,368 146,559 7,731,236
- 1,057,069 1,487,103 1,184,712 21,860,661 82,138,659
- 2,054 5,103,814 - 3,813,441 50,962,883 - 9,761,679 15,509,267 - 4,608,877 6,864,180 - 360,034 898,714
1,958,011 - 2,027,461 1,568,732 - 1,574,753
3,526,743 18,546,085 82,941,072
(2,342,031) 3,314,576 (802,413)
- - 2,568,446 2,184,676 303,868 4,831,038
- (2,288,780) (10,812,296) 2,184,676 (1,984,912) (3,412,812)
(157,355) 1,329,664 (4,215,225)
13,169,081 23,340,095 87,655,918
13,011,726$ 24,669,759$ 83,440,693$

City of West Covina Reconciliation of the Statement of Revenues, Expenditures and Changes in Fund Balances of Governmental Funds to the Statement of Activities For the Year Ended June 30, 2016
The accompanying notes are an integral part of these financial statements. -24-
Net change in fund balances - total governmental funds (4,215,225)$
Amounts reported for governmental activities in the Statement of Activities are different because:
of $89,922 and depreciation expense of $40,582).Capital outlay 6,226,598$ Depreciation expense (11,400,355) Loss on disposal of asset (863,490) Construction in progress deemed not viable (1,066,102) (7,103,349)
Principal payments on long-term debt 2,027,461$ 2,027,461
2,108
To record as expense the net change in compensated absences in the Statement of Activities (101,775)
Change in revenues that are measureable but not available are reported as unavailablerevenue under the modified accrual basis of accounting. (47,500)
Expenses reported in the statement of activities which do not require the use of current financial resources are not reported as expenditures in the governmental funds:
Increase in net other post employment benefits obligation (1,924,739)
Pension expense reported in the governmental funds includes the annual required
in the net pension liability, and related change in pension amounts for deferredoutflows of resources and deferred inflows of resources 3,608,965
The gain in the statement of activities for the transfer of land from the Successor Agency to the City does not provide current financing resources an therefore is not reported as a revenue in the governmental funds. 9,789,266
Internal service funds are used by management to charge the cost of certain activities,such as vehicle and equipment maintenance and replacement, the City's self-insurance and retirement health benefits to individual funds. The net revenues (expenses) of theinternal service funds is reported with governmental activities 5,759,613
Change in net position of governmental activities 7,794,825$
The issuance of long-term debt provides current financial resources to governmental
Statement of Activities, the cost of those assets is allocated over theirestimated useful lives as depreciation expense. This is the amount bywhich depreciation exceeded capital outlays and disposals in the current period: (this does not include the following internal service fund activity: capital outlay
Governmental funds report capital outlay as expenditures. However in the
contributions. In the Statement of Activities, pension expense includes the change
The Statement of Net Position includes accrued interest on long-term debt. Thisis the net change in the current year.
funds, while the repayment of the principal of long term debt consumes the current financial resources of governmental funds. Neither transaction, however, has any effect on net position.

City of West Covina Statement of Net Position Proprietary Funds June 30, 2016
The accompanying notes are an integral part of these financial statements. -25-
Business-type Governmental Activity Activities
ComputerService Internal
Enterprise ServiceFund Funds
Current Assets:Cash and investments 52,682$ 10,315,847$ Receivables, net
Accounts 36,975 11,942 Interest 30 392
Due from other funds - 128,817 Inventories - 8,308
Total current assets 89,687 10,465,306
Noncurrent Assets:Capital Assets:
Capital assets 1,059,120 3,076,066 Less accumulated depreciation (1,059,120) (2,693,224)
Total capital assets - 382,842 Total noncurrent assets - 382,842
Total assets 89,687 10,848,148
Current Liabilities:Accounts payable 1,997 247,560 Other accrued liabilities 21,262 12,337 Claims and judgments - current portion - 2,574,566 Compensated absences - current portion 65,000 28,580 Due to other funds - 78,183 Unearned revenue 84,983 -
Total current liabilities 173,242 2,941,226
Noncurrent Liabilities:Claims and judgments - 7,079,192 Compensated absences 52,121 23,575
Total noncurrent liabilities 52,121 7,102,767
Total liabilities 225,363 10,043,993
Net investment in capital assets - 382,842 Unrestricted (135,676) 421,313
Total net position (deficit) (135,676)$ 804,155$
LIABILITIES
NET POSITION
ASSETS

City of West Covina Statement of Revenues, Expenses, and Changes in Fund Net Position Proprietary Funds For the Year Ended June 30, 2016
The accompanying notes are an integral part of these financial statements. -26-
Business-type GovernmentalActivity Activities
ComputerService Internal
Enterprise ServiceFund Funds
OPERATING REVENUESCharges for services 1,413,114$ 4,257,721$ Other revenues - 233,821
Total operating revenues 1,413,114 4,491,542
OPERATING EXPENSESPersonnel services 1,253,563 714,391 Cost of sales, services and operations 385,010 2,064,915 Depreciation - 40,582 Insurance and claims paid - 1,999,139
Total operating expenses 1,638,573 4,819,027
Operating loss (225,459) (327,485)
NONOPERATING REVENUESInvestment income 3,513 4,065
Total nonoperating revenues 3,513 4,065
Loss before transfers (221,946) (323,420)
Transfers in - 6,083,033 Transfers out (101,775) -
Change in net position (323,721) 5,759,613
Net position (deficit), beginning of year 188,045 (4,955,458)
Net position (deficit), end of year (135,676)$ 804,155$

City of West Covina Statement of Cash Flows Proprietary Funds For the Year Ended June 30, 2016
The accompanying notes are an integral part of these financial statements. -27-
Business-type GovernmentalActivity Activities
Computer Service Internal
Enterprise ServiceFund Funds
CASH FLOWS FROM OPERATING ACTIVITIESReceived from customers 1,498,198$ 4,493,309$ Payments to suppliers for goods and services (383,418) (3,508,399)
Payments to employees for services (1,234,057) (705,090)
Net cash provided by (used for) operating activities (119,277) 279,820
CASH FLOWS FROM NONCAPITAL FINANCING ACTIVITIES
Transfers from other funds - 6,083,033 Paid to other funds (101,775) (146,900)
Net cash provided by (used for) noncapital financing activites (101,775) 5,936,133
CASH FLOWS FROM CAPITAL AND RELATEDFINANCING ACTIVITIES
Acquisition of capital assets - (101,168)
CASH FLOWS FROM INVESTING ACTIVITIESInterest received on investments 3,483 4,029
Net increase (decrease) in cash and cash equivalents (217,569) 6,118,814
Cash and cash equivalents, beginning of year 270,251 4,197,033
Cash and cash equivalents, end of year 52,682$ 10,315,847$

City of West Covina Statement of Cash Flows, (Continued) Proprietary Funds For the Year Ended June 30, 2016
The accompanying notes are an integral part of these financial statements. -28-
Business-type GovernmentalActivity Activities
Computer Service Internal
Enterprise ServiceFund Funds
RECONCILIATION OF OPERATING LOSS TO NET CASH PROVIDED BY (USED FOR) OPERATING ACTIVITIES
Operating loss (225,459)$ (327,485)$ Adjustments to reconcile operating loss to net
cash provided by (used for) operating activities:Depreciation - 40,582 (Increase) decrease in operating assets:
Accounts receivable 101 (4,721) Other receivables - 6,488 Inventory - (6,308)
Increase (decrease) in operating liabilities:Accounts payable (597) 89,697 Other accrued liabilities 2,189 5,771 Claims and judgments payable - 466,495 Compensated absences payable 19,506 9,301 Unearned revenue 84,983 -
Net cash provided by (used for) operating activities (119,277)$ 279,820$

City of West Covina Statement of Fiduciary Net Position Fiduciary Funds June 30, 2016
The accompanying notes are an integral part of these financial statements. -29-
SuccessorAgencyPrivate Pension Special
Purpose Trust DepositsTrust Fund Funds Agency Fund
Cash and investments 18,042,660$ 758,075$ 1,439,667$ Cash and investments with fiscal agent 7,422,268 - - Restricted cash and investments 113,285 - - Receivables, net:
Accounts - - 10,896 Taxes 487,500 - - Interest 8,175 - - Notes and loans 14,671,967 - - Allowance for doubtful accounts (14,671,967) - - Assessments 28,125,000 - - Other - - 2,911
Due from other governments 168,757 - - Prepaid expenses 3,575 - - Due from City of West Covina 10,999,433 - - Land held for resale 139,016 - - Capital assets:
Nondepreciable 3,007,802 - - Depreciable, net 5,216,761 - -
Total assets 73,734,232 758,075 1,453,474$
Accounts payable 43,286 - 29,700$ Accrued liabilities 1,723 - - Interest payable 788,532 - - Due to the City of West Covina 1,863,597 - - Due to other governments 201,457 - - Deposits - - 1,423,774 Advances from the City of West Covina 12,005,194 - - Long-term liabilities
Due to County Auditor Controller 10,999,433 - - Due within one year 7,054,933 - - Due in more than one year 94,601,273 - -
Total liabilities 127,559,428 - 1,453,474$
Held in trust for Successor Agency (53,825,196) - Held in trust for pension benefits - 758,075
Total net position (53,825,196)$ 758,075$
ASSETS
LIABILITIES
NET POSITION (DEFICIT)

City of West Covina Statement of Changes in Fiduciary Net Position Fiduciary Funds For the Year Ended June 30, 2016
The accompanying notes are an integral part of these financial statements. -30-
SuccessorAgencyPrivate Pension
Purpose Trust Trust Fund Funds
ADDITIONSTaxes 17,558,967$ -$ Employer contribution - 134,739 Investment income 474,523 9,419 Rental income 50,000 - Settlements 3,267,211 - Other revenues 539,153 -
Total additions 21,889,854 144,158
DEDUCTIONSProgram administration 9,998,483 - Administrative costs - 6,288 Investment expense - 690 Benefit distributions - 228,099 Interest and fiscal charges 2,935,405 - Depreciation 368,325 -
Total deductions 13,302,213 235,077
Change in net position before other item 8,587,641 (90,919)
OTHER ITEMLoss on transfer of assets to City of West Covina (9,536,297) -
Change in net position (948,656) (90,919)
Net position (deficit), beginning of year, as restated (52,876,540) 848,994
Net position (deficit), end of year (53,825,196)$ 758,075$

City of West Covina Notes to Basic Financial Statements For the Year Ended June 30, 2016
-31-
1) SUMMARY OF SIGNIFICANT ACCOUNTING POLICIES
A) Basis of Presentation
The basic financial statements of the City of West Covina, California (City) have been prepared in accordance with generally accepted accounting principles (GAAP) as applied to government units. The Governmental Accounting Standards Board (GASB) is the accepted standard-setting body for establishing governmental accounting and financial reporting principles. The City’s significant accounting policies are described below. B) Description of Reporting Entity
The City of West Covina was incorporated on February 23, 1923, under the general laws of the State of California. The accompanying financial statements present the City of West Covina and its component units; entities for which the City is considered to be financially accountable. The City is considered to be financially accountable for an organization if the City appoints a voting majority of that organization's governing body and the City is able to impose its will on that organization or there is a potential for that organization to provide specific financial benefits to or impose specific financial burdens on the City. The City is also considered to be financially accountable for an organization if that organization is fiscally dependent (i.e., it is unable to adopt its budget, levy taxes, set rates or charges, or issue bonded debt without approval from the City). In certain cases, other organizations are included as component units if the nature and significance of their relationship with the City are such that their exclusion would cause the City's financial statements to be misleading or incomplete. Because each component unit meets the above-mentioned criteria, included within the financial reporting entity of the City are the City of West Covina Housing Authority, the West Covina Public Financing Authority, the Parking Authority of the City of West Covina, and the West Covina Community Services Foundation, Inc. A brief description of each component unit follows: The West Covina Housing Authority (the Housing Authority) was formed on January 17, 2012, and is responsible for the administration of providing affordable housing in the City. The Housing Authority is administered by a Board which consists of members of the City Council. The transactions of the Housing Authority are reported as a special revenue fund. The West Covina Public Financing Authority (the Authority) was created by a joint powers agreement between the City and the Community Development Commission of the City on June 1, 1990. The purpose of the Authority is to provide, through the issuance of debt, financing necessary for various capital improvements. The Authority is administered by the Board who are the members of the City Council. The Authority's sole source of income is installment sale, loan and lease payments received from the City and former Community Development Commission (the Commission) which are used to meet the debt service requirements on debt issues. The Authority is blended into the debt service fund of the City.

City of West Covina Notes to Basic Financial Statements For the Year Ended June 30, 2016
-32-
1) SUMMARY OF SIGNIFICANT ACCOUNTING POLICIES, (continued)
B) Description of Reporting Entity, (continued) The Parking Authority of the City of West Covina (the Parking Authority) was formed under the provision of the government code of the State of California for the purpose of financing and constructing parking facilities for lease to the City. The City Council acts as the governing body of the Parking Authority and is able to impose its will on the Parking Authority. It is a component unit of the City, and the financial statements of the Parking Authority are included within the financial statements of the City, using the blended method. The Parking Authority has been inactive since 1999. The West Covina Community Services Foundation, Inc. (the Foundation) was established on July 26, 2005, as a nonprofit public benefit corporation. It was organized and operates exclusively for charitable purposes within the meaning of Section 501(c)(3) of the Internal Revenue Code. The Foundation is administered by the Board of Directors who are the members of the City Council. The Foundation is blended into the special revenue funds of the City.
Since the City Council serves as the governing board for these component units, all of the City's component units are considered to be blended component units. Blended component units, although legally separate entities, are in substance, part of the City's operations and so data from these units are reported with the interfund data of the primary government. Except for the Housing Authority, these component units do not issue component unit financial statements.
Separate financial statements for the Housing Authority can be obtained from the City of West Covina, City Hall. C) Basis of Accounting and Measurement Focus
The basic financial statements of the City are composed of the following:
Government-wide financial statements Fund financial statements Notes to basic financial statements

City of West Covina Notes to Basic Financial Statements For the Year Ended June 30, 2016
-33-
1) SUMMARY OF SIGNIFICANT ACCOUNTING POLICIES, (continued)
C) Basis of Accounting and Measurement Focus, (continued)
Government-wide Financial Statements Government-wide financial statements display information about the reporting government as a whole, except for its fiduciary activities. These statements include separate columns for the governmental and business-type activities of the primary government (including its blended component units). Eliminations have been made in the Statement of Activities so that certain allocated expenses are recorded only once (by the function to which they were allocated). However, general government expenses have not been allocated as indirect expenses to the various functions of the City. Interfund services provided and used are not eliminated in the process of consolidation. The accounting and financial reporting treatment is determined by the applicable measurement focus and basis of accounting. Measurement focus indicates the type of resources being measured such as current financial resources or economic resources. The basis of accounting indicates the timing of transactions or events for recognition in the financial statements. Government-wide financial statements are presented using the economic resources measurement focus and the accrual basis of accounting. Under the economic resources measurement focus, all (both current and long-term) economic resources and obligations of the reporting government are reported in the government-wide financial statements. Under the accrual basis of accounting, revenues, expenses, gains, losses, assets, and liabilities resulting from exchange and exchange-like transactions are recognized when the exchange takes place. Revenues, expenses, gains, losses, assets and liabilities resulting from nonexchange transactions are recognized in accordance with the requirements of GASB Statement No. 33. Program revenues include 1) charges to customers or applicants who purchase, use, or directly benefit from goods, services, or privileges provided by a given function and 2) grants and contributions that are restricted to meeting the operational or capital requirements of a particular function. Program revenues are netted with program expenses in the statement of activities to present the net cost of each program. Taxes and other items not included among program revenues are reported as general revenues. Amounts paid to acquire capital assets are capitalized as assets in the government-wide financial statements, rather than reported as an expenditure. Proceeds of long-term debt are recorded as a liability in the government-wide financial statements, rather than as an other financing source. Amounts paid to reduce long-term indebtedness of the reporting government are reported as a reduction of the related liability, rather than as an expenditure.

City of West Covina Notes to Basic Financial Statements For the Year Ended June 30, 2016
-34-
1) SUMMARY OF SIGNIFICANT ACCOUNTING POLICIES, (continued)
C) Basis of Accounting and Measurement Focus, (continued)
Fund Financial Statements
The underlying accounting system of the City is organized and operated on the basis of separate funds, each of which is considered to be a separate accounting entity. The operations of each fund are accounted for with a separate set of self-balancing accounts that comprise its assets, deferred outflows of resources, liabilities, deferred inflows of resources, fund equity, revenues and expenditures or expenses, as appropriate. Governmental resources are allocated to and accounted for in individual funds based upon the purposes for which they are to be spent and the means by which spending activities are controlled.
Fund financial statements for the primary government's governmental, proprietary, and fiduciary funds are presented after the government-wide financial statements. These statements display information about the major funds individually and other governmental funds in the aggregate for governmental funds. Fiduciary statements represent assets held by the City in a custodial capacity for other individuals or organizations in the private purpose trust, pension trust, and agency funds.
Governmental Funds
In the fund financial statements, governmental funds are presented using the modified-accrual basis of accounting. Their revenues are recognized when they become measurable and available. Measurable means that the amounts can be estimated, or otherwise determined. Available means that the amounts were collected during the reporting period or soon enough thereafter to be available to finance the expenditures accrued for the reporting period.
Revenue recognition is subject to the measurable and available criteria for the governmental funds in the fund financial statements. Significant revenues subject to the criteria include taxes, licenses and permits, and intergovernmental revenues. Exchange transactions are recognized as revenues in the period in which they are earned (i.e., the related goods or services are provided). Locally imposed derived tax revenues are recognized as revenues in the period in which the underlying exchange transaction upon which they are based takes place. Imposed nonexchange transactions are recognized as revenues in the period for which they were imposed. If the period of use is not specified, they are recognized as revenues when an enforceable legal claim to the revenues arises or when they are received, whichever occurs first. Government-mandated and voluntary nonexchange transactions are recognized as revenues when all applicable eligibility requirements have been met.

City of West Covina Notes to Basic Financial Statements For the Year Ended June 30, 2016
-35-
1) SUMMARY OF SIGNIFICANT ACCOUNTING POLICIES, (continued)
C) Basis of Accounting and Measurement Focus, (continued)
Governmental Funds, (continued)
In the fund financial statements, governmental funds are presented using the current financial resources measurement focus. This means that only current assets, deferred outflows of resources, current liabilities and deferred inflows of resources are generally included on their balance sheets. The reported fund balance is considered to be a measure of "available spendable resources”. Governmental fund operating statements present increases (revenues and other financing sources) and decreases (expenditures and other financing uses) in fund balance. Accordingly, they are said to present a summary of sources and uses of "available spendable resources" during a period.
Revenues, expenditures, assets, and liabilities resulting from nonexchange transactions are recognized in accordance with the requirements of GASB Statement No. 33 which requires that local governments defer grant revenue that is not received within 60 days after the fiscal year ends to meet the "available" criteria of revenue recognition. Therefore recognition of governmental fund type revenue represented by receivables is reported as deferred inflows of resources until they meet the “availability” criteria.
Sales taxes, property taxes, franchise taxes, revenue from other agencies, rental income, occupancy taxes and interest associated with the current fiscal period are all considered to be susceptible to accrual and so have been recognized as revenues of the current fiscal period to the extent normally collected within the availability period. Other revenue items are considered to be measurable and available where cash is received by the government. The availability period for all revenues is 60 days.
Amounts expended to acquire capital assets are recorded as expenditures in the year that resources were expended, rather than as fund assets. The proceeds of long-term debt are recorded as other financing sources rather than as a fund liability. Amounts paid to reduce long-term indebtedness are reported as fund expenditures rather than as a reduction of a fund liability.

City of West Covina Notes to Basic Financial Statements For the Year Ended June 30, 2016
-36-
1) SUMMARY OF SIGNIFICANT ACCOUNTING POLICIES, (continued)
C) Basis of Accounting and Measurement Focus, (continued)
Proprietary and Fiduciary Funds
The City's enterprise and internal service funds are proprietary funds. In the fund financial statements, the proprietary funds are presented using the accrual basis of accounting. Revenues are recognized when they are earned and expenses are recognized when the related goods or services are delivered. In the fund financial statements, proprietary funds are presented using the economic resources measurement focus. This means that all assets, deferred outflows of resources, liabilities, and deferred inflows of resources (whether current or noncurrent) associated with their activity are included on their statement of net position. Proprietary fund type operating statements present increases (revenues) and decreases (expenses) in total net position.
Proprietary fund operating revenues, such as charges for services, result from exchange transactions associated with the principal activity of the fund. Exchange transactions are those in which each party receives and gives up essentially equal values. Non-operating revenues, such as subsidies, taxes, and investment earnings result from nonexchange transactions or ancillary activities. Amounts paid to acquire capital assets are capitalized as assets in the enterprise fund financial statements, rather than reported as an expenditure. Proceeds of long-term debt are recorded as a liability in the enterprise fund financial statements, rather than as another financing source. Amounts paid to reduce long-term indebtedness of the enterprise fund are reported as a reduction of the related liability, rather than as an expenditure.
The City's fiduciary private purpose and pension trust funds are accounted for using the economic resources measurement focus and accrual basis of accounting. The private purpose trust fund accounts for the assets held by the City for the Successor Agency to the Community Development Commission of the City. The pension trust funds accounts for assets and activities of the Public Agency Retirement System Enhancement and Supplemental Retirement defined benefit pension plans. The City's fiduciary agency funds have no measurement focus but utilize the accrual basis for reporting its assets and liabilities. Because these funds are not available for use by the City, fiduciary funds are not included in the governmental-wide statements.

City of West Covina Notes to Basic Financial Statements For the Year Ended June 30, 2016
-37-
1) SUMMARY OF SIGNIFICANT ACCOUNTING POLICIES, (continued) D) Fund Classifications The City reports the following major governmental funds:
General Fund
This fund is the City’s primary operating fund. It accounts for all financial resources of the City, except those required to be accounted for in another fund.
West Covina Housing Authority Special Revenue Fund This fund is used to account for assets and related income received from the former Community Development Commission to be used for the administration of providing affordable housing in the City. Grants Special Revenue Fund This fund accounts for various Federal, State of California, and local grants that are restricted to expenditures for specific programs and projects. City Debt Service Fund This fund is used to account for the payment of principal, interest and related costs on the City's long-term debt issues.
The City reports the following major proprietary fund:
Computer Service Enterprise Fund
This fund is used to account for operations that are financed and operated in a manner similar to private business enterprises. The City's enterprise fund is used to account for computer services provided by the Police Department to other public agencies.

City of West Covina Notes to Basic Financial Statements For the Year Ended June 30, 2016
-38-
1) SUMMARY OF SIGNIFICANT ACCOUNTING POLICIES, (continued)
D) Fund Classifications, (continued)
Additionally, the City reports the following fund types:
Governmental Fund Types Special Revenue Funds – These funds are used to account for specific revenues that are legally restricted to expenditure for particular purposes. Capital Projects Funds – These funds are used to account for the purchase or construction of major capital facilities which are not financed by Proprietary Funds. Capital Projects Funds are ordinarily not used to account for the acquisition of furniture, fixtures, machinery, equipment and other relatively minor or comparatively short-lived capital assets. Proprietary Fund Types Internal Service Funds - These funds are used to account for vehicle and equipment maintenance and replacement, for the City's self-insurance programs, and for retirement health savings plans for qualified City employees. Departments of the City are charged for the services provided or benefits received from these funds. Fiduciary Fund Types Private Purpose Trust Fund - This fund is used to account for the assets and activities of the Successor Agency to Community Development Commission of the City of West Covina.
Pension Trust Funds - These funds are used to account for the assets and activities of the Public Agency Retirement System Retirement Enhancement and Supplemental Retirement plans.
Agency Fund - This fund is used to account for special deposits received by the City.

City of West Covina Notes to Basic Financial Statements For the Year Ended June 30, 2016
-39-
1) SUMMARY OF SIGNIFICANT ACCOUNTING POLICIES, (continued)
E) Financial Statement Elements 1) Cash, Cash Equivalents, and Investments
The City follows the practice of pooling cash and investments of all funds except for funds required to be held by outside fiscal agents under the provisions of bond indentures. Each fund’s share in this pool is displayed in the accompanying financial statements as cash and investments. Interest income earned on pooled cash and investments is allocated monthly to the various funds based on the month-end cash and investment balances. Interest income from cash and investments with fiscal agents is credited directly to the related fund.
The City’s cash and cash equivalents are considered to be cash on hand, demand deposits, and short-term investments with original maturities of three months or less from the date of acquisition.
Investments are reported at fair value. The State Treasurer’s Investment Pool operates in accordance with appropriate state laws and regulations. The reported value of the pool is the same as the fair value of the pool shares.
2) Receivables and Payables
Activity between funds that are representative of lending/borrowing arrangements outstanding at the end of the fiscal year are referred to as either “due to/from other funds” (i.e., the current portion of interfund loans) or “advances to/from other funds” (i.e., the non-current portion of interfund loans). Any residual balances outstanding between the governmental activities and business-type activities are reported in the government-wide financial statements as “internal balances.”
Advances between funds, as reported in the fund financial statements, are offset by a fund balance reserve in applicable governmental funds to indicate that they are not available for appropriation and are not expendable available financial resources. 3) Inventory Inventory is stated at average cost. Physical counts of inventory are taken on a cyclical basis during each fiscal year with perpetual records adjusted to actual at that time. The City uses the consumption method of accounting for inventory. 4) Prepaid Items
Certain payments to vendors for costs applicable to future accounting periods are recorded as prepaid items in both government-wide and fund financial statements using the consumption method.

City of West Covina Notes to Basic Financial Statements For the Year Ended June 30, 2016
-40-
1) SUMMARY OF SIGNIFICANT ACCOUNTING POLICIES, (continued)
E) Financial Statement Elements, (continued)
5) Notes Receivable
The accompanying financial statements reflect the recording of certain notes receivable that represent loans made to private developers and other parties. In certain cases, the amount of collection is dependent upon future residual receipts to be generated by the property or contingent upon the ability of the owner to sell the property at an amount sufficient to pay all liens against the property.
6) Deferred Outflows/Inflows of Resources In addition to assets, the statement of net position and the governmental funds balance sheet will sometimes report a separate section for deferred outflows of resources. This separate financial statement element, deferred outflows of resources, represents a consumption of net position that applies to future periods and so will not be recognized as an outflow of resources (expense/expenditure) until that time. The City has one item that qualifies for reporting in this category, which is the deferred outflow related to pensions. This amount is equal to employer contributions made after the measurement date of the net pension liability. In addition to liabilities, the statement of net position and the governmental funds balance sheet will sometimes report a separate section for deferred inflows of resources. This separate financial statement element, deferred inflows of resources, represents an acquisition of net position that applies to future periods and will not be recognized as an inflow of resources (revenue) until that time. The City has two items that qualify for reporting in this category. The first item is unavailable revenues, which arise only under a modified accrual basis of accounting that qualifies for reporting in this category. Accordingly, unavailable revenues are reported only in the governmental fund balance sheet. The governmental funds report unavailable revenues from two sources: taxes and grants. These amounts are deferred and recognized as an inflow of resources in the period that the amounts become available. The second item is a deferred inflow related to pension resulting from the difference in projected and actual earnings on investments of the pension plan fiduciary net position. This amount is amortized over five years.

City of West Covina Notes to Basic Financial Statements For the Year Ended June 30, 2016
-41-
1) SUMMARY OF SIGNIFICANT ACCOUNTING POLICIES, (continued)
E) Financial Statement Elements, (continued)
7) Net Position Flow Assumptions Sometimes the City will fund outlays for a particular purpose from both restricted (e.g., restricted bond or grant proceeds) and unrestricted resources. In order to calculate the amounts to report as restricted - net position and unrestricted - net position in the government-wide and proprietary fund financial statements, a flow assumption must be made about the order in which the resources are considered to be applied.
It is the City’s practice to consider restricted - net position to have been depleted before unrestricted - net position is applied. 8) Property Taxes
Under California law, property taxes are assessed and collected by the counties up to 1% of assessed value, plus other increases approved by the voters. The property taxes go into a pool, and are then allocated to the cities based on complex formulas. Accordingly, the City of West Covina accrues only those taxes which are received within 60 days after year end.
The property tax calendar is as follows:
Lien Date: January 1 Levy Date: July 1 Due Dates: First Installment – November 1 Second Installment – February 1 Delinquency Dates: First Installment – December 10
Second Installment – April 10 Taxes are collected by Los Angeles County and are remitted to the City periodically. Dates and percentages are as follows:
December 20 40% Advance January 17 10% Advance February 20 Collection No. 1 April 18 35% Advance May 20 Collection No. 2 July 18 Collection No. 3

City of West Covina Notes to Basic Financial Statements For the Year Ended June 30, 2016
-42-
1) SUMMARY OF SIGNIFICANT ACCOUNTING POLICIES, (continued)
E) Financial Statement Elements, (continued)
9) Capital Assets Capital assets greater than $5,000 and infrastructure greater than $100,000 are capitalized and recorded at cost or at an estimated fair value of the assets at the time of acquisition where complete historical records do not exist. Contributed capital assets are valued at their estimated fair market value at the date of the contribution. The costs of normal maintenance and repairs that do not add to the value of the asset or materially extend asset lives are not capitalized. Capital assets include public domain infrastructure assets consisting of certain improvements other than buildings, including roads, bridges, curbs and gutters, streets and sidewalks, medians, sewer and storm drains. Depreciation has been provided using the straight-line method over the estimated useful life of the asset in the government-wide financial statements and in the fund financial statements of the proprietary and the private-purpose trust funds. Interest is capitalized on proprietary fund assets acquired with tax-exempt debt. The amount of interest to be capitalized is calculated by offsetting interest expense incurred from the date of the borrowing until completion of the project with interest earned on invested proceeds over the same period. There was no interest capitalized during the year ended June 30, 2016, since the proprietary funds have no debt utilized to construction capital assets. Capital assets are depreciated using the straight-line method over the following estimated useful lives. Depreciation starts the year following acquisition.
Governmental activities:
Infrastructure - pavement 25 yearsInfrastructure - other 20-75 yearsBuildings 20-50 yearsImprovements other than buildings 20-50 yearsEquipment and vehicles 5-25 years
Business-type activities:Equipment and machinery 5-25 years

City of West Covina Notes to Basic Financial Statements For the Year Ended June 30, 2016
-43-
1) SUMMARY OF SIGNIFICANT ACCOUNTING POLICIES, (continued)
E) Financial Statement Elements, (continued)
10) Claims and Judgments
The City records a liability for litigation, judgments, and claims when it is probable that an asset has been impaired or a liability (including claims incurred but not reported) has been incurred prior to year-end and the probable amount of loss (net of any insurance coverage) can be reasonably estimated. This liability is recorded in the internal service fund that accounts for the City's self-insurance activities.
11) Compensated Absences
A liability is recorded for unused vacation and similar compensatory leave balances since the employees' entitlement to these balances are attributable to services already rendered and it is probable that virtually all of these balances will be liquidated by either paid time off or payments upon termination or retirement.
A liability is recorded for unused sick leave balances only to the extent that it is probable that the unused balances will result in termination payments. This is estimated by including in the liability the unused balances of employees currently entitled to receive termination payment, as well as those who are expected to become eligible to receive termination benefits as a result of continuing their employment with the City. Other amounts of unused sick leave are excluded from the liability since their payment is contingent solely upon the occurrence of a future event (illness) which is outside the control of the City and the employee. The General Fund and Computer Service Enterprise Fund typically have been used to liquidate the liability for compensated absences. 12) Long-Term Obligations
In the government-wide financial statements, long-term debt and other long-term obligations are reported as liabilities in the applicable governmental activities. Bond premiums and discounts are deferred and amortized over the life of the bonds using the straight-line method. Bonds payable are reported net of the applicable bond premium or discount. Bond issuance costs are expensed during the current period.
In the fund financial statements, governmental fund types recognize bond premiums and discounts, as well as bond issuance costs, during the current period. The face amount of debt issued is reported as other financing sources. Premiums received on debt issuances are reported as other financing sources while discounts on debt issuances are reported as other financing uses. Issuance costs, whether or not withheld from the actual debt proceeds received, are reported as debt service expenditures.
City of West Covina Notes to Basic Financial Statements For the Year Ended June 30, 2016
-44-
1) SUMMARY OF SIGNIFICANT ACCOUNTING POLICIES, (continued)
E) Financial Statement Elements, (continued) 13) Reclassifications and Eliminations
Interfund balances must generally be eliminated in the government-wide statements, except for net residual amounts due between governmental activities. Amounts involving fiduciary funds should be reported as external transactions. Any allocations must reduce the expenses of the function from which the expenses are being allocated, so that the expenses are reported only once in the function in which they are allocated. 14) Use of Estimates
The financial statements have been prepared in accordance with accounting principles generally accepted in the United States of America and necessarily include amounts based on estimates and assumptions by management. Actual results could differ from those amounts. 15) Implementation of New Pronouncements
The City implemented GASB Statement No. 72, Fair Value Measurement and Application. The objective of this statement is to address accounting and financial reporting issues related to fair value measurement. The statement defines fair value as the price that would be received to sell an asset or paid to transfer a liability in an orderly transaction between two market participants. This statement provides guidance for determining a fair value measurement for financial reporting purposes and also provides guidance for applying fair value to certain investments and disclosures related to all fair value measurements. The City implemented GASB Statement No. 82, Pension Issues. The objective of this statement is to address certain issues that have been raised with respect to Statements No. 67, Financial Reporting for Pension Plans, No. 68, Accounting and Financial Reporting for Pensions, and No. 73, Accounting and Financial Reporting for Pensions and Related Assets that are Not within the Scope of GASB Statement 68, and Amendments to Certain Provisions of GASB Statements 67 and 68. The statement addresses the presentation of payroll-related measures in required supplementary information, the selection of assumptions and the treatment of deviations from the guidance in an Actuarial Standard of Practice for financial reporting purposes and the classification of payments made by employers to satisfy employee (plan member) contribution requirements.

City of West Covina Notes to Basic Financial Statements For the Year Ended June 30, 2016
-45-
1) SUMMARY OF SIGNIFICANT ACCOUNTING POLICIES, (continued)
E) Financial Statement Elements, (continued) 16) Pension Plans
For purposes of measuring the net pension liability and deferred outflows/inflows of resources related to pensions, and pension expense, information about the fiduciary net position of the City’s California Public Employees’ Retirement System (CalPERS) and Public Agency Retirement System plans (PARS) and additions to/deductions from the Plans’ fiduciary net position have been determined on the same basis as they are reported by CalPERS and PARS. For this purpose, benefit payments (including refunds of employee contributions) are recognized when due and payable in accordance with the benefit terms. Investments are reported at fair value. GASB Statement No. 68 requires that the reported results must pertain to liability and asset information within certain defined timeframes. For this report, the following timeframes are used.
Valuation Date (VD) June 30, 2014 Measurement Date (MD) June 30, 2015 Measurement Period (MP) July 1, 2014 to June 30, 2015

City of West Covina Notes to Basic Financial Statements For the Year Ended June 30, 2016
-46-
2) CASH AND INVESTMENTS
Cash and investments are classified in the accompanying financial statements as follows:
Statement of Net Position:Cash and investments $ 59,849,569 Cash and investments with fiscal agents 2,089,969 Restricted cash and investments 501,028
Statement of Fiduciary Net Position:Cash and investments 20,240,402 Cash and investments with fiscal agents 7,422,268 Restricted cash and investments 113,285
Total Cash and Investments $ 90,216,521
Cash and investments at June 30, 2016, consisted of the following:
Cash on hand $ 20,685 Deposits with financial institutions 11,911,042 Investments 78,284,794
Total Cash and Investments $ 90,216,521

City of West Covina Notes to Basic Financial Statements For the Year Ended June 30, 2016
-47-
2) CASH AND INVESTMENTS, (continued)
Investments Authorized by the California Government Code and the City’s Investment Policy
The table below identifies the investment types that are authorized for the City by the California Government Code and the City’s investment policy. This table also identifies certain provisions of the California Government Code (or the City’s investment policy, if more restrictive) that addresses interest rate risk and concentrations of credit risk. This table does not address investments of debt proceeds held by bond trustees that are governed by the provisions of debt agreements of the City and investments in the City’s retirement enhancement and supplemental retirement defined benefit pension trust funds that are in the Public Agency Retirement Plans (PARS Trust Pool), rather than the general provisions of the California Government Code or the City’s investment policy.
Authorized Maximum Maximum
by Investment Maximum Percentage InvestmentPolicy Maturity* of Portfolio* in One Issuer*
U.S. Treasury Obligations Yes 5 years None NoneU.S. Government Sponsored
Agency Securities Yes 5 years None NoneMunicipal Securities Yes 5 years 30% 5%Supernationals Yes 5 years 30% 10%Medium-Term Notes Yes 5 years 30% 5%Collateralized Certificate of Deposit Yes 5 years 25% 25%Negotiable Certificate of Deposit Yes 5 years 30% 30%Banker's Acceptance Yes 180 days 40% 30%Commercial Paper Yes 270 days 25% 5%Asset-Backed Securities Yes 5 years 20% 20%Money Market Mutual Funds Yes N/A 20% 10%Repurchase Agreements Yes 100 days 20% 20%County Pooled Investment Funds Yes N/A None NoneLocal Agency Investment Fund Yes N/A None $65,000,000
Authorized by State LawInvestment Types
* Based on state law requirements or investment policy requirements, whichever is more restrictive.

City of West Covina Notes to Basic Financial Statements For the Year Ended June 30, 2016
-48-
2) CASH AND INVESTMENTS, (continued)
Investments Authorized by Debt Agreements
Investments of debt proceeds held by bond trustee are governed by provisions of the debt agreements, rather than the general provisions of the California Government Code or the City’s investment policy. The table below identifies the investment types that are generally authorized for investments held by bond trustee. The table also identifies certain provisions of these debt agreements that address interest rate risk and concentration of credit risk.
Maximum MaximumMaximum Percentage Investment
Authorized Investment Type Maturity Allowed in One IssuerNone None None
U.S Government SponsoredAgency Securities None None None
Certificates of Deposit None None NoneBanker's Acceptance 360 to 365 days None NoneCommercial Paper 180 to 365 days None NoneRepurchase Agreements 30 days to 6 months None NoneLocal Agency Investment Fund None None NoneInvestment Agreements None None NoneMoney Market Funds None None None
U.S. Treasury Obligations
Investments Authorized by Pension Trust Agreements
Investments of pension trust fund contributions held by the trustee are governed by the trust agreements. The City selected an investment strategy allowed by the trust agreements with the objective of providing current income and moderated capital appreciation. The strategic ranges for the investment strategy selected by the City are as follows:
5% Cash 45% Fixed Income 48.50% Equities 1.50% REIT

City of West Covina Notes to Basic Financial Statements For the Year Ended June 30, 2016
-49-
2) CASH AND INVESTMENTS, (continued)
Interest Rate Risk
Interest rate risk is the risk that changes in market interest rates will adversely affect the fair value of an investment. Generally, the longer the maturity of an investment, the greater is the sensitivity of its fair value to changes in market interest rates. One of the ways that the City manages its exposure to interest rate risk is by purchasing a combination of shorter term and longer term investments and by timing cash flows from maturities so that a portion of the portfolio is maturing or coming close to maturity evenly over time as necessary to provide the cash flow and liquidity needed for operations. Information about the sensitivity of the fair values of the City’s investments (including investments held by bond trustee) to market interest rate fluctuations is provided by the following table that shows the distribution of the City’s investments by maturity:
Less than 1 to 3 3 to 5
1 year Years Years TotalLos Angeles County Investment Pool 42,032,319$ -$ -$ 42,032,319$ U.S. Treasury Obligations 17,548,347 - - 17,548,347 U.S. Government Sponsored
Agency Securities 6,709,151 765,551 - 7,474,702 Commercial Paper 3,746,068 - - 3,746,068 Supranational 999,679 - - 999,679 Negotiable Certificates of Deposit 749,902 - - 749,902 Money market mutual funds 4,473,831 - - 4,473,831 Asset-Backed Securities - - 501,871 501,871
Subtotal 76,259,297$ 765,551$ 501,871$ 77,526,719$
PARS Trust Pool 758,075 Total Investments 78,284,794$
Investment Type
Credit Risk
Generally, credit risk is the risk that an issuer of an investment will not fulfill its obligation to the holder of the investment. This is measured by the assignment of a rating by a nationally recognized statistical rating organization. Presented below is the minimum rating required by the California Government Code, the City’s investment policy, or debt agreements and the actual rating as of year-end by Standard and Poor’s for each investment type.
Minimum Total Legal as of Not
Rating* June 30, 2016 AAA AA+ A-1+ A-1 RatedLos Angeles County Investment Pool N/A 42,032,319$ -$ -$ -$ -$ 42,032,319$ U.S. Treasury Obligations N/A 17,548,347 - - 17,548,347 - - U.S. Government Sponsored
Agency Securities N/A 7,474,702 - 2,475,939 4,998,763 - - Commercial Paper A-1 3,746,068 - - 747,900 2,998,168 - Supranational AA/A-1+ 999,679 - - 999,679 - - Negotiable Certificates of Deposit A 749,902 - - 749,902 - - Money market mutual funds AAA 4,473,831 4,473,831 - - - - Asset-Backed Securities AA 501,871 501,871 - - - - PARS Trust Pool N/A 758,075 - - - - 758,075
Total 78,284,794$ 4,975,702$ 2,475,939$ 25,044,591$ 2,998,168$ 42,790,394$
* N/A- Not Applicable
Investment Type
City of West Covina Notes to Basic Financial Statements For the Year Ended June 30, 2016
-50-
2) CASH AND INVESTMENTS, (continued)
Concentration of Credit Risk
The investment policy of the City contains no limitations on the amount that can be invested in any one issuer beyond that stipulated by the California Government Code. Investments in any one issuer (other than U.S. Gov, Agencies, Supranationals, Money Market Funds, and external investment pools) that represent 5% or more of total City investments are as follows:
Issuer Investment Type Reported Amount
Westdeutsche Landesbank Investment agreement $5,002,670
Custodial Credit Risk
Custodial credit risk for deposits is the risk that, in the event of the failure of a depository financial institution, a government will not be able to recover its deposits or will not be able to recover collateral securities that are in the possession of an outside party. The custodial credit risk for investments is the risk that, in the event of the failure of the counterparty (e.g., broker-dealer) to a transaction, a government will not be able to recover the value of its investment or collateral securities that are in the possession of another party.
The California Government Code and the City’s investment policy do not contain legal or policy requirements that would limit the exposure to custodial credit risk for deposits or investments, other than the following provisions for deposits: The California Government Code requires that a financial institution secure deposits made by state or local governmental units by pledging securities in an undivided collateral pool held by a depository regulated under state law (unless so waived by the governmental unit). The market value of the pledged securities in the collateral pool must equal at least 110% of the total amount deposited by the public agencies. California law also allows financial institutions to secure City deposits by pledging first trust deed mortgage notes having a value of 150% of the secured public deposits. As of June 30, 2016, all the City’s deposits are either federally insured or collateralized. Investments held by bond trustee are selected under the terms of the applicable trust agreement. The trustee acquires the investment and holds the investment on behalf of the reporting government.

City of West Covina Notes to Basic Financial Statements For the Year Ended June 30, 2016
-51-
2) CASH AND INVESTMENTS, (continued) Investment in County Investment Pool The city is a voluntary participant in the Los Angeles County Investment Pool (LACIP) that is regulated by the California Government Code and the Los Angeles County Board of Supervisors under the oversight of the Los Angeles County Treasurer-Tax Collector. The fair value of the City’s investment in this pool is reported in the accompanying financial statements at amount based upon the City’s pro-rata share of the fair value provided by LACIP for the entire LACIP portfolio. The balance for withdrawal is based on the accounting records maintained by LACIP, which are recorded on an amortized cost basis. Fair Value Measurements GASB Statement No. 72, Fair Value Measurements and Application, establishes a fair value hierarchy consists of three broad levels: Level 1 inputs consist of quoted prices (unadjusted) for identical assets and liabilities in active markets that a government can access at the measurement date, Level 2 inputs consist of inputs other than quoted prices that are observable for an asset or liability, either directly or indirectly, and Level 3 inputs have the lowest priority and consist of unobservable inputs for an asset or liability. The following table presents the balances of the assets measured at fair value on a recurring basis as of June 30, 2016.
Total Level 1 Level 2 Level 3
U.S. Treasury Obligations 17,548,347$ -$ 17,548,347$ -$ U.S. Government Sponsored
Agency Securities 7,474,702 - 7,474,702 - Commercial Paper 3,746,068 - 3,746,068 - Supranational 999,679 - 999,679 - Negotiable Certificates of Deposit 749,902 - 749,902 Asset-Backed Securities 501,871 - 501,871 -
Total Investments by Fair Value Level 31,020,569 -$ 31,020,569$ -$
Investments Measured at Net Asset Value (NAV)
Los Angeles County Investment Pool 42,032,319 Money market mutual funds 4,473,831 PARS Trust Pool 758,075
Total 78,284,794$
Fair Value Measurement UsingInvestments by Fair Value Level

City of West Covina Notes to Basic Financial Statements For the Year Ended June 30, 2016
-52-
3) INTERFUND RECEIVABLES AND TRANSFERS
Interfund transactions – Due to/due from interfund borrowings Interfund receivable and payable balances at June 30, 2016, are as follows:
General Internal ServicePayable Fund Fund Funds Total
General Fund -$ 128,817$ 128,817$ Grants 605,197 - 605,197 Non-Major Governmental Funds 690,548 - 690,548 Internal Service Funds 78,183 - 78,183
Total 1,373,928$ 128,817$ 1,502,745$
Receivable Fund
These interfund payables represent temporary loans to cover negative cash balances. Interfund transactions - Advances
Receivable FundPayable Fund General Fund
Non-Major Governmental Funds 523,582$
Advances between the General Fund and the Auto Plaza Improvement District non-major special revenue fund are for cash advanced for the replacement of the readerboard sign at the Auto Plaza.

City of West Covina Notes to Basic Financial Statements For the Year Ended June 30, 2016
-53-
3) INTERFUND RECEIVABLES AND TRANSFERS, (continued) Interfund transactions - Transfers The following schedule summarizes the City's transfer activity:
GrantsSpecial Non-major Internal Total
General Revenue City Debt Governmental Service TransfersFund Fund Service Fund Funds Funds Out
Transfers Out:General Fund -$ 570$ 2,184,676$ 255,237$ 6,083,033$ 8,523,516$ Non-major Governmental Funds 2,240,149 - - 48,631 - 2,288,780 Enterprise Fund 101,775 - - - - 101,775
Total Transfers In: 2,341,924$ 570$ 2,184,676$ 303,868$ 6,083,033$ 10,914,071$
Transfers In
The General Fund transferred $6,083,033 to the Internal Service Funds to cover deficits in the funds, $2,184,676 to the City Debt Service Fund for debt service payments, and $255,237 to the Non-major Governmental Funds to close the Fee and Charge Fund to the General Fund and fund information technology ongoing upgrades. The Non-major Governmental Funds transferred $2,240,149 to the General Fund to reimburse for public safety, public works, and community service activities. The Computer Service Enterprise Fund transferred $101,775 to the General Fund to reimburse for public safety activities.
4) LONG-TERM RECEIVABLES FROM SUCCESSOR AGENCY
Prior to the dissolution of the Commission’s redevelopment activities on February 1, 2012, the City authorized several advances to be used for completing redevelopment projects throughout the community. As a result of the dissolution, the liabilities related to these advances were transferred to the Successor Agency. See Note 17 for additional information. At June 30, 2016, the outstanding receivable side of these advances was as follows: (a) The General Fund had made the several advances to the Commission totaling
$8,100,000 for administrative and capital improvement construction costs (“General Advance”). Eighty percent (80%) of the balance is reported in the General Fund and the remaining twenty percent (20%) balance is reported in the West Covina Housing Authority Special Revenue Fund.

City of West Covina Notes to Basic Financial Statements For the Year Ended June 30, 2016
-54-
4) LONG-TERM RECEIVABLES FROM SUCCESSOR AGENCY, (continued) (b) In May 2010, the Commission made an advance of $6,529,308 from the Low and
Moderate Income Housing Capital Projects Fund to the Citywide Project Area Debt Service Fund to satisfy the Commission's Supplemental Educational Revenue Augmentation Fund (SERAF) obligation as required by Assembly Bill ABX4-26. The advance bears no interest. In May 2011, the Commission made an advance of $1,344,269 from the Low and Moderate Income Housing Capital Projects Fund to the Citywide Project Area Debt Service Fund to satisfy the Commission's Supplemental Educational Revenue Augmentation Fund (SERAF) obligation as required by Assembly Bill ABX4-26. The advance bears no interest and must be repaid by August 1, 2022. Effective February 1, 2012, the Commission’s redevelopment activities were dissolved and the receivable side of these advances were retained by the Housing Authority.
The “Dissolution Act” (AB 1x26 as amended by AB 1484) outlines the method of repayment for the General Advances and the SERAF Advances by the Successor Agency. The Dissolution Act sets a defined schedule by which the General Advances may be repaid. The repayment schedule is to span a reasonable term of years, with outstanding balances incurring interest at a rate not to exceed that earned by the funds deposited into the Local Agency Investment Fund (“LAIF”). Repayment of the General Advances is subject to additional repayment limitations. Repayment commenced in the 2015-2016 fiscal year, annual payments are capped as determined by a specific formula, repayment of the General Advances is on a lower payment priority than other obligations of the Successor Agency, and twenty percent (20%) of the repayment amount must be deposited in the LMIHF for the benefit of the Housing Authority. Total SERAF advance repayments made in the 2015-16 fiscal year were $1,120,000. At June 30, 2016, the outstanding balances are as follows:
General advances 6,480,000$ SERAF advances 5,525,194
Total 12,005,194$

City of West Covina Notes to Basic Financial Statements For the Year Ended June 30, 2016
-55-
5) NOTES AND LOANS RECEIVABLE
As of June 30, 2016, the following notes and loans receivable were outstanding:
Housing rehabilitation 379,446$ First time home buyers 305,891 Housing preservation program 643,599 Home improvement program 998,387 Lark Ellen Towers 6,094,330 Executive Lodge Apartments Limited Partnership 6,278,002 West Covina Senior Villas, LLC 2,833,333 West Covina Senior Villas II, L.P. 8,513,885 Other loans 642,892 Allowance for doubtful accounts (11,990,110)
Total 14,699,655$
Several housing rehabilitation loans totaling $379,446 have been made to qualified applicants using Community Development Block Grants received by the City and housing set-aside funds of the former Commission’s redevelopment activities. These loans bear interest up to 5% and are repaid when title to the property changes. The Authority has loans to first-time home buyers totaling $305,891. Loans are secured by second trust deeds and bear interest at 5%. Principal and interest are deferred for five years and are due monthly in years 6 through 30. There were 20 individual loans outstanding at June 30, 2016, ranging from $8,939 to $22,407. The Authority also has housing preservation loans to qualified applicants using housing set-aside funds totaling $643,599. Principal and interest are deferred for ten years; after the tenth year loans bear interest at 5%. Loans are repaid after the tenth year or when title to the property changes. There were 86 individual loans outstanding at June 30, 2016, ranging from $205 to $10,659. In May 1997, the Commission loaned $4,270,000 to Lark Ellen Towers. The loan was transferred to the Authority from the dissolved former Commission. The loan is secured by a deed of trust. The loan accrues interest at 3% per annum and requires annual payments equal to the maximum of $35,000 or 50% of net profits earned by the project. The outstanding principal and accrued interest at June 30, 2016, is $6,094,330. In April 1998, the Commission loaned $5,622,300 to Executive Lodge Apartments Limited Partnership (Promenade Apartments project). The loan was transferred to the Authority from the dissolved former Commission. The loan is secured by a deed of trust. The loan accrues interest at 3% per annum and requires annual payments equal to 80% of net profits earned by the project. The outstanding principal and accrued interest at June 30, 2016, is $6,278,002.

City of West Covina Notes to Basic Financial Statements For the Year Ended June 30, 2016
-56-
5) NOTES RECEIVABLE, (continued) Several housing improvement loans totaling $998,387 have been made to qualified applicants. Loans are secured by second trust deeds.
In May 2002, the Commission loaned $4,360,000 to West Covina Senior Villas, LLC. The loan is secured by a deed of trust. The loan does not accrue interest. The note requires annual payments of $141,667 through May 2032 that are forgiven by the City unless the borrower defaults on the agreement. The outstanding principal at June 30, 2016, is $2,833,333. The loan is likely to be forgiven; therefore, the City has included the entire balance in the allowance for doubtful accounts. In May 2009, the Commission entered into an agreement with West Covina Senior Villas II, L.P. to provide $8,600,000 for the acquisition of real property in the City of West Covina and construction and maintenance of an approximately 65-unit apartment complex to be rented to low income and very low income senior citizens. The loan is secured by a deed of trust. The loan does not accrue interest and is forgiven so long as the borrower does not default on the loan. The outstanding principal at June 30, 2016, is $8,513,885. The loan is likely to be forgiven; therefore, the City has included the entire balance in the allowance for doubtful accounts. Other notes consist of affordable housing loans of $400,000. The notes do not accrued interest and are forgiven unless the borrower sells or refinances the property. Additionally, the balance included a note of $242,892 for low income housing which accrues no interest and is forgivable if the owner maintains the low and moderate income housing status. The loan is likely to be forgiven; therefore, the City has included the entire balance in the allowance for doubtful accounts. The outstanding principal at June 30, 2016, is $642,892.

City of West Covina Notes to Basic Financial Statements For the Year Ended June 30, 2016
-57-
6) CAPITAL ASSETS
Capital asset activity was as follows for the year ended June 30, 2016:
Governmental activities: Balance BalanceJune 30, 2015 Additions Deletions June 30, 2016
Capital assets, not depreciated:Land 38,974,512$ 9,789,266$ (863,490)$ 47,900,288$ Rights of way 14,376,498 - - 14,376,498 Construction in progress 1,091,085 7,159,429 (3,867,920) 4,382,594
Total capital assets, not depreciated 54,442,095 16,948,695 (4,731,410) 66,659,380
Capital assets, being depreciated:Buildings and improvements 89,397,581 335,967 - 89,733,548 Equipment and vehicles 26,642,889 1,736,782 (1,170,738) 27,208,933 Infrastructure - pavement 191,375,001 2,465,852 - 193,840,853 Infrastructure-other 22,612,509 - - 22,612,509
Total capital assets, being depreciated 330,027,980 4,538,601 (1,170,738) 333,395,843
Less accumulated depreciation for:Buildings and improvements (24,593,258) (1,863,928) - (26,457,186) Equipment and vehicles (19,744,557) (2,294,299) 1,170,738 (20,868,118) Infrastructure - pavement (118,986,558) (6,911,409) - (125,897,967) Infrastructure - other (16,547,999) (371,301) - (16,919,300)
Total accumulated depreciation (179,872,372) (11,440,937) 1,170,738 (190,142,571)
Total capital assets, being depreciated, net 150,155,608 (6,902,336) - 143,253,272
Total governmental activities $ 204,597,703 $ 10,046,359 $ (4,731,410) $ 209,912,652
Depreciation expense (including $40,582 from Internal Service Funds) was charged to the following functions in the Statement of Activities for the year ended June 30, 2016, as follows:
Governmental Activities:
General government $ 196,257 Public safety 1,712,512 Public works 8,007,178 Community services 1,524,990
Total depreciation expense – governmental activities $ 11,440,937

City of West Covina Notes to Basic Financial Statements For the Year Ended June 30, 2016
-58-
6) CAPITAL ASSETS, (continued)
Capital asset activity was as follows for the year ended June 30, 2016:
Business-type activities: Balance BalanceJune 30, 2015 Additions Deletions June 30, 2016
Capital assets, being depreciated:Equipment and vehicles 1,059,120$ -$ -$ 1,059,120$
Less accumulated depreciation for:Equipment and vehicles (1,059,120) - - (1,059,120)
Total business-type activities -$ -$ -$ -$
There was no depreciation expense charged to the computer service program for the year ended June 30, 2016.
7) LONG-TERM LIABILITIES
The following is a summary of changes in long-term liabilities for governmental activities for the year ended June 30, 2016:
Balance Balance Due WithinJune 30, 2015 Additions Deletions June 30, 2016 One Year
Governmental activities:
Lease Revenue Bonds:2002 Lease Revenue Bonds 15,105,000$ -$ (525,000)$ 14,580,000$ 545,000$ 2004 Lease Revenue Bonds 10,520,000 - (355,000) 10,165,000 375,000 2005 Lease Revenue Bonds 2,210,000 - (75,000) 2,135,000 80,000 2006 Lease Revenue Bonds 17,205,000 - (270,000) 16,935,000 310,000 2013 Lease Revenue
Refunding Bonds 2,185,000 - - 2,185,000 65,000 Total Lease Revenue Bonds 47,225,000 - (1,225,000) 46,000,000 1,375,000
Compensated absences 4,096,191 4,278,202 (4,167,126) 4,207,267 2,448,974 Claims and judgments payable 9,187,263 472,694 (6,199) 9,653,758 2,574,566 Capital lease obligations 216,342 2,568,446 (69,451) 2,715,337 249,257 Notes payable 12,941,113 - (733,010) 12,208,103 737,517
Total 73,665,909$ 7,319,342$ (6,200,786)$ 74,784,465$ 7,385,314$
The following is a summary of changes in long-term liabilities for business-type activities for the year ended June 30, 2016.
Balance Balance Due WithinJune 30, 2015 Additions Deletions June 30, 2016 One Year
Business-type activities:
Compensated absences 97,615$ 138,230$ (118,724)$ 117,121$ 65,000$
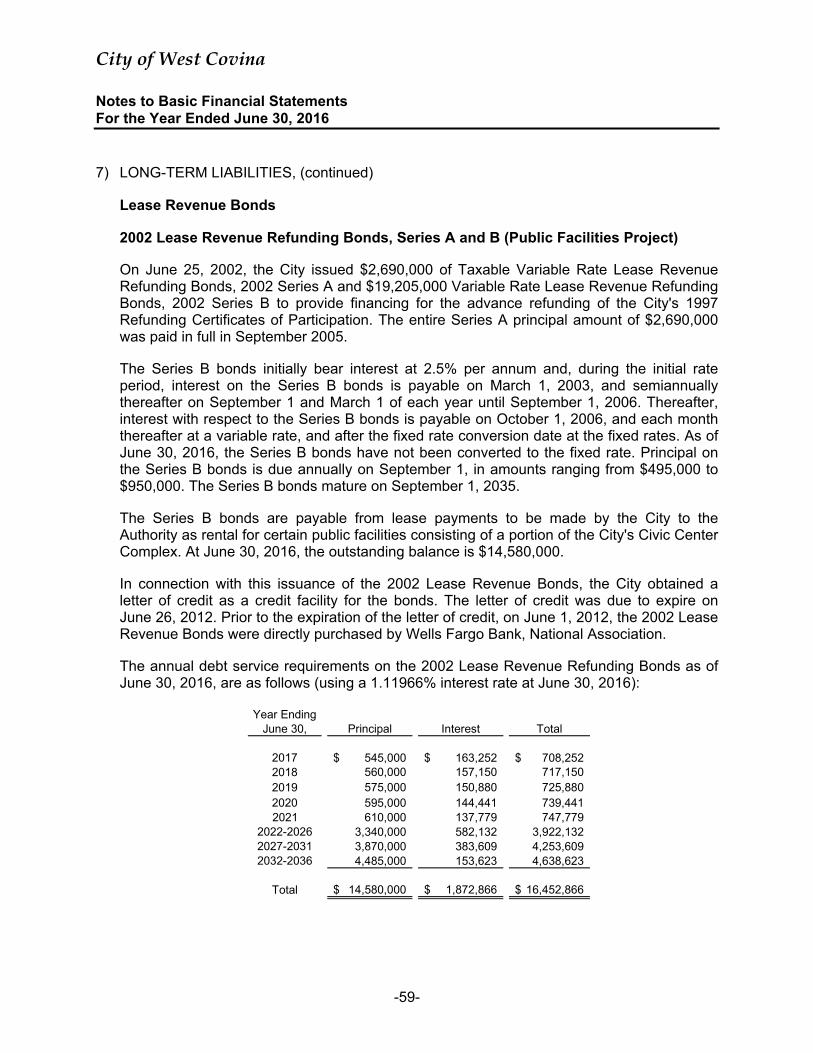
City of West Covina Notes to Basic Financial Statements For the Year Ended June 30, 2016
-59-
7) LONG-TERM LIABILITIES, (continued) Lease Revenue Bonds
2002 Lease Revenue Refunding Bonds, Series A and B (Public Facilities Project) On June 25, 2002, the City issued $2,690,000 of Taxable Variable Rate Lease Revenue Refunding Bonds, 2002 Series A and $19,205,000 Variable Rate Lease Revenue Refunding Bonds, 2002 Series B to provide financing for the advance refunding of the City's 1997 Refunding Certificates of Participation. The entire Series A principal amount of $2,690,000 was paid in full in September 2005. The Series B bonds initially bear interest at 2.5% per annum and, during the initial rate period, interest on the Series B bonds is payable on March 1, 2003, and semiannually thereafter on September 1 and March 1 of each year until September 1, 2006. Thereafter, interest with respect to the Series B bonds is payable on October 1, 2006, and each month thereafter at a variable rate, and after the fixed rate conversion date at the fixed rates. As of June 30, 2016, the Series B bonds have not been converted to the fixed rate. Principal on the Series B bonds is due annually on September 1, in amounts ranging from $495,000 to $950,000. The Series B bonds mature on September 1, 2035. The Series B bonds are payable from lease payments to be made by the City to the Authority as rental for certain public facilities consisting of a portion of the City's Civic Center Complex. At June 30, 2016, the outstanding balance is $14,580,000. In connection with this issuance of the 2002 Lease Revenue Bonds, the City obtained a letter of credit as a credit facility for the bonds. The letter of credit was due to expire on June 26, 2012. Prior to the expiration of the letter of credit, on June 1, 2012, the 2002 Lease Revenue Bonds were directly purchased by Wells Fargo Bank, National Association. The annual debt service requirements on the 2002 Lease Revenue Refunding Bonds as of June 30, 2016, are as follows (using a 1.11966% interest rate at June 30, 2016):
2017 545,000$ 163,252$ 708,252$ 2018 560,000 157,150 717,150 2019 575,000 150,880 725,880 2020 595,000 144,441 739,441 2021 610,000 137,779 747,779
2022-2026 3,340,000 582,132 3,922,132 2027-2031 3,870,000 383,609 4,253,609 2032-2036 4,485,000 153,623 4,638,623
Total 14,580,000$ 1,872,866$ 16,452,866$
Principal Interest TotalYear Ending
June 30,

City of West Covina Notes to Basic Financial Statements For the Year Ended June 30, 2016
-60-
7) LONG-TERM LIABILITIES, (continued) Lease Revenue Bonds, (continued)
2004 Lease Revenue Bonds, Series A and B (Golf Course Project)
In August 2004, the City issued $8,165,000 of Variable Rate Lease Revenue Bonds, Series A and $5,335,000 of Variable Rate Lease Revenue Bonds, Series B to provide financing for grading and infrastructure relating to the City's proposed municipal golf course. The Series A bonds mature annually through May 1, 2034, in amounts ranging from $185,000 to $460,000. The Series B bonds mature annually through May 1, 2034, in amounts ranging from $140,000 and $350,000. The Series A and B bonds bear interest at a variable rate reset weekly and at a fixed rate after the fixed rate conversion date. Prior to the fixed rate conversion date, interest is payable on the first business day of each month. Following the fixed rate conversion date, interest is payable on May 1 and November 1 of each year. As of June 30, 2016, the Series A and B bonds have not been converted to the fixed rate.
The bonds are payable from lease payments as rental for certain public facilities. At June 30, 2016, the outstanding balance is $10,165,000. The annual debt service requirements on the 2004 Lease Revenue Bonds as of June 30, 2016 are as follows (using .41% interest rate at June 30, 2016):
2017 375,000$ 41,677$ 416,677$ 2018 395,000 40,139 435,139 2019 410,000 38,520 448,520 2020 430,000 36,839 466,839 2021 450,000 35,076 485,076
2022-2026 2,565,000 146,124 2,711,124 2027-2031 3,220,000 88,375 3,308,375 2032-2034 2,320,000 19,311 2,339,311
Total 10,165,000$ 446,061$ 10,611,061$
TotalYear Ending
June 30, Principal Interest

City of West Covina Notes to Basic Financial Statements For the Year Ended June 30, 2016
-61-
7) LONG-TERM LIABILITIES, (continued) Lease Revenue Bonds, (continued)
2005 Lease Revenue Bonds, Series C (Public Facilities Project) In September 2005, the City issued $2,735,000 of Variable Rate Lease Refunding Bonds, Series C to provide funds to refinance the City's 2002 Series A Taxable Variable Rate Lease Revenue Refunding Bonds and finance the construction of various public facility projects. The bonds mature annually on September 1 in amounts ranging from $70,000 to $155,000 through September 1, 2034. The bonds bear interest at a variable rate reset weekly and at a fixed rate after the fixed rate conversion date. Prior to the fixed rate conversion date, interest is payable on the first business day of each month. Following the fixed rate conversion date, interest is payable on March 1 and September 1 of each year. As of June 30, 2016, bonds have not been converted to the fixed rate. The bonds are payable from lease payments as rental for certain public facilities. At June 30, 2016, the outstanding balance is $2,135,000. In connection with this issuance of the 2005 Lease Revenue Bonds, the City obtained a letter of credit as a credit facility for the bonds. The letter of credit was due to expire on June 26, 2012. Prior to the expiration of the letter of credit, on June 1, 2012, the 2005 Lease Revenue Bonds were directly purchased by Wells Fargo Bank, National Association. The annual debt service requirements on the 2005 Lease Revenue Bonds as of June 30, 2016, are as follows (using 1.119659 % interest rate at June 30, 2016):
2017 80,000$ 23,905$ 103,905$ 2018 80,000 23,009 103,009 2019 85,000 22,113 107,113 2020 90,000 21,162 111,162 2021 90,000 20,154 110,154
2022-2026 510,000 84,702 594,702 2027-2031 615,000 54,136 669,136 2032-2035 585,000 16,683 601,683
Total 2,135,000$ 265,864$ 2,400,864$
Year Ending June 30, Principal Interest Total

City of West Covina Notes to Basic Financial Statements For the Year Ended June 30, 2016
-62-
7) LONG-TERM LIABILITIES, (continued) Lease Revenue Bonds, (continued)
2006 Lease Revenue Bonds, Series A and B (Big League Dreams Project) In September 2006, the City issued $10,710,000 of Lease Revenue Bonds, Series A and $7,295,000 of taxable Lease Revenue Bonds, Series B to provide financing for facilities and infrastructure related to the Big League Dreams sports park. The Series A bonds mature annually through June 1, 2036, in amounts ranging from $80,000 to $1,270,000, with interest rates that range from 4.0% to a maximum of 5.0% over the term of the bonds. The Series B bonds mature annually through June 1, 2036, in amounts ranging from $115,000 to $550,000, with interest rates that range from 5.39% to a maximum of 6.07% over the term of the bonds. The bonds are payable from lease payments as rental for certain public facilities. The reserve requirement of $1,535,322 was fully funded at June 30, 2016. At June 30, 2016, the outstanding balance is $16,935,000. The annual debt service requirements on the 2006 Lease Revenue Bonds as of June 30, 2016, are as follows:
2017 310,000$ 910,665$ 1,220,665$ 2018 360,000 894,412 1,254,412 2019 405,000 875,692 1,280,692 2020 460,000 854,777 1,314,777 2021 515,000 830,990 1,345,990
2022-2026 3,440,000 3,672,860 7,112,860 2027-2031 4,540,000 2,622,583 7,162,583 2032-2036 6,905,000 1,223,909 8,128,909
Total 16,935,000$ 11,885,888$ 28,820,888$
TotalYear Ending
June 30, Principal Interest

City of West Covina Notes to Basic Financial Statements For the Year Ended June 30, 2016
-63-
7) LONG-TERM LIABILITIES, (continued) Lease Revenue Bonds, (continued)
2013 Lease Revenue Refunding Bonds, Series A (Community Center Project) On January 8, 2014, the City issued $2,185,000 of Variable Rate Lease Revenue Refunding Bonds, 2013 Series to provide financing for the advance refunding of the City's 2003 Lease Revenue Bonds, Series A. The bonds mature annually on August 1 in amounts ranging from $65,000 to $95,000 through August 1, 2043. The bonds bear interest at a variable rate reset weekly and at a fixed rate after the fixed rate conversion date. Prior to the fixed rate conversion date, interest is payable on the first business day of each month. Following the fixed rate conversion date, interest is payable on February 1 and August 1 of each year. As of June 30, 2016, the bonds have not been converted to the fixed rate. At June 30, 2016, the outstanding balance is $2,185,000. The City refunded the 2003 Bonds to reduce its total debt service payments over 30 years by $109,604 and to obtain an economic gain (difference between the present values of the debt service payments on the old and new debt) of $421,241. The annual debt service requirements on the 2013 Lease Revenue Refunding Bonds as of June 30, 2016, are as follows (using .47% interest rate at June 30, 2016):
2017 65,000$ 9,964$ 74,964$ 2018 65,000 9,659 74,659 2019 65,000 9,353 74,353 2020 65,000 9,048 74,048 2021 65,000 8,742 73,742
2022-2026 350,000 38,775 388,775 2027-2031 380,000 30,174 410,174 2032-2036 410,000 20,845 430,845 2037-2041 440,000 10,787 450,787 2042-2044 280,000 1,340 281,340
Total 2,185,000$ 148,687$ 2,333,687$
TotalYear Ending
June 30, Principal Interest

City of West Covina Notes to Basic Financial Statements For the Year Ended June 30, 2016
-64-
7) LONG-TERM LIABILITIES, (continued)
Compensated Absences The liability of $4,207,267 represents the governmental activities portion of total unpaid vacation and compensation time earned by employees of the City. There is no fixed payment schedule for earned but unpaid compensated absences. The General Fund typically has been used to liquidate the liability for compensated absences. The liability of $117,121 represents the business-type activity portion of total unpaid vacation and compensation time earned by employees of the City. There is no fixed payment schedule for earned but unpaid compensated absences. Claims and Judgments The City is exposed to various risks of loss related to its operation, including losses associated with errors and omissions, injuries to employees and members of the public. The City's Internal Service Self-Insurance Fund is used to account for and finance its uninsured risks of loss. The City is self-insured for the first $1,000,000 each for general liability and workers’ compensation claims against the City. The City purchases excess insurance for general liability and workers’ compensation. Settlements for general liability and worker's compensation claims did not exceed the insurance coverage during the last three years. The claims and judgments liability reported in the Internal Service Self-Insurance Fund is based on the requirements of Governmental Accounting Standards Board Statement No. 10, which requires that a liability for claims and judgments be reported if information prior to the issuance of the financial statements indicates that it is probable that a liability has been incurred at the date of the financial statements and the amount of loss can be reasonably estimated. As of June 30, 2016, claims and judgments payable, including estimated claims for incurred but not reported claims, amounted to $9,653,758.
Changes in the claims and judgments payable amounts in fiscal years 2015 and 2016 for the Self-Insurance Fund are as follows:
Beginning of Claims and End ofFiscal Year Changes in Claims Fiscal Year
Fiscal Year Liability Estimates Payments Liability2014-2015 7,939,581$ 1,760,639$ (512,957)$ 9,187,263$ 2015-2016 9,187,263 472,694 (6,199) 9,653,758

City of West Covina Notes to Basic Financial Statements For the Year Ended June 30, 2016
-65-
7) LONG-TERM LIABILITIES, (continued)
Capital Lease Obligations: The following represents governmental activity obligation under capital leases: Ambulance In October 2013, the City entered into a lease agreement for the acquisition of an ambulance. This lease agreement qualifies as a capital lease for accounting purposes (title transfers at the end of the lease) and, therefore, has been recorded at the present value of the future minimum lease payments as of the date of inception. The ambulance acquired under this lease agreement is recorded at their acquisition cost of $358,784. The City obtained financing in the amount of $285,224 with an interest rate of 2.31% and annual payments of $75,471 through the end of the lease (2017). The outstanding balance at June 30, 2016, is $146,891. The calculation of the present value of the future lease payments for obligations under capital leases as of June 30, 2016, is as follows:
Year Ending June 30,
2017 75,471$ 2018 75,471
Total minimum lease payments 150,942 Less amount representing interest (4,051)
Net present value of minimum lease payments 146,891$

City of West Covina Notes to Basic Financial Statements For the Year Ended June 30, 2016
-66-
7) LONG-TERM LIABILITIES, (continued) Capital Lease Obligations, (continued)
Fire Trucks On December 23, 2015, the City entered into a lease agreement for the acquisition of fire trucks. This lease agreement qualifies as a capital lease for accounting purposes (title transfers at the end of the lease) and, therefore, has been recorded at the present value of the future minimum lease payments as of the date of inception. The fire trucks acquired under this lease agreement is recorded at their acquisition cost of $2,568,446. The City obtained financing in the amount of $2,568,446 with an interest rate of 3.10% and semi-annual payments of $129,073 through the end of the lease (2028). At June 30, 2016, the outstanding balance is $2,568,446. The calculation of the present value of the future lease payments for obligations under capital leases as of June 30, 2016, is as follows:
Year Ending June 30,
2017 $ 258,146 2018 258,146 2019 258,146 2020 258,146 2021 258,146
2022-2026 1,290,732 2027-2028 516,294
Total minimum lease payments 3,097,756 Less amount representing interest (529,310)
Net present value of minimum lease payments 2,568,446$

City of West Covina Notes to Basic Financial Statements For the Year Ended June 30, 2016
-67-
7) LONG-TERM LIABILITIES, (continued) Notes Payable Valencia Note On May 1, 2003, the City entered into a note agreement for $1,215,000 to finance the purchase of certain real property. The initial interest rate of 5.31% is adjusted on the eighteenth month anniversary of the effective date, and shall be at that rate which is 0.5% in excess of the two year United States Treasury Bill in existence on the date of such adjustment. Principal and interest payments are due monthly through 2023. The note is payable from the revenues of the General Fund. At June 30, 2016, the outstanding balance is $491,466. The annual debt service requirements on the Valencia note as of June 30, 2016, are as follows:
2017 69,293$ 3,718$ 73,011$ 2018 68,570 3,162 71,732 2019 69,582 2,602 72,184 2020 70,147 2,037 72,184 2021 70,716 1,468 72,184
2022-2023 143,158 1,209 144,367
Total 491,466$ 14,196$ 505,662$
TotalYear Ending
June 30, Principal Interest

City of West Covina Notes to Basic Financial Statements For the Year Ended June 30, 2016
-68-
7) LONG-TERM LIABILITIES, (continued) Notes Payable, (continued)
California Energy Commission Loan On September 5, 2006, the City entered into a note agreement for $1,278,000 to finance for energy efficient purposes the acquisition of equipment and other capital projects. The note accrues interest at 4.5%. Principal and interest payments of $60,295 are due semiannually through June 22, 2023. The note is payable from the revenues of the General Fund. At June 30, 2016, the outstanding balance is $717,204. The annual debt service requirements on the California Energy Commission loan as of June 30, 2016, are as follows:
2017 89,306$ 31,284$ 120,590$ 2018 93,370 27,220 120,590 2019 97,618 22,972 120,590 2020 102,013 18,577 120,590 2021 106,703 13,887 120,590
2022-2023 228,194 12,986 241,180
Total 717,204$ 126,926$ 844,130$
Year Ending June 30, Principal Interest Total

City of West Covina Notes to Basic Financial Statements For the Year Ended June 30, 2016
-69-
7) LONG-TERM LIABILITIES, (continued) Notes Payable, (continued) Successor Agency Note On December 4, 2015, the City and Successor Agency entered into a settlement agreement with the California Department of Finance (DOF) regarding the Other Funds Due Diligence Review. The agreement requires the City to repay the Successor Agency $11,578,351 for transfers that did not represent enforceable obligations. The Successor Agency will then remit these funds to the Los Angeles County Auditor-Controller for allocation to the affected taxing entities. The amount of the note must be repaid through biannual payments in the amount of $289,459 each January 15th and June 15th until the loan is repaid in full on June 15, 2035. There is no interest charged on this repayment. At June 30, 2016, the outstanding balance is $10,999,433. The annual debt service requirements on the Successor Agency note as of June 30, 2016, are as follows:
2017 578,918$ 2018 578,918 2019 578,918 2020 578,918 2021 578,918
2022-2026 2,894,590 2027-2031 2,894,590 2032-2035 2,315,663
Total 10,999,433$
Year Ending June 30, Principal

City of West Covina Notes to Basic Financial Statements For the Year Ended June 30, 2016
-70-
8) LETTERS OF CREDIT The City has letters of credit securing the payment of principal and interest on its variable rate bonded debt. The letters of credit are issued in favor of the bond trustees and enable the trustees to make drawings against the letters of credit for payment of principal and interest amounts, if necessary. There were no draws made during fiscal year ended June 30, 2016. The terms of the letters of credit are summarized as follows:
Letter of credit Trustee Amount Expiration DateWells Fargo Bank:
2004 Lease Revenue Bonds US Bank 10,717,142$ April 30, 2017Bank of the West:
2013A Lease Revenue Bonds US Bank 3,172,313 January 9, 2018
9) FUND BALANCE CLASSIFICATION
The fund balances reported on the fund statements consist of the following categories: Nonspendable Fund Balance - This includes amounts that cannot be spent because they are either (a) not in spendable form or (b) legally or contractually required to be maintained intact. Restricted Fund Balance - This includes amounts that can be spent only for the specific purposes stipulated by constitution, external resource providers, or through enabling legislation. Committed Fund Balance - This classification includes amounts that can be used only for the specific purposes determined by a formal action of the City’s highest level of decision-making authority. The City Council is the highest level of decision-making authority for the City that can, by adoption of an ordinance prior to the end of the fiscal year, commit fund balance. Once adopted, the limitation imposed by the ordinance remains in place until a similar action is taken (the adoption of another ordinance) to remove or revise the limitation. Assigned Fund Balance - This classification includes amounts intended to be used by the City for specific purposes but do not meet the criteria to be classified as committed. The City Council (Council) has by resolution authorized the City Manager to assign fund balance. The Council may also assign fund balance as it does when appropriating fund balance to cover a gap between estimated revenue and appropriations in the subsequent year’s appropriated budget. Unlike commitments, assignments generally only exist temporarily. Additional formal action does not normally have to be taken for the removal of an assignment.

City of West Covina Notes to Basic Financial Statements For the Year Ended June 30, 2016
-71-
9) FUND BALANCE CLASSIFICATION, (continued)
Unassigned Fund Balance - This is the residual classification that includes all spendable amounts not contained in the other classifications When an expenditure is incurred for purposes for which both restricted and unrestricted fund balances are available, the City’s policy is to apply restricted fund balance first. When an expenditure is incurred for purposes for which committed, assigned or unassigned fund balances are available, the City’s policy is to apply committed fund balance first, then assigned fund balance, and finally unassigned fund balance.
West Covina City Non-Major TotalHousing Debt Governmental Governmental
General Authority Grants Service Fund Funds Funds
Nonspendable:
Prepaid expenses 126,197$ 134,167$ -$ 129,073$ 12,351$ 401,788$
Advances to other funds 523,582 523,582
Advances to
Successor Agency 6,480,000 5,525,194 - - - 12,005,194
Restricted:
Affordable housing - 18,786,853 - - - 18,786,853
Debt service - - - 12,882,653 - 12,882,653
Community services - - - - 2,179,015 2,179,015
Public safety - - - - 5,941,231 5,941,231
Public works - - - - 11,677,696 11,677,696
Assigned:
Capital projects - - - - 5,065,065 5,065,065
Unassigned 15,032,610 - (849,395) - (205,599) 13,977,616
Totals 22,162,389$ 24,446,214$ (849,395)$ 13,011,726$ 24,669,759$ 83,440,693$
Special Revenue Funds
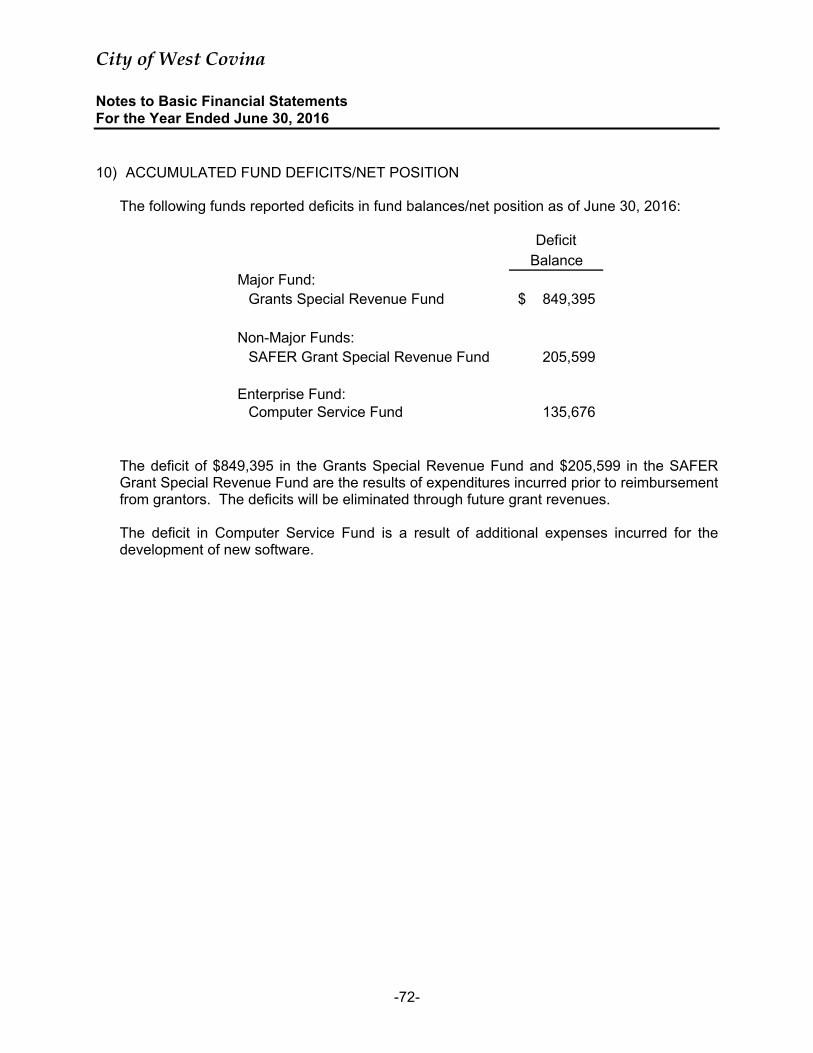
City of West Covina Notes to Basic Financial Statements For the Year Ended June 30, 2016
-72-
10) ACCUMULATED FUND DEFICITS/NET POSITION
The following funds reported deficits in fund balances/net position as of June 30, 2016:
DeficitBalance
Major Fund:Grants Special Revenue Fund 849,395$
Non-Major Funds:SAFER Grant Special Revenue Fund 205,599
Enterprise Fund:Computer Service Fund 135,676
The deficit of $849,395 in the Grants Special Revenue Fund and $205,599 in the SAFER Grant Special Revenue Fund are the results of expenditures incurred prior to reimbursement from grantors. The deficits will be eliminated through future grant revenues. The deficit in Computer Service Fund is a result of additional expenses incurred for the development of new software.

City of West Covina Notes to Basic Financial Statements For the Year Ended June 30, 2016
-73-
11) RETIREMENT PLAN - CALPERS
A) General Information about the Pension Plans
Plan Descriptions The Plans consist of Miscellaneous and Safety agent multiple-employer defined benefit pension plans administered by the California Public Employees’ Retirement System (CalPERS). A full description of the pension plan regarding number of employees covered, benefit provisions, assumptions (for funding, but not accounting purposes), and membership information are listed in the plan’s June 30, 2014, Annual Actuarial Valuation Report (funding valuation). Details of the benefits provided can be obtained in Appendix B of the actuarial valuation report. This report and CalPERS’ audited financial statements are publicly available reports that can be obtained at CalPERS’ website, at www.calpers.ca.gov. Benefits Provided CalPERS provides service retirement and disability benefits, annual cost of living adjustments and death benefits to plan members, who must be public employees and beneficiaries. Benefits are based on years of credited service, equal to one year of full time employment. Members with five years of total service are eligible to retire at age 50 with statutorily reduced benefits. All members are eligible for non-duty disability benefits after five years of service. The death benefit is one of the following: the Basic Death Benefit, the 1957 Survivor Benefit, or the Optional Settlement 2W Death Benefit. The cost of living adjustments for each plan are applied as specified by the Public Employees’ Retirement Law. The Plans operate under the provisions of the California Public Employees’ Retirement Law (PERL), the California Public Employees’ Pension Reform Act of 2013 (PEPRA), and the regulations, procedures and policies adopted by the CalPERS Board of Administration. The Plan’s authority to establish and amend the benefit terms are set by the PERL and PEPRA, and may be amended by the California state legislature and in some cases require approval by the CalPERS Board.

City of West Covina Notes to Basic Financial Statements For the Year Ended June 30, 2016
-74-
11) RETIREMENT PLAN - CALPERS, (continued)
A) General Information about the Pension Plans, (continued)
Benefits Provided, (continued) The Plans’ provisions and benefits in effect at June 30, 2016, are summarized as follows:
Prior to After Prior to On or After Hire date January 1, 2011 January 1, 2011 January 1, 2013 January 1, 2013Benefit formula 2.0% @ 55 2.5% @ 55 2.0% @ 60 2.0% @ 62Benefit vesting schedule 5 years of service 5 years of service 5 years of service 5 years of serviceBenefit payments monthly for life monthly for life monthly for life monthly for lifeRetirement age 50 - 63 50 - 55 50 - 63 52 - 67Monthly benefits, as a % of eligible compensation 1.426% to 2.418% 2.0% to 2.5% 1.092% to 2.418% 1.0% to 2.5%Required employee contribution rates 7% or 8% 7% or 8% 7% or 8% 6.25%Required employer contribution rates 19.878% 19.878% 19.878% 19.878%
Miscellaneous Plan
Prior to Prior to On or After Hire date July 1, 2012 January 1, 2013 January 1, 2013Benefit formula 3.0% @ 50 3.0% @ 55 2.7% @ 57Benefit vesting schedule 5 years of service 5 years of service 5 years of serviceBenefit payments monthly for life monthly for life monthly for lifeRetirement age 50 & Up 50 - 55 50 - 57Monthly benefits, as a % of eligible compensation 3.0% 2.4% to 3.0% 2.0% to 2.7%Required employee contribution rates 12.00% 12.00% 12.00%Required employer contribution rates 48.364% 48.364% 48.364%
Safety Plan
Employees Covered At June 30, 2014, (valuation date), the following employees were covered by the benefit terms:
Miscellaneous Safety
Inactive employees or beneficiariescurrently receiving benefits 357 314
Inactive employees entitled to butnot yet receiving benefits 232 61
Active employees 167 157
Total 756 532

City of West Covina Notes to Basic Financial Statements For the Year Ended June 30, 2016
-75-
11) RETIREMENT PLAN - CALPERS, (continued) A) General Information about the Pension Plans, (continued)
Contributions Section 20814(c) of the California Public Employees’ Retirement Law (PERL) requires that the employer contribution rates for all public employers be determined on an annual basis by the actuary and shall be effective on the July 1 following notice of a change in the rate. The total plan contributions are determined through CalPERS’ annual actuarial valuation process. The actuarially determined rate is the estimated amount necessary to finance the costs of benefits earned by employees during the year, with an additional amount to finance any unfunded accrued liability. The employer is required to contribute the difference between the actuarially determined rate and the contribution rate of employees. Employer contribution rates may change if plan contracts are amended. Employer Contributions to the Miscellaneous and Safety Plan’s for the fiscal year ended June 30, 2016, were $1,871,891 and $8,387,165, respectively.
B) Net Pension Liability The City’s net pension liability for the Plan is measured as the total pension liability, less the pension plan’s fiduciary net position. The net pension liability of the Plan is measured as of June 30, 2015, using an annual actuarial valuation as of June 30, 2014, rolled forward to June 30, 2015, using standard update procedures. A summary of principal assumptions and methods used to determine the net pension liability is as follows.

City of West Covina Notes to Basic Financial Statements For the Year Ended June 30, 2016
-76-
11) RETIREMENT PLAN - CALPERS, (continued)
B) Net Pension Liability, (continued)
Actuarial Methods and Assumptions Used to Determine Total Pension Liability Valuation Date June 30, 2014Measurement Date June 30, 2015Actuarial Cost Method Entry Age NormalAsset Valuation Method Market Value of
AssetsActuarial Assumptions:
Discount RateInflation 2.75%Salary Increases (1) 3.3% - 14.2%
Investment Rate of Return (2)
Mortality Rate Table (3)
Post Retirement Benefit Increase
(1) Annual increases vary by category, entry age, and duration of service
(2) Net of pension plan investment and administrative expenses; includes inflation
Deriverd using CALPERS'membership data for all FundsContract COLA up to 2.75% untilpurchasing power protectionallowance floor on purchasingpower applies, 2.75% thereafter
(3) The mortality table used was developed based on CalPERS’ specific data. The table includes 20 years of mortality improvements using Society of Actuaries Scale BB. For more details on this table, please refer to the 2014 experience study report.
7.65%. For measurement dateJune 30, 2014, 7.50%.
7.65%. For measurement dateJune 30, 2014, 7.50%.
All other actuarial assumptions used in the June 30, 2014, valuation were based on the results of an actuarial experience study for the period from 1997 to 2011, including updates to salary increase, mortality and retirement rates. The Experience Study report can be obtained at CalPERS’ website, at www.calpers.ca.gov.

City of West Covina Notes to Basic Financial Statements For the Year Ended June 30, 2016
-77-
11) RETIREMENT PLAN – CALPERS, (continued)
B) Net Pension Liability, (continued) Discount Rate The discount rate used to measure the total pension liability for measurement date June 30, 2015, was 7.65 percent. The discount rate used to measure the total pension liability in the previous year was 7.50 percent. To determine whether the municipal bond rate should be used in the calculation of a discount rate for each plan, CalPERS stress tested plans that would most likely result in a discount rate that would be different from the actuarially assumed discount rate. Based on the testing of the plan, the test revealed the assets would not run out. Therefore, the current 7.65 percent discount rate is appropriate and the use of the municipal bond rate calculation is not deemed necessary. The long-term expected discount rate of 7.65 percent is applied to all plans in the Public Employees Retirement Fund. The stress test results are presented in a detailed report called “GASB Crossover Testing Report” that can be obtained at CalPERS’ website, at www.calpers.ca.gov.
The long-term expected rate of return on pension plan investments was determined using a building-block method in which best-estimate ranges of expected future real rates of return (expected returns, net of pension plan investment expense and inflation) are developed for each major asset class.
In determining the long-term expected rate of return, CalPERS took into account both short-term and long-term market return expectations as well as the expected pension fund (Public Employees’ Retirement Fund) cash flows. Such cash flows were developed assuming that both members and employers will make their required contributions on time and as scheduled in all future years. Using historical returns of all the funds’ asset classes, expected compound (geometric) returns were calculated over the short-term (first 10 years) and the long-term (11-60 years) using a building-block approach. Using the expected nominal returns for both short-term and long-term, the present value of benefits was calculated for each fund. The expected rate of return was set by calculating the single equivalent expected return that arrived at the same present value of benefits for cash flows as the one calculated using both short-term and long-term returns. The expected rate of return was then set equivalent to the single equivalent rate calculated above and rounded down to the nearest one quarter of one percent.

City of West Covina Notes to Basic Financial Statements For the Year Ended June 30, 2016
-78-
11) RETIREMENT PLAN - CALPERS, (continued)
B) Net Pension Liability, (continued)
Discount Rate, (continued) The following table reflects long-term expected real rate of return by asset class. The rate of return was calculated using the capital market assumptions applied to determine the discount rate and asset allocation. The target allocation shown was adopted by the CalPERS Board effective on July 1, 2014.
Asset ClassCurrent Target
Allocation
Real Return
Years 1 - 101Real Return
Years 11+2
Global Equity 51.0% 5.25% 5.71%Global Fixed Income 19.0% 0.99% 2.43%Inflation Sensitive 6.0% 0.45% 3.36%Private Equity 10.0% 6.83% 6.95%Real Estate 10.0% 4.50% 5.13%Infrastructure and Forestland 2.0% 4.50% 5.09%Liquidity 2.0% (0.55%) (1.05%)
Total 100%
1 An expected inflation of 2.5% used for this period2 An expected inflation of 3.0% used for this period
Pension Plan Fiduciary Net Position Information about the pension plan’s assets, deferred outflows of resources, liabilities, deferred inflows of resources, and fiduciary net position are presented in CalPERS’ audited financial statements, which are publicly available reports that can be obtained at CalPERS’ website, at www.calpers.ca.gov. The plan’s fiduciary net position and additions to/deductions from the plan’s fiduciary net position have been determined on the same basis used by the pension plan, which is the economic resources measurement focus and the accrual basis of accounting. Benefits and refunds are recognized when due and payable in accordance with the terms of the plan. Investments are reported at fair value. The plan fiduciary net position disclosed in the GASB 68 accounting valuation report may differ from the plan assets reported in the funding actuarial valuation report due to several reasons. First, for the accounting valuations, CalPERS must keep items such as deficiency reserves, fiduciary self-insurance and Other Post-Employment Benefits (OPEB) expense included as assets. These amounts are excluded for rate setting purposes in the funding actuarial valuation. In addition, differences may result from early Comprehensive Annual Financial Report closing and final reconciled reserves.

City of West Covina Notes to Basic Financial Statements For the Year Ended June 30, 2016
-79-
11) RETIREMENT PLAN - CALPERS, (continued)
C) Changes in the Net Pension Liability and Proportionate Share of Net Pension Liability
The following table shows the changes in net pension liability recognized over the measurement period. Miscellaneous Plan:
Increase (Decrease)
Total Pension Liability
(a)
Plan Fiduciary Net Position
(b)
Net Pension Liability/(Asset)
(c) = (a) - (b)Balance at: 6/30/2014 (VD)1 138,590,350$ 112,785,681$ 25,804,669$ Changes Recognized for theMeasurement Period:• Service Cost 1,454,757 - 1,454,757 • Interest on the Total
Pension Liability 10,180,561 - 10,180,561 • Changes of Benefit Terms - - - • Differences between
Expected and ActualExperience (134,455) - (134,455)
• Changes of Assumptions (2,336,836) - (2,336,836) • Plan to Plan Resource
Movement - 307 (307) • Contributions from the
Employer - 1,507,469 (1,507,469) • Contributions from
Employees - 714,712 (714,712) • Net Investment Income2 - 2,500,142 (2,500,142) • Benefit Payments,
including Refunds ofEmployee Contributions (7,534,397) (7,534,397) -
• Administrative Expense - (123,626) 123,626 Net Changes during 2014-15 1,629,630 (2,935,393) 4,565,023 Balance at: 6/30/2015 (MD)1 140,219,980$ 109,850,288$ 30,369,692$ Valuation Date (VD), Measurement Date (MD). 1 The fiduciary net position includes receivables for employee service buybacks, deficiency reserves, fiduciary self-insurance and OPEB expense. As described in the previous section of this note, this may differ from the plan assets reported in the funding actuarial valuation report. 2 Net of administrative expenses.

City of West Covina Notes to Basic Financial Statements For the Year Ended June 30, 2016
-80-
11) RETIREMENT PLAN - CALPERS, (continued)
C) Changes in the Net Pension Liability and Proportionate Share of Net Pension Liability, (continued)
Safety Plan:
Increase (Decrease)Total Pension
Liability(a)
Plan Fiduciary Net Position
(b)
Net Pension Liability/(Asset)
(c) = (a) - (b)Balance at: 6/30/2014 (VD)1 329,505,806$ 229,998,231$ 99,507,575$ Changes Recognized for theMeasurement Period:• Service Cost 4,604,800 - 4,604,800 • Interest on the Total
Pension Liability 24,117,128 - 24,117,128 • Changes of Benefit Terms - - - • Differences between
Expected and ActualExperience (1,760,971) - (1,760,971)
• Changes of Assumptions (5,858,071) - (5,858,071) • Plan to Plan Resource
Movement - 10,338 (10,338) • Contributions from the
Employer - 7,339,064 (7,339,064) • Contributions from
Employees - 1,628,630 (1,628,630) • Net Investment Income2 - 5,057,426 (5,057,426) • Benefit Payments,
including Refunds ofEmployee Contributions (17,865,208) (17,865,208) -
• Administrative Expense - (254,287) 254,287 Net Changes during 2014-15 3,237,678 (4,084,037) 7,321,715 Balance at: 6/30/2015 (MD)1 332,743,484$ 225,914,194$ 106,829,290$ Valuation Date (VD), Measurement Date (MD). 1 The fiduciary net position includes receivables for employee service buybacks, deficiency reserves, fiduciary self-insurance and OPEB expense. As described in the previous section of this note, this may differ from the plan assets reported in the funding actuarial valuation report. 2 Net of administrative expenses.

City of West Covina Notes to Basic Financial Statements For the Year Ended June 30, 2016
-81-
11) RETIREMENT PLAN - CALPERS, (continued)
C) Changes in the Net Pension Liability and Proportionate Share of Net Pension Liability, (continued)
Sensitivity of the Net Pension Liability to Changes in the Discount Rate The following presents the net pension liability of the Miscellaneous and Safety Plan’s as of the measurement date, calculated using the discount rate of 7.65 percent, as well as what the net pension liability would be if it were calculated using a discount rate that is 1 percentage-point lower (6.65 percent) or 1 percentage-point higher (8.65 percent) than the current rate:
Discount Rate - 1%(6.65%)
Current DiscountRate (7.65%)
Discount Rate + 1%(8.65%)
Misc Plan's Net Pension Liability/(Asset) 47,775,063$ 30,369,692$ 15,896,832$
Sefety Plan's Net Pension Liability/(Asset) 150,853,079$ 106,829,290$ 70,632,399$
Subsequent Events There were no subsequent events that would materially affect the results presented in this disclosure. Recognition of Gains and Losses Under GASB 68, gains and losses related to changes in total pension liability and fiduciary net position are recognized in pension expense systematically over time.
The first amortized amounts are recognized in pension expense for the year the gain or loss occurs. The remaining amounts are categorized as deferred outflows and deferred inflows of resources related to pensions and are to be recognized in future pension expense.
The amortization period differs depending on the source of the gain or loss:
Difference between projected and actual earnings
5 year straight-line amortization
All other amounts Straight-line amortization over the average expected remaining service lives of all members that are provided with benefits (active, inactive and retired) as of the beginning of the measurement period
The expected average remaining service lifetime (EARSL) is calculated by dividing the total future service years by the total number of plan participants (active, inactive, and retired).
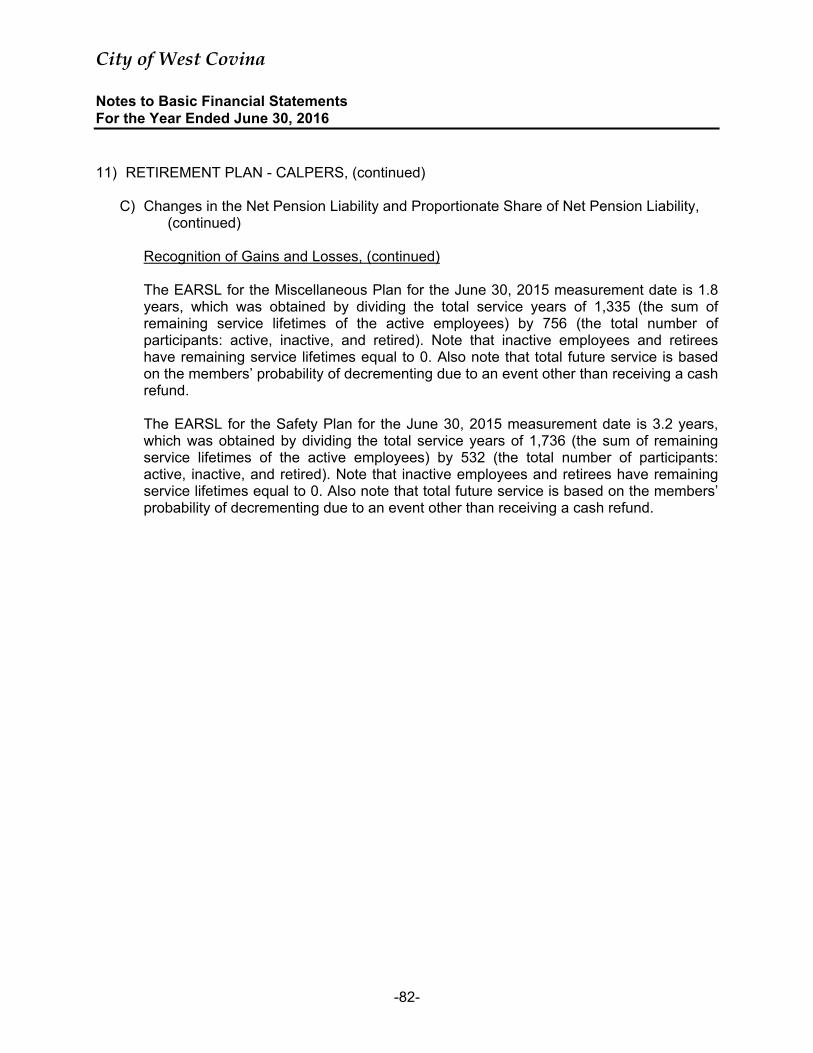
City of West Covina Notes to Basic Financial Statements For the Year Ended June 30, 2016
-82-
11) RETIREMENT PLAN - CALPERS, (continued)
C) Changes in the Net Pension Liability and Proportionate Share of Net Pension Liability, (continued)
Recognition of Gains and Losses, (continued)
The EARSL for the Miscellaneous Plan for the June 30, 2015 measurement date is 1.8 years, which was obtained by dividing the total service years of 1,335 (the sum of remaining service lifetimes of the active employees) by 756 (the total number of participants: active, inactive, and retired). Note that inactive employees and retirees have remaining service lifetimes equal to 0. Also note that total future service is based on the members’ probability of decrementing due to an event other than receiving a cash refund.
The EARSL for the Safety Plan for the June 30, 2015 measurement date is 3.2 years, which was obtained by dividing the total service years of 1,736 (the sum of remaining service lifetimes of the active employees) by 532 (the total number of participants: active, inactive, and retired). Note that inactive employees and retirees have remaining service lifetimes equal to 0. Also note that total future service is based on the members’ probability of decrementing due to an event other than receiving a cash refund.

City of West Covina Notes to Basic Financial Statements For the Year Ended June 30, 2016
-83-
11) RETIREMENT PLAN - CALPERS, (continued)
D) Pension Expense and Deferred Outflows and Deferred Inflows of Resources Related to Pensions As of the start of the measurement period (July 1, 2014), the net pension liability for Miscellaneous and Safety Plan was $25,804,669 and $99,507,575, respectively. For the measurement period ending June 30, 2015 (the measurement date), the City incurred a pension expense/ (income) of $473,712 for the Miscellaneous Plan and $6,225,323 for the Safety Plan. A complete breakdown of the pension expense for Misc. and Safety Plan is as follows: Miscellaneous Plan
Description Amount
Service Cost 1,454,757$ Interest on the Total Pension Liability 10,180,561 Changes of Benefit Terms - Recognized Differences between Expected and Actual Experience (74,697) Plan to Plan Resource Movement (307) Recognized Changes of Assumptions (1,298,242) Employee Contributions (714,712) Projected Earnings on Pension Plan Investments (8,404,566) Recognized Differences between Projected and
Actual Earnings on Plan Investments (792,708) Administrative Expense 123,626
Total Pension Expense/(Income) 473,712$

City of West Covina Notes to Basic Financial Statements For the Year Ended June 30, 2016
-84-
11) RETIREMENT PLAN - CALPERS, (continued)
D) Pension Expense and Deferred Outflows and Deferred Inflows of Resources Related to Pensions, (continued) Safety Plan
Description Amount
Service Cost 4,604,800$ Interest on the Total Pension Liability 24,117,128 Changes of Benefit Terms - Recognized Differences between Expected and Actual Experience (550,303) Plan to Plan Resource Movement (10,338) Recognized Changes of Assumptions (1,830,647) Employee Contributions (1,628,630) Projected Earnings on Pension Plan Investments (17,179,134) Recognized Differences between Projected and
Actual Earnings on Plan Investments (1,551,840) Administrative Expense 254,287
Total Pension Expense/(Income) 6,225,323$

City of West Covina Notes to Basic Financial Statements For the Year Ended June 30, 2016
-85-
11) RETIREMENT PLAN - CALPERS, (continued)
D) Pension Expense and Deferred Outflows and Deferred Inflows of Resources Related to Pensions, (continued) As of June 30, 2016, the City has deferred outflows and deferred inflows of resources related to pensions as follows:
Deferred Outflows of Resources
Deferred Inflows of
Resources
Deferred Outflows of Resources
Deferred Inflows of Resources
Differences between Expected andActual Experience -$ (59,758)$ -$ (1,210,668)$
Changes of Assumptions - (1,038,594) - (4,027,424) Net Difference between Projected and Actual
Earnings on Pension Plan Investments - (1,197,241) - (2,231,179) Change in Employer's Proportion - - - - Difference in Actual vs Projected Contributions 15,771 - 5,155 - Pension Contributions Subsequent to
Measurement Date 1,871,891 - 8,387,165 - 1,887,662$ (2,295,593)$ 8,392,320$ (7,469,271)$
SafetyMiscellaneous
These amounts above are net of outflows and inflow recognized in the 2014-15 measurement period expense. The $1,871,891 and $8,387,165 reported as deferred outflows of resources related to contributions subsequent to the measurement date will be recognized as a reduction of the net pension liability in the year ended June 30, 2017. Other amounts reported as deferred outflows and deferred inflows of resources related to pensions will be recognized in future pension expense as follows:
Measurement Period Ended
June 30, Miscellaneous Safety2016 (1,875,289)$ (3,930,447)$ 2017 (792,708) (3,930,447) 2018 (792,709) (2,027,562) 2019 1,180,884 2,424,340
Thereafter - -
Deferred Outflows/(Inflows) of Resources, Net
E) Payable to the Pension Plan At June 30, 2016, the City had no outstanding amount of contributions to the pension plan required for the year ended June 30, 2016.

City of West Covina Notes to Basic Financial Statements For the Year Ended June 30, 2016
-86-
12) PUBLIC AGENCY RETIREMENT SYSTEM (PARS)
A) EPMC Replacement Supplemental Retirement Plan General Information about the Pension Plan Plan Description and Benefits Effective November 1, 2007, the City established a single-employer defined benefit plan to supplement the current CalPERS retirement benefits that is to be administered for the City by the Public Agency Retirement System (PARS), a third-party administrator. The plan meets the requirements of a pension trust under California Government Code. Phase II Systems is the PARS Trust Administrator. The plan does not issue separate financial reports. The EPMC Replacement Plan was established to replace a long-standing benefit for city employees no longer allowed by CalPERS. The plan provides for a benefit in an amount equal to the member's years of service, times the member's final pay, times the CalPERS age factor, times .70% for miscellaneous employees (times .89% for safety employees). At the time of retirement, employees will make an election to receive either a lump sum payment or receive ongoing stipends over their lifetime. Employees shall be eligible to receive benefits under this plan if he or she meets all of the following requirements under one of the following tiers Tier 1 • Full time miscellaneous employees on or after July 1, 2004 but hired prior to
July 1, 2011. • Classified as a department head or city council, employee represented by the
Confidential Employees’ Association, General Employees’ Association, West Covina Maintenance and Crafts Employees’ Association, Mid-Management Employees’ Association and Non-Sworn Support Employees’ Association.
• Has had compensable earnings under CalPERS impacted by CalPERS regulation, thereby causing a reduction in CalPERS benefits.
• At least fifty (50) years of age. • Has completed at least one year of employment. • Has terminated employment with the City and concurrently retired under CalPERS
under a regular service retirement, and remains in retired status under CalPERS. • Has applied for benefits under this plan.
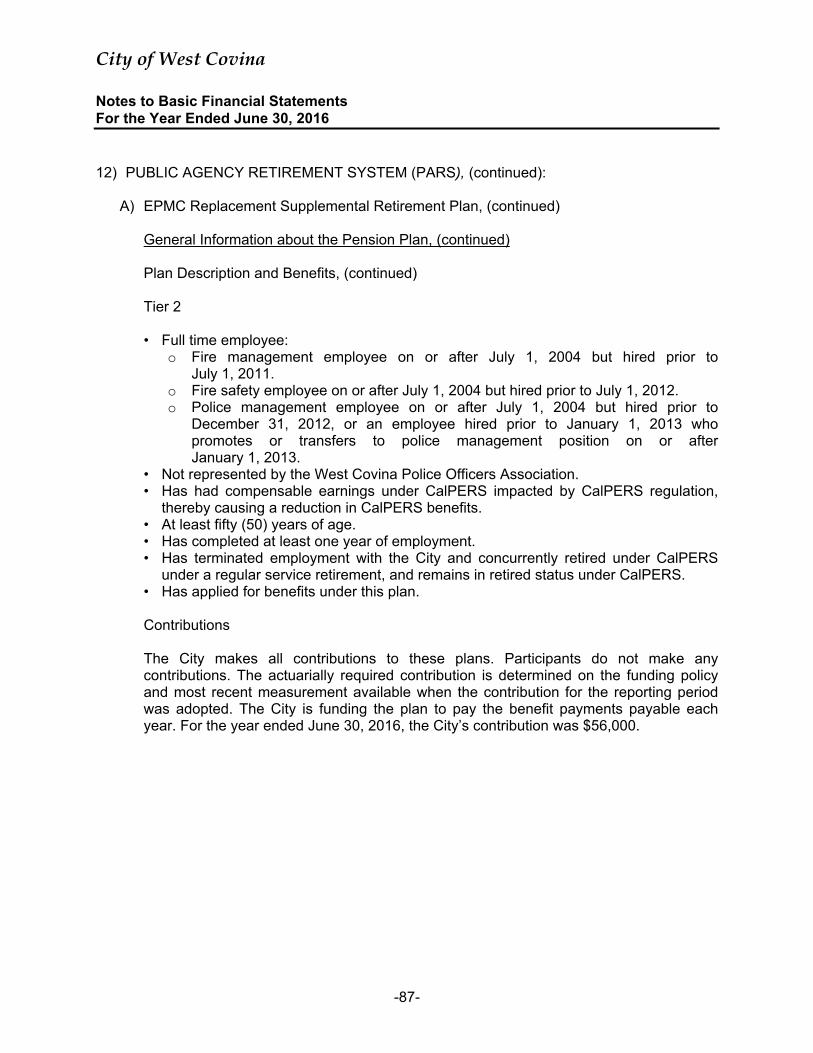
City of West Covina Notes to Basic Financial Statements For the Year Ended June 30, 2016
-87-
12) PUBLIC AGENCY RETIREMENT SYSTEM (PARS), (continued): A) EPMC Replacement Supplemental Retirement Plan, (continued)
General Information about the Pension Plan, (continued) Plan Description and Benefits, (continued) Tier 2 • Full time employee:
o Fire management employee on or after July 1, 2004 but hired prior to July 1, 2011.
o Fire safety employee on or after July 1, 2004 but hired prior to July 1, 2012. o Police management employee on or after July 1, 2004 but hired prior to
December 31, 2012, or an employee hired prior to January 1, 2013 who promotes or transfers to police management position on or after January 1, 2013.
• Not represented by the West Covina Police Officers Association. • Has had compensable earnings under CalPERS impacted by CalPERS regulation,
thereby causing a reduction in CalPERS benefits. • At least fifty (50) years of age. • Has completed at least one year of employment. • Has terminated employment with the City and concurrently retired under CalPERS
under a regular service retirement, and remains in retired status under CalPERS. • Has applied for benefits under this plan. Contributions The City makes all contributions to these plans. Participants do not make any contributions. The actuarially required contribution is determined on the funding policy and most recent measurement available when the contribution for the reporting period was adopted. The City is funding the plan to pay the benefit payments payable each year. For the year ended June 30, 2016, the City’s contribution was $56,000.
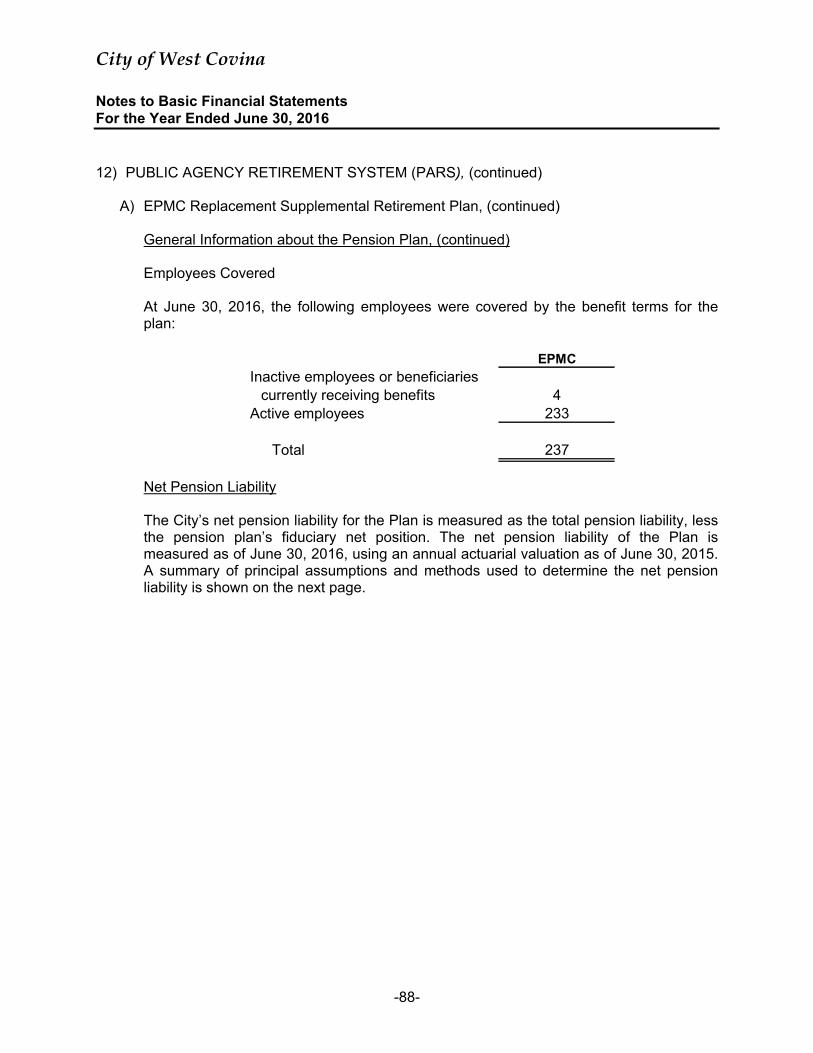
City of West Covina Notes to Basic Financial Statements For the Year Ended June 30, 2016
-88-
12) PUBLIC AGENCY RETIREMENT SYSTEM (PARS), (continued) A) EPMC Replacement Supplemental Retirement Plan, (continued)
General Information about the Pension Plan, (continued) Employees Covered At June 30, 2016, the following employees were covered by the benefit terms for the plan:
EPMCInactive employees or beneficiaries
currently receiving benefits 4Active employees 233
Total 237
Net Pension Liability The City’s net pension liability for the Plan is measured as the total pension liability, less the pension plan’s fiduciary net position. The net pension liability of the Plan is measured as of June 30, 2016, using an annual actuarial valuation as of June 30, 2015. A summary of principal assumptions and methods used to determine the net pension liability is shown on the next page.

City of West Covina Notes to Basic Financial Statements For the Year Ended June 30, 2016
-89-
12) PUBLIC AGENCY RETIREMENT SYSTEM (PARS), (continued) A) EPMC Replacement Supplemental Retirement Plan, (continued)
Net Pension Liability, (continued) Actuarial Assumptions The total pension liability in the June 30, 2015, actuarial valuation was determined using the following actuarial assumptions:
EPMC
Valuation Date June 30, 2015Measurement Date June 30, 2015Actuarial Cost Method Entry Age NormalActuarial Assumptions:
Discount Rate 3.50% (1)Inflation 3.00%Salary Increases (1) 3.25%Investment Rate of Return 6.25% (2)Mortality Rate Table
(1) Long term expected return on plan assets (gross of administrative expenses).(2) Plan assets currently invested in PARS diversified moderate portfolio.(3) The probabilities of mortality are derived using CalPERS' 1997-2011 experiencestudy.
(3)
Discount Rate GASB 67 and 68 generally require that a blended discount rate be used to measure the Total Pension Liability (the Actuarial Accrued Liability calculated using the Individual Entry Age Normal Cost Method). The long-term expected return on plan investments may be used to discount liabilities to the extent that the plan’s Fiduciary Net Position (fair market value of assets) is projected to cover benefit payments and administrative expenses. A 20-year high quality (AA/Aa or higher) municipal bond rate must be used for periods where the Fiduciary Net Position is not projected to cover benefit payments and administrative expenses. Determining the discount rate under GASB 67 and 68 will often require that the actuary perform complex projections of future benefit payments and asset values.

City of West Covina Notes to Basic Financial Statements For the Year Ended June 30, 2016
-90-
12) PUBLIC AGENCY RETIREMENT SYSTEM (PARS), (continued) A) EPMC Replacement Supplemental Retirement Plan, (continued)
Net Pension Liability, (continued) Discount Rate, (continued) The following circumstances were included in the evaluation of sufficiency for the City:
• Annual contributions of 0.7% of payroll (closed group basis) are assumed (beginning with 2015/16).
• Benefit payments are annually withdrawn from the Trust until assets are exhausted and then benefit payments made directly by the City.
• All cash flows are assumed to occur on average halfway through the year. • The long-term expected rate of return on pension plan investments is 6.25%. • The actuarial assumptions do not change. • GASB 67 and 68 specify that the projections regarding future solvency assume
that plan assets earn the assumed rate of return and there are no future changes in the plan provisions or actuarial methods and assumptions, which means that the projections would not reflect any adverse future experience which might impact the plan’s funded position.
Based on these circumstances, it is the actuary’s opinion that the depletion date outlined in GASB 67 and 68 outlined in GASB 67 and 68 is fiscal year 2027/28. Therefore, benefit payments before 2027/28 are discounted at the long-term expected rate of return on pension plan investments (6.25%), and payments after that date at the Bond Buyer 20-Bond Go Index as of the June 30, 2014, measurement date (4.29%). The discount rate used (4.8%) represents the single equivalent rate of return, as described under GASB 68 (paragraph 31). The best-estimate range for the long-term expected rate of return is determined by adding expected inflation to expected long-term real returns and reflecting expected volatility and correlation.
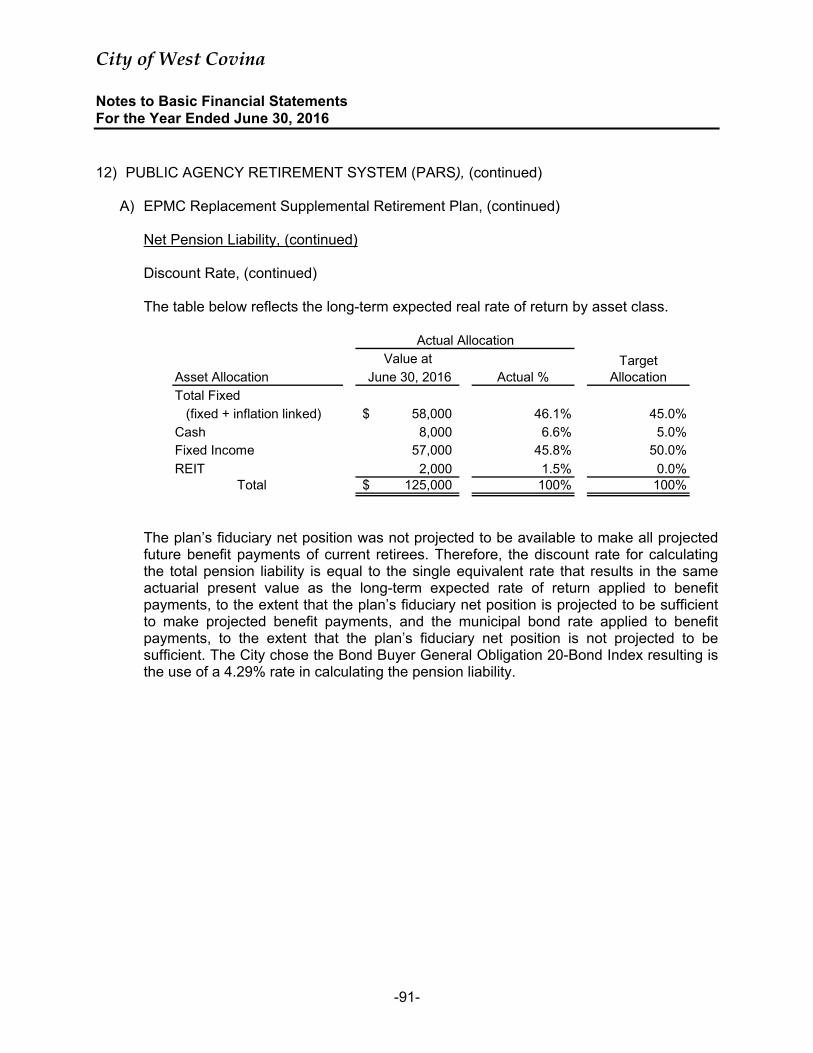
City of West Covina Notes to Basic Financial Statements For the Year Ended June 30, 2016
-91-
12) PUBLIC AGENCY RETIREMENT SYSTEM (PARS), (continued) A) EPMC Replacement Supplemental Retirement Plan, (continued)
Net Pension Liability, (continued) Discount Rate, (continued) The table below reflects the long-term expected real rate of return by asset class.
Value atAsset Allocation June 30, 2016Total Fixed
(fixed + inflation linked) 58,000$ 46.1% 45.0%Cash 8,000 6.6% 5.0%Fixed Income 57,000 45.8% 50.0%
REIT 2,000 1.5% 0.0% Total 125,000$ 100% 100%
Target Allocation
Actual Allocation
Actual %
The plan’s fiduciary net position was not projected to be available to make all projected future benefit payments of current retirees. Therefore, the discount rate for calculating the total pension liability is equal to the single equivalent rate that results in the same actuarial present value as the long-term expected rate of return applied to benefit payments, to the extent that the plan’s fiduciary net position is projected to be sufficient to make projected benefit payments, and the municipal bond rate applied to benefit payments, to the extent that the plan’s fiduciary net position is not projected to be sufficient. The City chose the Bond Buyer General Obligation 20-Bond Index resulting is the use of a 4.29% rate in calculating the pension liability.

City of West Covina Notes to Basic Financial Statements For the Year Ended June 30, 2016
-92-
12) PUBLIC AGENCY RETIREMENT SYSTEM (PARS), (continued) A) EPMC Replacement Supplemental Retirement Plan, (continued)
Changes in the Net Pension Liability The changes in the net pension liability for the Plan are as follows:
Increase (Decrease)
Total Pension Liability
(a)
Plan Fiduciary Net Position
(b)
Net Pension Liability
(c) = (a) - (b)Balances as of June 30, 2014 763,000$ 119,000$ 644,000$ Changes for the year:• Service Cost 36,000 - 36,000 • Interest 28,000 - 28,000 • Difference between actual and expected experience (72,000) - (72,000) • Assumptions Changes 200,000 - 200,000 • Contributions- employer - 56,000 (56,000) • Contributions- employee - - - • Net Investment Income - 3,000 (3,000) • Benefit payements and refunds (9,000) (9,000) - • Administrative Expenses - (7,000) 7,000 Net Changes 183,000 43,000 140,000 Balance as of June 30, 2015 946,000$ 162,000$ 784,000$

City of West Covina Notes to Basic Financial Statements For the Year Ended June 30, 2016
-93-
12) PUBLIC AGENCY RETIREMENT SYSTEM (PARS), (continued) A) EPMC Replacement Supplemental Retirement Plan, (continued)
Changes in the Net Pension Liability, (continued) Sensitivity of the Net Pension Liability to Changes in the Discount Rate The following presents the net pension liability (asset) of the City for the Plan, calculated using the discount rate for the Plan, as well as what the City’s net pension liability would be if it were calculated using a discount rate that is 1-percentage point lower or 1-percentage point higher than the current rate:
Discount Rate - 1%
(2.5%)Current Discount Rate
(3.5%)Discount Rate + 1%
(4.5%)Net Pension Liability 892,000$ 784,000$ 696,000$ Pension Expenses and Deferred Outflows/Inflows of Resources Related to Pensions: For the year ended June 30, 2016, the City recognized pension expense of $82,000. At June 30, 2016, the City reported deferred outflows of resources and deferred inflows of resources related to pensions from the following sources:
Deferred Outflows of Resources
Deferred Inflows of Resources
Differences between Expected andActual Experience -$ (62,000)$
Changes of Assumptions 173,000 - Net Difference between Projected and
Actual Earnings on Pension Plan - (1,000) Employer Contributions Subsequent to
Measurement Date 56,000 - Total 229,000$ (63,000)$

City of West Covina Notes to Basic Financial Statements For the Year Ended June 30, 2016
-94-
12) PUBLIC AGENCY RETIREMENT SYSTEM (PARS), (continued) A) EPMC Replacement Supplemental Retirement Plan, (continued)
Pension Expenses and Deferred Outflows/Inflows of Resources Related to Pensions, (continued): The $56,000 reported as deferred outflows of resources related to contributions subsequent to the measurement date will be recognized as a reduction of the net pension liability in the year ending June 30, 2016. Other amounts reported as deferred inflows of resources related to pensions will be recognized as pension expense as follows:
Measurement Period Ended
Deferred Outflows/(Inflows) of Resources, Net
June 30, PARS 2017 16,000$ 2018 16,000 2019 16,000 2020 17,000
Thereafter 45,000 Payable to the Pension Plan At June 30, 2016, the City had no outstanding amount of contributions to the pension plan required for the year ended June 30, 2016.
B) Supplemental Retirement Plan for Executive Staff and City Council General Information about the Pension Plan Plan Description and Benefits Effective November 1, 2007, the City established a single-employer defined benefit plan to supplement the current CalPERS retirement benefits that is to be administered for the City by with the Public Agency Retirement System (PARS), a third-party administrator. The plan meets the requirements of a pension trust under California Government Code. Phase II Systems is the PARS Trust Administrator. The plan does not issue separate financial reports and is closed to new hires.

City of West Covina Notes to Basic Financial Statements For the Year Ended June 30, 2016
-95-
12) PUBLIC AGENCY RETIREMENT SYSTEM (PARS), (continued) B) Supplemental Retirement Plan for Executive Staff and City Council, (continued)
General Information about the Pension Plan, (continued) Plan Description and Benefits, (continued) This single-employer defined benefit pension plan is separated into three tiers. Tier 1 (full-time non-safety Department Head and the City Manager) and Tier 2 (City Council) provides an additional retirement amount to miscellaneous department heads, City Manager and City Council in an amount equal to the amount of $823 per month. This benefit amount increases each year by CPI, up to 2%. In order to be eligible for this benefit, participants must have five years of service with the City and must retire into PERS from the City. Tier 3 (City Manager) provides an increased retirement benefit to a former City Manager consistent with the terms of his contract. It will convert the retirement formula for all years of prior CalPERS service at non-West Covina agencies to the CalPERS 2.5% @ 55 formula currently in place with the City of West Covina. Contributions All three tiers are combined for funding purposes in this plan. The City makes all contributions to these plans. Participants do not make any contributions. The actuarially required contribution is determined on a pay as you go funding policy and most recent measurement available when the contribution for the reporting period was adopted. The City is funding the plan to pay the benefit payments payable each year. For the year ended June 30, 2016, the City’s contribution was $78,000. Employees Covered At June 30, 2016, the following employees were covered by the benefit terms for the plan:
MiscellaneousInactive employees or beneficiaries
currently receiving benefits 6Active employees 9
Total 15

City of West Covina Notes to Basic Financial Statements For the Year Ended June 30, 2016
-96-
12) PUBLIC AGENCY RETIREMENT SYSTEM (PARS), (continued) B) Supplemental Retirement Plan for Executive Staff and City Council, (continued)
Net Pension Liability The City’s net pension liability for the Plan is measured as the total pension liability, less the pension plan’s fiduciary net position. The net pension liability of the Plan is measured as of June 30, 2015, using an annual actuarial valuation as of June 30, 2015. A summary of principal assumptions and methods used to determine the net pension liability is shown below. Actuarial Assumptions The total pension liability in the June 30, 2015, actuarial valuation was determined using the following actuarial assumptions:
MiscellaneousValuation Date June 30, 2015Measurement Date June 30, 2015Actuarial Cost Method Entry Age NormalActuarial Assumptions:
Discount Rate 4.70% (1)Inflation 3.00%Salary Increases (1) 3.25%Investment Rate of Return 6.25% (2)Mortality Rate Table
(1) Long term expected return on plan assets (gross of administrative expenses).(2) Plan assets currently invested in PARS diversified moderate portfolio.(3) The probabilities of mortality are derived using CalPERS' 1997-2011 experiencestudy.
(3)

City of West Covina Notes to Basic Financial Statements For the Year Ended June 30, 2016
-97-
12) PUBLIC AGENCY RETIREMENT SYSTEM (PARS), (continued) B) Supplemental Retirement Plan for Executive Staff and City Council, (continued)
Net Pension Liability, (continued) Discount Rate GASB 67 and 68 generally require that a blended discount rate be used to measure the Total Pension Liability (the Actuarial Accrued Liability calculated using the Individual Entry Age Normal Cost Method). The long-term expected return on plan investments may be used to discount liabilities to the extent that the plan’s Fiduciary Net Position (fair market value of assets) is projected to cover benefit payments and administrative expenses. A 20-year high quality (AA/Aa or higher) municipal bond rate must be used for periods where the Fiduciary Net Position is not projected to cover benefit payments and administrative expenses. Determining the discount rate under GASB 67 and 68 will often require that the actuary perform complex projections of future benefit payments and asset values. GASB 67 (paragraph 43) and 68 (paragraph 29) do allow for alternative evaluations of projected solvency, if such evaluation can reliably be made. GASB does not contemplate a specific method for making an alternative evaluation of sufficiency; it is left to professional judgment. The following circumstances justify an alternative evaluation of sufficiency for the City: • The City ceased contributions and withdrawals from the Trust. The City will pay
benefits directly to retirees until the trust is sufficient, on an expected basis, to pay all remaining benefits.
• All cash flows are assumed to occur on average halfway through the year. • The long-term expected rate of return on pension plan investments is 6.25%. • The actuarial assumptions do not change. • GASB 67 and 68 specify that the projections regarding future solvency assume that
plan assets earn the assumed rate of return and there are no future changes in the plan provisions or actuarial methods and assumptions, which means that the projections would not reflect any adverse future experience which might impact the plan’s funded position.
Based on these circumstances, it is the actuary’s opinion that a depletion date projection is not appropriate. Therefore, the discount rate is based on the projected portion of the Total Pension Liability funded by the Fiduciary Net Position in each future year. For the funded portion, the long-term expected rate of return on pension plan investments (6.25%) was used, and the Bond Buyer 20-Bond Go Index as of the June 30, 2016, measurement date (2.85%) for the unfunded portion. The discount rate used (3.5%) represents the single equivalent rate of return, as described under GASB 68 (paragraph 31).

City of West Covina Notes to Basic Financial Statements For the Year Ended June 30, 2016
-98-
12) PUBLIC AGENCY RETIREMENT SYSTEM (PARS), (continued)
B) Supplemental Retirement Plan for Executive Staff and City Council, (continued) Net Pension Liability, (continued) Discount Rate, (continued) The best-estimate range for the long-term expected rate of return is determined by adding expected inflation to expected long-term real returns and reflecting expected volatility and correlation. The table below reflects the long-term expected real rate of return by asset class.
Asset ClassCash 5.0% 0.45%Equities 48.5% 5.35%Fixed Income 45.0% 1.55%REIT 1.5% 4.03% Total 100%
Long-Term Expected Rate of Return 6.25%
Expected Real Rate of Return
(Geometric)New Strategic
Allocation
The plan’s fiduciary net position was not projected to be available to make all projected future benefit payments of current retirees. Therefore, the discount rate for calculating the total pension liability is equal to the single equivalent rate that results in the same actuarial present value as the long-term expected rate of return applied to benefit payments, to the extent that the plan’s fiduciary net position is projected to be sufficient to make projected benefit payments, and the municipal bond rate applied to benefit payments, to the extent that the plan’s fiduciary net position is not projected to be sufficient. The City chose the Bond Buyer General Obligation 20-Bond Index resulting is the use of a 4.29% rate in calculating the pension liability.

City of West Covina Notes to Basic Financial Statements For the Year Ended June 30, 2016
-99-
12) PUBLIC AGENCY RETIREMENT SYSTEM (PARS), (continued) B) Supplemental Retirement Plan for Executive Staff and City Council, (continued)
Changes in the Net Pension Liability The changes in the net pension liability, with a measurement date of June 30, 2015, for the Plan are as follows:
Increase (Decrease)Total Pension
Liability(a)
Plan Fiduciary Net Position
(b)
Net Pension Liability
(c) = (a) - (b)Balances as of June 30, 2014 3,157,000$ 706,000$ 2,451,000$ Changes for the year:• Service Cost 116,000 - 116,000 • Interest 178,000 - 178,000 • Difference between actual and expected experience (643,000) - (643,000) • Assumptions Changes 346,000 - 346,000 • Contributions- employer - 78,000 (78,000) • Contributions- employee - - - • Net Investment Income - 13,000 (13,000) • Benefit payments and refunds (104,000) (104,000) - • Administrative Expenses - (6,000) 6,000 Net Changes (107,000) (19,000) (88,000) Balance as of June 30, 2015 3,050,000$ 687,000$ 2,363,000$

City of West Covina Notes to Basic Financial Statements For the Year Ended June 30, 2016
-100-
12) PUBLIC AGENCY RETIREMENT SYSTEM (PARS), (continued)
B) Supplemental Retirement Plan for Executive Staff and City Council, (continued) Changes in the Net Pension Liability, (continued) Sensitivity of the Net Pension Liability to Changes in the Discount Rate The following presents the net pension liability (asset) of the City for the Plan, calculated using the discount rate for the Plan, as well as what the City’s net pension liability would be if it were calculated using a discount rate that is 1-percentage point lower or 1-percentage point higher than the current rate:
Discount Rate - 1%(3.7%)
Current Discount Rate (4.7%)
Discount Rate + 1%(5.7%)
Net Pension Liability 2,875,000$ 2,363,000$ 1,960,000$
Pension Expenses and Deferred Outflows/Inflows of Resources Related to Pensions: For the year ended June 30, 2016, the City recognized pension expense of negative $19,000. At June 30, 2016, the City reported deferred outflows of resources and deferred inflows of resources related to pensions from the following sources:
Deferred Outflows of Resources
Deferred Inflows of Resources
Differences between Expected andActual Experience -$ (48,000)$
Changes of Assumptions 26,000 - Net Difference between Projected and
Actual Earnings on Pension Plan 3,000 - Pension Contributions Subsequent to
Measurement Date 78,000 - Total 107,000$ (48,000)$

City of West Covina Notes to Basic Financial Statements For the Year Ended June 30, 2016
-101-
12) PUBLIC AGENCY RETIREMENT SYSTEM (PARS), (continued) B) Supplemental Retirement Plan for Executive Staff and City Council, (continued)
Pension Expenses and Deferred Outflows/Inflows of Resources Related to Pensions, (continued) The $78,000 reported as deferred outflows of resources related to contributions subsequent to the measurement date will be recognized as a reduction of the net pension liability in the year ending June 30, 2016. Other amounts reported as deferred inflows of resources related to pensions will be recognized as pension expense as follows:
Measurement Period Ended
Deferred Outflows/(Inflows) of Resources, Net
June 30, PARS 2017 (23,000)$ 2018 (1,000) 2019 (1,000) 2020 6,000
Thereafter - Payable to the Pension Plan At June 30, 2016, the City had no outstanding amount of contributions to the pension plan required for the year ended June 30, 2016.

City of West Covina Notes to Basic Financial Statements For the Year Ended June 30, 2016
-102-
13) DEFINED CONTRIBUTION PENSION PLAN
Plan Description During the 1991-1992 fiscal year, the City established the West Covina Part-Time Retirement Plan, a defined contribution retirement plan, for all nonbenefited, part-time employees in accordance with Internal Revenue Code Section 457, to conform to Section 3121(b)(7)(F) of the Internal Revenue Code added by the Omnibus Budget Reconciliation Act of 1990. The plan is administered by Nationwide Retirement Solutions. The plan was established by the authority of the City Council who retains the authority to amend the plan. A defined contribution pension plan provides pension benefits in return for services rendered, provides an individual account for each participant, and specifies how contributions to the individual’s account are to be determined instead of specifying the amount of benefits the individual is to receive. Under a defined contribution pension plan, the benefits a participant will receive depend solely on the amount contributed to the participant’s account and the returns earned on investments of the contributions. Part-time, nonbenefited, nonpersable employees of the City must participate in the plan. During 2012-13, 195 part-time employees participated in the plan. All contributions to the plan vest immediately. An employee who leaves the City is entitled to all contributions and earnings applied to the individual’s account through the date of separation, less legally required income tax withholding. Contribution levels into the deferred compensation plan were established by City Council resolution at 0% for the City and 7.5% for nonbenefited, nonpersable part-time employees. During the year, total required and actual contributions amounted to $92,806 and covered payroll for the year ended June 30, 2016, totaled $1,898,563. No contributions were made by the City and employees contributed $92,806 (7.5% of current covered payroll). Total plan assets at June 30, 2016, were $765,377. Plan assets are held in trust for the exclusive benefit of participants and their beneficiaries and, therefore, are not included in the financial statements.
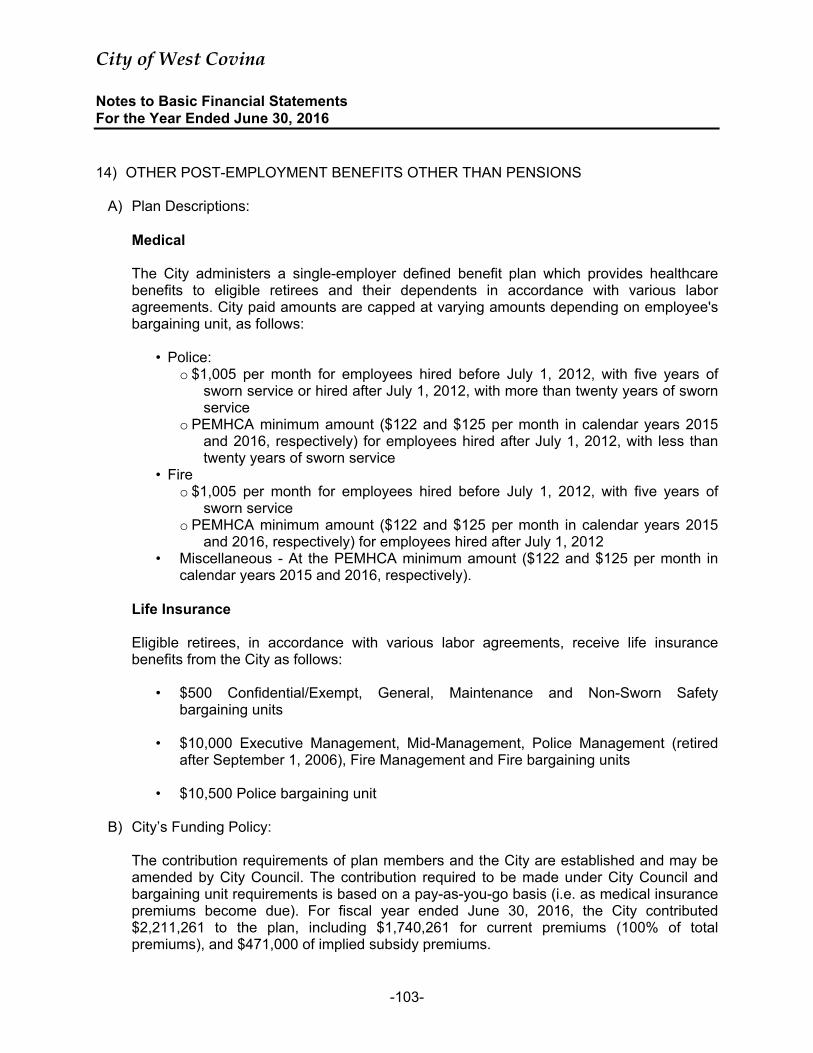
City of West Covina Notes to Basic Financial Statements For the Year Ended June 30, 2016
-103-
14) OTHER POST-EMPLOYMENT BENEFITS OTHER THAN PENSIONS
A) Plan Descriptions:
Medical The City administers a single-employer defined benefit plan which provides healthcare benefits to eligible retirees and their dependents in accordance with various labor agreements. City paid amounts are capped at varying amounts depending on employee's bargaining unit, as follows:
• Police: o $1,005 per month for employees hired before July 1, 2012, with five years of
sworn service or hired after July 1, 2012, with more than twenty years of sworn service
o PEMHCA minimum amount ($122 and $125 per month in calendar years 2015 and 2016, respectively) for employees hired after July 1, 2012, with less than twenty years of sworn service
• Fire o $1,005 per month for employees hired before July 1, 2012, with five years of
sworn service o PEMHCA minimum amount ($122 and $125 per month in calendar years 2015
and 2016, respectively) for employees hired after July 1, 2012 • Miscellaneous - At the PEMHCA minimum amount ($122 and $125 per month in
calendar years 2015 and 2016, respectively). Life Insurance Eligible retirees, in accordance with various labor agreements, receive life insurance benefits from the City as follows:
• $500 Confidential/Exempt, General, Maintenance and Non-Sworn Safety bargaining units
• $10,000 Executive Management, Mid-Management, Police Management (retired
after September 1, 2006), Fire Management and Fire bargaining units • $10,500 Police bargaining unit
B) City’s Funding Policy:
The contribution requirements of plan members and the City are established and may be amended by City Council. The contribution required to be made under City Council and bargaining unit requirements is based on a pay-as-you-go basis (i.e. as medical insurance premiums become due). For fiscal year ended June 30, 2016, the City contributed $2,211,261 to the plan, including $1,740,261 for current premiums (100% of total premiums), and $471,000 of implied subsidy premiums.

City of West Covina Notes to Basic Financial Statements For the Year Ended June 30, 2016
-104-
14) OTHER POST-EMPLOYMENT BENEFITS OTHER THAN PENSIONS, (continued)
C) Annual OPEB Cost and Net OPEB Obligation:
The City's annual other postemployment benefit (OPEB) cost (expense) is calculated based on the annual required contribution of the employer (ARC), an amount actuarially determined in accordance with the parameters of GASB Statement No. 45. The ARC represents a level of funding that, if paid on an ongoing basis, is projected to cover normal cost each year and amortize any unfunded actuarial liabilities (or funding excess) over a period not to exceed thirty years. The following table shows the components of the City's annual OPEB cost for the year, the amount actually contributed to the plan, and changes in the City's net OPEB obligation for these benefits:
Annual required contribution (ARC) 4,325,000$ Interest on net OPEB obligation 778,000 Adjustments to annual required contribution (967,000) Annual OPEB cost (expense) 4,136,000 Contributions made (2,211,261) Decrease in net OPEB obligation 1,924,739 Net OPEB obligation - beginning of year 20,565,644 Net OPEB obligation - end of year 22,490,383$
The City's annual OPEB cost, the percentage of annual OPEB cost contributed to the plan, and the net OPEB obligation for 2016 and the two preceding years were as follows:
Fiscal Annual OPEB Percentage of Net OPEBYear Cost (AOC) OPEB Cost Contributed Obligation
6/30/2014 5,150,000$ 34.45% 17,006,654$ 6/30/2015 5,471,000 34.95% 20,565,444 6/30/2016 4,136,000 53.46% 22,490,383
D) Funded Status and Funding Progress:
Actuarial Accrued Liability (AAL) 55,763,000$ Actuarial Value Plan Assets - Unfunded Actuarial Accrued Liability (UAAL) 55,763,000 Funded Ratio (Actuarial Value of Plan Assets/AAL 0%Covered Payroll (Active Plan Members) 25,692,000 UAAL as a Percentage of Covered Payroll 217.04%

City of West Covina Notes to Basic Financial Statements For the Year Ended June 30, 2016
-105-
14) OTHER POST-EMPLOYMENT BENEFITS OTHER THAN PENSIONS, (continued)
D) Funded Status and Funding Progress (Continued):
Actuarial valuations of an ongoing plan involve estimates of the value of reported amounts and assumptions about the probability of occurrence of events far into the future. Examples include assumptions about rates of employee turnover, retirement, mortality, as well as economic assumptions regarding claim costs per retiree, healthcare inflation and interest rates. Amounts determined regarding the funded status of the plan and the annual required contributions of the employer are subject to continual revision as actual results are compared with past expectations and new estimates are made about the future. The schedule of funding progress, presented as required supplementary information following the notes to the financial statements represents multi-year trend information about whether the actuarial value of plan assets is increasing or decreasing over time relative to the actuarial accrued liabilities for benefits.
E) Actuarial Methods and Assumptions:
Projections of benefits for financial reporting purposes are based on the substantive plan (the plan as understood by the employer and the plan members) and include the types of benefits provided at the time of each valuation and the historical pattern of sharing of benefit costs between employer and plan members to that point. The actuarial methods and assumptions used include techniques that are designed to reduce the effects of short-term volatility in actuarial accrued liabilities and the actuarial assets, consistent with the long-term perspective of the calculations. The actuarial cost method used for determining the benefit obligations is as follow:
Valuation Date June 30, 2015Actuarial Cost Method Entry Age NormalAmortization Method Level Percent of PayrollRemaining Amortization Period 27 Years as of the Valuation DateActuarial Assumptions:Investment Rate of Return 4.00%Projected Salary Increase 3.25%Health Care Trend Rate* 6.50%Inflation Rate 3.00%
* 6.50% initially, reduced by increments of .05% per year to an ultimate rate of 5% after the third year.
City of West Covina Notes to Basic Financial Statements For the Year Ended June 30, 2016
-106-
15) COMMITMENTS AND CONTINGENCIES
A) In 1989, in order to assist in the expansion of the Fashion Plaza shopping center, the City enacted an ordinance to allow the Redevelopment Agency of the City of West Covina (the predecessor to the West Covina Community Development Commission) to receive the sales tax generated as a result of the expansion project. At the same time, the City enacted an ordinance providing a credit for sales tax payable by the developer in the amount equal to the sales tax due to the redevelopment agency. These sales tax ordinances and related agreements between the City and the Agency essentially transferred the sales tax increment due to the Fashion Plaza expansion project from the City to the Agency.
B) On July 25, 2005, the Board of Directors of the former West Covina Community
Development Commission adopted Resolution No. 2005-50. By this resolution, the Board of Directors authorized the Commission to reimburse the City of West Covina over a period of 17 years for the sales tax revenue that had essentially been shifted from the City to the Agency. These budgeted interfund transfers between the primary government of the City of West Covina and the former Community Development Commission will be recorded in the fiscal year that they result in a flow of current financial resources, as required by the measurement focus prescribed for governmental funds. As a result of the dissolution of the Redevelopment Agency, the Department of Finance has deemed this agreement as an unenforceable obligation.
16) CHANGES IN LEGISLATION AFFECTING CALIFORNIA REDEVELOPMENT AGENCIES
On June 29, 2011, Assembly Bills 1x 26 (the “Dissolution Act”) and 1x 27 were enacted as part of the fiscal year 2011-12 state budget package. On June 27, 2012, as part of the fiscal year 2012-13 state budget package, the Legislature passed and the Governor signed AB 1484, which made technical and substantive amendments to the Dissolution Act based on experience to-date at the state and local level in implementing the Dissolution Act. Under the Dissolution Act, each California redevelopment agency (each “Dissolved RDA”) was dissolved as of February 1, 2012, and the sponsoring community that formed the Dissolved RDA, together with other designated entities, have initiated the process under the Dissolution Act to unwind the affairs of the Dissolved RDA. A Successor Agency was created for each Dissolved RDA which is the sponsoring community of the Dissolved RDA unless it elected not to serve as the Successor Agency. On January 10, 2012, the City elected to serve as the Successor Agency of the Community Development Commission of the City of West Covina.
City of West Covina Notes to Basic Financial Statements For the Year Ended June 30, 2016
-107-
16) CHANGES IN LEGISLATION AFFECTING CALIFORNIA REDEVELOPMENT AGENCIES, (continued)
The Dissolution Act also created oversight boards which monitor the activities of the successor agencies. The roles of the successor agencies and oversight boards is to administer the wind down of each Dissolved RDA which includes making payments due on enforceable obligations, disposing of the assets (other than housing assets) and remitting the unencumbered balances of the Dissolved RDAs to the County Auditor-Controller for distribution to the affected taxing entities. The Dissolution Act allowed the sponsoring community that formed the Dissolved RDA to elect to assume the housing functions and take over certain housing assets of the Dissolved RDA. If the sponsoring community does not elect to become the Successor Housing Agency and assume the Dissolved RDA’s housing functions, such housing functions and all related housing assets will be transferred to the local housing authority in the jurisdiction. AB 1484 modified and provided some clarifications on the treatment of housing assets under the Dissolution Act. On January 17, 2012, the City created the City of West Covina Housing Authority to service as the Housing Successor Agency. After the date of dissolution, the housing assets, obligations, and activities of the Dissolved RDA have been transferred and are reported in the Housing Authority Special Revenue Fund in the financial statements of the City. All other assets, obligations, and activities of the Dissolved RDA have been transferred and are reported in a fiduciary fund (private-purpose trust fund) in the financial statements of the City.
The Dissolution Act and AB 1484 also establish roles for the County Auditor-Controller, the California Department of Finance (the “DOF”) and the California State Controller’s office in the dissolution process and the satisfaction of enforceable obligations of the Dissolved RDAs. The County Auditor-Controller is charged with establishing a Redevelopment Property Tax Trust Fund (the “RPTTF”) for each Successor Agency and depositing into the RPTTF for each six-month period the amount of property taxes that would have been redevelopment property tax increment had the Dissolved RDA not been dissolved. The deposit in the RPTTF fund is to be used to pay to the Successor Agency the amounts due on the Successor Agency’s enforceable obligations for the upcoming six-month period. The Successor Agency is required to prepare a recognized obligation payment schedule (the “ROPS”) approved by the oversight board setting forth the amounts due for each enforceable obligation during each six month period. The ROPS is submitted to the DOF for approval. The County Auditor-Controller will make payments to the Successor Agency from the RPTTF fund based on the ROPS amount approved by the DOF. The ROPS is prepared in advance for the enforceable obligations due over the next six months. The process of making RPTTF deposits to be used to pay enforceable obligations of the Dissolved RDA will continue until all enforceable obligations have been paid in full and all non-housing assets of the Dissolved RDA have been liquidated.

City of West Covina Notes to Basic Financial Statements For the Year Ended June 30, 2016
-108-
16) CHANGES IN LEGISLATION AFFECTING CALIFORNIA REDEVELOPMENT AGENCIES, (continued)
As part of the dissolution process AB1484 required the Successor Agency to have due diligence reviews of both the low and moderate income housing funds and all other funds to be completed by October 15, 2012, and January 15, 2013, to compute the funds (cash) which were not needed by the Successor Agency to be retained to pay for existing enforceable obligations. The Successor Agency remitted $1,891,166 to the CAC on December 19, 2012, for the low and moderate income housing funds due diligence review. The due diligence review for all other funds was finalized with the final letter of determination issued by the DOF on April 24, 2013. The DOF determined that the principal and interest payments made by the former Community Development Commission totaling $12,205,531 on various loans from the City of West Covina for the period January 1, 2011, to June 30, 2012, were on loans not made within the first two years of the formation of the former redevelopment agency. The DOF ordered Successor Agency to remit $11,578,351 to the CAC within five days from the date of the letter. City management, in consultation with its legal counsel, did not agree with the DOF’s decision and filed a lawsuit to contest the decision. The City also did not remit the payments that were disallowed to the CAC. In December 2015, the City entered into a settlement agreement, which requires the City to repay the $11,578,351 over a period of 20 years. See additional details on the long-term payable in Note 7. As the City repays the Successor Agency, the Successor Agency will remit the amounts collected to the CAC. At June 30, 2016, the City is reporting a long-term liability of $11,578,351 in the governmental activities and a receivable of $11,578,351 in the Successor Agency related to the DOF’s determination. Advances from City of West Covina - AB 1484 specifies the actions to be taken and the method of repayment for advances by the Successor Agency to the various funds of the City. Upon application and approval by the Successor Agency and approval by the Oversight Board, loan agreements (advances) entered into by the former redevelopment agency and the City shall be deemed to be enforceable obligations provided that the Oversight Board makes a finding that the advances were for legitimate redevelopment purposes. The accumulated interest on the remaining amount of advances will be recalculated from origination at the interest rate earned by funds deposited into the Local Agency Investment Fund. The advances are to be repaid with a defined schedule over a reasonable term of years at an interest rate not to exceed the interest rate earned by the funds deposited into the Local Agency Investment Fund. The annual advances repayments are subject to certain limitations. Advance repayments shall not be made prior to the 2014-2015 fiscal year, are subject to a formula distribution, and have a lower priority for repayment as described in AB 1484 (Health and Safety Code Section 34191.4(2)(A)). The advances related to the borrowing for the SERAF payment have a priority over repayment of the other advances. 20% of the repayment of the other advances not related to the SERAF advances shall be deducted and transferred to the Low and Moderate Income Housing Asset Fund (Housing Authority). Management of the City has not recorded an allowance for uncollectible advances as all the advances are expected to be repaid.

City of West Covina Notes to Basic Financial Statements For the Year Ended June 30, 2016
-109-
16) CHANGES IN LEGISLATION AFFECTING CALIFORNIA REDEVELOPMENT AGENCIES, (continued)
The State Controller of the State of California has been directed to review the propriety of any transfers of assets between Dissolved RDA and other public bodies that occurred after January 1, 2011. If the public body that received such transfers is not contractually committed to a third party for the expenditure or encumbrance of those assets, the State Controller is required to order the available assets to be transferred to the public body designated as the successor agency. The State Controller completed its review on December 11, 2013, and identified $8,497,720 of unallowable transfers of assets that occurred during the audit between the former Commission and the City. This amount is already included in the amount ordered by DOF to remit to the CAC (see above). On May 2, 2000, the City and the RDA entered into a Financing Agreement establishing a $5,600,000 line of credit to the RDA to achieve project goals within the implementation plan. The City Council and RDA resolutions approved the 2000 Financing Agreement and promissory note. The Financing Agreement authorized the RDA to draw down funds from the line of credit. Specifically, the RDA withdrew $600,000 and $5,000,000 on September 2000 and June 2004, respectively, as substantiated through the financial statements. On March 9, 2016, the DOF found that the loans were for legitimate redevelopment purposes and therefore enforceable obligations. Similarly, on June 15, 2010, the RDA and the City entered into a Cash Flow Loan totaling $2,500,000 to satisfy the RDA's short term cash flow needs. The Agency provided City Council and RDA resolutions and financial statements substantiating the loans in the amount of $2,500,000. On March 9, 2016, the DOF found that the loans were for legitimate redevelopment purposes and therefore enforceable obligations. Management believes, in consultation with legal counsel, that the remaining obligations of the Dissolved RDA due to the City are valid enforceable obligations payable by the Successor Agency under the requirements of the Dissolution Act and AB 1484. The City’s position on this issue is not a position of settled law and there is considerable legal uncertainty regarding this issue. It is reasonably possible that a legal determination may be made at a later date by an appropriate judicial authority that would resolve this issue unfavorably to the City.

City of West Covina Notes to Basic Financial Statements For the Year Ended June 30, 2016
-110-
17) SUCCESSOR AGENCY DISCLOSURES
The assets and liabilities of the Commission’s former non-housing redevelopment activities were transferred to the City in its fiduciary capacity as the Successor Agency to the Redevelopment Agency of the City of West Covina on February 1, 2012, as a result of the dissolution of California redevelopment agencies. These assets and liabilities and any activities related to them are reported in the City’s fiduciary private-purpose trust fund financial statements. Disclosures related to these assets and liabilities are as follows: Notes Receivable In 2010, the Commission received an award for damages, attorneys’ fees and costs under a foreclosure judgment in the superior court in the amount of $7,586,603. This amount is the result of a positive verdict in litigation against Hassan Imports Partnership and various related entities, stemming from breach of contract of various agreements and covenants with the Commission. The Commission is pursuing collection of these judgments in federal bankruptcy court. The developer has also filed an appeal of the judgment. The outstanding balance at June 30, 2016, with interest, is $10,229,768. The City also obtained a judgment in a related matter. The outstanding balance of that judgment at June 30, 2016, with interest, is $1,401,506. Subsequent to the above litigation, Hassan Imports Partnership also breached two additional sales tax guaranty agreements related to the Chevrolet and Dodge dealerships. The outstanding amounts due under these loans at June 30, 2016, is $1,997,861. The Commission had previously provided a loan to Clippinger Dodge that bears interest at 7% and is collateralized by a promissory note and sales tax guarantees. The outstanding principal and accrued interest at June 30, 2016, is $1,042,832. All of these receivables are offset by an allowance for doubtful accounts on the financial statements of the private-purpose trust fund. Assessment Receivable In connection with the Commission's issuance of its $51,220,000 1996 Special Tax Bonds, $32,520,000 in assessments receivable was recorded. The assessment is an annual special tax levied on the community facilities district in an amount sufficient to ensure payment of the debt service on the 1996 Special Tax Bonds. This special tax supplements sales and property tax increment revenues that also support the debt service on the bonds. As of June 30, 2016, the following assessments receivable were outstanding:
1996 Special Tax Bonds $25,185,000

City of West Covina Notes to Basic Financial Statements For the Year Ended June 30, 2016
-111-
17) SUCCESSOR AGENCY DISCLOSURES, (continued)
Land Held For Resale Land held for resale, which is valued a lower of cost or the sales price per contract with the developer is comprised of the following at June 30, 2016:
BKK Project $139,016
Capital Assets Capital asset activity for the year ended June 30, 2016, was as follows:
Balance BalanceJune 30, 2015 Additions Deletions June 30, 2016
Capital assets, not being depreciated:Land 15,597,561$ -$ (12,589,759)$ 3,007,802$
Total capital assets, not being depreciated 15,597,561 - (12,589,759) 3,007,802
Capital assets, being depreciated:Buildings and improvements 18,403,609 - - 18,403,609 Equipment and vehicles 95,975 (34,570) - 61,405
Total capital assets, being depreciated 18,499,584 (34,570) - 18,465,014
Less accumulated depreciation for:Buildings and improvements (12,820,785) (368,074) - (13,188,859) Equipment and vehicles (93,713) (251) 34,570 (59,394)
Total accumulated depreciation (12,914,498) (368,325) 34,570 (13,248,253)
Total capital assets, being depreciated, net 5,585,086 (402,895) 34,570 5,216,761
Total capital assets, net $ 21,182,647 $ (402,895) $ (12,555,189) $ 8,224,563

City of West Covina Notes to Basic Financial Statements For the Year Ended June 30, 2016
-112-
17) SUCCESSOR AGENCY DISCLOSURES, (continued) Long-Term Liabilities Long-term liability activity for the year ended June 30, 2016, was as follows:
Balance Balance Due WithinJune 30, 2015* Additions Deletions June 30, 2016 One Year
Successor Agency:
Lease Revenue Bonds:1998 Lease Revenue Bonds 2,405,000$ -$ (535,000)$ 1,870,000$ 575,000$
Special Tax Bonds:1996 Special Tax Bonds 28,125,000 - (2,940,000) 25,185,000 2,745,000
Tax Allocation Bonds:1999 Tax Allocation Bonds 3,120,000 - (155,000) 2,965,000 165,000 2002 Tax Allocation Bonds 7,225,000 - (630,000) 6,595,000 660,000
Housing Set-Aside Bonds:1998 Housing Set-Aside Bonds 3,545,000 - (240,000) 3,305,000 255,000 2001 Housing Set-Aside Bonds 6,595,000 - (455,000) 6,140,000 475,000
Total Bonds Payable 51,015,000 - (4,955,000) 46,060,000 4,875,000
Developer agreement payable 46,148,939 5,071,489 (1,657,353) 49,563,075 480,578 Due to County of Los Angeles 7,078,328 394,691 (1,439,888) 6,033,131 1,699,355
Total 104,242,267$ 5,466,180$ (8,052,241)$ 101,656,206$ 7,054,933$
*Includes prior period restatement of $393,534 to developer agreement payable. See note 18 for details.

City of West Covina Notes to Basic Financial Statements For the Year Ended June 30, 2016
-113-
17) SUCCESSOR AGENCY DISCLOSURES, (continued) Long-Term Liabilities, (continued) 1988 Lease Revenue Refunding Bonds (The Lakes Public Parking Project) In 1988, the Community Development Commission issued $7,750,000 of Variable Rate Lease Revenue Bonds for the purpose of constructing two multi-story parking structures. The bonds consist of $7,350,000 of current interest bonds and $400,000 of compound interest bonds. The bonds carried interest rates of 6.625% and 7.50%, respectively, until January 31, 1994. On February 1, 1994, the bonds were converted to variable rate bonds. The interest rates vary based on the prevailing financial market conditions beginning on February 1, 1994, to a maximum of 12% over the term of the bonds and are payable monthly. The bonds are subject to mandatory redemption beginning August 1, 1994, and annually thereafter through August 1, 2018. The bonds are secured by the facilities and lease rentals to be received pursuant to a lease agreement between the Commission and the City. The reserve requirement of $387,500 was fully funded at June 30, 2016. At June 30, 2016, the outstanding balance is $1,870,000. The annual debt service requirements on the 1988 Lease Revenue Refunding Bonds as of June 30, 2016, are as follows (using interest rate of 0.1%):
2017 575,000$ 1,870$ 576,870$ 2018 625,000 1,295 626,295 2019 670,000 670 670,670
Total 1,870,000$ 3,835$ 1,873,835$
TotalYear Ending
June 30, Principal Interest

City of West Covina Notes to Basic Financial Statements For the Year Ended June 30, 2016
-114-
17) SUCCESSOR AGENCY DISCLOSURES, (continued) Long-Term Liabilities, (continued) 1996 Special Tax Bonds (The Fashion Plaza Project) In 1996, the Community Development Commission issued $51,220,000 of Special Tax Refunding Bonds comprised of $9,980,000 of serial bonds and $41,240,000 of term bonds to finance public parking facilities, street and other improvements located in or adjacent to the Community Development Commission Community Facilities District. The serial bonds matured during the fiscal year ended June 30, 2007. The term bonds bear interest at a rate from 5.75% to 6.0% payable semiannually and are due September 1, 2022. The term bonds are not subject to optional redemption; mandatory redemption begins September 1, 2007, then annually thereafter through September 1, 2022. Interest is payable semiannually on March 1 and September 1 of each year. The bonds are secured by and payable from a portion of the revenues derived from an annual special tax to be levied against all taxable real property within the Special Assessment District. In addition, the Commission has pledged certain other incremental revenues generated within the District consisting of property taxes and sales taxes. The reserve requirement of $5,002,670 was fully funded at June 30, 2016. In addition, there was a bond call on March 1, 2016, for $425,000. The outstanding principal balance of the bonds at June 30, 2016, is $25,185,000. The annual debt service requirements on the 1996 Special Tax Bonds as of June 30, 2016, are as follows:
2017 2,745,000$ 1,452,900$ 4,197,900$ 2018 3,000,000 1,277,700 4,277,700 2019 3,250,000 1,087,050 4,337,050 2020 3,495,000 881,250 4,376,250 2021 3,735,000 660,750 4,395,750
2022-2023 8,960,000 572,850 9,532,850
Total 25,185,000$ 5,932,500$ 31,117,500$
Year Ending June 30, Principal Interest Total

City of West Covina Notes to Basic Financial Statements For the Year Ended June 30, 2016
-115-
17) SUCCESSOR AGENCY DISCLOSURES, (continued) Long-Term Liabilities, (continued) 1999 Tax Allocation Bonds On November 1, 1999, the Community Development Commission issued $3,945,000 of Taxable Variable Rate Tax Allocation bonds. The proceeds of the bonds were used to fund a loan to the Commission, which was used by the Commission to finance certain redevelopment capital projects within the West Covina Merged Project Area. The bonds are payable from and secured by certain tax revenues payable to the Commission. The interest on the 1999 Bonds is payable monthly at an adjustable interest rate with a maximum of 12%. Principal is due annually through November 1, 2029, in amounts ranging from $140,000 to $270,000. The Commission has a letter of credit to pay the principal and interest due on the bonds to the extent that other funds are not available. The outstanding principal balance of the bonds at June 30, 2016, is $2,965,000. The annual debt service requirements on the 1999 Tax Allocation Bonds as of June 30, 2016, are as follows (using interest rate of 0.50%):
2017 165,000$ 14,825$ 179,825$ 2018 165,000 14,000 179,000 2019 170,000 13,175 183,175 2020 175,000 12,325 187,325 2021 185,000 11,450 196,450
2022-2026 1,075,000 42,325 1,117,325 2027-2030 1,030,000 13,075 1,043,075
Total 2,965,000$ 121,175$ 3,086,175$
TotalYear Ending
June 30, Principal Interest

City of West Covina Notes to Basic Financial Statements For the Year Ended June 30, 2016
-116-
17) SUCCESSOR AGENCY DISCLOSURES, (continued) Long-Term Liabilities, (continued) 2002 Tax Allocation Refunding Bonds On June 4, 2002, the Community Development Commission issued $12,200,000 of Tax Allocation Refunding Bonds. The proceeds of the Bonds were used to prepay the outstanding 1993 Tax Allocation Bonds. The 2002 Bonds are payable from tax revenues of the Commission. The interest on the bonds is payable semiannually on September 1 and March 1 of each year at interest rates ranging from 1.75% to 5.10%. The principal of the bonds is due annually through September 1, 2025, in amounts ranging from $580,000 to $800,000. At June 30, 2016, the required reserve of $996,533 was fully funded. The principal balance of outstanding bonds at June 30, 2016, is $6,595,000. The annual debt service requirements on the 2002 Tax Allocation Refunding Bonds as of June 30, 2016, are as follows:
2017 660,000$ 319,515$ 979,515$ 2018 690,000 285,090 975,090 2019 725,000 249,008 974,008 2020 765,000 211,013 976,013 2021 800,000 171,105 971,105
2022-2026 2,955,000 391,553 3,346,553
Total 6,595,000$ 1,627,284$ 8,222,284$
Year Ending June 30, Principal Interest Total

City of West Covina Notes to Basic Financial Statements For the Year Ended June 30, 2016
-117-
17) SUCCESSOR AGENCY DISCLOSURES, (continued) Long-Term Liabilities, (continued) 1998 Housing Set-Aside Tax Allocation Bonds In 1998, the Community Development Commission issued $4,945,000 of Series A Tax Allocation Bonds and $1,200,000 of Taxable Series B Tax Allocation Bonds to provide funds for the acquisition and rehabilitation of a multi-family housing project. The bonds mature annually through September 1, 2025 in amounts ranging from $215,000 to $420,000, with interest rates varying from 4.5% to 7.0%. Interest is payable semiannually on March 1, and September 1, of each year. The bonds are payable solely from and secured by a pledge of that portion of the tax increment revenues receivable by the Commission with respect to the merged redevelopment project area and are required to be deposited into the Commission's Low and Moderate Income Housing Fund. At June 30, 2016, the required reserve of $446,513 was fully funded. The principal balance of outstanding bonds at June 30, 2016, is $3,305,000. The annual debt service requirements on the 1998 Housing Set-Aside Tax Allocation Bonds as of June 30, 2016, are as follows:
2017 255,000$ 179,248$ 434,248$ 2018 270,000 164,653 434,653 2019 285,000 149,131 434,131 2020 300,000 132,725 432,725 2021 315,000 115,425 430,425
2022-2026 1,880,000 278,464 2,158,464
Total 3,305,000$ 1,019,646$ 4,324,646$
TotalYear Ending
June 30, Principal Interest

City of West Covina Notes to Basic Financial Statements For the Year Ended June 30, 2016
-118-
17) SUCCESSOR AGENCY DISCLOSURES, (continued) Long-Term Liabilities, (continued) 2001 Housing Set-Aside Tax Allocation Bonds On December 1, 2001, the Community Development Commission issued $11,275,000 of Housing Set-Aside Tax Allocation Bonds. The proceeds of the bonds were used to fund a grant for the acquisition and development of a senior housing apartment complex and finance the implementation of the Commission's low and moderate income housing programs. The bonds are payable from and secured by certain tax increment revenues. The interest on the bonds is payable on March 1 and September 1 of each year with interest rates ranging from 2.25% to 5.00%. The principal of the bonds is due annually through September 1, 2031, in amounts ranging from $25,000 to $600,000. The bonds are subject to optional and mandatory redemption provisions. At June 30, 2016, the required reserve of $779,438 was fully funded. The principal balance of outstanding bonds at June 30, 2016, is $6,140,000. The annual debt service requirements on the 2001 Housing Set-Aside Tax Allocation Bonds as of June 30, 2016, are as follows:
2017 475,000$ 289,287$ 764,287$ 2018 500,000 266,250 766,250 2019 525,000 241,906 766,906 2020 550,000 216,237 766,237 2021 575,000 189,094 764,094
2022-2026 1,555,000 634,325 2,189,325 2027-2031 1,765,000 315,375 2,080,375
2032 195,000 4,875 199,875
Total 6,140,000$ 2,157,349$ 8,297,349$
Year Ending June 30, Principal Interest Total
Developer Agreement Payable On June 26, 1989, the Commission entered into an agreement with a developer to share certain future tax revenues generated by the Community Facilities District. Since 1992, the developer's share of revenues totaled $55,372,039, the unpaid balance accrues interest at a rate of 10%. The Commission has made payments to the developer totaling $21,486,622. The balance outstanding at June 30, 2016, is $49,563,075.

City of West Covina Notes to Basic Financial Statements For the Year Ended June 30, 2016
-119-
17) SUCCESSOR AGENCY DISCLOSURES, (continued) Long-Term Liabilities, (continued) Due to the County of Los Angeles Based on an agreement dated June 19, 1990, between the Commission and the County, during the first twenty years beginning in 1990, the Commission will retain from the County 50% of the County portion of tax increment. Per the agreement, the Commission must repay all amounts withheld from the County beginning in 2011. The repayment is made annually and is based on a calculation of excess tax increment revenues from the sub-project area. The outstanding balance accrues interest at 7%. The balance at June 30, 2016, is $6,033,131. Letters of Credit The Commission has letters of credit securing the payment of principal and interest on certain variable rate bonded debt. The letters of credit are issued in favor of the bond trustees and enable the trustees to make drawings against the letters of credit for payment of principal and interest amounts, if necessary. There were no draws made during fiscal year ended June 30, 2016. The terms of the letters of credit are summarized as follows:
Letter of credit Trustee Amount Expiration DateWells Fargo Bank:
1988 Lease Revenue Bonds Bank of New York 2,440,582$ August 1, 2018

City of West Covina Notes to Basic Financial Statements For the Year Ended June 30, 2016
-120-
18) RESTATEMENT OF BEGINNING NET POSITION
Fund Statements During fiscal year 2015-16, prior period adjustments were needed to correct the beginning fund balance in the following funds. The amount of adjustments affecting the cumulative results of operations was due to errors occurred in fiscal year 2014-15.
General Fund
General Fund
Fund balance - beginning, as previously reported 27,015,619$ Prior period adjustment 164,828
Fund balance - beginning, as restated 27,180,447$
A prior period adjustment of net effect of $164,828 was needed to adjust/correct the beginning fund balance in the General Fund. In fiscal year 2015-16 the Inmate Welfare Fund was moved to the General Fund. As a result, the Inmate Welfare Fund’s beginning fund balance of $7,226 was recorded as part of the General Fund’s beginning fund balance. It was also determined during the year that $157,602 in expenditures related to the Los Angeles County Park Bonds were incorrectly charged to the General Fund in previous years.
Special Revenue Funds:
Grants
Fund balance - beginning, as previously reported (245,924)$ Prior period adjustment (157,602)
Fund balance - beginning, as restated (403,526)$
Art in Public Places
Fund balance - beginning, as previously reported 528,448$ Prior period adjustment (322,121)
Fund balance - beginning, as restated 206,327$
Community Development Block Grant
Fund balance - beginning, as previously reported 3,737,389$ Prior period adjustment (3,599,408)
Fund balance - beginning, as restated 137,981$

City of West Covina Notes to Basic Financial Statements For the Year Ended June 30, 2016
-121-
18) RESTATEMENT OF BEGINNING NET POSITION, (continued)
A prior period adjustment of $157,602 in the Grants Special Revenue Fund was needed to correctly reflect expenditures related to the Los Angeles County Park Bonds that were incorrectly charged to the General Fund in previous years.
A prior period adjustment of $322,121 in the Art in Public Places Special Revenue Fund is due to the City Council approving the in-lieu funds reimbursement to Plaza West Covina. However, the in-lieu funds that were received in prior years were recognized as revenue instead of being held as a deposit.
A prior period adjustment of $3,599,408 in the Community Development Block Grant Special Revenue Fund was needed to correct an error for amounts that should have been recorded as deferred revenue in the prior year.
Fiduciary Fund:
Successor Agency Private Purpose Trust Fund
Net position - beginning, as previously reported (49,501,513)$ Prior period adjustment (3,375,027)
Net position - beginning, as restated (52,876,540)$
A prior period adjustment of $393,534 was recorded to correct the Developer Agreement Payable beginning balance. A prior period adjustment of $2,981,493 was recorded during the year due to certain capital assets discovered that are no longer being held by the former Redevelopment Agency.
GOVERNMENT WIDE STATEMENTS
Net position - beginning, as previously reported 63,856,375$ Prior period adjustment (3,921,686)
Net position - beginning, as restated 59,934,689$
A prior period adjustment of $3,921,686 was recorded based on the prior period adjustments previously noted in the General Fund and Special Revenue Funds.

City of West Covina Notes to Basic Financial Statements For the Year Ended June 30, 2016
-122-
19) SUBSEQUENT EVENT
During Fiscal Year 2016-17, the City budgeted to pay off various debt obligations. As of January 3, 2017, the following debt obligations had been paid off:
2005 Lease Revenue Refunding Bonds, Series C, in the amount of $2,135,476 Fire Trucks Lease in the amount of $2,591,382 California Energy Commission Loan in the amount of $718,530 Valencia Note in the amount of $491,797 Ambulance Capital Lease in the amount of $149,237
On December 21, 2016, the California Public Employees’ Retirement System (CalPERS) Board of Administration voted to lower the CalPERS discount rate from 7.5 percent to 7.0 percent over the next three years. The discount rate will change as follows:
Fiscal year 2017-2018 7.375% Fiscal year 2018-2019 7.250% Fiscal year 2019-2020 7.000%
Lowering the discount rate, also known as the assumed rate of investment return, will lead to increases in an employer’s normal cost for pension contributions and unfunded actuarial liabilities. On January 17, 2017, City Council approved in the Police Officer's Association's (POA) Memorandum of Understanding (MOU) the elimination of retiree medical benefits for new employees, who will instead receive a $200 month City contribution to a Retiree health Savings plan. On February 14, 2017, the Successor Agency issued Tax Allocation Revenue Refunding bonds, Series 2017A (Tax-Exempt) and 2017B (Federally Taxable). These bonds refinanced the 1998 Housing Set-Aside Tax Allocation Bonds Series A & B, the 2001 Housing Set-Aside Tax Allocation Revenue Bonds, the 2002 Tax Allocation Refunding Bonds and the 1999 Taxable Variable Rate Demand Tax Allocation Bonds.
-123-
REQUIRED SUPPLEMENTARY
INFORMATION

City of West Covina Required Supplementary Information Schedule of Changes in Net Pension Liability and Related Ratios CalPERS Pension Plan - Miscellaneous Last Ten Years*
-124-
Measurement Period 2013-14 2014-15
TOTAL PENSION LIABILITYService Cost 1,653,769$ 1,454,757$ Interest 9,849,865 10,180,561 Changes of Benefit Terms - - Difference Between Expected and Actual Experience - (134,455) Changes of Assumptions - (2,336,836) Benefit Payments, Including Refunds of Employee Contributions (6,835,867) (7,534,397) Net Change in Total Pension Liability 4,667,767 1,629,630 Total Pension Liability - Beginning 133,922,583 138,590,350 Total Pension Liability - Ending (a) 138,590,350$ 140,219,980$
PLAN FIDUCIARY NET POSITIONContributions - Employer 1,441,234$ 1,507,469$ Contributions - Employee 921,495 714,712 Net Investment Income1 17,189,513 2,500,142 Benefit Payments, Including Refunds of Employee Contributions (6,835,867) (7,534,397) Plan to Plan Resource Movement - 307 Administrative Expense - (123,626) Net Change in Fiduciary Net Position 12,716,375 (2,935,393) Plan Fiduciary Net Position - Beginning 100,069,306 112,785,681 Plan Fiduciary Net Position - Ending (b) 112,785,681$ 109,850,288$
Plan Net Pension Liability - Ending (a) - (b) 25,804,669$ 30,369,692$
Plan Fiduciary Net Position as a Percentage of the Total Pension Liability 81.38% 78.34%
Covered Payroll 10,025,879$ 9,381,292$
Plan Net Pension Liability as a Percentage of Covered Payroll 257.38% 323.73%
1 Net of administrative expenses.
Notes to Schedule:
* Measurement date June 30, 2014 (fiscal year 2014-15) was the first year of implementation, therefore, only two yearsare presented.
Changes in Benefit Terms: The figures above do not include any liability impact that may have resulted from plan changeswhich occurred after June 30, 2014. This applies for voluntary benefit changes as well as any offers of Two YearsAdditional Service Credit (a.k.a. Golden Handshakes).
Changes in Assumptions: The discount rate was changed from 7.5 percent (net of administrative expense) to 7.65percent for the June 30, 2015 measurement date.

City of West Covina Required Supplementary Information Schedule of Plan Contributions CalPERS Pension Plan - Miscellaneous Last Ten Years*
-125-
Fiscal Year2014-15
Fiscal Year2015-16
Actuarially Determined Contribution 1,542,953$ 1,507,469$ Contributions in Relation to the Actuarially Determined Contribution (1,542,953) (1,507,469) Contribution Deficiency (Excess) -$ -$
Covered Payroll 7,250,397$ 9,381,292$
Contributions as a Percentage of Covered Payroll 21.28% 16.07%
Notes to Schedule:
Actuarial Cost MethodAmortization Method/PeriodAsset Valuation Method
InflationSalary IncreasesPayroll GrowthInvestment Rate of Return
Retirement Age
Mortality
2.75%
* Fiscal Year 2014-15 was the first year of implementation, therefore, only two years are presented.
The actuarial methods and assumptions used to set the actuarially determined contributions for Fiscal Year2015-16 were from the June 30, 2013, Funding Valuation Report.
Entry Age NormalFor details, see June 30, 2012, Funding Valuation Report.Actuarial Value of Assets. For details, see June 30, 2012, Funding ValuationReport.
Varies by Entry Age and Service3.00%7.65% Net of Pension Plan Investment Expenses; includes Inflation. For2014-15, 7.50% Net of Pension Plan Investment and AdministrativeExpenses; includes Inflation.
The probabilities of Retirement are based on the 2010 CalPERS ExperienceStudy for the period from 1997 to 2007.
The probabilities of mortality are based on the 2010 CalPERS ExperienceStudy for the period from 1997 to 2007. Pre-retirement and Post-retirementmortality rates include 5 years of projected mortality improvement usingScale AA published by the Society of Actuaries.

City of West Covina Required Supplementary Information Schedule of Changes in Net Pension Liability and Related Ratios CalPERS Pension Plan - Safety Last Ten Years*
-126-
Measurement Period 2013-14 2014-15
TOTAL PENSION LIABILITYService Cost 4,824,545$ 4,604,800$ Interest 23,426,151 24,117,128 Changes of Benefit Terms - - Difference Between Expected and Actual Experience - (1,760,971) Changes of Assumptions - (5,858,071) Benefit Payments, Including Refunds of Employee Contributions (17,362,607) (17,865,208) Net Change in Total Pension Liability 10,888,089 3,237,678 Total Pension Liability - Beginning 318,617,717 329,505,806 Total Pension Liability - Ending (a) 329,505,806$ 332,743,484$
PLAN FIDUCIARY NET POSITIONContributions - Employer 6,403,118$ 7,339,064$ Contributions - Employee 2,416,548 1,628,630 Net Investment Income1 34,775,710 5,057,426 Benefit Payments, Including Refunds of Employee Contributions (17,362,607) (17,865,208) Plan to Plan Resource Movement - 10,338 Administrative Expense - (254,287) Net Change in Fiduciary Net Position 26,232,769 (4,084,037) Plan Fiduciary Net Position - Beginning 203,765,462 229,998,231 Plan Fiduciary Net Position - Ending (b) 229,998,231$ 225,914,194$
Plan Net Pension Liability - Ending (a) - (b) 99,507,575$ 106,829,290$
Plan Fiduciary Net Position as a Percentage of the Total Pension Liability 69.80% 67.89%
Covered Payroll 16,974,682$ 16,517,686$
Plan Net Pension Liability as a Percentage of Covered Payroll 586.21% 646.76%
1 Net of administrative expenses.
Notes to Schedule:
* Measurement date June 30, 2014, (fiscal year 2014-15) was the first year of implementation, therefore, only two yearsare presented.
Changes in Benefit Terms: The figures above do not include any liability impact that may have resulted from plan changeswhich occurred after June 30, 2014. This applies for voluntary benefit changes as well as any offers of Two YearsAdditional Service Credit (a.k.a. Golden Handshakes).
Changes in Assumptions: The discount rate was changed from 7.5 percent (net of administrative expense) to 7.65percent for the June 30, 2015, measurement date.

City of West Covina Required Supplementary Information Schedule of Plan Contributions CalPERS Pension Plan - Safety Last Ten Years*
-127-
Fiscal Year2014-15
Fiscal Year2015-16
Actuarially Determined Contribution 7,346,562$ 7,339,064$ Contributions in Relation to the Actuarially Determined Contribution (7,346,562) (7,339,064) Contribution Deficiency (Excess) -$ -$
Covered Payroll 13,239,430$ 16,517,686$
Contributions as a Percentage of Covered Payroll 55.49% 44.43%
Notes to Schedule:
Actuarial Cost MethodAmortization Method/PeriodAsset Valuation Method
InflationSalary IncreasesPayroll GrowthInvestment Rate of Return
Retirement Age
Mortality
2.75%
* Fiscal Year 2014-15 was the first year of implementation, therefore, only two years are presented.
The actuarial methods and assumptions used to set the actuarially determined contributions for Fiscal Year2015-16 were from the June 30, 2013, Funding Valuation Report.
Entry Age NormalFor details, see June 30, 2012, Funding Valuation Report.Actuarial Value of Assets. For details, see June 30, 2012, Funding ValuationReport.
Varies by Entry Age and Service3.00%7.65% Net of Pension Plan Investment Expenses; includes Inflation. For2014-15, 7.50% Net of Pension Plan Investment and AdministrativeExpenses; includes Inflation.
The probabilities of Retirement are based on the 2010 CalPERS ExperienceStudy for the period from 1997 to 2007.
The probabilities of mortality are based on the 2010 CalPERS ExperienceStudy for the period from 1997 to 2007. Pre-retirement and Post-retirementmortality rates include 5 years of projected mortality improvement usingScale AA published by the Society of Actuaries.

City of West Covina Required Supplementary Information Schedule of Changes in Net Pension Liability and Related Ratios CalPERS Pension Plan- EPMC Replacement Supplemental Retirement Plan Last Ten Years*
-128-
Measurement Period 2013-14 2014-15
TOTAL PENSION LIABILITYService Cost 36,000$ 36,000$ Interest 36,000 28,000 Difference Between Expected and Actual Experience - (72,000) Changes of Assumptions - 200,000 Changes in benefits - - Benefit Payments, Including Refunds of Employee Contributions (64,000) (9,000) Net Change in Total Pension Liability 8,000 183,000 Total Pension Liability - Beginning 755,000 763,000 Total Pension Liability - Ending (a) 763,000$ 946,000$
PLAN FIDUCIARY NET POSITIONContributions - Employer 65,000$ 56,000$ Contributions - Employee - - Net Investment Income1 12,000 3,000 Benefit Payments, Including Refunds of Employee Contributions (64,000) (9,000) Plan to Plan Resource Movement - - Administrative Expense (3,000) (7,000) Net Change in Fiduciary Net Position 10,000 43,000 Plan Fiduciary Net Position - Beginning 109,000 119,000 Plan Fiduciary Net Position - Ending (b) 119,000$ 162,000$
Plan Net Pension Liability - Ending (a) - (b) 644,000$ 784,000$
Plan Fiduciary Net Position as a Percentage of the Total Pension Liability 15.60% 17.12%
Covered Payroll 10,877,169$ 9,374,923$
Plan Net Pension Liability as a Percentage of Covered Payroll 5.92% 8.36%
1 Net of administrative expenses.
Notes to Schedule:
* Measurement date June 30, 2014, (fiscal year 2014-15) was the first year of implementation, therefore, only two yearsare presented.
Changes in Benefit Terms: The figures above do not include any liability impact that may have resulted from plan changeswhich occurred after June 30, 2014. This applies for voluntary benefit changes as well as any offers of Two YearsAdditional Service Credit (a.k.a. Golden Handshakes).
Changes in Assumptions: The discount rate was changed from 7.5 percent (net of administrative expense) to 7.65percent for the June 30, 2015, measurement date.

City of West Covina Required Supplementary Information Schedule of Plan Contributions CalPERS Pension Plan- EPMC Replacement Supplemental Retirement Plan Last Ten Years*
-129-
Fiscal Year2014-15
Fiscal Year2015-16
Actuarially Determined Contribution 112,000$ 82,000$ Contributions in Relation to the Actuarially Determined Contribution (56,000) (56,000) Contribution Deficiency (Excess) 56,000$ 26,000$
Covered Payroll 10,877,169$ 9,374,923$
Contributions as a Percentage of Covered Payroll 1.03% 0.87%
Notes to Schedule:
Actuarial Cost MethodAmortization Method/PeriodAsset Valuation Method
InflationSalary IncreasesPayroll GrowthInvestment Rate of Return
Retirement Age
Mortality
2.75%
* Fiscal Year 2014-15 was the first year of implementation, therefore, only two years are presented.
The actuarial methods and assumptions used to set the actuarially determined contributions for Fiscal Year2015-16 were from the June 30, 2013, Funding Valuation Report.
Entry Age NormalFor details, see June 30, 2012, Funding Valuation Report.Actuarial Value of Assets. For details, see June 30, 2012, Funding ValuationReport.
Varies by Entry Age and Service3.00%7.65% Net of Pension Plan Investment Expenses; includes Inflation. For2014-15, 7.50% Net of Pension Plan Investment and AdministrativeExpenses; includes Inflation.
The probabilities of Retirement are based on the 2010 CalPERS ExperienceStudy for the period from 1997 to 2007.
The probabilities of mortality are based on the 2010 CalPERS ExperienceStudy for the period from 1997 to 2007. Pre-retirement and Post-retirementmortality rates include 5 years of projected mortality improvement usingScale AA published by the Society of Actuaries.

City of West Covina Required Supplementary Information Schedule of Changes in Net Pension Liability and Related Ratios CalPERS Pension Plan - Supplemental Retirement Plan for Executive Staff Last Ten Years*
-130-
Measurement Period 2013-14 2014-15
TOTAL PENSION LIABILITYService Cost 112,000$ 116,000$ Interest 168,000 178,000 Difference Between Expected and Actual Experience - (643,000) Changes of Assumptions - 346,000 Changes in benefits - - Benefit Payments, Including Refunds of Employee Contributions (82,000) (104,000) Net Change in Total Pension Liability 198,000 (107,000) Total Pension Liability - Beginning 2,959,000 3,157,000 Total Pension Liability - Ending (a) 3,157,000$ 3,050,000$
PLAN FIDUCIARY NET POSITIONContributions - Employer 59,000$ 78,000$ Contributions - Employee - - Net Investment Income1 75,000 13,000 Benefit Payments, Including Refunds of Employee Contributions (82,000) (104,000) Plan to Plan Resource Movement - - Administrative Expense (6,000) (6,000) Net Change in Fiduciary Net Position 46,000 (19,000) Plan Fiduciary Net Position - Beginning 660,000 706,000 Plan Fiduciary Net Position - Ending (b) 706,000$ 687,000$
Plan Net Pension Liability - Ending (a) - (b) 2,451,000$ 2,363,000$
Plan Fiduciary Net Position as a Percentage of the Total Pension Liability 22.36% 22.52%
Covered Payroll -$ -$
Plan Net Pension Liability as a Percentage of Covered Payroll 0.00% 0.00%
1 Net of administrative expenses.
Notes to Schedule:
* Measurement date June 30, 2014, (fiscal year 2014-15) was the first year of implementation, therefore, only two years arepresented.
Changes in Benefit Terms: The figures above do not include any liability impact that may have resulted from plan changeswhich occurred after June 30, 2014. This applies for voluntary benefit changes as well as any offers of Two Years AdditionalService Credit (a.k.a. Golden Handshakes).
Changes in Assumptions: The discount rate was changed from 7.5 percent (net of administrative expense) to 7.65 percentfor the June 30, 2015, measurement date.

City of West Covina Required Supplementary Information Schedule of Plan Contributions CalPERS Pension Plan - Supplemental Retirement Plan for Executive Staff Last Ten Years*
-131-
Fiscal Year2014-15
Fiscal Year2015-16
Actuarially Determined Contribution 383,000$ 439,000$ Contributions in Relation to the Actuarially Determined Contribution (78,000) (78,000) Contribution Deficiency (Excess) 305,000$ 361,000$
Covered Payroll -$ -$
Contributions as a Percentage of Covered Payroll 0.00% 0.00%
Notes to Schedule:
Actuarial Cost MethodAmortization Method/PeriodAsset Valuation Method
InflationSalary IncreasesPayroll GrowthInvestment Rate of Return
Retirement Age
Mortality
2.75%
* Fiscal Year 2014-15 was the first year of implementation, therefore, only two years are presented.
The actuarial methods and assumptions used to set the actuarially determined contributions for Fiscal Year2015-16 were from the June 30, 2013, Funding Valuation Report.
Entry Age NormalFor details, see June 30, 2012, Funding Valuation Report.Actuarial Value of Assets. For details, see June 30, 2012, Funding ValuationReport.
Varies by Entry Age and Service3.00%7.65% Net of Pension Plan Investment Expenses; includes Inflation. For2014-15, 7.50% Net of Pension Plan Investment and AdministrativeExpenses; includes Inflation.
The probabilities of Retirement are based on the 2010 CalPERS ExperienceStudy for the period from 1997 to 2007.
The probabilities of mortality are based on the 2010 CalPERS ExperienceStudy for the period from 1997 to 2007. Pre-retirement and Post-retirementmortality rates include 5 years of projected mortality improvement usingScale AA published by the Society of Actuaries.

City of West Covina Required Supplementary Information Schedule of Funding Progress Other Post-Employment Benefits For the Year Ended June 30, 2016 (Amounts Expressed in Thousands)
-132-
Actuarial ActuarialValue Accrued Unfunded UAAL as a
Actuarial of Assets Liability AAL Funded Covered % ofValuation (AVA) (AAL) (UAAL) Ratio Payroll Payroll
Date (a) (b) (b) - (a) (a)/(b) (c) [(b)-(a)]/c]6/30/2011 -$ 68,782$ 68,782$ 0.00% 29,420$ 233.79%6/30/2013 - 65,190 65,190 0.00% 25,620 254.45%6/30/2015 - 55,763 55,763 0.00% 25,692 217.04%
OTHER POST-EMPLOYMENT BENEFIT PLAN

City of West Covina Required Supplementary Information General Fund
-133-
General Fund The General Fund is the City’s primary operating fund. It accounts for all financial resources of the City, except those required to be accounted for in another fund.

City of West Covina Schedule of Revenues, Expenditures, and Changes in Fund Balance - Budget and Actual General Fund For the Year Ended June 30, 2016
-134-
Variance withFinal Budget
PositiveOriginal Final Actual (Negative)
REVENUES Taxes 45,682,675$ 46,472,675$ 47,452,961$ 980,286$
Licenses and permits 1,185,000 1,185,000 1,156,613 (28,387) Fines and forfeitures 913,000 913,000 796,989 (116,011) Investment income 150,000 150,000 (569,996) (719,996) Rental income 460,000 460,000 529,833 69,833 Revenue from other agencies 1,464,000 1,464,000 1,566,549 102,549 Charges for services 5,698,510 5,766,438 7,032,594 1,266,156 Other revenues 183,000 183,000 167,787 (15,213)
Total revenues 55,736,185 56,594,113 58,133,330 1,539,217
EXPENDITURESCurrent:
General government 5,159,556 5,240,679 4,710,142 530,537 Public safety 44,917,214 45,730,542 47,120,170 (1,389,628) Public works 4,897,057 5,216,408 5,081,608 134,800 Community services 2,241,666 2,251,048 2,012,171 238,877 Community development 572,599 588,828 538,680 50,148
Debt service:Principal 75,500 69,479 69,450 29 Interest and fiscal charges - 6,021 6,021 -
Total expenditures 57,863,592 59,103,005 59,538,242 (435,237)
Deficiency of revenues underexpenditures (2,127,407) (2,508,892) (1,404,912) 1,103,980
OTHER FINANCING SOURCES (USES)Acquisition under capital leases 2,568,446 2,568,446 2,568,446 - Transfers in 1,581,775 3,198,182 2,341,924 (856,258) Transfers out (1,887,000) (9,755,021) (8,523,516) 1,231,505
Total other financingsources (uses) 2,263,221 (3,988,393) (3,613,146) 375,247
Net change in fund balance 135,814 (6,497,285) (5,018,058) 1,479,227
Fund balance, beginning of year, as restated 27,180,447 27,180,447 27,180,447 -
Fund balance, end of year 27,316,261$ 20,683,162$ 22,162,389$ 1,479,227$
Budgeted Amounts
City of West Covina Required Supplementary Information Major Special Revenue Funds
-135-
West Covina Housing Authority Special Revenue Fund
The West Covina Housing Authority Special Revenue Fund is used to account for assets and related income received from the former Community Development Commission to be used for the administration of providing affordable housing in the City.
Grants Special Revenue Fund
The Grants Special Revenue Fund accounts for various Federal, State of California, and local grants that are restricted to expenditures for specific programs and projects.

City of West Covina Schedule of Revenues, Expenditures, and Changes in Fund Balance - Budget and Actual West Covina Housing Authority Special Revenue Fund For the Year Ended June 30, 2016
-136-
Variance withFinal Budget
PositiveOriginal Final Actual (Negative)
REVENUESInvestment Income -$ -$ 368,011$ 368,011$ Other revenues 18,000 18,000 100,000 82,000
Total revenues 18,000 18,000 468,011 450,011
EXPENDITURESCurrent:
General government 777,058 581,605 391,618 189,987
Total expenditures 777,058 581,605 391,618 189,987
Net change in fund balance (759,058) (563,605) 76,393 639,998
Fund balance, beginning of year 24,369,821 24,369,821 24,369,821 -
Fund balance, end of year 23,610,763$ 23,806,216$ 24,446,214$ 639,998$
Budgeted Amounts

City of West Covina Schedule of Revenues, Expenditures, and Changes in Fund Balance - Budget and Actual Grants Special Revenue Fund For the Year Ended June 30, 2016
-137-
Variance withFinal Budget
PositiveOriginal Final Actual (Negative)
REVENUES Investment income -$ -$ 1,486$ 1,486$
Revenue from other agencies 233,309 1,367,816 273,497 (1,094,319) Charges for services 71,810 71,810 54,715 (17,095) Other revenues 160,000 160,000 162,247 2,247
Total revenues 465,119 1,599,626 491,945 (1,107,681)
EXPENDITURESCurrent:
Public safety - 30,103 29,272 831 Public works 102,602 816,609 665,980 150,629 Community services 297,583 297,761 243,132 54,629
Total expenditures 400,185 1,144,473 938,384 206,089
Excess (deficiency) of revenues over (under) expenditures 64,934 455,153 (446,439) (901,592)
OTHER FINANCING SOURCESTransfers in - 3,787 570 (3,217)
Total other financing sources - 3,787 570 (3,217)
Net change in fund balance 64,934 458,940 (445,869) (904,809)
Fund balance (deficit), beginning of year, as restated (403,526) (403,526) (403,526) -
Fund balance (deficit), end of year (338,592)$ 55,414$ (849,395)$ (904,809)$
Budgeted Amounts

City of West Covina Notes to Required Supplementary Information June 30, 2016
-138-
1) BUDGETARY INFORMATION
The annual budget adopted by the City Council provides for the general operation of the City. The annual budget is adopted in summary by the City Council in June of each year for the General, special revenue, debt service funds and capital projects funds with the exception of the Development Impact Fees Capital Projects Fund. The resolution sets a combined appropriation of the funds for the operation of the City. The City Manager is authorized to transfer budgeted amounts between departments to ensure adequate and proper standards of service. Budgetary revisions, including supplemental appropriations which increase appropriations in individual funds, must be approved by the City Council. The budgetary level of control is at the fund level. The budgeted figures used in the financial statements’ budget to actual comparisons are the final amended amounts. The budget is formally integrated into the accounting system and employed as a management control device during the year for the General Fund, special revenue funds, debt service funds and capital projects funds. Budgets for governmental fund types are adopted on a basis consistent with generally accepted accounting principles. Operating appropriations lapse at the end of the fiscal year. Capital projects funds are appropriated on a project basis and appropriations are funded by the council to continue until the specific projects are completed.
2) EXPENDITURES IN EXCESS OF APPROPRIATIONS
FinalGovernmental Funds Budget Expenditures ExcessMajor Fund - General Fund 59,103,005$ 59,538,242$ 435,237$ Non-Major Special Revenue Funds:
Drug Enforcement Rebate 1,718,445 1,720,932 2,487 Transportation Development Act 75,847 76,070 223
Non-Major Capital Projects Fund:Construction Tax 235,297 236,236 939

-139-
SUPPLEMENTARY INFORMATION

City of West Covina Major Debt Service Fund
-140-
DEBT SERVICE FUNDS are used to account for the accumulation of resources for, and the payment of, governmental long-term debt principal and interest. City Debt Service – This fund accounts for the payment of principal, interest, and related costs on the City’s long-term issues.

City of West Covina Schedule of Revenues, Expenditures, and Changes in Fund Balance - Budget and Actual Major Fund City Debt Service Fund For the Year Ended June 30, 2016
-141-
Variance with
Final BudgetPositive
Original Final Actual (Negative)REVENUES
Investment income -$ -$ (513,461)$ (513,461)$ Revenue from other agencies - 1,193,805 1,200,805 7,000 Charges for services 975,415 975,415 497,368 (478,047)
Total revenues 975,415 2,169,220 1,184,712 (984,508)
EXPENDITURESDebt service:
Principal 1,980,329 2,559,247 1,958,011 601,236 Interest and fiscal charges 1,542,165 1,542,165 1,568,732 (26,567)
Total expenditures 3,522,494 4,101,412 3,526,743 574,669
Deficiency of revenues underexpenditures (2,547,079) (1,932,192) (2,342,031) (409,839)
OTHER FINANCING SOURCESTransfers in 1,747,000 2,325,918 2,184,676 (141,242)
Net change in fund balance (800,079) 393,726 (157,355) (551,081)
Fund balance, beginning of year 13,169,081 13,169,081 13,169,081 -
Fund balance, end of year 12,369,002$ 13,562,807$ 13,011,726$ (551,081)$
Budgeted Amounts

City of West Covina Non-Major Governmental Funds
-142-
SPECIAL REVENUE FUNDS are used to account for specific revenues that are legally restricted to expenditure for particular purposes. CAPITAL PROJECTS FUNDS are used to account for the purchase or construction of major capital facilities which are not financed by Proprietary Funds. Capital Projects Funds are ordinarily not used to account for the acquisition of furniture, fixtures, machinery, equipment and other relatively minor or comparatively short-lived capital assets.

City of West Covina Combining Balance Sheet Non-Major Governmental Funds June 30, 2016
-143-
TotalSpecial Capital Non-MajorRevenue Projects Governmental
Funds Funds Funds
Cash and investments 20,465,067$ 5,420,364$ 25,885,431$ Receivables, net:
Taxes 238,242 - 238,242 Interest 12,589 3,178 15,767 Other 49,466 - 49,466
Due from other agencies 1,210,945 35,000 1,245,945 Prepaid expenses 12,351 - 12,351
Total assets 21,988,660$ 5,458,542$ 27,447,202$
RESOURCES, AND FUND BALANCES
Accounts payable 773,023$ 333,797$ 1,106,820$ Other accrued liabilities 132,190 24,680 156,870 Due to other funds 690,548 - 690,548 Advances from other funds 523,582 - 523,582 Due to other governments 8,025 - 8,025 Unearned revenue 38,690 - 38,690
Total liabilities 2,166,058 358,477 2,524,535
Unavailable revenue 217,908 35,000 252,908
Nonspendable 12,351 - 12,351 Restricted: Community services 2,179,015 - 2,179,015
Public safety 5,941,231 - 5,941,231 Public works 11,677,696 - 11,677,696
Assigned - 5,065,065 5,065,065 Unassigned (205,599) - (205,599)
Total fund balances 19,604,694 5,065,065 24,669,759
Total liabilities, deferred inflows of resources,and fund balances 21,988,660$ 5,458,542$ 27,447,202$
LIABILITIES, DEFERRED INFLOWS OF
Deferred inflows of resources:
Fund Balances:
ASSETS
Liabilities:

City of West Covina Combining Statement of Revenues, Expenditures, and Changes in Fund Balance Non-Major Governmental Funds For the Year Ended June 30, 2016
-144-
TotalSpecial Capital Non-Major
Revenue Projects GovernmentalFunds Funds Funds
REVENUESTaxes 6,594,788$ 189,900$ 6,784,688$ Special assessments 5,550,657 - 5,550,657 Investment income 112,275 31,553 143,828 Revenue from other agencies 7,977,860 200,000 8,177,860 Charges for services 133,559 13,000 146,559 Other revenues 458,889 598,180 1,057,069
Total revenues 20,828,028 1,032,633 21,860,661
EXPENDITURESCurrent:
General government 2,054 - 2,054 Public safety 3,642,530 170,911 3,813,441 Public works 9,525,443 236,236 9,761,679 Community services 3,913,872 695,005 4,608,877 Community development 360,034 - 360,034
Total expenditures 17,443,933 1,102,152 18,546,085
Excess (deficiency) of revenues over (under) expenditures 3,384,095 (69,519) 3,314,576
OTHER FINANCING SOURCES (USES)Transfers in 99,977 203,891 303,868 Transfers out (2,288,780) - (2,288,780)
Total other financing sources (uses) (2,188,803) 203,891 (1,984,912)
Net change in fund balance 1,195,292 134,372 1,329,664
Fund balances, beginning of year, as restated 18,409,402 4,930,693 23,340,095
Fund balances, end of year 19,604,694$ 5,065,065$ 24,669,759$

City of West Covina Non-Major Governmental Funds – Special Revenue Funds
-145-
SPECIAL REVENUE FUNDS are used to account for specific revenues that are legally restricted to expenditure for particular purposes. Drug Enforcement Rebate - This fund accounts for the City’s portion of revenue received from drug asset seizures. The revenue is used to enhance the police programs. Business Improvement Tax - This fund accounts for business improvement taxes which are restricted to economic development activities. Air Quality Improvement - This fund accounts for the City’s portion of motor vehicle registration fees collected under AB 2766. This fee was levied to fund programs to reduce air pollution from mobile sources such as cars, trucks and buses. Money is distributed to the cities based on population, and additional discretionary grants are made based on specific requests. Proposition A - This fund accounts for the 0.5% sales tax collected in Los Angeles County which is used for transportation programs and projects. Proposition C - This fund accounts for gasoline taxes which are restricted for transportation programs and projects. State Gas Tax - This fund accounts for the City’s proportionate share of gas tax monies collected by the State of California and Proposition 1B monies which are used for street construction and maintenance. Police Donations - This fund accounts for donations received and expenditures related to various police programs. Transportation Development Act - This fund accounts for regional Transportation Development Act funds received from Los Angeles County which are used for local streets and roads. AB939 - This fund accounts for programs to reduce solid waste deposits in local landfills, pursuant to AB939. Public Safety Augmentation - This fund accounts for sales tax revenue legally restricted for public safety. Revenue is used to augment police operations. COPS/SLESA - This fund accounts for revenue from the State restricted for supplementing police operations.

City of West Covina Non-Major Governmental Funds – Special Revenue Funds, (continued)
-146-
Charter PEG - This fund accounts for monies received from the City’s cable television franchisee for a one-time litigation settlement and for cable-related capital expenditures. Art in Public Places - This fund accounts for development fees paid in lieu of acquisition and installation of approved artwork in a development with expenditures restricted to acquisition, installation, maintenance and repair of artworks at approved sites. Measure R - This fund accounts for sales tax revenues collected in Los Angeles County to provide transportation related projects and programs. Integrated Waste Management - This fund accounts for landfill local enforcement agency activities and waste management programs, other than AB939. West Covina Community Services Foundation - This fund accounts for activity of the West Covina Community Services Foundation, a 501(c)(3) nonprofit organization. Community Development Block Grant (CDBG) - This fund accounts for the activities of the Community Development Block Grant received from the U.S. Department of Housing and Urban Development. SAFER Grant - This fund accounts for personnel costs that are reimbursable through the Staffing for Adequate Fire and Emergency Response (SAFER) Grant. Maintenance District #1 - The City levies special benefit assessments and property taxes upon property within defined districts. Through the Los Angeles County Tax Collector, assessments are placed on the property owner’s annual tax bill. These funds are used to maintain and improve the open spaces within the districts by providing landscape maintenance. Maintenance District #2 - The City levies special benefit assessments and property taxes upon property within defined districts. Through the Los Angeles County Tax Collector, assessments are placed on the property owner’s annual tax bill. These funds are used to maintain and improve the open spaces within the districts by providing landscape maintenance. Coastal Sage Shrub – This community facilities district was formed to provide for the restoration and ongoing maintenance of sensitive environmental habitat within the development area of a former landfill, including habitat for endangered species such as the California gnatcatcher (Polioptila californica). Maintenance District #4 - The City levies special benefit assessments and property taxes upon property within defined districts. Through the Los Angeles County Tax Collector, assessments are placed on the property owner’s annual tax bill. These funds are used to maintain and improve the open spaces within the districts by providing landscape maintenance.

City of West Covina Non-Major Governmental Funds – Special Revenue Funds, (continued)
-147-
Maintenance District #6 - The City levies special benefit assessments and property taxes upon property within defined districts. Through the Los Angeles County Tax Collector, assessments are placed on the property owner’s annual tax bill. These funds are used to maintain and improve the open spaces within the districts by providing landscape maintenance. Maintenance District #7 - The City levies special benefit assessments and property taxes upon property within defined districts. Through the Los Angeles County Tax Collector, assessments are placed on the property owner’s annual tax bill. These funds are used to maintain and improve the open spaces within the districts by providing landscape maintenance. Citywide Maintenance District - Revenue for the fund comes from annual special benefit assessments from property owners who benefit from covered improvements. This fund provides the majority of funding for the City’s street lighting system and street tree program. Sewer Maintenance - This fund supports the City’s street sweeping program and maintenance of the City’s sewer system. The City also provides services to the City of Covina through this fund. Auto Plaza Improvement District - This fund is an assessment district supported by six of West Covina’s automobile dealers to fund the construction, maintenance and operations of a reader board adjacent to Interstate 10.

City of West Covina Combining Balance Sheet Non-Major Special Revenue Funds June 30, 2016
-148-
Drug Business AirEnforcement Improvement Quality Proposition
Rebate Tax Improvement A
Cash and investments 5,511,420$ 6,266$ 572,566$ 486,864$ Receivables, net:
Taxes - - - - Interest 3,391 4 352 300 Other - - - -
Due from other agencies - - 42,537 - Prepaid expenses - - - -
Total assets 5,514,811$ 6,270$ 615,455$ 487,164$
RESOURCES, AND FUND BALANCESLiabilities:
Accounts payable 179,392$ 6,270$ 4,621$ 1,880$ Other accrued liabilities 646 - - - Due to other funds - - - - Advances from other funds - - - - Due to other governments - - - - Unearned revenue - - - -
Total liabilities 180,038 6,270 4,621 1,880
Unavailable revenue - - 5,448 -
Nonspendable - - - - Restricted:
Community services - - - 485,284 Public safety 5,334,773 - - - Public works - - 605,386 -
Unassigned - - - -
Total fund balances (deficit) 5,334,773 - 605,386 485,284
Total liabilities, deferred inflows of resources,and fund balances 5,514,811$ 6,270$ 615,455$ 487,164$
Fund Balances (Deficit):
Deferred Inflows of Resources:
LIABILITIES, DEFERRED INFLOWS OF
ASSETS

-149-
State Transportation Public Proposition Gas Police Development Safety
C Tax Donations Act AB939 Augmentation COPS/SLESA
1,184,422$ 274,660$ 29,660$ -$ 333,416$ 154,504$ 316,094$
- - - - - 126,295 6,304 727 197 14 - 200 95 194 - - - - 44,585 - - - 135,128 - 86,389 - - - - - - - - - -
1,185,149$ 409,985$ 29,674$ 86,389$ 378,201$ 280,894$ 322,592$
139,838$ 25,121$ -$ -$ 480$ -$ 22,687$ 5,526 30,652 - 3,660 2,344 - 4,015
- - - 74,704 - - - - - - - - - - - - - 8,025 - - - - - - - - - -
145,364 55,773 - 86,389 2,824 - 26,702
- - - - - - -
- - - - - - -
1,039,785 - - - - - - - - 29,674 - - 280,894 295,890 - 354,212 - - 375,377 - - - - - - - - -
1,039,785 354,212 29,674 - 375,377 280,894 295,890
1,185,149$ 409,985$ 29,674$ 86,389$ 378,201$ 280,894$ 322,592$

City of West Covina Combining Balance Sheet Non-Major Special Revenue Funds June 30, 2016
-150-
Art in Integrated Charter Public Measure Waste
PEG Places R Management
Cash and investments 278,142$ 89,784$ 922,540$ 76,528$ Receivables, net:
Taxes - - - 18,403 Interest 171 55 567 - Other - - - -
Due from other agencies - - - - Prepaid expenses - - - -
Total assets 278,313$ 89,839$ 923,107$ 94,931$
RESOURCES, AND FUND BALANCESLiabilities:
Accounts payable -$ 5,756$ 66,340$ 1,011$ Other accrued liabilities - 2,647 940 617 Due to other funds - - - - Advances from other funds - - - - Due to other governments - - - - Unearned revenue - - - -
Total liabilities - 8,403 67,280 1,628
Unavailable revenue - - - -
Nonspendable - - - - Restricted:
Community services 278,313 81,436 - - Public safety - - - - Public works - - 855,827 93,303
Unassigned - - - -
Total fund balances (deficit) 278,313 81,436 855,827 93,303
Total liabilities, deferred inflows of resources, and fund balances 278,313$ 89,839$ 923,107$ 94,931$
Deferred Inflows of Resources:
Fund Balances (Deficit):
ASSETS
LIABILITIES, DEFERRED INFLOWS OF

-151-
West CovinaCommunity Community
Services Development SAFER Maintenance Maintenance Coastal Sage Maintenance Foundation Block Grant Grant District #1 District #2 Shrub District #4
117,051$ -$ -$ 1,780,805$ 619,426$ 261,849$ 2,399,142$
- - - 10,493 29 98 11,550 72 - - 1,096 381 161 1,477
4,881 - - - - - - - 315,859 631,032 - - - -
12,351 - - - - - -
134,355$ 315,859$ 631,032$ 1,792,394$ 619,836$ 262,108$ 2,412,169$
6,030$ 49,186$ -$ 31,350$ 33,980$ 10,436$ 50,002$ - 31,138 26,949 997 604 226 1,503 - 11,069 604,775 - - - - - - - - - - - - - - - - - - - 38,690 - - - - -
6,030 130,083 631,724 32,347 34,584 10,662 51,505
- 7,553 204,907 - - - -
12,351 - - - - - -
115,974 178,223 - - - - - - - - - - - - - - - 1,760,047 585,252 251,446 2,360,664 - - (205,599) - - - -
128,325 178,223 (205,599) 1,760,047 585,252 251,446 2,360,664
134,355$ 315,859$ 631,032$ 1,792,394$ 619,836$ 262,108$ 2,412,169$

City of West Covina Combining Balance Sheet Non-Major Special Revenue Funds June 30, 2016
-152-
CitywideMaintenance Maintenance Maintenance
District #6 District #7 District
Cash and investments 383,093$ 378,358$ 915,053$ Receivables, net:
Taxes 1,960 2,685 20,758 Interest 236 233 567 Other - - -
Due from other agencies - - - Prepaid expenses - - -
Total assets 385,289$ 381,276$ 936,378$
RESOURCES, AND FUND BALANCESLiabilities:
Accounts payable 18,616$ 9,823$ 77,632$ Other accrued liabilities 644 630 1,624 Due to other funds - - - Advances from other funds - - - Due to other governments - - - Unearned revenue - - -
Total liabilities 19,260 10,453 79,256
Unavailable revenue - - -
Nonspendable - - - Restricted:
Community services - - - Public safety - - - Public works 366,029 370,823 857,122
Unassigned - - -
Total fund balances (deficit) 366,029 370,823 857,122
Total liabilities, deferred inflows of resources,and fund balances 385,289$ 381,276$ 936,378$
Deferred Inflows of Resources:
Fund Balances (Deficit):
ASSETS
LIABILITIES, DEFERRED INFLOWS OF
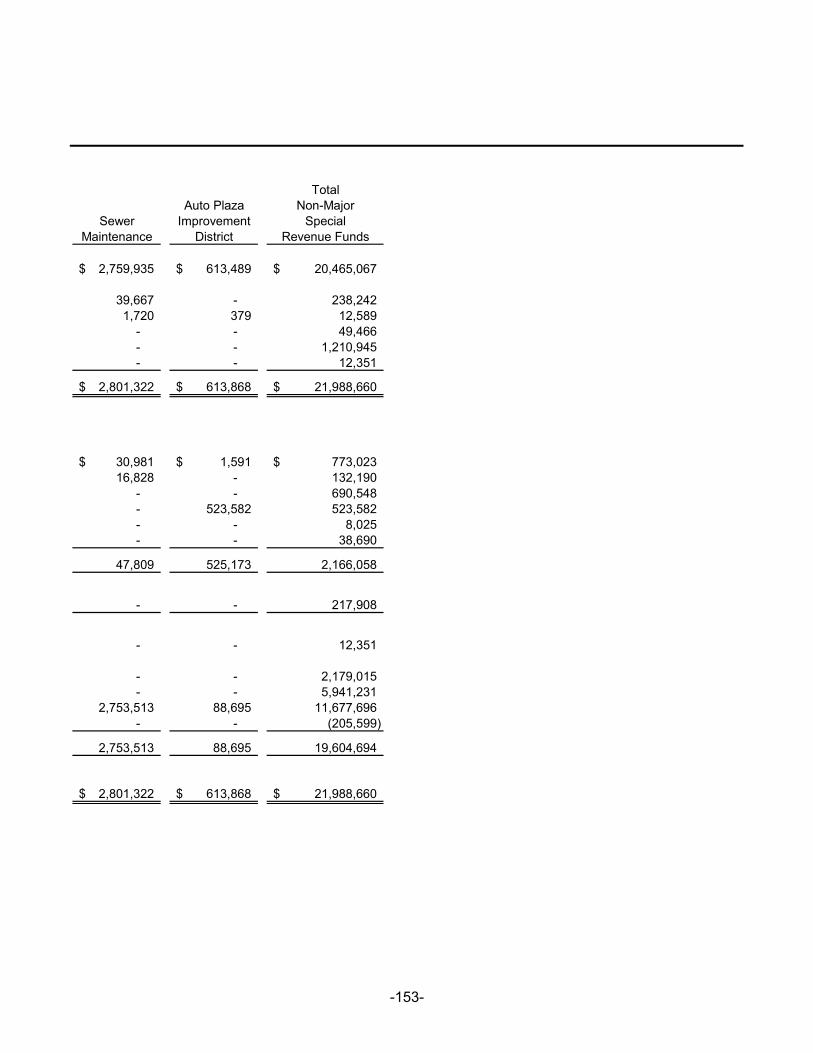
-153-
TotalAuto Plaza Non-Major
Sewer Improvement SpecialMaintenance District Revenue Funds
2,759,935$ 613,489$ 20,465,067$
39,667 - 238,242 1,720 379 12,589
- - 49,466 - - 1,210,945 - - 12,351
2,801,322$ 613,868$ 21,988,660$
30,981$ 1,591$ 773,023$ 16,828 - 132,190
- - 690,548 - 523,582 523,582 - - 8,025 - - 38,690
47,809 525,173 2,166,058
- - 217,908
- - 12,351
- - 2,179,015 - - 5,941,231
2,753,513 88,695 11,677,696 - - (205,599)
2,753,513 88,695 19,604,694
2,801,322$ 613,868$ 21,988,660$

City of West Covina Combining Statement of Revenues, Expenditures, and Changes in Fund Balance Non-Major Special Revenue Funds For the Year Ended June 30, 2016
-154-
Drug Business AirEnforcement Improvement Quality Proposition
Rebate Tax Improvement AREVENUES
Taxes -$ -$ -$ 1,946,323$ Special assessments - - - - Investment income 32,281 - 3,246 1,393 Revenue from other agencies 2,343,769 - 138,114 100,420 Charges for services 56,608 - - - Other revenues - - - 3,224
Total revenues 2,432,658 - 141,360 2,051,360
EXPENDITURESCurrent:
General government - - - - Public safety 1,720,932 - - - Public works - - 47,827 - Community services - 6,293 - 2,172,123 Community development - - - -
Total expenditures 1,720,932 6,293 47,827 2,172,123
Excess of revenues over (under) expenditures 711,726 (6,293) 93,533 (120,763)
OTHER FINANCING SOURCES (USES)Transfers in - - - - Transfers out - - - -
Total other financing sources (uses) - - - -
Net change in fund balances 711,726 (6,293) 93,533 (120,763)
Fund balances (deficit), beginning of year, as restated 4,623,047 6,293 511,853 606,047
Fund balances (deficit), end of year 5,334,773$ -$ 605,386$ 485,284$

-155-
State Transportation Public Proposition Gas Police Development Safety
C Tax Donations Act AB939 Augmentation COPS/SLESA
1,617,352$ -$ -$ -$ -$ 709,173$ -$ - - - - - - -
6,156 2,578 183 - 1,943 1,538 1,911 - 2,050,061 1,600 78,365 - - 194,333 - 1,961 - - 1,376 - - - - 3,107 - 178,417 - -
1,623,508 2,054,600 4,890 78,365 181,736 710,711 196,244
- 2,054 - - - - - - - 5,593 - - - 207,011
275,593 2,192,892 - 76,070 138,083 - - 854,722 - - - - - - 135,355 - - - - - -
1,265,670 2,194,946 5,593 76,070 138,083 - 207,011
357,838 (140,346) (703) 2,295 43,653 710,711 (10,767)
1,200 25,000 - - - - - - (720,000) - - - (709,173) -
1,200 (695,000) - - - (709,173) -
359,038 (835,346) (703) 2,295 43,653 1,538 (10,767)
680,747 1,189,558 30,377 (2,295) 331,724 279,356 306,657
1,039,785$ 354,212$ 29,674$ -$ 375,377$ 280,894$ 295,890$

City of West Covina Combining Statement of Revenues, Expenditures, and Changes in Fund Balance Non-Major Special Revenue Funds For the Year Ended June 30, 2016
-156-
Art in IntegratedCharter Public Waste
PEG Places Measure R ManagementREVENUES
Taxes -$ -$ 1,211,550$ -$ Special assessments - - - - Investment income 1,686 1,720 6,062 - Revenue from other agencies - - - - Charges for services - - - 73,614 Other revenues - 51,019 - -
Total revenues 1,686 52,739 1,217,612 73,614
EXPENDITURESCurrent:
General government - - - - Public safety - - - - Public works - - 489,648 68,124 Community services - - 589,846 - Community development - 177,630 - -
Total expenditures - 177,630 1,079,494 68,124
Excess of revenues over (under) expenditures 1,686 (124,891) 138,118 5,490
OTHER FINANCING SOURCES (USES)Transfers in - - - - Transfers out - - - -
Total other financing sources (uses) - - - -
Net change in fund balances 1,686 (124,891) 138,118 5,490
Fund balances (deficit), beginning of year, as restated 276,627 206,327 717,709 87,813
Fund balances (deficit), end of year 278,313$ 81,436$ 855,827$ 93,303$

-157-
West CovinaCommunity Community
Services Development SAFER Maintenance Maintenance Coastal Sage Maintenance Foundation Block Grant Grant District #1 District #2 Shrub District #4
-$ -$ -$ 487,045$ 155,443$ 180,712$ -$ - - - - - - 1,045,001 937 - - 10,106 3,594 1,308 13,581 - 1,417,556 1,618,182 - - - - - - - - - - -
137,006 86,116 - - - - -
137,943 1,503,672 1,618,182 497,151 159,037 182,020 1,058,582
- - - - - - - 5,509 61,992 1,633,292 - - - -
- 1,203,119 - 335,273 144,536 86,806 904,520 92,569 198,319 - - - - -
- - - - - - -
98,078 1,463,430 1,633,292 335,273 144,536 86,806 904,520
39,865 40,242 (15,110) 161,878 14,501 95,214 154,062
- - - 1,501 - - 9,000 (50,000) - - (2,594) (10,200) - (3,580)
(50,000) - - (1,093) (10,200) - 5,420
(10,135) 40,242 (15,110) 160,785 4,301 95,214 159,482
138,460 137,981 (190,489) 1,599,262 580,951 156,232 2,201,182
128,325$ 178,223$ (205,599)$ 1,760,047$ 585,252$ 251,446$ 2,360,664$

City of West Covina Combining Statement of Revenues, Expenditures, and Changes in Fund Balance Non-Major Special Revenue Funds For the Year Ended June 30, 2016
-158-
CitywideMaintenance Maintenance Maintenance
District #6 District #7 DistrictREVENUES
Taxes -$ -$ -$ Special assessments 154,999 146,024 1,590,345 Investment income 2,173 2,349 4,403 Revenue from other agencies - - - Charges for services - - - Other revenues - - -
Total revenues 157,172 148,373 1,594,748
EXPENDITURESCurrent:
General government - - - Public safety 8,100 - - Public works 131,749 180,365 1,522,209 Community services - - - Community development - - -
Total expenditures 139,849 180,365 1,522,209
Excess of revenues over (under) expenditures 17,323 (31,992) 72,539
OTHER FINANCING SOURCES (USES)Transfers in - - 13,130 Transfers out (3,570) (3,580) -
Total other financing sources (uses) (3,570) (3,580) 13,130
Net change in fund balances 13,753 (35,572) 85,669
Fund balances (deficit), beginning of year, as restated 352,276 406,395 771,453
Fund balances (deficit), end of year 366,029$ 370,823$ 857,122$

-159-
TotalAuto Plaza Non-Major
Sewer Improvement SpecialMaintenance District Revenue Funds
219,867$ 67,323$ 6,594,788$ 2,614,288 - 5,550,657
12,110 1,017 112,275 35,460 - 7,977,860
- - 133,559 - - 458,889
2,881,725 68,340 20,828,028
- - 2,054 101 - 3,642,530
1,728,629 - 9,525,443 - - 3,913,872 - 47,049 360,034
1,728,730 47,049 17,443,933
1,152,995 21,291 3,384,095
50,146 - 99,977 (786,083) - (2,288,780)
(735,937) - (2,188,803)
417,058 21,291 1,195,292
2,336,455 67,404 18,409,402
2,753,513$ 88,695$ 19,604,694$

City of West Covina Schedule of Revenues, Expenditures, and Changes in Fund Balance - Budget and Actual Drug Enforcement Rebate Special Revenue Fund For the Year Ended June 30, 2016
-160-
Variance withFinal Budget
PositiveOriginal Final Actual (Negative)
REVENUESInvestment income -$ -$ 32,281$ 32,281$ Revenue from other agencies 20,000 1,549,378 2,343,769 794,391 Charges for services - 56,608 56,608 -
Total revenues 20,000 1,605,986 2,432,658 826,672
EXPENDITURESCurrent:
Public safety - 1,718,445 1,720,932 (2,487)
Net change in fund balance 20,000 (112,459) 711,726 824,185
Fund balance, beginning of year 4,623,047 4,623,047 4,623,047 -
Fund balance, end of year 4,643,047$ 4,510,588$ 5,334,773$ 824,185$
Budgeted Amounts

City of West Covina Schedule of Revenues, Expenditures, and Changes in Fund Balance - Budget and Actual Business Improvement Tax Special Revenue Fund For the Year Ended June 30, 2016
-161-
Variance withFinal Budget
PositiveOriginal Final Actual (Negative)
EXPENDITURESCurrent:
Community services -$ 6,293$ 6,293$ -$
Net change in fund balance - (6,293) (6,293) -
Fund balance, beginning of year 6,293 6,293 6,293 -
Fund balance, end of year 6,293$ -$ -$ -$
Budgeted Amounts

City of West Covina Schedule of Revenues, Expenditures, and Changes in Fund Balance - Budget and Actual Air Quality Improvement Special Revenue Fund For the Year Ended June 30, 2016
-162-
Variance withFinal Budget
PositiveOriginal Final Actual (Negative)
REVENUESInvestment income -$ -$ 3,246$ 3,246$ Revenue from other agencies 134,000 134,000 138,114 4,114
Total revenues 134,000 134,000 141,360 7,360
EXPENDITURESCurrent:
Public works 54,630 60,958 47,827 13,131
Net change in fund balance 79,370 73,042 93,533 20,491
Fund balance, beginning of year 511,853 511,853 511,853 -
Fund balance, end of year 591,223$ 584,895$ 605,386$ 20,491$
Budgeted Amounts

City of West Covina Schedule of Revenues, Expenditures, and Changes in Fund Balance - Budget and Actual Proposition A Special Revenue Fund For the Year Ended June 30, 2016
-163-
Variance withFinal Budget
PositiveOriginal Final Actual (Negative)
REVENUESTaxes 1,947,120$ 1,947,120$ 1,946,323$ (797)$ Investment income - - 1,393 1,393 Revenue from other agencies 100,000 100,000 100,420 420 Other revenue - - 3,224 3,224
Total revenues 2,047,120 2,047,120 2,051,360 4,240
EXPENDITURESCurrent:
Community services 1,930,000 2,222,648 2,172,123 50,525
Net change in fund balance 117,120 (175,528) (120,763) 54,765
Fund balance, beginning of year 606,047 606,047 606,047 -
Fund balance, end of year 723,167$ 430,519$ 485,284$ 54,765$
Budgeted Amounts

City of West Covina Schedule of Revenues, Expenditures, and Changes in Fund Balance - Budget and Actual Proposition C Special Revenue Fund For the Year Ended June 30, 2016
-164-
Variance withFinal Budget
PositiveOriginal Final Actual (Negative)
REVENUESTaxes 1,615,485$ 1,615,485$ 1,617,352$ 1,867$ Investment income - - 6,156 6,156
Total revenues 1,615,485 1,615,485 1,623,508 8,023
EXPENDITURESCurrent:
Public works 394,217 346,722 275,593 71,129 Community services 918,909 945,654 854,722 90,932 Community development 158,761 158,761 135,355 23,406
Total expenditures 1,471,887 1,451,137 1,265,670 185,467
Excess of revenues overexpenditures 143,598 164,348 357,838 193,490
OTHER FINANCING SOURCES (USES)Transfers in - 1,200 1,200 -
Net change in fund balance 143,598 165,548 359,038 193,490
Fund balance, beginning of year 680,747 680,747 680,747 -
Fund balance, end of year 824,345$ 846,295$ 1,039,785$ 193,490$
Budgeted Amounts

City of West Covina Schedule of Revenues, Expenditures, and Changes in Fund Balance - Budget and Actual State Gas Tax Special Revenue Fund For the Year Ended June 30, 2016
-165-
Variance withFinal Budget
PositiveOriginal Final Actual (Negative)
REVENUESInvestment income -$ -$ 2,578$ 2,578$ Revenue from other agencies 2,386,741 2,386,741 2,050,061 (336,680) Charges for services - - 1,961 1,961
Total revenues 2,386,741 2,386,741 2,054,600 (332,141)
EXPENDITURESCurrent:
General government 2,500 2,500 2,054 446 Public works 2,524,578 2,493,393 2,192,892 300,501
Total expenditures 2,527,078 2,495,893 2,194,946 300,947
Deficiency of revenues underexpenditures (140,337) (109,152) (140,346) (31,194)
OTHER FINANCING SOURCES (USES)Transfers in 25,000 25,000 25,000 - Transfers out (720,000) (720,000) (720,000) -
Total other financing sources (uses) (695,000) (695,000) (695,000) -
Net change in fund balance (835,337) (804,152) (835,346) (31,194)
Fund balance, beginning of year 1,189,558 1,189,558 1,189,558 -
Fund balance, end of year 354,221$ 385,406$ 354,212$ (31,194)$
Budgeted Amounts

City of West Covina Schedule of Revenues, Expenditures, and Changes in Fund Balance - Budget and Actual Police Donations Special Revenue Fund For the Year Ended June 30, 2016
-166-
Variance withFinal Budget
PositiveOriginal Final Actual (Negative)
REVENUESInvestment income -$ -$ 183$ 183$ Revenue from other agencies - 1,600 1,600 - Other revenues - 3,107 3,107 -
Total revenues - 4,707 4,890 183
EXPENDITURESCurrent:
Public safety - 5,593 5,593 -
Net change in fund balance - (886) (703) 183
Fund balance, beginning of year 30,377 30,377 30,377 -
Fund balance, end of year 30,377$ 29,491$ 29,674$ 183$
Budgeted Amounts

City of West Covina Schedule of Revenues, Expenditures, and Changes in Fund Balance - Budget and Actual Transportation Development Act Special Revenue Fund For the Year Ended June 30, 2016
-167-
Variance withFinal Budget
PositiveOriginal Final Actual (Negative)
REVENUESRevenue from other agencies 68,702$ 78,365$ 78,365$ -$
EXPENDITURESCurrent:
Public works - 75,847 76,070 (223)
Net change in fund balance 68,702 2,518 2,295 (223)
Fund balance, beginning of year (2,295) (2,295) (2,295) -
Fund balance, end of year 66,407$ 223$ -$ (223)$
Budgeted Amounts

City of West Covina Schedule of Revenues, Expenditures, and Changes in Fund Balance - Budget and Actual AB939 Special Revenue Fund For the Year Ended June 30, 2016
-168-
Variance withFinal Budget
PositiveOriginal Final Actual (Negative)
REVENUESInvestment income -$ -$ 1,943$ 1,943$ Charges for services 3,000 3,000 1,376 (1,624) Other revenues 170,000 170,000 178,417 8,417
Total revenues 173,000 173,000 181,736 8,736
EXPENDITURESCurrent:
Public works 142,644 154,644 138,083 16,561
Net change in fund balance 30,356 18,356 43,653 25,297
Fund balance, beginning of year 331,724 331,724 331,724 -
Fund balance, end of year 362,080$ 350,080$ 375,377$ 25,297$
Budgeted Amounts

City of West Covina Schedule of Revenues, Expenditures, and Changes in Fund Balance - Budget and Actual Public Safety Augmentation Special Revenue Fund For the Year Ended June 30, 2016
-169-
Variance withFinal Budget
PositiveOriginal Final Actual (Negative)
REVENUESTaxes 650,000$ 709,173$ 709,173$ -$ Investment income - - 1,538 1,538
Total revenues 650,000 709,173 710,711 1,538
OTHER FINANCING USESTransfers out (650,000) (709,173) (709,173) -
Net change in fund balance - - 1,538 1,538
Fund balance, beginning of year 279,356 279,356 279,356 -
Fund balance, end of year 279,356$ 279,356$ 280,894$ 1,538$
Budgeted Amounts

City of West Covina Schedule of Revenues, Expenditures, and Changes in Fund Balance - Budget and Actual COPS/SLESA Special Revenue Fund For the Year Ended June 30, 2016
-170-
Variance withFinal Budget
PositiveOriginal Final Actual (Negative)
REVENUESInvestment income -$ -$ 1,911$ 1,911$ Revenue from other agencies 170,000 170,000 194,333 24,333
Total revenues 170,000 170,000 196,244 26,244
EXPENDITURESCurrent:
Public safety - 207,011 207,011 -
Net change in fund balance 170,000 (37,011) (10,767) 26,244
Fund balance, beginning of year 306,657 306,657 306,657 -
Fund balance, end of year 476,657$ 269,646$ 295,890$ 26,244$
Budgeted Amounts

City of West Covina Schedule of Revenues, Expenditures, and Changes in Fund Balance - Budget and Actual Charter PEG Special Revenue Fund For the Year Ended June 30, 2016
-171-
Variance withFinal Budget
PositiveOriginal Final Actual (Negative)
REVENUESInvestment income -$ -$ 1,686$ 1,686$
EXPENDITURESCurrent:
Community Services 10,000 10,000 - 10,000
Net change in fund balance (10,000) (10,000) 1,686 11,686
Fund balance, beginning of year 276,627 276,627 276,627 -
Fund balance, end of year 266,627$ 266,627$ 278,313$ 11,686$
Budgeted Amounts

City of West Covina Schedule of Revenues, Expenditures, and Changes in Fund Balance - Budget and Actual Art in Public Places Special Revenue Fund For the Year Ended June 30, 2016
-172-
Variance withFinal Budget
PositiveOriginal Final Actual (Negative)
REVENUESInvestment income -$ -$ 1,720$ 1,720$ Other revenues 70,000 70,000 51,019 (18,981)
Total revenues 70,000 70,000 52,739 (17,261)
EXPENDITURESCurrent:
Community development 8,000 184,530 177,630 6,900
Net change in fund balance 62,000 (114,530) (124,891) (10,361)
Fund balance, beginning of year, as restated 206,327 206,327 206,327 -
Fund balance, end of year 268,327$ 91,797$ 81,436$ (10,361)$
Budgeted Amounts

City of West Covina Schedule of Revenues, Expenditures, and Changes in Fund Balance - Budget and Actual Measure R Special Revenue Fund For the Year Ended June 30, 2016
-173-
Variance withFinal Budget
PositiveOriginal Final Actual (Negative)
REVENUESTaxes 1,211,328$ 1,211,328$ 1,211,550$ 222$ Investment income - - 6,062 6,062
Total revenues 1,211,328 1,211,328 1,217,612 6,284
EXPENDITURESCurrent:
Public works 200,000 498,002 489,648 8,354 Community services 659,150 659,150 589,846 69,304
Total expenditures 859,150 1,157,152 1,079,494 77,658
Net change in fund balance 352,178 54,176 138,118 83,942
Fund balance, beginning of year 717,709 717,709 717,709 -
Fund balance, end of year 1,069,887$ 771,885$ 855,827$ 83,942$
Budgeted Amounts

City of West Covina Schedule of Revenues, Expenditures, and Changes in Fund Balance - Budget and Actual Integrated Waste Management Special Revenue Fund For the Year Ended June 30, 2016
-174-
Variance withFinal Budget
PositiveOriginal Final Actual (Negative)
REVENUESCharges for services 70,000$ 70,000$ 73,614$ 3,614$
EXPENDITURESCurrent:
Public works 85,180 106,701 68,124 38,577
Net change in fund balance (15,180) (36,701) 5,490 42,191
Fund balance, beginning of year 87,813 87,813 87,813 -
Fund balance, end of year 72,633$ 51,112$ 93,303$ 42,191$
Budgeted Amounts

City of West Covina Schedule of Revenues, Expenditures, and Changes in Fund Balance - Budget and Actual West Covina Community Services Foundation Special Revenue Fund For the Year Ended June 30, 2016
-175-
Variance withFinal Budget
PositiveOriginal Final Actual (Negative)
REVENUESInvestment income -$ -$ 937$ 937$ Other revenues 100,000 131,228 137,006 5,778
Total revenues 100,000 131,228 137,943 6,715
EXPENDITURESCurrent:
Public safety - 5,509 5,509 - Community services 50,000 98,109 92,569 5,540
Total expenditures 50,000 103,618 98,078 5,540
Excess of revenues overexpenditures 50,000 27,610 39,865 12,255
OTHER FINANCING (USES)Transfers out (50,000) (50,000) (50,000) -
Net change in fund balance - (22,390) (10,135) 12,255
Fund balance, beginning of year 138,460 138,460 138,460 -
Fund balance, end of year 138,460$ 116,070$ 128,325$ 12,255$
Budgeted Amounts

City of West Covina Schedule of Revenues, Expenditures, and Changes in Fund Balance - Budget and Actual Community Development Block Grant Special Revenue Fund For the Year Ended June 30, 2016
-176-
Variance withFinal Budget
PositiveOriginal Final Actual (Negative)
REVENUESRevenue from other agencies 760,439$ 1,608,779$ 1,417,556$ (191,223)$ Other revenue 80,000 80,000 86,116 6,116
Total revenues 840,439 1,688,779 1,503,672 (185,107)
EXPENDITURESCurrent:
Public safety 500 125,999 61,992 64,007 Public works 734,455 1,202,268 1,203,119 (851) Community services 168,085 280,512 198,319 82,193
Total expenditures 903,040 1,608,779 1,463,430 145,349
Net change in fund balance (62,601) 80,000 40,242 (39,758)
Fund balance, beginning of year, as restated 137,981 137,981 137,981 -
Fund balance, end of year 75,380$ 217,981$ 178,223$ (39,758)$
Budgeted Amounts

City of West Covina Schedule of Revenues, Expenditures, and Changes in Fund Balance - Budget and Actual SAFER Grant Special Revenue Fund For the Year Ended June 30, 2016
-177-
Variance withFinal Budget
PositiveOriginal Final Actual (Negative)
REVENUESRevenue from other agencies 1,706,256$ 1,706,256$ 1,618,182$ (88,074)$
EXPENDITURESCurrent:
Public safety 1,706,256 1,706,256 1,633,292 72,964
Net change in fund balance - - (15,110) (15,110)
Fund balance (deficit), beginning of year (190,489) (190,489) (190,489) -
Fund balance (deficit), end of year (190,489)$ (190,489)$ (205,599)$ (15,110)$
Budgeted Amounts
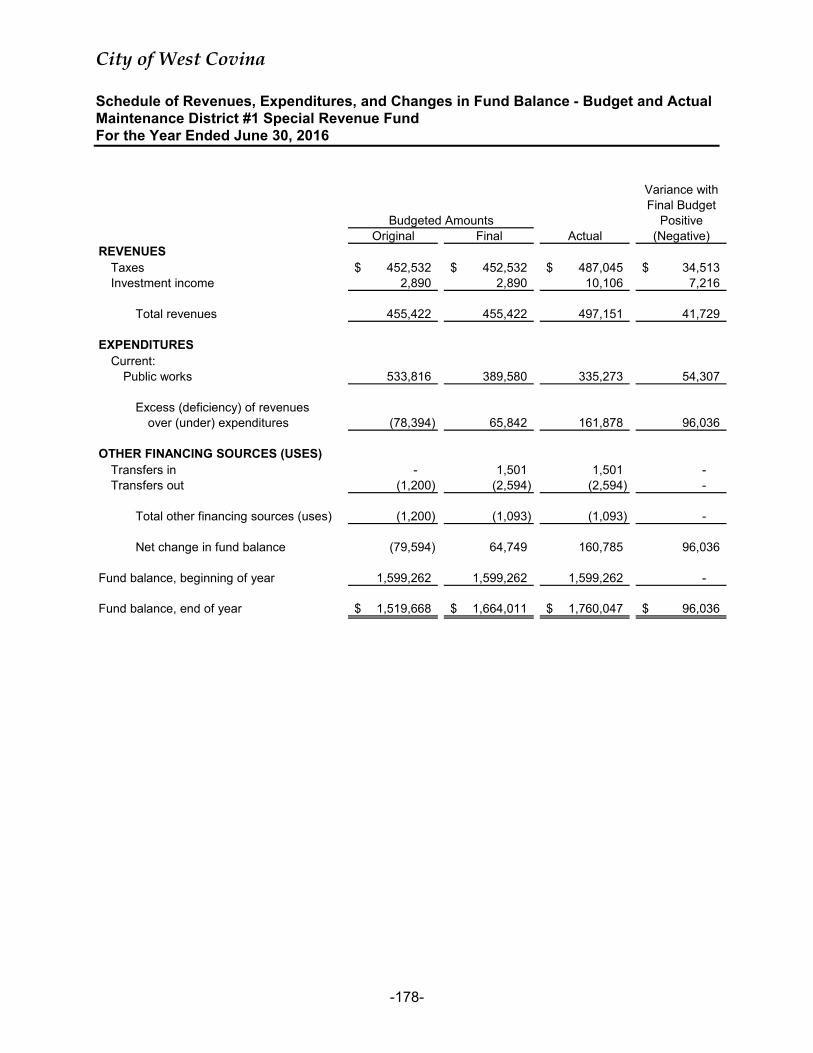
City of West Covina Schedule of Revenues, Expenditures, and Changes in Fund Balance - Budget and Actual Maintenance District #1 Special Revenue Fund For the Year Ended June 30, 2016
-178-
Variance withFinal Budget
PositiveOriginal Final Actual (Negative)
REVENUESTaxes 452,532$ 452,532$ 487,045$ 34,513$ Investment income 2,890 2,890 10,106 7,216
Total revenues 455,422 455,422 497,151 41,729
EXPENDITURESCurrent:
Public works 533,816 389,580 335,273 54,307
Excess (deficiency) of revenues over (under) expenditures (78,394) 65,842 161,878 96,036
OTHER FINANCING SOURCES (USES)Transfers in - 1,501 1,501 - Transfers out (1,200) (2,594) (2,594) -
Total other financing sources (uses) (1,200) (1,093) (1,093) -
Net change in fund balance (79,594) 64,749 160,785 96,036
Fund balance, beginning of year 1,599,262 1,599,262 1,599,262 -
Fund balance, end of year 1,519,668$ 1,664,011$ 1,760,047$ 96,036$
Budgeted Amounts

City of West Covina Schedule of Revenues, Expenditures, and Changes in Fund Balance - Budget and Actual Maintenance District #2 Special Revenue Fund For the Year Ended June 30, 2016
-179-
Variance with
Final BudgetPositive
Original Final Actual (Negative)REVENUES
Taxes 138,500$ 138,500$ 155,443$ 16,943$ Investment income - - 3,594 3,594
Total revenues 138,500 138,500 159,037 20,537
EXPENDITURESCurrent:
Public works 168,561 158,411 144,536 13,875
Excess (deficiency) of revenues over (under) expenditures (30,061) (19,911) 14,501 34,412
OTHER FINANCING (USES)Transfers out (10,200) (10,200) (10,200) -
Net change in fund balance (40,261) (30,111) 4,301 34,412
Fund balance, beginning of year 580,951 580,951 580,951 -
Fund balance, end of year 540,690$ 550,840$ 585,252$ 34,412$
Budgeted Amounts
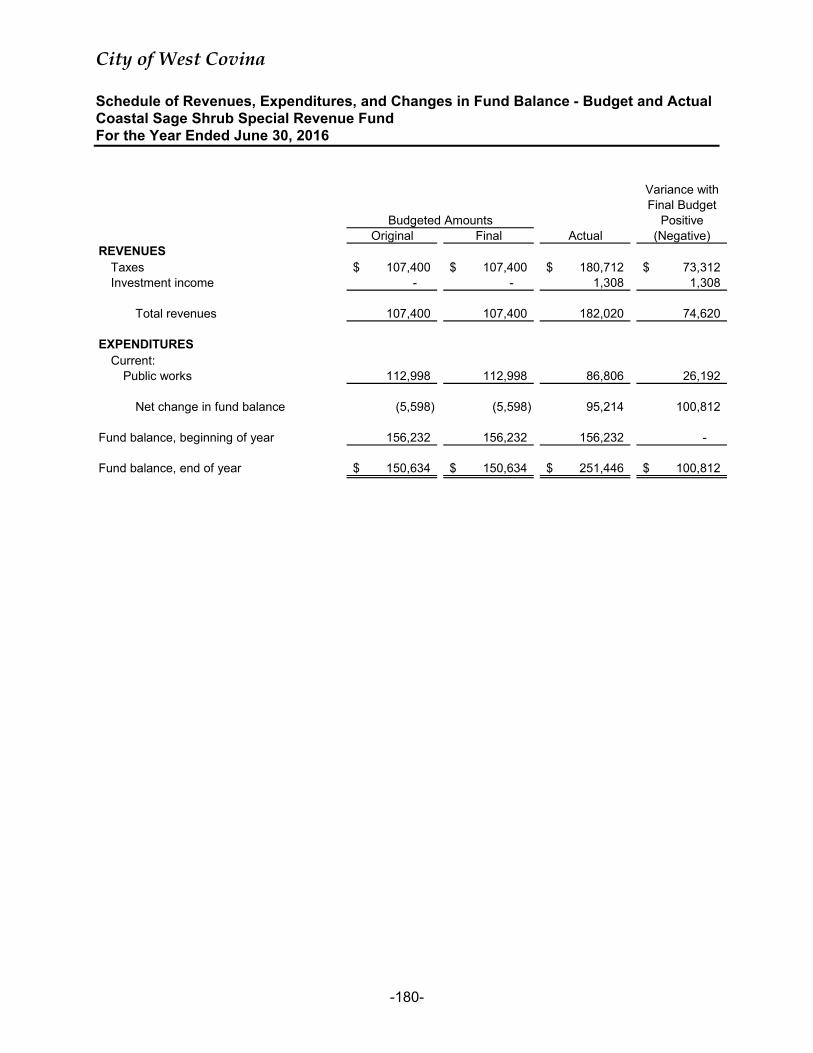
City of West Covina Schedule of Revenues, Expenditures, and Changes in Fund Balance - Budget and Actual Coastal Sage Shrub Special Revenue Fund For the Year Ended June 30, 2016
-180-
Variance withFinal Budget
PositiveOriginal Final Actual (Negative)
REVENUESTaxes 107,400$ 107,400$ 180,712$ 73,312$ Investment income - - 1,308 1,308
Total revenues 107,400 107,400 182,020 74,620
EXPENDITURESCurrent:
Public works 112,998 112,998 86,806 26,192
Net change in fund balance (5,598) (5,598) 95,214 100,812
Fund balance, beginning of year 156,232 156,232 156,232 -
Fund balance, end of year 150,634$ 150,634$ 251,446$ 100,812$
Budgeted Amounts

City of West Covina Schedule of Revenues, Expenditures, and Changes in Fund Balance - Budget and Actual Maintenance District #4 Special Revenue Fund For the Year Ended June 30, 2016
-181-
Variance with
Final BudgetPositive
Original Final Actual (Negative)REVENUES
Special assessments 1,040,000$ 1,040,000$ 1,045,001$ 5,001$ Investment income - - 13,581 13,581
Total revenues 1,040,000 1,040,000 1,058,582 18,582
EXPENDITURESCurrent:
Public works 1,361,267 1,187,549 904,520 283,029
Excess (deficiency) of revenues over (under) expenditures (321,267) (147,549) 154,062 301,611
OTHER FINANCING SOURCES (USES)Transfers in 9,000 9,000 9,000 - Transfers out (3,580) (3,580) (3,580) -
Total other financing sources (uses) 5,420 5,420 5,420 -
Net change in fund balance (315,847) (142,129) 159,482 301,611
Fund balance, beginning of year 2,201,182 2,201,182 2,201,182 -
Fund balance, end of year 1,885,335$ 2,059,053$ 2,360,664$ 301,611$
Budgeted Amounts
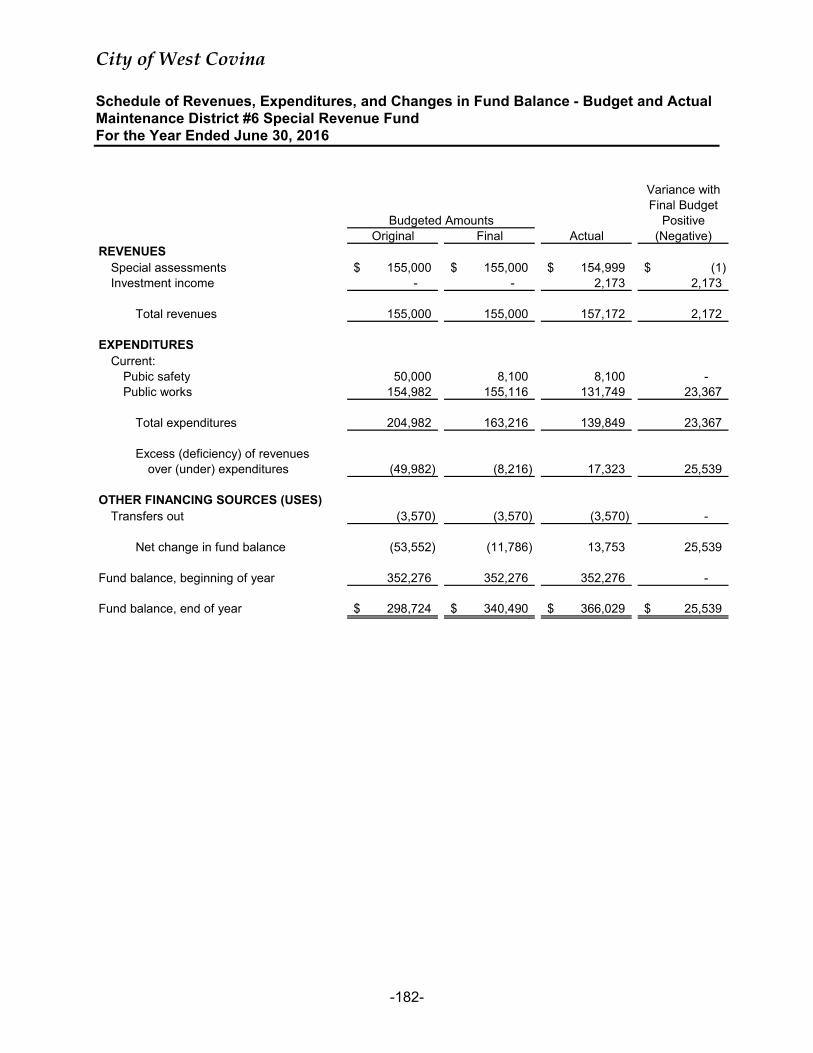
City of West Covina Schedule of Revenues, Expenditures, and Changes in Fund Balance - Budget and Actual Maintenance District #6 Special Revenue Fund For the Year Ended June 30, 2016
-182-
Variance withFinal Budget
PositiveOriginal Final Actual (Negative)
REVENUESSpecial assessments 155,000$ 155,000$ 154,999$ (1)$ Investment income - - 2,173 2,173
Total revenues 155,000 155,000 157,172 2,172
EXPENDITURESCurrent:
Pubic safety 50,000 8,100 8,100 - Public works 154,982 155,116 131,749 23,367
Total expenditures 204,982 163,216 139,849 23,367
Excess (deficiency) of revenues over (under) expenditures (49,982) (8,216) 17,323 25,539
OTHER FINANCING SOURCES (USES)Transfers out (3,570) (3,570) (3,570) -
Net change in fund balance (53,552) (11,786) 13,753 25,539
Fund balance, beginning of year 352,276 352,276 352,276 -
Fund balance, end of year 298,724$ 340,490$ 366,029$ 25,539$
Budgeted Amounts

City of West Covina Schedule of Revenues, Expenditures, and Changes in Fund Balance - Budget and Actual Maintenance District #7 Special Revenue Fund For the Year Ended June 30, 2016
-183-
Variance withFinal Budget
PositiveOriginal Final Actual (Negative)
REVENUESSpecial assessments 150,800$ 150,800$ 146,024$ (4,776)$ Investment income - - 2,349 2,349
Total revenues 150,800 150,800 148,373 (2,427)
EXPENDITURESCurrent:
Public works 211,159 208,301 180,365 27,936
Deficiency of revenues underexpenditures (60,359) (57,501) (31,992) 25,509
OTHER FINANCING SOURCES (USES)Transfers out (3,580) (3,580) (3,580) -
Net change in fund balance (63,939) (61,081) (35,572) 25,509
Fund balance, beginning of year 406,395 406,395 406,395 -
Fund balance, end of year 342,456$ 345,314$ 370,823$ 25,509$
Budgeted Amounts

City of West Covina Schedule of Revenues, Expenditures, and Changes in Fund Balance - Budget and Actual Citywide Maintenance District Special Revenue Fund For the Year Ended June 30, 2016
-184-
Variance with
Final BudgetPositive
Original Final Actual (Negative)REVENUES
Special assessments 1,595,000$ 1,595,000$ 1,590,345$ (4,655)$ Investment income - - 4,403 4,403
Total revenues 1,595,000 1,595,000 1,594,748 (252)
EXPENDITURESCurrent:
Public works 1,528,008 1,538,235 1,522,209 16,026
Excess of revenues overexpenditures 66,992 56,765 72,539 15,774
OTHER FINANCING SOURCESTransfers in 13,130 13,130 13,130 -
Net change in fund balance 80,122 69,895 85,669 15,774
Fund balance, beginning of year 771,453 771,453 771,453 -
Fund balance, end of year 851,575$ 841,348$ 857,122$ 15,774$
Budgeted Amounts

City of West Covina Schedule of Revenues, Expenditures, and Changes in Fund Balance - Budget and Actual Sewer Maintenance Special Revenue Fund For the Year Ended June 30, 2016
-185-
Variance with
Final BudgetPositive
Original Final Actual (Negative)REVENUES
Taxes 190,000$ 190,000$ 219,867$ 29,867$ Special assessments 2,678,065 2,678,065 2,614,288 (63,777) Investment income 3,500 3,500 12,110 8,610 Charges for services - - 35,460 35,460
Total revenues 2,871,565 2,871,565 2,881,725 10,160
EXPENDITURESCurrent:
Public safety - - 101 (101) Public works 2,654,649 2,006,287 1,728,629 277,658
Total expenditures 2,654,649 2,006,287 1,728,730 277,557
Excess of revenues overexpenditures 216,916 865,278 1,152,995 287,717
OTHER FINANCING SOURCES (USES)Transfers in - 50,146 50,146 - Transfers out (25,000) (786,083) (786,083) -
Total other financing sources (uses) (25,000) (735,937) (735,937) -
Net change in fund balance 191,916 129,341 417,058 287,717
Fund balance, beginning of year 2,336,455 2,336,455 2,336,455 -
Fund balance, end of year 2,528,371$ 2,465,796$ 2,753,513$ 287,717$
Budgeted Amounts

City of West Covina Schedule of Revenues, Expenditures, and Changes in Fund Balance - Budget and Actual Auto Plaza Improvement District Special Revenue Fund For the Year Ended June 30, 2016
-186-
Variance withFinal Budget
PositiveOriginal Final Actual (Negative)
REVENUESTaxes 57,750$ 57,750$ 67,323$ 9,573$ Investment income - - 1,017 1,017
Total revenues 57,750 57,750 68,340 10,590
EXPENDITURESCurrent:
Community development 46,890 49,970 47,049 2,921
Net change in fund balance 10,860 7,780 21,291 13,511
Fund balance, beginning of year 67,404 67,404 67,404 -
Fund balance, end of year 78,264$ 75,184$ 88,695$ 13,511$
Budgeted Amounts

City of West Covina Non-Major Governmental Funds – Capital Projects Funds
-187-
CAPITAL PROJECTS FUNDS are used to account for the purchase or construction of major capital facilities which are not financed by Proprietary Funds. Capital Projects Funds are ordinarily not used to account for the acquisition of furniture, fixtures, machinery, equipment and other relatively minor or comparatively short-lived capital assets. City Capital Projects - This fund accounts for all capital expenditures not being accounted for in the capital projects described below, or in other fund types. Construction Tax - This fund accounts for monies received from developers based on the construction of dwelling units and used primarily to construct public domain assets. Information Technology - The funds paid into this fund are to be used for information technology capital outlay projects. Park Development - This fund accounts for park fees received from residential developers to be used for new park construction. Development Impact Fees - This fund accounts for fees received from residential developers to help fund the purchase/replacement of vehicles/equipment along with the repairs and improvements of city facilities.

City of West Covina Combining Balance Sheet Non-Major Capital Projects Funds June 30, 2016
-188-
Construction InformationCity Tax Technology
Cash and investments 383,082$ 403,242$ 203,891$ Receivables, net:
Interest 236 248 - Due from other agencies 35,000 - -
Total assets 418,318$ 403,490$ 203,891$
RESOURCES, AND FUND BALANCESLiabilities:
Accounts payable 18,881$ 14,694$ -$ Other accrued liabilities 26 11,425 -
Total liabilities 18,907 26,119 -
Unavailable revenue 35,000 - -
Assigned 364,411 377,371 203,891
Total fund balances 364,411 377,371 203,891
Total liabilities, deferred inflows of resources, and fund balances 418,318$ 403,490$ 203,891$
ASSETS
Fund Balances:
LIABILITIES, DEFERRED INFLOWS OF
Deferred Inflows of Resources:

-189-
TotalDevelopment Non-Major
Park Impact Capital ProjectsDevelopment Fees Funds
4,379,381$ 50,768$ 5,420,364$
2,694 - 3,178 - - 35,000
4,382,075$ 50,768$ 5,458,542$
300,222$ -$ 333,797$ 13,229 - 24,680
313,451 - 358,477
- - 35,000
4,068,624 50,768 5,065,065
4,068,624 50,768 5,065,065
4,382,075$ 50,768$ 5,458,542$
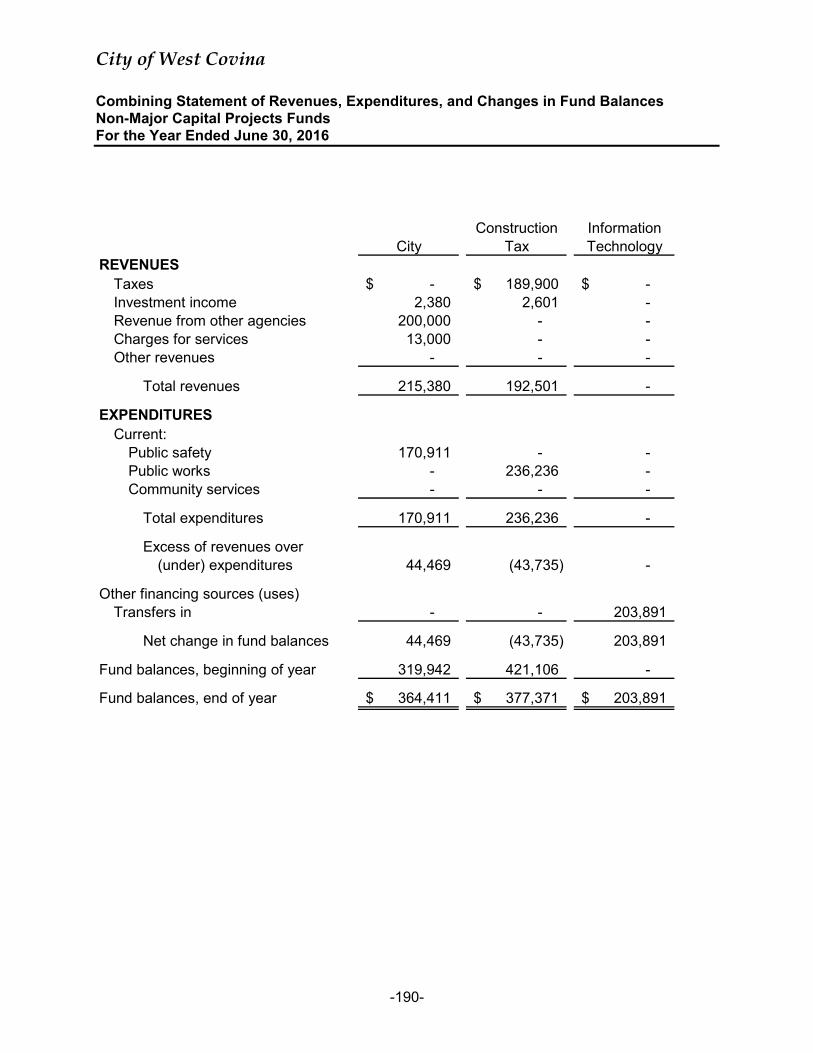
City of West Covina Combining Statement of Revenues, Expenditures, and Changes in Fund Balances Non-Major Capital Projects Funds For the Year Ended June 30, 2016
-190-
Construction InformationCity Tax Technology
REVENUESTaxes -$ 189,900$ -$ Investment income 2,380 2,601 - Revenue from other agencies 200,000 - - Charges for services 13,000 - - Other revenues - - -
Total revenues 215,380 192,501 -
EXPENDITURESCurrent:
Public safety 170,911 - - Public works - 236,236 - Community services - - -
Total expenditures 170,911 236,236 -
Excess of revenues over(under) expenditures 44,469 (43,735) -
Other financing sources (uses)Transfers in - - 203,891
Net change in fund balances 44,469 (43,735) 203,891
Fund balances, beginning of year 319,942 421,106 -
Fund balances, end of year 364,411$ 377,371$ 203,891$

-191-
TotalDevelopment Non-Major
Park Impact Capital ProjectsDevelopment Fees Funds
-$ -$ 189,900$ 26,484 88 31,553
- - 200,000 - - 13,000
547,500 50,680 598,180
573,984 50,768 1,032,633
- - 170,911 - - 236,236
695,005 - 695,005
695,005 - 1,102,152
(121,021) 50,768 (69,519)
- - 203,891
(121,021) 50,768 134,372
4,189,645 - 4,930,693
4,068,624$ 50,768$ 5,065,065$

City of West Covina Schedule of Revenues, Expenditures, and Changes in Fund Balance - Budget and Actual City Capital Projects Fund For the Year Ended June 30, 2016
-192-
Variance withFinal Budget
PositiveOriginal Final Actual (Negative)
REVENUESInvestment income -$ -$ 2,380$ 2,380$ Revenue from other agencies - 200,000 200,000 - Charges for services - 13,000 13,000 -
Total revenues - 213,000 215,380 2,380
EXPENDITURESCurrent:
Public safety - 170,911 170,911 -
Net change in fund balance - 42,089 44,469 2,380
Fund balance, beginning of year 319,942 319,942 319,942 -
Fund balance, end of year 319,942$ 362,031$ 364,411$ 2,380$
Budgeted Amounts

City of West Covina Schedule of Revenues, Expenditures, and Changes in Fund Balance - Budget and Actual Construction Tax Capital Projects Fund For the Year Ended June 30, 2016
-193-
Variance withFinal Budget
PositiveOriginal Final Actual (Negative)
REVENUESTaxes 90,000$ 90,000$ 189,900$ 99,900$ Investment income - - 2,601 2,601
Total revenues 90,000 90,000 192,501 102,501
EXPENDITURESCurrent:
Public works 132,775 235,297 236,236 (939)
Net change in fund balance (42,775) (145,297) (43,735) 101,562
Fund balance, beginning of year 421,106 421,106 421,106 -
Fund balance, end of year 378,331$ 275,809$ 377,371$ 101,562$
Budgeted Amounts

City of West Covina Schedule of Revenues, Expenditures, and Changes in Fund Balance - Budget and Actual Information Technology Capital Projects Fund For the Year Ended June 30, 2016
-194-
Variance withFinal Budget
PositiveOriginal Final Actual (Negative)
OTHER FINANCING SOURCES (USES)Transfers in -$ 203,891$ 203,891$ -$
Net change in fund balance - 203,891 203,891 -
Fund balance, beginning of year - - - -
Fund balance, end of year -$ 203,891$ 203,891$ -$
Budgeted Amounts
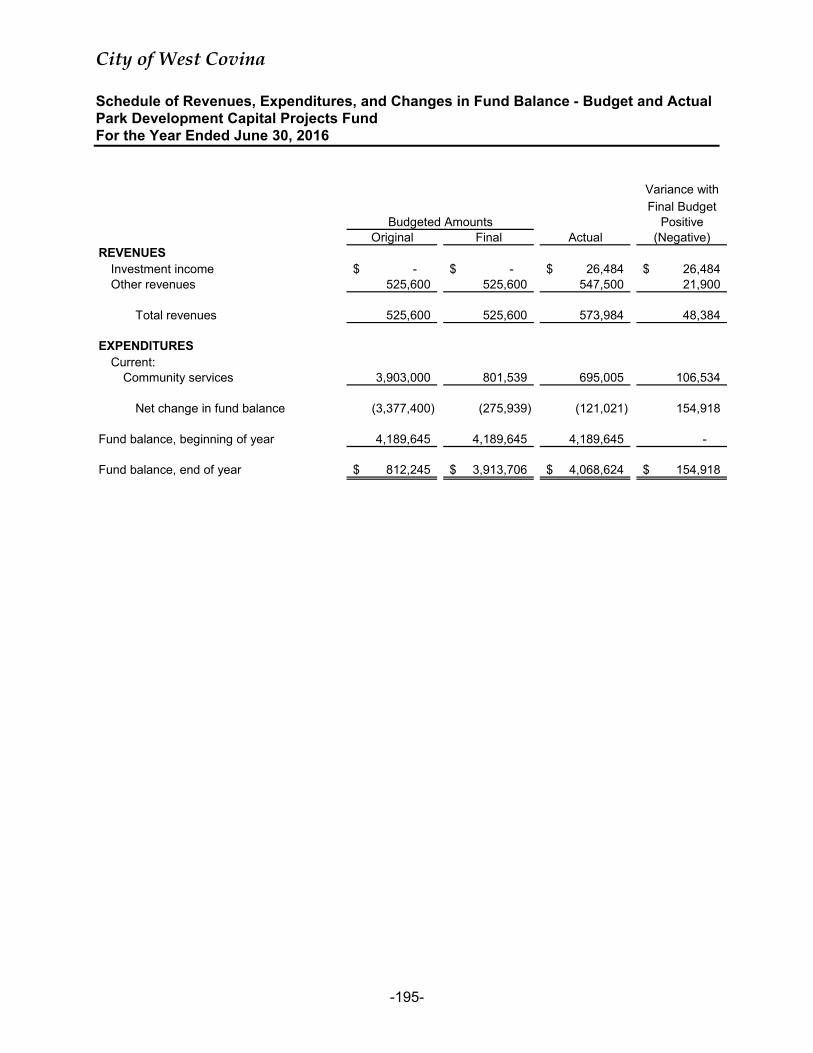
City of West Covina Schedule of Revenues, Expenditures, and Changes in Fund Balance - Budget and Actual Park Development Capital Projects Fund For the Year Ended June 30, 2016
-195-
Variance with
Final BudgetPositive
Original Final Actual (Negative)REVENUES
Investment income -$ -$ 26,484$ 26,484$ Other revenues 525,600 525,600 547,500 21,900
Total revenues 525,600 525,600 573,984 48,384
EXPENDITURESCurrent:
Community services 3,903,000 801,539 695,005 106,534
Net change in fund balance (3,377,400) (275,939) (121,021) 154,918
Fund balance, beginning of year 4,189,645 4,189,645 4,189,645 -
Fund balance, end of year 812,245$ 3,913,706$ 4,068,624$ 154,918$
Budgeted Amounts

This page intentionally left blank.

City of West Covina Internal Service Funds
-196-
INTERNAL SERVICE FUNDS are used to account for the financing of goods or services provided by one department to other departments of the City on a cost reimbursement basis. Fleet Management - This fund provides maintenance on materials and supplies for City vehicles and other gasoline or diesel powered equipment. Self-Insurance - This fund accounts for the use of funds that are charged to departments for the administration and payment of claims under the City’s self-insured general liability and workers’ compensation programs. Retirement Health Savings Plan - This fund accounts for the set aside lump sum benefits for retiring employees. Vehicle Replacement - This fund provides for replacement of City vehicles.

City of West Covina Combining Statement of Net Position Internal Service Funds June 30, 2016
-197-
Fleet Management Self-Insurance
Current Assets:Cash and investments -$ 9,677,759$ Receivables, net:
Accounts - 11,942 Interest - -
Due from other funds - 128,817Inventories 8,308 -
Total current assets 8,308 9,818,518
Capital assets: Capital assets 2,464,436 - Less accumulated depreciation (2,263,691) -
Total capital assets 200,745 - Total noncurrent assets 200,745 -
Total assets 209,053 9,818,518
Current Liabilities:Accounts payable 80,304 150,834 Other accrued liabilities 9,106 3,231 Claims and judgements - current portion - 2,574,566 Compensated absences - current portion 20,215 8,365 Due to other funds 78,183 -
Total current liabilities 187,808 2,736,996
Noncurrent Liabilities:Claims and judgements - 7,079,192 Compensated absences 21,245 2,330
Total noncurrent liabilities 21,245 7,081,522
Total liabilities 209,053 9,818,518
NET POSITIONNet investment in capital assets 200,745 - Unrestricted (200,745) -
Total net position -$ -$
ASSETS
Noncurrent Assets
LIABILITIES

-198-
Retiree Health VehicleSavings Plan Replacement Totals
606,565$ 31,523$ 10,315,847$
- - 11,942 373 19 392 - - 128,817 - - 8,308
606,938 31,542 10,465,306
- 611,630 3,076,066 - (429,533) (2,693,224) - 182,097 382,842 - 182,097 382,842
606,938 213,639 10,848,148
- 16,422 247,560 - - 12,337 - - 2,574,566 - - 28,580 - - 78,183 - 16,422 2,941,226
- - 7,079,192 - - 23,575 - - 7,102,767
- 16,422 10,043,993
- 182,097 382,842 606,938 15,120 421,313
606,938$ 197,217$ 804,155$

City of West Covina Combining Statement of Revenues, Expenses, and Changes in Net Position Internal Service Funds For the Year Ended June 30, 2016
-199-
Fleet Management Self-Insurance
Charges for services 1,500,138$ 2,670,413$ Other revenues - 233,821
Total operating revenues 1,500,138 2,904,234
Personnel services 425,958 179,041Cost of sales, services and operations 1,038,128 1,026,787 Depreciation 36,085 - Insurance and claims paid - 1,999,139
Total operating expenses 1,500,171 3,204,967
Operating loss (33) (300,733)
NONOPERATING REVENUES:Investment income - -
Total nonoperating revenues - -
Loss before transfers (33) (300,733)
Transfers in - 6,003,033
Change in net position (33) 5,702,300
Net position, beginning of year 33 (5,702,300)
Net position, end of year -$ -$
OPERATING EXPENSES:
OPERATING REVENUES:

-200-
Retiree Health VehicleSavings Plan Replacement Totals
87,170$ -$ 4,257,721$ - - 233,821
87,170 - 4,491,542
109,392 - 714,391 - - 2,064,915 - 4,497 40,582 - - 1,999,139
109,392 4,497 4,819,027
(22,222) (4,497) (327,485)
3,716 349 4,065
3,716 349 4,065
(18,506) (4,148) (323,420)
- 80,000 6,083,033
(18,506) 75,852 5,759,613
625,444 121,365 (4,955,458)
606,938$ 197,217$ 804,155$

City of West Covina Combining Statement of Cash Flows Internal Service Funds For the Year Ended June 30, 2016
-201-
Fleet Management Self-Insurance
CASH FLOWS FROM OPERATING ACTIVITIES:Received from user departments 1,500,138$ 2,906,001$ Payments to suppliers for goods and services (1,059,267) (2,440,351) Payments to employees for services (422,788) (172,910)
Net cash provided by (used for) operating activities 18,083 292,740
CASH FLOWS FROM NONCAPITAL FINANCING ACTIVITIES:
Transfers from other funds - 6,003,033 Paid to other funds (18,083) (128,817)
Net cash provided by (used for) noncapital financing activities (18,083) 5,874,216
CASH FLOWS FROM CAPITAL AND RELATED FINANCING ACTIVITIES:
Acquisition of capital assets - -
CASH FLOWS FROM INVESTING ACTIVITIES:Interest received on investments - -
Net cash increase (decrease) in cash and cash equivalents - 6,166,956
Cash and cash equivalents, beginning of year - 3,510,803
Cash and cash equivalents, ending of year -$ 9,677,759$
RECONCILIATION OF OPERATING LOSS TO NETCASH PROVIDED BY (USED FOR) OPERATING ACTIVITIES:Operating loss (33)$ (300,733)$ Adjustments to reconcile operating loss to net
cash provided by (used for) operating activities:Depreciation 36,085 - (Increase) decrease in operating assets:
Accounts receivable - (4,721) Other receivables - 6,488 Inventory (6,308) -
Increase (decrease) in operating liabilities:Accounts payable (17,594) 116,072 Other accrued liabilities 2,763 3,008 Claims and judgments payable - 466,495 Compensated absences payable 3,170 6,131
Net cash provided by (used for) operating activities 18,083$ 292,740$

-202-
Retiree Health Vehicle Savings Plan Replacement Totals
87,170$ -$ 4,493,309$ - (8,781) (3,508,399)
(109,392) - (705,090)
(22,222) (8,781) 279,820
- 80,000 6,083,033 - - (146,900)
- 80,000 5,936,133
- (101,168) (101,168)
3,577 452 4,029
(18,645) (29,497) 6,118,814
625,210 61,020 4,197,033
606,565$ 31,523$ 10,315,847$
(22,222)$ (4,497)$ (327,485)$
- 4,497 40,582
- - (4,721) - - 6,488 - - (6,308)
- (8,781) 89,697 - - 5,771 - - 466,495 - - 9,301
(22,222)$ (8,781)$ 279,820$

City of West Covina Pension Trust Funds
-203-
PENSION TRUST FUNDS are used to account for monies required to be held in trust for the members and beneficiaries of defined benefit pension plans. Retirement Enhancement Defined Benefit Pension Trust Fund - This fund accounts for the assets and activities of the Public Agency Retirement System Enhancement Plan. Supplemental Retirement Defined Benefit Pension Trust Fund - This fund accounts for the assets and activities of the Public Agency Supplemental Retirement Plan.

City of West Covina Combining Statement of Net Position Pension Trust Funds June 30, 2016
-204-
Retirement Supplemental TotalEnhancement Retirement Pension
Defined Benefit Defined Benefit TrustPension Fund Pension Fund Funds
Cash and investments 125,271$ 632,804$ 758,075$
Held in Trust for Pension Benefits 125,271$ 632,804$ 758,075$
ASSETS

City of West Covina Combining Statement of Changes in Net Position Pension Trust Funds For the Year Ended June 30, 2016
-205-
Retirement Supplemental TotalEnhancement Retirement Pension
Defined Benefit Defined Benefit TrustPension Fund Pension Fund Funds
ADDITIONSEmployer contribution 56,439$ 78,300$ 134,739$ Investment income - 9,419 9,419
Total Additions 56,439 87,719 144,158
DEDUCTIONS
Administrative costs 1,769 4,519 6,288 Investment expense 690 - 690 Benefit distributions 91,020 137,079 228,099
Total Deductions 93,479 141,598 235,077
Change in net position (37,040) (53,879) (90,919)
Net Position, beginning of year 162,311 686,683 848,994
Net Position, end of year 125,271$ 632,804$ 758,075$

City of West Covina Agency Fund
-206-
AGENCY FUNDS are used to account for monies held by the City in a trustee capacity as an agent for individuals, private organizations and other governmental units. Special Deposits - This fund accounts for developer funds placed on deposit with the City pending either a return to the depositor or disbursement by the City on behalf of the depositor to pay for studies and other developer expenses.

City of West Covina Statement of Changes in Assets and Liabilities Agency Fund For the Year Ended June 30, 2016
-207-
Balance BalanceJune 30, 2015 Additions Deletions June 30, 2016
Cash and investments 1,461,526$ 399,050$ 420,909$ 1,439,667$ Receivables, net:
Accounts - 31,087 20,191 10,896 Other - 3,090 179 2,911
Total Assets 1,461,526$ 433,227$ 441,279$ 1,453,474$
Accounts payable 34,901$ 313,701$ 318,902$ 29,700$ Deposits 1,426,625 421,069 423,920 1,423,774
Total Liabilities 1,461,526$ 734,770$ 742,822$ 1,453,474$
ASSETS
LIABILITIES

City of West Covina Statistical Section
-208-
This section of the City’s comprehensive annual financial report presents detailed information as a context for understanding what the information in the financial statements, note disclosures, and required supplementary information says about the government’s overall financial health.
Page
Financial Trends 209
Revenue Capacity 223
Debt Capacity 230
Demographic and Economic Information 238
Operating Information 241
CONTENTS
These schedules contain trend information to help the reader understand how theCity's financial performance and well being have changed over time.
These schedules contain information to help the reader assess one of the City'smost significant local revenue source, the property tax.
These schedules present information to help the reader assess the affordability ofthe City's current levels of outstanding debt and its ability to issue additional debtin the future.
These schedules offer demographic and economic indicators to help the readerunderstand the environment within which the City's financial activities take palce.
These schedules contain service and infastructure data to help the readerunderstand how the information in the City's financial report relates to theservices the government provides and the activities it performs.
Sources: Unless otherwise noted, the information in these schedules is derived from the comprehensive annual financial reports for the relevant year.

City of West Covina Net Position by Component Last Ten Fiscal Years (accrual basis of accounting)
-209-
2007 2008 2009 2010
Governmental activities:Net investment in capital assets 139,413,253$ 148,634,909$ 180,298,472$ 184,338,106$ Restricted 88,484,572 30,802,069 25,937,799 18,316,134 Unrestricted 20,796,530 63,530,998 22,723,726 10,219,814
Total governmental activities net pension 248,694,355$ 242,967,976$ 228,959,997$ 212,874,054$
Business-type activities:Net investment in capital assets 303,147$ 202,227$ 107,507$ 42,073$ Restricted - - - - Unrestricted 721,839 (66,842) (786,551) (1,128,610)
Total business-type activities net pension 1,024,986$ 135,385$ (679,044)$ (1,086,537)$
Primary government:Net investment in capital assets 139,716,400$ 148,837,136$ 180,405,979$ 184,380,179$ Restricted 88,484,572 30,802,069 25,937,799 18,316,134 Unrestricted 21,518,369 63,464,156 21,937,175 9,091,204
Total primary government net pension 249,719,341$ 243,103,361$ 228,280,953$ 211,787,517$
Fiscal Year

-210-
2011 2012 2013 2014 2015 2016
179,236,866$ 222,784,189$ 164,621,539$ 161,771,546$ 144,215,248$ 148,989,212$ 25,286,909 53,331,999 46,016,224 47,468,277 48,793,821 56,902,504 1,884,827 (27,344,668) (297,086) 191,878 (129,152,694) (138,162,202)
206,408,602$ 248,771,520$ 210,340,677$ 209,431,701$ 63,856,375$ 67,729,514$
-$ -$ -$ -$ -$ -$ - - - - - -
(999,624) (994,560) (426,769) 60,922 188,045 (135,676)
(999,624)$ (994,560)$ (426,769)$ 60,922$ 188,045$ (135,676)$
179,236,866$ 222,784,189$ 164,621,539$ 161,771,546$ 144,215,248$ 148,989,212$ 25,286,909 53,331,999 46,016,224 47,468,277 48,793,821 56,902,504
(98,187) (28,339,228) (723,855) 252,800 (128,964,649) (138,297,878)
204,425,588$ 247,776,960$ 209,913,908$ 209,492,623$ 64,044,420$ 67,593,838$
Fiscal Year

City of West Covina Changes in Net Position Last Ten Fiscal Years (accrual basis of accounting)
-211-
2007 2008 2009 2010Expenses:
Governmental activities:General government 46,328$ 2,448,843$ 2,849,501$ 3,337,547$ Public safety 42,186,533 45,498,406 47,682,934 48,151,398 Public works 19,322,212 20,246,687 21,598,894 21,054,241 Community services 5,167,297 5,214,550 7,835,430 6,558,987 Community development 9,610,651 10,000,667 12,867,904 8,619,004 Interest on long-term debt 8,320,239 8,200,588 7,962,089 6,577,544
Total governmental activities expenses 84,653,260 91,609,741 100,796,752 94,298,721
Business-type activities:Computer enterprise 2,470,811 2,682,467 2,633,564 2,507,498
Total business-type activities expenses 2,470,811 2,682,467 2,633,564 2,507,498
Total primary government expenses 87,124,071 94,292,208 103,430,316 96,806,219
Program revenues:Governmental activities:Charges for services:
General government 861,565 1,145,943 757,678 1,019,690 Public safety 3,141,098 3,431,488 3,611,259 3,850,741 Public works 6,339,196 4,251,433 5,818,290 7,041,281 Community services 1,526,866 1,443,945 1,158,644 1,089,227 Community development 537,813 275,235 266,286 313,639
Operating grants and contributions 8,607,221 10,618,414 11,895,355 5,157,956 Capital grants and contributions 2,714,668 434,630 578,828 3,574,609
Total governmental activities program revenues 23,728,427 21,601,088 24,086,340 22,047,143
Business-type activities:Charges for services:
Computer enterprise 1,765,224 1,755,717 1,885,071 2,193,037 Total business-type activities program revenues 1,765,224 1,755,717 1,885,071 2,193,037
Total primary government program revenues 25,493,651 23,356,805 25,971,411 24,240,180
Source: City of West Covina Finance Department
Fiscal Year

-212-
2011 2012 2013 2014 2015 2016
2,922,898$ 4,953,340$ 5,519,153$ 7,472,254$ 5,676,067$ 4,963,302$ 45,253,725 49,369,913 47,323,516 45,443,958 49,813,447 48,410,511 21,052,423 20,510,387 20,372,375 21,109,952 20,586,770 20,259,279 6,629,292 6,949,951 6,878,176 6,437,040 7,035,872 7,368,492 9,414,730 4,071,050 1,127,924 658,082 766,886 753,721 7,101,037 5,927,002 1,652,750 1,677,062 1,353,156 1,572,645
92,374,105 91,781,643 82,873,894 82,798,348 85,232,198 83,327,950
2,086,135 1,701,367 1,435,855 1,284,419 1,427,789 1,638,573 2,086,135 1,701,367 1,435,855 1,284,419 1,427,789 1,638,573
94,460,240 93,483,010 84,309,749 84,082,767 86,659,987 84,966,523
681,877 599,066 548,333 486,478 885,123 400,051 3,571,864 3,196,729 3,018,478 3,037,891 2,825,831 3,170,579 8,043,988 7,046,096 7,781,333 8,878,122 8,278,038 8,271,744 1,166,675 1,141,162 1,195,612 1,180,562 1,275,278 1,365,482
240,462 255,669 348,112 621,352 502,621 425,013 10,189,050 12,557,141 10,344,778 11,021,410 12,405,742 13,317,378
678,827 958,459 597,405 4,458,250 2,224,864 1,004,826
24,572,743 25,754,322 23,834,051 29,684,065 28,397,497 27,955,073
2,268,982 1,805,242 2,105,421 1,873,636 1,655,134 1,413,114
2,268,982 1,805,242 2,105,421 1,873,636 1,655,134 1,413,114
26,841,725 27,559,564 25,939,472 31,557,701 30,052,631 29,368,187
Fiscal Year

City of West Covina Changes in Net Position, (continued) Last Ten Fiscal Years (accrual basis of accounting)
-213-
2007 2008 2009 2010Net revenues (expenses):
Governmental activities (60,924,833)$ (70,008,653)$ (76,710,412)$ (72,251,578)$ Business-type activities (705,587) (926,750) (748,493) (314,461) net primary government
revenues (expenses) (61,630,420) (70,935,403) (77,458,905) (72,566,039)
General revenues and other changesin net position:Governmental activities:Taxes:
Property taxes 32,458,314 34,760,944 36,387,548 28,849,815 Sales tax 14,056,880 11,167,748 9,261,965 7,791,286 Franchise tax 2,874,165 3,367,958 3,512,830 3,093,538 Other taxes 4,454,217 4,445,300 5,108,429 5,392,829
Motor vehicle in lieu, unrestricted 650,304 500,629 383,831 331,289 Investment income 6,919,306 7,800,642 4,768,327 4,288,088 Other general revenues 7,895,977 2,239,053 3,200,753 2,077,837 Transfers - - 78,750 93,140 Extraordinary gain (loss) - - - -
Total governmental activities 69,309,163 64,282,274 62,702,433 51,917,822
Business-type activities:Investment income 66,873 37,149 12,814 108 Transfers - - (78,750) (93,140)
Total business-type activities 66,873 37,149 (65,936) (93,032)
Total primary government 69,376,036 64,319,423 62,636,497 51,824,790
Changes in net position:Governmental activities 8,384,330 (5,726,379) (14,007,979) (20,333,756) Business-type activities (638,714) (889,601) (814,429) (407,493)
Total primary governmentchange in net position 7,745,616$ (6,615,980)$ (14,822,408)$ (20,741,249)$
Source: City of West Covina Finance Department
Fiscal Year

-214-
2011 2012 2013 2014 2015 2016
(67,801,362)$ (66,027,321)$ (58,612,191)$ (53,114,283)$ (56,834,701)$ (55,372,877)$ 182,847 103,875 669,566 589,217 227,345 (225,459)
(67,618,515) (65,923,446) (57,942,625) (52,525,066) (56,607,356) (55,598,336)
30,888,074 23,313,556 20,937,356 20,420,020 21,156,596 22,352,163 12,550,157 13,177,914 13,307,736 14,705,790 15,096,101 17,228,237 3,159,080 3,224,053 3,361,812 3,478,532 3,635,092 3,540,011 5,449,323 7,835,918 6,265,257 7,451,947 7,433,106 6,485,394
517,098 55,880 57,902 - - - 2,281,105 1,647,399 185,451 695,341 660,157 (566,064) 4,412,125 5,193,850 7,310,544 5,960,967 6,999,034 4,236,920
95,934 98,811 101,775 101,775 101,775 101,775 - 55,825,872 (19,629,066) - - 9,789,266
59,352,896 110,373,253 31,898,767 52,814,372 55,081,861 63,167,702
- - - - 1,553 3,513 (95,934) (98,811) (101,775) (101,775) (101,775) (101,775) (95,934) (98,811) (101,775) (101,775) (100,222) (98,262)
59,256,962 110,274,442 31,796,992 52,712,597 54,981,639 63,069,440
(8,448,466) 44,345,932 (26,713,424) (299,911) (1,752,840) 7,794,825 86,913 5,064 568,040 487,442 127,123 (323,721)
(8,361,553)$ 44,350,996$ (26,145,384)$ 187,531$ (1,625,717)$ 7,471,104$
Fiscal Year
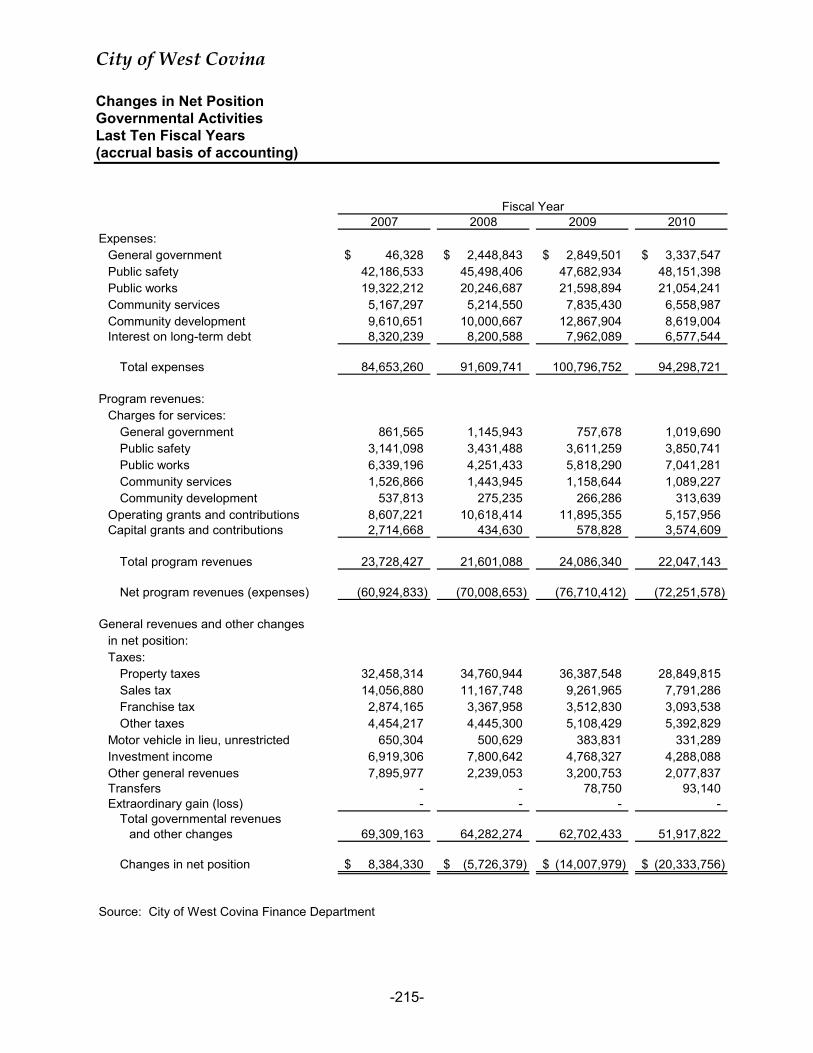
City of West Covina Changes in Net Position Governmental Activities Last Ten Fiscal Years (accrual basis of accounting)
-215-
2007 2008 2009 2010Expenses:
General government 46,328$ 2,448,843$ 2,849,501$ 3,337,547$ Public safety 42,186,533 45,498,406 47,682,934 48,151,398 Public works 19,322,212 20,246,687 21,598,894 21,054,241 Community services 5,167,297 5,214,550 7,835,430 6,558,987 Community development 9,610,651 10,000,667 12,867,904 8,619,004 Interest on long-term debt 8,320,239 8,200,588 7,962,089 6,577,544
Total expenses 84,653,260 91,609,741 100,796,752 94,298,721
Program revenues:Charges for services:
General government 861,565 1,145,943 757,678 1,019,690 Public safety 3,141,098 3,431,488 3,611,259 3,850,741 Public works 6,339,196 4,251,433 5,818,290 7,041,281 Community services 1,526,866 1,443,945 1,158,644 1,089,227 Community development 537,813 275,235 266,286 313,639
Operating grants and contributions 8,607,221 10,618,414 11,895,355 5,157,956 Capital grants and contributions 2,714,668 434,630 578,828 3,574,609
Total program revenues 23,728,427 21,601,088 24,086,340 22,047,143
Net program revenues (expenses) (60,924,833) (70,008,653) (76,710,412) (72,251,578)
General revenues and other changesin net position:Taxes:
Property taxes 32,458,314 34,760,944 36,387,548 28,849,815 Sales tax 14,056,880 11,167,748 9,261,965 7,791,286 Franchise tax 2,874,165 3,367,958 3,512,830 3,093,538 Other taxes 4,454,217 4,445,300 5,108,429 5,392,829
Motor vehicle in lieu, unrestricted 650,304 500,629 383,831 331,289 Investment income 6,919,306 7,800,642 4,768,327 4,288,088 Other general revenues 7,895,977 2,239,053 3,200,753 2,077,837 Transfers - - 78,750 93,140 Extraordinary gain (loss) - - - -
Total governmental revenuesand other changes 69,309,163 64,282,274 62,702,433 51,917,822
Changes in net position 8,384,330$ (5,726,379)$ (14,007,979)$ (20,333,756)$
Source: City of West Covina Finance Department
Fiscal Year

-216-
2011 2012 2013 2014 2015 2016
2,922,898$ 4,953,340$ 5,547,949$ 7,472,254$ 5,676,067$ 4,963,302$ 45,253,725 49,369,913 47,160,347 45,443,958 49,813,447 48,410,511 21,052,423 20,510,387 20,465,106 21,109,952 20,586,770 20,259,279 6,629,292 6,949,951 6,911,667 6,437,040 7,035,872 7,368,492 9,414,730 4,071,050 708,422 658,082 766,886 753,721 7,101,037 5,927,002 1,652,751 1,677,062 1,353,156 1,572,645
92,374,105 91,781,643 82,446,242 82,798,348 85,232,198 83,327,950
681,877 599,066 548,333 486,478 885,123 400,051 3,571,864 3,196,729 3,018,478 3,037,891 2,825,831 3,170,579 8,043,988 7,046,096 7,781,333 8,878,122 8,278,038 8,271,744 1,166,675 1,141,162 1,195,612 1,180,562 1,275,278 1,365,482
240,462 255,669 348,112 621,352 502,621 425,013 10,189,050 12,557,141 10,344,778 11,021,410 12,405,742 13,317,378
678,827 958,459 597,405 4,458,250 2,224,864 1,004,826
24,572,743 25,754,322 23,834,051 29,684,065 28,397,497 27,955,073
(67,801,362) (66,027,321) (58,612,191) (53,114,283) (56,834,701) (55,372,877)
30,888,074 23,313,556 20,937,356 20,420,020 21,156,596 22,352,163 12,550,157 13,177,914 13,307,736 14,705,790 15,096,101 17,228,237 3,159,080 3,224,053 3,361,812 3,478,532 3,635,092 3,540,011 5,449,323 7,835,918 6,265,257 7,451,947 7,433,106 6,485,394
517,098 55,880 57,902 - - - 2,281,105 1,647,399 185,451 695,341 660,157 (566,064) 4,412,125 5,193,850 7,310,544 5,960,967 6,999,034 4,236,920
95,934 98,811 101,775 101,775 101,775 101,775 - 55,825,872 (19,629,066) - - 9,789,266
59,352,896 110,373,253 31,898,767 52,814,372 55,081,861 63,167,702
(8,448,466)$ 44,345,932$ (26,713,424)$ (299,911)$ (1,752,840)$ 7,794,825$
Fiscal Year

City of West Covina Changes in Net Position Business-Type Activities Last Ten Fiscal Years (accrual basis of accounting)
-217-
2007 2008 2009 2010Expenses:
Computer Enterprise 2,470,811$ 2,682,467$ 2,633,564$ 2,507,498$
Total expenses 2,470,811 2,682,467 2,633,564 2,507,498
Program revenues:Charges for services:
Computer Enterprise 1,765,224 1,755,717 1,885,071 2,193,037
Total program revenues 1,765,224 1,755,717 1,885,071 2,193,037
Net revenues (expenses) (705,587) (926,750) (748,493) (314,461)
General revenues and other changesin net position:
Investment income 66,873 37,149 12,814 108 Transfers - - (78,750) (93,140)
Total general revenues and other changes 66,873 37,149 (65,936) (93,032)
Changes in net position (638,714)$ (889,601)$ (814,429)$ (407,493)$
Source: City of West Covina Finance Department
Fiscal Year

-218-
2011 2012 2013 2014 2015 2016
2,086,135$ 1,701,367$ 1,435,606$ 1,284,419$ 1,427,789$ 1,638,573$
2,086,135 1,701,367 1,435,606 1,284,419 1,427,789 1,638,573
2,268,982 1,805,242 2,105,421 1,873,636 1,655,134 1,413,114
2,268,982 1,805,242 2,105,421 1,873,636 1,655,134 1,413,114
182,847 103,875 669,815 589,217 227,345 (225,459)
- - - - 1,553 3,513 (95,934) (98,811) (101,775) (101,775) (101,775) (101,775)
(95,934) (98,811) (101,775) (101,775) (100,222) (98,262)
86,913$ 5,064$ 568,040$ 487,442$ 127,123$ (323,721)$
Fiscal Year

City of West Covina Fund Balances of Governmental Funds Last Ten Fiscal Years (modified accrual basis of accounting)
-219-
2007 2008 2009 2010General fund:
Reserved 24,793,675$ 23,805,491$ 22,621,000$ 24,321,122$ Unreserved 19,315,808 16,021,539 12,846,323 7,246,828
Total general fund 44,109,483$ 39,827,030$ 35,467,323$ 31,567,950$
All other governmental funds:Reserved 42,527,670$ 33,118,104$ 28,675,986$ 24,916,095$ Unreserved, reported in:
Special revenue funds 8,293,679 9,438,350 9,297,969 10,351,716 Capital projects funds 4,134,045 (631,251) (2,380,312) (465,131) Debt service funds (1,825,601) 860,278 3,085,503 (131,153)
Total all other governmental funds 53,129,793$ 42,785,481$ 38,679,146$ 34,671,527$
General Fund:Nonspendable -$ -$ -$ -$ Unassigned - - - -
Total general fund -$ -$ -$ -$
All other governmental funds:Nonspendable -$ -$ -$ -$ Restricted - - - - Assigned - - - - Unassigned - - - -
Total all other governmental funds -$ -$ -$ -$
Source: City of West Covina Finance Department
Fiscal Year
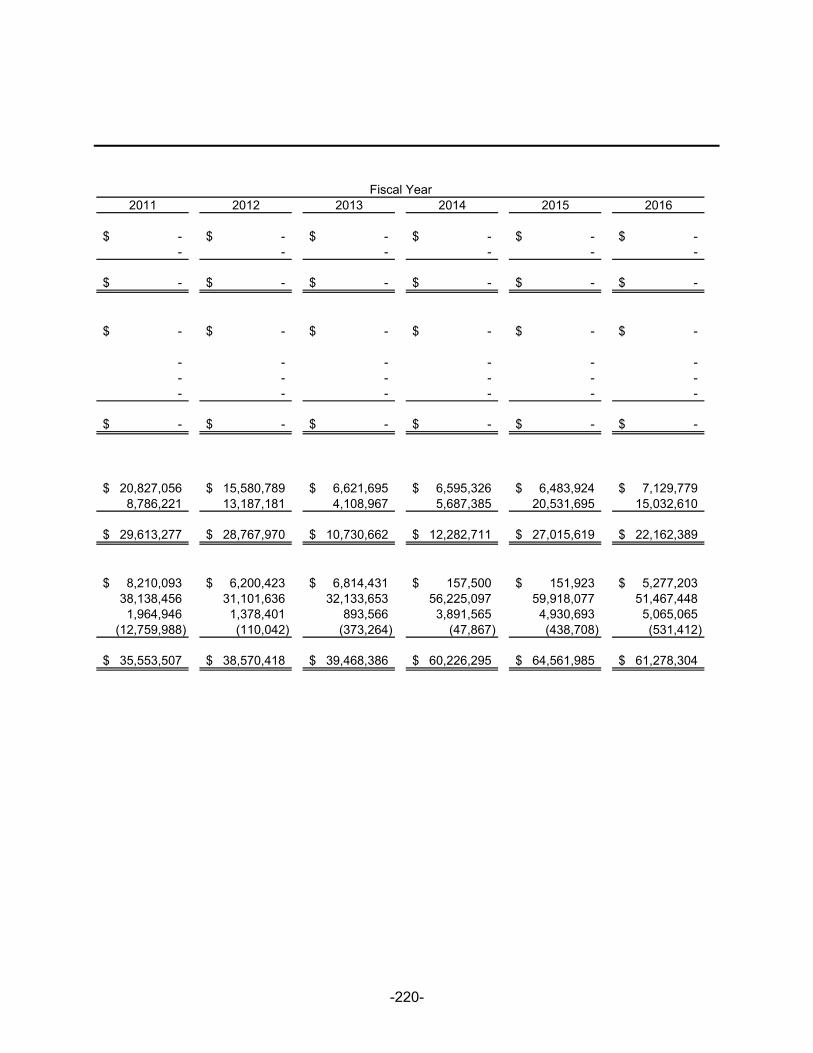
-220-
2011 2012 2013 2014 2015 2016
-$ -$ -$ -$ -$ -$ - - - - - -
-$ -$ -$ -$ -$ -$
-$ -$ -$ -$ -$ -$
- - - - - - - - - - - - - - - - - -
-$ -$ -$ -$ -$ -$
20,827,056$ 15,580,789$ 6,621,695$ 6,595,326$ 6,483,924$ 7,129,779$ 8,786,221 13,187,181 4,108,967 5,687,385 20,531,695 15,032,610
29,613,277$ 28,767,970$ 10,730,662$ 12,282,711$ 27,015,619$ 22,162,389$
8,210,093$ 6,200,423$ 6,814,431$ 157,500$ 151,923$ 5,277,203$ 38,138,456 31,101,636 32,133,653 56,225,097 59,918,077 51,467,448
1,964,946 1,378,401 893,566 3,891,565 4,930,693 5,065,065 (12,759,988) (110,042) (373,264) (47,867) (438,708) (531,412)
35,553,507$ 38,570,418$ 39,468,386$ 60,226,295$ 64,561,985$ 61,278,304$
Fiscal Year

City of West Covina Changes in Fund Balances of Governmental Funds Last Ten Fiscal Years (modified accrual basis of accounting)
-221-
2007 2008 2009 2010Revenues:
Taxes 62,801,264$ 65,069,488$ 65,186,854$ 63,270,166$ Special assessments 3,711,712 3,913,965 4,180,404 4,871,575 Licenses and permits 1,833,239 1,196,670 1,085,650 904,985 Fines and forfeitures 1,106,271 1,216,628 1,229,852 1,324,698 Investment income 9,544,547 8,778,813 5,601,091 5,589,739 Rental income 223,668 270,058 311,997 310,819 Intergovernmental 7,491,065 8,113,584 8,848,048 11,321,980 Charges for services 8,515,601 8,178,880 7,021,197 6,845,511 Repayment of notes and loans 988,220 1,048,727 794,365 449,045 Developer fees 1,462,535 10,950 - - Other 8,903,148 662,988 1,824,050 1,112,553
Total revenues 106,581,270 98,460,751 96,083,508 96,001,071
ExpendituresCurrent:
General government 5,478,534 5,787,654 4,687,485 4,646,621 Public safety 41,602,661 44,138,678 45,554,204 45,639,257 Public works 15,623,128 16,308,548 17,923,628 19,686,587 Community services 31,362,253 24,580,791 7,189,514 5,390,364 Community development 7,120,280 7,632,478 10,739,465 6,142,905 Pass-through payments 2,568,343 2,825,925 3,468,902 9,724,035 Capital Outlay - - - -
Debt service:Principal retirement 4,014,507 3,441,290 3,828,282 4,108,592 Interest and fiscal charges 10,059,439 9,827,109 9,055,221 8,410,803 Cost of issuance 294,764 - - - Developer agreement payments 2,783,820 2,939,322 2,181,599 2,002,039
Total expenditures 120,907,729 117,481,795 104,628,300 105,751,203
Excess (deficiency) of revenues over (under) expenditures (14,326,459) (19,021,044) (8,544,792) (9,750,132)
Other financing sources (uses):Transfers in 33,024,064 9,976,252 12,048,364 11,023,152 Transfers out (33,024,064) (9,901,252) (11,969,614) (9,180,012) Acquisition under capital leases - - - - Issuance of bonds 18,005,000 4,319,279 - - Payment to refunded bond escrow agent - - - - Extraordinary gain (loss)
Total other financing sources (uses) 18,005,000 4,394,279 78,750 1,843,140
Net change in fund balances 3,678,541$ (14,626,765)$ (8,466,042)$ (7,906,992)$
Debt service as a percentage of noncapital expenditures 23.60% 21.10% 19.30% 25.60%
Source: City of West Covina Finance Department
Fiscal Year

-222-
2011 2012 2013 2014 2015 2016
63,663,702$ 53,636,172$ 46,185,045$ 48,785,393$ 50,918,823$ 54,237,649$ 5,210,062 5,270,856 5,511,465 5,513,535 5,595,338 5,550,657 1,099,083 866,642 1,156,196 1,717,153 1,419,457 1,156,613 1,056,923 1,097,836 1,048,819 1,036,732 959,606 796,989 4,124,960 3,419,665 533,388 716,472 679,844 (570,132)
468,123 421,521 370,913 367,798 406,350 529,833 8,363,460 12,481,691 9,496,633 11,097,551 10,769,196 11,218,711 6,779,667 6,732,076 6,124,201 6,751,541 6,803,615 7,731,236
721,348 332,698 925,235 26,148 - - - - - - - -
3,781,096 1,720,792 5,105,117 6,258,384 5,490,327 1,487,103 95,268,424 85,979,949 76,457,012 82,270,707 83,042,556 82,138,659
4,180,878 4,950,311 5,205,956 7,087,335 5,757,334 5,103,814 41,938,421 44,109,598 42,688,487 43,332,847 45,906,138 50,962,883 15,325,261 18,209,981 16,203,144 17,790,042 13,724,417 15,509,267 5,412,009 5,917,227 5,872,485 5,399,732 5,816,443 6,864,180 8,228,653 4,246,590 666,255 679,007 761,896 898,714 5,863,850 2,112,227 - - - -
- - - - - -
4,649,975 5,155,105 1,773,261 1,870,239 1,866,947 2,027,461 8,520,890 6,307,988 1,659,473 1,666,054 1,360,370 1,574,753
- - - - - - 2,317,114 351,444 - - - -
96,437,051 91,360,471 74,069,061 77,825,256 75,193,545 82,941,072
(1,168,627) (5,380,522) 2,387,951 4,445,451 7,849,011 (802,413)
11,171,460 8,947,657 3,639,400 3,744,115 3,201,793 4,831,038 (11,075,526) (8,848,846) (3,537,625) (3,642,340) (3,100,018) (10,812,296)
- - - - - 2,568,446 - - - 2,185,000 - - - - - (2,248,061) - -
7,453,315 (19,629,066) - 11,578,351 - 95,934 7,552,126 (19,527,291) 38,714 11,680,126 (3,412,812)
(1,072,693)$ 2,171,604$ (17,139,340)$ 4,484,165$ 19,529,137$ (4,215,225)$
19.89% 16.20% 5.21% 5.18% 4.92% 4.70%
Fiscal Year

City of West Covina Assessed Value and Estimated Actual Value of Taxable Property (1) Last Ten Fiscal Years
-223-
Fiscal Year TaxableEnded Less: Assessed
June 30 Secured Non- Unitary Unsecured Exemptions Value
2007 5,838,746$ 464$ 14,903$ (56,655)$ 5,797,458$
2008 6,261,173 462 15,899 (76,713) 6,200,821
2009 6,549,882 462 15,315 (78,464) 6,487,195
2010 6,281,230 - 15,205 (76,991) 6,219,444
2011 6,276,734 - 11,705 (86,340) 6,202,099
2012 6,381,873 - 12,762 (85,792) 6,308,843
2013 6,477,468 - 10,645 (93,277) 6,394,836
2014 6,670,267 - 15,080 (73,615) 6,611,732
2015 7,116,733 - 12,346 (94,084) 7,034,995
2016 7,458,200 - 14,738 (95,915) 7,377,023
NOTE:
City
In 1978 the voters of the State of California passed Proposition 13 which limited property taxes to a total maximum rate of 1% based upon the assessed value of the property being taxed. Each year, the assessed value of property may be increased by an "inflation factor" (limited to a maximum increase of 2%). With few exceptions, property is only reassessed at the time that it is sold to a new owner. At that point, the new assessed value is reassessed at the purchase price of the property sold. The assessed valuation data shown above represents the only data currently available with respect to the actual market value of taxable property and is subject to the limitations described above.

-224-
City and SATaxable Total Taxable Total
Less: Assessed Assessed Direct TaxSecured Unsecured Exemptions Value Value Rate
1,895,168$ 146,336$ (123,048)$ 1,918,456$ 7,715,914$ 30.751%
2,038,968 144,533 (138,919) 2,044,582 8,245,403 30.818%
2,283,051 150,880 (143,108) 2,290,823 8,778,018 32.247%
2,339,976 163,198 (152,699) 2,350,475 8,569,919 33.284%
2,336,269 157,035 (142,764) 2,350,540 8,552,639 33.326%
2,408,026 152,958 (152,569) 2,408,415 8,717,258 33.518%
2,429,152 160,821 (152,386) 2,437,587 8,832,423 33.456%
2,498,131 161,438 (186,502) 2,473,067 9,084,799 14.083%
2,566,170 161,710 (184,907) 2,542,973 9,577,968 14.116%
2,795,635 162,488 (189,554) 2,768,569 10,145,592 14.138%
Successor Agency (SA) of the former Community Development Commission (CDC)

City of West Covina Direct and Overlapping Property Tax Rates (1) Last Ten Fiscal Years (rate per $100 of assessed value)
-225-
2007 2008 2009 2010
Basic Levy11.00000 1.00000 1.00000 1.00000
Baldwin Park Unified 0.08877 0.13260 0.15384 0.16101Bassett Unified School District 0.08210 0.10806 0.08990 0.10877County Detention Facilities 1987 Debt 0.00066 0.00000 0.00000 0.00000Covina Valley Unified School District 0.08419 0.07870 0.07863 0.08592Hacienda-La Puente Unified 0.05239 0.05103 0.05681 0.05973LA County Flood Control 0.00005 0.00000 0.00000 0.00000Metropolitan Water District 0.00470 0.00450 0.00430 0.00430Mt. San Antonio College 0.02530 0.01750 0.02333 0.02571Rowland Heights Unified 0.07429 0.06944 0.07029 0.06769Walnut Valley Unified 0.08749 0.08462 0.11297 0.11674West Covina Municipal Maint. Dist. 0.16980 0.17480 0.17830 0.18180West Covina Unified 0.06511 0.05143 0.06041 0.05258Total Direct & Overlapping2 Tax Rates 1.73485 1.77267 1.82876 1.86426
City Share of 1% Levy Per Prop 1330.13820 0.13820 0.13820 0.13820
Redevelopment Rate41.00541 1.00450 1.00430 1.00430
Total Tax Rate50.30751 0.30818 0.32247 0.33284
Source: Los Angeles County Assessor 2006/07 - 2015/16 Tax Rate Table
5 Total Direct Rate is the weighted average of all individual direct rates applied to by the government preparing the statistical section information and excludes revenues derived from aircraft taxes. Beginning in 2013/14 the Total Direct Rate no longer includes revenue generated from the former redevelopment tax rate areas. Challenges to recognized enforceable obligations are assumed to have been resolved during 2012/13. For the purpose of this report, residual revenue is assumed to be distributed to the City in the same proportions as general fund revenue.
4 Redevelopment Rate is based on the largest RDA tax rate area and only includes rate(s) from indebtedness adopted prior to 1989 per California State statute. RDA direct and overlapping rates are applied only to the incremental property values. The approval of ABX1 26 eliminated Redevelopment from the State of California for the fiscal year 2012/13 and years
3 City's share of 1% Levy is based on the City's share of the general fund tax rate area with the largest net taxable value within the City. ERAF general fund tax shifts may not be included in tax ratio figures.
2 Overlapping rates are those of local and county governments that apply to property owners within the City. Not all overlappping rates apply to all city property owners.
1 In 1978, California voters passed Proposition 13 which set the property tax rate at a 1.00% fixed amount. This 1.00% is shared by all taxing agencies for which the subject property resides within. In addition to the 1.00% fixed amount, property owners are charged taxes as a percentage of assessed property values for the payment of any voter approved bonds.
Fiscal Year
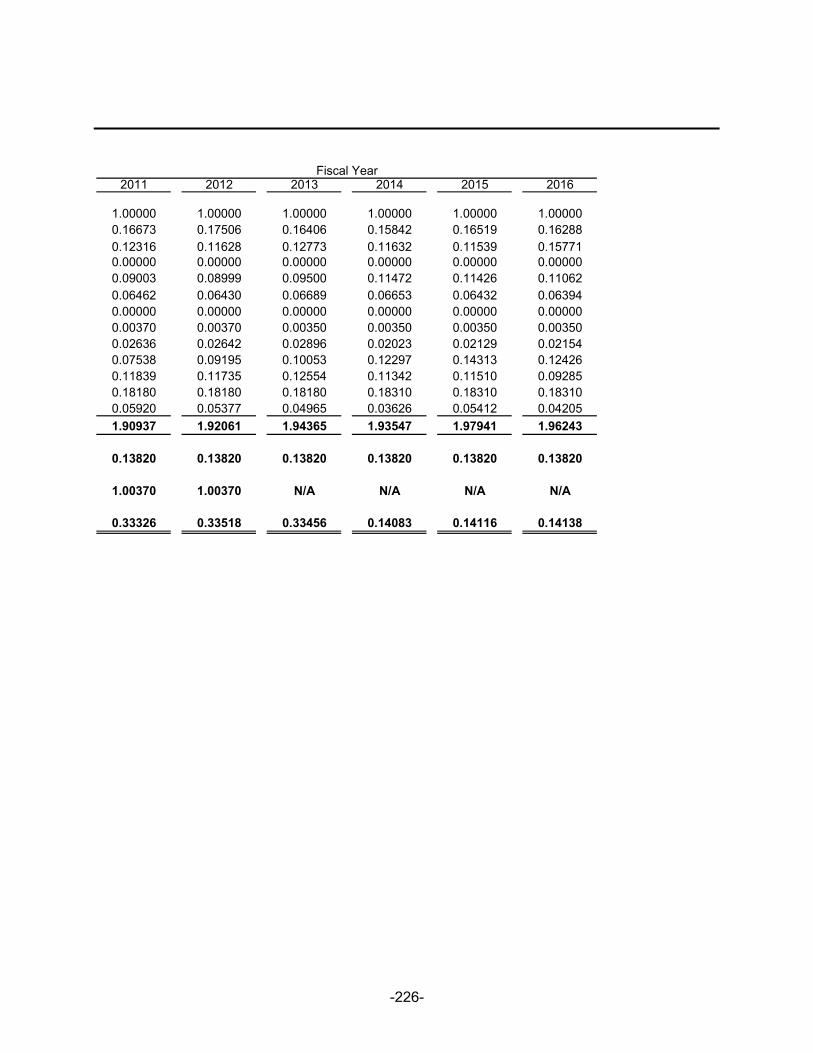
-226-
2011 2012 2013 2014 2015 2016
1.00000 1.00000 1.00000 1.00000 1.00000 1.000000.16673 0.17506 0.16406 0.15842 0.16519 0.162880.12316 0.11628 0.12773 0.11632 0.11539 0.157710.00000 0.00000 0.00000 0.00000 0.00000 0.000000.09003 0.08999 0.09500 0.11472 0.11426 0.110620.06462 0.06430 0.06689 0.06653 0.06432 0.063940.00000 0.00000 0.00000 0.00000 0.00000 0.000000.00370 0.00370 0.00350 0.00350 0.00350 0.003500.02636 0.02642 0.02896 0.02023 0.02129 0.021540.07538 0.09195 0.10053 0.12297 0.14313 0.124260.11839 0.11735 0.12554 0.11342 0.11510 0.092850.18180 0.18180 0.18180 0.18310 0.18310 0.183100.05920 0.05377 0.04965 0.03626 0.05412 0.04205
1.90937 1.92061 1.94365 1.93547 1.97941 1.96243
0.13820 0.13820 0.13820 0.13820 0.13820 0.13820
1.00370 1.00370 N/A N/A N/A N/A
0.33326 0.33518 0.33456 0.14083 0.14116 0.14138
Fiscal Year

This page intentionally left blank.

City of West Covina Principal Property Taxpayers Current Year and Nine Years Ago
-227-
Percent of Percent of Taxable Total Taxable Taxable Total Taxable
Assessed Assessed Assessed AssessedTaxpayer Value Rank Value Value Rank Value
Plaza West Covina LLC 224,708,376$ 1 2.21% 175,557,475$ 1 2.28%
Eastland Shopping Center LLC 151,417,830 2 1.49% 89,382,037 2 1.16%
La Palma Royale LLC 56,969,885 3 0.56% - 0.00%
Glendora Avenue Properties LLC 51,748,570 4 0.51% - 0.00%
301 South Glendora Avenue Apts 49,609,290 5 0.49% - 0.00%
CIP 2014 SG Covina Owner LLC 46,800,000 6 0.46% - 0.00%
CSMC 2006 C5 North Barranca St 46,100,000 7 0.45% - 0.00%
TPA of NASCH LLC 45,728,385 8 0.45% - 0.00%
Bently Real Estate LLC 40,595,815 9 0.40% - 0.00%
Hassen Real Estate Partnership 37,062,125 10 0.37% 52,911,869 3 0.69%
PPC WR Apartments - 0.00% 48,511,798 4 0.63%
Ten West Associates LLC - 0.00% 40,180,000 5 0.52%
PPC AVF III Pacific LLC - 0.00% 37,909,950 6 0.49%
West Covina 8 B LLC - 0.00% 35,809,360 7 0.46%
Eastland Tower Partnership - 0.00% 31,650,000 8 0.41%
Pried XIV Trust - 0.00% 27,349,820 9 0.35%
Sears Development Company - 0.00% 27,345,173 10 0.35%
Totals 750,740,276$ 7.40% 566,607,482$ 7.34%
Non UnitaryTax Roll
2016 2007
Source: HdL Coren & Cone; Los Angeles County Assessor 2006-07 and 2015-16 Combined Tax Rolls and the SBE

City of West Covina Property Tax Levies and Collections Last Ten Fiscal Years (1)
-228-
Fiscal Taxes Levied Collections inYear Ended for the Percent Subsequent Percent
June 30 Fiscal Year Amount of Levy Years Amount of Levy
2007 8,255,755$ 7,536,422$ 91.29% (7,738)$ 7,528,684$ 91.19%
2008 8,788,631 7,766,633 88.37% (65,994) 7,700,639 87.62%
2009 9,207,210 8,509,721 92.42% 104,568 8,614,289 93.56%
2010 8,913,839 8,152,304 91.46% 111,790 8,264,094 92.71%
2011 8,782,946 8,287,440 94.36% 201,261 8,488,701 96.65%
2012 8,961,279 8,280,265 92.40% (167,264) 8,113,001 90.53%
2013 9,094,235 8,853,013 97.35% (75,056) 8,777,957 96.52%
2014 9,119,226 9,105,997 99.85% (67,229) 9,038,768 99.12%
2015 9,702,185 53,266 0.55% 34,965 88,231 0.91%
2016 10,173,156 9,881,520 97.13% 88,647 9,970,167 98.00%
Notes:
Fiscal Year of LevyCollected within the
Total Collections to Date
Fiscal year 2012 collections for Community Development Commission are as of January 1, 2012. This is due to ABx1 26 (RDA Dissolution Bill ) that was effective February 1, 2012. Subsequent to January 1, 2012, there were no property taxes levied under the Community Development Commission.
City
The amounts presented include City property taxes and Community Development Commission tax increment. This schedule also includes amounts collected by the City and the Community Development Commission that were passed-through to other agencies.

-229-
Fiscal Taxes Levied Collections inYear Ended for the Percent Subsequent Percent
June 30 Fiscal Year Amount of Levy Years Amount of Levy
2007 15,942,115$ 15,927,954$ 99.91% 827,358$ 16,755,312$ 105.10%
2008 17,595,311 17,485,161 99.37% 1,100,374 18,585,535 105.63%
2009 19,346,023 18,610,849 96.20% 833,301 19,444,150 100.51%
2010 20,058,658 19,121,096 95.33% 349,563 19,470,659 97.07%
2011 20,132,138 19,147,814 95.11% 394,313 19,542,127 97.07%
2012 20,612,835 8,727,674 42.34% 191,262 8,918,936 43.27%
2013 N/A N/A N/A N/A N/A N/A
2014 N/A N/A N/A N/A N/A N/A
2015 N/A N/A N/A N/A N/A N/A
2016 N/A N/A N/A N/A N/A N/A
Total Collections to Date
Community Development Commission
Fiscal Year of LevyCollected within the

City of West Covina Ratios of Outstanding Debt by Type Last Ten Fiscal Years
-230-
Fiscal Year Lease Special Tax Capital TotalEnded Revenue Assessment Allocation Lease Governmental
June 30 Bonds Bonds (a) Bonds (1) (a) Loans Obligations Activities
2007 60,570,000$ 41,240,000$ 30,140,000$ 27,764,353$ 398,483$ 160,112,836$
2008 59,395,000 40,040,000 29,170,000 31,584,157 3,267,104 163,456,261
2009 58,530,000 38,745,000 28,165,000 34,960,554 2,691,276 163,091,830
2010 57,515,000 37,355,000 27,020,000 38,733,523 2,261,401 162,884,924
2011 56,115,000 35,870,000 25,815,000 42,385,673 1,843,538 162,029,211
2012 50,825,000 - - 1,800,221 1,409,134 54,034,355
2013 49,645,000 - - 1,658,532 957,535 52,261,067
2014 48,385,000 - - 1,512,768 773,282 50,671,051
2015 47,225,000 - - 12,941,113 216,342 60,382,455
2016 46,000,000 - - 12,208,103 2,715,337 60,923,440
Notes: Details regarding the City's outstanding debt can be found in the notes to the financial statements.
(a) As a result of the dissolution of the Community Development Commission on January 31, 2012 indebtedness was transferred to the Successor Agency.
(2) These ratios are calculated using personal income and population for the prior calendar year.
(1) The 1994 West Covina Public Financing Authority Water Revenue Bonds were defeased as of June 30, 2000 due to the sale of the City's water system.
Governmental Activities

-231-
Total Total Percentage DebtCertificates of Business-type Primary of Personal PerParticipation Activities Government Income (2) Capita (2)
-$ -$ 160,112,836$ 6.10% 1,431$
- - 163,456,261 6.19% 1,461
- - 163,091,830 6.29% 1,453
- - 162,884,924 6.38% 1,443
- - 162,029,211 6.07% 1,518
- - 54,034,355 1.96% 504
- - 52,261,067 1.94% 485
- - 50,671,051 1.88% 470
- - 60,382,455 2.28% 560
- - 60,923,440 2.27% 565
Business-Type Activities

City of West Covina Ratios of General Bonded Debt Outstanding Last Ten Fiscal Years
-232-
Fiscal Year Lease Special Tax Percent ofEnded Revenue Assessment Allocation Assessed Per
June 30 Bonds Bonds(a) Bonds(a) Total Value(1) Capita
2007 60,570$ 41,240$ 30,140$ 131,950$ 1.71% 541
2008 59,395 40,040 29,170 128,605 1.56% 531
2009 58,530 38,745 28,165 125,440 1.43% 522
2010 57,515 37,355 27,020 121,890 1.42% 509
2011 56,115 35,870 25,815 117,800 1.38% 526
2012 50,825 - - 50,825 0.81% 474
2013 49,645 - - 49,645 0.78% 460
2014 48,385 - - 48,385 0.73% 449
2015 47,225 - - 47,225 0.67% 438
2016 46,000 - - 46,000 0.62% 426
Notes:
(a) As a result of the dissolution of the Community Development Commission on January 31, 2012 indebtedness was transferred to the Successor Agency.
(1) Assessed value has been used because the actual value of taxable property is not readily available in the State of California.
General bonded debt is debt payable with governmental fund resources and general obligation bonds recorded in enterprise funds (of which, the City has none).

City of West Covina Direct and Overlapping Debt June 30, 2016
-233-
Estimated Estimated ShareDebt Percentage of Overlapping
Governmental Unit Outstanding Applicable (1) Debt
Debt repaid with Property Taxes:
Metropolitan Water District 44,916,916$ 0.753 338,074$ Mt. San Antonio CCD DS 2001, 2006 Series C 1,000,000 12.819 128,191 Mt. San Antonio CCD DS 2001, 2008 Series D 1,000,924 12.819 128,309 Mt. San Antonio CCD DS 2008 Series 2013A 202,351,691 12.819 25,939,569 Mt. San Antonio CCD DS 2008 Series 2013B 9,555,000 12.819 1,224,860 Mt. San Antonio CCD DS 2013 Ref Series A 70,910,000 12.819 9,089,990 Mt. San Antonio CCD DS 2013 Ref Series B 44,045,000 12.819 5,646,152 Mt. San Antonio CCD DS 2008 Series 2015C 39,130,000 12.819 5,016,095 Baldwin Park USD 1996 Series A 741,058 0.295 2,189 Baldwin Park USD 2001 Refunding Bonds 530,000 0.295 1,566 Baldwin Park USD 2002 Series 2004 4,174,767 0.295 12,333 Baldwin Park USD 2005 Refund Bonds 3,108,699 0.295 9,183 Baldwin Park USD 2002 Series 2005 108,232 0.295 320 Baldwin Park USD 2002 Series 2006 1,265,000 0.295 3,737 Baldwin Park USD 2006 Series 2007 683,605 0.295 2,019 Baldwin Park USD 2006 Series 2008 23,736,780 0.295 70,121 Baldwin Park USD DS 2006 Series 2013 68,780,000 0.295 203,183 Basset USD DS 2004 Series 2005 A 773,352 0.060 467 Basset USD DS 2006 Series 2007 4,636,192 0.060 2,800 Basset USD DS 2006 Series B 2,409,566 0.060 1,455 Basset USD DS 2014 Ref Series A 4,999,970 0.060 3,020 Basset USD DS 2014 Ref Series B 8,445,000 0.060 5,101 Basset USD DS 2014 Series A 25,090,000 0.060 15,155 Covina Valley USD DS 2001 Series B 14,161,686 32.017 4,534,134 Covina Valley USD DS 2006, 07 Series B 13,711,450 32.017 4,389,982 Covina Valley USD DS 2001 Refund 2010 Series A 11,645,000 32.017 3,728,369 Covina Valley USD DS 2012 Series A 27,565,000 32.017 8,825,461 Covina Valley USD DS 2013 Ref Bonds 39,280,000 32.017 12,576,242 Covina Valley USD DS 2012 Series B 37,000,000 32.017 11,846,256 Hacienda-La Puente USD DS 2000 Series A 2,091,173 1.345 28,133 Hacienda-La Puente USD DS 2000 Series 2003B 2,821,876 1.345 37,963 Hacienda-La Puente USD DS 2005 Refunding Bonds 23,615,000 1.345 317,695 Hacienda-La Puente USD DS 2007 Refunding 54,550,000 1.345 733,866 Rowland Heights USD DS 2000 Series A 1,531,982 15.023 230,143 Rowland Heights USD DS 2000 Series B 439,075 15.023 65,960 Rowland Heights USD DS 2005 Ref Bonds 9,538,815 15.023 1,432,977 Rowland Heights USD DS 2006 Series A 735,000 15.023 110,416 Rowland Heights USD DS 2006 Series B 28,197,549 15.023 4,236,003 Rowland Heights USD DS 2006 Series C (BABS) 12,000,000 15.023 1,802,711 Rowland Heights USD DS 2006 Series D QSCB 20,150,000 15.023 3,027,053 Rowland Heights USD DS 2006 Series E 557,451 15.023 83,744 Rowland Heights USD DS 2012 Series A 72,410,000 15.023 10,877,861 Rowland Heights USD DS 2013 Ref Bonds 111,219,972 15.023 16,708,125 Walnut Valley USD DS 2000 Series E 16,694,951 0.741 123,759 Walnut Valley USD DS 2007 Series A (Measure S) 1,685,000 0.741 12,491 Walnut Valley USD DS 2007 Series A (Measure Y) 285,887 0.741 2,119 Walnut Valley USD DS 2011 Refunding 27,329,521 0.741 202,593 Walnut Valley USD DS 2012 Ref Bonds 5,585,000 0.741 41,401 Walnut Valley USD DS 2014 Ref Bonds Series A 24,470,000 0.741 181,395 Walnut Valley USD DS 2014 Ref Bonds Series B 40,660,000 0.741 301,411 West Covina USD 2002 Refunding Series A 12,160,000 95.421 11,603,196 West Covina USD DS 2012 Ref Bonds 13,455,000 95.421 12,838,898
Sub Total Overlapping Debt 158,744,246
City of West Covina Direct Debt - Lease Revenue Bonds 46,000,000
Total Direct and Overlapping Debt 204,744,246$
Source: HdL Coren & Cone, Los Angeles, County Assessor and Auditor Combined 2015-16 Lien Date Tax Rolls
Note: Overlapping governments are those that coincide, at least in part, with the geographic boundaries of the City. This schedule estimates the portion of the outstanding debt of those overlapping governments that is borne by the residents and businesses of Glendora. This process recognizes that, when considering the City's ability to issue and repay long-term debt, the entire debt burden borne by the residents and businesses should be taken into account. However, this does not imply that every taxpayer is a resident and, therefore, responsible for the debt, for each overlapping government.
(1) The percentage of overlapping debt applicable is estimated using taxable assessed property values. Applicable percentages were estimated by determining the portion of the County's taxable assessed value that is within the government's boundaries and dividing it by the County's total taxable assessed value.
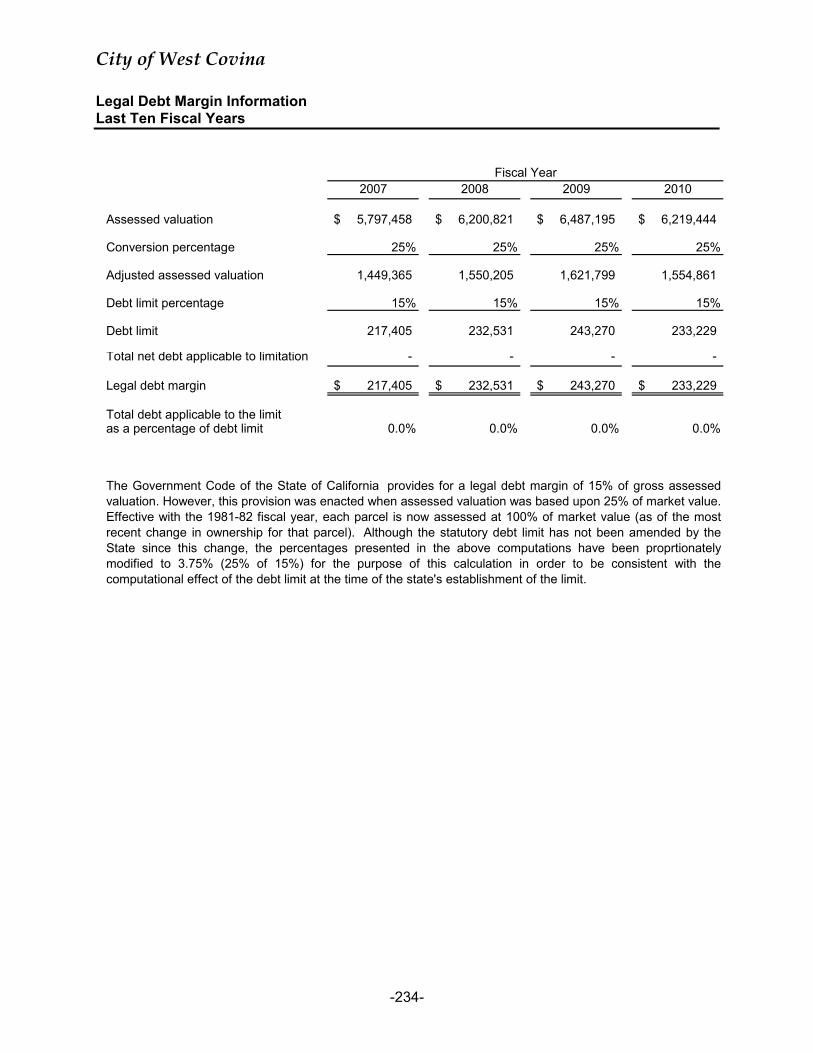
City of West Covina Legal Debt Margin Information Last Ten Fiscal Years
-234-
2007 2008 2009 2010
Assessed valuation 5,797,458$ 6,200,821$ 6,487,195$ 6,219,444$
Conversion percentage 25% 25% 25% 25%
Adjusted assessed valuation 1,449,365 1,550,205 1,621,799 1,554,861
Debt limit percentage 15% 15% 15% 15%
Debt limit 217,405 232,531 243,270 233,229
Total net debt applicable to limitation - - - -
Legal debt margin 217,405$ 232,531$ 243,270$ 233,229$
Total debt applicable to the limitas a percentage of debt limit 0.0% 0.0% 0.0% 0.0%
The Government Code of the State of California provides for a legal debt margin of 15% of gross assessedvaluation. However, this provision was enacted when assessed valuation was based upon 25% of market value. Effective with the 1981-82 fiscal year, each parcel is now assessed at 100% of market value (as of the mostrecent change in ownership for that parcel). Although the statutory debt limit has not been amended by theState since this change, the percentages presented in the above computations have been proprtionatelymodified to 3.75% (25% of 15%) for the purpose of this calculation in order to be consistent with thecomputational effect of the debt limit at the time of the state's establishment of the limit.
Fiscal Year

-235-
2011 2012 2013 2014 2015 2016
6,202,099$ 6,308,843$ 6,394,836$ 6,611,732$ 7,034,995$ 2,566,170$
25% 25% 25% 25% 25% 25%
1,550,525 1,577,211 1,598,709 1,652,933 1,758,749 641,543
15% 15% 15% 15% 15% 15%
232,579 236,582 239,806 247,940 263,812 96,231.38
- - - - - -
232,579$ 236,582$ 239,806$ 247,940$ 263,812$ 96,231$
0.0% 0.0% 0.0% 0.0% 0.0% 0.0%
Fiscal Year

City of West Covina Pledged-Revenue Coverage Last Ten Fiscal Years
-236-
Fiscal YearEnded
June 30 Revenue Principal Interest Coverage2007 47,964$ 2,130$ 2,411$ 10.56
2008 48,724 1,175 2,151 14.65
2009 48,251 865 1,675 19.00
2010 44,950 1,310 1,245 17.59
2011 47,672 1,855 1,268 15.26
2012 48,347 1,505 1,155 18.18
2013 53,006 1,605 1,272 18.42
2014 54,753 1,715 1,249 18.47
2015 57,588 1,655 891 22.62
2016 58,133 1,900 1,121 19.24
Fiscal YearEnded Tax
June 30 Increment Principal Interest Coverage2006 15,221$ 670$ 1,458$ 7.15
2007 16,755 690 1,474 7.74
2008 18,626 970 1,406 7.84
2009 19,444 1,005 1,293 8.46
2010 19,564 1,145 1,207 8.32
2011 19,542 1,205 1,127 8.38
2012 17,260 1,250 1,079 7.41
2013 12,152 1,305 1,030 5.20
2014 8,675 1,358 978 3.71
2015 9,260 1,420 920 3.96
2016 15,110 1,480 853 6.48
Note: Details regarding the city's outstanding debt can be found in the notes to the financial statements. Operating expenses do not include interest or depreciation expenses.Source: City of West Covina Finance Department
Debt Service
Lease Revenue Bonds and Certificates of Participation
Debt Service
Tax Allocation Bonds

-237-
Fiscal Year Less NetEnded Operating Available
June 30 Revenue Expenses Revenue Principal Interest Coverage2007 3,995$ 593$ 3,402$ 1,105$ 2,494$ 0.95
2008 3,765 811 2,954 1,200 2,430 0.81
2009 3,375 333 3,042 1,295 2,358 0.83
2010 3,828 72 3,756 1,390 2,281 1.02
2011 3,591 470 3,121 1,485 2,197 0.85
2012 4,444 70 4,374 1,580 2,105 1.19
2013 5,569 1,027 4,542 1,770 2,004 1.20
2014 5,740 767 4,973 2,055 1,890 1.26
2015 3,305 1,457 1,848 2,340 1,758 0.45
2016 6,911 1,429 5,482 2,940 2,124 1.08
Debt Service
Assessment District Bond

City of West Covina Demographic and Economic Statistics Last Ten Fiscal Years
-238-
PerPersonal Capita Annual
Calendar Income Personal UnemploymentYear Population (in thousands) Income Rate
2006 112,034 2,544,852$ 22,715$ 4.2%
2007 111,868 2,623,864 23,455 4.4%
2008 111,842 2,642,491 23,627 6.5%
2009 112,230 2,591,391 23,090 10.2%
2010 112,890 2,552,782 22,613 11.2%
2011 106,713 2,670,706 25,027 10.9%
2012 107,248 2,751,555 25,656 8.2%
2013 107,828 2,698,504 25,026 6.7%
2014 107,879 2,653,176 24,594 10.1%
2015 107,873 2,680,000 24,844 8.2%
Sources: HdL Coren & Cone, California State Department of Finance, and California Employement

City of West Covina Principal Employers Current Year and Nine Years Ago
-239-
Percent of Percent of Number of Total Number of Total
Employer Employees Rank Employment Employees Rank Employment
Queen of the Valley Campus 1,591 1 3.13% 1,700 1 3.18%
WC Unified School District 1,466 2 2.88% 950 2 1.78%
City of West Covina 339 3 0.67% 515 3 0.96%
Walmart Store #5954 300 4 0.59%
Macy's 289 5 0.57% 450 4 0.84%
Interspace/Concorde Battery Corpo 245 6 0.48% 215 9 0.40%
JC Penney Corp Inc. #1505-7 220 7 0.43% 215 10 0.40%
Target Store #T1028 215 8 0.42% 323 6 0.60%
S G V Newspaper Group 180 9 0.35% 378 5 0.71%
B.J.'s Restaurant & Brewery 176 10 0.35%
Progressive Mgmt Systems 217 8 0.41%
Penske Motors 228 7 0.43%
Totals 5,021 9.86% 5,191 9.71%
Note: "Total Employment" as used above represents the total employment of all employers located within City limits.
Source: Labor Market Info, EDD, State of California City of West Covina Business License section
20072016

This page intentionally left blank.

City of West Covina Full-time and Part-time City Employees By Function Last Ten Fiscal Years
-240-
Function 2007 2008 2009 2010 2011 2012 2013 2014 2015 2016
General government 43 43 42 40 39 36 31 31 31 32
Public safety 307 307 306 295 281 264 253 244 268 268
Public works 79 79 83 78 76 72 64 69 71 71
Community services 63 63 55 47 44 44 41 42 41 41
Community development 24 24 24 23 19 16 7 2 2 2
Total 516 516 510 483 459 432 396 389 413 414
Source: City of West Covina Finance Department
Fiscal year

City of West Covina Operating Indicators by Function (1) Last Ten Years
-241-
Function/Program 2007 2008 2009 2010
Public Safety:Police:
Total arrests 3,449 3,726 3,651 3,397
Calls for police service (1) 79,753 82,588 82,682 75,752 Graffiti sites cleaned (2) N/A 15,736 8,009 16,077
Fire:Emergency responses 7,064 7,167 7,194 6,949 Fire inspections 3,711 3,748 3,751 3,603
Public works:Building permits issued 3,854 3,189 2,891 2,334 Graffiti sites cleaned (2) N/A N/A N/A N/A
Community ServicesRecreation class registrations 4,850 5,097 6,564 7,916
Environmental Management
Graffiti sites cleaned (2) 17,903 N/A N/A N/A
Note:(1) Calls received that generated an incident number, not necessarily a police response.
(2)
Source: City of West Covina Finance Department
Fiscal Year
Due to department restructuring, the responsibility for graffiti abatement was absorbed by the Police Department starting fiscal year 2008-2009 and by Public Works starting fiscal year 2015-2016.

-242-
2011 2012 2013 2014 2015 2016
3,210 2,557 2,755 2,537 2,544 2,624
71,254 71,741 65,554 69,874 71,098 72,368 15,781 23,579 19,910 20,014 16,156 N/A
7,454 7,545 7,871 7,990 8,555 9,494 430 496 837 749 717 778
2,477 2,435 3,882 2,925 3,617 5,038 N/A N/A N/A N/A N/A 13,964
7,041 6,927 6,027 6,283 6,487 7,129
N/A N/A N/A N/A N/A N/A
Fiscal Year

City of West Covina Capital Asset Statistics by Function/Program Last Ten Fiscal Years
-243-
2007 2008 2009 2010
Public Safety:Police:
Stations 1 1 1 1
Fire:Stations 5 5 5 5
Public works:Streets (miles) 230.0 230.0 230.0 230.0 Streetlight poles 826 826 826 826 Streelight fixtures 1,109 1,109 1,109 1,109 Traffic signals 114 114 116 116
Parks and recreation:- 1 1 1
Parks 16 16 16 16 Community centers 4 4 4 4
Wastewater:Sanitary sewers (miles) 238.9 238.9 238.9 238.9 Storm sewers (miles) 42.0 42.0 42.0 42.0
Source: City of West Covina
Fiscal Year
Sports Complex
Function
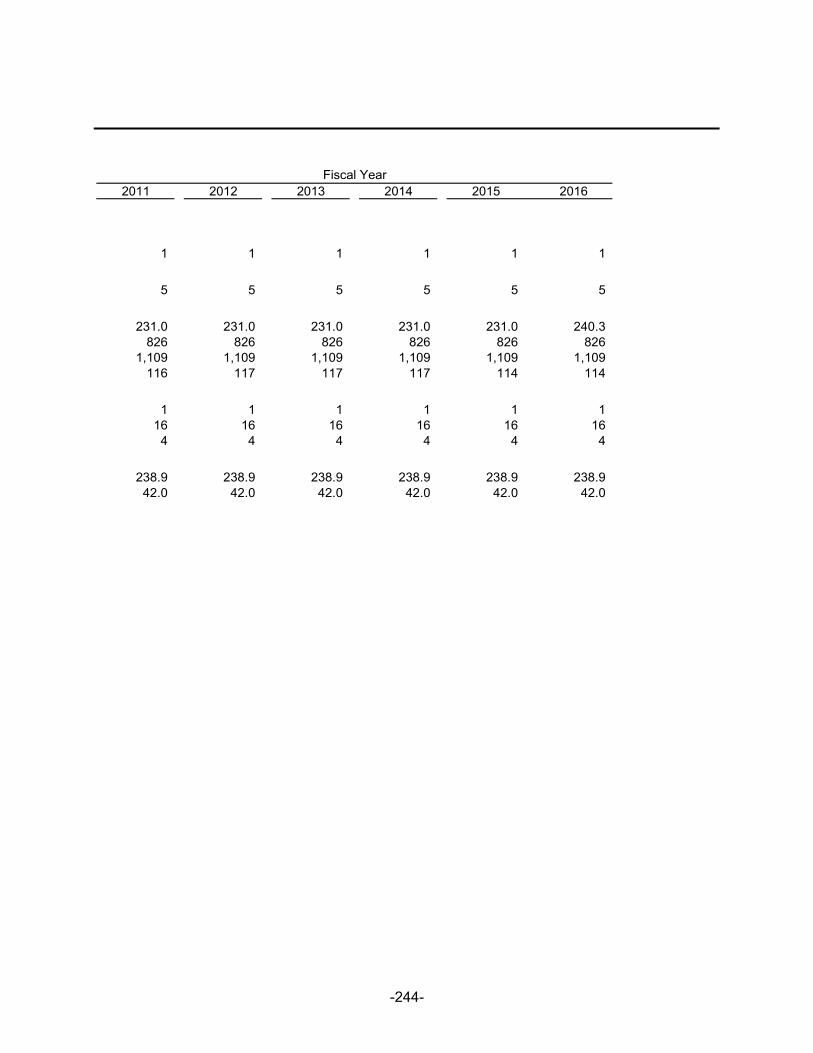
-244-
2011 2012 2013 2014 2015 2016
1 1 1 1 1 1
5 5 5 5 5 5
231.0 231.0 231.0 231.0 231.0 240.3 826 826 826 826 826 826
1,109 1,109 1,109 1,109 1,109 1,109 116 117 117 117 114 114
1 1 1 1 1 1 16 16 16 16 16 16
4 4 4 4 4 4
238.9 238.9 238.9 238.9 238.9 238.9 42.0 42.0 42.0 42.0 42.0 42.0
Fiscal Year

This page intentionally left blank.