city of fremont transportation impact analysis handbook
TRANSCRIPT

Transportation Impact Analysis Handbook | Final City of Fremont
i
City of Fremont Transportation Impact Analysis Handbook Final
June 2020

Transportation Impact Analysis Handbook | DRAFT City of Fremont
Table of Contents Page
1 Introduction ............................................................................................................ 1 1.1 Purpose of the Transportation Impact Analysis ....................................................................................1 1.2 California Environmental Quality Act .....................................................................................................1 1.3 General Plan Goals and Policies ............................................................................................................1 2 Overview of Process ................................................................................................ 4 2.1 Roles of the Participants ............................................................................................................................4 2.2 Transportation Analysis Process ...............................................................................................................5 2.3 Scope of Work............................................................................................................................................5 2.4 Transportation Analysis Review ...............................................................................................................6 3 CEQA Transportation Analysis.................................................................................. 8 3.1 Environmental Checklist..............................................................................................................................8 3.2 CEQA Transportation Performance Metrics...........................................................................................8 3.3 Screening Criteria.......................................................................................................................................9 3.4 Thresholds of Significance ...................................................................................................................... 14 3.5 VMT Analysis Tools .................................................................................................................................. 14 3.6 VMT Estimation Process........................................................................................................................... 15 3.7 Mitigation Measures................................................................................................................................ 18 3.8 Cumulative Impact Analysis ................................................................................................................... 18 4 Local Transportation Analysis ................................................................................. 19 4.1 Vehicular Operations, Trip Generation, Distribution, & Assignment.............................................. 20 4.2 Intersection Operations........................................................................................................................... 20 4.3 Queueing Analysis ................................................................................................................................... 22 4.4 Traffic Signal Warrants ......................................................................................................................... 22 4.5 All-way Stop Analysis ............................................................................................................................. 22 4.6 Site Access/Egress ................................................................................................................................... 22 4.7 Alameda CTC Congestion Management Program Analysis............................................................ 25 4.8 Planned Bicycle Infrastructure ............................................................................................................... 25 4.9 Planned Pedestrian Infrastructure......................................................................................................... 26 4.10 Bicyclist and Pedestrian Behavior & Travel Patterns ........................................................................ 26 4.11 Pedestrian Crossing Safety.................................................................................................................... 26 4.12 Pedestrian Lighting .................................................................................................................................. 26 4.13 Bus Stop Locations and Amenities......................................................................................................... 27 4.14 Speed Control Measures within Project Site ...................................................................................... 27 4.15 Parking Stall Dimensions......................................................................................................................... 27 4.16 Parking Layout ......................................................................................................................................... 27 4.17 Driveway Sight Distance for All Modes – Including Pedestrians within Sidewalks..................... 28 4.18 Internal Bicycle and Pedestrian Circulation ........................................................................................ 29 4.19 Fire Safety Geometric Design Requirements ..................................................................................... 29 4.20 Solid Waste .............................................................................................................................................. 29 4.21 Bicycle Parking ......................................................................................................................................... 30 4.22 Speed Control Measures within the Project Site................................................................................ 31 4.23 Public Access Through Project Site........................................................................................................ 31 4.24 Site Design and Proposed Operations to Limit Negative Effects .................................................. 31

Transportation Impact Analysis Handbook | Final City of Fremont
ii
Table of Figures Page
Figure 1 Typical Study Components.......................................................................................................6 Figure 2 CEQA Transportation Analysis Process Overview...............................................................7 Figure 3 Screening Criteria for Land Use Projects ..............................................................................9 Figure 4 CEQA Transportation Screening Map for Residential Projects ..................................... 11 Figure 5 CEQA Transportation Screening Map for Office Projects.............................................. 12 Figure 6 CEQA Transportation Screening Map for Affordable Housing Projects ..................... 13 Figure 7 Adopted Thresholds of Significance for Projects by Land Use...................................... 14 Figure 8 Map of Fremont VMT per Capita ....................................................................................... 16 Figure 9 Map of Fremont VMT per Employee .................................................................................. 17 Figure 10 Local Transportation Analysis Subsections ......................................................................... 19 Figure 11 Driveway Alignment ............................................................................................................... 23 Figure 12 Driveway Proximity to Intersection...................................................................................... 23 Figure 13 Driveway Consolidation ........................................................................................................ 24 Figure 14 Loop Driveways....................................................................................................................... 24 Figure 15 Driveway Access Street ......................................................................................................... 25 Figure 16 Parking Lot Layout Example ................................................................................................. 28 Figure 17 Parking Stall Access................................................................................................................ 28 Figure 18 Driveway Sight Distance Triangle Example ...................................................................... 29 Figure 19 Bicycle Parking Standards .................................................................................................... 30 Figure 20 Mobility Management VMT Reduction Measures for Project/Site Level
Application ............................................................................................................................... 32 Figure 21 Mobility Management VMT Reduction Measures for Community/City-Level
Application ............................................................................................................................... 34 Figure 22 Additional VMT Reduction Measures .................................................................................. 36

1
1 INTRODUCTION 1.1 Purpose of the Transportation Impact Analysis This handbook is a comprehensive guide that:
1. Outlines the review procedure and document requirements for development projects, City transportation projects, and General Plan amendments.
2. Provides the screening criteria, adopted thresholds of significance, pre-approved mitigations, and monitoring requirements within the context of the California Environmental Quality Act (CEQA).
3. Provides the criteria and project characteristics used to determine when a Local Transportation Analysis (LTA) is required.
4. Outlines project attributes to be considered when determining impacts to the local transportation system.
5. Provides the appropriate methodologies, procedures, and processes for mitigating impacts to the local transportation system within the City of Fremont.
1.2 California Environmental Quality Act Per Senate Bill 743 (SB 743), the focus of transportation analysis under the California Environmental Quality Act (CEQA) will shift statewide from level of service (LOS), as measured by roadway capacity and vehicle delay, to vehicle miles traveled (VMT) beginning July 1, 2020. VMT provides an estimate of the amount and distance driven by vehicle to reach a destination. SB 743 does not preclude LOS for operational analysis, but LOS may no longer be used as a method for evaluating a project's potential transportation impacts under CEQA.
1.3 General Plan Goals and Policies In December 2011, the City Council adopted the General Plan Update to guide future growth and development in Fremont through the year 2030. The General Plan guides Fremont’s development toward goals and strategies related to land use, mobility, and sustainability. Development projects, City transportation projects, and General Plan amendments will be reviewed based on their qualitative adherence to the General Plan. In June 2020, the City Council amended the General Plan Mobility Element to replace LOS with VMT as the measurement to be used when conducting Transportation Impact Analysis under CEQA.
Strategic Urbanism
As part of regional planning efforts, Bay Area cities have identified “Priority Development Areas” (PDAs) where land use intensification is expected and desired. Fremont has four PDAs: around Fremont BART and City Center; Warm Springs BART; in Centerville near the Capitol Corridor

Transportation Impact Analysis Handbook | Final City of Fremont
2
and ACE train station; and in Irvington near the future BART station. A majority of the City’s future growth will be focused within the PDAs. Strategic urbanism plans for growth around transit in the form of mixed use neighborhoods, which offer residential, retail, and offices in proximity to each other. Walkable, mixed use neighborhoods provide many benefits to the community, including a reduction in the number of car trips, better health for residents, and efficient use of resources such as parking and infrastructure.
Transit-Oriented Design
Fremont’s 2030 General Plan establishes Transit-Oriented Development (TOD) Overlay Districts that will encourage higher-intensity development near transit, such as current and future BART stations and the Centerville Train Station, and along key bus corridors such as Fremont Boulevard. General Plan 2030 calls for the majority of existing residential neighborhoods that are not close to transit to retain their current land use patterns. General Plan 2030 calls for the majority of the 35,000 new residents projected by 2030 to be housed within the PDAs. Other neighborhoods are not expected to change dramatically between now and 2030.
Town Centers
The General Plan continues the City of Fremont’s efforts to promote a mix of land uses in the original towns and establishes “City Center” and “Town Center” land use designations intended to promote enhancements to these areas. City Center policies encourage the most intense development in Fremont to occur in the heart of Fremont. Town Center policies encourage a mix of uses and the incorporation of civic plazas and public art to add vibrancy to the original commercial districts.
Mobility
General Plan 2030 acknowledges that cars will continue to be a key part of Fremont’s transportation network, but it places a new emphasis on more sustainable ways of getting around—walking, bicycling, and public transit. The General Plan incorporates the concept of “complete streets” that serve all modes of transportation. It also acknowledges that in strategic locations where better public transit, interesting buildings and spaces, and improved bicycle and pedestrian amenities are considered priorities, traffic congestion may be an acceptable trade-off.
General Plan Policies
The transportation needs of the City will be met through implementation of policies that foster the safe and efficient movement of people and goods. General Plan policies direct how these objectives will be met through the build-out of inter-connected, multimodal transportation networks. General Plan policies that call for transportation analysis and lead to implementation of the City’s multi-modal vision include, but are not limited to, the following:
Measure transportation impacts by replacing Level of Service (LOS), a measurement system that prioritizes motorized vehicle throughput and a vehicle-oriented roadway infrastructure with VMT, a measurement system that encourages alternative modes of travel and complete-street infrastructure that facilitates mass transit and the above-mentioned non-motorized methods of travel. (ME 2-1);
Projects in high Vehicle Miles Traveled (VMT) areas that would induce VMT-related transportation impacts are required to mitigate those impacts by facilitating carpooling, use of mass transit, and other non-motorized methods of travel. (ME 3-2);

Transportation Impact Analysis Handbook | Final City of Fremont
3
New developments will sustain a transportation system that balances speed and convenience with the desire to have walkable neighborhoods and an enhanced sense of place (ME 3-4);
New developments must provide parking that meets the needs of residents, workers, visitors, and shoppers in a way that is consistent with broader goals related to sustainability and community character. (ME 3-7);
Developments will reduce greenhouse gas emissions by encouraging, and where appropriate requiring, pedestrian-friendly design. (CC 4-2.3);
Encourage multi-story residential and mixed-use development in Fremont’s designated Centers. (CC 4-3.10);
Encourage all businesses to adopt environmentally sustainable business practices; and work with businesses to develop vehicle-trip reduction strategies such as commuter checks, direct transit subsidies, bike racks, lockers, showers, or parking charges (ED 6-5.2/C);
New developments will contribute to a more compact pattern of development, be designed to encourage transit use and reduce vehicle miles traveled, provide comfortable walking and bicycling environments, and project a positive image of the city. (LU 2-1.9);
Develop and maintain ridesharing, carpooling, flextime, shuttle bus, and other programs in major employment areas to reduce vehicle miles traveled, cut greenhouse gas emissions, and ease congestion on regional roadways. (LU 2-5.12).

4
2 OVERVIEW OF PROCESS The Department of Public Works determines the need for a CEQA transportation analysis (TA) in conformance with the CEQA guidelines and City policies; and holds discretionary review of local transportation analysis (LTA) for conformance with adopted plans and policies. Not all projects require both CEQA transportation analysis (TA) and local transportation analysis (LTA) in a transportation impact analysis (TIA) report. Projects that do not require a TA would typically include just an LTA in a TIA, while some small projects may not require a TA or an LTA. Additionally, projects that do not require a TA may be required, upon discretionary review, to provide additional analyses for a complete TIA. Transportation Impact Analysis (TIA) report could contain: Project Summary – Always required CEQA Transportation Analysis (TA) – Sometimes required Local Transportation Analysis (LTA) – Sometimes required, extent of analysis
determined by the City based on project factors.
2.1 Roles of the Participants Project Applicants1 – Applicant refers to the owner of the property or project. The applicant is responsible for overseeing the completion of reports, documentation, permits, and payment of fees. The applicant shall be responsible for choosing and contracting with a qualified primary transportation consultant to perform the transportation review. Consultants – Project applicants shall be responsible for choosing and contracting with a qualified, primary transportation consultant to perform the transportation review. Consultants must be licensed transportation engineers or qualified transportation planners; the City maintains a list of pre-qualified firms. The City reserves the right to conduct a peer review of studies provided by an applicant or the applicant’s consultant. The peer review transportation consultant will review the primary transportation consultant work to ensure the project meets all City standards. City of Fremont – The City of Fremont refers to employees and departments representing the City of Fremont, and may include but is not limited to: Administration, Planning, Public Works, Accounting, etc. City staff will be responsible for reviewing and approving the proposed scope for both transportation consultants. City staff will also review the CEQA document and transportation study, including review of the proposed mitigations and conditions of approval.
1 “Applicant” in this handbook is used to refer to all instances where the person or entity is responsible for project requirements. Where work may be performed by peer-review consultants, the term “applicant” may be used.

Transportation Impact Analysis Handbook | Final City of Fremont
5
2.2 Transportation Analysis Process To initiate the Transportation Impact Analysis Process, applicants must draft an initial project description, request for transportation analysis scoping, and submit a review fee deposit on the City of Fremont’s Development Services Center website to proceed. The initial project description provides background information on the project that will ultimately determine the various analyses to be included in the TIA.
Initial Project Description: Upon initial application for a new development, the project applicant shall include an initial project description. The City of Fremont will review the initial project description with screening criteria established in Section 3.3 to determine if the project meets the CEQA screening criteria and types of analysis to be required in the LTA. The initial project description should include:
Project land use type Number of housing units Total gross floor area Distance from major transit stops Density of housing or gross floor area ration (FAR) Number of parking spaces Affordable residential units included Previous or existing uses Project location VMT per capita or per employee
A statement of operations may also be required for use types where hours of operation or schedule of activities significantly impact travel to the project.
Study Area Description: Upon initial application for a new development, the project applicant shall include a study area description. The City of Fremont will review the study area description to determine help determine the types of analysis to be required in the LTA.
Transportation Analysis Scoping: Upon initial application for a new development, the project applicant shall submit a request for transportation analysis scoping. The City of Fremont will review the request with the CEQA screens, General Plan, and Zoning Code. Under discretionary review, the project may be determined to meet the City’s adopted plans and policies; or, based on findings, will require a TIA to be completed by the project applicant.
2.3 Scope of Work The information provided in the initial project description will be reviewed by the City of Fremont to determine if it meets criteria for a CEQA screen and for completeness and consistency with the General Plan. The CEQA screen (see section 3.3: Screening Criteria) helps determine the type of CEQA document and analysis, if any, is required. Upon completion of initial coordination meeting and discussion with the project applicant, a finalized project description and scope of work will be agreed upon for the purposes of preparing the TIA.
Figure 1 below presents a table of high-level components required in a scope of work, based on a project size and meeting CEQA screening criteria. The cells marked with an ‘X’ indicate a required analysis and the columns show types of projects based on size and CEQA screen. The City maintains discretion to require specific reports, analyses, and background information as part of

Transportation Impact Analysis Handbook | Final City of Fremont
6
the Local Transportation Analysis, including for projects generating fewer than 110 trips per day. Projects sponsors should consult Figure 1 to determine the high level-level elements to include in the scope of work.
Figure 1 Typical Study Components
Topic Subtopics Pass
es C
EQA
Scre
en
Small
Pro
ject
(>11
0 trip
s)
Pass
es C
EQA
Scre
en
Larg
e Pro
ject (
>110
trips
)
Does
not p
ass C
EQA
Scre
en
Handbook Section
Project Summary Project Description X X X 2.2 Study Area Description X X X 2.2
CEQA Transportation Analysis Screening X X X 3.3 VMT Analysis X 3.4, 3.5
Mitigations (if applicable) X 3.7 Local Transportation Analysis Vehicle Operations X X 4.1 - 4.7
Multimodal Operations X X 4.8 - 4.13 Site Plan Review X X 4.14 - 4.24
Conditions of Approval Conditions of Approval X X X
2.4 Transportation Analysis Review The City of Fremont will coordinate with appropriate agencies, organizations, and jurisdictions for review as appropriate. The City of Fremont will provide comments on the draft TA to be addressed in the final TA report. Upon approval, the final TA will be incorporated into the CEQA documentation for the project. The project applicant shall submit one (1) final TA report to the City. Figure 2 presents a flow chart of the CEQA TA review process.

Transportation Impact Analysis Handbook | Final City of Fremont
7
Figure 2 CEQA Transportation Analysis Process Overview
• Applicant submits Initial Project Description, request for Transportation Analysis Scoping, and review fee deposit.
• City of Fremont (City) coordinates and reviews Initial Project Description.
• City sends Final Scope of Work and data to applicant. • City sends TIA fee invoice to applicant.
TIA Scoping
• Applicant submits draft TA report with remaining review fee. • City of Fremont reviews report and coordinates internally. • City coordinates with external jurisdictions, as appropriate. • City determines if report identifies CEQA impacts and local
transportation effects in conformance with City policies and guidelines.
• City determines if report demonstrates feasibility of CEQA mitigation and local transportation improvements.
• City sends comments to applicant.
Draft TA Report
• Applicant submits revised TIA report. • City sends comments on report, if needed. • City approves final TIA in conformance with City policies and
guidelines.
Revised/Final TA Report
8
3 CEQA TRANSPORTATION ANALYSIS CEQA transportation analysis requires an evaluation of a project’s potential impacts related to VMT. This section provides the environmental checklist, screening criteria, adopted thresholds of significance, and methodologies of analysis to be used in transportation impact analysis (TIA) reports and CEQA documents for development projects.
3.1 Environmental Checklist In accordance with the latest CEQA Statute & Guidelines, a project should be reviewed for potentially significant transportation impacts on the environment. Project applications are responsible for including a description/review of how the project may impact the following:
Conflicts with a program, plan, ordinance or policy addressing the circulation system, including transit, roadway, bicycle and pedestrian facilities.
Conflicts, or is inconsistent, with CEQA Guidelines section 15064.3, subdivision (b). Substantially increases hazards due to a geometric design feature (e.g. sharp curves or
dangerous intersections) or incompatible uses (e.g., farm equipment). Results in inadequate emergency access. Causes substantial additional VMT per capita, per service population, or other
appropriate efficiency measure, which will be explored in later sections. Where project applications do not provide sufficient information to ensure less than significant impacts to the environmental checklist, City of Fremont staff may request additional analysis from the project applicant. It is recommended that project applicants address all elements of the environmental checklist upon first submission to minimize processing delays and workload impacts to City staff.
3.2 CEQA Transportation Performance Metrics
Vehicle Miles Traveled
VMT is the total miles of travel by personal motorized vehicles a project is expected to generate in a day. VMT measures the full distance of personal motorized vehicle trips with one end within the project.
VMT per Capita
VMT per capita measures the total VMT of all vehicle miles traveled that begin or end at households (residences) in a geography divided by the number of residents in that geography. A city’s VMT per capita is not truncated by travel into another jurisdiction and does not include pass through travel.

Transportation Impact Analysis Handbook | Final City of Fremont
9
(Total Home-based VMT / Total Population = VMT per Capita)
VMT per Employee
VMT per employee measures the VMT of only the commute travel (employee VMT) to workplaces in a geographic area divided by the number of jobs in that geographic area. A city’s VMT per employee is not truncated by travel into another jurisdiction and does not include pass through travel. Heavy-duty truck and customer VMT is not considered in the calculation.
(Total Employee VMT / Total Number of Employees = VMT per Employee)
Net Change in Total VMT
When assessing a retail land use or similar project, the project’s total VMT is measured. The total VMT for the region with and without the project is calculated and the difference between the two scenarios is the net change in total VMT that is attributable to the project. The region should be defined based on typical travel patterns (county or multiple counties).
3.3 Screening Criteria A detailed CEQA transportation analysis would not be required if a project meets one of the City’s screens and all screening criteria for that screen.2 Figure 3 presents the screening criteria for projects that are expected to result in less-than-significant VMT impact based on project description and/or location. A screened-out project may be required to provide a Local Transportation Analysis (LTA) to assess non-CEQA transportation aspects of a project. If a component of a mixed-use project meets the screening criteria, only the component, not the entire project, would be screened out of a detailed CEQA transportation analysis.
Figure 3 Screening Criteria for Land Use Projects
Screen Type Screening Criteria
Small Infill Projects
Must meet one of the following: • Single-family detached housing of 15 units or less; OR • Single-family attached or multi-family housing of 25 units or less; OR • Office of 10,000 square feet of gross floor area or less; OR • Project generating 110 trips a day or less for other land use
Local Serving Retail • 50,000 square feet of total gross floor area or less without drive-through operations
Local Serving Public Facilities • Local serving public facility
2 The screening criteria are consistent with the purposes described in Section 21099 of the California Public Resources Code and closely aligned with the recommended screening criteria provided in the OPR’s 2018 Technical Advisory.

Transportation Impact Analysis Handbook | Final City of Fremont
10
Screen Type Screening Criteria
Location-Based Screening for Residential and Office Employment Projects
• Location: Either o Within a half mile of a major transit stop3; OR o In an area with low (below the threshold) VMT per capita/employee
and in an area with planned growth. And meet the following: • Density:
o Minimum gross floor area ratio (FAR) of 0.75 for employment projects o Minimum of 35 units per acre for residential projects o If located in an area that has a maximum density below 0.75 FAR or 35
units per acre, the maximum density allowed must be met • Parking:
o No more than the minimum number of parking spaces required • Does not replace affordable residential units with a smaller number of moderate-
or high-income residential units • Consistent with Plan Bay Area, the applicable Sustainable Communities
Strategy (as determined by the lead agency, with input from the Metropolitan Transportation Commission)
Restricted Affordable Residential Projects or Components
Must meet all: • Affordability: 100% deed-restricted affordable housing (exception for the
manager’s unit(s)); affordability must extend for a minimum of 55 years for rental homes or 45 years for for-sale homes. Affordability for this purpose is restricted to households making 80% or less of the area’s median income.
• Location: within an area with below average VMT per capita • Parking: no more than the minimum number of parking spaces required
Small Infill Projects Projects below the size screen would not require a detailed CEQA transportation analysis. CEQA Guidelines Section 15303 provides a categorical exemption for new construction or conversion of small structures of up to 10,000 square feet of office or 110 trips per day for other land uses. Fremont’s policy includes infill residential projects of up to 15 single-family homes or 25 multi-family homes.
Local Serving Retail
New retail development typically redistributes existing shopping trips instead of creating new trips. Local-serving retail projects close to where people live, results in a decrease in VMT, whereas regional-serving retail projects can increase VMT. Local-serving retail is defined as a project below 50,000 square feet, which is presumed to have a less-than significant impact. This presumption, however, does not apply to projects that contain drive-through uses, due to the high vehicle traffic.
3 A major transit stop has rail service OR two or more intersecting bus lines with 15-minute peak commute frequencies or better (Pub. Resources Code § 21064.3).

Transportation Impact Analysis Handbook | Final City of Fremont
11
Local Serving Public Facilities
Public facilities are publicly owned or controlled such as police stations, fire stations, passive parks, public utilities, and other similar facilities. Local serving public facilities improve people’s proximity to recreation, safety, and other important community needs. If a public facility is determined to be local serving, the project would be screened out of a detailed CEQA transportation analysis.
Location-Based Screening for Residential Projects
Residential land use projects located in areas of low VMT and/or within a half mile of a major transit stop or corridor and that include low VMT-supporting features will produce low VMT per capita. These areas are shown in Figure 4. Projects must comply with the criteria listed in Figure 3.
Figure 4 CEQA Transportation Screening Map for Residential Projects

Transportation Impact Analysis Handbook | Final City of Fremont
12
Location-Based Screening for Office Projects
Office projects located in areas of low VMT and/or within a half mile of a major transit stop or corridor and that include low VMT-supporting features will produce low VMT per employee. These areas are shown in Figure 6. Projects must include features that are similar or better for lowering VMT than what exists today for density and parking as detailed in Figure 3.
Figure 5 CEQA Transportation Screening Map for Office Projects

Transportation Impact Analysis Handbook | Final City of Fremont
13
Location-Based Screening for Affordable Housing Projects
Deed-restricted affordable housing, defined as developments that are 100 percent affordable for low-income families making 80% or less of area median income, correlate with reductions in VMT compared with market-rate housing.
Figure 5 presents the recommended affordable housing screen based on the following geographic criteria: located in an area with a below average VMT and/or within a half mile of a major transit stop or corridor. Projects must comply with the criteria listed in Figure 3.
Figure 6 CEQA Transportation Screening Map for Affordable Housing Projects

Transportation Impact Analysis Handbook | Final City of Fremont
14
3.4 Thresholds of Significance When a project does not meet the screening criteria described in the previous section, a CEQA transportation analysis (TA) will be required. This analysis is used to evaluate a project’s VMT generation against the appropriate thresholds of significance. Figure 7 presents the thresholds of significance for development projects as established in the General Plan Amendment.
Figure 7 Adopted Thresholds of Significance for Projects by Land Use
Land use Threshold of Significance Residential 15% below existing average VMT per capita for the City of Fremont
Employment - Office 15% below existing regional average VMT per employee Employment – Industrial Existing regional average VMT per employee
Retail Net increase in total regional VMT Mixed Uses Each land use component of a mixed-use project will be analyzed independently,
applying the significance threshold for each land use component from the enumerated project types in this Table.
Change of Use or Additions to Existing Development
Changes of use or additions to existing development will be analyzed applying the significance threshold for each land use component from the enumerated project types in this Table.
Area or Specific Plans Each land use component will be analyzed independently, applying the significance threshold for each land use component from the enumerated project types in this Table.
General Plan Amendments General Plan Amendments will be analyzed in conformance with the General Plan’s definition of VMT. An increase in City total VMT is a significant transportation impact.
Other Land Uses Not Defined Methodology to be determined by the Director of Public Works on a project by project basis.
Subject to adoption by the City Council, these thresholds of significance provided in General Plan Policy 3-4.2: Transportation Analysis may be updated through City Council adoption as local and regional VMT and GHG emissions goals shift in response to changes in population and transportation patterns. Additionally, the travel demand models used to determine VMT will change as they are updated. The City will revisit these thresholds at the time of the General Plan update, when major changes to the City’s land uses and transportation network occur, and/or if new data substantially changes the map-based screens.
3.5 VMT Analysis Tools Projects that require a CEQA transportation analysis may use one of two tools for estimating VMT and/or quantifying mitigation measures:
1. City of Fremont VMT Maps and Alameda County VMT Calculator 2. Alameda CTC Travel Demand Model

Transportation Impact Analysis Handbook | Final City of Fremont
15
Alameda County VMT Estimation Tool
Alameda County Transportation Commission (CTC) is developing a Mobility Management VMT Reduction Calculator tool (VMT Calculator) for cities in Alameda County. The VMT Calculator will assess a project’s potential VMT (Project VMT) based on the project’s description, location, and attributes. For most residential and employment projects or components, the VMT Calculator is the approved method to calculate Project VMT.
Until the more user-friendly VMT Calculator is released, projects will work with the City to scope the TA analysis using the same data and methodologies.
Alameda CTC Travel Demand Model
For General Plan updates, area plans, non-residential or non-employment land use projects, very large projects, or projects that can potentially shift travel patterns, the VMT Calculator may not be appropriate or adequate for the CEQA transportation analysis. In such cases, the Alameda CTC Travel Demand model may be required based on a preliminary review of the project. For projects requiring model runs, the transportation consultant will coordinate with Alameda CTC and Fremont’s Department of Public Works on the scoping process to obtain the model information.
3.6 VMT Estimation Process
Residential and Employment Projects
Residential and employment (office and industrial) projects generate new travel, with the magnitude of VMT increase primarily determined by the location of the project. For this reason, the VMT per capita for these project types is estimated using a combination of the City’s VMT mapping (which provides the VMT for an “average” residential or employment project in the vicinity of the project) and adjustments using the Alameda CTC VMT Calculator (which provides percent changes to reflect the specific project definition).
Step 1 – Obtain Base VMT
The Base VMT for a project can be found by consulting the VMT maps found in Figures 8 and 9. The Base VMT for the project is simply the VMT per capita or VMT per employee in the census block where the project is located. The precise Base VMT per capita and per employee will be available at the census block level on Fremont's Open Data Portal . If the project is located on the border of two or more census blocks, then the Base VMT is the average between the census blocks where the project is located.
Step 2 – Calculate Project VMT
The project specific VMT can be calculated by applying percentage changes from the Alameda CTC VMT Calculator. These percent changes reflect the fact that projects with low parking provision, mixing of uses, or high density may have a VMT per capita or VMT per employee that is lower than an “average” project in the TAZ. If the project specific VMT falls above the threshold of significance for the project type, applicants may adjust the project definition to lower the VMT. If the project specific VMT is above the threshold and the project cannot be further redefined, mitigation measures such as TDM strategies or multimodal transportation infrastructure should be considered (see Section 3.7: Mitigation Measures).

Transportation Impact Analysis Handbook | Final City of Fremont
16
Figure 8 Map of Fremont VMT per Capita

Transportation Impact Analysis Handbook | Final City of Fremont
17
Figure 9 Map of Fremont VMT per Employee
Alameda CTC’s travel demand model produces VMT estimates for Alameda County and is updated periodically. The City of Fremont will maintain relevant VMT maps as the county travel demand model is updated or is replaced by an alternative travel demand model.
Retail Projects and Area Plans
Retail projects typically redirect existing travel and are therefore estimated using a net VMT method. Area Plans typically consist of a significant magnitude of development that may alter regional travel patterns in ways that are not reflected in base VMT mapping. For this reason, VMT for these project types is analyzed using the Alameda CTC Travel Demand Model. The basic process is to analyze the VMT within a reasonable travel-shed around the project site with and without the project, and determine if the project results in a net increase or a net decrease. Sub-area validation of the Travel Demand Model may be required based on consultation between the City and applicant.

Transportation Impact Analysis Handbook | Final City of Fremont
18
3.7 Mitigation Measures
Mitigation VMT Reductions Projects above the VMT threshold must propose measures to reduce project VMT or mitigate a CEQA transportation impact. The applicant must provide data and/or research attesting to the effectiveness of proposed mitigation measures at achieving their stated reductions in VMT.
Projects may utilize the mitigation measures provided in Appendix A with associated VMT percentage reductions, which are considered “pre-approved” by the City of Fremont. These measures fall in five categories: land use strategies, parking management, neighborhood enhancements, transit strategies, and TDM measures. The list of measures in Appendix A includes measures included in the Alameda CTC VMT calculator, as well as additional measures adapted from CAPCOA and the City of San José.
Mitigation Monitoring If a project proposes to include any TDM measures as a mitigation measure, the project must include a TDM Plan that demonstrates how it will provide monitoring and reporting, compliance, and funding for the life of the project. The TDM plan will become part of the conditions of project approval. The monitoring portion of the TDM Plan must identify the monitoring elements and time frame for reporting to the City. Monitoring elements can include a TDM program report, parking surveys, resident/employee surveys, and/or a trip cap as well as the time frame for submitting reports.
A trip cap is a maximum number of motor vehicle trips within specific timeframes that are allowed to be generated by a project. Projects with substantial TDM-based mitigations may be required to include a trip cap in their TDM plan based on the determination of the Public Works Director.
3.8 Cumulative Impact Analysis Projects must demonstrate consistency with the Fremont General Plan to address cumulative impacts. If a project is consistent with the General Plan, it will be considered part of the cumulative solution to meet the General Plan’s long-range transportation goals, resulting in a less-than-significant cumulative impact. Projects determined to be inconsistent with the General Plan may be required to conduct a project-specific cumulative analysis based on the determination of the Public Works Director.

19
4 LOCAL TRANSPORTATION ANALYSIS
If deemed necessary by the City of Fremont, an applicant must include a Local Transportation Analysis (LTA) within the Transportation Impact Assessment (TIA). This will typically apply to large projects that pass the CEQA screen or any project that does not pass the CEQA screen as shown in Figure 1. The LTA is intended to ensure safe multimodal operations and site access.
The LTA includes the following sections:
Vehicular Operations Analysis Multimodal Operations Analysis Site Plan Review
Figure 10 provides an overview of the analysis that makes up each section. Note that not every analysis type is required for every project, see each subsection for the specific requirements. Additional analysis other than those listed Figure 10 can be required at the City’s discretion.
Figure 10 Local Transportation Analysis Subsections
LTA Section Analysis Type Subsection Vehicle Operations Vehicular Operations, Trip Generation, Distribution, & Assignment 4.1
Intersection Operations 4.2
Queueing Analysis 4.3 Traffic Signal Warrants 4.4
All-way Stop Analysis 4.5 Site Access/Egress 4.6
Alameda CTC Congestion Management Program Analysis 4.7 Multimodal Operations
Planned Bicycle Infrastructure 4.8
Planned Pedestrian Infrastructure 4.9 Bicyclist and Pedestrian Behavior & Travel Patterns 4.10
Pedestrian Crossing Safety 4.11 Pedestrian Lighting 4.12 Bus Stop Locations and Amenities 4.13
Site Plan Review Speed Control Measures within Project Site 4.14 Parking Stall Dimensions 4.15

Transportation Impact Analysis Handbook | Final City of Fremont
20
LTA Section Analysis Type Subsection Parking Layout 4.16 Driveway Site Distance for All Modes – Including Pedestrians within Sidewalks
4.17
Internal Bicycle and Pedestrian Circulation 4.18 Fire Safety Geometric Design Requirements 4.19
Solid Waste 4.20 Bicycle Parking 4.21
Speed Control Measures within the Project Site 4.22 Public Access Through Project Site 4.23
Site Design and Proposed Operations to Limit Negative Effects 4.24
VEHICLE OPERATIONS
4.1 Vehicular Operations, Trip Generation, Distribution, & Assignment
Threshold
The City of Fremont will conduct initial trip generation calculations. Projects surpassing a threshold of 100 peak hour trips during either the AM or PM peak hour are required to conduct more detailed analysis.
Standards
The project applicant will develop the detailed analysis using the most current ITE Trip Generation Handbook unless a proposed alternative methodology has been approved by the City.
Analysis The traffic analysis will include reasonable and supported pass-by trip assumptions, full-occupancy measurements, and trip distribution splits. Applicant will verify square footage and use types of existing developments at site. Vacant uses generally shall not be subtracted out of trip generation calculations to reflect the most accurate estimate of new traffic in project vicinity when the project is ultimately completed and occupied. Trip distribution splits will factor in driveway locations, freeway access, locations of major generators/attractors, and other generally accepted engineering methodologies.
4.2 Intersection Operations
Intersection Selection
Applicant to submit a list or map of intersections to the City to determine which ones are to be included in the intersection operations analysis. Intersections that may be included in the intersection operations analysis are defined by the following:

Transportation Impact Analysis Handbook | Final City of Fremont
21
Where it is expected that the project will add 50 or more peak-hour vehicle trips based on the most recent ITE Trip Generation Handbook; and meets any of the following:
− Within a half mile distance of the project’s property line; − Within a designated City-defined zone of concern; − Surpasses the thresholds of an adjacent City to the one in which it resides; − City directs to include it.
In any case, where City directs to include it.
Acceptable Methodologies.
Applicants to confirm with City an appropriate methodology to be used throughout the intersection operations analysis. Previously developed plans, studies and projects in the project area can inform and define acceptable methodologies to provide consistency between documents. Acceptable methodologies may include: Highway Capacity Manual 2000; Highway Capacity Manual 2010; Highway Capacity Manual 6th Edition; Any generally accepted software package, that is validated and calibrated to conform to
the selected analysis methodology.
Analysis Periods
The project applicant is required to perform Level of Service calculations under approved methodologies. Applicant will include project impacts under a “No Project” scenario and a “With Project” scenario for the following periods: AM Peak Hours PM Peak Hours Other conditions per City request
Data Requirements
Data shall be collected not earlier than 24 months before submission of LTA to the City of Fremont. The City may require more recent data or allow older data at its discretion, based on the transportation facility characteristics. Intersection geometry and signal timing must be field verified.
LOS Goals
City policy aims to maintain vehicle level of service (LOS) goals without negatively impacting non-motorized street users.
LOS goals for signalized intersections are as follows:
Maintain LOS D or better outside of Town Centers Maintain LOS E or better within Town Centers Increase delay by more than 10 secs for locations already at LOS level worse than the
stated goal.

Transportation Impact Analysis Handbook | Final City of Fremont
22
At unsignalized intersections the City does not set LOS goals. Intersection operations are instead captured within signal warrants analysis as outlined in Traffic Signal Warrants 4.4.
4.3 Queueing Analysis Queuing analysis to be included in the LTA as required by the City. Applicants to confirm with the City an appropriate methodology to be used on the queuing analysis.
Queuing Goals
The queuing analysis should demonstrate that the following operational goals can be achieved:
Ensure that queues do not extend into through travel lanes (turn bays) Ensure that queues do not extend to adjacent property frontage (driveway access) Ensure that queues do not extend onto public streets (drop-off loop).
The City will consider both average and 95th percentile queues when determining if goals are met and if action is required.
4.4 Traffic Signal Warrants Traffic signal warrant studies to be included in the LTA as required by the City. Applicants generally are required to study the following MUTCD Warrants:
1 (8-hour) 2 (4-hour volume) 3 (peak hour volume) 4 (pedestrian volume) 7 (crash history) Additional warrants may be required based on site specifics
City of Fremont to provide collision data; applicant required to collect any volume data, as needed.
4.5 All-way Stop Analysis An all-way stop warrant analysis is required for any intersection that meets both of the following criteria:
1. One or more collector streets that is not already all-way stop controlled; and 2. Where 50+ daily trips would be added
All-way stop warrant analysis is required to use the City’s adopted warrants (reference Traffic Signal Warrants 4.4).
4.6 Site Access/Egress Project access and egress driveways to be evaluated in the LTA to ensure driveway operations are safe, visible, and do not conflict with existing or planned pedestrian or bicycle facilities. Driveways should be minimized in both number and size. Additionally, where possible, driveways should include turn restrictions (i.e. right-in/right-out, left-in/no left-out, U-turn prohibitions).

Transportation Impact Analysis Handbook | Final City of Fremont
23
General guidance for good driveway locations include:
Driveways to align with existing intersections and avoid offset whenever possible ( Figure 11) Driveways near signalized intersections discouraged (Figure 12) Driveway consolidation/concentrated points of access encouraged (Figure 13) Projects with drop-off loops should seek to have loop entrance (rather than loop exit) tie
into existing intersections (Figure 14) Encourage access from lower speed and lower volume roadways where possible (Figure
15)
Figure 11 Driveway Alignment
Figure 12 Driveway Proximity to Intersection

Transportation Impact Analysis Handbook | Final City of Fremont
24
Figure 13 Driveway Consolidation
Figure 14 Loop Driveways

Transportation Impact Analysis Handbook | Final City of Fremont
25
Figure 15 Driveway Access Street
The LTA should include the number and location of driveways. Driveway design will be analyzed in terms of sight distance, queueing issues, required space to complete weaving/merging maneuvers, and proximity to intersections.
4.7 Alameda CTC Congestion Management Program Analysis Congestion Management Program (CMP) analysis is required by the Alameda CTC for projects and plans that would generate 100 or more PM peak hour trips.
The CMP analysis, if required, includes LOS analysis for roadway segments as well as transit, bicycle, and pedestrian network analysis. Alameda CTC will determine the requirements, as outlined in the Land Use Analysis Program chapter of the Congestion Management Program which is updated every two years.
MULTIMODAL OPERATIONS The LTA includes a Multimodal Operations Analysis (MOA) which establishes priorities for bicycles, pedestrians, transit, and other non-vehicular users. The City will determine if a proposed project reasonably and substantially affects the facilities or operations of the multimodal network and provide the applicant a list of required elements to be included in the MOA.
4.8 Planned Bicycle Infrastructure The Planned Bicycle Infrastructure element will include a summary of the bicycle-related recommendations listed/identified/described in the below documents located along the frontages of the proposed project. Applicant will be required to implement the bicycle-related recommendations as part of the planned improvements to said frontage, except under special circumstances deemed by the City. The Planned Bicycle Infrastructure element will reference the City of Fremont’s Bicycle Master Plan, Safe Routes to School Plans, and any Specific Plans or Scoping Studies identified by the City.
Transportation Impact Analysis Handbook | Final City of Fremont
26
4.9 Planned Pedestrian Infrastructure The Planned Pedestrian Infrastructure element will include a summary of the pedestrian-related recommendations listed/identified/described in the below documents applied to the frontages of proposed project. Applicant will be required to implement the pedestrian-related recommendations as part of the planned improvements to said frontage, except under special circumstances deemed by the City.
The Planned Pedestrian Infrastructure element will reference the City of Fremont’s Pedestrian Master Plan, Safe Routes to School Plans, and any Specific Plans or Scoping Studies identified by the City.
4.10 Bicyclist and Pedestrian Behavior & Travel Patterns The Bicyclist and Pedestrian Behavior & Travel Patterns element will be developed by the applicant utilizing 5-year collision data near the project site and site observations documented by a qualified transportation consultant.
5-year collision data will include collisions that occurred on all dates and times throughout the full year. Site observations to be recorded during typical operating conditions relative to site location and context, including but not limited to commute hours, midday peak, school hours, and other periods recommended by the City.
Data and observations will be summarized by the applicant and included as an attachment to the MOA. Summaries will include but are not limited to primary collision factors, direction of travel, compliance issues, near misses, travel pattern behaviors, and other considerations recommended by the City.
4.11 Pedestrian Crossing Safety The Pedestrian Crossing Safety Element will include an analysis of existing uncontrolled crossings using the Federal Highway Administration’s (FHWA) “Guide for Improving Pedestrian Safety at Uncontrolled Crossings”. The element will include all locations within walking distance of the project area (approximately ½ mile) and any extents identified by the City. Applicant will use the guidance provided by FHWA to analyze locations where crossing opportunities would support pedestrian activity in the project area.
The evaluation will include an inventory of the roadway network, existing pedestrian crossings, and recommendations for new crossings that will link paths, close gaps, and form complete networks of pedestrian-supportive infrastructure. It will include an analysis of the project’s access points with recommendations for crossing locations that support safe access for pedestrians approaching from any/all direction/s.
4.12 Pedestrian Lighting The Pedestrian Lighting Element will include an analysis of existing conditions using the FHWA’s Informational Report on Lighting Design for Midblock Crossings. All affected signalized and unsignalized crossings will be included in the analysis.

Transportation Impact Analysis Handbook | Final City of Fremont
27
4.13 Bus Stop Locations and Amenities The Transit Element will include an analysis of transit stops within the project area based on the AC Transit Multimodal Corridor Guidelines. Key items include transit operation efficiency and transit-rider amenities related to safety and comfort. Where feasible, the applicant shall incorporate transit improvements to any existing stops located along the project frontage. This includes, but is not limited to: Bus bays Sidewalk widths Pedestrian crossings at signalized intersections Transfer opportunities between nearby stations Any improvements that reduce transit delays
4.14 Speed Control Measures within Project Site To improve the safety of traffic operations and reduce roadway collisions/conflicts within the City of Fremont, the MOA will include an element covering Speed Control Measures within the Project Site. Key elements include traffic control measures to accommodate travel during construction, and may include passenger and commercial loading plans, on a case-by-case basis determined by the City.
SITE PLAN REVIEW The applicant will submit site plans for review by the City that should adhere to the standards outlined below.
4.15 Parking Stall Dimensions Parking stalls should conform with the Fremont Municipal Code 18.183.110 (g). The minimum standard parking stall dimensions at 9 feet by 19 feet, with up to two feet reduction in length allowed to overhang onto landscaping.
The minimum compact parking stall dimensions at 8 feet by 16 feet, with up to two feet reduction in length allowed to overhang onto landscaping. Compact parking may make up 35 percent of the required spaces and must be signed.
4.16 Parking Layout Off-street parking layout should conform with the Fremont Municipal Code Chapter 18.183: Parking, Loading Areas and Vehicle Storage. The parking design should demonstrate conformance with the following minimum design requirements (presented graphically in Figure 16):
Minimum 15 foot setback between parking stalls and property line Minimum drive aisle intersection radii, from the inside wheel radius:
− 20 feet for major drive aisle intersections

Transportation Impact Analysis Handbook | Final City of Fremont
28
− 10 feet for minor drive aisle intersections Dead-end aisles shall be avoided to the greatest extent possible Parking stalls should not require extended distances to back out (Figure 17)
Figure 16 Parking Lot Layout Example
Figure 17 Parking Stall Access
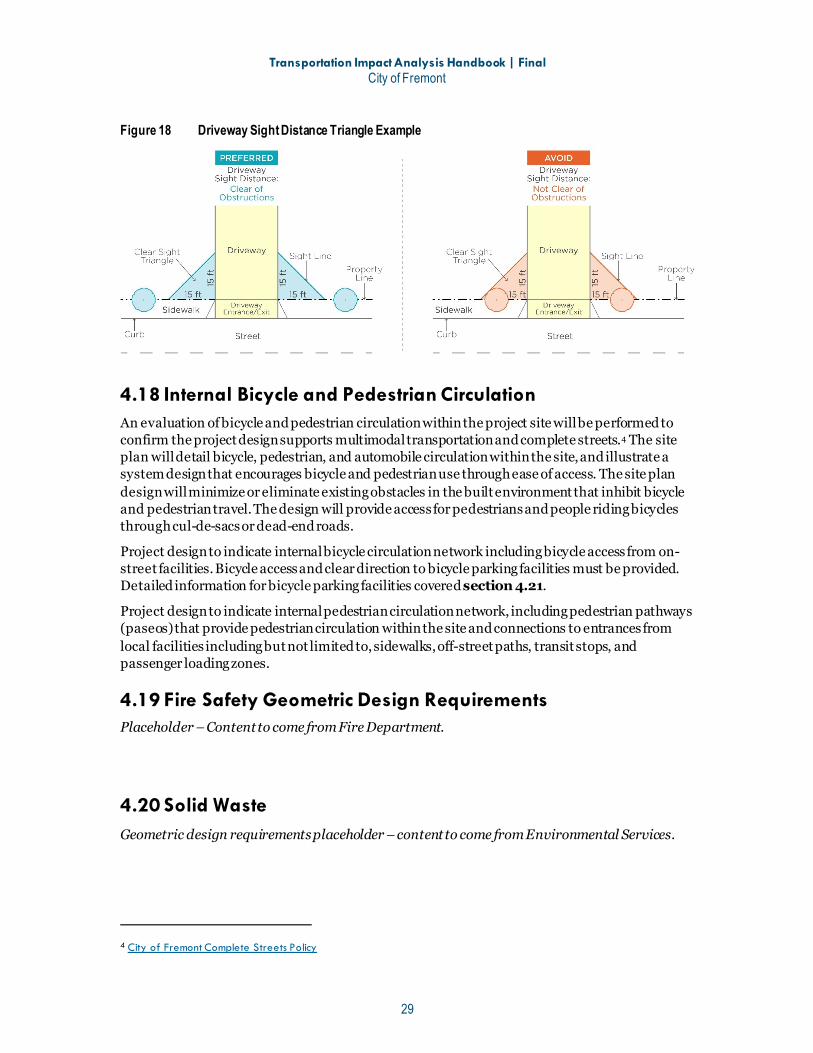
4.17 Driveway Sight Distance for All Modes – Including Pedestrians within Sidewalks
To ensure safe driveway egress, the project applicant shall provide graphics of sight triangles for streets intersecting all driveways. An example graphic is shown in Figure 18. Sight triangle dimensions shall be based on design speeds on connecting streets per Highway Design Manual stopping distances. Measures to improve visibility may be required.
Transportation Impact Analysis Handbook | Final City of Fremont
29
Figure 18 Driveway Sight Distance Triangle Example
4.18 Internal Bicycle and Pedestrian Circulation An evaluation of bicycle and pedestrian circulation within the project site will be performed to confirm the project design supports multimodal transportation and complete streets.4 The site plan will detail bicycle, pedestrian, and automobile circulation within the site, and illustrate a system design that encourages bicycle and pedestrian use through ease of access. The site plan design will minimize or eliminate existing obstacles in the built environment that inhibit bicycle and pedestrian travel. The design will provide access for pedestrians and people riding bicycles through cul-de-sacs or dead-end roads.
Project design to indicate internal bicycle circulation network including bicycle access from on-street facilities. Bicycle access and clear direction to bicycle parking facilities must be provided. Detailed information for bicycle parking facilities covered section 4.21.
Project design to indicate internal pedestrian circulation network, including pedestrian pathways (paseos) that provide pedestrian circulation within the site and connections to entrances from local facilities including but not limited to, sidewalks, off-street paths, transit stops, and passenger loading zones.
4.19 Fire Safety Geometric Design Requirements Placeholder – Content to come from Fire Department.
4.20 Solid Waste Geometric design requirements placeholder – content to come from Environmental Services.
4 City of Fremont Complete Streets Policy
Transportation Impact Analysis Handbook | Final City of Fremont
30
4.21 Bicycle Parking Bicycle parking proposed as part of the project is required to meet the Bicycle Parking Design Standards described in the City of Fremont Bicycle Master Plan5. Bicycle parking elements not meeting standards are required to be upgraded to meet or exceed established standards of design, ease of use, materials, and finishes.
Projects are required to provide short term and/or long-term bicycle parking depending on the land use and size of the project. Short term bicycle parking is defined as bicycle racks designed to serve visitors who leave their bikes for relatively short periods of time, typically for shopping, errands, eating or recreation. Long term bicycle parking is defined as bicycle lockers, indoor bicycle storage, or similar facilities protected from the weather designed to serve people who leave their bikes for longer periods of times such as commuters, residents, and transit users.
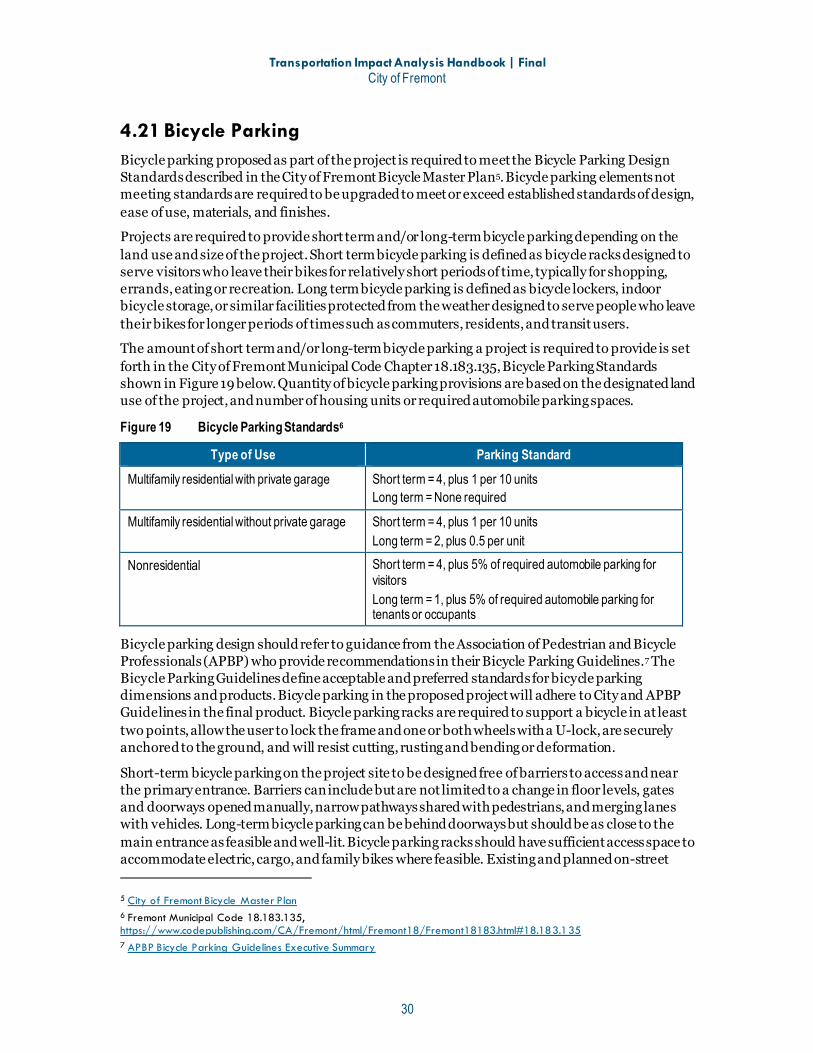
The amount of short term and/or long-term bicycle parking a project is required to provide is set forth in the City of Fremont Municipal Code Chapter 18.183.135, Bicycle Parking Standards shown in Figure 19 below. Quantity of bicycle parking provisions are based on the designated land use of the project, and number of housing units or required automobile parking spaces.
Figure 19 Bicycle Parking Standards6
Type of Use Parking Standard Multifamily residential with private garage Short term = 4, plus 1 per 10 units
Long term = None required
Multifamily residential without private garage Short term = 4, plus 1 per 10 units Long term = 2, plus 0.5 per unit
Nonresidential Short term = 4, plus 5% of required automobile parking for visitors Long term = 1, plus 5% of required automobile parking for tenants or occupants
Bicycle parking design should refer to guidance from the Association of Pedestrian and Bicycle Professionals (APBP) who provide recommendations in their Bicycle Parking Guidelines.7 The Bicycle Parking Guidelines define acceptable and preferred standards for bicycle parking dimensions and products. Bicycle parking in the proposed project will adhere to City and APBP Guidelines in the final product. Bicycle parking racks are required to support a bicycle in at least two points, allow the user to lock the frame and one or both wheels with a U-lock, are securely anchored to the ground, and will resist cutting, rusting and bending or deformation.
Short-term bicycle parking on the project site to be designed free of barriers to access and near the primary entrance. Barriers can include but are not limited to a change in floor levels, gates and doorways opened manually, narrow pathways shared with pedestrians, and merging lanes with vehicles. Long-term bicycle parking can be behind doorways but should be as close to the main entrance as feasible and well-lit. Bicycle parking racks should have sufficient access space to accommodate electric, cargo, and family bikes where feasible. Existing and planned on-street
5 City of Fremont Bicycle Master Plan 6 Fremont Municipal Code 18.183.135, https://www.codepublishing.com/CA/Fremont/html/Fremont18/Fremont18183.html#18.183.135 7 APBP Bicycle Parking Guidelines Executive Summary

Transportation Impact Analysis Handbook | Final City of Fremont
31
bicycle facilities are to be reflected in the placement of on-site bicycle parking facilities through connection and ease of access. Signage placement and lighting along bicycle routes to provide clear direction toward safe and secure parking facilities.
4.22 Speed Control Measures within the Project Site Project should endeavor to discourage unsafe speeds within the site and any roadways affected by the project.
4.23 Public Access Through Project Site The site design will provide access for pedestrians and people riding bicycles through cul-de-sacs or dead-end roads where feasible, to enhance multimodal connectivity.
4.24 Site Design and Proposed Operations to Limit Negative Effects
The project’s design and proposed operations should be designed to minimize negative effects on public transportation facilities by causing delay or conflicts with transit operations (e.g. a passenger drop-off location near a bus stop would conflict with bus loading). Similarly, negative effects on private properties in the vicinity of the project site should also be avoided or minimized.

32
Appendix A VMT Mitigation Measures The tables below show the Mobility Management Tool’s VMT reduction measures under consideration by Alameda CTC for inclusion in their VMT Calculator. The first table presents the project and site level mitigations and the second table presents the community and city level mitigations. A summary description of each measure and the highest reduction percentage possible are provided, and different reduction measures are listed for each land use category where SANDAG considers that input (this only applies to project/site level applications).
Figure 20 Mobility Management VMT Reduction Measures for Project/Site Level Application
Category Measure Description Maximum Reduction (by land use where applicable)
Employer Commute Programs
1A. Voluntary Employer Commute Program
Employer offers a voluntary employer commute trip-reduction program May include a carpool or vanpool program, subsidized or discounted transit passes, bike amenities, commute trip-
reduction marketing, and preferential parking permit program. Encompasses strategies 1C (Employer Carpool Program), 1D (Employer Transit Pass Subsidy), and 1E (Employer
Vanpool Program) and cannot be analyzed in combination with these strategies. Unlike strategy 1B (Mandatory Employer Commute Program), this strategy does not require monitoring, reporting, or
performance standards. If this strategy is selected, strategy 1B cannot be analyzed as part of the total VMT reduction.
Low-density suburb: 6.2% Suburban center: 5.4% Urban: 5.2%
1B. Mandatory Employer Commute Program
Employer offers a mandatory employer commute trip-reduction program. May include a carpool or vanpool program, subsidized or discounted transit passes, bike amenities, encouragement
for telecommuting and alternative work schedules, commute trip-reduction marketing, and preferential parking permit program.
This strategy encompasses strategies 1C, 1D, and 1E and cannot be analyzed in combination with these strategies. Unlike strategy 1A (Voluntary Employer Commute Program), this strategy would be contractually required of the developer or property owner and is accompanied by a regular performance-monitoring and reporting program. If this strategy is selected, strategy 1A cannot be analyzed as part of the total VMT reduction.
26%
1C. Employer Carpool Program
Employers can encourage carpooling by providing ridematching assistance to employees, providing priority parking for carshare vehicles, and providing incentives for carpooling.
Low-density suburb: 3% Suburban center: 5% Urban: 8%
1D. Employer Transit Pass Subsidy
Employers can encourage employees to take transit by providing subsidized or discounted daily or monthly public transit passes to employees.
Reduction varies by amount of subsidy Low-density suburb: 0.1-
0.6%

Transportation Impact Analysis Handbook | Final City of Fremont
33
Suburban center: 1.1-5.8%
Urban: 2.2-10.9%
1E. Employer Vanpool Program
Vanpooling is a flexible form of public transportation that provides groups of 5–15 people with a cost-effective and convenient rideshare option for commuting,
An employer can encourage ridesharing by subsidizing vanpooling for employees who have a similar origin and destination and by providing priority parking for employees who vanpool.
7.1%
1F. Employer Telework Program
A telework program enables employees to work from home or a remote location one or more days per week. Depending on the nature of the work, schedules can range from full-time, specific days of the week, or as-needed. The VMT impacts of telework are similar to a flexible work schedule program, which enables employees to work long
hours in exchange for one day off every week or two.
44% (maximum, but not typical)
Land Use Strategies
2A. Transit Oriented Development
Transit Oriented Development (TOD) refers to projects built in compact, walkable areas that have easy access to public transit, ideally in a location with a mix of uses, including housing, retail, offices, and community facilities.
TODs are generally described as places within a 10 minute walk of a high-frequency rail transit station (BART) They should, at a minimum, incorporate bike and pedestrian access to transit, thereby encouraging transit use and
reducing vehicle travel.
14.4%
2B. Mixed Use Development
Mixed use projects incorporate a range of complementary land uses that provide a balanced development approach relative to the surrounding neighborhood and encourage transportation alternatives. This could include co-location residential development, office space, retail shops, and others.
Land use mix is measured using an entropy index. An index of 0 indicates a single land use while an index of 1 indicates equal distribution of all land uses. For ease of use, the strategy is calculated using only two land use types - residential (number of residents) and commercial (number of jobs).
30%
Parking Management
3A. Parking Pricing Priced parking can be implemented on- or off-street and helps to effectively manage the parking supply. Priced parking works best in areas where on-street parking is managed (e.g., priced parking, residential permit
programs, time limits, etc.) to reduce unintended consequences of parking in adjacent neighborhoods. 7.5%
3B. Parking Cash Out
Employers can offer employees who are provided free parking the option to take the cash value of the space in lieu of the space itself.
California state law (AB 2109, Katz) requires that certain employers who provide subsidized parking for their employees offer a cash allowance in lieu of a parking space.
This strategy is only applicable where employers pay for or rent parking for their employees. Parking cash-out is most successful when paired with incentives or programs that encourage the use of
transportation alternatives.
12%

Transportation Impact Analysis Handbook | Final City of Fremont
34
Figure 21 Mobility Management VMT Reduction Measures for Community/City-Level Application
Category Measure Description Reduction
Neighborhood Enhancements
4A. Street Connectivity Improvement
A connected and complete street network improves accessibility, safety, and livability of the community. Traditional grid street patterns with short blocks offer a high degree of connectivity compared to street networks with
curvilinear designs and cul-de-sacs. This strategy uses intersection density as a proxy for street connectivity improvements, which help to facilitate a greater number of short trips.
Example projects that increase intersection density would be building a new street network in a subdivision or retrofitting an existing street network to improve connectivity (e.g. cul-de-sacs converted to grid streets).
6%
4B. Pedestrian Facility Improvement
Enhancing pedestrian facilities (e.g. streetscape and pedestrian crossing improvements) within the jurisdiction or community helps to encourage walking and reduce the reliance on the single occupancy vehicle.
This strategy applies to sidewalk enhancements that improve the existing streetscape and is not inclusive of greenfield developments with new roadways.
1.4%
4C. Bikeway Network Expansion
A bikeway network includes an interconnected system of bike lanes, bike paths, and cycle tracks (Class I, Class II, and Class IV facilities).
Bike facilities may share the roadway with vehicles or provide a dedicated pathway that separates bikes from cars or pedestrians. Increasing the network of bike facilities help to encourage biking as a safe and convenient alternative to driving.
If this strategy is selected, strategy 4D (Bike Facility Improvement) cannot be analyzed as part of the total VMT reduction.
5%
4D. Bike Facility Improvement
If a comprehensive bikeway network expansion (strategy 4C) is not feasible, the addition of a single bike lane (Class II), bike path (Class I), or protected bikeway (Class IV) to an existing bikeway network helps to improve biking conditions within an area.
Class I facilities are bike paths that are physically separated from motor vehicle traffic. Class II facilities are striped bicycle lanes that provide exclusive use to bicycles on a roadway.
Class IV facilities are protected on-street bikeways, also called cycle tracks. Consider local or state bike width standards when implementing facility improvements.
If this strategy is selected, strategy 4C (Bikeway Network Expansion) cannot be analyzed as part of the total VMT reduction.
0.3%
4E. Bikeshare
Bikeshare programs help to reduce traffic congestion and demand for parking by providing users with on-demand access to bikes for short-term rental.
Bikeshare systems that feature electrified vehicles (scooters, e-bikes) help increase the range of the bike trip, making these services convenient and attractive to users.
Providing discounted bikeshare memberships or dedicated bikeshare parking can encourage users and improve the user experience.
0.1%
4F. Carshare Carsharing offers people with convenient access to a vehicle for personal or commuting purposes. Carsharing helps to encourage transportation alternatives by reducing vehicle ownership. Roundtrip carshare providers require members to return the vehicle to a designated location. One-way carshare (i.e.,
free-floating) providers allow members to pick up the vehicle in one place and end their trip in another.
0.7%

Transportation Impact Analysis Handbook | Final City of Fremont
35
Discounted carshare memberships and priority parking for carsharing vehicles help to encourage use of carsharing services.
4G. Community-Based Travel Planning
Community-based travel planning (CBTP) is a residential-based approach to outreach that provides households with customized information, incentives and support to encourage the use of transportation alternatives.
The approach involves a team of trained ‘Travel Advisors’ engaging residents at home or in their communities to offer information, incentives, and advice about how members of households can travel in alternative ways that meet their needs.
Teams of trained Travel Advisors visit all households within a targeted geographic area, have tailored conversations about residents’ travel needs, and educate residents about the various transportation options available to them.
Due to the personalized outreach method, communities are typically targeted in phases.
2%
Transit Strategies
5A. Transit Service Expansion
Expanding the transit network increases the transit system's ability to accommodate existing and future travel demand, particularly for peak period commute trips.
This strategy provides an effective alternative to congested freeways and roadways for travelers and can reduce vehicle miles traveled by increasing transit ridership.
Transit network service improvements should be coordinated closely with the operating transit agency.
5.9%
5B. Transit Frequency Improvements
Transit frequency improvements can be implemented system-wide or on individual routes. Frequency improvements increase transit ridership by reducing travel times, which improve the user experience and
increase the attractiveness of transit service. Transit network service improvements should be coordinated closely with the operating transit agency.
8.2%
5C. Transit-Supportive Treatments
Roadway infrastructure and/or traffic signal modifications can improve transit travel times and reliability, leading to mode shift to transit.
Treatments can include transit signal priority, bus-only signal phases, queue jumps, curb extensions to speed passenger loading, and dedicated bus lanes.
Transit-supportive treatments should be coordinated closely with the operating transit agency.
0.4%
5D. Transit Fare Reduction
Transit pricing strategies are designed to reduce the costs associated with using transit, thereby creating incentives for people to shift from other traveling modes.
Fare reductions can be implemented system-wide, in specific fare-free or reduced fare zones. This strategy varies from Employer Transit Pass Subsidy (Strategy 1D) which can be offered through employer-based
benefits programs in which the employer fully or partially pays the employee’s cost of transit.
1.2%
5E. Microtransit NEV Shuttle
Microtransit services utilize real-time ride-hailing, mobile tracking and app-based payment to provide demand-based service to users.
Microtransit services are flexible and can be designed to fulfill the mobility needs of a community. Neighborhood electric vehicles (NEVs) are a type of microtransit service that operate within a defined service area and
fulfill trips that are short-distance in nature, typically less than two miles long. NEVs help to facilitate connections to and from transit stations and provide users with an alternative to driving for short
trips.
0.1%

Transportation Impact Analysis Handbook | Final City of Fremont
36
In addition to the measures identified by SANDAG, the following measures listed in Error! Reference source not found. can be proposed by a project applicant if the VMT reductions in the VMT calculator are insufficient to reduce Project VMT below the threshold. The Land Use Strategies and Parking Management measures listed in the following table are currently used by the City of San José.
Figure 22 Additional VMT Reduction Measures
Category Measure Description Maximum Reduction Source
TDM Measures (residential)
Transit Pass for Residents
Provide units with one free transit pass to AC transit or a Clipper card with monthly funds to use on BART and other agencies (can paid for with unbundled, priced parking).
10% CAPCOA
School Pool (Community or city level)
This strategy creates a ridesharing program for school children. It helps match parents to transport students to private schools, or to schools where students cannot walk or bike but do not meet the requirements for bussing.
8% CAPCOA
Voluntary TDM Marketing
Implement marketing strategies to reduce VMT, which may include new resident information materials of alternative mode options, event promotions and publications. 4% CAPCOA
Multi-family Residential Coworking Space (Telework)
Encourage teleworking for residents by providing a shared space with high-speed internet, desks, and private meeting rooms to facilitate working from home. 2.25% CAPCOA
Land Use Strategies
Increase Residential Density
Design the Project with increased residential densities compared to existing conditions in the surrounding area. Increased densities affect the distances people travel and provide greater options for the mode of travel they choose.
30% San José’s VMT Evaluation Tool
Increase Employment Density
Design the Project with increased employment densities compared to existing conditions in the surrounding area. Increased densities affect the distances people travel and provide greater options for the mode of travel they choose.
30% San José’s VMT Evaluation Tool
Include Below Market Rate Housing
Develop on-site deed-restricted affordable, below-market rate (BMR) housing, for low-income households to reside in the Project. At the same site, households with incomes at or below 80% of the regional median income generally make fewer trips by automobile than households with higher incomes, resulting in reduced VMT. BMR housing provides greater opportunity for families to live closer to transit.
32.5% San José’s VMT Evaluation Tool
Parking Management Parking Supply Reduction
Reduce parking supply to encourage “smart growth” development and alternative transportation choices by project residents and employees. Requires a way to address parking off-site through on-street parking management or other means such as lack of nearby on-street parking supply.
12.5% San José’s VMT Evaluation Tool