transportation analysis handbook 2 0
TRANSCRIPT

Transportation Analysis Handbook
2
0
2
0
April 2020

Transportation Analysis Handbook April 2020
This page intentionally left blank

Transportation Analysis Handbook April 2020
Table of Contents
1. INTRODUCTION .......................................................................................................................1
Purpose of the Transportation Analysis (TA) Handbook........................................................... 1 Background ............................................................................................................................... 1 California Environmental Quality Act ........................................................................................ 1 Senate Bill 743 ........................................................................................................................... 2 General Plan Goals and Policies ................................................................................................ 2
2. OVERVIEW OF PROCESS AND PROCEDURES ..............................................................................5
Transportation Analysis Process ............................................................................................... 5 Scope of Work ........................................................................................................................... 5 Transportation Analysis Review ................................................................................................ 6
3. DEVELOPMENT PROJECTS ........................................................................................................9
CEQA Transportation Analysis .................................................................................................. 9 Significance Criteria................................................................................................................... 9 CEQA Transportation Performance Metrics ............................................................................. 9 Screening Criteria .................................................................................................................... 10 Thresholds of Significance ....................................................................................................... 16 Project Impact Analysis ........................................................................................................... 18 VMT Reduction and Mitigation Measures .............................................................................. 25 Trip Cap ................................................................................................................................... 25 Cumulative Impact Analysis .................................................................................................... 25
4. LOCAL TRANSPORTATION ANALYSIS ...................................................................................... 27
Existing Conditions .................................................................................................................. 27 Bicycle and Pedestrian ............................................................................................................ 28 Vision Zero .............................................................................................................................. 29 Americans with Disabilities Act (ADA) .................................................................................... 31 Pedestrian Generators ............................................................................................................ 31 Transit ..................................................................................................................................... 31 Transportation Demand Management (TDM) ........................................................................ 32 Intersection Operations Analysis ............................................................................................ 32 Congestion Management Program ......................................................................................... 41
Intersection Phasing and Queuing Analysis ............................................................................ 43 Signal Warrant Study .............................................................................................................. 44 Site Circulation and Access ..................................................................................................... 45 Sight Distance .......................................................................................................................... 45 Driveway Operations .............................................................................................................. 46
Transportation Analysis Handbook April 2020
Traffic Gap Analysis ................................................................................................................. 46 Parking .................................................................................................................................... 46 Delivery, Waste, and Moving Trucks ....................................................................................... 46 Neighborhood Traffic Intrusion .............................................................................................. 47 Construction ............................................................................................................................ 47 Other Relevant Analyses ......................................................................................................... 47
5. CITY TRANSPORTATION PROJECTS ......................................................................................... 49
CEQA Transportation Analysis ................................................................................................ 49 Significance Criteria................................................................................................................. 49 CEQA Transportation Performance Metrics ........................................................................... 49 Screening Criteria .................................................................................................................... 50 Thresholds of Significance ....................................................................................................... 52 Project Impact Analysis ........................................................................................................... 53 Cumulative Impact Analysis .................................................................................................... 53 Mitigation Measures ............................................................................................................... 54
6. GENERAL PLAN AMENDMENTS .............................................................................................. 55
CEQA Transportation Performance Metrics ........................................................................... 55 Thresholds of Significance ....................................................................................................... 56 Land Use Amendments ........................................................................................................... 57 Transportation Network Amendments ................................................................................... 60 Mitigation Measures ............................................................................................................... 62
7. CONTENTS OF TA REPORT ...................................................................................................... 63
APPENDIX A GLOSSARY OF TERMS ............................................................................................. 79
APPENDIX B TRIP-BASED VMT ASSESSMENT ............................................................................... 83
Transportation Analysis Handbook April 2020
List of Figures
Figure 1 Transportation Analysis Scoping Framework............................................................................ 6
Figure 2 Transportation Analysis Process Overview ............................................................................... 7
Figure 3 CEQA Transportation Screening Map for Residential Projects (March 2018) ........................ 14
Figure 4 CEQA Transportation Screening Map for Affordable Housing Projects (March 2018) ........... 15
Figure 5 CEQA Transportation Screening Map for Office Projects (March 2018) ................................ 16
Figure 6 Vision Zero Corridors (March 2018) ........................................................................................ 30
Figure 7 Project Trip Generation Flow Chart ........................................................................................ 34
Figure 8 San José Infill Opportunity Zone and CMP Facilities (March 2018) ........................................ 43
Figure 9 Site-Specific Long-Range Transportation Analysis Screening Criteria Subarea Boundaries ... 59
Figure 10 Sample Table of Contents ....................................................................................................... 64
Figure 11 Sample Site Location Map ....................................................................................................... 67
Figure 12 VMT Heat Map for Residents in San José (March 2018) ......................................................... 68
Figure 13 VMT Heat Map for Workers in San José (March 2018) .......................................................... 69
Figure 14 VMT Heat Map for Residents in the Nine-County Bay Area (March 2018) ............................ 70
Figure 15 VMT Heat Map for Workers in the Nine-County Bay Area (March 2018) .............................. 71
Figure 16 Sample Pedestrian and Bicycle Facilities ................................................................................ 73
Figure 17 Sample Transit Facilities .......................................................................................................... 74
Figure 18 Sample San José VMT Evaluation Tool Output ....................................................................... 76
Transportation Analysis Handbook April 2020
List of Tables
Table 1 Screening Criteria for CEQA Transportation Analysis for Development Projects ................... 11
Table 2 Thresholds of Significance for Development Projects (March 2018) ..................................... 17
Table 3 Project Characteristics, Multimodal Network Improvements, and Parking Measures (March 2018) ........................................................................................................................................ 19
Table 4 Programmatic Transportation Demand Management Measures (March 2018) .................... 22
Table 5 Place Types in San José ........................................................................................................... 35
Table 6 Location-based Vehicle Mode Share (March 2018) ................................................................ 36
Table 7 Sample Trip Generation for a Residential Project................................................................... 38
Table 8 Intersection Operations Standards at Signalized Intersections .............................................. 40
Table 9 City Transportation Project Types Screened from CEQA Transportation Analysis ................. 50
Table 10 Thresholds of Significance for City Transportation Projects (March 2018) ............................ 52
Table 11 Thresholds of Significance for General Plan Amendments (April 2020) ................................. 57
Table 12 Site-Specific Long-Range Transportation Analysis Screening Criteria for Land Use Amendments ........................................................................................................................... 58
Table 13 Screening Criteria for Transportation Network Amendments ............................................... 61

Transportation Analysis Handbook Page | 1 April 2020
1. INTRODUCTION
PURPOSE OF THE TRANSPORTATION ANALYSIS (TA) HANDBOOK
This handbook is a comprehensive guide that:
1. Provides the transportation analysis (TA) significance criteria, screening criteria, and thresholds of significance for environmental clearance for development projects, City transportation projects, and General Plan amendments;
2. Provides a framework for TA based on the City’s transportation policies and the Envision San José 2040 General Plan;
3. Provides the appropriate methodologies, procedures, and process for the preparation of a TA report within the context of CEQA; and
4. Provides the appropriate methodologies, procedures, and process for determining the effects of projects on the local transportation system.
BACKGROUND
In June 1994, the City developed the Interim Guidelines for Traffic Impact Analysis of Land Development. The document was a guide that provided a basis for determining the need for a transportation impact analysis, the scope, and necessary steps to conduct the analysis based on the City’s Transportation Level of Service Policy (Council Policy 5-3). The guidelines were updated and renamed in 2009 (Traffic Impact Analysis Handbook Volume I – Methodologies & Requirements) and 2011 (Volume II – Policies & Guidelines) to align with adopted transportation policies related to development projects.
This revised Handbook replaces and updates the Traffic Impact Analysis Handbook Volumes I and II to align with the City’s new Transportation Analysis Policy (Council Policy 5-1) and Envision San José 2040 General Plan (2011). The contents are organized as follows:
Chapter 1: Introduction
Chapter 2: Overview of Process and Procedures
Chapter 3: Development Projects
Chapter 4: Local Transportation Analysis
Chapter 5: City Transportation Projects
Chapter 6: General Plan Amendments
Chapter 7: Contents of TA Report
CALIFORNIA ENVIRONMENTAL QUALITY ACT
The California Environmental Quality Act (CEQA) was enacted in 1970 to ensure environmental protection through review of discretionary actions approved by all public agencies. The California Natural Resources Agency adopted the statute, which is codified in the Public Resources Code Section

Transportation Analysis Handbook Page | 2 April 2020
21000 et seq. The California Office of Planning and Research develops the CEQA Guidelines to interpret CEQA statute and published court decisions.
A TA conducted for a development project, a City transportation project, or a General Plan amendment identifies potential CEQA transportation impacts and mitigation which results in a public document used to inform decision makers and the public. Therefore, a TA should provide sufficient information to properly evaluate the impacts and the required project mitigation.
A TA is part of the environmental review process and must meet the requirements of CEQA. San José Municipal Code Title 21- Environmental Clearance incorporates and adopts the objectives, criteria, and procedures for environmental review contained in the CEQA Public Resources Code Section 21000 et seq. and the CEQA Guidelines codified at Title 14 California Code of Regulations Section 15000 et seq. Refer to the California Natural Resources Agency website for further information.
SENATE BILL 743
On September 27, 2013, Governor Jerry Brown signed Senate Bill (SB) 743 (Steinberg) into law and started a process that changes transportation impact analysis as part of CEQA compliance. SB 743 directs the California Office of Planning and Research (OPR) to establish new CEQA guidance for jurisdictions that removes automobile vehicle delay and other similar measures of vehicular capacity or traffic congestion from CEQA transportation analysis. Rather, vehicle-miles traveled (VMT), or other measures that “promote[s] the reduction of greenhouse gas emissions, the development of multimodal transportation networks, and a diversity of land uses,” shall be used as a basis for determining significant transportation impacts in California. The intent of the change is to appropriately balance the needs of congestion management with statewide goals related to infill development, the promotion of public health through active transportation, and the reduction of greenhouse gas emissions.
GENERAL PLAN GOALS AND POLICIES
In November 2011, the City Council adopted the Envision San José 2040 General Plan (General Plan) to guide future growth and development in San José. The General Plan aims to transform San José from a city built around personal motorized vehicles to one that prioritizes people and the public spaces where they live, work, and connect. The General Plan recognizes that access is a function of proximity and mobility and includes complementary strategies to improve both attributes.
Proximity
The General Plan provides a framework to transition from a segregated land use pattern, where the things that people need in their daily lives – housing, jobs, shops, services, child care, schools, entertainment, recreation, etc. – are spread apart, to a more integrated land use pattern that clusters uses in the City’s Planned Growth Areas (PGAs). These PGAs are expected to accommodate more than 470,000 new residents and 380,000 additional jobs, as projected in the General Plan. PGAs include Downtown, Specific Plan Areas, Urban Villages, and Employment Priority Areas. PGAs are largely clustered around existing and planned transit.

Transportation Analysis Handbook Page | 3 April 2020
Regionally, these goals aim to bring residents and jobs closer together. More employment opportunities in San José allow more people to work closer to home and avoid long, traffic-filled commutes to and from the traditional job centers in northern parts of Santa Clara County and along the San Francisco Peninsula.
Mobility
The General Plan aims to build a more balanced and environmentally sustainable transportation system where 60 percent of commute trips made in San José are by walking, biking, transit, or carpool. To achieve this ambitious goal, the General Plan prioritizes better places to walk, connected bicycle facilities that are comfortable for people of all ages and abilities, and improved transit options, particularly in PGAs.
General Plan Policies
The transportation needs of the City associated with land use changes, zoning changes, development projects, and/or transportation projects should be met through implementation of General Plan policies that foster the safe and efficient movement of people and goods. General Plan policies direct how these objectives should be met through the build-out of inter-connected, multimodal transportation networks. General Plan policies that call for transportation analysis and lead to implementation of the City’s multi-modal vision include, but are not limited to, the following:
Consider impacts on overall mobility and all travel modes when evaluating transportation impacts of new developments or infrastructure projects (TR-1.2);
Through the entitlement process for new development, projects shall be required to fund or construct needed transportation improvements for all transportation modes, giving first consideration to improvement of biking, walking and transit facilities and services that encourage reduced vehicle travel demand (TR-1.4);
Require new development where feasible to provide on-site facilities such as bicycle storage and showers, provide connections to existing and planned facilities, dedicate land to expand existing facilities or provide new facilities such as sidewalks and/or bicycle lanes/paths, or share in the cost of improvements (TR-2.8);
Within new development, create and maintain a pedestrian-friendly environment by connecting the internal components with safe, convenient, accessible, and pleasant pedestrian facilities and by requiring pedestrian connections between building entrances, other site features, and adjacent public streets (CD-3.3);
Create a pedestrian-friendly environment by connecting new residential development with safe, convenient, accessible, and pleasant pedestrian facilities. Provide such connections between new development, its adjoining neighborhood, transit access points, schools, parks, and nearby commercial areas (LU-9.1);
Encourage all developers to install and maintain trails when new development occurs adjacent to a designated trail location. Use the City’s Parkland Dedication Ordinance and Park Impact Ordinance to have residential developers build trails when new residential development occurs adjacent to a designated trail location, consistent with other parkland priorities. Encourage developers or property owners to enter into formal agreements with the City to maintain trails adjacent to their properties (PR-8.5).

Transportation Analysis Handbook Page | 4 April 2020
This page intentionally left blank

Transportation Analysis Handbook Page | 5 April 2020
2. OVERVIEW OF PROCESS AND PROCEDURES
The Department of Public Works determines the need for a transportation analysis (TA) in conformance with the CEQA guidelines and City policies. For development projects (called “projects” for the remainder of this document unless otherwise noted), a TA report typically includes two types of analysis: (1) CEQA transportation analysis and (2) Local Transportation Analysis (LTA). Not all projects require both CEQA transportation analysis and LTA in a TA report; projects that do not require a CEQA transportation analysis would typically include just an LTA in a TA report, while some small infill projects (defined in Section 3.4) may not require a CEQA transportation analysis or an LTA.
TRANSPORTATION ANALYSIS PROCESS
The TA process begins by accessing the Public Works’ Development Services website. Applicants must fill out an application for TA scoping, submit a review fee deposit, and a draft work scope prepared by a licensed traffic engineer.
The TA process requires two separate fees: the work scope preparation fee and the TA review fee. Upon a transportation consultant’s submittal of a proposed work scope, a $1500 deposit is required and will be applied to the balance of the TA fees. Public Works will send the final work scope to the transportation consultant and an invoice to the applicant for the outstanding balance of the TA fees. Prior to the City’s review of the TA report, all fees must be paid. Refer to the Public Works’ Applications website for updates to the submittal process and the current fee schedule.
SCOPE OF WORK
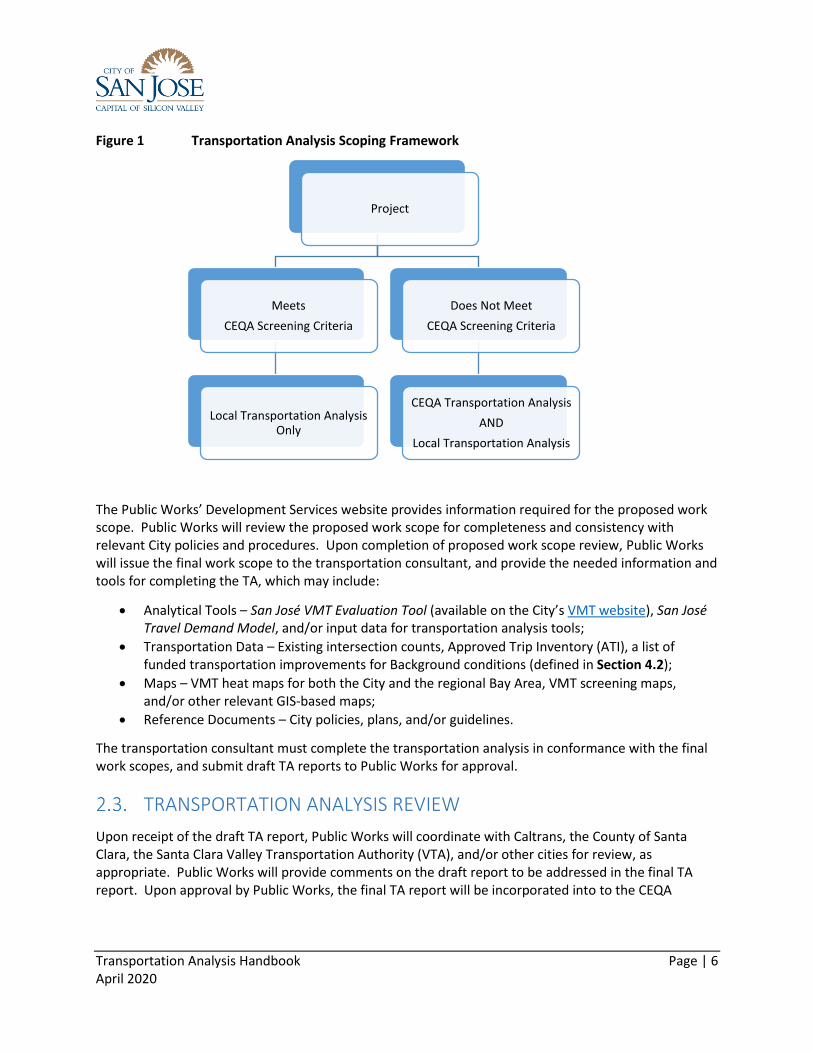
Figure 1 presents a framework as to when a CEQA transportation analysis and/or LTA would generally be included in the scope of work for a TA. Public Works will ultimately determine the required type(s) of TA for a project during the TA scoping process.
Projects that meet the CEQA screening criteria will not require a CEQA transportation analysis. Such projects would typically still require an LTA, with the exception of some small infill projects.
Based on this framework, the transportation consultant shall submit a TA application and a proposed work scope to Public Works for review. The proposed work scope should document key project assumptions and a brief justification of those assumptions. Refer to the Public Works’ Applications website for guidelines for submitting a proposed work scope.
Transportation Analysis Handbook Page | 6 April 2020
Figure 1 Transportation Analysis Scoping Framework
The Public Works’ Development Services website provides information required for the proposed work scope. Public Works will review the proposed work scope for completeness and consistency with relevant City policies and procedures. Upon completion of proposed work scope review, Public Works will issue the final work scope to the transportation consultant, and provide the needed information and tools for completing the TA, which may include:
Analytical Tools – San José VMT Evaluation Tool (available on the City’s VMT website), San José Travel Demand Model, and/or input data for transportation analysis tools;
Transportation Data – Existing intersection counts, Approved Trip Inventory (ATI), a list of funded transportation improvements for Background conditions (defined in Section 4.2);
Maps – VMT heat maps for both the City and the regional Bay Area, VMT screening maps, and/or other relevant GIS-based maps;
Reference Documents – City policies, plans, and/or guidelines.
The transportation consultant must complete the transportation analysis in conformance with the final work scopes, and submit draft TA reports to Public Works for approval.
TRANSPORTATION ANALYSIS REVIEW
Upon receipt of the draft TA report, Public Works will coordinate with Caltrans, the County of Santa Clara, the Santa Clara Valley Transportation Authority (VTA), and/or other cities for review, as appropriate. Public Works will provide comments on the draft report to be addressed in the final TA report. Upon approval by Public Works, the final TA report will be incorporated into to the CEQA
Project
Meets
CEQA Screening Criteria
Local Transportation Analysis Only
Does Not Meet
CEQA Screening Criteria
CEQA Transportation Analysis
AND
Local Transportation Analysis

Transportation Analysis Handbook Page | 7 April 2020
document for the project. The transportation consultant shall submit one (1) final TA report to Public Works. Figure 2 presents a flow chart of the TA review process.
Figure 2 Transportation Analysis Process Overview
TA Scoping
• Consultant submits proposed work scope, application, and review fee deposit
• Public Works coordinates and reviews proposed work scope
• Public Works sends final work scope and data to consultant
• Public Works sends TA fee invoice to applicant
Draft TA Report
• Consultant submits draft TA report with remaining review fee
• Public Works reviews report and coordinates internally
• Public coordinates with external jurisdictions, as appropriate
• Public Works determines if report identifies CEQA impacts and local transportation effects in conformance to City Policies and guidelines
• Public Works determines if report demonstrates feasibility of CEQA mitigation and local transportation improvements
• Public Works sends comments to consultant
Revised/Final TA Report
• Consultant submits revised TA report
• Public Works sends comments on report, if needed
• Public Works approves final TA report in conformance with City policies and guidelines

Transportation Analysis Handbook Page | 8 April 2020
This page intentionally left blank

Transportation Analysis Handbook Page | 9 April 2020
3. DEVELOPMENT PROJECTS
CEQA TRANSPORTATION ANALYSIS
CEQA transportation analysis requires an evaluation of a project’s potential impacts related to VMT and other significance criteria. This section provides the significance criteria, screening criteria, thresholds of significance, and methodologies of the analysis to be used in transportation analysis (TA) reports and CEQA documents for development projects. The City has developed a tool to streamline the analysis for residential, office, and industrial projects (described in Section 3.6).
SIGNIFICANCE CRITERIA
In accordance with OPR’s proposed updates to the CEQA Guidelines1, a project could have a significant transportation impact on the environment if it:
a) Conflicts with a plan, ordinance, or policy addressing the circulation system, including transit, roadways, bicycle lanes, and pedestrian paths;
b) Conflicts or is inconsistent with CEQA Guidelines section 15064.2, subdivision (b)(1); c) Substantially increases hazards due to a geometric design feature (e.g. sharp curves or
dangerous intersections) or incompatible uses (e.g. farm equipment); d) Results in inadequate emergency access.
CEQA TRANSPORTATION PERFORMANCE METRICS
Vehicle-Miles Traveled
VMT is the total miles of travel by personal motorized vehicles a project is expected to generate in a day. VMT is calculated using the Origin-Destination VMT method, which measures the full distance of personal motorized vehicle-trips with one end within the project2.
VMT per Capita (Residential Projects)
When assessing a residential project, the project’s VMT is divided by the number of residents expected to occupy the project to determine the VMT per capita of the project. Refer to Section 3.6 and Appendix B for the City’s guidance for this assessment.
1 Office of Planning and Research. (2017). Proposed Updates to the CEQA Guidelines. 2 The Origin-Destination VMT method used for a CEQA transportation analysis is different from the Boundary VMT method used for a General Plan Amendment long-range transportation analysis. Refer to Section 6.1 for more information.
Transportation Analysis Handbook Page | 10 April 2020
VMT per Employee (Office or Industrial Projects)
When assessing an office or industrial project, the project’s VMT is divided by the number of employees expected to occupy the project to determine the VMT per employee of the project. Refer to Section 3.6 and Appendix B for the City’s guidance for this assessment.
VMT per capita and VMT per employee should not be evaluated against one another; instead, each should be evaluated against its corresponding threshold of significance (defined in Section 3.5).
Net Change in Total VMT (Retail, Hotel, or School Projects)
When assessing a retail, hotel, or school project, the project’s total VMT, as opposed to a per-capita or per-employee VMT metric, is measured. The total VMT for the region with and without the project is calculated. The difference between the two scenarios is the net change in total VMT that is attributable to the project. Refer to Appendix B for the City’s guidance for this assessment.
SCREENING CRITERIA
A detailed CEQA transportation analysis would not be required if a project meets the City’s screening criteria3. Table 1 presents the screening criteria for projects that are expected to result in less-than-significant VMT impacts based on project description, characteristics, and/or location. If a component of a mixed-use project meets these screening criteria, only the component, not the entire project, would not require a detailed CEQA transportation analysis. When a project or component does not meet the screening criteria, refer to Section 3.5.
Small Infill Projects
Projects of sufficiently small size (defined in Table 1) would not require a detailed CEQA transportation analysis. CEQA Guidelines Section 15303 states a categorical exemption for new construction or conversion of small structures, such as an existing office, of up to 10,000 square feet. An office project of this size typically generates the same number of daily trips – around 110 daily trips – as an industrial project of 30,000 square feet4. OPR suggests using these small infill screening thresholds for employment projects5.
The Council Policy 5-1 presumes that an addition of 15 single-family detached dwelling units, 25 attached dwelling units, 10,000 square feet of office gross floor area, or 30,000 square feet of industrial gross floor area, or less, does not result in significant VMT impacts and will further other City goals and policies. In no case should a small infill project be screened out if it is a part of a larger project or “site”6.
3 The screening criteria are consistent with the purposes described in Section 21099 of the California Public Resources Code and closely aligned with the recommended screening criteria provided in the OPR’s 2017 Technical Advisory with expansions to cover other land uses. 4 Based on vehicle-trip rates obtained from the ITE Trip Generation Handbook, 10th Edition. 5 Office of Planning and Research. (2017). Technical Advisory on Evaluating Transportation Impacts in CEQA. 6 Defined in Chapter 20.200 of the San José Municipal Code.

Transportation Analysis Handbook Page | 11 April 2020
Table 1 Screening Criteria for CEQA Transportation Analysis for Development Projects
Type Screening Criteria
Small Infill Projects
Single-family detached housing of 15 units or less; OR
Single-family attached or multi-family housing of 25 units or less; OR
Office of 10,000 square feet of gross floor area or less; OR
Industrial of 30,000 square feet of gross floor area or less
Local-Serving Retail
100,000 square feet of total gross floor area or less without drive-through operations(1)
Local-Serving Public Facilities
Local-serving public facilities
Residential/ Office
Projects or Components
Planned Growth Areas: Located within a Planned Growth Area as defined in the Envision San José 2040 General Plan; AND
High-Quality Transit: Located within ½ a mile of an existing major transit stop(2) or an existing stop along a high-quality transit corridor(3); AND
Low VMT: Located in an area in which the per-capita or per-employee VMT is less than or equal to the threshold of significance for the land use; AND
Transit-Supporting Project Density: o Minimum Gross Floor Area Ratio (FAR) of 0.75 for office projects
or components; o Minimum of 35 units per acre for residential projects or
components; o If located in a Planned Growth Area that has a maximum density
below 0.75 FAR or 35 units per acre, the maximum density allowed in the Planned Growth Area must be met; AND
Parking: o No more than the minimum number of parking spaces required(4); o If located in Urban Villages or Downtown, the number of parking
spaces must be adjusted to the lowest amount allowed(5); however, if the parking is shared, publicly available, and/or “unbundled”(6), the number of parking spaces can be up to the zoned minimum; AND
Active Transportation: Not negatively impact transit, bike or pedestrian infrastructure(7).
Restricted Affordable Residential Projects or
Components
Affordability: 100% restricted affordable units(8), excluding unrestricted manager units; affordability must extend for a minimum of 55 years for rental homes or 45 years for for-sale homes; AND
Planned Growth Areas: Located within a Planned Growth Area as defined in the Envision San José 2040 General Plan; AND

Transportation Analysis Handbook Page | 12 April 2020
High Quality Transit: Located within ½ a mile of an existing major transit stop or an existing stop along a high quality transit corridor; AND
Transit-Supporting Project Density: o Minimum of 35 units per acre for residential projects or
components; o If located in a Planned Growth Area that has a maximum density
below 35 units per acre, the maximum density allowed in the Planned Growth Area must be met; AND
Transportation Demand Management (TDM): If located in an area in which the per capita VMT is higher than the CEQA significance threshold, a robust TDM plan must be included; AND
Parking: o No more than the minimum number of parking spaces required; o If located in Urban Villages or Downtown, the number of parking
spaces must be adjusted to the lowest amount allowed; however, if the parking is shared, publicly available, and/or “unbundled”, the number of parking spaces can be up to the zoned minimum; AND
Active Transportation: Not negatively impact transit, bike or pedestrian infrastructure.
Notes: (1) Defined in the Council Policy 6-10, Criteria for the Review of Drive-through Uses. (2) Defined in the Pub. Resources Code § 21064.3 (“Major transit stop’ means a site containing an existing rail
transit station, a ferry terminal served by either a bus or rail transit service, or the intersection of two or more major bus routes with a frequency of service interval of 15 minutes or less during the morning and afternoon peak commute periods”).
(3) Defined in the Pub. Resources Code § 21155 (“For purposes of this section, a high-quality transit corridor means a corridor with fixed route bus service with service intervals no longer than 15 minutes during peak commute hours”).
(4) Defined in Title 20 of the San José Municipal Code. (5) Defined in Chapter 20.90.220 of the San José Municipal Code. (6) Defined in Chapter 20.200 of the San José Municipal Code. (7) Defined in Council Policy 5-1, Appendix A. (8) At or below income levels defined in the General Plan Policy IP-5.12.
Local-Serving Retail Projects or Components
New retail development typically redistributes existing shopping trips instead of creating new trips7. Local-serving retail projects may shorten vehicle-trips and reduce VMT by diverting existing trips from established local retail to the new local retail without measurably increasing trips outside of the local
7 Lovejoy, et al. (2012). Measuring the impacts of local land-use policies on vehicle miles of travel: The case of the first big-box store in Davis, California. The Journal of Transport and Land Use.

Transportation Analysis Handbook Page | 13 April 2020
area. Regional-serving retail projects, conversely, can lead to longer vehicle-trips and may increase VMT.
The City has defined retail projects below 100,000 square feet as local-serving shopping centers and those above as regional shopping centers8. Therefore, it is presumed that retail projects or retail components of mixed-use projects no larger than 100,000 square feet will have a less-than-significant VMT impact and will not require a detailed CEQA transportation analysis. This presumption, however, does not apply to projects that contain drive-through retail uses, due to the high personal motorized vehicle traffic.
Public Facilities
Public facilities that are publicly-owned or controlled, such as police stations, fire stations, passive parks (defined in Appendix A), branch libraries, pumping stations, community centers, or other public utilities, etc., are located within established communities and serve local needs. These services improve people’s proximity to recreational, community, and other necessary community needs. Schools are not included in this category. If a public facility is determined to be local-serving, the project would not require a detailed CEQA transportation analysis.
Residential and Office Projects in Planned Growth Areas with Low VMT and High-Quality Transit
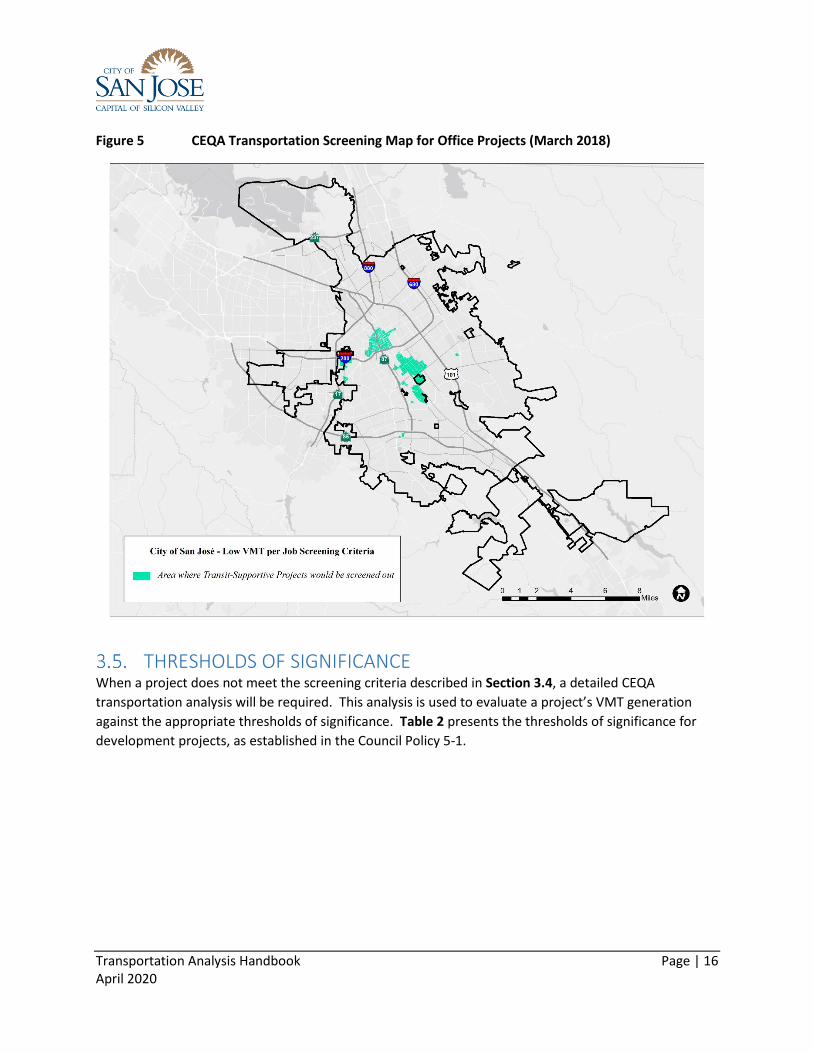
Residential and office projects located in PGAs with low VMT near high-quality transit that incorporate transit-supporting features (i.e. the 7Ds: density, diversity of uses, distance to multimodal facilities, design, destination accessibility, demographics, and development scale) will result in low VMT. Figure 3 and Figure 5 show the CEQA transportation screening maps9 for residential and office projects. These maps illustrate areas that meet the geographic elements of the screening criteria (i.e. located in PGAs, with low VMT, and near high-quality transit).
These maps are used to screen out residential and office projects that may not require a detailed CEQA transportation analysis. For mixed-use projects that include residential or office components, these maps should be used to evaluate each relevant component of the project. If a residential (or office) project is located in a highlighted area in Figure 3 (or Figure 5), and meets the other screening criteria specified in Table 1 (i.e. transit-supporting project density, parking, and active transportation), then the project would be screened from a detailed CEQA transportation analysis.
Affordable Housing in Planned Growth Areas with High-Quality Transit
Deed-restricted affordable housing, defined as developments that are 100 percent affordable for families of Low Income level or below10, correlate with reductions in VMT compared with market-rate housing. This correlation is particularly evident in affordable residential projects near transit11. Figure 4
8 February 15, 2018 Memorandum to City Council, “City-initiated General Plan Text Amendment, New City Council Transportation Analysis 5-1, Amendment to City Council Policy Transportation Impact Policy 5-3, and Designation of Infill Opportunity Zones”, Appendix D. 9 Based on outputs generated produced from the San José Travel Demand Model, updated March 2018. 10 Defined in the Department of Housing’s affordable ownership housing income limits. 11 Newmark & Hass. (2015). Income, Location Efficiency, and VMT: Affordable Housing as a Climate Strategy. The California Housing Partnership.

Transportation Analysis Handbook Page | 14 April 2020
is the CEQA transportation screening map for affordable housing projects. This map illustrates areas located in PGAs and near high-quality transit. One-hundred percent deed-restricted affordable housing projects that are located in a highlighted area in Figure 4 and meets the other screening criteria specified in Table 1 (i.e. transit-supporting project density, TDM, parking, and active transportation) would be screened from a detailed CEQA transportation analysis.
Figure 3 CEQA Transportation Screening Map for Residential Projects (March 2018)

Transportation Analysis Handbook Page | 15 April 2020
Figure 4 CEQA Transportation Screening Map for Affordable Housing Projects (March 2018)
Transportation Analysis Handbook Page | 16 April 2020
Figure 5 CEQA Transportation Screening Map for Office Projects (March 2018)
THRESHOLDS OF SIGNIFICANCE When a project does not meet the screening criteria described in Section 3.4, a detailed CEQA
transportation analysis will be required. This analysis is used to evaluate a project’s VMT generation
against the appropriate thresholds of significance. Table 2 presents the thresholds of significance for
development projects, as established in the Council Policy 5-1.

Transportation Analysis Handbook Page | 17 April 2020
Table 2 Thresholds of Significance for Development Projects (March 2018)
Project Types Significance Criteria Current Level Threshold
Residential Uses
Project VMT per capita exceeds existing citywide average VMT per capita minus 15 percent OR existing regional average VMT per capita minus 15 percent, whichever is lower.
11.91
VMT per capita (Citywide Average)
10.12
VMT per capita
General Employment Uses
Project VMT per employee exceeds existing regional average VMT per employee minus 15 percent
14.37
VMT per employee (Regional Average)
12.21
VMT per employee
Industrial Employment Uses
Project VMT per employee exceeds existing regional average VMT per employee
14.37
VMT per employee (Regional Average)
14.37
VMT per employee
Retail/ Hotel/ School Uses
Net increase in existing regional total VMT
Regional Total VMT Net Increase
Public/Quasi-Public Uses
In accordance with the most appropriate type(s) as determined by Public Works Director
Appropriate levels listed above
Appropriate thresholds listed
above
Mixed Uses
Evaluate each land use component of a mixed-use project independently, and apply the threshold of significance for each land use type included
Appropriate levels listed above
Appropriate thresholds listed
above
Change of Use/ Additions to Existing Development
Evaluate the full site with the change of use or additions to existing development, and apply the threshold of significance for each project type included
Appropriate levels listed above
Appropriate thresholds listed
above
Area Plans
Evaluate each land use component of the area plan independently, and apply the threshold of significance for each land use type included
Appropriate levels listed above
Appropriate thresholds listed
above

Transportation Analysis Handbook Page | 18 April 2020
These thresholds of significance may change over time as local and regional VMT and greenhouse gas emissions goals shift in response to changes in population, air quality, and transportation patterns. Therefore, the City will revisit the current VMT levels at least once every four years, at the time of the General Plan four-year reviews, and/or when major changes to the City’s land uses and transportation network occur. The thresholds of significance may be updated as needed.
PROJECT IMPACT ANALYSIS
Most projects that require a detailed CEQA transportation analysis will use one of the two methods for assessing a project’s VMT generation (Project VMT), if applicable: (1) San José VMT Evaluation Tool and (2) San José Travel Demand Model.
San José VMT Evaluation Tool
The City has developed the San José VMT Evaluation Tool (“sketch tool”) to assess a project’s potential VMT based on the project’s description, location, and attributes12. For most residential, office, and industrial projects, the sketch tool is the approved method to calculate Project VMT. Available for download from the City’s VMT website, the sketch tool is provided for use by transportation consultants, developers, and others in assessing VMT for development projects and evaluating TDM plans. The tool will be periodically updated by the Department of Transportation as new research on VMT reduction measures becomes available or as circumstances change.
Step 1 – Obtain Existing VMT
Once a user inputs the Assessor’s Parcel Number (APN) of a project, the sketch tool would retrieve from a built-in database the average VMT per capita and VMT per employee for existing buildings within the ½-mile buffer of the project (Existing VMT). In other words, Existing VMT is the current VMT generation for existing buildings in the area and is a base point for calculating Project VMT.
The Existing VMT database used in the sketch tool was obtained from the San José Travel Demand Model. The model draws on geographic data to identify representative per-capita VMT within each Transportation Analysis Zone (TAZ) for residents and employees.
Step 2 – Calculate Project VMT
Using Existing VMT as the base point, the sketch tool calculates Project VMT through an evaluation of project description and the proposed VMT reduction measures. Projects located in areas where Existing VMT is above the established threshold are referred to as being in “high-VMT areas”. Projects in high-VMT areas are required to include a set of VMT reduction measures that would reduce Project VMT to the extent possible.
The sketch tool evaluates a list of selected VMT reduction measures that can be applied to a project to reduce Project VMT. There are four strategy tiers whose effects on VMT can be calculated in the sketch tool: (1) project characteristics, (2) multimodal network improvements, (3) parking, and (4) TDM. The first three strategies – land use characteristics, multimodal network improvements and parking – are
12 San José VMT Evaluation Tool, developed by Fehr & Peers and City of San José in 2018.

Transportation Analysis Handbook Page | 19 April 2020
physical design strategies that can be incorporated into the project description. Table 3 shows the list of potential VMT reduction measures under the three physical design strategies.
If Project VMT still exceeds the threshold of significance after a combination of project characteristics, multimodal network improvements, and parking measures are included in the project description, the fourth strategy, TDM, should be considered. TDM includes programmatic measures that aim to reduce VMT by decreasing personal motorized vehicle mode share and by encouraging more walking, biking, and riding transit (referred to as “alternative transportation modes” throughout the document). Table 4 shows the list of VMT-reducing TDM measures and their general descriptions. TDM measures will be enforced through annual trip monitoring to assess the project’s status in meeting the VMT reduction goals. Refer to Section 3.8 for further information.
Projects in high-VMT areas are required to propose a list of VMT reduction measures and document the associated percent reduction in VMT. Project VMT is calculated by applying the percent reduction to Existing VMT. Project VMT is then compared to the threshold of significance to evaluate the project’s CEQA transportation impact. These calculations are automated in the sketch tool.
Table 3 Project Characteristics, Multimodal Network Improvements, and Parking Measures (March 2018)
Strategy (Tier) Measures Description
Project Characteristics (Tier 1)
Increase Development Density
Where consistent with the Envision San José 2040 General Plan and where in compliance with the San José Municipal Code, design the Project to be denser than existing conditions in the surrounding area. Increased densities affect the distances people travel and provide more options for the mode of travel they choose.
Application: Residential and employment uses
Increase Diversity of Uses
Where consistent with the Envision San José 2040 General Plan and in compliance with the San José Municipal Code, increase the amount of space dedicated to mixed employment and high-density residential uses in the area surrounding the project (defined as a ½-mile buffer from the Project). Different types of uses near one another can reduce VMT because trips between use types are shorter and may be accommodated more easily by non-personal motorized vehicle modes of travel.
Application: Residential and employment uses.
Integrate Affordable and Below Market Rate Housing
Develop on-site deed-restricted affordable, below-market rate (BMR) housing, for low-income households to reside in the project. At the same site, households with incomes at or below 80% of the regional median income generally make fewer trips by personal motorized vehicles than

Transportation Analysis Handbook Page | 20 April 2020
households with higher incomes, resulting in reduced VMT. BMR housing provides greater opportunity for families to live closer to transit.
Application: Residential uses only.
Multimodal Network Improvements (Tier 2)
Expand the Reach of Bike Access with Investment in Infrastructure(1)
Implement bicycle facilities that close gaps in the bicycle network and/or improve the existing bicycle network (e.g. construct barrier or buffer for an existing bike lane). Improving bike access to the project promotes biking as an alternative to driving, and reduces VMT. VMT reductions are based on a reduction of the distance between the project frontage and a bicycle facility.
This measure only applies to bicycle facilities that provide a dedicated lane for bicyclists or a completely separated right-of-way for bicycles and pedestrians. These facilities include Class I, Class II, and Class IV bikeways. This measure would not be applicable if the resulting gap between the project and the external bikeway exceeds 1/3 mile.
Application: Residential and employment uses.
Provide Pedestrian Network Improvements for Active Transportation(1)
Implement pedestrian improvements both on-site and in the surrounding neighborhood. Improving the pedestrian connections encourages people to walk instead of drive and reduces VMT. Pedestrian improvements include but are not limited to: sidewalks; marked or signalized pedestrian crossings at intersections; lighting; and curb ramps. Some proposed pedestrian improvements require additional study and conceptual City approval.
Application: Residential and employment uses.
Provide Traffic Calming Measures(1)
Implement pedestrian/bicycle safety and traffic calming measures both on-site and in the surrounding neighborhood. Providing traffic calming measures promotes walking and biking as an alternative to driving.
VMT reductions are based on proposed median refuges, bulb-outs, and/or other pedestrian crossing enhancements beyond the project frontage. Proposed traffic calming features such as speed bumps require further study and conceptual City approval.
Application: Residential and employment uses.
Transportation Analysis Handbook Page | 21 April 2020
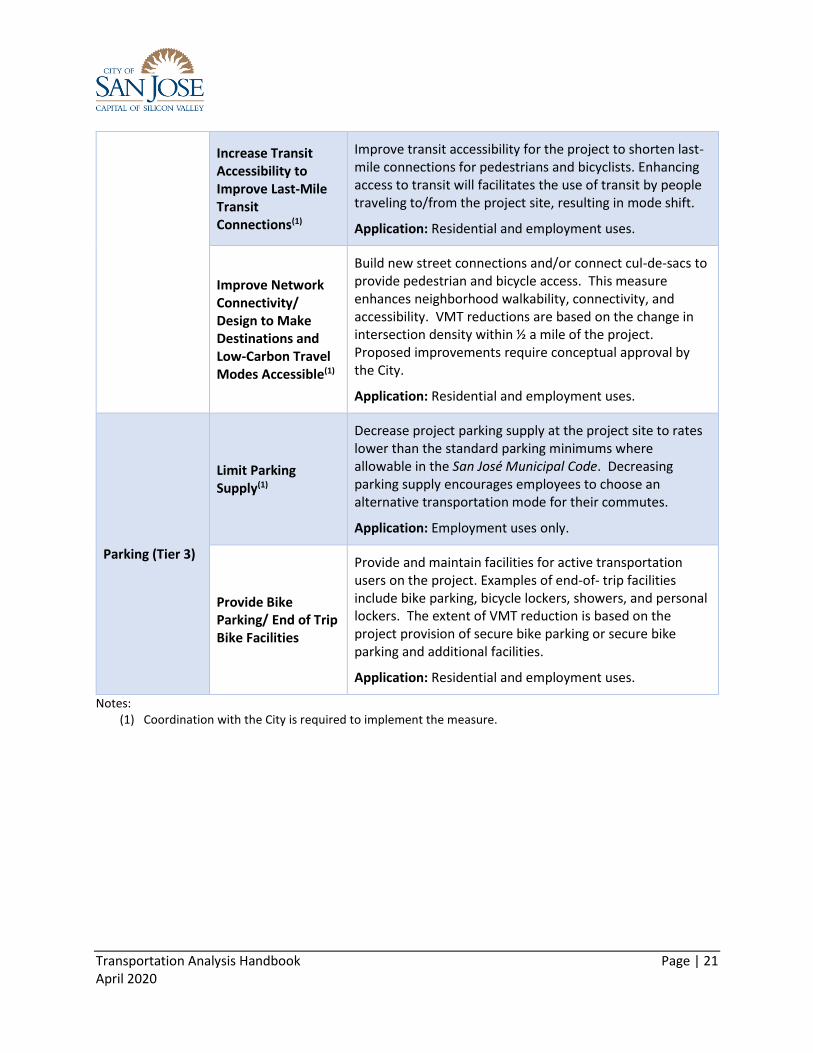
Increase Transit Accessibility to Improve Last-Mile Transit Connections(1)
Improve transit accessibility for the project to shorten last-mile connections for pedestrians and bicyclists. Enhancing access to transit will facilitates the use of transit by people traveling to/from the project site, resulting in mode shift.
Application: Residential and employment uses.
Improve Network Connectivity/ Design to Make Destinations and Low-Carbon Travel Modes Accessible(1)
Build new street connections and/or connect cul-de-sacs to provide pedestrian and bicycle access. This measure enhances neighborhood walkability, connectivity, and accessibility. VMT reductions are based on the change in intersection density within ½ a mile of the project. Proposed improvements require conceptual approval by the City.
Application: Residential and employment uses.
Parking (Tier 3)
Limit Parking Supply(1)
Decrease project parking supply at the project site to rates lower than the standard parking minimums where allowable in the San José Municipal Code. Decreasing parking supply encourages employees to choose an alternative transportation mode for their commutes.
Application: Employment uses only.
Provide Bike Parking/ End of Trip Bike Facilities
Provide and maintain facilities for active transportation users on the project. Examples of end-of- trip facilities include bike parking, bicycle lockers, showers, and personal lockers. The extent of VMT reduction is based on the project provision of secure bike parking or secure bike parking and additional facilities.
Application: Residential and employment uses.
Notes: (1) Coordination with the City is required to implement the measure.

Transportation Analysis Handbook Page | 22 April 2020
Table 4 Programmatic Transportation Demand Management Measures (March 2018)
TDM (Tier 4) Description
Implement a School Car Pool Program(1)
Establish a program that coordinates carpools amongst parents in the development who transport students to and from schools. The school carpool program should be open to all residents in the development. School carpools reduce the total number of personal motorized vehicle-trips traveling to and from schools.
Requires coordination with the City and schools.
Application: Residential uses only.
Implement Bike Sharing Program(1)
Dedicate land for or provide subsidies to a bike sharing system, such as Ford GoBike. Bike share trips replace some driving trips. Bike share also provides a first/last-mile connection for transit users.
Requires coordination with the City and the bike share provider.
Application: Residential and employment uses
Implement Car Sharing Program(1)
Provide subsidies and promotions, as well as dedicated parking spaces, for car-sharing services such as ZipCar, Car2Go, and GetAround, etc. Supporting a car-sharing program gives people on-demand access to shared fleets of vehicles. Car-sharing reduces personal motorized vehicle dependence, which supports more walking, biking, carpooling, and transit use.
Subject to negotiations with the City and possible negotiations with Car Share companies.
Application: Residential and employment uses
Implement Commute Trip Reduction Marketing/ Educational Campaign
Implement marketing/educational campaigns that promote the use of transit, shared rides, and travel through active modes. Strategies may include incorporation of alternative commute options into new employee orientations, event promotions, and publications.
Application: Employment uses only
Implement Commute Trip Reduction Program
Provide a comprehensive program to reduce the number of drive-alone commute trips to and from the project. Such a program should assist employees in using alternative transportation modes. Tools that may be incorporated into the program include flexible/alternative work schedules, ride-share assistance, vanpool assistance, and bicycle end-of-trip facilities.
Application: Employment uses only

Transportation Analysis Handbook Page | 23 April 2020
Implement Employee Parking “Cash-Out”
Require Project employers to offer parking "cash-out." Providing a "cash-out" incentives gives employees the choice to forgo subsidized/free parking for a cash payment equivalent to the cost that the employer would otherwise pay for the parking space. Providing an alternative to subsidized/free parking encourages commuters to travel by walking, biking, carpooling, and transit.
Application: Employment uses only
Implement Subsidized or Discounted Transit Program
Provide either partially or fully subsidized/discounted transit passes (i.e. employees, residents, and visitors). Providing subsidies for transit use encourages people to use transit rather than driving. This measure differs from the "Subsidize Public Transit Service Upgrades" below in that subsidies are provided to employees, not the public transit agency.
Application: Residential and employment uses
Implement Telecommuting and Alternative Work Schedules
Encourage employees to telecommute, shift work schedules, or commute outside of peak congestion periods. This measure reduces commute vehicle-trips.
Application: Employment land uses only
Operate a Free Direct Shuttle Service(1)
Provide shuttle service between the project site and areas with high concentrations of employed residents. This measure reduces drive-alone commute trips.
Application: Employment uses only
Price On-Site Workplace Parking
Require commuters to pay for parking on-site. This measure provides a disincentive to driving and promotes use of alternative transportation modes.
Application: Employment uses only
Access to Neighborhood Schools(1)
Contribute to the development of a neighborhood school that would serve families living in the development. Neighborhood schools primarily serve the neighborhoods immediately surrounding the school and allow students to walk or bike to school.
Requires coordination with City and school district.
Application: Residential uses only
Provide Ride-Sharing Programs
Organize a program to match individuals interested in carpooling who have similar commutes. This measure promotes the use of carpooling and reduces the number of drive-alone trips.
Application: Employment uses only

Transportation Analysis Handbook Page | 24 April 2020
Subsidize Public Transit Service Upgrades(1)
Subsidize transit service through contributions to the transit provider to improve transit service to the project (e.g. frequency and number of routes). This measure differs from the "Subsidized or Discounted Transit Program" in that subsidies are provided to the public transit agency, not the employees.
Subject to negotiation with the City and transit provider (primarily VTA).
Application: Residential and employment uses only
Unbundle On-Site Parking Costs
Provide the cost of parking spaces unbundled from the rental costs of occupied space (in other words, residents must rent parking spaces). Surrounding streets should have parking restrictions, such as metered parking, time limits, restricted overnight parking, and/or residential parking permits (RPP).
Application: Residential uses only
Subsidize Vanpool
Subsidize individuals forming new vanpools for their commutes. This encourages the use of vanpools.
Application: Employment uses only
Voluntary Travel Behavior Change Program
Provide a program that targets individual attitudes and behaviors towards travel, and provide tools for individuals to analyze and alter their travel behavior. Voluntary Travel Behavior Change programs include mass communication campaigns and travel feedback programs, such as travel diaries or feedback on calories burned from activities and travel.
Application: Residential and employment uses
Trip Cap
Establishes a maximum number of daily personal motorized vehicle-trips allowed to be generated by a project. Requires annual monitoring and reporting and requires penalties for nonconformance. Refer to Section 3.8.
Application: Residential and employment uses
Notes: (1) Coordination with the City is required to implement the measure.
San José Travel Demand Model
For non-residential or non-office projects, very large projects, or projects that can potentially shift travel patterns, the sketch tool would not be appropriate or adequate for the CEQA transportation analysis. In such cases, the San José Travel Demand Model may be required based on a preliminary review of the project. For projects requiring model runs, the transportation consultant will coordinate with Public Works in the scoping process to obtain modeling information.

Transportation Analysis Handbook Page | 25 April 2020
There may be projects for which neither the sketch tool nor the San José Travel Demand Model is appropriate for the VMT analysis. In such cases, the transportation consultant should work with Public Works to determine the appropriate methodology for the analysis.
VMT REDUCTION AND MITIGATION MEASURES
Projects must propose measures to reduce Project VMT or mitigate a CEQA transportation impact. As explained in Section 3.6, projects may select a combination of measures from the four VMT reduction strategies – project characteristics, multimodal improvements, parking, and TDM. When the selected measures are included during the planning and design stage as part of the project description, the measures are reflected in the assessment of Project VMT.
When Project VMT exceeds the threshold(s) of significance, the project will need to mitigate its CEQA transportation impact. Measures from the four VMT reduction strategies can be used as mitigation measures.
A project may propose mitigation measures that are not included in the list of approved VMT reduction measures as described in Table 3 and Table 4. In order to be considered as mitigation measures, the transportation consultant must submit substantial evidence of their effect on reducing Project VMT or mitigating a CEQA transportation impact for review and approval by the Director of Public Works.
TRIP CAP
A trip cap is a maximum number of personal motorized vehicle-trips within specified timeframes that are allowed to be generated by a project. If a project proposes to include any TDM measures in the project description and/or mitigation measures, the project must demonstrate that its VMT are below the relevant thresholds after the opening day. To apply a trip cap to a development, a TDM plan for monitoring, reporting, compliance, and funding for the life of the project is required and will become part of conditions of project approval.
The trip cap will be included in the project’s planning permit and/or the Mitigation Monitoring and Reporting Program (MMRP) in perpetuity. Annual trip monitoring reports will be submitted to the Department of Planning, Building and Code Enforcement’s Environmental Review for approval.
If a project’s annual trip monitoring report finds that the project exceeds the established trip cap(s), the project will be required to submit a follow-up report that demonstrates compliance with the trip cap requirements within a grace period, which typically will not exceed six months. Penalties will be assessed if a project does not meet the trip cap requirements by the end of the grace period. Penalties for non-compliance will be assessed by the City as defined in the Council Policy 5-1.
CUMULATIVE IMPACT ANALYSIS
Projects must demonstrate consistency with the Envision San José 2040 General Plan to address cumulative impacts. Factors that contribute to a determination of General Plan consistency include a project’s density, design, and conformance to the General Plan goals and policies. If a project is consistent with the General Plan, it will be considered as part of the cumulative solution to meet the
Transportation Analysis Handbook Page | 26 April 2020
General Plan’s long-range transportation goals, and therefore will result in a less-than-significant cumulative impact.
If a project is determined to be inconsistent with the General Plan, a cumulative impact analysis will be required as part of the General Plan amendment to determine the project’s cumulative effect on the regional air quality and greenhouse gas emissions targets and other performance metrics of the General Plan. Refer to Section 6 for more information.
Transportation Analysis Handbook Page | 27 April 2020
4. LOCAL TRANSPORTATION ANALYSIS
A Local Transportation Analysis (LTA) evaluates the effects of a development project on transportation, access, circulation, and related safety elements in the proximate area of the project. An LTA also establishes consistency with the General Plan policies and goals through the following three objectives:
1. Ensures that a local transportation system is appropriate for serving the types, characters, and intensity of the surrounding land uses;
2. Encourages projects to reduce personal motorized vehicle-trips and increase alternative transportation mode share;
3. Addresses issues related to operations and safety for all transportation modes, with trade-offs guided by the General Plan street typology.
Many factors are considered when determining what types of analyses are included in an LTA. These factors include project description, location, adjacent land uses, and the local transportation system in the proximate area. Public Works determines the LTA scope for a project during the TA scoping process.
This section presents guidelines for preparing LTAs for development projects. Where topics overlap with those in the VTA Transportation Impact Analysis Guidelines, these guidelines are intended to be consistent with the VTA’s, unless otherwise noted, to promote consistency across jurisdictions within the Santa Clara County and good regional planning.
For transportation standards, refer to the San José Complete Streets Design Standards and Guidelines, San José Municipal Code, Envision San José 2040 General Plan, American Association of State Highway and Transportation Officials (AASHTO), California Manual on Uniform Traffic Control Devices (CA MUTCD), Caltrans Highway Capacity Manual, VTA Transportation Impact Analysis Guidelines, VTA Traffic Level of Service Analysis Guidelines, Institute of Transportation Engineers (ITE) Trip Generation Manual, ITE Trip Generation Handbook, and other appropriate guidelines.
EXISTING CONDITIONS
A project is required to document the existing conditions of the local transportation system in its proximate area, including field observations of biking, walking, transit, and roadway operations during peak commute periods.
Existing conditions should include, but not be limited to, the following areas:
Pedestrian facilities and operations;
Bicycle facilities and operations;
Transit stations, routes, schedules, and operations;
Intersection operations;
Queuing and storage length;
Traffic signal phasing and timing;
Ramp meter queues and spill back onto local streets;

Transportation Analysis Handbook Page | 28 April 2020
Uneven lane demand and usage;
Sight distance.
BICYCLE AND PEDESTRIAN
Projects will be evaluated for their ability to support bicycling and walking. This evaluation should include the effects and benefits of site development and associated roadway modifications on: (1) bicycle and pedestrian infrastructure, (2) bicycle and pedestrian access; and (3) conformance to existing plans and policies. These assessments should include the following elements:
Bicycle and Pedestrian Infrastructure:
Any effects on the existing bicycle and pedestrian facilities;
The actual and effective widths of sidewalks immediately adjacent to the project. For areas where sidewalks are absent or deficient, the sidewalk width as determined by the San José Complete Streets Design Standards and Guidelines should be included;
The availability of Americans with Disabilities Act (ADA) ramps at intersections and driveways. A project may be required to construct or reconstruct ADA ramps, especially to existing major pedestrian generators, within the project’s sphere;
The availability and adequacy of bike parking and bike share facilities;
The location of fire hydrants, light poles, traffic control devices, and other significant physical items between the curb and the property line;
The effects of any proposed addition, relocation, or reconstruction of bikeways, sidewalks, curb ramps, lighting, etc.;
Consistency with the Envision San José 2040 General Plan, San José Complete Streets Design Standards and Guidelines, ADA Transition Plan, Urban Village Plans, Area Plans, and other appropriate design standards.
Bicycle and Pedestrian Access:
Pedestrian and bicycle access to and from the project, including an inventory of facilities and deficiencies for access within the site (i.e. from buildings on the site to the public sidewalks) and off-site (i.e. presence/absence of continuous sidewalks, safe crossings). Bicycle and pedestrian access is also described in the Site Circulation and Access section (Section 4.12);
Proposed actions to improve pedestrian and bicycle access, or to mitigate adverse effects on pedestrian and bicycle access that result from the project.
Conformance to Existing Plans and Policies:
Transportation plans developed at the state (California Transportation Plan 2040), regional (Plan Bay Area 2040), county (Valley Transportation Plan 2040, Countywide Bike Plan, and Pedestrian Access to Transit Plan, Multimodal Improvement Plans, etc.), and local (Envision San José 2040

Transportation Analysis Handbook Page | 29 April 2020
General Plan, San José Bike Plan 202013, Multimodal Transportation Improvement Plans14, and Vision Zero15, etc.) levels outline planned improvements to the bicycle and pedestrian networks within the City that are intended to promote and encourage the use of active transportation. Identify any planned improvements to the bicycle and pedestrian networks that will provide the project with improved connections to the surrounding bike, pedestrian, and transit facilities, as well as a balanced transportation system consistent with General Plan goals and policies.
Full implementation of some of the planned pedestrian and bike facility improvements may be cost-prohibitive and beyond the means of the project. In such cases, the project may be required to make a fair-share contribution towards the cost of the improvements if it is determined that the identified improvements would benefit the project.
VISION ZERO
Vision Zero San José is the City’s commitment to prioritize street safety and ensure all road users – people who walk, bike, ride transit, drive, or carpool – are safe.
The Vision Zero San José action plan includes continuing the successful implementation of the “4E’s” (Evaluate, Engineering, Enforcement, and Education), expanding the analysis of crash data, aligning limited resources on high crash corridors, and adding a program of advocacy related to technology, policy, and partnerships.
Developers and projects are considered partners that can help the City achieve the Vision Zero goals of safer streets for everyone. The LTA ensures that a project conforms to the goals of the Vision Zero program. Figure 6 shows the City’s Vision Zero corridors.
13 An update to the City’s bike plan, San José Bike Plan 2025, is underway at the time of the development of this Handbook, with expected completion by 2019. 14 A Multimodal Transportation Improvement Plan (MTIP) is an area-based prioritized list of projects and programs intended to facilitate realization of goals and objectives identified in a long-range plan. MTIPs for Downtown, West San José, and East San José are underway at the development of this Handbook. 15 The City’s Vision Zero corridor evaluation reports are underway at the time of the development of this Handbook.

Transportation Analysis Handbook Page | 30 April 2020
Figure 6 Vision Zero Corridors (March 2018)

Transportation Analysis Handbook Page | 31 April 2020
AMERICANS WITH DISABILITIES ACT (ADA)
The ADA is a civil rights law that prohibits discrimination against individuals with disabilities in all areas of public life, including jobs, schools, transportation, and all public and private places that are open to the public. In support of this, the City has adopted a General Plan policy to ensure all public right-of-ways are safe and accessible to all users. An assessment of the pedestrian facilities within the identified project sphere will be required including any intersections or driveways without ADA ramps. Projects will be required to construct or reconstruct ADA ramps, especially to existing transit stops.
PEDESTRIAN GENERATORS
Private schools, community centers, libraries, parks, and other high pedestrian generators should be evaluated for pedestrian activities. These projects may be required to collect data on adjacent neighborhood streets and propose pedestrian crossing improvements, electronic speed limit signs, or other improvements if appropriate.
These high pedestrian generators should also be evaluated for safe pedestrian access. Projects that add traffic to the adjacent streets may be required to implement improvements to improve pedestrian access to and from these community facilities.
TRANSIT
Projects will be evaluated based on their ability to support transit ridership. An assessment of (1) transit facilities and services, (2) access to transit, and (3) transit operations. These assessments should include the following elements:
Transit Facilities and Services:
Any permanent or temporary reduction of transit availability or interference with existing transit users (e.g. relocation/reconstruction/closure of a transit stop or vacation of a roadway utilized by transit);
Existing transit services with stops within ½ a mile from a project, including route character, service areas, hours of service, peak period headways, and types of vehicles (e.g. bus, light rail, etc.);
For projects located more than ½ a mile from existing or planned transit services: (1) assess the potential of generating a demand for such services; (2) large projects are encouraged to identify funding sources to provide public or private transit services; and (3) if there is an adopted plan on a transit priority corridor, a project may construct or contribute to the buildout of the plan;
If an existing or planned transit stop is located along the project frontage, transit stop improvements may be required as part of the project frontage improvements. If an existing or planned transit stop requires the installation of a shelter where additional right-of-way is needed, or if the new transit stop is not located along the project frontage, the transit agency will coordinate with the affected property owners prior to construction of such improvements by the project;

Transportation Analysis Handbook Page | 32 April 2020
Proposed actions to enhance transit services, transit facilities (e.g. bus stop improvements), or to mitigate adverse effects on existing transit systems or facilities that result from the project.
Access to Transit:
Pedestrian and bicycle access from the project to nearby transit stops, including an inventory of facilities and deficiencies for access within the site (i.e. from building entrances/exits to public sidewalks) and off-site (i.e. presence/absence of continuous sidewalks and safe crossings to access transit). Access to transit is also described in the Site Circulation and Access section (Section 4.12);
Proposed actions to improve pedestrian and bicycle access to transit stops, or to mitigate adverse effects on pedestrian and bicycle access to transit stops that result from the project.
Transit Operations:
The Envision San José 2040 General Plan EIR analyzed the effects of future growth on transit speeds along transit priority corridors. If a project is not transit-supportive, it should be assessed for its effects on transit operations. This assessment may be qualitative (e.g. based on the site circulation and access analysis) or quantitative (e.g. based on the intersection operations analysis);
If a large project is found to have an adverse effect on transit operations, the project should work with the City and VTA to identify feasible transit priority measures (e.g. transit signal priority, queue jump lanes, transit bulb-outs, and dedicated bus lanes, etc.) near the affected facilities and include contributions to any applicable projects that improve transit operations.
TRANSPORTATION DEMAND MANAGEMENT (TDM)
TDM programs are one of the recommended options to reduce project traffic. There are a multitude of TDM measures the City supports to reduce traffic, increase pedestrian, bicycle, and transit use, and improve the environment surrounding a project. Furthermore, according the San José Municipal Code, projects located in Urban Villages or Downtown can propose reductions in the required minimum off-street parking spaces if accompanying a TDM program. The transportation consultant will work with the project applicant to develop a TDM plan for the City’s review and approval. A TDM plan should include monitoring, reporting, compliance, and funding for the life of the project and will become part of conditions of project approval. Some of the measures in the TDM plan may overlap with the TDM measures for CEQA transportation impacts described in Section 3.6.
Annual trip monitoring reports will be submitted to the Department of Planning, Building and Code Enforcement’s Environmental Review for approval. The monitoring of TDM programs is typically conducted through a Trip Cap. Refer to the “Trip Cap” section in Section 3.8 for more information.
INTERSECTION OPERATIONS ANALYSIS
A project is required to conduct an intersection operations analysis if the project would add a measurable number of vehicle-trips to any signalized intersections in the proximate area (defined later

Transportation Analysis Handbook Page | 33 April 2020
in this section). Public Works will provide any available intersection data for use in the analysis. New data will be included in the work scope if the City’s available data are older than two years.
An intersection operations analysis will require assumptions related to project trip generation, trip distribution, and trip assignment. These assumptions should be submitted with the proposed work scope for review and approval. The trip generation analysis should include any proposed trip reduction, if applicable.
Trip Generation
A trip generation analysis estimates the number of external vehicle-trips generated by a project. Figure 7 presents a flow chart of performing a trip generation analysis. Steps 1, 2, and 5 are consistent with the standard trip reductions outlined in the VTA Transportation Impact Analysis Guidelines. Steps 3 and 4 reflect the estimated mode share for people entering or exiting a project, and are consistent with the peer/study-based trip reductions outlined in the VTA Transportation Impact Analysis Guidelines.
1. Estimate Baseline Vehicle-Trips: This step is the base estimation of gross vehicle-trips generated by a project. A project’s vehicle-trips are first estimated by using the vehicle-trip rates from the ITE Trip Generation Manual or other approved source(s). This establishes a project’s baseline vehicle-trips before internal and external trip adjustments are applied.
2. Apply Internal Trip Adjustments: For mixed-use projects, the internal capture trips should be
estimated prior to applying the external trip adjustments. Refer to the VTA Transportation Impact Analysis Guidelines for the vehicle-trip reduction rates for mixed-use projects.
3. Apply Location-based Adjustments: This is the first external trip adjustment to be applied. Based on the location of the project, the estimated vehicle mode share is applied to the adjusted vehicle-trips from Step 2. Refer to the “Location-based Adjustments” section below for more information. This results in an estimated project external vehicle-trips based on location.
4. Apply Project Trip Adjustments: The project external vehicle-trips can be further reduced if the project includes conditions that would result in fewer vehicle-trips than a typical site in a similar context. This is the second external trip adjustment to be applied. Refer to the “Project Adjustments” section below for more information. This results in an estimated project external vehicle-trips based on both location and project conditions.
5. Apply Other Adjustments: The project external vehicle-trips can also be further reduced based on trip type (e.g. pass-by, primary, diverted, and existing uses). Refer to the “Pass-by and Diverted Link Trips” and “Existing Uses” sections below for more information. This results in the net external vehicle-trips generated by the project.

Transportation Analysis Handbook Page | 34 April 2020
Figure 7 Project Trip Generation Flow Chart
1. Estimate Baseline Vehicle-Trips
(Refer to ITE Trip Generation Handbook)
2. Apply Internal Trip Adjustments
(Refer to VTA Traffic Impact Analysis Guidelines)
3. Apply Location-based Adjustments
(Refer to "Location-based Adjustments" section below)
4. Apply Project Trip Adjustments
(Refer to "Project Trip Adjustments" section below)
5. Apply Other Trip Adjustments
(Refer to "Pass-by/Diverted Link Trips" and "Existing Uses" sections below)
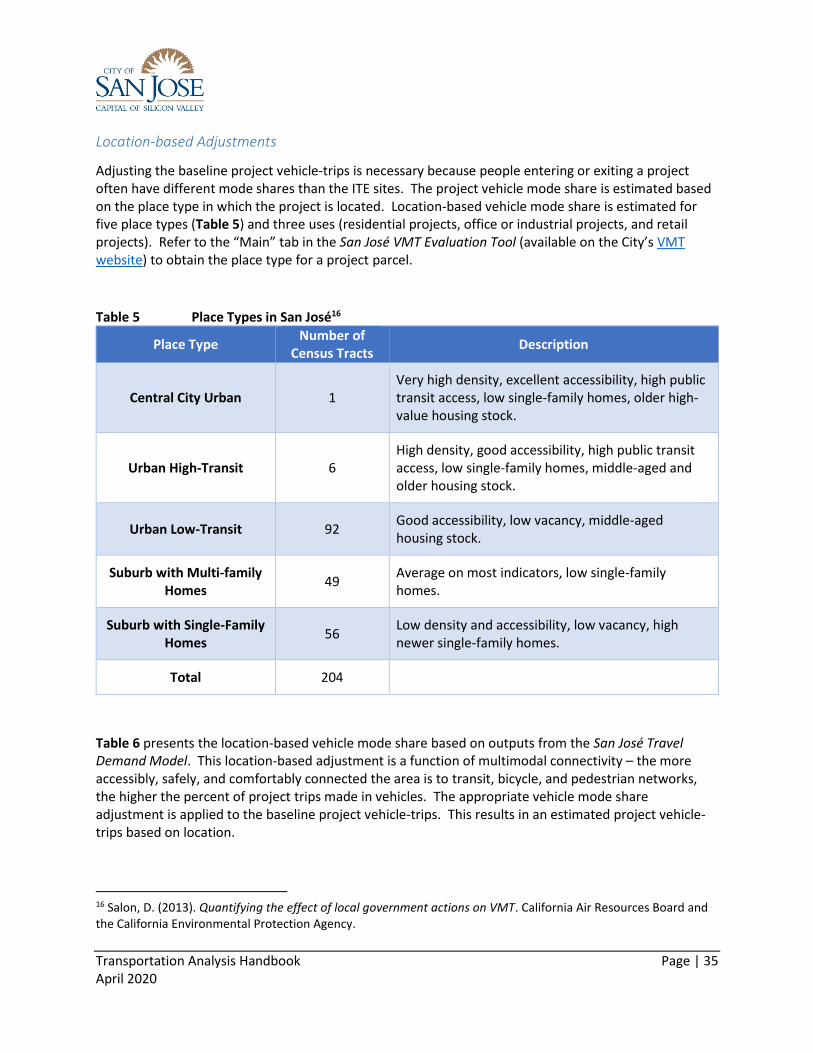
Transportation Analysis Handbook Page | 35 April 2020
Location-based Adjustments
Adjusting the baseline project vehicle-trips is necessary because people entering or exiting a project often have different mode shares than the ITE sites. The project vehicle mode share is estimated based on the place type in which the project is located. Location-based vehicle mode share is estimated for five place types (Table 5) and three uses (residential projects, office or industrial projects, and retail projects). Refer to the “Main” tab in the San José VMT Evaluation Tool (available on the City’s VMT website) to obtain the place type for a project parcel.
Table 5 Place Types in San José16
Place Type Number of
Census Tracts Description
Central City Urban 1 Very high density, excellent accessibility, high public transit access, low single-family homes, older high-value housing stock.
Urban High-Transit 6 High density, good accessibility, high public transit access, low single-family homes, middle-aged and older housing stock.
Urban Low-Transit 92 Good accessibility, low vacancy, middle-aged housing stock.
Suburb with Multi-family Homes
49 Average on most indicators, low single-family homes.
Suburb with Single-Family Homes
56 Low density and accessibility, low vacancy, high newer single-family homes.
Total 204
Table 6 presents the location-based vehicle mode share based on outputs from the San José Travel Demand Model. This location-based adjustment is a function of multimodal connectivity – the more accessibly, safely, and comfortably connected the area is to transit, bicycle, and pedestrian networks, the higher the percent of project trips made in vehicles. The appropriate vehicle mode share adjustment is applied to the baseline project vehicle-trips. This results in an estimated project vehicle-trips based on location.
16 Salon, D. (2013). Quantifying the effect of local government actions on VMT. California Air Resources Board and the California Environmental Protection Agency.

Transportation Analysis Handbook Page | 36 April 2020
Table 6 Location-based Vehicle Mode Share (March 2018) 17
Place Type
% Vehicle Mode Share
Residential Office/
Industrial Retail
Central City Urban 71% 69% 84%
Urban High-Transit 78% 69% 83%
Urban Low-Transit 87% 91% 87%
Suburban with Multifamily Homes 88% 92% 88%
Suburban with Single-Family Homes 94% 95% 91%
Project Trip Adjustments
One of the LTA goals is to encourage projects to reduce personal motorized vehicle-trips and increase alternative transportation mode share. The VMT reduction strategies, discussed in Section 3.6, would not only reduce VMT for a project but also reduce vehicle-trips and increase alternative transportation mode share for the project. The VMT reduction strategies include:
Project characteristics (e.g. density, diversity of uses, design, and affordability of housing) that encourage walking, biking and transit uses;
Improvements to the multimodal network that increase accessibility for transit users, bicyclists, and pedestrians;
Parking measures that discourage personal motorized vehicle-trips;
TDM measures that provide incentives and services to encourage alternatives to personal motorized vehicle-trips.
Implementation of one or more of these strategies will encourage reductions in vehicle-trips generated by projects compared to standard trip generation rates. A project that implements part or all of these strategies may apply the associated vehicle-trip reduction, which can be estimated using the sketch tool. This project trip adjustment is applied so that the project vehicle-trip estimate aligns well with its VMT estimate.
For residential projects, it is assumed that every percent reduction in per-capita VMT is equivalent to one percent reduction in peak hour vehicle-trips. For office and industrial projects, it is assumed that every percent reduction in per-employee VMT is equivalent to one percent reduction in peak hour vehicle-trips.
17 Based on output produced from the San José Travel Demand Model.

Transportation Analysis Handbook Page | 37 April 2020
A project may propose new measures that are not included in the sketch tool. In order to be eligible for the project trip adjustments, the transportation consultant must submit substantial evidence of their effect on reducing project vehicle-trips for review and approval by the Director of Public Works.
Pass-by and Diverted Link Trips
Primary vehicle-trips are trips attracted to a project where the project is the (primary) destination. Pass-by trips are intermediate stops on the way from an origin to a primary destination without diverting to another street to access a project. Diverted link trips are intermediate stops on the way from an origin to a primary destination that require diversion from one roadway to another to gain access to the site. Refer to the VTA Transportation Impact Analysis Guidelines for estimates of pass-by, primary and diverted vehicle-trips for most retail uses.
The percentage of pass-by and diverted link trips should be estimated based on data provided by ITE or actual surveys of similar land uses. The net new vehicle-trip generation estimates should be used to assign project trips to the roadway network and the appropriate pass-by and diverted link trips should be added to or subtracted from the appropriate intersection turning movements.
Existing Uses
Vehicle-trip credits associated with existing use at the project site may be acceptable. Applying vehicle-trip credits provides a more accurate estimation of net new vehicle traffic to be added to the existing roadway network. Public Works determines vehicle-trip credits associated with existing use(s) at the project site.
Sample Trip Generation
The example below illustrates how vehicle-trip adjustments are applied.
A multi-family residential project located in an “Urban High-Transit” place type with the ITE baseline of 500 PM peak hour vehicle-trips. The vehicle mode share in an “Urban High-Transit” place type is 78 percent. The adjusted project vehicle-trips based on location is (500*78%) = 390 vehicle-trips.
Next, based on the VMT analysis, the project would achieve 10 percent reduction in per-capita VMT relative to Existing VMT (defined in Section 3.6). Project vehicle-trips are then estimated by applying 10 percent reduction to the 390 vehicle-trips. The adjusted vehicle-trips based on location and project conditions is 390*(1-10%) = 351 vehicle-trips. Assuming that the project site is currently vacant without existing use, there are no other trip adjustments to be applied. Therefore, the net external PM peak hour vehicle-trips generated by the project is 351. Table 7 summarizes the trip generation calculations for this example.
Where the adjustment factors do not adequately reflect travel characteristics for project occupants, the transportation consultant may choose to use a separate method or tool to estimate vehicle-trip reduction, subject to the review and approval by Public Works.

Transportation Analysis Handbook Page | 38 April 2020
Table 7 Sample Trip Generation for a Residential Project
PM Peak Hour Vehicle-Trips
1. Estimate Baseline Vehicle-Trips 500
2. Apply Internal Trip Adjustments N/A
3. Apply Location-based Mode Share Adjustments 500*78% = 390
4. Apply Project Trip Adjustments 390*(1 - 10%) = 351
5. Apply Other Trip Adjustments N/A
Final project vehicle-trips 351
Trip Distribution
Trip distribution forecasts the travel direction of vehicles generated by a project. Trip distribution percentages should be included in the transportation analysis on a figure showing an area map with the transportation network and the project. The trip distribution figure should show trip percentages at gateways, on nearby freeway segments, and along major arterials that provide direct access to the project.
Trip distribution can be determined from zip code data, census data, market research, travel demand models, existing travel patterns, and/or the locations of complementary land uses, and professional engineering judgement. Trip distribution assumptions should be consistent for developments of the same use in the same areas. The trip distribution figure must be submitted with the work scope for review and approval by Public Works prior to use.
Trip Assignment
Trip assignment consists of assigning vehicle-trips to certain routes on the roadway system based on the trip distribution percentages. Assignment of vehicle-trips should be based on existing and expected traffic volumes and patterns. Trip assignment forecast from a travel demand model may also be used, particularly for long-term land use plans or development projects where the transportation network near the project is expected to change substantially.
Trip assignment figures should contain the project’s traffic turning movement volumes at each study intersection and all other signalized intersections in the project’s vicinity. The figures must be submitted with the work scope for review and approved by Public Works prior to use. Before an approved project is built and occupied, these vehicle-trips will appear in the Approved Trip Inventory (ATI) as “approved trips” to be used for any future transportation analysis in the area.
Study Scenarios
Background Conditions: Public Works will provide the Approved Trip Inventory (ATI), the database of vehicle-trips of approved but not yet constructed projects for use in the analysis. ATI volumes should be added to existing intersection volumes to represent background

Transportation Analysis Handbook Page | 39 April 2020
conditions. The transportation consultant should review the ATI and verify the accuracy of the volumes provided by Public Works to the greatest extent possible (i.e. balanced volumes between adjacent intersections). Public Works will also provide information on any funded roadway improvements that should be included in the background conditions analysis;
Background plus Project Conditions: The project vehicle-trips are added to background traffic volumes to obtain background plus project volumes. Background plus project conditions are evaluated relative to background conditions to determine potential adverse operational effects.
Study Intersections
If a project is expected to add 10 vehicle-trips per hour per lane to a signalized intersection that meets any of the following conditions, the intersection is included in the intersection operations analysis:
Within a ½-mile buffer from the project’s property line;
Outside a ½-mile buffer but within a one-mile buffer from the project AND currently operating at D or worse;
Designated Congestion Management Program (CMP) facility outside of the City’s Infill Opportunity Zones (defined in Section 4.9);
Outside the City limits with the potential to be effected by the project, per the transportation standards of the corresponding external jurisdiction;
With the potential to be effected by the project, per engineering judgement of Public Works.
Public Works determines the list of study intersections for the intersection operations analysis.
Data Collection
Public Works will request new traffic volume counts from a transportation consultant if the most recent existing counts in the City’s database were collected more than two years ago. New intersection turning volume counts, if requested, should be collected and processed by a transportation consultant as follows:
Obtain new, AM and PM two-hour peak period data – vehicle and bicycle counts by turning movement counts, and pedestrian counts by crosswalk leg – at the selected intersections required by Public Works. Intersections are to be counted only Tuesdays through Thursday during non-holiday periods and not on the week of a holiday under fair weather conditions. Studies of certain land uses may require intersection turning movement counts during a non-standard peak period. The work scope will specify the period(s) for which intersection turning movement counts should be taken;
The peak hour volumes consist of counts from the four highest consecutive 15-minute count intervals during the peak period;
Review and evaluate each new count and notify Public Works of any irregularities or discrepancies found;
Submit new counts, along with any evaluation comments, to Public Works for review and approval. New counts should be submitted in the same template format Public Works provide. All approved data will be incorporated into the City’s transportation databases.

Transportation Analysis Handbook Page | 40 April 2020
Intersection Operations
Intersection operations analysis is a measure of traffic operations at signalized intersections in the form of average automobile delay. The standards used by the City to measure intersection operations are described in Table 8. The City’s acceptable intersection operations standard is D unless superseded by an Area Development Policy.
Table 8 Intersection Operations Standards at Signalized Intersections
Operations Standard
Descriptions Average Control Delay
(seconds/vehicle)
A Operations with very low delay occurring with favorable progression and/or short cycle lengths.
10.0 or less
B Operations with low delay occurring with good progression and/or short cycle lengths.
Between 10.1 and 20.0
C Operations with average delays resulting from fair progression and/or longer cycle lengths. Individual cycle failures begin to appear.
Between 20.1 to 35.0
D
Operations with longer delays due to a combination of unfavorable progression, long cycle lengths, and high volume-to-capacity (V/C) ratios. Many vehicles stop and individual cycle failures are noticeable.
Between 35.1 to 55.0
E Operations with high delays indicating poor progression, long cycle lengths, and high V/C ratios. Individual cycle failures are frequent occurrences.
Between 55.1 to 80.0
F Operations with delays unacceptable to most drivers occurring due to over-saturation, poor progression, or very long cycle lengths.
Higher than 80.0
Intersection Operations Analysis Methodologies
Intersection operations analysis should be completed for all study intersections using the Highway Capacity Manual methodologies and the VTA Traffic Level of Service Analysis Guidelines. The analysis should include all study periods specified in the scope of work. The transportation consultant should obtain current signal timing information from Department of Transportation and use these data in the analysis of signalized intersections.
Adverse Intersection Operations Effects
An adverse effect on intersection operations occurs when the analysis demonstrates that a project would cause the operations standard at a study intersection to fall below D with the addition of project

Transportation Analysis Handbook Page | 41 April 2020
vehicle-trips to baseline conditions. For intersections already operating at E or F under the baseline conditions, an adverse effect is defined as:
An increase in average critical delay by 4.0 seconds or more AND an increase in the critical volume-to-capacity (V/C) ratio of 0.010 or more; OR
A decrease in average critical delay AND an increase in the critical V/C ratio of 0.010 or more.
Addressing Adverse Intersection Operations Effects
There are three possible approaches to address negative effects at signalized intersections:
Reduce project vehicle-trips to eliminate the adverse effects and bring the intersections back to the background conditions. The sketch tool can be used to select additional measure(s) that would achieve this reduction;
Construct improvements to the subject intersection(s) or other roadway segments of the citywide transportation system to increase overall capacity;
Implement a trip cap, the maximum number of daily vehicle-trips allowed to be generated by a project. The City, in coordination with the applicant, will set a trip cap for the project at a level that is attainable through proven means and reduce the adverse operations effects to background conditions. Refer to the “Trip Cap” section in Section 3.8 for more information.
A project should prioritize improvements related to alternative transportation modes, parking measures, and/or TDM measures. Improvements that increase vehicle capacity are secondary and must not have unacceptable effects on existing or planned transportation facilities. Unacceptable effects on existing or planned transportation facilities include the following:
Inconsistent with the General Plan Transportation Network and Street Typologies;
Reduction of any physical dimension of a transportation facility below the minimum design standards per the San José Complete Streets Design Standards and Guidelines; OR
Substantial deterioration in the quality of existing or planned transportation facilities, including pedestrian, bicycle, and transit systems and facilities, as determined by the Director of Transportation.
CONGESTION MANAGEMENT PROGRAM
In accordance with California Statute, Government code 65088, Santa Clara County has established a CMP. The intent of the CMP legislation is to develop a comprehensive transportation improvement program among local jurisdictions that will reduce traffic congestion and improve land use decision-making and air quality. VTA serves as the Congestion Management Agency (CMA) for Santa Clara County’s CMP.
As the CMA, VTA is required by California Statute to monitor roadway traffic congestion and the impact of land use and transportation decisions on a countywide level, at least every two years. VTA conducts CMP monitoring and produces the CMP Monitoring and Conformance Report on an annual basis.
As a member agency, the City is required to conform to the CMP requirements for evaluating the transportation impacts of land use decisions on the designated CMP Roadway System. The program is
Transportation Analysis Handbook Page | 42 April 2020
established to address regional transportation issues across City boundaries. The LTA requirements for projects are intended to conform to the CMP requirements. Projects should assess their effects on the designated CMP Roadway System using the VTA Transportation Impact Analysis Guidelines, the VTA Traffic Level of Service Analysis Guidelines, and this handbook.
Infill Opportunity Zones In recognition of the environmental benefits afforded by infill development and to balance the need to
maintain acceptable operations with the need to build infill and mixed-use developments within walking
distance of mass transit facilities and high-density areas, the CMP legislation provides local jurisdictions
options to designate Infill Opportunity Zones (IOZ) and exempt CMP facilities located within the IOZ
from the provisions of CMP’s intersection operations standards. Figure 8 shows the City’s adopted IOZ
map and the exempted CMP facilities.
While there is still a requirement to measure performance of CMP facilities that are located outside of
the adopted IOZ, the CMP regulations allow for some flexibility in determining how congestion is
measured and what improvements are implemented in response to increased congestion. Examples
include shifting the focus of transportation investments from roadway expansion to alternative
transportation modes.
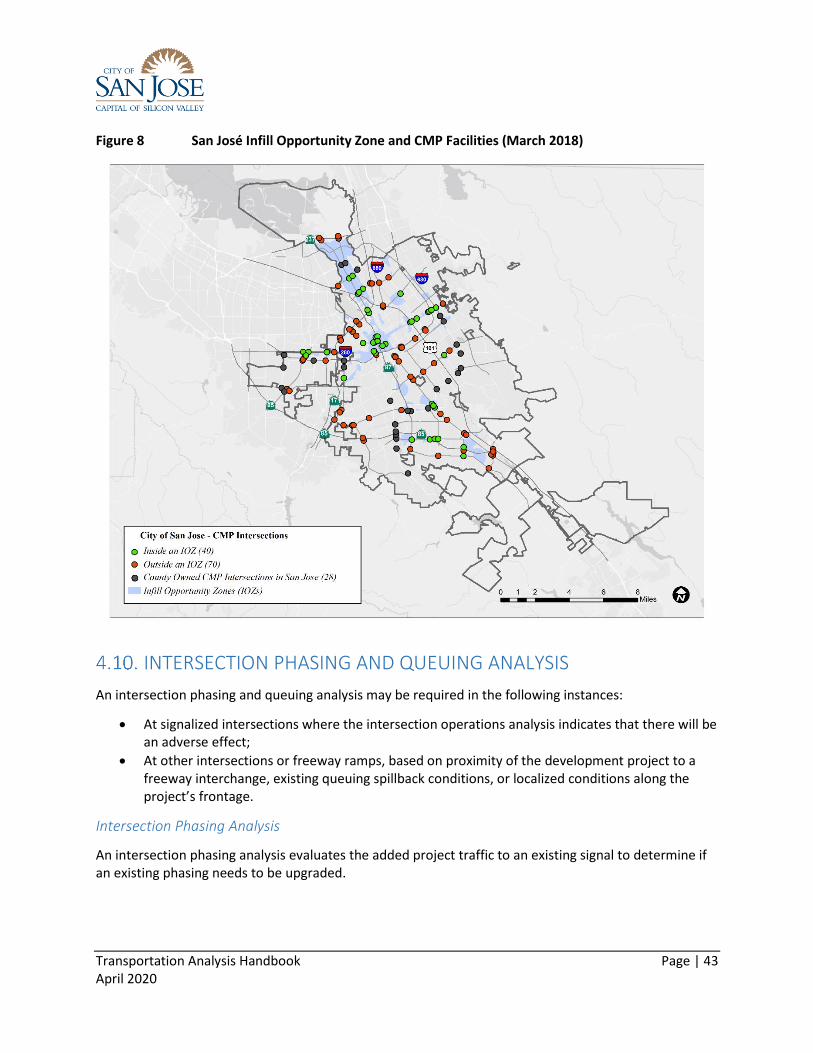
Transportation Analysis Handbook Page | 43 April 2020
Figure 8 San José Infill Opportunity Zone and CMP Facilities (March 2018)
INTERSECTION PHASING AND QUEUING ANALYSIS
An intersection phasing and queuing analysis may be required in the following instances:
At signalized intersections where the intersection operations analysis indicates that there will be an adverse effect;
At other intersections or freeway ramps, based on proximity of the development project to a freeway interchange, existing queuing spillback conditions, or localized conditions along the project’s frontage.
Intersection Phasing Analysis
An intersection phasing analysis evaluates the added project traffic to an existing signal to determine if an existing phasing needs to be upgraded.

Transportation Analysis Handbook Page | 44 April 2020
Left-Turn or Right-Turn Storage Analysis
Left-turn or right-turn storage analysis measures how many vehicle-trips a project would add to an existing turn pocket and determines if the pocket needs to be lengthened and/or improved. It is performed by comparing Background plus project conditions with Background conditions. Adverse effects of queuing should be identified by comparing the calculated design queue to the available queue storage. Queuing effects include, but are not limited to the following:
Spillback queues from turn lanes at intersections that block through traffic;
Queues from an intersection that extend back and affect other intersections;
Queues from bottleneck locations such as lane drops that impact the intersection operations;
Spillback queues from freeway ramps that affect local street or freeway operations;
Queues at intersections that are proximate to freeway ramps.
Un-signalized Intersections
Un-signalized intersection analysis may be required at intersections providing project access. The current macroscopic operational analysis model that supports the Highway Capacity Manual (HCM) should be used to evaluate operations at un-signalized intersections affected by project traffic. Un-signalized intersection analysis indicates if improvements such as a new traffic signal, stop controls, or median island modifications, etc., would be needed. If a new traffic signal is recommended, a separate signal warrant study may also be required.
SIGNAL WARRANT STUDY
Traffic signal warrant studies may be required when a project proposes a signalized entrance or has the potential to effect operations and safety at an existing un-signalized intersection proximate to the project. For most intersections, only the peak hour warrant will be required. However, the project may be required to perform other traffic signal warrants, if determined necessary.
Traffic signal warrant studies are required to conform to the California Manual on Uniform Traffic Control Devices (CA MUTCD) standards. Investigation of the need for a traffic control signal should include an analysis of factors related to the existing operations and safety at a study intersection and the potential to improve these conditions. The study may include an evaluation of the following traffic signal warrants:
Warrant 1: Eight-Hour Vehicular Volume;
Warrant 2: Four-Hour Vehicular Volume;
Warrant 3: Peak Hour;
Warrant 4: Pedestrian Volume;
Warrant 5: School Crossing;
Warrant 6: Coordinated Signal System;
Warrant 7: Crash Experience;
Warrant 8: Roadway Network;
Warrant 9: Intersection near a Grade Crossing.

Transportation Analysis Handbook Page | 45 April 2020
It is important to note the satisfaction of a traffic signal warrant or warrants shall not in itself require the installation of a traffic control signal. The Department of Transportation will determine if a traffic signal is required.
SITE CIRCULATION AND ACCESS
This section evaluates the intersection of a project and the public right-of-way. The evaluation of the site circulation and access should consider the following issues:
Proposed pedestrian access and on-site circulation with recommendations to encourage pedestrian trips to and within the site. Sidewalk, walkway, trail, and path of travel on foot to building entrances should be evaluated. Pedestrian access between the site and the nearest transit stops or stations should be assessed. Any adverse circulation issues should be addressed;
Proposed bicycle access and on-site circulation with recommendations to encourage bicycle trips to and within the site. Bike lanes and path of travel by bicycle to the bicycle parking and/or building entrances should be assessed. Any adverse circulation issues should be addressed;
The extent to which the ability of bicyclist and pedestrians to access the site is inhibited by man-made and natural barriers such as railroad crossings, rivers, freeways, dead-end streets, and cul-de-sacs, should be addressed;
Trips entering and exiting the site at each driveway and parking garage entrance. Distribution of trips to access points should consider street configuration, storage lanes, acceleration and deceleration lanes, and sight distance;
A site plan with adequate detail to show automobile, bicycle, and pedestrian circulation within the site and connections to the off-site transportation network;
Emergency vehicles and service vehicles such as delivery and garbage trucks.
The goal of this evaluation is to establish safe and efficient site access and circulation to and from a project by identifying potential conflicts and propose solutions to those conflicts.
SIGHT DISTANCE
A sight distance analysis will be required at a project driveway if there is potential physical obstruction, or the driveway is located along a horizontal or vertical curve. A sight distance analysis should be performed based on the American Association of State Highway Transportation Officials (AASHTO) standards. This evaluation ensures that driveways and parking garage access have a clear line of sight.
For parking garage entrances, especially where parking structures are proposed at the back of a driveway, sight distance evaluations should consider the intersection of vehicles accessing the parking garage with pedestrians and bicyclists crossing the driveway.

Transportation Analysis Handbook Page | 46 April 2020
DRIVEWAY OPERATIONS
All project access driveways should be evaluated to ensure driveway locations are safe, visible and do not conflict with pedestrian or bicycle facilities. Driveways should be minimized in both number and size. An LTA may evaluate driveways for the following:
Location: Driveways should be a minimum of 150 feet from any intersection;
Number of driveways: Approximately 300 to 600 peak hour trips per driveway;
Driveway design: Standard driveways (typical) or modified curb-return with ADA accessible ramps. Modified driveways may be allowed for signalized entrances, large vehicle uses such as warehouses or distribution centers with primary truck traffic, or ceremonial or major entrances to large developments.
TRAFFIC GAP ANALYSIS
For projects located along busy arterials with no traffic controls, gap analysis may be required to ensure adequate gaps in traffic to accommodate project traffic and provide safe access. This analysis measures the speed and volume of traffic of an existing roadway to determine whether existing gaps in traffic are available to facilitate safe access between the project driveway and nearby streets.
PARKING
The evaluation of off-street parking may be required to identify the number of parking spaces provided by a project and whether its parking supply is consistent with the San José Municipal Code. If the parking supply does not meet the requirements, transportation demand management (TDM) measures will be required.
Projects may be required to evaluate nearby neighborhoods for potential parking intrusion by doing the following:
Conduct parking survey on identified streets prior to implementation of the project;
Conduct parking survey on identified streets approximately six (6) to twelve (12) months after the project is fully operational or occupied;
Implement a parking plan as recommended by the Department of Transportation based on survey results. The parking plan may include establishment of a Residential Parking Permit Program (RPP), installation of parking control signs, and other parking management actions.
DELIVERY, WASTE, AND MOVING TRUCKS
An evaluation of a truck turning template and truck loading area(s) may be required. If a project proposes loading areas in the public right-of-way, the analysis should determine feasibility, location, hours of operation, to ensure there would be no conflicts with the surrounding the transit, bicycle, and pedestrian facilities.

Transportation Analysis Handbook Page | 47 April 2020
NEIGHBORHOOD TRAFFIC INTRUSION
If a project is expected to generate conflicting traffic with adjacent land uses (i.e. commercial traffic generated along neighborhood residential streets) or result in excessive speeds and/or volumes on neighborhood streets, the project may be required to construct traffic calming measures. Traffic calming measures may include: bulb-outs, median refuges, road humps, electronic speed limit signs, or other measures.
Refer to City’s Traffic Calming Policy (Council Policy 5-6) for more information. Projects required to evaluate nearby neighborhoods for potential intrusion will:
Conduct speed and volume study on identified streets prior to implementation of the project;
Conduct speed and volume study on identified streets approximately six (6) to twelve (12) months after the project is fully operational or occupied;
Implement approved traffic calming or traffic control as warranted by the analysis.
Some traffic calming measures, such as bulb-outs and median refuges, etc., can be implemented by the project without requiring a comprehensive study.
CONSTRUCTION
All projects should anticipate construction impacts with new developments. Typically, construction impacts are identified in the CEQA document prepared for a project. To the extent possible, operational analysis should include information about project construction schedule such as duration, hours of operations, any required grading, potential haul routes, traffic control plans, closure or relocation of bus stops, street closures, and construction entrances, etc., especially when adjacent to residents and businesses.
OTHER RELEVANT ANALYSES
Other types of analyses that may be requested in the Local Transportation Analysis chapter of the TA report include, but are not limited to, the following:
Median island or channelization island movement restrictions
Acceleration or deceleration lanes
Average Daily Traffic (ADT) volumes and speeds
Turning movement volumes
Signal coordination plans
Drive-through use
Emergency vehicle access

Transportation Analysis Handbook Page | 48 April 2020
This page intentionally left blank

Transportation Analysis Handbook Page | 49 April 2020
5. CITY TRANSPORTATION PROJECTS
CEQA TRANSPORTATION ANALYSIS
CEQA transportation analysis requires an evaluation of project impacts related to VMT. This section explains the significance criteria, screening criteria, thresholds of significance, and methodologies of VMT analysis to be used in CEQA documents and transportation analysis reports for transportation projects.
SIGNIFICANCE CRITERIA
In accordance with the OPR’s proposed updates to the CEQA Guidelines, a transportation project could have a significant effect on the environment if it:
a) Conflicts with a plan, ordinance, or policy addressing the circulation system, including transit, roadways, bicycle lanes, and pedestrian paths;
b) Conflicts or is inconsistent with CEQA Guidelines section 15064.3, subdivision (b)(2); c) Substantially increases hazards due to a geometric design feature (e.g. sharp curves or
dangerous intersections) or incompatible uses (e.g. farm equipment); d) Results in inadequate emergency access.
CEQA TRANSPORTATION PERFORMANCE METRICS
Percent Change in Total VMT
Shortly after the project becomes operational, induced VMT may occur where road users respond to an initial appreciable reduction in travel time. With lower travel times, the modified facility becomes more attractive to travelers, resulting in four short-run trip-making changes: (1) longer trips; (2) changes in route choice; (3) changes in mode choice; and (4) newly generated trips. Longer trips may occur because the ability to travel a long distance in a shorter time increases the attractiveness of destinations that are further away, increasing trip length and VMT. Changes in route choice may occur immediately when faster travel times on a path attract more drivers to that path from other paths, which can increase or decrease VMT depending on whether it shortens or lengths trips. Changes in mode choice may also occur in the near-term when travelers respond to a reduction of personal motorized vehicle travel time by shifting toward personal motorized vehicle use from other modes. Newly generated trips may occur when an individual who previously did not have a travel need might have one because of increased speed and decreased travel time. The short-run effect of a project on induced VMT, measured in percent change in total VMT, is evaluated for a project.
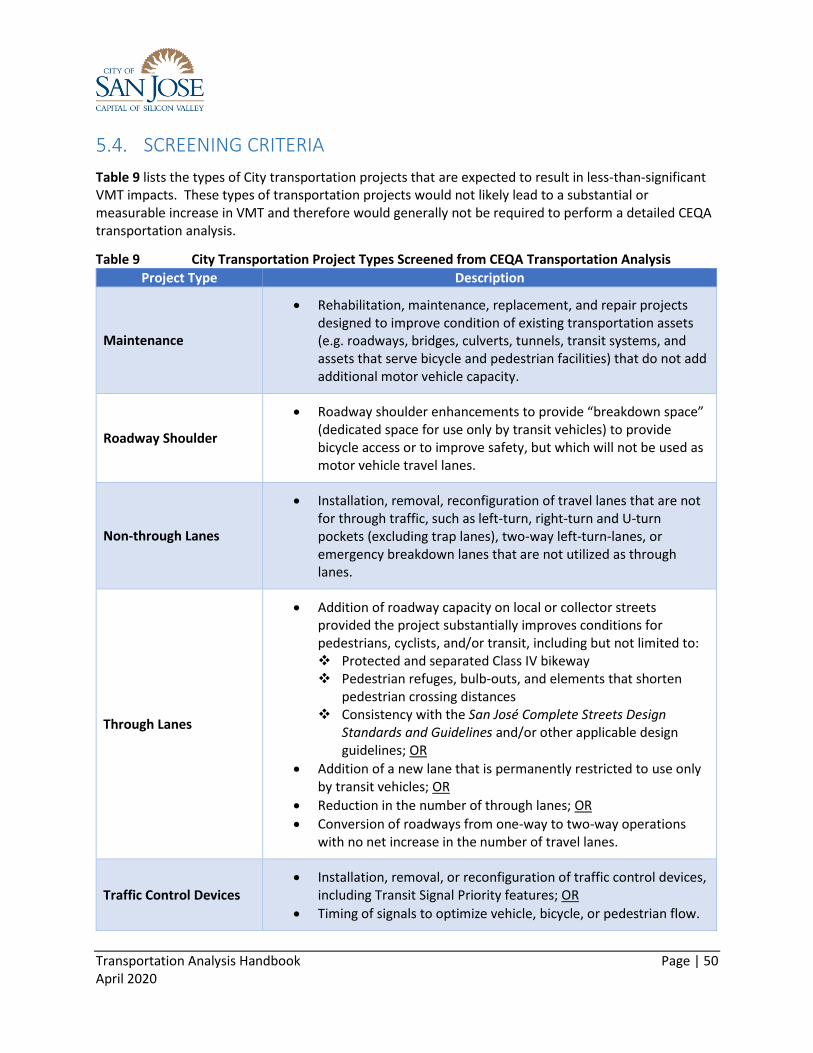
Transportation Analysis Handbook Page | 50 April 2020
SCREENING CRITERIA
Table 9 lists the types of City transportation projects that are expected to result in less-than-significant VMT impacts. These types of transportation projects would not likely lead to a substantial or measurable increase in VMT and therefore would generally not be required to perform a detailed CEQA transportation analysis.
Table 9 City Transportation Project Types Screened from CEQA Transportation Analysis
Project Type Description
Maintenance
Rehabilitation, maintenance, replacement, and repair projects designed to improve condition of existing transportation assets (e.g. roadways, bridges, culverts, tunnels, transit systems, and assets that serve bicycle and pedestrian facilities) that do not add additional motor vehicle capacity.
Roadway Shoulder
Roadway shoulder enhancements to provide “breakdown space” (dedicated space for use only by transit vehicles) to provide bicycle access or to improve safety, but which will not be used as motor vehicle travel lanes.
Non-through Lanes
Installation, removal, reconfiguration of travel lanes that are not for through traffic, such as left-turn, right-turn and U-turn pockets (excluding trap lanes), two-way left-turn-lanes, or emergency breakdown lanes that are not utilized as through lanes.
Through Lanes
Addition of roadway capacity on local or collector streets provided the project substantially improves conditions for pedestrians, cyclists, and/or transit, including but not limited to: Protected and separated Class IV bikeway Pedestrian refuges, bulb-outs, and elements that shorten
pedestrian crossing distances Consistency with the San José Complete Streets Design
Standards and Guidelines and/or other applicable design guidelines; OR
Addition of a new lane that is permanently restricted to use only by transit vehicles; OR
Reduction in the number of through lanes; OR
Conversion of roadways from one-way to two-way operations with no net increase in the number of travel lanes.
Traffic Control Devices Installation, removal, or reconfiguration of traffic control devices,
including Transit Signal Priority features; OR
Timing of signals to optimize vehicle, bicycle, or pedestrian flow.
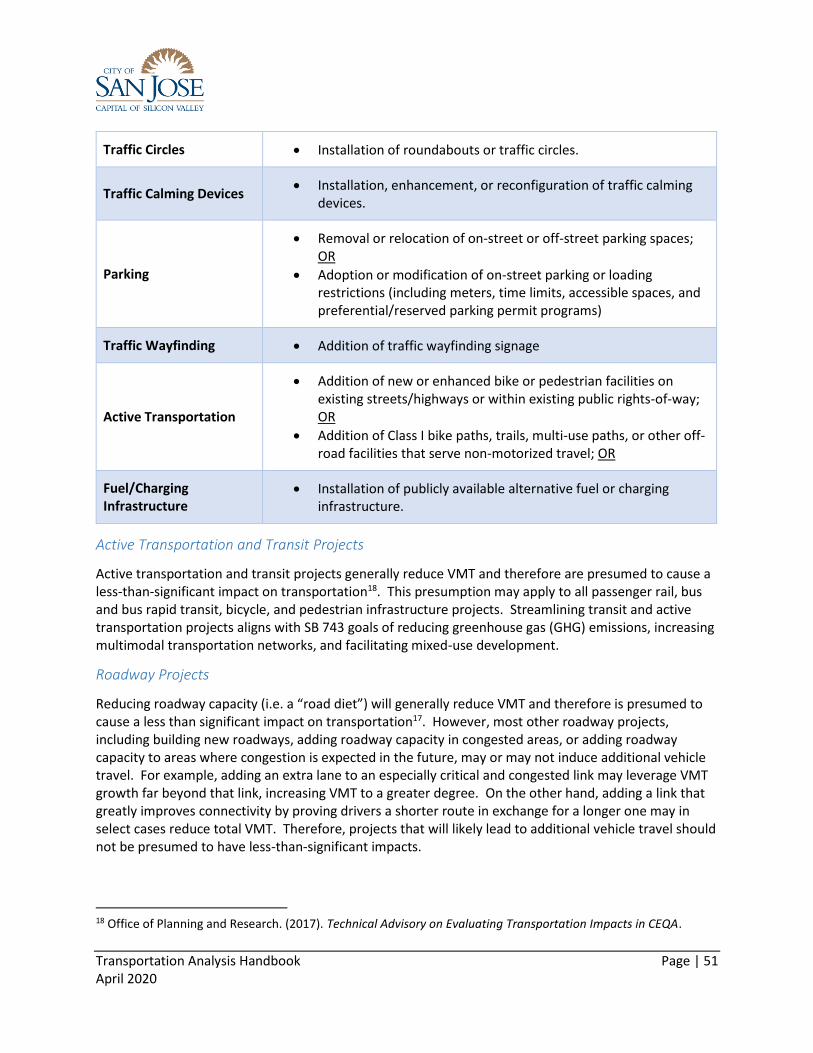
Transportation Analysis Handbook Page | 51 April 2020
Traffic Circles Installation of roundabouts or traffic circles.
Traffic Calming Devices Installation, enhancement, or reconfiguration of traffic calming
devices.
Parking
Removal or relocation of on-street or off-street parking spaces; OR
Adoption or modification of on-street parking or loading restrictions (including meters, time limits, accessible spaces, and preferential/reserved parking permit programs)
Traffic Wayfinding Addition of traffic wayfinding signage
Active Transportation
Addition of new or enhanced bike or pedestrian facilities on existing streets/highways or within existing public rights-of-way; OR
Addition of Class I bike paths, trails, multi-use paths, or other off-road facilities that serve non-motorized travel; OR
Fuel/Charging Infrastructure
Installation of publicly available alternative fuel or charging infrastructure.
Active Transportation and Transit Projects
Active transportation and transit projects generally reduce VMT and therefore are presumed to cause a less-than-significant impact on transportation18. This presumption may apply to all passenger rail, bus and bus rapid transit, bicycle, and pedestrian infrastructure projects. Streamlining transit and active transportation projects aligns with SB 743 goals of reducing greenhouse gas (GHG) emissions, increasing multimodal transportation networks, and facilitating mixed-use development.
Roadway Projects
Reducing roadway capacity (i.e. a “road diet”) will generally reduce VMT and therefore is presumed to cause a less than significant impact on transportation17. However, most other roadway projects, including building new roadways, adding roadway capacity in congested areas, or adding roadway capacity to areas where congestion is expected in the future, may or may not induce additional vehicle travel. For example, adding an extra lane to an especially critical and congested link may leverage VMT growth far beyond that link, increasing VMT to a greater degree. On the other hand, adding a link that greatly improves connectivity by proving drivers a shorter route in exchange for a longer one may in select cases reduce total VMT. Therefore, projects that will likely lead to additional vehicle travel should not be presumed to have less-than-significant impacts.
18 Office of Planning and Research. (2017). Technical Advisory on Evaluating Transportation Impacts in CEQA.
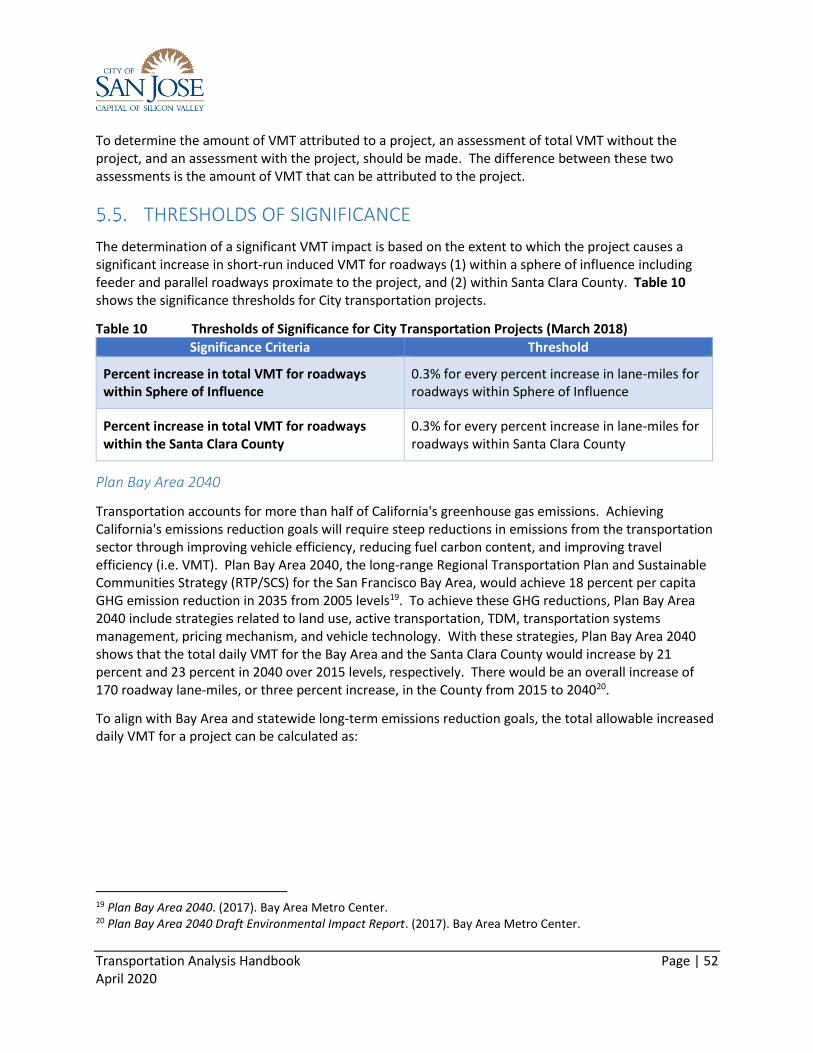
Transportation Analysis Handbook Page | 52 April 2020
To determine the amount of VMT attributed to a project, an assessment of total VMT without the project, and an assessment with the project, should be made. The difference between these two assessments is the amount of VMT that can be attributed to the project.
THRESHOLDS OF SIGNIFICANCE
The determination of a significant VMT impact is based on the extent to which the project causes a significant increase in short-run induced VMT for roadways (1) within a sphere of influence including feeder and parallel roadways proximate to the project, and (2) within Santa Clara County. Table 10 shows the significance thresholds for City transportation projects.
Table 10 Thresholds of Significance for City Transportation Projects (March 2018)
Significance Criteria Threshold
Percent increase in total VMT for roadways within Sphere of Influence
0.3% for every percent increase in lane-miles for roadways within Sphere of Influence
Percent increase in total VMT for roadways within the Santa Clara County
0.3% for every percent increase in lane-miles for roadways within Santa Clara County
Plan Bay Area 2040
Transportation accounts for more than half of California's greenhouse gas emissions. Achieving California's emissions reduction goals will require steep reductions in emissions from the transportation sector through improving vehicle efficiency, reducing fuel carbon content, and improving travel efficiency (i.e. VMT). Plan Bay Area 2040, the long-range Regional Transportation Plan and Sustainable Communities Strategy (RTP/SCS) for the San Francisco Bay Area, would achieve 18 percent per capita GHG emission reduction in 2035 from 2005 levels19. To achieve these GHG reductions, Plan Bay Area 2040 include strategies related to land use, active transportation, TDM, transportation systems management, pricing mechanism, and vehicle technology. With these strategies, Plan Bay Area 2040 shows that the total daily VMT for the Bay Area and the Santa Clara County would increase by 21 percent and 23 percent in 2040 over 2015 levels, respectively. There would be an overall increase of 170 roadway lane-miles, or three percent increase, in the County from 2015 to 204020.
To align with Bay Area and statewide long-term emissions reduction goals, the total allowable increased daily VMT for a project can be calculated as:
19 Plan Bay Area 2040. (2017). Bay Area Metro Center. 20 Plan Bay Area 2040 Draft Environmental Impact Report. (2017). Bay Area Metro Center.

Transportation Analysis Handbook Page | 53 April 2020
𝑇𝑜𝑡𝑎𝑙 𝐴𝑙𝑙𝑜𝑤𝑎𝑏𝑙𝑒 𝑉𝑀𝑇 𝐼𝑛𝑐𝑟𝑒𝑚𝑒𝑛𝑡𝑎𝑙 𝐼𝑛𝑐𝑟𝑒𝑎𝑠𝑒
=23% 𝐼𝑛𝑐𝑟𝑒𝑎𝑠𝑒 𝑖𝑛 𝑇𝑜𝑡𝑎𝑙 𝑉𝑀𝑇 𝑓𝑟𝑜𝑚 2015 𝑡𝑜 2040
3% 𝐼𝑛𝑐𝑟𝑒𝑎𝑠𝑒 𝑖𝑛 𝐿𝑎𝑛𝑒 𝑀𝑖𝑙𝑒𝑠 ∗ 25 𝑌𝑒𝑎𝑟𝑠
=0.3% 𝐼𝑛𝑐𝑟𝑒𝑚𝑒𝑛𝑡𝑎𝑙 𝐼𝑛𝑐𝑟𝑒𝑎𝑠𝑒 𝑖𝑛 𝑇𝑜𝑡𝑎𝑙 𝑉𝑀𝑇
1% 𝐼𝑛𝑐𝑟𝑒𝑎𝑠𝑒 𝑖𝑛 𝐿𝑎𝑛𝑒 𝑀𝑖𝑙𝑒𝑠
PROJECT IMPACT ANALYSIS
Project impact analysis assesses the short-run effect of a project on induced VMT by estimating the percent change in total VMT for the year by which the project is expected to be operational. Total VMT without the project and that with the project should be compared; the percent change between the two is the amount of short-run induced VMT attributed to the project.
Roadways within Sphere of influence
The sphere of influence of a project is defined as the area in which driving patterns are expected to change due to the project. The sphere of influence should not be truncated at a modeling or jurisdictional boundary for convenience of analysis when travel behavior is substantially affected beyond that boundary. For every percent increase in roadway lane-miles that a project will add to the sphere of influence in which driving patterns are expected to change, the project is said to cause a significant transportation impact if it results in 0.3 percent or greater increase in total VMT for all roadways within the sphere of influence. For example, if a project would increase the roadway lane-miles in the sphere of influence by 10 percent, a significant transportation impact would result if the project would cause the total VMT within the sphere of influence by three percent.
Roadways within Santa Clara County
All roadways within Santa Clara County are also evaluated. For every percent increase in roadway lane-miles that a project will add to the transportation network within Santa Clara County, the project is said to cause a significant transportation impact if it results in 0.3 percent or greater increase in total VMT for all roadways within the County. For example, if a project would increase the total roadway lane-miles in the County by 0.1 percent, a significant transportation impact would result if the project would cause the total VMT for all roadways within the County by 0.03 percent.
CUMULATIVE IMPACT ANALYSIS
Estimating long-run induced VMT is important because it captures the full effect of the project rather than just the early-stage induced VMT effect. Besides longer trips, changes in path choice, changes in mode choice and newly generated trips, the project should also be evaluated for its potential long-run land use-inducing impacts and its associated trip-making changes. Faster travel times along a corridor lead to land development further along that corridor which may generate longer trips and VMT increase in the long-run.
Transportation Analysis Handbook Page | 54 April 2020
Long-run induced VMT should be estimated using the change in total VMT method for the horizon year of the General Plan. This analysis should cover both the Sphere of influence Total VMT and the Countywide Total VMT. An assessment of total VMT without the project and that with the project should be made; the difference between the two is the amount of long-run induced VMT attributable to the project.
MITIGATION MEASURES
Induced VMT has the potential to reduce or eliminate congestion relief benefits, increase VMT, and increase other environmental impacts resulted from vehicle travel21. When a significant impact is identified, mitigation measures shall be considered to reduce that impact. In the context of increased travel induced by capacity increases, projects may need to be modified to minimize or avoid substantial induced VMT. Appropriate mitigation to project impacts, such as reducing the scope of the capacity increase or enhancing active transportation components, should be considered and evaluated in the TA.
Impacts resulting from cumulative impact analyses are assumed to occur in the context of full build-out of land uses and transportation network per the General Plan. There is, therefore, little scope for identifying and evaluating new or additional mitigation as it is usually discussed in CEQA documents. In some situations, there may be currently unplanned infrastructure improvements that could provide mitigation for the cumulative impacts. In many cases, behavioral modification (such as greater use of alternative travel modes than was assumed in the travel demand model), transit station enhancements, or other factors that may reduce VMT even though they may not qualify for CEQA mitigation measures. The TA should discuss what, if any, mitigation might be applicable for cumulative impacts.
21 Office of Planning and Research. (2017). Technical Advisory on Evaluating Transportation Impacts in CEQA.

Transportation Analysis Handbook Page | 55 April 2020
6. GENERAL PLAN AMENDMENTS
The City’s General Plan Amendments (GPA) long-range transportation analysis requires an evaluation of potential impacts on the citywide transportation system in the horizon year of the General Plan (2040) when the land use capacities are fully developed. There are two types of GPA transportation analysis: (1) site-specific long-range transportation analysis and (2) cumulative long-range transportation analysis.
GPA long-range transportation analyses are conducted during the City’s General Plan Amendment cycle for developer-initiated General Plan amendments. Projects that require an EIR must file an application for environmental clearance with the Department of Planning, Building, and Code Enforcement (PBCE) by November prior to the Fall General Plan hearing. Projects that do not require an EIR must file an application with PBCE by early March prior to the Fall General Plan hearing. In some cases, projects may file for both a GPA and a project-level environmental clearance. For each developer-initiated GPA, the City will need to determine whether a site-specific long-range transportation analysis would be required. All projects included in a GPA cycle for that year will be included in the cumulative long-range transportation analysis.
This section explains the performance metrics, significance criteria, thresholds of significance, and methodologies for performing the two types of GPA transportation analyses in the TA reports.
CEQA TRANSPORTATION PERFORMANCE METRICS
Vehicle-Miles Traveled per Service Population
Citywide VMT measures the sum of vehicle-miles traveled on roadways bounded within the City. Citywide VMT is calculated using the Boundary VMT method, which accounts for the portion of personal motorized vehicle-trips that occur only within the City boundary, as described below:
Internal-Internal (II) – All trips made entirely within the City limits (trips traveling from San José to San José);
Internal-External (IX) – 50 percent of trips with trips with an origin within the City limits and a destination outside of the City (trips traveling from San José to other locations). This assumes that San José shares half the responsibility for trips traveling to other jurisdictions;
External-Internal (XI) – 50 percent of VMT associated with trips with an origin outside the City limits and a destination within the City (trips traveling from other locations to San José). Similar to the IX trips, San José shares the responsibility of trips traveling to other jurisdictions;
External-External (XX) – Trips that travel through the City to and from other locations are not included in the calculation of Boundary VMT.
Citywide VMT is then divided by the total service population, defined as the sum of household population and jobs. This measurement accounts for the fact that while there is absolute growth in Citywide VMT, the rate of VMT per service population can be reduced by land use decisions.
Transportation Analysis Handbook Page | 56 April 2020
The Boundary VMT method is different from the Origin-Destination VMT method that is used in a CEQA transportation analysis for development projects. The Boundary VMT method is a geographical-based measurement of VMT and ignores the accounting of the individual trip characteristics. On the other hand, the Origin-Destination VMT method ignores the jurisdictional boundaries and adheres to the accounting of trip lengths and other characteristics of individual trips, and is therefore more suited for the evaluation of development projects.
Journey-to-Work Mode Share
The journey-to-work mode share measures the distribution of all daily work trips by travel mode, including drive alone, carpool with two persons, carpool with three or more persons, transit (rail and bus), bike and walk trips. Although work trips may occur at any time of the day, for the purpose of this analysis, work trips that occur during typical peak commute periods (6:00 to 10:00 AM and 3:00 to 7:00 PM) are evaluated using the San José Travel Demand Model.
Average Vehicle Speeds in Transit Priority Corridors
Average travel speed for all vehicles (transit and non-transit vehicles) in the City’s 14 transit corridors is calculated for the AM peak hour based on the segment distance dividing the vehicle travel time. A transit corridor is a segment of roadway identified as a Grand Boulevard in the General Plan’s Land Use/Transportation Diagram.
THRESHOLDS OF SIGNIFICANCE
Table 11 shows the thresholds of significance associated with vehicular modes of transportation.

Transportation Analysis Handbook Page | 57 April 2020
Table 11 Thresholds of Significance for General Plan Amendments (April 2020)
Performance Metrics Significance Thresholds
VMT per Service Population
Any increase over current 2040 General Plan conditions
Journey-to-Work Mode Share
Any increase in journey-to-work drive alone mode share over current 2040 General Plan conditions
Transit Corridor Travel Speeds
Decrease in average travel speed on a transit corridor below current 2040 General Plan conditions in the AM peak one-hour period when:
The average speed drops below 15 mph or decreases by 25 percent or more; OR
The average speed drops by one mph or more for a transit corridor with average speed below 15 mph under current 2040 General Plan conditions
In addition to the significance thresholds above, the impacts of the General Plan amendments on transit, bicycle, and pedestrian facilities are evaluated. A significant long-range transportation impact would occur if the amendments would:
Disrupt existing, or interfere with planned transit services or facilities;
Disrupt existing, or interfere with planned bicycle facilities;
Conflict or create inconsistencies with adopted bicycle plans, guidelines, policies, or standards;
Disrupt existing, or interfere with planned pedestrian facilities; OR
Create inconsistencies with adopted pedestrian plans, guidelines, policies, or standards.
LAND USE AMENDMENTS
Site-Specific Long-Range Transportation Analysis
A site-specific long-range transportation analysis is required for every proposed land use amendment to the General Plan Land Use/Transportation Diagram, except for those amendments that meet the screening criteria as shown in Table 12. In addition, a site-specific long-range transportation analysis may be required for proposed amendments that would otherwise be screened, if special circumstances indicate that transportation impacts may be unusually severe.
Screening Criteria
Table 12 categorizes General Plan land use amendments based on whether a proposed land use change would expand the designated use or convert to a different use. Amendments are also categorized based on their location within geographic subareas of the City. The screening criteria uses the PM peak hour vehicle-trips based on the San José Travel Demand Model. Land use amendments that would generate fewer than the listed number of PM peak hour trips are generally found to not result in a significant long-range transportation impact. These land use amendments are screened from performing a site-specific long-range transportation analysis. Figure 9 shows the geographic boundaries of the four
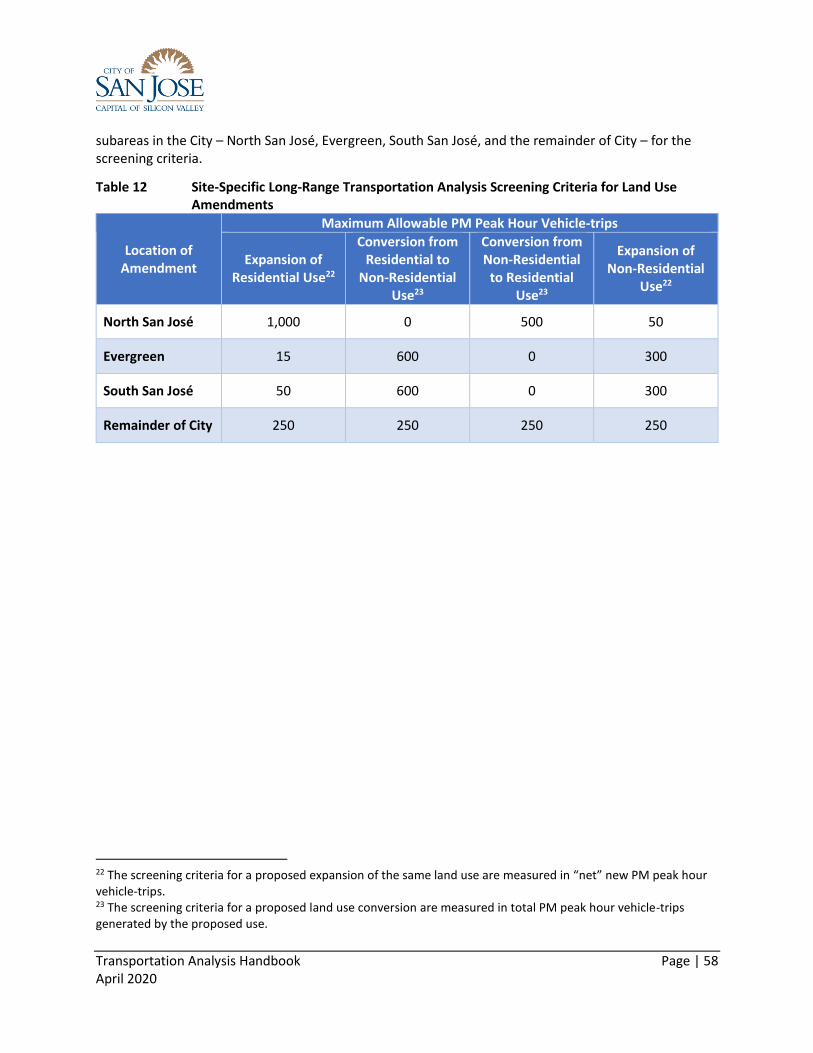
Transportation Analysis Handbook Page | 58 April 2020
subareas in the City – North San José, Evergreen, South San José, and the remainder of City – for the screening criteria.
Table 12 Site-Specific Long-Range Transportation Analysis Screening Criteria for Land Use Amendments
Location of Amendment
Maximum Allowable PM Peak Hour Vehicle-trips
Expansion of Residential Use22
Conversion from Residential to
Non-Residential Use23
Conversion from Non-Residential
to Residential Use23
Expansion of Non-Residential
Use22
North San José 1,000 0 500 50
Evergreen 15 600 0 300
South San José 50 600 0 300
Remainder of City 250 250 250 250
22 The screening criteria for a proposed expansion of the same land use are measured in “net” new PM peak hour vehicle-trips. 23 The screening criteria for a proposed land use conversion are measured in total PM peak hour vehicle-trips generated by the proposed use.

Transportation Analysis Handbook Page | 59 April 2020
Figure 9 Site-Specific Long-Range Transportation Analysis Screening Criteria Subarea Boundaries
Transportation Analysis Handbook Page | 60 April 2020
Study Scenarios
Base Year Conditions: Transportation conditions for the base year against which General Plan scenarios are evaluated;
Adopted General Plan 2040 Conditions: Transportation conditions for the adopted General Plan Year 2040 Conditions are evaluated against the Base Year Conditions;
Proposed General Plan Amendment 2040 Conditions: Transportation conditions for the Proposed General Plan Amendment 2040 Conditions are evaluated against the Base Year Conditions. Results are then compared relative to the Adopted General Plan 2040 Conditions to determine any additional long-range transportation impacts due to the proposed General Plan Amendment.
Cumulative Impact Analysis
In addition to site-specific long-range transportation analyses for individual land use amendments, the TA will also include a cumulative long-range transportation analysis to meet CEQA requirements. This analysis will include all the proposed General Plan amendments, including those individual land use amendments that have been screened from performing site-specific long-range transportation analyses, as well as all the concurrently proposed transportation network amendments, if any.
TRANSPORTATION NETWORK AMENDMENTS
Changing the planned transportation network in the General Plan has substantially different implications for the long-range analysis than amending the land use designation on a single parcel. Changing the citywide transportation network could affect the local area and the external network. The analysis of such a change is therefore distinctively different than the analysis done for a land use change.
While a project may include both land use and transportation network amendments to the General Plan, it is usually possible for the City Council to approve one part of the amendments without the other. It is also possible that the transportation network change may be controversial with a neighborhood, raising issues not directly related to the land use amendment. It would be inappropriate to limit the discretion of the City Council under these circumstances.
Therefore, the long-range analysis for transportation network amendments should be performed independently of any and all land use amendments.
Screening Criteria
The transportation network as referred to in the General Plan Land Use/Transportation Diagram includes four network categories: (1) roadway access points, (2) street network, (3) transit network, and (4) bicycle network. A long-range transportation analysis is required for all transportation network amendments to the General Plan Land Use/Transportation Diagram, except for those amendments that meet the screening criteria as shown in Table 13.

Transportation Analysis Handbook Page | 61 April 2020
Table 13 Screening Criteria for Transportation Network Amendments
Amendment Type Screening Criteria
Roadway Access Points Not applicable
Street Network Decrease in vehicle capacity of collectors or residential streets24
Transit Network Increase in the transit service and network coverage
Bicycle Network Increase in the bicycle network coverage
A roadway access point is defined as an interchange that provides access between local streets and regional facilities (e.g. freeways). Removing a roadway access point will reduce traffic on the streets that are connected to it, and will likely increase traffic using adjacent access points and the streets that are connected to those adjacent access points. Adding a roadway access point will do the opposite. While any reduction in the overall roadway capacity will likely result in the reduction in the City’s Boundary VMT per service population and the commute trip drive-alone share, the effects on transit corridor travel speeds is less certain without a long-range analysis. Therefore, the screening criteria are not applicable for modifications to roadway access points.
Reducing vehicle capacity of an arterial will decrease traffic on the street and the collectors that are connected to it, and will likely increase traffic on adjacent parallel arterials. Increasing the vehicle capacity of an arterial will do the opposite. Similar to roadway access point modifications, since the effects of an arterial capacity change on transit corridor travel speeds is context-specific and cannot be presumed, it is necessary to evaluate against significant criteria in a long-range analysis. Therefore, the screening criteria are not applicable for capacity changes to arterials.
Decreasing vehicle capacity of a collector or residential street generally meets the screening criteria. Travel pattern responses to roadway capacity changes to a collector or a residential street are localized compared to capacity changes to arterials that also serve regional traffic.
Enhancing transit and bicycle network also generally meets the screening criteria. Enhancing transit and bicycle networks will encourage mode shift to transit, bike and walk trips and will likely have beneficial effects on the citywide transportation system. Therefore, these changes are presumed to have less-than-significant long-range transportation impacts and are screened from performing a long-range analysis.
Study Scenarios
Base Year Conditions: Transportation conditions for the base year against which General Plan scenarios are evaluated;
Adopted General Plan 2040 Conditions: All the planned transportation network improvements identified in the adopted General Plan are included. Transportation conditions for the adopted General Plan Year 2040 Conditions are evaluated against the Base Year Conditions;
24 This screening criterion is not applicable for a decrease in vehicle changes of arterials.

Transportation Analysis Handbook Page | 62 April 2020
Proposed General Plan Amendment 2040 Conditions: The combined amendments to the transportation network are made to the General Plan 2040 Conditions. Transportation conditions for the Proposed GPA 2040 Conditions are evaluated against the Base Year Conditions. Results are then compared relative to the Adopted General Plan 2040 Conditions to determine any additional long-range transportation impacts due to the proposed GPA.
MITIGATION MEASURES
Impacts resulting from GPAs are assumed to occur in the context of all the planned land use growth, infrastructure improvements and policies that are already included in the General Plan. There is, therefore, little scope for identifying and evaluating new or additional mitigation as it is usually discussed in CEQA documents. Since GPAs are evaluated in terms of generalized assumptions, such as density averages for land use designations, mitigating a long-range transportation impact requires consideration at a macro level – what types of land use or transportation infrastructure improvements can accommodate the overall citywide transportation demand growth and reducing the long-range transportation impacts. The TA should include a discussion of the following areas when evaluating what mitigation, if any, might be applicable for the GPA:
Are there any unplanned transportation infrastructure improvements or transit enhancements that could alleviate long-range impacts and accommodate overall citywide growth?
Can the GPA be modified to minimize or avoid long-range impacts?
Can travel behavior modification, such as greater use of alternative transportation modes than were assumed in the travel demand model which was calibrated against the travel behavior in the base year, reduce long-range impacts?
Unlike a near-term development, a GPA cannot be conditioned; hence, there is no effective legal mechanism for the City to require mitigation as a condition of approval of the GPA. The discussion of mitigation for long-range transportation impacts must therefore conclude that the impacts are significant and unavoidable.

Transportation Analysis Handbook Page | 63 April 2020
7. CONTENTS OF TA REPORT
This section describes the key elements of a typical Transportation Analysis (TA) report.
Executive Summary
The Executive Summary provides a brief description of the transportation analysis that the project is expected to have on the transportation system. The Executive Summary should provide a table that presents the vehicle-miles travelled (VMT) findings for all applicable land uses of the project. Figures generated from the San José VMT Evaluation Tool or alternative method, along with results of Project VMT and Project with Mitigation VMT, if applicable, should be included in the Executive Summary. Any transportation impacts and proposed mitigation measures should also be identified. Other noteworthy findings, conclusions, and recommendations on the local transportation analysis, such as those related to intersection operations, bicycle/pedestrian issues, site access and circulation issues, etc., should also be addressed in the Executive Summary as appropriate.
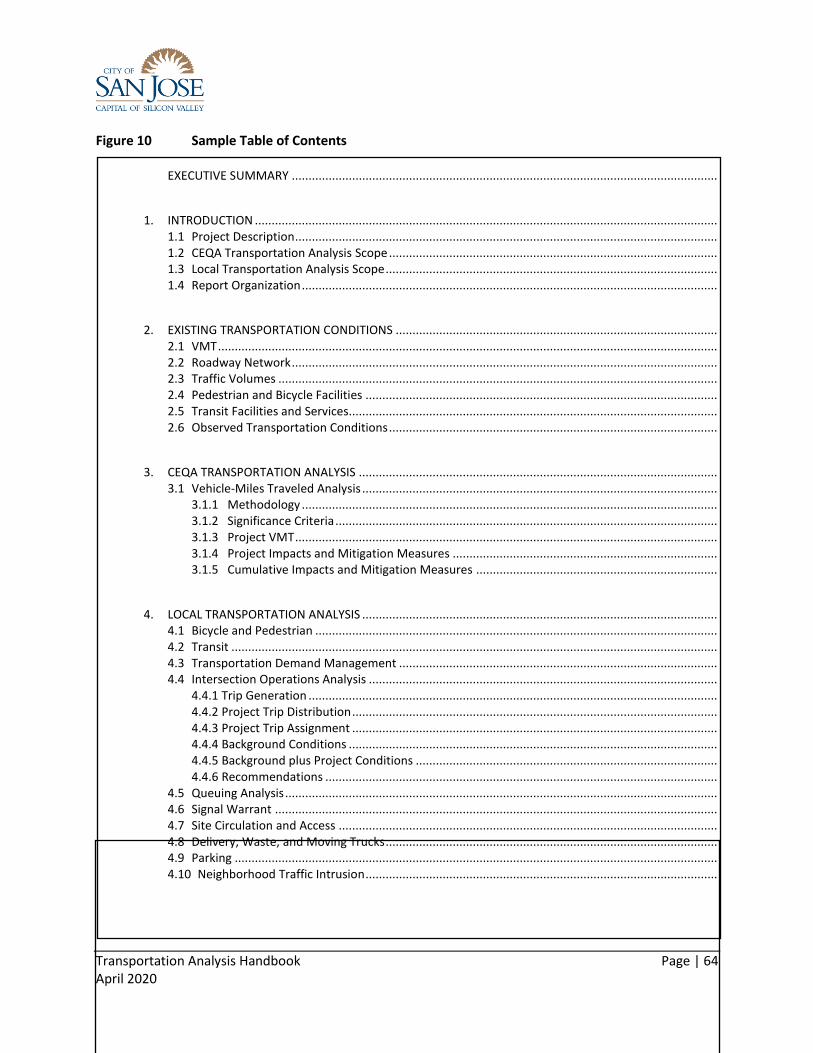
Transportation Analysis Handbook Page | 64 April 2020
Figure 10 Sample Table of Contents
EXECUTIVE SUMMARY ...............................................................................................................................
1. INTRODUCTION ..........................................................................................................................................
1.1 Project Description .............................................................................................................................. 1.2 CEQA Transportation Analysis Scope .................................................................................................. 1.3 Local Transportation Analysis Scope ................................................................................................... 1.4 Report Organization ............................................................................................................................
2. EXISTING TRANSPORTATION CONDITIONS ................................................................................................
2.1 VMT ..................................................................................................................................................... 2.2 Roadway Network ............................................................................................................................... 2.3 Traffic Volumes ................................................................................................................................... 2.4 Pedestrian and Bicycle Facilities ......................................................................................................... 2.5 Transit Facilities and Services.............................................................................................................. 2.6 Observed Transportation Conditions ..................................................................................................
3. CEQA TRANSPORTATION ANALYSIS ...........................................................................................................
3.1 Vehicle-Miles Traveled Analysis .......................................................................................................... 3.1.1 Methodology ............................................................................................................................ 3.1.2 Significance Criteria .................................................................................................................. 3.1.3 Project VMT .............................................................................................................................. 3.1.4 Project Impacts and Mitigation Measures ............................................................................... 3.1.5 Cumulative Impacts and Mitigation Measures ........................................................................
4. LOCAL TRANSPORTATION ANALYSIS ..........................................................................................................
4.1 Bicycle and Pedestrian ........................................................................................................................ 4.2 Transit ................................................................................................................................................. 4.3 Transportation Demand Management ............................................................................................... 4.4 Intersection Operations Analysis ........................................................................................................
4.4.1 Trip Generation .......................................................................................................................... 4.4.2 Project Trip Distribution ............................................................................................................. 4.4.3 Project Trip Assignment ............................................................................................................. 4.4.4 Background Conditions .............................................................................................................. 4.4.5 Background plus Project Conditions .......................................................................................... 4.4.6 Recommendations .....................................................................................................................
4.5 Queuing Analysis ................................................................................................................................. 4.6 Signal Warrant .................................................................................................................................... 4.7 Site Circulation and Access ................................................................................................................. 4.8 Delivery, Waste, and Moving Trucks ................................................................................................... 4.9 Parking ................................................................................................................................................ 4.10 Neighborhood Traffic Intrusion .........................................................................................................
Transportation Analysis Handbook Page | 65 April 2020
5. GENERAL PLAN AMENDMENT LONG-RANGE TRANSPORTATION ANALYSIS ..............................................
6. CONCLUSIONS ............................................................................................................................................
TECHNICAL APPENICES ......................................................................................................................................
Appendix A – San José VMT Evaluation Tool Output Sheet ....................................................................... Appendix B – Transportation Counts ......................................................................................................... Appendix C – Approved Trip Inventory ...................................................................................................... Appendix D – Intersection Operations Analysis Output Sheets ................................................................. Appendix E – Signal Warrant Study Output Sheets ....................................................................................

Transportation Analysis Handbook Page | 66 April 2020
Introduction
The first chapter of the TA report should include a project description, a site location map (Figure 11) and a site plan. The site plan should include adjacent intersections, site access, on-site circulation, pedestrian and bicycle facilities, and parking layout of the project. This chapter should describe the scope of the CEQA transportation analysis and/or local transportation analysis, if applicable.
When describing the CEQA transportation analysis scope, the report should describe what VMT is, the benefits of reducing VMT, and the City’s General Plan goals and strategies that address VMT. The report should include a discussion of the VMT analysis that includes how to read and interpret the VMT output for the project. The report should also include the City’s VMT heat maps and a discussion of what the heat maps are. For most projects, the City’s VMT heat maps (Figure 12 and Figure 13) should be included; for regional projects, both the City’s and the nine-county Bay Area’s VMT heat maps (Figure 14 and Figure 15) should be included.
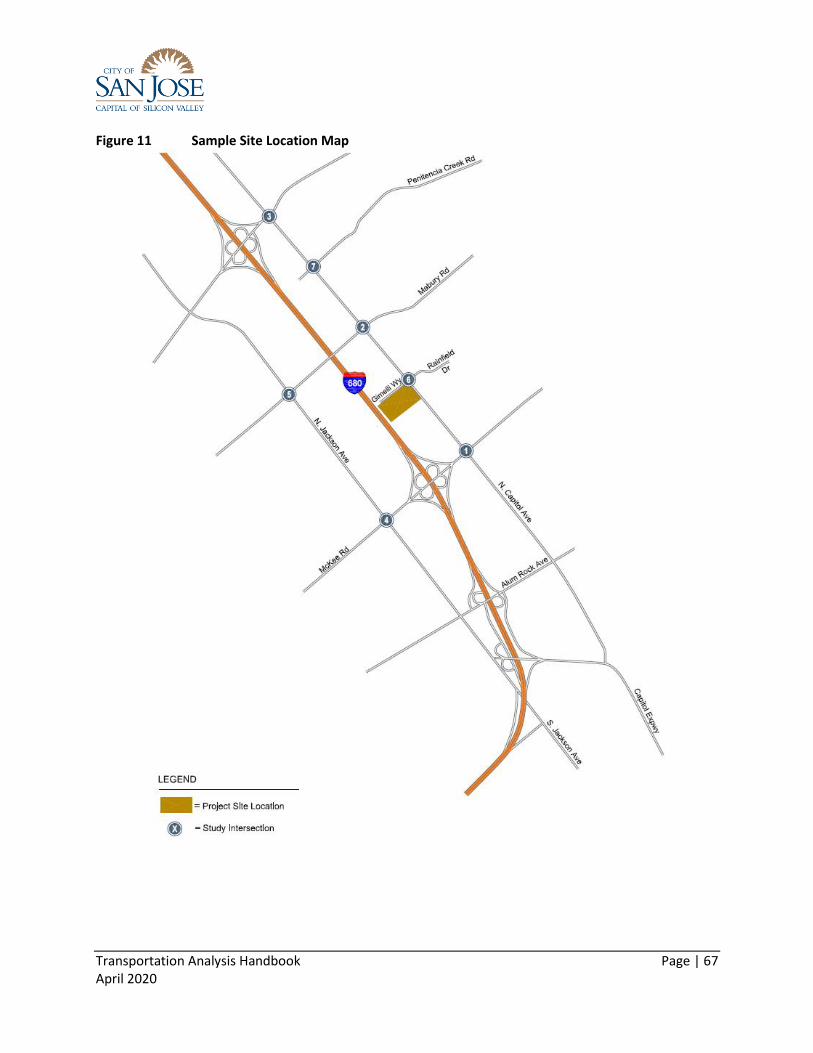
Transportation Analysis Handbook Page | 67 April 2020
Figure 11 Sample Site Location Map
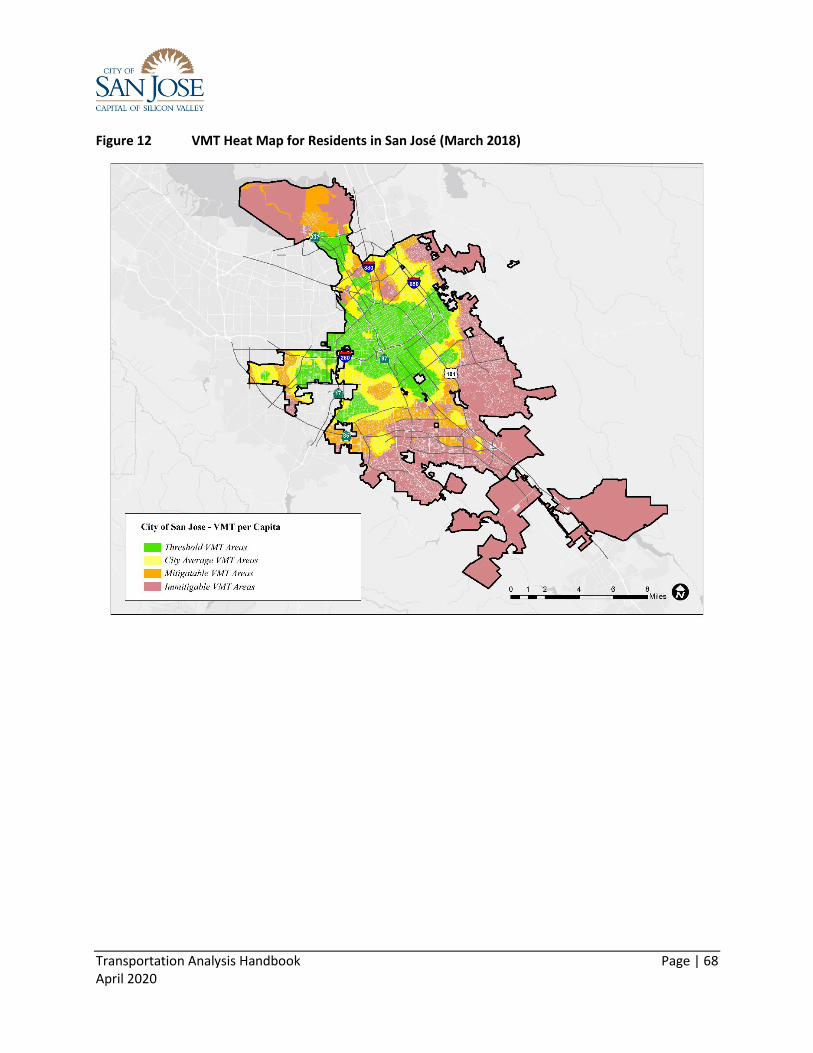
Transportation Analysis Handbook Page | 68 April 2020
Figure 12 VMT Heat Map for Residents in San José (March 2018)
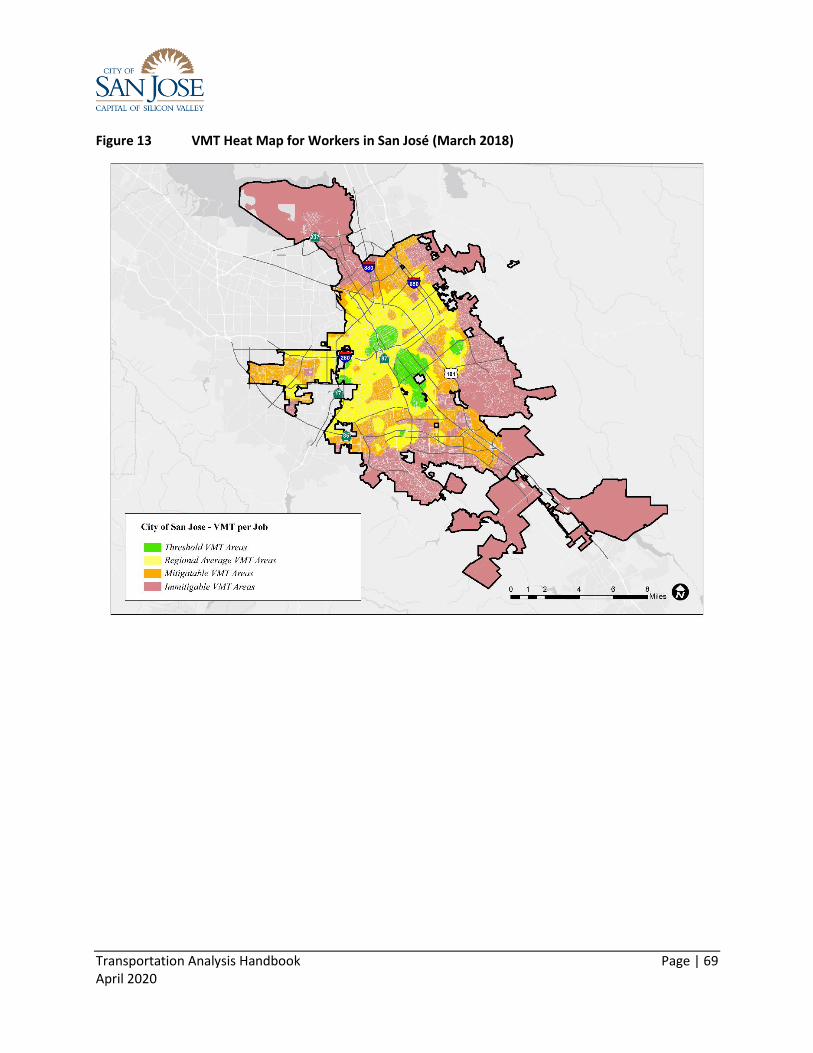
Transportation Analysis Handbook Page | 69 April 2020
Figure 13 VMT Heat Map for Workers in San José (March 2018)

Transportation Analysis Handbook Page | 70 April 2020
Figure 14 VMT Heat Map for Residents in the Nine-County Bay Area (March 2018)

Transportation Analysis Handbook Page | 71 April 2020
Figure 15 VMT Heat Map for Workers in the Nine-County Bay Area (March 2018)

Transportation Analysis Handbook Page | 72 April 2020
Existing Conditions
The second chapter should include the existing conditions of the transportation system within the study area of the project. It should first present, both textually and graphically, the VMT of the existing land uses in the proximity of the project. Then, it should describe the physical characteristics of the surrounding roadway network, including the existing roadway cross-sections, intersection lane configurations, traffic control devices and surrounding land uses. The existing turning movement volumes, lane configurations and traffic control devices should be shown (in one figure if possible). Next, the report should include, both textually and graphically, the availability, accessibility and quality of the existing pedestrian, bicycle (Figure 16) and transit facilities (Figure 17). Operational issues based on the field observations should be identified as well.

Transportation Analysis Handbook Page | 73 April 2020
Figure 16 Sample Pedestrian and Bicycle Facilities
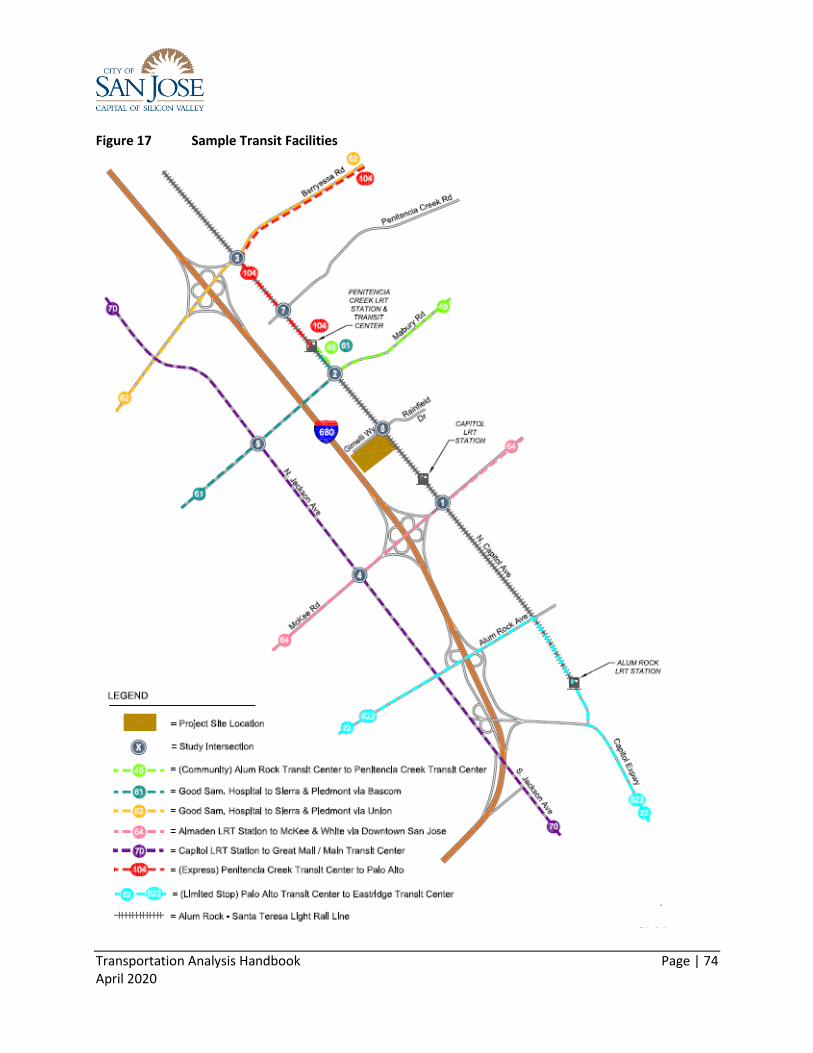
Transportation Analysis Handbook Page | 74 April 2020
Figure 17 Sample Transit Facilities

Transportation Analysis Handbook Page | 75 April 2020
CEQA Transportation Analysis
The third chapter describes the CEQA transportation analysis. It should include the performance metrics, the significance criteria, the thresholds of significance, and the methodology for the analysis.
Figure(s) showing how Project VMT is generated is required. If the project uses the sketch tool to calculate Project VMT, the report should summarize the VMT analysis results and the output sheets produced by the sketch tool should be included (Figure 18) in the appendix. The analysis should include the assumptions made in using the sketch tool to calculate Project VMT – the project inputs and the selected measures that resulted in the reduction from Existing VMT to Project VMT. If the project is shown to have a significant impact, the analysis should include the recommended mitigation measures and the resulting project with mitigation.
If the sketch tool cannot be used to measure Project VMT, an alternative method, such as the San José Travel Demand Model, is required. The analysis method will be determined during the scoping process. The chapter should describe how Project VMT is calculated using the alternative method. Tables or figures, similar to the San José VMT Evaluation Tool output, that compare Project VMT and Project with Mitigation VMT against the thresholds of significance.

Transportation Analysis Handbook Page | 76 April 2020
Figure 18 Sample San José VMT Evaluation Tool Output

Transportation Analysis Handbook Page | 77 April 2020
Figure 18 Sample San José VMT Evaluation Tool Output (continued)
Transportation Analysis Handbook Page | 78 April 2020
Local Transportation Analysis
This chapter should describe the local transportation analysis in conformance with the guidelines set forth in this Handbook (Section 4). For each analysis, the chapter should include operational constraints of the project and any proposed improvements.
In the intersection operations analysis, the chapter should include a figure showing the intersection turning movements, lane configurations and traffic control devices for Background Conditions, and another figure for Background plus Project Conditions. It should also present a table for project vehicle-trip generation (with adjustments), a figure for project vehicle-trip distribution, and a figure for the project vehicle-trip assignment at the study intersections. Intersection average control delays and corresponding standards, increase in average critical delays (relative to Background Conditions), and increase in critical volume-to-capacity ratio (relative to Background Conditions), should be presented in tables for the Background and Background plus Project Conditions.
General Plan Amendment Long-Range Transportation Analysis
The GPA long-range transportation analyses are conducted during the City’s General Plan Amendment cycle for applicant-initiated GPA’s. Projects that require an EIR should file an application for environmental clearance with the Department of Planning, Building and Code Enforcement by November prior to the Fall General Plan hearing. Projects that do not require an EIR should file an application with the Department of Planning, Building and Code Enforcement by the beginning of March prior to the Fall General Plan hearing. In some cases, projects may file for both a GPA and a project level environmental clearance. For all projects proposing GPA’s, the City will need to determine whether a site-specific long-range transportation analysis would be required. All projects included in a GPA cycle for that year will be included in the cumulative long-range transportation analysis.
This chapter should present the long-range evaluation of the effects of the proposed GPA on the citywide transportation system following the guidelines described in this Handbook (Section 6). It should include a table comparing the measures of effectiveness among the Base Year Conditions, the adopted General Plan 2040 Conditions, and the proposed General Plan Amendment 2040 Conditions.

Transportation Analysis Handbook Page | 79 April 2020
APPENDIX A GLOSSARY OF TERMS Term Definition
Active Transportation A means of getting around that is powered by human energy, primarily walking and biking.
Alternative Transportation Modes Sustainable transportation methods that are alternative to personal motorized vehicles, primarily walking, biking, and riding transit.
Approved Trip Inventory (ATI) A City-maintained database of vehicle-trips generated by projects for which an entitlement to build has been granted that have yet been built or occupied. Consists of assigned vehicle-trips by turn movement at signalized intersections.
Area Development Policy (ADP) A City-adopted implementation policy of an Area Plan.
Area Plan A City-adopted plan that coordinates transportation infrastructure improvements and land use development in support of a unique vision for a subarea of the City (e.g. an Urban Village Plan).
Boundary VMT Method A method used to calculate total VMT on roadways bounded within the City. VMT per service population, a performance metric for General Plan amendments, is based on this method.
Effect Project-related effects on elements of the transportation system for which no transportation standards or CEQA thresholds of significance have been established by the City. Distinct from “impact”.
Existing VMT Current VMT levels for the existing buildings within a one-half-mile buffer of a development project.
High-Quality Transit Areas Areas are within half a mile of a high-quality transit corridor or major transit stop.
High-Quality Transit Corridor A corridor with fixed route bus service with service intervals no longer than 15 minutes during peak commute hours (Pub. Resources Code § 21155 (b)).
Impact Refer to a project’s impacts as determined by the transportation standards or CEQA thresholds of significance established by the City. Distinct from “effect”.
Improvement A change that addresses the effects, particularly adverse effects, of a project on elements of the transportation system

Transportation Analysis Handbook Page | 80 April 2020
for which no transportation standards or CEQA thresholds of significance have been established by the City. Distinct from “mitigation’.
Induced Trips Increase in traffic volume that occurs soon after a new road is opened or a previously congested road is widened. Increases in roadway capacity are typically quickly filled up with additional traffic.
Infill Opportunity Zone (IOZ) Areas designated by the City that exempt intersection operations standards in the Congestion Management Program (CMP). CMP facilities located within IOZs are exempt from provisions of the CMP’s operations standard requirements.
Internal trips Trips between different land use types within the same development project that are accommodated at the project site. Trips that are not internal are those with the project at one end and other locations at the other end.
Intersection Operations Standard A measure of automobile vehicle delays through a signalized intersection, graded on a scale A through F.
Major Transit Stop
A rail transit station, a ferry terminal served by either a bus or rail transit service, or the intersection of two or more major bus routes with a frequency of service interval of 15 minutes or less during the morning and afternoon peak commute periods (Pub. Resources Code § 21064.3).
Mitigation A change that addresses the CEQA impacts of a project on elements of the transportation system for which transportation standards or CEQA thresholds of significance have been established. Distinct from “improvement”.
Mixed-Use Project A development project that combines two or more land uses.
Mode Share The share of all person-trips to and from a project taken by each transportation mode (personal motorized vehicles, transit, bicycle, and pedestrian).
Multimodal Improvement Plan (MIP)
VTA terminology for “Deficiency Plan” as defined by CMA statue. VTA’s plans developed to identify offsetting measures to improve transportation conditions on CMP facilities in lieu of making physical traffic capacity improvements such as widening a roadway.
Multimodal Transportation Improvement Plan (MTIP)
The City’s area-based prioritized list of projects and programs intended to facilitate realization of goals and objectives identified in a long-range plan.

Transportation Analysis Handbook Page | 81 April 2020
Net Change in Total VMT Difference in total VMT in the area with and without the project. Performance metric for regional retail projects and transportation projects.
Origin-Destination (O-D) VMT Method
A method used to calculate the total vehicle-miles traveled a study area (e.g. a development project, the City, or the region) is expected to generate in a day. For a personal motorized vehicle-trip to be included in the VMT calculation using the O-D VMT method, one of the trip ends must be within the study area.
Passive Parks Less structured recreational activities and casual pursuit of hobbies that allow for the preservation of natural habitat.
Peak Hour The highest morning or evening hour of travel reported on a transportation network or street.
Personal Motorized Vehicles Mainly personal motor vehicles that transport people rather than goods. VMT is based on only personal motor vehicles in this Handbook.
Physical VMT Reduction Strategies Strategies that development projects can physically construct to encourage the shift from driving alone to walking, biking, and riding transit. Include three of the four VMT reduction strategies – project characteristics, multimodal network improvements, and parking measures.
Plan Bay Area The Regional Transportation Plan and Sustainable Community Strategies for the nine-county Bay Area. Developed by Bay Area Metro and updated every four years.
Planned Growth Area (PGA) Areas designated in the Envision San José 2040 General Plan to accommodate certain growth expected in the General Plan’s horizon.
Priority Development Area (PDA) Areas identified for concentrated development as part of the regional transportation plan for the nine-county Bay Area.
Project VMT Calculated VMT generation of a development project.
Service Population The sum of residents and workers in an area such as the City.
Sphere of influence Area in which travel patterns are expected to change due to a transportation project.
Transportation Demand Management (TDM)
Programmatic measures that discourage drive-alone trips and encourage pedestrian, bicycle, and transit use. One of the

Transportation Analysis Handbook Page | 82 April 2020
four categories of VMT reduction strategies for development projects.
Trip Cap A maximum number of vehicle-trips that a development project is allowed to generate in a day.
Trip Adjustments Effort to reduce the number of vehicle-trips to and from a project.
Trip Assignment An assignment of vehicle-trips to transportation facilities based on trip distribution percentages.
Trip Distribution A forecast of the travel direction of vehicle-trips to and from a project.
Trip Generation The estimated total number of vehicle-trips to and from a project.
Vehicle-Miles Traveled The total miles of travel by personal motorized vehicles in a day. A measure on which a project’ transportation impact(s) are based.
Vision Zero San José The City’s commitment to prioritize street safety and eliminate deaths and severe injuries on roadways. A multi-national road traffic safety program started in Sweden in 1997 and joined by the City in 2015.
VMT per Capita The sum of VMT for personal motorized vehicle-trips made by all residents of a development project, divided by the total number of residents of the project.
VMT per Employee The sum of VMT for personal motorized vehicle-trips made by all workers of an office or industrial development project, divided by the total number of workers at the project.

Transportation Analysis Handbook Page | 83 April 2020
APPENDIX B TRIP-BASED VMT ASSESSMENT
For development projects, the trip-based assessment for VMT is the method currently used in the San José Travel Demand Model. Because a trip-based model does not capture tours of individual vehicles, multi-linked trips cannot be fully accounted for when using a trip-based model. However, because the City’s prevailing method for the CEQA transportation analysis as described in this Handbook only requires an assessment of VMT in relationship to a baseline, the City finds this method acceptable. If the City transitions to a tour-based travel demand model, a full accounting of trips would be included in the VMT assessment.
VMT per Capita (Residential Projects)
VMT per capita measures a residential project’s impact on VMT using a trip-based approach. Capita is defined as the number of residents expected to occupy the residential project. It counts VMT from individual trips to and from the project. For example, the driving characteristics of a typical resident may include:
1. Residential Project to Coffee Shop; 2. Coffee Shop to Work; 3. Work to Sandwich Shop; 4. Sandwich Shop to Work; 5. Work to Residential Project; 6. Residential Project to Store; 7. Store to Residential Project.
A trip-based VMT assessment of a residential project accounts for VMT associated with only home-based trips, or segments 1, 5, 6 and 7 (highlighted in blue). VMT per capita is calculated by dividing the total home-based VMT by the number of residents.
VMT per Employee (Office or Industrial Projects)
VMT per employee measures an office or industrial project’s impact on VMT using a trip-based approach. It counts VMT from only linked trips made between residence and the project. For example, the travel characteristics of a typical commuter may include:
1. Home to Coffee Shop; 2. Coffee Shop to Office Project; 3. Office Project to Sandwich Shop; 4. Sandwich Shop to Office Project; 5. Office Project to Home; 6. Home to Store; 7. Store to Home.
Home
Coffee Shop
Office Project
Lunch
Store
1
2
3
4
5
6
7
Residential Project
Coffee Shop
Work
Lunch
Store
1
2
3
4
5
6
7

Transportation Analysis Handbook Page | 84 April 2020
A trip-based VMT assessment of an office or industrial project accounts for VMT associated with only home-based-work trips, or segment 5 (highlighted in blue). Home-based-work trips are defined as directly-linked home-to-work or work-to-home trips. Note that segments 1 and 2 are not captured in the VMT calculation because they are multi-linked home-to-work trips. In other words, if an employee makes a directly-linked home-to-work trip in the morning (not represented in the graphic) and another directly-linked work-to-home trip in the evening, the VMT associated with both directly-linked home-based-work trips would be captured. VMT per employee is calculated by dividing the total home-based-work VMT by the number of employees.
VMT per capita and VMT per employee should not be evaluated against one another; instead, they should be evaluated against their thresholds, as defined in this section.
Net Change in Total VMT (Retail Projects)
New retail development typically attracts existing customers rather than creating new trips25. Therefore, estimating the net change in total VMT (i.e. the difference in total VMT in the area with and without the project) is the best way to analyze a proposed retail project’s effect on the travel behavior of existing customers within a community. For example: a travel characteristic of typical retail customer may include:
1. Home to Work; 2. Work to Existing Shop; 3. Existing Shop to Home.
Once the project is constructed, the customer may opt to shop at the new project instead of the existing retail site:
A. Home to Work; B. Work to Retail Project; C. Retail Project to Home.
An assessment of the total VMT from all trips with the project (i.e. segments A, B, and C) and an assessment without the project (i.e. segments 1, 2, and 3) is made. Since all the non-shop trips (i.e. segments 1 and A) are not affected by the project and would cancel out each other, the difference between the two assessments is the net change in total VMT that is attributable to the retail project.
25 Lovejoy, et al. (2012). Measuring the impacts of local land-use policies on vehicle miles of travel: The case of the first big-box store in Davis, California. The Journal of Transport and Land Use.
Residence
Existing Shop
Retail Project
1
B
C
Work 2
3 A