clean energy business and policy - martinotmartinot.info/bit/lecture...
TRANSCRIPT

Clean Energy Business and Policy
Beijing Institute of Technology School of Management and Economics
Fall 2014
Lecture #12: Finance and Investment and Clean Energy Futures December 20, 2014
Professor Eric Martinot

&+$37(5��
0$1<�&+2,&(6��21(�)8785(
),*������
7KH�DUJXPHQWV�IRU�PDUJLQDO�

),*�������7KH�SDWK�FKDUWHG�LQ�WKLV�ERRN�FRXOG�DGYDQWDJHRXVO\�SKDVH�RXW�RLO��FRDO��DQG�QXFOHDUHQHUJ\�E\�������1DWXUDO�JDV�XVH�LQ������ZRXOG�EH�DERXW���±����EHORZ�WKH������OHYHO�GHSHQGLQJ�RQ�WKH�OHYHO�RI�LQWHJUDWLYH�GHVLJQ�IURP�QRQH�WR�KLJK��RU��±����LI�DOO�KHDY\�WUXFNVZHUH�IXHOHG�ZLWK�QDWXUDO�JDV���,I�WKH�K\GURJHQ�VKRZQ�LV�DOO�UHIRUPHG�IURP�QDWXUDO�JDV��LW�ZLOO�FRPHKDOI�IURP�JDV�DQG�KDOI�IURP�VWHDP����

),*�������'LVFRXQWHG�WR������SUHVHQW�YDOXH�DW�D����\�UHDO�GLVFRXQW�UDWH��WKH�VWUDWHJ\�RXWOLQHG�LQFKDSWHUV���WKURXJK���ZRXOG�UHTXLUH������WULOOLRQ�RI�FXPXODWLYH�H[WUD�LQYHVWPHQW��EH\RQGEXVLQHVV�DV�XVXDO��EXW�UHWXUQ������WULOOLRQ�LQ�IXHO�VDYLQJV��FUHDWLQJ����WULOOLRQ�RI�FXPXODWLYH�QHWZHDOWK�����7KLV�H[FOXGHV�LQWHJUDWLYH�GHVLJQ�DQG�QRQ�HQHUJ\�EHQHILWV�
6RPH����WULOOLRQ�LQ�VDYLQJV�RYHU����\HDUV�PD\�VHHP�VPDOO�LQ�D�����WULOOLRQ�SHU�\HDU�HFRQRP\��%XW�LW¶V�WKH�RSSRVLWH�RI�WKH�HFRQRPLF�FROODSVH�WKDW�VRPHSXQGLWV�SUHGLFW�6R�ZKR�SD\V�DQG�ZKR�ZLQV�LQ�WKLV�PXOWL�WULOOLRQ�GROODU�VZHHSVWDNHV"
5HLQYHQWLQJ�)LUH�UHOLHV�RQ�EXVLQHVVHV�LQ�HDFK�VHFWRU�WR�LQYHVW�DW�PDUNHWFRQGLWLRQV�RQFH�WKH�UXOHV�EHFRPH�KHOSIXO�RU�DW�OHDVW�QHXWUDO�'HVFDOLQJ�DQG�UHFDSLWDOL]DWLRQ�PLJKW�DOVR�EH�QHHGHG�LQ�VHFWRUV�ZKHUH
LQYHVWPHQWV�DUH�WUXO\�GLVUXSWLYH��OLNH�FDUERQ�ILEHU�DXWRERGLHV��VPDUW�JULG��RUVRPH�QRYHO�UHDO�HVWDWH�GHYHORSPHQWV��0RUH�WUDGLWLRQDO�ILQDQFLQJ�FRXOG�VXIILFHIRU�LQFUHPHQWDO�FKDQJHV�OLNH�EXLOGLQJ�FRQWUROV��&+3�HTXLSPHQW��DQG�ELRIXHOVLQIUDVWUXFWXUH��%XW�RYHUDOO��ZLWK�WKH�ULJKW�SROLF\�DQG�UHJXODWRU\�IUDPHZRUN�LQSODFH��ZH�H[SHFW�WKH�5HLQYHQWLQJ�)LUH�LQYHVWPHQWV�WR�EH�FDUULHG�RXW�E\EXVLQHVVHV�IRU�UHWXUQV�FRPPHQVXUDWH�ZLWK�WKHLU�UHVSHFWLYH�LQGXVWU\�QRUPV�1RW�DOO�WKH�IXHO�VDYLQJV�DUH�FDSWXUHG�E\�EXVLQHVVHV��WKRXJK��)RU�H[DPSOH�
DOWKRXJK�DXWRPDNHUV�ZLOO�PDNH�DQ�LQGXVWU\�FRPPHQVXUDWH�UHWXUQ�RQ�VHOOLQJ5HYROXWLRQDU\��YHKLFOHV��WKH�RLO�ZLOO�EH�VDYHG�E\�GULYHUV��PDLQO\�LQGLYLGXDOV�

RENEWABLES GLOBAL FUTURES REPORT 2013

32
$¤
RENEWABLES GLOBAL FUTURES REPORT 03 INVESTMENT FUTURES: FLOWS, INVESTORS, AND BUSINESS MODELS
INVESTMENT FUTURES: FLOWS, INVESTORS, AND BUSINESS MODELS
03Annual investment in renewable energy reached US$ 260–290 billion in 2011 and is projected to increase annually through 2020 and well beyond. Innovative new forms RI�LQYHVWPHQW�DQG�čQDQFH�DUH�SURMHFWHG� from new sources, such as pension funds along with new business models for energy services for households and businesses and for mobility services.

New&Sources&of&Finance&&&
• Pension!funds!!• Insurance!funds!!• Aggregated!securities!funds!(like!mortgage6back!securities)!!• Community!funds!!• Oil!companies!!• Equipment!suppliers!/!vendors!!• Sovereign!wealth!funds!and!national!governments!
!!

!e Challenge of Institutional Investment in Renewable Energy
CPI Report
Climate Policy Initiative
David NelsonBrendan Pierpont
March 2013

2A CPI R!"#$%
T!" C!#$$"%&" '( I%)*+*,*+'%#$ I%-")*."%* +% R"%"/#0$" E%"1&2M#13! 2013
Table 1.1 – Key questions/dimensions for institutional investment and renewable energy
WHO ARE INSTITUTIONAL INVESTORS TYPES OF INVESTMENT ASSETS INVESTMENT CHANNELS
Pension funds • Defined benefit • Defined contribution
Other pension assets • Pension reserve funds • IRAs, insurance contracts, etc.
Insurance companies • Life, reinsurance • Property and casualty
Sovereign wealth fundsFoundations & endowmentsInvestment managers
Corporate equity (Shares)Corporate debt (Bonds)Project equity
• Levered • Unlevered (whole asset)
Project debt
Direct investment • In corporate securities • In projects
Through intermediaries • Investment managers • Private equity funds • Infrastructure funds • Other pooled investment vehicles
1. IntroductionPension funds and insurance companies invest money today to provide products like pensions and life insurance that help us protect our tomorrow; but providing pensions and insurance may not be the only way that these players help protect our future. Institutional investors, a group that includes pension funds and insurance companies, may also help avoid and adapt to future climate change by investing some of that money into long-term, low-car-bon assets like renewable energy. They may even be able to improve their investment performance by doing so. Or so the theory goes.
This theory has grabbed the attention of policy makers, as they cannot miss the scale of assets managed by institu-tional investors when they face the daunting investment requirements associated with climate change. Policy makers observe that institutional investors look for long-term trends, like the global response to climate change, that can help their portfolios outperform in the long term. At the same time, many of the investment opportunities associated with climate change are precisely the long-term infrastructure assets that should appeal to institu-tional investors seeking attractive, low-risk, long-term investment performance. Thus, the relationship between institutional investors and climate change could be very important.
In this paper, we estimate the scale of potential institu-tional investment in one subset of climate change related
investments — renewable energy — and identify both barriers and potential solutions for reaching this poten-tial. But before we can adequately address the potential, barriers and solutions, we must clarify the scope along a number of dimensions:
• Who are these “institutional investors” and do di!erences within this group matter with respect to renewable energy?
• What types of renewable energy financial assets do we expect institutions to invest in and does the choice of asset matter to renewable energy goals?
• Does it matter how institutions invest, for instance whether they invest directly into projects or invest indirectly through intermediaries?
There are a range of possible answers for these questions, as described in table 1.1.
To explore these questions, we have interviewed over 25 institutional investors across Europe, Australia, and North America. We have also interviewed several of their invest-ment consultants and advisors, bankers and investment managers, academics, analysts and ratings agencies. In addition to these interviews, we have mined relevant investment data and analyzed some of the policies and investment barriers to gain further insight.
In section 2 we define the set of institutional investors that could have an impact on renewable energy. In section 3, we scope the potential for their investment in renew-
able energy. As it turns out, the types of assets institu-tions invest in and the channels they use matter a great deal (see appendix 1), particularly if the primary objective is to reduce the cost of renewable energy while enhancing returns, rather than merely finding the required capital at any cost (see discussion in boxes 1 and 2). Meanwhile,

Table 2.2 – Characteristics of institutional investor types
INVESTOR TYPE
TOTAL OECD
ASSETS ($BN)
INVESTMENT OBJECTIVE
TYPICAL SIZE OF FUND INVESTMENT STYLE ASSET ALLOCATION REGULATORY
ENVIRONMENTFIT FOR INVESTMENT IN RENEWABLE
ENERGY
Insurance Companies 22,015
Lowering cost and improving profits from insurance policies
Dominated by large firms - over half of assets in 20 largest insurance companies
Large insurance companies invest directly, and through subsidiaries - some invest-ment through external asset managers
Dominated by fixed income, including large allocations to sovereign fixed income
Subject to significant finan-cial regulation, including working capital require-ments and accounting rules
Non-life insurance assets back short-term policies, requiring liquidity. Life insurers are active participants in renewable project finance markets.
Pension Funds 21,337 Providing pension
benefits
Some large funds, many small funds - 20 largest pension funds (public, national and corporate) account for around 1/5 of total assets
Some large pension funds have direct investment teams, most funds rely on external asset managers
Allocation tilted towards equities
Corporate pension funds subject to corporate accounting requirements, public sector funds some-times subject to less strin-gent accounting standards
In most defined contribution plans, pension beneficiaries can switch in an out of investment options, generating a need for liquidity. With several exceptions, only defined benefit funds are expected to invest directly in renewable energy projects.
Foundations and Endowments
1,500
Supporting activities of organization / institution over the long run
Small funds relative to other II types, largest are USD 30-40 bn
Largely reliant on external asset managers
Allocation tilted towards equities
Varies by geography and nature of institution
Time horizons and use of proceeds vary, but may be able to invest through third-party funds.
Sovereign Wealth Funds
587
Providing benefits to future residents, stabilizing national wealth from resource revenue
OECD figure dominated by NBIM, Norway’s Sovereign Wealth Fund
Some direct investment, and some investment via external asset managers
Allocation tilted towards equities
Varies by geography and nature of institution
Time horizons vary, and would need to develop expertise in renewable energy, and make an allocation to renewable energy in order to invest.
Investment Managers 28,679
Track or exceed benchmark, objective varies by type of fund
Many funds, though several large asset managers with a variety of di!erent funds under management
Direct investment consis-tent with fund objective
Mix reflects market demands
Listed funds subject to national financial regulation, explicit illiquidity limits, other rules
Mutual funds require significant liquidity to account for investment switching and market conditions Liquidity needs likely preclude investment in renewable energy.
Non-Fund Pension Assets
11,594 Various N/A
Sovereign reserve funds invested in risk-free securities only, other asset types managed largely by external asset managers
Sovereign reserve funds invest in risk-free securities only. Asset allocation for others varies, deter-mined by objective
Varies by geography and nature of assets
Personally-managed funds allow greater invest-ment choice, and may require greater liquidity Sovereign reserve funds invested in liquid, risk-free assets to ensure stability of social security programs Assets backing pension insurance contracts (e.g. annuities) managed by insurance companies

SOME&CONCLUSIONS&–&CPI&2013&!!“Investment!in!corporations!is!the!easiest!investment!path!for!most!institutional!investors,!whether!through!equity!shares!or!corporate!bonds.!Our!analysis!indicates!that!institutional!investors!could!easily!provide!corporations!with!all!of!the!corporate!equity!and!debt!that!corporations!would!need!to!fund!their!share!of!renewable!energy!for!the!next!25!years.”!!“Direct!investment!in!renewable!energy!projects!is!the!most!difficult!for!institutional!investors.!The!skills!and!expense!required!to!make!these!investments!are!likely!to!limit!direct!investment!to!the!largest!150!or!so!institutions,!while!the!illiquidity!of!these!investments!—!the!ability!to!sell!the!asset!at!a!minimum!loss!of!value!if!unexpected!cash!needs!arise!—!limits!direct!investment.”!!“Pooled!investment!vehicles!or!investment!funds!vary!in!fit!and!accessibility!for!institutional!investors.!A!large,!publicly!traded!pooled!investment!fund!could!eliminate!both!the!liquidity!and!size!constraints;!however,!like!corporate!investment,!it!could!also!reduce!the!connection!to!underlying!project!cash!flows!and!therefore!the!potential!cost!of!capital!advantage!for!renewable!energy.!Other!fund!designs!could!offer!a!better!connection!to!the!underlying!assets!—!for!instance!by!offering!a!‘buy!and!hold!to!maturity’!strategy.”!!!

GLOBAL TRENDS IN RENEWABLE ENERGY INVESTMENT 2014
Key Findings

1 2
Some foundations for future growth in the renewable energy market fell into place in 2013, even as investment levels declined for the second successive year. Lower costs, a return to profitability on the part of some leading manufacturers, the phenomenon of unsubsidised market uptake in a number of countries, and a warmer attitude to renewables among public market investors, were hopeful signs after several years of painful shake-out in the sector.
EXECUTIVE SUMMARY
E X E C U T I V E S U M M A R Y
Renewable energy continued to build up its share of the global electricity market. Renewables excluding large hydro projects accounted for 43.6% of the new generating capacity installed worldwide in 2013, raising its share of world electricity generation from 7.8% in 2012, to 8.5%. If this capacity were not present, world energy-related CO2 emissions would have been an estimated 1.2 gigatonnes higher in 2013, adding about 12% to
the 2020 projected emissions gap that needs to be closed to remain within a two degrees Celsius global temperature increase.1
New investment in renewable energy excluding large hydro-electric projects slipped 14% in 2013 to $214 billion, but even this disguised one major positive development. One of the two main reasons for this fall in 2013 was a reduction in costs in
photovoltaics – even as the dollar investment in solar went down, the number of gigawatts of PV systems added went up.
Nevertheless, the decline in investment was disappointing for the industry and those hoping to see investors and financiers increasing their dollar commitments to the decarbonisation of the energy system.
There were setbacks to investment in many important geographical areas, including China (down 6% at $56 billion), the US (down 10% at $36 billion) and – most of all – Europe (down 44% at $48 billion). The biggest exception to the downward trend was Japan, where investment excluding research and development soared 80% to $29 billion.
FIGURE 1. GLOBAL NEW INVESTMENT IN RENEWABLE ENERGY BY ASSET CLASS, 2004-2013, $BN
*Asset finance volume adjusts for re-invested equity. Total values include estimates for undisclosed dealsSource: UNEP, Bloomberg New Energy Finance
1 The Emissions Gap Report 2013, UNEP, Nairobi.

1 8
E X E C U T I V E S U M M A R Y
with wind second and important contributions also by geothermal and biofuels.
The largest single part of overall investment in renewable energy is the asset finance of utility-scale projects of 1MW or more. In 2013, this fell 13% to $133 billion, with the sector make-up displayed in Figure 8. Wind made up the largest part of this and suffered only a 3% decline, while solar, second largest, saw dollar commitments fall 20% even though the number of utility-scale megawatts installed actually increased.
Adding small-scale projects of less than 1MW to the comparison for capacity investment shows that solar was by some distance the leading renewable energy sector in 2013, just as it was in 2012 (see Figure 9). The last year in which
FIGURE 8. ASSET FINANCE OF RENEWABLE ENERGY ASSETS BY SECTOR, 2013, $BN
Total values include estimates for undisclosed dealsSource: UNEP, Bloomberg New Energy Finance

1 5
which large amounts of new wind capacity were awarded power purchase agreements last year) and the subsequent signatures on debt and equity deals for those projects.
A consequence of all these issues was that, for the first time for at least a decade, there was a fall in investment in renewable energy in developing countries. The 14% reduction in dollar commitments to $93 billion in 2013 is shown in Figure 4, along with a similarly-sized slippage in investment in developed economies.2
As well as the $214 billion global figure mentioned above, there were additional sums of money committed to large hydro-electric projects of more than 50MW. These projects are mature in terms of technology and fall outside the main scope of this report. However, at least 20GW of large hydro capacity are estimated to have been commissioned in 2013, equivalent to approximately $35 billion of investment. There is a box on large hydro investment at the end of Chapter 5.
IMPROVEMENT IN FUNDAMENTALS
Although renewable energy investment in 2013 was some 14% down on 2012, there were more hopeful signs for investment in 2014 and beyond. The first sign was the further gain in the cost-competitiveness of the two leading renewable power technologies – solar PV and onshore wind. Chapter 3 explains how over a five-year period to the first quarter of 2014, the worldwide average levelised cost of electricity has declined by 53% for crystalline silicon PV systems, and 15% for onshore wind turbines. Over the same years, the cost per MWh of coal- and gas-fired generation has increased in many countries, with the notable exception of the US where gas prices remain much lower than elsewhere.
The cost reductions for the two leading renewable technologies have enabled subsidies for new projects to be reduced, and brought wind and solar much closer to full competitiveness with fossil-fuel alternatives – even where the latter are not encumbered by carbon emission charges.
E X E C U T I V E S U M M A R Y
FIGURE 3. GLOBAL TRENDS IN RENEWABLE ENERGY INVESTMENT 2013 DATA TABLE, $BN
New investment volume adjusts for re-invested equity. Total values include estimates for undisclosed deals. Source: UNEP, Bloomberg New Energy Finance
2 In this report, developed economies are defined as all member countries of the OECD, other than Chile, Mexico and Turkey. Developing
economies are defined as all non-OECD countries plus those three.
Variables)Influencing)Renewable)Energy)Futures)
(REN21)Renewables)Global)Futures)Report,)Annex)3))
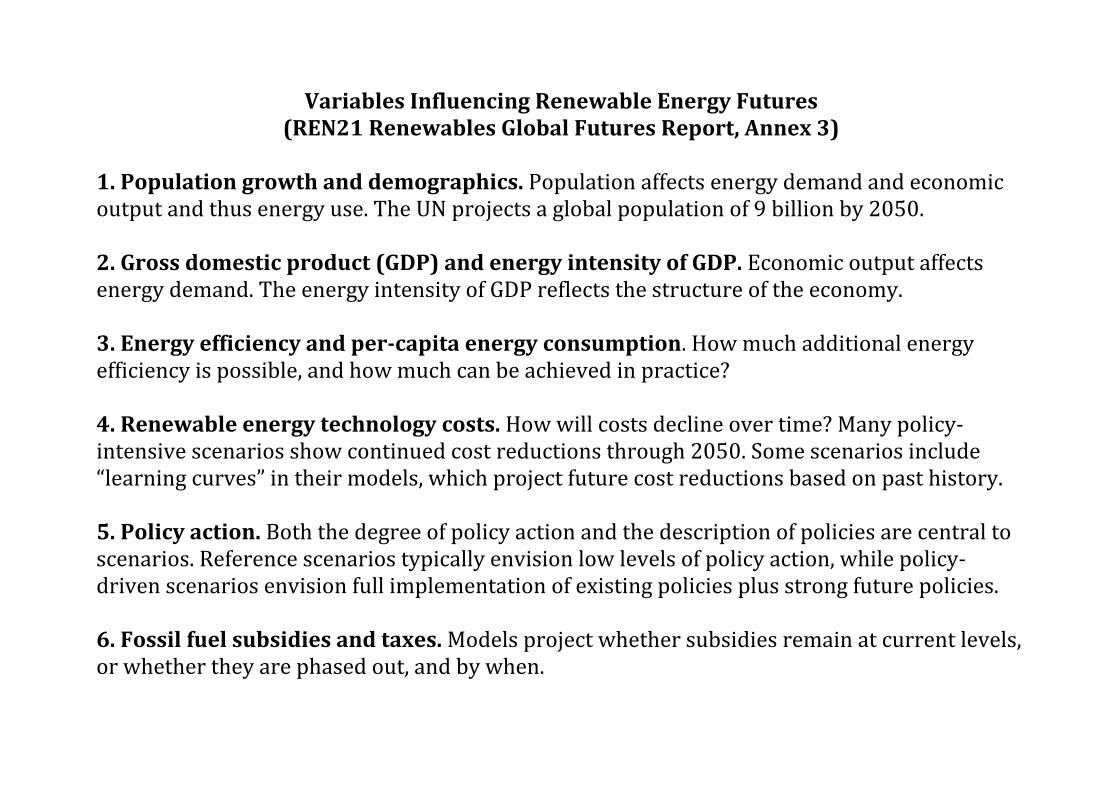
&1.)Population)growth)and)demographics.&Population&affects&energy&demand&and&economic&output&and&thus&energy&use.&The&UN&projects&a&global&population&of&9&billion&by&2050.&&&2.)Gross)domestic)product)(GDP))and)energy)intensity)of)GDP.&Economic&output&affects&energy&demand.&The&energy&intensity&of&GDP&reflects&the&structure&of&the&economy.&&3.)Energy)efficiency)and)perHcapita)energy)consumption.&How&much&additional&energy&efficiency&is&possible,&and&how&much&can&be&achieved&in&practice?&&&4.)Renewable)energy)technology)costs.&How&will&costs&decline&over&time?&Many&policy(intensive&scenarios&show&continued&cost&reductions&through&2050.&Some&scenarios&include&“learning&curves”&in&their&models,&which&project&future&cost&reductions&based&on&past&history.&&5.)Policy)action.&Both&the°ree&of&policy&action&and&the&description&of&policies&are¢ral&to&scenarios.&Reference&scenarios&typically&envision&low&levels&of&policy&action,&while&policy(driven&scenarios&envision&full&implementation&of&existing&policies&plus&strong&future&policies.&&6.)Fossil)fuel)subsidies)and)taxes.&Models&project&whether&subsidies&remain&at¤t&levels,&or&whether&they&are&phased&out,&and&by&when.&&

&7.)Interest)rates)(discount)rates).&Renewable&energy&investments&are&capital(intensive&and&thus&heavily&dependent&on&the&cost&of&capital.&Finance&experts&underlined&that&interest&rates&are&“factor&one”&in&the&analysis&of&future&projections&and&possibilities.&&&8.)Finance)availability)and)riskHreturn)profiles.&How&much&finance&will&be&available&for&infrastructure&investments,&at&what&levels&of&risk&and&return?&&This&question&relates&to&&the&willingness&of&large&institutional&investors&to&invest&given&time,&risk,&and&return&profiles.&&&9.)Carbon)prices)and)taxes.&To&what°ree&will&carbon&prices&and&taxes&affect&the&economics&of&renewable&energy?&&Carbon&prices&are&very&uncertain,&and&depend&very&much&on&market&rules&and&government&allocations&of&credits.&&10.)Natural)gas)prices,)price)volatility,)and)demand.&What&happens&to&future&gas&prices&and&gas&demand?&Experts&point&to&natural&gas&price&volatility,&and&the&cost&of&gas&price&hedging&&11.)Coal)prices)and)demand.&Does&coal&remain&a¢ral&feature&of&our&energy&systems,&or&is&coal&“on&the&way&out"&as&some&visionaries&suggest?&&(Does&China&coal&use&peak&in&2030?)&&12.)Oil)prices.&What&happens&to&future&oil&prices?&Most&scenarios&show&long(term&oil&prices&in&the&$100–150&per&barrel&range&continuing&for&decades.&&


13.)Nuclear)power)acceptance)and)government)support.&How&much&will&governments&continue&to&support&nuclear&power?&How&will&political&and&social&acceptance&change?&&Does&nuclear&provide&carbon&credits?&&14.)Shale)gas)cost)and)availability.&What&production&quantities&of&shale&gas&are&feasible&and&how&will&shale&gas&affect&natural&gas&prices?&&&15.)Carbon)capture)and)storage)(CCS))technology)cost)and)viability.&Will&CCS&become&commercial?&When?&&&16.)Power)transmission)network)expansion,)environmental)and)social)issues.&Can&ways&be&found&to&expand&and&strengthen&networks&in&ways&that&are&socially&acceptable?&&&17.)Population)and)resource)geography.&The&location&of&population¢ers&relative&to&areas&of&renewable&resources&affects&how&much&transmission&must&exist&to&accommodate&renewables.&&&18.)Climate)change)perception)and)reality.&How&will&perceptions&about&climate&change&evolve&over&time?&How&quickly&will&the&climate&actually&change?&&&

Roles&of&Different&Types&of&Companies&
•Electric!Utilities
•Oil!companies
•Automakers
• Information6technology!(IT)!companies
•Technology!integration!companies!(i.e.,!Siemens)
•Buildings!materials!manufacturers!(i.e,.!architectural!glass)

34
GEA (2012) projects up to $800 billion per year by 2050 in its high-est-renewables case, but as low as $160 billion per year for some cases with low energy demand and high shares of nuclear power and carbon capture and storage. At the highest end of the projec-tions, Greenpeace (2012) shows a $20 trillion investment in renew-able energy during the 20-year period 2011–2030, or an average of $1 trillion per year. Greenpeace notes that “a major driving force for investment in new generation capacity will be the replacement RI�WKH�DJHLQJ�ĎHHW�RI�SRZHU�SODQWV�LQ�2(&'�FRXQWULHV�DQG�WKH�EXLOG�up of new power plants in developing countries.”6 (See Figure 5 for FRPSDULVRQV�RI�DQQXDO�LQYHVWPHQW�ĎRZV�DFURVV�VFHQDULRV��
9LUWXDOO\�DOO�čQDQFH�H[SHUWV�EHOLHYHG�WKDW�LQYHVWPHQW�DQG�RZQHUVKLS�in renewable energy will come from a broadening array of sources. In interviews, experts elaborated a wide range of investment sources, mechanisms, and models. These include insurance companies and pension funds, utilities, oil companies, retail investors, sovereign ZHDOWK�IXQGV��EDQNV��SXEOLF�HTXLW\��DQG�PXOWLODWHUDO�čQDQFH�7
Several experts pointed to the “unlocking” of pension funds and large institutional investors looking for stable, safe, long-term investments that could be guaranteed on 20-year time frames. Such “unlocking” could occur by creating ratings for renewable HQHUJ\�SURMHFWV��DVVHW�čQDQFH���E\�OHQJWKHQLQJ�IHHG�LQ�WDULII�YDOLG-ity periods, by extending project design lifetimes, by reducing construction performance risk, and/or by insuring against wind-resource variability risk. Another mechanism for unlocking pension funds is utility-pension fund joint-ownership models, where a utility čQDQFHV�DQG�EXLOGV�D�SURMHFW�ZLWK�VKRUW�WHUP�IXQGV�DQG�WKHQ�VHOOV�a share of the project to pension funds. Dong Energy is one utility that has piloted this approach with 49% pension-fund ownership. Beyond pension funds, some experts pointed to sovereign wealth IXQGV��SDUWLFXODUO\�IURP�RLO�H[SRUWLQJ�FRXQWULHV��DV�D�VLJQLčFDQW�QHZ�VRXUFH�RI�čQDQFH�8
Utility companies themselves do not necessarily share the degree of optimism suggested by experts and scenarios. Nevertheless,
over the past 20 years, utilities around the world have increasingly embraced renewable energy investments, either on their balance sheets, through the establishment of subsidiaries, or as invest-ment partners. Hydro has been the preferred renewable investment by utilities for many decades, but since the 1990s, utilities have increasingly invested in wind power, and to a much lesser extent in other renewables. Industry experts pointed to progressive utilities as bellwethers of future industry-wide investment.9
Several utilities have announced multi-billion dollar investments in UHQHZDEOHV�RYHU�WKH�QH[W�čYH�\HDUV��LQFOXGLQJ�(')��(�21��5:(��DQG�Vattenfall, and at least three of these are also targeting 20% or more shares of renewables by 2020. Some utilities have reached the point where over half of their generation assets are already renew-able, including Iberdrola and Next Era Energy Resources. And some utilities have set climate-related targets: for example, Dong Energy WDUJHWV�D�����FDUERQ�GLR[LGH� �&22) emissions reduction by 2020 and an 85% reduction by 2040 (relative to 2006). Notwithstanding these examples, many other utilities around the world see renew-ables as minor parts of their corporate strategies, or have yet to include renewables at all.10
2LO�DQG�JDV�FRPSDQLHV�GR�QRW�QHFHVVDULO\�HQYLVLRQ�ODUJH�LQYHVWPHQWV�in renewables either. Many are investing in renewables, but still at relatively low levels, and indications are few that these companies plan large investments in the long term. French Total’s announce-ment in 2009 that it would invest $2 billion in renewables during 2010–2020 was a large leap from the few millions it had been invest-ing prior to that, but this still represents a very small share of the company’s investment in oil and gas upstream activities. BP launched its Alternative Energy business in 2005 and committed to invest $8 billion over 10 years (and had reached almost $7 billion by 2011).11
2LO�FRPSDQLHV�ZLWK�UHFHQW�LQYHVWPHQWV�DQG�SODQV�LQ�WKH�UHQHZDEOHV�arena include BP (wind), Chevron (geothermal, solar, wind), ENI (solar), Petrobras (solar, wind, hydro), Repsol (geothermal, wind), Sonatrach (solar), Statoil (geothermal, wind), and Total (solar).
RENEWABLES GLOBAL FUTURES REPORT 03 INVESTMENT FUTURES: FLOWS, INVESTORS, AND BUSINESS MODELS
Great Debate 6 | Will Utilities Lead, Follow, Push Back, or Perish?
With increasing levels of renewables, the business models and revenue streams of many existing utility and energy companies are FRPLQJ�XQGHU�WKUHDW�RU�VWUHVV��6RPH�FRPSDQLHV�ZLOO�ORVH�PDUNHW�VKDUH��UHYHQXH��DQG�HYHQ�VXIčFLHQW�SURčW�WR�FRQWLQXH�WR�H[LVW��PDQ\�experts believed. How existing companies (called “incumbents” by some) decide to respond to that stress will shape how renewable energy develops in the future.
([SHUWV�EHOLHYHG�WKDW�FKDQJH�LV�XQGHU�ZD\��DQG�PDQ\�ZHUH�FRQčGHQW�WKDW�XWLOLWLHV�ZRXOG�ULVH�WR�WKH�FKDOOHQJH��2QH�VDLG��èXWLOLWLHV�DUH�already reevaluating their strategies, and this will certainly start to happen in the next 3–5 years, and then we’ll see overall changes in business models and market structures in the 5–10 year time frame.” Another commented that “utility resistance is declining with new business models, guided by new policy frameworks,” and believed that, “the mindset of established utilities is changing—they are recognizing that if they do not change, they can’t continue with business-as-usual.”
+RZHYHU��QRW�DOO�H[SHUWV�ZHUH�DV�FHUWDLQ�WKDW�XWLOLWLHV�ZRXOG�OHDG��6DLG�RQH��èXWLOLW\�V\VWHP�WUDQVIRUPDWLRQ�ZLOO�HPHUJH�ZLWKLQ�čYH�years, but led by external stakeholders, not by the utilities themselves.” Another saw the utility leadership question as generational: “To transform the utility systems in the ways required, we are going to have to retire many existing power engineers.”
2QH�čQDQFH�H[SHUW�EHOLHYHG�WKDW�VRPH�XWLOLWLHV�ZLOO�FRPH�XQGHU�SUHVVXUH�WR�OHDG�RU�SHULVK�TXLWH�VRRQ��DQG�SUHGLFWHG�WKH�èFRPLQJ�LPPLQHQW�FROODSVH�LQ�čQDQFLQJ�RI�FRQYHQWLRQDO�FHQWUDOL]HG�SRZHU�JHQHUDWLRQ�DVVHWV�LQ�2(&'�FRXQWULHV�é�7KLV�H[SHUW�H[SODLQHG�WKDW�èVRODU�39�ZLOO�GHVWUR\�WKH�čQDQFLQJ��HFRQRPLFV��DQG�RSHUDWLRQV�RI�WKH�WUDGLWLRQDO�FHQWUDOL]HG�QHWZRUNV�PXFK�IDVWHU�DQG�ZLWK�PXFK�larger negative consequences than anyone is discussing.”
Notes and discussion: See Annex 4.

35
(Many oil companies are also investing in biofuels; see Chapter 2.) Some companies recognize in particular the comparative advantage they have for geothermal and offshore wind development. With environmental goals in mind, oil and gas companies are also invest-ing in carbon capture and storage, natural gas generation, energy HIčFLHQF\��DQG�QXFOHDU�SRZHUäZLWK�UHQHZDEOHV�MXVW�RQH�VWUDWHJ\�among many and not necessarily the most important, company statements suggest.12
Beyond traditional energy companies, recent investment trends by private companies in a wide variety of other industries also suggest future investors. As just one example, Google has invested close to $1 billion in renewable energy projects in recent years.13
Finance experts suggested a variety of other new investment mod-els and mechanisms that could take hold in the future, and cited examples of such models in use today. General categories include community ownership (co-ops and community-based utilities), direct ownership by business and retail power customers, owner-ship/leasing by equipment vendors themselves, ownership by large institutional investors such as pension funds, and ownership by national and local governments.14
2WKHU� LQYHVWPHQW� PHFKDQLVPV� FLWHG� E\� H[SHUWV� LQFOXGH� GHIDXOW�insurance for utility power-purchase agreements, securitization of potentially thousands of rooftop solar PV loans (initiated through banks) into securities for long-term investors, and new ways to involve aggregates of many small investors in larger renewable HQHUJ\�SURMHFWV��2QH�VXFK�DJJUHJDWLRQ�PRGHO�FLWHG�LV�WKH�8�6��PRGHO�of master limited partnerships used in the oil and gas industry.15
Most experts foresaw continued markets for the “environmental DWWULEXWHVé� RI� UHQHZDEOHV�� VXFK� DV� SUHVHQW�GD\� JUHHQ� FHUWLčFDWHV�and carbon trading. But experts also foresaw markets for these DWWULEXWHV�H[SDQGLQJ�DQG�GLYHUVLI\LQJ� LQ�ZD\V�WKDW�DUH�GLIčFXOW� WR�LPDJLQH�WRGD\��2YHUDOO��D�FRPPRQ�VHQWLPHQW�ZDV�WKDW�èUHQHZDEOHV�will continue to be paid for their environmental attributes.”16
,Q�GHYHORSLQJ�FRXQWULHV��čQDQFH�H[SHUWV�VDZ�D�FRQWLQXHG�QHHG�IRU�PXOWLODWHUDO�čQDQFH��6DLG�RQH���7KHUH�DUH�VWLOO�SROLWLFDO�DQG�JHRSROLWL-cal risks around the world … We’ll see the multilaterals continuing WR�čOO�WKH�JDS�DQG�SURYLGH�FDSLWDO�IRU�UHQHZDEOH�SURMHFWV�LQ�DGGLWLRQ�
WR�EDQNV�DQG�LQVWLWXWLRQDO�IXQGV�é�%XW�EH\RQG�PXOWLODWHUDO�čQDQFH��D�QXPEHU�RI�čQDQFH�H[SHUWV�DOVR�SRLQWHG�WR�D�èEURDGHQLQJ�DQG�GHHS-HQLQJé�RI�čQDQFH�VRXUFHV�LQ�GHYHORSLQJ�FRXQWULHV��$�EURDGHU�EDVH�RI� LQVWLWXWLRQV�� VRXUFHV��DQG� W\SHV�RI�čQDQFH�ZLOO� HPHUJH�� LQFOXG-ing institutional investors, manufacturers, project developers, and RWKHU�IRUPV�RI�IRUHLJQ�GLUHFW�LQYHVWPHQW��$QG�PRUH�čQDQFH�ZLOO�JR�to countries beyond the current major recipients (i.e., Brazil, India, and China), to include those countries currently considered “second-tier” and “third-tier.”17
The often-cited risk of utility power-purchase agreements not being honored (also called “power off-take risk) will continue to be a PDMRU�FRQFHUQ��VDLG�RQH�H[SHUW��%XW�SROLF\�OHDUQLQJ��DQG�čQGLQJ�QHZ�ways to reduce investment risks, including new types of structured investment funds and guarantee schemes, will be crucial to this deepening. Experts foresaw guarantee funds for power-purchase agreements, construction risk mitigation, and higher levels of equity IURP�ORFDO�LQYHVWRUV��2QH�H[SHUW�SURMHFWHG�WKDW�GHYHORSLQJ�FRXQWU\�governments themselves would provide public equity in renewable HQHUJ\�SURMHFWV��WR�VKDUH�ULVNV�DQG�OHYHUDJH�SULYDWH�čQDQFH�18
As noted in this report’s introduction, some 120 countries around the world have some type of policy and/or target to promote renewable energy, and the number of policies keeps growing year by year. The IEA estimates that government support for investments in renewables will continue to increase in the coming decades WKURXJK�D�YDULHW\�RI�SROLF\�PHFKDQLVPV��,($�:(2��������HVWLPDWHV�that government support for renewables amounted to almost $90 billion worldwide in 2011.a This support grows to $240 billion annually by 2035 in the “New Policies” scenario.19
The IEA estimates that EU support for renewables will peak in the 2020s at around $70 billion annually and remain above $30 billion through 2035. U.S. government support will peak somewhat later, at about $60 billion before 2030 (compared to $15 billion in 2009). Chinese government support will exceed $30 billion during the late 2020s (compared to $3 billion in 2009), and government support in India will similarly reach almost $30 billion (although later—by 2035).20
a) “Government support” from policies is both direct and indirect, meaning that it goes beyond direct payments from government budgets. The IEA uses the term “subsidies” in a broader sense to mean “government support,” where costs are met “either through government budgets (for example, tax credits) or by end-XVHUV�FROOHFWLYHO\���7KH�,($�GHčQHV�GLUHFW�VXEVLGLHV�DV�èWD[�FUHGLWV�IRU�SURGXFWLRQ�DQG�LQYHVWPHQW��SULFH�SUHPLXPV�DQG�SUHIHUHQWLDO�EX\�EDFN�UDWHV��RU�IHHG�LQ�tariffs).” Indirect subsidies “arise from mandates, quotas and portfolio standards, which support the uptake of renewables at higher costs to the economy or WKH�FRQVXPHU�é��,($�:(2��������S������
03
Great Debate 7 | What Roles Will Oil and Gas Companies Play?
2LO�FRPSDQLHV�DUH�D�GRPLQDQW�SDUW�RI�RXU�H[LVWLQJ�HQHUJ\�V\VWHPV��:LOO�WKH\�UHPDLQ�WKDW�ZD\�LQ�WKH�IXWXUH"�&OHDUO\��RLO�FRPSDQLHV�DUH�SRVLWLRQLQJ�WKHPVHOYHV�DV�ELRIXHOV�VXSSOLHUV�LQ�DGGLWLRQ�WR�PDQ\�DJULFXOWXUH�EDVHG�ELRIXHOV�SURGXFHUV��2YHU�WKH�SDVW�GHFDGH��VRPH�oil companies have sought to position themselves as future suppliers of hydrogen from renewables, or have tried to get involved in small-scale solar or biomass projects, but with limited success. Some experts believed that offshore logistics capabilities will ultimately mean a major role for oil companies in offshore wind power given comparative advantages, but so far few oil companies have gone beyond expressing interest.
Notes and discussion: See Annex 4.

3UREDEO\�QRW��EXW�WKH\¶OO�KDYH�WR�FKDQJH�DV�WKHLU�EXOZDUNV�DUH�SRXQGHG�E\ZDYHV�RI�UDGLFDO�LQQRYDWLRQV�7DNH�RLO��ZKLFK�FRXOG�EH�IXOO\�REVROHWH�E\����������2LO�FRPSDQLHV�DUH�QHDUO\
DOO�GLYHUVLILHG�HQHUJ\�FRPSDQLHV��0DQ\�KDYH�VKLIWHG�RU�DUH�VKLIWLQJ�WR�QDWXUDOJDV�RU�UHQHZDEOHV��%XW�WUDGLWLRQDOO\�DERXW�WZR�WKLUGV�RI�WKHLU�HTXLW\�YDOXHFRPHV�IURP�WKHLU�K\GURFDUERQ�UHVHUYHV��7KDW�YDOXH�FRXOG�GURS�GUDPDWLFDOO\�LIZH�VWRS�XVLQJ�RLO²DQG�WKHUH�DUH�DOUHDG\�VWURQJ�VLJQDOV�WKDW�RLO�GHPDQG�LVSHDNLQJ��,Q�2FWREHU�������IRU�LQVWDQFH��'HXWVFKH�%DQN�IRUHFDVW�ZRUOG�RLO�XVHZLOO�SHDN�DURXQG�������WKHQ�E\������GURS�WR�����EHORZ�WKH�FRQVHQVXV�IRUHFDVWRU����EHORZ�WKH������OHYHO���²MXVW�GXH�WR�HOHFWULILHG�DXWRV²DQG�FRQFOXGHG�³:H�EHOLHYH�WKDW�IDOOLQJ�RLO�GHPDQG�ZLOO�HQG�WKH�RLO�DJH�´7KXV�WKH�RLO�LQGXVWU\�IDFHV�ZKDW�HFRQRPLVW�-RVHSK�6FKXPSHWHU�FDOOHG
³FUHDWLYH�GHVWUXFWLRQ´²ZUHQFKLQJ�FKDQJH�WKDW�FRPHV�ZKHQ�HQWLUHO\�QHZEXVLQHVVHV�UHSODFH�WKH�ROG�RQHV��2LO�FRPSDQLHV�QR�ORQJHU�FRQWURO�WKHLU�RZQGHVWLQ\�����0DQ\�PDMRU�RLO�FRPSDQLHV�KDYH�VHHQ�WKLV�FRPLQJ�IRU�PRUH�WKDQ�DGHFDGH�DQG�KDYH�GLYHUVLILHG�WKHLU�DFWLYLWLHV�DQG�RSWLRQ�SRUWIROLRV�DFFRUGLQJO\�6KHOO��IRU�H[DPSOH��LV�DOUHDG\�WKH�ZRUOG¶V�OHDGLQJ�ELRIXHO�GLVWULEXWRU��7KHLQGXVWU\�FDQ�DOVR�XVH�LWV�GULOOLQJ�DQG�UHVHUYRLU�PDVWHU\�WR�RIIHU�FDUERQVHTXHVWUDWLRQ�VHUYLFHV²ZKRVH�VXFFHVV�PLJKW�XOWLPDWHO\�UHTXLUH�PDQ\�WLPHV�WKHDQQXDO�FXELF�PHWHUV�RI�WKURXJKSXW�WKDW�RLO�QRZ�GRHV²DQG�WR�H[SORLW�DGYDQFHGJHRWKHUPDO�HQHUJ\�3HUKDSV�WKH�ELJJHVW�RSSRUWXQLW\�IRU�WKH�RLO�LQGXVWU\��KRZHYHU��LV�WKH�SRWHQWLDO
K\GURJHQ�PDUNHW��ZKLFK�WKH�LQGXVWU\�DOUHDG\�NQRZV�ZHOO�DQG�FDQ�VHUYH�WKURXJKLWV�UHWDLO�FKDQQHOV��+\GURJHQ�FRXOG�HDUQ�RLO�RZQHUV�KLJKHU�SULFHV�LQ�D�ZRUOG�WKDWXOWLPDWHO\�EX\V�QR�RLO��EHFDXVH�WKH�K\GURJHQ�PD\�EH�ZRUWK�PRUH�ZLWKRXW�WKHFDUERQ�WKDQ�ZLWK�LW��HYHQ�LI�QRERG\�SD\V�WR�NHHS�FDUERQ�RXW�RI�WKH�DLU��2ZQHUVPD\�WKXV�PDNH�PRUH�PRQH\�WDNLQJ�K\GURJHQ�RXW�RI�WKHLU�K\GURFDUERQV�LQ�DUHIRUPHU�WKDQ�SXWWLQJ�K\GURJHQ�LQWR�WKHLU�K\GURFDUERQV�LQ�D�UHILQHU\��7KDW¶VEHFDXVH�IXHO�FHOOV¶�YHU\�KLJK�HIILFLHQF\�LQ�YHKLFOHV��DQG�HYHQ�KLJKHU�V\VWHPHIILFLHQF\�LQ�VWDWLRQDU\�FRJHQHUDWRUV��PDNHV�K\GURJHQ�PRUH�YDOXDEOH�WKDQK\GURFDUERQ�SHU�XQLW�RI�HQG�XVH�VHUYLFH�GHOLYHUHG�$�VKLIW�WR�K\GURJHQ�IXHOLQJ�VKRXOGQ¶W�VLJQLILFDQWO\�LQFUHDVH�WRWDO�8�6��XVH�RI
QDWXUDO�JDV�DQG�PD\��DV�*0�IRXQG��UHGXFH�LW�����EXW�K\GURJHQ�VKRXOG�HDUQ�KLJKHUPDUJLQV�WKDQ�JDVROLQH��%\�PRYLQJ�WRZDUG�K\GURJHQ��ELRIXHOV��DQG�³JUHHQ´FKHPLFDOV��RLO�FRPSDQLHV�FRXOG�FRQWLQXH�WR�XVH�VRPH�RI�WKHLU�UHILQHULHV�

Hydrogen - energy carrier with interesting properties Optimum direct fuel cell fuel High energy density Non-toxic Colourless, odourless Zero air emission impact Zero water environmental impact Rapid dispersal
Explosive only if contained Flammable over wide range Difficult to store Difficult to transport (in medium quantities)

How to make Hydrogen
H2
Nuclear • Electrolysis • Thermo-catalytic
Biomass • Gasification • Bio-hydrogen
Natural gas • Reforming • Partial oxidation
Coal • Gasification • In-situ gasification incl. CO2 sequestration Solar
• Electrolysis
Wind • Electrolysis
Petroleum Coke/Residue • Gasification incl. CO2 sequestration
Petroleum • Reforming • Partial oxidation

What is a fuel cell

Benefits of using Fuel Cell Power
High efficiencies Pollution reduction Ability to use heat Distributed generation Grid independence High reliability
If combined with the right cost => compelling case for fuel cells
Hydrogen Economy
Why is Shell interested in the “Hydrogen Economy” ?
….creating a more sustainable energy system,
and a profitable future growth market


H2 infrastructure expansion
Gas resource outlook expandsFuel cell fuel distribution innovationsRenewables limited to niches
Convergence around fuel cells for transport andstationary uses - gas network backbone
Unconventional oil & gas expand in China and IndiaFuel cells reach 25% of sales in OECD
Solid H2 Storage transitionRenewables pulled by strong H2 demand
First stationary and vehicular fuel cells- high consumer interest2005
2010
2015
2020
2030
2040
Timeline Spirit of the Coming Age 3
57
Oil scarcity drives biofuels expansion
New nuclear stallsNext generation of renewables emerges
OECD renewables stall at 20% of electricity supplyGas security concerns emerge
Oil price shock triggers resource expansion
"Dash for Gas"; Renewable pump priming
H2Hybrid vehicles proliferate with "CARB" pushes2005
2010
2015
2020
2030
2040
Timeline Dynamics as Usual 2
41
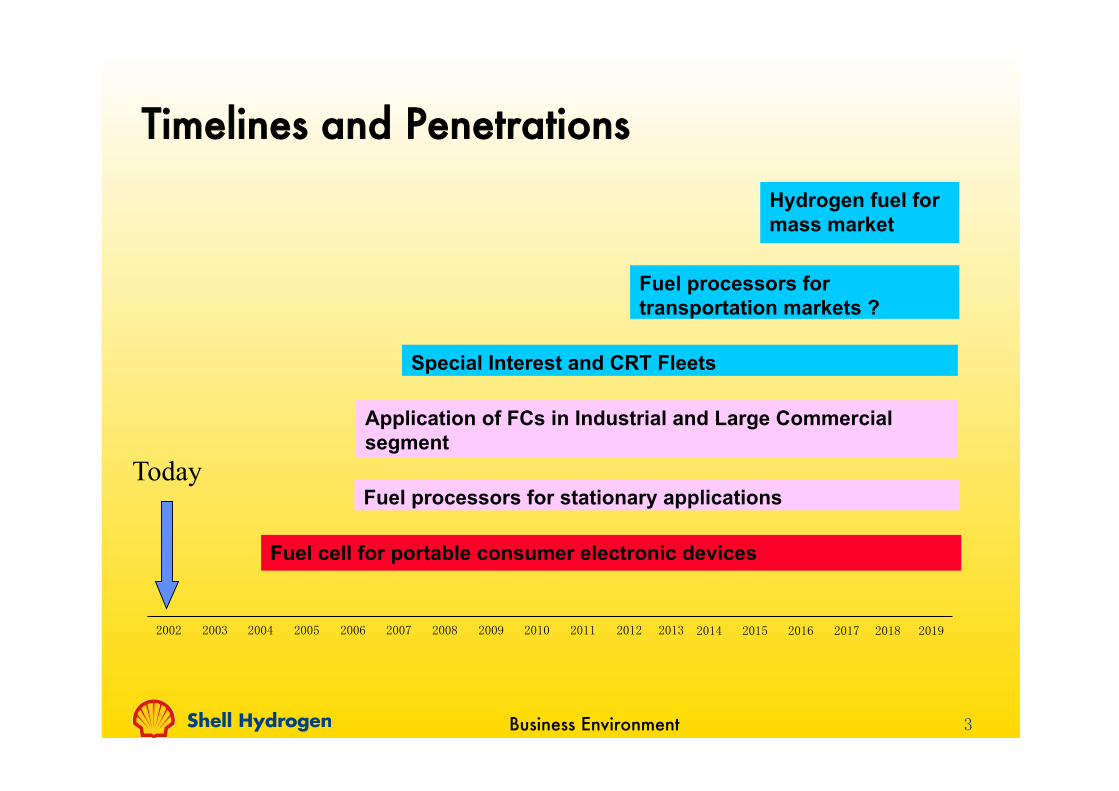
Timelines and Penetrations
��
Special Interest and CRT Fleets�
Hydrogen fuel for mass market
Application of FCs in Industrial and Large Commercial segment
����� ����� ����� ����� ����� ���� ���� ����� ����� ����� ����� ����� ����� ����� ����� ���� ���� �����
Today
Fuel cell for portable consumer electronic devices
Business Environment
Fuel processors for stationary applications�
Fuel processors for transportation markets ?�

1
Shell background 7493 Grundy background 451
Shell long-term energy scenariosShell energy scenariosto 2050

1
Step-change inenergy use
2
Supply will
struggle to keeppace
3
Environmental
stresses are increasing
Worldwide emission trading scheme evolving post Kyoto
Electric vehicles enter mass market
Moderate uptake in unconventionals
Electri!cation of the transport sector
Decoupling of world GDP & energy growth
Continued growth in unconventionals
30% of transportation needsare met by alternative fuels
Non-OECD reaches two-thirdsof world primary energydemand
China overtakes U.S. asmajor CO2 emitter
Flight into coal
Nuclear comeback
India overtakes U.S. as majorCO2 emitter
Biofuels ~30% of liquid fuels
Energy related CO2 emissionsdecline but atmospheric
concentrations continue to rise
Climate adaption measures begin
Strong growth in CO2 emissions
Modest nuclear growthCoal hits constraints
CO2 emissions moderateFurther rise in biofuels
CO2 emissions on the rise again
Solar expansion
Drivers
BlueprintsScram
ble
Nuclear slowdown
Global CO2 trading scheme
CCS deployed commercially
Nuclear revival
Centralised solar PV
Wind takes o!
Mandated biofuels
What can w
e expect from the future?
Three Hard Truths
Scramble
Blueprints
The present to 2015
Turbulence 2015-2030
The future 2030-2055
Technology
Dem
and
Resources
Environment
2015?
?
2055
2050
2040
2030
2020
Blueprints need 13%
less prim
ary energy than Scram
ble
Choice
Prices
E!ciency technology
E!ciency behaviour
Mandates
Externalities not included
Mandates
Necessity
Market driven but incentivised
Externalities included
Economic incentives & standards
Designed in
Oil & gas
Coal
Nuclear
Electric renewables
Biomass
onstrained growth
Flight into coal
Modest uptake
Sequential - wind, solar
Strong growth
Long plateau
Coal not wanted unless “clean”
Continued growth
Incentivise early stage technologies
Complem
ents alternative fuel mix
Innovation
Implem
entation
Mobility
Power
IT
Strongly guarded
National “docking points”
Hybrids & dow
nsizing
E!ciency
Supply optimisation
Extensively shared
International “tipping points”
Hybrids & electri"cation
Carbon capture & storage
Demand load m
anagement system
s
Land use
Pollution
Climate / Biodiversity
Water
Energy vs. food principle
Important locally
Background global concern
Energy production & climate
change im
pact
Sustainability principle
Important
Prominent local & global concern
Factored into development
fram
eworks
A "fth of all coal and gas"red power generationequipped with CCS
50% of all new vehicles salesare electric or hydrogen
Strong growth in unconventionals
Slowdown in unconventionals
World population
passes 9 billion
Timeline spread
Comparison spread
Scenario timeline
What are the energy-related di!erences
between the
two scenarios?
Scenario com
parisons4
4
38

1
Step-change inenergy use
2
Supply will
struggle to keeppace
3
Environmental
stresses are increasing
Worldwide emission trading scheme evolving post Kyoto
Electric vehicles enter mass market
Moderate uptake in unconventionals
Electri!cation of the transport sector
Decoupling of world GDP & energy growth
Continued growth in unconventionals
30% of transportation needsare met by alternative fuels
Non-OECD reaches two-thirdsof world primary energydemand
China overtakes U.S. asmajor CO2 emitter
Flight into coal
Nuclear comeback
India overtakes U.S. as majorCO2 emitter
Biofuels ~30% of liquid fuels
Energy related CO2 emissionsdecline but atmospheric
concentrations continue to rise
Climate adaption measures begin
Strong growth in CO2 emissions
Modest nuclear growthCoal hits constraints
CO2 emissions moderateFurther rise in biofuels
CO2 emissions on the rise again
Solar expansion
Drivers
BlueprintsScram
ble
Nuclear slowdown
Global CO2 trading scheme
CCS deployed commercially
Nuclear revival
Centralised solar PV
Wind takes o!
Mandated biofuels
What can w
e expect from the future?
Three Hard Truths
Scramble
Blueprints
The present to 2015
Turbulence 2015-2030
The future 2030-2055
Technology
Dem
and
Resources
Environment
2015
?
?
2055
2050
2040
2030
2020
Blueprints need 13%
less prim
ary energy than Scram
ble
Choice
Prices
E!ciency technology
E!ciency behaviour
Mandates
Externalities not included
Mandates
Necessity
Market driven but incentivised
Externalities included
Economic incentives & standards
Designed in
Oil & gas
Coal
Nuclear
Electric renewables
Biomass
onstrained growth
Flight into coal
Modest uptake
Sequential - wind, solar
Strong growth
Long plateau
Coal not wanted unless “clean”
Continued growth
Incentivise early stage technologies
Complem
ents alternative fuel mix
Innovation
Implem
entation
Mobility
Power
IT
Strongly guarded
National “docking points”
Hybrids & dow
nsizing
E!ciency
Supply optimisation
Extensively shared
International “tipping points”
Hybrids & electri"cation
Carbon capture & storage
Demand load m
anagement system
s
Land use
Pollution
Climate / Biodiversity
Water
Energy vs. food principle
Important locally
Background global concern
Energy production & climate
change im
pact
Sustainability principle
Important
Prominent local & global concern
Factored into development
fram
eworks
A "fth of all coal and gas"red power generationequipped with CCS
50% of all new vehicles salesare electric or hydrogen
Strong growth in unconventionals
Slowdown in unconventionals
World population
passes 9 billion
Timeline spread
Comparison spread
Scenario timeline
What are the energy-related di!erences
between the
two scenarios?
Scenario com
parisons4
4
39

14
RENEWABLES GLOBAL FUTURES REPORT 01 HOW MUCH RENEWABLES?
HOW MUCH RENEWABLES?01Future renewable energy shares are in the range of 15–20% in conservative scenarios, 30–45% in moderate scenarios, and 50–95% in high-renewables scenarios. Attaining high shares of electricity is considered easiest, KLJK�VKDUHV�RI�KHDWLQJ�FRROLQJ�PRVW�GLIčFXOW��and high shares of transport energy most uncertain.

0
50
100
150
200
IEA (2000) -- Wind Power Globally (GW)
2010
Projected
2010
Actual
Historic Projections Fall Short…
0
10
20
30
40
50
60
70
World Bank (1997)--Wind Power in China (GW)
2020
Projected
2011
Actual


Energy Outlook 2030 © BP 201110
0
1
2
3
4
5
1970-1990
1990-2010
2010-2030
0
1
2
3
4
5
1850-1910
1910-1970
0
3
6
9
12
15
18
1870 1910 1950 1990 2030
RenewablesNuclearHydroGasOilCoal
The long view: Energy consumption and fuel mix…
Billion toe
World commercial energy use Contribution to total energy growth
% p.a.
* Includes biofuels
*

Energy Outlook 2030 © BP 201118
Gas and renewables win as fuel shares converge...
0%
10%
20%
30%
40%
50%
1970 1990 2010 2030
Shares of world primary energy
Oil
Coal
Gas
Hydro
Nuclear Renewables*
Contributions to growth
0.0%
0.5%
1.0%
1.5%
2.0%
2.5%
1970-1990
1990-2010
2010-2030
Renewables*
Hydro
Nuclear
Coal
Gas
Oil
* Includes biofuels

Energy Outlook 2030 © BP 201114
The relationship between population, GDP and energy…
-2%
-1%
0%
1%
2%
3%
4%
1970-1990 1990-2010 2010-2030
GDP
Population
Energy
Energy per capita
Energy per GDP
Global growth rates% p.a.
Final energy consumption by region
First coal, then biofuels followed by renewable energy, are sequential supply responses to the increasing energy demand. But no single or easy solution to the energy challenge exists. Government driven efficiency measures are introduced when stresses become too high for the market to cope with.
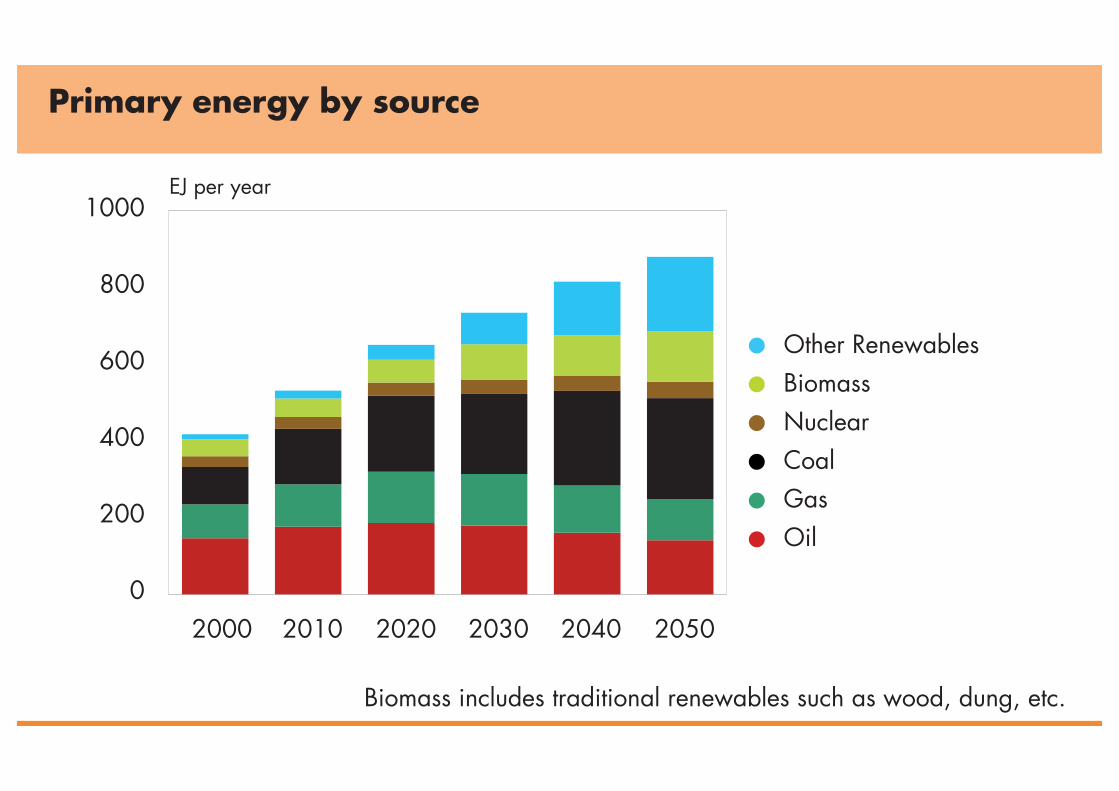
Primary energy by source
Chart on page 17 !!!!!!!!!!!!!!!!!!!!!!!!!!!!!!!!
0
200
400
600
2000 2010 2020 2030 2040 2050
Sub-Saharan AfricaMiddle East & N AfricaLatin AmericaAsia & Oceania - DevelopingAsia & Oceania - DevelopedNorth AmericaEurope
EJ per year
Updated Charts for Booklet based on v1.1.3.3
No change to page 9 but check missing head on 2025 line (population chart)
P17
0
200
400
600
800
1000
2000 2010 2020 2030 2040 2050
EJ per year
Other RenewablesBiomassNuclearCoalGasOil
0
200
400
600
800
1000
2000 2010 2020 2030 2040 2050
Sub-Saharan AfricaMiddle East & N AfricaLatin AmericaAsia & Oceania - DevelopingAsia & Oceania - DevelopedNorth AmericaEurope
EJ per year
Biomass includes traditional renewables such as wood, dung, etc.
Sub-Saharan AfricaMiddle East & N. AfricaLatin AmericaAsia & Oceania - DevelopingAsia & Oceania - DevelopedNorth AmericaEurope
Other RenewablesBiomassNuclearCoalGasOil
600
400
200
0205020402030202020102000
205020402030202020102000
1000
800
600
400
200
0
exajoule (EJ) per year
EJ per year
17


2 0 1 0
ENERGYTECHNOLOGYPERSPECTIVES
Scenarios &
Strategies
to 2050
© OECD/IEA - 2010
Decarbonising the electricity sector
A mix of renewables, nuclear and fossil-fuels combined with CCS will be needed to decarbonise the electricity sector.
0
5
10
15
20
25
30
35
40
45
50
2007 Baseline 2050 BLUE Map 2050
BLUE High Nuclear 2050
BLUE High Ren 2050
PWh
Other
Solar
Wind
Biomass+CCS
Biomass and waste
Hydro
Nuclear
Natural gas+CCS
Natural gas
Oil
Coal+CCS
Coal

78
5
key resu
lts|
GL
OB
AL
- EL
EC
TR
ICIT
Y G
EN
ER
AT
ION
WORLD ENERGY [R]EVOLUTIONA SUSTAINABLE WORLD ENERGY OUTLOOK
GLOBAL SCENARIO OECD NORTH AMERICALATIN AMERICAOECD EUROPE AFRICA
MIDDLE EASTEASTERN EUROPE/EURASIAINDIA
NON OECD ASIACHINAOECD ASIA OCEANIA
global
global: electricity generation
The development of the electricity supply market is charaterised bya dynamically growing renewable energy market. This willcompensate for the phasing out of nuclear energy and reduce thenumber of fossil fuel-fired power plants required for gridstabilisation. By 2050, 94% of the electricity produced worldwidewill come from renewable energy sources. ‘New’ renewables –mainly wind, PV and geothermal energy – will contribute 60% ofelectricity generation. The Energy [R]evolution scenario projects animmediate market development with high annual growth ratesachieving a renewable electricity share of 37% already by 2020and 61% by 2030. The installed capacity of renewables will reach7,400 GW in 2030 and 15,100 GW by 2050.
Table 5.1 shows the global development of the differentrenewable technologies over time. Up to 2020 hydro and windwill remain the main contributors of the growing market share.After 2020, the continuing growth of wind will be complementedby electricity from photovoltaics solar thermal (CSP), oceanenergy and bioenergy. The Energy [R]evolution scenario will leadto a high share of fluctuating power generation sources(photovoltaic, wind and ocean) of 31% by 2030, therefore theexpansion of smart grids, demand side management (DSM) andstorage capacity will be required. The further expanison ofconventional power plants - especially coal in China and Indianeeds to slow down immediately and peak no later than 2025 inorder to avoid long term lock-in effects in coal the the relatedlong term CO2 emissions in the power sector.
table 5.1: global: renewable electricity generation capacityunder the reference scenario and the energy [r]evolutionscenario IN GW
2020
1,2501,246
98162
5251,357
1865
124674
11166
154
2,0283,724
2040
1,5641,428
215390
9594,287
37446
3513,335
401,362
13345
3,17911,594
2050
1,6951,484
272490
1,1355,236
47666
4714,548
622,054
18610
3,69915,088
Hydro
Biomass
Wind
Geothermal
PV
CSP
Ocean energy
Total
REFE[R]
REFE[R]
REFE[R]
REFE[R]
REFE[R]
REFE[R]
REFE[R]
REFE[R]
2030
1,4251,347
155265
7542,908
27219
2341,764
24714
4176
2,6227,392
2009
995995
5151
147147
1111
1919
00
00
1,2241,224
figure 5.6: global: electricity generation structure under the reference scenario and the energy [r]evolution scenario (INCLUDING ELECTRICITY FOR ELECTROMOBILITY, HEAT PUMPS AND HYDROGEN GENERATION)
TWh/a 0
10,000
20,000
30,000
40,000
50,000
REF REF REF REF REF REFE[R] E[R] E[R] E[R] E[R] E[R]
2009 2015 2020 2030 2040 2050
•OCEAN ENERGY
• SOLAR THERMAL
• GEOTHERMAL
• BIOMASS
• PV
•WIND
• HYDRO
• NUCLEAR
• DIESEL
• OIL
• NATURAL GAS
• LIGNITE
• COAL

0
50
100
150
200
2000 2010 2020 2030 2040 2050
EJ per year
Other RenewablesWindSolarBiomass + WasteHydroelectricityNuclearCoalGasOil
Final energy consumption of electricity
Carbon dioxide capture and storage (CCS)There are many technical options for capturing CO2. Once captured, CO2 can be stored underground (in aquifers or in certain oil and gas fields), or used in some industrial processes. However, capturing and storing CO2 is energy intensive and expensive. CCS is technically feasible with today’s technologies but has not yet been deployed on a large scale. Its development will require the creation of a substantial CCS infrastructure, incentives for greenhouse gas emission control (e.g. CO2 pricing or emission intensity targets), and the addressing of regulation, permitting, safety and liability issues.
Given these requirements, large-scale deployment of CCS is not expected to take place until at least 2020. Even then, CCS is not without drawbacks: its use inevitably reduces the efficiency of power stations and so increases the pressure on the energy system. Reaching an annual storage capacity of 6 gigatonnes of CO2 – a substantial contribution to efforts to lower emissions – would require an enormous transportation and storage site infrastructure twice the scale of today’s global natural gas infrastructure. Nevertheless, by 2050 CCS can make an important contribution to CO2 management.
Reducing CO2 emissions through electrification triggers strong growth in the power sector and pulls in renewable energies. By 2050, over 60% of electricity is generated by non-fossil sources. Carbon capture and storage can make an important contribution to reduce emissions but is not a silver bullet.
EJ per yearOther RenewablesWindSolarBiomass + WasteHydroelectricityNuclearCoalGasOil
200
150
100
50
02000 2010 2020 2030 2040 2050
P31
New chart to come
P33
0
50
100
150
200
2000 2010 2020 2030 2040 2050
EJ per year
Other RenewablesWindSolarBiomass + WasteHydroelectricityNuclearCoalGasOil
33

CHINA&HIGH(RENEWABLE&ELECTRICITY&SCENARIO&FOR&2050&(Under&development&by&the&China&Energy&Research&Institute)&
!!• Total!primary!energy!demand!only!increases!by!25%!compared!to!today,!with!peak!in!2030!!• “Electrification!of!economy”!–!electricity!provides!65%!of!all!final!energy!consumption!(vs.!22%!today).!
!• Renewable!energy!provides!up!to!80%!share!of!electricity!!• 2400!GW!wind!power!(vs.!target!of!200!GW!by!2020)!!• 2000!GW!solar!PV!(vs.!target!of!35!GW!by!2015!and!100!GW!by!2020)!!• 400!million!electric!vehicles!by!2050!(out!of!500!million!total!passenger!vehicles)!!• CO2!emissions!3!Gt!in!2050,!half!of!6!Gt!today!!

53
With the explosive growth of renewable energy markets over the past decade have come dramatic technology improvements and FRVW�UHGXFWLRQV��7KHVH�JURZWK�UDWHV�UHĎ�HFW�D�èWDNH�RIIé�SKDVH�WKDW�has seen many renewable energy technologies become mainstream investments and undergo dramatic advances in performance, cost, and scale.1 (For details on the status of all technologies and markets, see annual editions of the REN21 Renewables Global Status Report. For more on cost comparisons between renewables and other energy technologies, see “Great Debate 1” on page 12. For policies underlying market growth, see “Great Debate 2” on page 13, and Chapter 5. For more on technology integration, see Chapter 2.)
In power generation, global wind power capacity grew by 20% in 2011 (to 238 GW), after growing by an annual average of 26% RYHU�WKH�č�YH�\HDU�SHULRG�����ã������6RODU�39�FDSDFLW\�JUHZ�E\�D�record 74% in 2011 (to 70 GW), after growing by an average of 58% RYHU�WKH�č�YH�\HDU�SHULRG��6RODU�WKHUPDO�SRZHU��&63��JUHZ�E\�����in 2011. In contrast, hydropower, biomass, and geothermal power KDYH�EHHQ�PDWXUH�IRU�GHFDGHV��DQG�č�YH�\HDU�JURZWK�UDWHV�IRU�WKHVH�renewables were more on par with conventional energy techno-logies. In terms of total power generation capacity, renewable energy reached 1,360 GW in 2011, including 970 GW of hydropower. This meant that global renewable capacity represented about one-quarter of total global power capacity.2
Growing markets for hot water and space heating that incorporate biomass, solar thermal, and geothermal have also contributed to technology evolution and cost reduction.a Biomass remains the primary form of heat supply from renewables, and provides about one tenth of global energy supply, two-thirds of which is “tradi-tional” biomass use (see footnote on page 15). Another 10% of the biomass resource is used for electricity generation and combined heat and power (CHP). Most biomass is consumed locally, but international trade in wood pellets has grown since the mid-1990s.
Markets for solar thermal collectors (for hot water and heating) have been growing rapidly in recent years, and solar now provides almost as much heating capacity as modern biomass. Solar heat-ing capacity grew by 27% in 2011, following 17% annual average JURZWK�RYHU�WKH�č�YH�\HDU�SHULRG�����ã������*HRWKHUPDO�KHDWLQJ�FDSDFLW\�LV�URXJKO\�RQH�č�IWK�WKDW�RI�ELRPDVV�KHDWLQJ�FDSDFLW\�DQG�also growing.3
Transport fuels from renewables are primarily ethanol and biodiesel produced from a variety of biomass crops. Production of these two fuels together reached 107 billion liters in 2011, about 3% of total global road transport fuel consumption. Ethanol fuel produc-WLRQ�JUHZ�E\�DQ�DQQXDO�DYHUDJH�RI�����RYHU�WKH�č�YH�\HDU�SHULRG�2006–2011, although growth was stagnant in 2011, and biodiesel JUHZ�E\�DQ�DQQXDO�DYHUDJH�RI�����RYHU�WKH�č�YH�\HDUV�4
Expert interviews and scenarios offer projections of continued dramatic global market growth in the coming decades, coupled with continuing technology improvements and cost reductions. These projections are explored in this chapter. Most common are projections for global power capacity, as shown in Table 4 from č�YH� VFHQDULRV� WR� ������ ,Q� WKHVH� VFHQDULRV�� ZLQG� SRZHU� FDSDFLW\�increases between 4-fold and 12-fold by 2030, solar PV between 7-fold and 25-fold, CSP between 20-fold and 350-fold, biomass power between 3-fold and 5-fold (with one exception), geothermal between 4-fold and 15-fold, and hydro between 30% and 80%.5
The following sections explore projections for the evolution of markets, technologies, and costs for individual technologies. These include future cost projections by experts and scenarios. In general, scenarios and experts expect costs to decline for a host of reasons, such as increased market volumes that accelerate technology development, economies of scale in manufacturing, and materials advances.6, b
Table 4: Global Renewable Power Capacity by 2030 in Recent Scenarios
Sources: See Annex 2. Actual 2006 and 2011 from REN21 (2008, 2012).Notes: CSP stands for solar thermal power. Figures for 2030 are rounded to nearest 10 GW or 50 GW from original sources. Hydropower č�JXUH�IRU������H[FOXGHV�SXUH�SXPSHG�K\GUR�FDSDFLW\��D�FRPSDUDEOH�č�JXUH�IRU������LV�QRW�DYDLODEOH��VHH�5(1�����������QRWHV�WR�7DEOH�5���and note on hydropower on page 168.
Hydro Wind Solar PV CSP Biomass Geothermal Ocean
GW
Actual 2006 Capacity for Comparison – 74 8 0.4 45 9.5 0.3
Actual 2011 Capacity for Comparison 970 238 70 1.8 72 11 0.5
,($�:(2��������è1HZ�3ROLFLHVé 1,580 920 490 40 210 40 10
,($�:(2��������è���é 1,740 1,340 720 110 260 50 10
IEA ETP (2012) “2DS” 1,640 1,400 700 140 340 50 20
%1()�*5(02������� — 1,350 1,200 260 30 —
IEA RETD (2010) “ACES” 1,300 2,700 1,000 120 340 — —
Greenpeace (2012) 1,350 2,900 1,750 700 60 170 180
a) Markets for cooling from renewables are much less developed than for heating, but are also growing; see annual editions of the REN21 Renewables Global Status Report. For more on both heating and cooling technologies, see buildings integration on page 26 and urban infrastructure integration on page 39.
b) Some experts questioned the sustainability of high levels of “manufactured” renewables like wind and solar PV in the very long term, in terms of material resources, rare earths, recycling, and toxic wastes. See Endnote 6.
06
GFR_Layout_31.indd 53 18.12.12 16:41

18
many countries already have targets for shares of electricity.16 �6HH�&KDSWHU���IRU�IXUWKHU�FRXQWU\�VSHFLčF�LQIRUPDWLRQ�RQ�HOHFWULFLW\�projections.)
+HDWLQJ�DQG�FRROLQJ�IURP�UHQHZDEOHV�ZLOO�EH�PXFK�PRUH�GLIčFXOW�WR�attain in large shares, many experts said, and published scenarios support this view. Although heating and cooling technologies are fairly well understood and established, policies for heating are not as evolved or widespread as for electricity, and many challenges persist in terms of integration into the built environment. There are far fewer scenarios projecting heating and cooling shares relative to those projecting electricity shares, and only a handful of countries have policy targets or national-level policies for renewable heating and cooling.17 (See also buildings integration in Chapter 2 and heat-ing and cooling at the city/local level in Chapter 4.)
Long-term transport shares are the most challenging to project, and the most uncertain, because the range of possible vehicle technologies and fuel types in the future is very broad, future oil prices are uncertain, and technology progress for many ele-ments, from vehicle batteries to advanced biofuels, remains unpredictable. These factors create uncertainty about what future transport systems look like. Fewer scenarios project shares of transport fuels, and in those that do, projections vary widely. However, quite a number of countries do have blending man-dates and/or targets for future shares of biofuels in transport.18 (See also transport integration in Chapter 2 and biofuels in Chapter 6. For more details on current biofuels mandates, see annual edi-tions of the REN21 Renewables Global Status Report.)
Table 1 shows global sectoral-share projections for the years 2030 to 2050 from several scenarios. These include two conservative scenarios by oil companies, two moderate scenarios by the IEA
(WE2 “New Policies” and “450”), and four high-renewables scenarios by IEA ETP, GEA, Greenpeace, and WWF. Beyond these global shares, H[DPSOHV� RI� FRXQWU\�VSHFLčF� SROLF\� WDUJHWV� DQG� SURMHFWLRQV� DUH�given in the following sections.19
! Electricity Shares
The global share of electricity from renewables in 2011 was 20%. In the EU, the share was 21%. A number of countries already produce very high shares of electricity from renewables, mainly from hydro-power in most countries. To illustrate the breadth of such countries, a list of countries with shares above 30% includes: Argentina (31%), Austria (68%), Brazil (85%), Cameroon (88%), Columbia (70%), Costa Rica (94%), Croatia (61%), Denmark (32%), El Salvador (65%), Ethiopia (89%), Finland (30%), Guatemala (63%), Iceland (100%), Latvia (55%), Madagascar (57%), New Zealand (73%), Norway (96%), Panama (59%), Paraguay (100%), Portugal (53%), Romania (34%), Slovenia (30%), Spain (34%), Sudan (81%), Sweden (55%), Switzerland (58%), Uganda (54%), and Venezuela (66%).20
At least 48 countries have targets for shares of electricity from renewables in the 2020–2030 time frame. Many of these targets represent a doubling or tripling of current shares. Examples of targets for 2020 include: Egypt (20%), Ireland (40%), Madagascar (75%), Philippines (40%), and Thailand (14%). A few targets extend to 2030, such as Kuwait (15%), South Africa (42%), and Tunisia (40%). And targets for three countries extend all the way to 2050: Denmark (100%), Germany (80%), and Malaysia (24%).a In late 2012, the Japanese government was expected to announce a target for a 30–35% share by 2030, as part of its new post-Fukushima energy strategy.21
Table 1: Sectoral Shares of Renewable Energy in Recent Global Scenarios
Sources: See Endnote 19 for this chapter and Annex 2.
1RWHV��7UDQVSRUW�VKDUHV�IRU�,($�:(2��,($�(73��DQG�%3�DUH�RQO\�IRU�ELRIXHOV��WUDQVSRUW�VKDUH�IRU�*UHHQSHDFH�LQFOXGHV�HOHFWULF�YHKLFOHV��WUDQVSRUW�share for WWF is entirely biofuels. Heat share for WWF is only industry and buildings. Electricity share for BP is estimated from graphics. (OHFWULFLW\�VKDUH�IRU�*($�LV�EDVHG�RQ�WKH�FHQWUDO��(IčFLHQF\��FDVH�
RENEWABLES GLOBAL FUTURES REPORT 01 HOW MUCH RENEWABLES?
Scenario By Year Electricity Heat Transport
By 2030–2040
ExxonMobil 2XWORRN�IRU�(QHUJ\��$�9LHZ�WR����� (2012) 2040 16% — —
BP (QHUJ\�2XWORRN����� (2012) 2030 25% — 7%
IEA :RUOG�(QHUJ\�2XWORRN (2012) “New Policies” 2035 31% 14% 6%
IEA :RUOG�(QHUJ\�2XWORRN (2012) “450” 2035 48% 19% 14%
Greenpeace (2012) Energy [R]evolution 2030 61% 51% 17%
By 2050
IEA Energy Technology Perspectives (2012) “2DS” 2050 57% — 39%
GEA Global Energy Assessment (2012) 2050 62% — 30%
IEA Energy Technology Perspectives (2012) “2DS High Renewables” 2050 71% — —
Greenpeace (2012) Energy [R]evolution 2050 94% 91% 72%
WWF (2011) Ecofys Energy Scenario 2050 100% 85% 100%
a) Germany's 80% share is reached through step-wise targets for each decade starting with 35% in 2020, and is part of its Energiewend movement to completely eliminate fossil fuels and nuclear.
GFR_Layout_31.indd 18 18.12.12 16:40


High overall efficiency of electric cars reduces demand in the transport sector and changes the fuel mix.
Chart for page 31
Delete Final energy consumption for transport
Add
Growth of electricity in transport
Replace chart with above, key should be round bullets and text etc should be as per other charts
0
50
100
150
200
250
300
350
2000 2025 2050
Electric transport
Liquid fuels
Passenger distance travelled (world), index 2000 = 100
Growth of electricity in transport
Electric transportLiquid fuels
350
300
250
200
150
100
50
0
205020252000
Passenger distance travelled (world), index 2000 = 100
31

81
5
key resu
lts|
GL
OB
AL
- HE
AT
ING
SU
PP
LY
global: heating supply
Renewables currently provide 25% of the global energy demand forheat supply, the main contribution coming from the use of biomass.In the Energy [R]evolution scenario, renewables provide 51% ofglobal total heat demand in 2030 and 91% in 2050. The lack ofdistrict heating networks is a severe structural barrier to the largescale utilisation of geothermal and solar thermal energy as well asthe lack of specific renewable heating policy. Past experience showsthat it is easier to implement effective support instruments in thegrid-connected electricity sector than in the heat market, with itsmultitude of different actors. Dedicated support instruments arerequired to ensure a dynamic development.
• Energy efficiency measures can decrease the demand for heatsupply by 23 % compared to the Reference scenario, in spite ofa growing global population, increasing economic activities andimproving living standards.
• For direct heating, solar collectors, biomass/biogas as well asgeothermal energy are increasingly substituting for fossil fuel-fired systems.
• The introduction of strict efficiency measures e.g. via strictbuilding standards and ambitious support programs forrenewable heating systems are needed to achieve economies ofscale within the next 5 to 10 years.
Table 5.3 shows the worldwide development of the differentrenewable technologies for heating over time. Up to 2020biomass will remain the main contributor of the growing marketshare. After 2020, the continuing growth of solar collectors anda growing share of geothermal energy and heat pumps will reducethe dependence on fossil fuels.
table 5.3: global: renewable heating capacities under thereference scenario and the energy [r]evolution scenario IN
GW
2020
37,31140,397
1,1007,724
5255,942
0604
38,93554,667
2040
41,35643,605
2,54335,236
1,11032,023
04,145
45,009115,009
2050
44,38040,368
3,25545,092
1,40047,488
06,343
49,035139,292
Biomass
Solarcollectors
Geothermal
Hydrogen
Total
REFE[R]
REFE[R]
REFE[R]
REFE[R]
REFE[R]
2030
38,85642,573
1,74320,004
72515,938
02,054
41,32580,568
2009
34,08534,085
546546
342342
00
34,97234,972
figure 5.10: global: heat supply structure under the reference scenario and the energy [r]evolution scenario (‘EFFICIENCY’ =
REDUCTION COMPARED TO THE REFERENCE SCENARIO)
PJ/a 0
20,000
40,000
60,000
80,000
100,000
120,000
140,000
160,000
180,000
200,000
REF REF REF REF REF REFE[R] E[R] E[R] E[R] E[R] E[R]
2009 2015 2020 2030 2040 2050
•‘EFFICIENCY’
• HYDROGEN
• GEOTHERMAL
• SOLAR
• BIOMASS
• FOSSIL
© G
P/P
ET
ER
CA
TON
© G
P/D
EA
N S
EW
ELL
image A RICE FIELD DESTROYED BY SALT WATER FROM HUGE TIDAL SURGESDURING THE CYCLONE ALIA IN BALI ISLAND IN THE SUNDARBANS.
image PORTLAND, IN THE STATE OF VICTORIA, WAS THE FIRST AUSTRALIAN COUNCILTO RECEIVE A DEVELOPMENT APPLICATION FOR WIND TURBINES AND NOW HASENOUGH IN THE SHIRE TO PROVIDE ENERGY FOR SEVERAL LOCAL TOWNS COMBINED.

Sustainable Energy Futures: Key Considerations and Questions
1. How much do “energy autonomy” or “security” factor into future motivations?
2. How much does climate change factor into future motivations?
3. How do we measure and account for external costs in investment decision-making?
4. How does a non-zero price of emitted carbon translate into changed incentives and costs?
5. How to overcome barriers to energy efficiency on large scales for high impact?
6. What type of transformation do we need in architecture, building design, passive solar, etc?
7. What are the most serious environmental and social impacts of renewables & how to address?
8. How much will the costs of wind, solar PV, and solar thermal power decline within 5-10 years?
9. How much wind power is possible without storage?
10. How much storage is necessary to balance out variable wind power for large amounts?
11. What are the prospects for pumped hydro storage given topography and costs?
12. How much of a contribution can biogas from animal and agricultural wastes make?
13. How much of the electric power system really could be local distributed generation?
14. What policies are needed to support distributed generation on large scales?

Sustainable Energy Futures: Key Considerations and Questions (continued)
15. At what point in time and performance do electric vehicles become viable on large scales?
16. How long do we “transition” with plug-in hybrid vehicles (PHEV) before getting to electric-only?
17. What is the best use and role of hydrogen?
18. What energy sources will be used to produce hydrogen in both medium and long terms?
19. How much transport fuel can we actually get from biofuels?
20. When (if ever) will second-generation biofuels (from cellulose) become commercially viable?
21. How drastically do we need to scale-back global carbon emissions, and how quickly?
22. Will carbon capture and storage ever be practical on large scales and cheap enough?
23. Will international climate policies cause a return to governments promoting nuclear power?
24. How to assess the trade-off between renewables, nuclear, and carbon-capture and storage?
25. How real is peak-oil and how much will it affect all of the above?
Others?