climate based simulation of different shading device ... · climate based simulation of different...
TRANSCRIPT

CLIMATE BASED SIMULATION OF DIFFERENT SHADING DEVICE SYSTEMS FOR COMFORT AND ENERGY DEMAND
Jan Wienold1, Francesco Frontini1,2, Sebastian Herkel1 and Sandra Mende1 1Fraunhofer Institute for Solar Energy Systems, Heidenhofstr. 2, 79110 Freiburg, Germany
2Institute for Applied Sustainability to the Built Environment (ISAAC), Campus Trevano CH-6952, Switzerland Canobbio
ABSTRACT This study investigates in detail conventional and advanced shading devices. Thermal and visual aspects are considered as well as advanced control strategies. The systems are compared regarding energy balances, daylight provision and visual comfort aspects (glare, view contact). Outside mounted systems offer in all investigated cases best solar protection. A combination of external shading and internal glare protection can reduce the overall energy demand by more than 25% compared to a solar control glazing and/or only internal mounted shadings. High reflective internal mounted shadings cannot reach the performance of external shadings. They can improve the cooling demand compared to a standard internal mounted blind system, but only if high quality sufaces are used.
INTRODUCTION AND OBJECTIVES The comfort and energy demand of a building are influenced significantly by the transparent part of a façade. To prevent the building from overheating and to provide a visual comfortable indoor environment at the same time, movable shading devices (like venetian blinds or internal roller blinds) are used frequently. The control algorithms of the blinds (e.g. manual or cut-off) influence the incoming flux of the solar radiation and therefore the illuminance distribution, the visual and thermal comfort and finally yet importantly the energy demand of a building. Additionally, the number of shading systems available today on the market is very huge and it is not always easy to choose the best solution for a building. Many parameters influence the choice of the system and of the control strategy itself. The building’s energy performance using different shading designs, like venetian blinds (Simmler, 2008) and internal shadings (Florides, 2000) have been studied already. But most existing studies investigated either only the thermal comfort and its influence on the energy demand (Tzempelikos, 2010; Hien, 2005; Kuhn, 2006; Kuhn, 2001; Afnor, 2003) or the visual comfort and its influence on the energy demand (Li, 2008). Only few studies investigate visual and thermal comfort of static and dynamic shading devices in office buildings: Nielsen (Nielsen, 2011) performed
simulations for three types of façades (without solar shading, with fixed solar shading, and with dynamic solar shading). David (David, 2011) investigated different types of solar shadings in non-residential buildings and Tzempelikos (Tzempelikos, 2007) investigated external roller shades. None of these studies investigated a holistic energy and visual comfort analysis including glare, view contact to the outside and daylight autonomy. The objective of this study is to show the influence of very different shading systems on the comfort and on the building energy demand for two different climates. This includes a comprehensive investigation of thermal and visual aspects. Sophisticated shading controls and models are used.
METHOD FOR THE SIMULATIONS In order to investigate the influence of different shading systems on comfort and energy demand, a three step method is applied. In the first step detailed daylight simulations are carried out. This method pre-calculates for a workplace the horizontal illuminance, the discomfort glare and the view contact. These calculations are done for each time step of a year for all possible positions of the shadings like angle and/or heights. RADIANCE based tools DAYSIM (Reinhart, 2001), evalglare (Wienold, 2004) and gen_dgp_profile are used for the daylight investigations. For the high reflective Retrolux system, the photon-mapping (Schregle, 2005) extension for DAYSIM is used. In the second step the control algorithm is applied. Within this step, the needed shading position is calculated and then the resulting horizontal illuminance, DGP and view are obtained out of the pre-calculated dataset. From these data the hourly electric energy demand for the artificial lighting and the daylight autonomy are calculated. The obtained results of shading position and internal loads of the electric lighting are considered as input for the third simulation step, the building energy simulation. For these simulations the program ESP-r (Clark, 2001) is used. The software was modified in order to consider the angle dependent properties (g-value) of the blind systems together with the control strategies (Frontini, 2009).
Proceedings of Building Simulation 2011: 12th Conference of International Building Performance Simulation Association, Sydney, 14-16 November.
- 2680 -
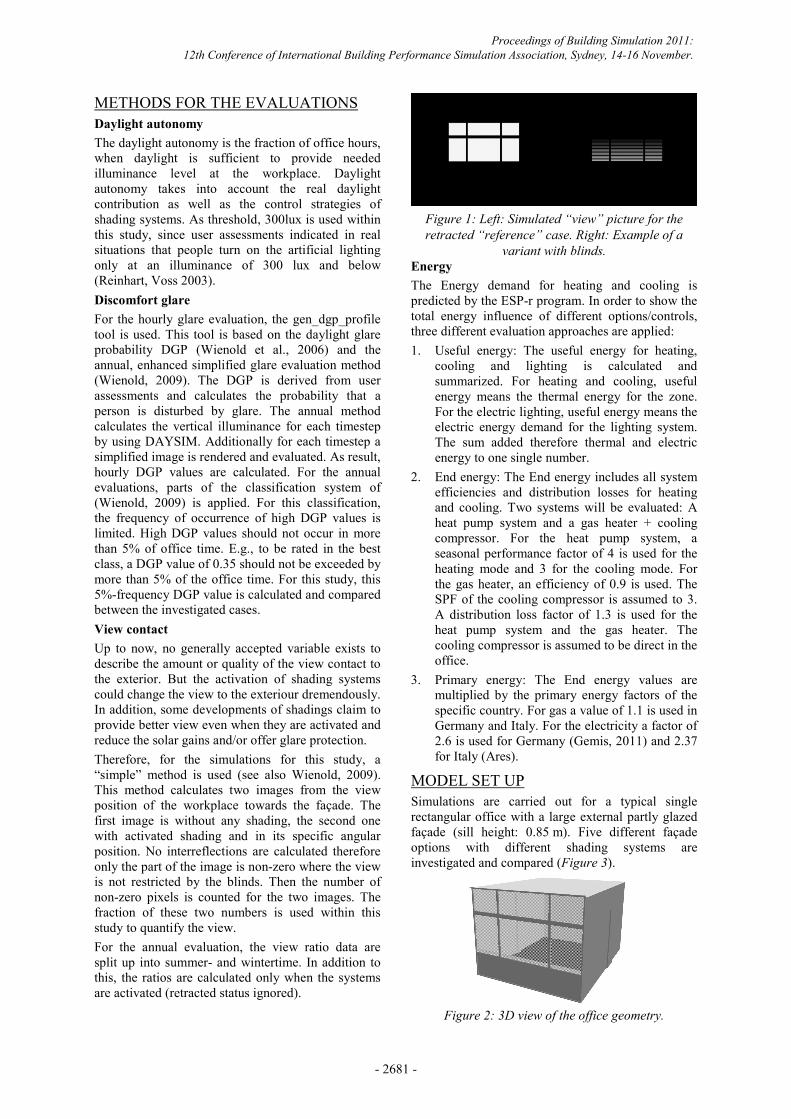
METHODS FOR THE EVALUATIONS Daylight autonomy The daylight autonomy is the fraction of office hours, when daylight is sufficient to provide needed illuminance level at the workplace. Daylight autonomy takes into account the real daylight contribution as well as the control strategies of shading systems. As threshold, 300lux is used within this study, since user assessments indicated in real situations that people turn on the artificial lighting only at an illuminance of 300 lux and below (Reinhart, Voss 2003). Discomfort glare For the hourly glare evaluation, the gen_dgp_profile tool is used. This tool is based on the daylight glare probability DGP (Wienold et al., 2006) and the annual, enhanced simplified glare evaluation method (Wienold, 2009). The DGP is derived from user assessments and calculates the probability that a person is disturbed by glare. The annual method calculates the vertical illuminance for each timestep by using DAYSIM. Additionally for each timestep a simplified image is rendered and evaluated. As result, hourly DGP values are calculated. For the annual evaluations, parts of the classification system of (Wienold, 2009) is applied. For this classification, the frequency of occurrence of high DGP values is limited. High DGP values should not occur in more than 5% of office time. E.g., to be rated in the best class, a DGP value of 0.35 should not be exceeded by more than 5% of the office time. For this study, this 5%-frequency DGP value is calculated and compared between the investigated cases. View contact Up to now, no generally accepted variable exists to describe the amount or quality of the view contact to the exterior. But the activation of shading systems could change the view to the exteriour dremendously. In addition, some developments of shadings claim to provide better view even when they are activated and reduce the solar gains and/or offer glare protection. Therefore, for the simulations for this study, a “simple” method is used (see also Wienold, 2009). This method calculates two images from the view position of the workplace towards the façade. The first image is without any shading, the second one with activated shading and in its specific angular position. No interreflections are calculated therefore only the part of the image is non-zero where the view is not restricted by the blinds. Then the number of non-zero pixels is counted for the two images. The fraction of these two numbers is used within this study to quantify the view. For the annual evaluation, the view ratio data are split up into summer- and wintertime. In addition to this, the ratios are calculated only when the systems are activated (retracted status ignored).
Figure 1: Left: Simulated “view” picture for the retracted “reference” case. Right: Example of a
variant with blinds. Energy The Energy demand for heating and cooling is predicted by the ESP-r program. In order to show the total energy influence of different options/controls, three different evaluation approaches are applied: 1. Useful energy: The useful energy for heating,
cooling and lighting is calculated and summarized. For heating and cooling, useful energy means the thermal energy for the zone. For the electric lighting, useful energy means the electric energy demand for the lighting system. The sum added therefore thermal and electric energy to one single number.
2. End energy: The End energy includes all system efficiencies and distribution losses for heating and cooling. Two systems will be evaluated: A heat pump system and a gas heater + cooling compressor. For the heat pump system, a seasonal performance factor of 4 is used for the heating mode and 3 for the cooling mode. For the gas heater, an efficiency of 0.9 is used. The SPF of the cooling compressor is assumed to 3. A distribution loss factor of 1.3 is used for the heat pump system and the gas heater. The cooling compressor is assumed to be direct in the office.
3. Primary energy: The End energy values are multiplied by the primary energy factors of the specific country. For gas a value of 1.1 is used in Germany and Italy. For the electricity a factor of 2.6 is used for Germany (Gemis, 2011) and 2.37 for Italy (Ares).
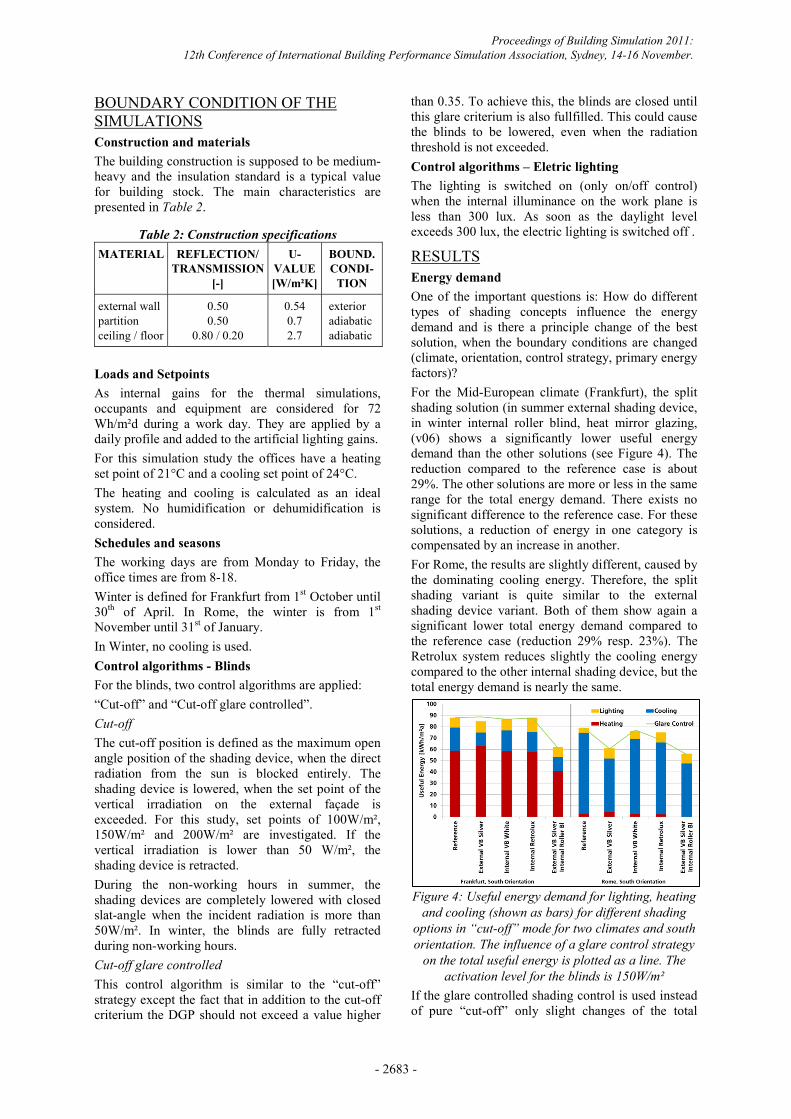
MODEL SET UP Simulations are carried out for a typical single rectangular office with a large external partly glazed façade (sill height: 0.85 m). Five different façade options with different shading systems are investigated and compared (Figure 3).
Figure 2: 3D view of the office geometry.
Proceedings of Building Simulation 2011: 12th Conference of International Building Performance Simulation Association, Sydney, 14-16 November.
- 2681 -

Table 1: Simulation Variants
Where (according to the EN 14501): • Glass C stands for Heat Control glazing
(g=0.58, τvis=0.75) • Glass D stands for Solar Control glazing
(g=0.32, τvis=0.46) VB stands for Venetian blind, White means that the total surface reflectance is 85% and Silver means that the total surface reflectance is 61%. The Retrolux system is available in different configurations. The manufacturer specifies two different variants (95% and 84% visual and solar reflectance for the upper side, which is highly specular). However the measurements of the upper side of a sample showed only 74% visual and solar reflectance. The comparison of these three different configurations is shown in Figure 12 and Figure 13. For all the other evaluations, the 84% configuration is used. The lower side is white (80% visual and 78% solar reflectance). The thermal and optical properties of the blinds are calculated with the façade models developed at Fraunhofer ISE (named “black box model” BBM) (Kuhn, 2006 and Kuhn et al,. 2011). With this model,
the g-value of the combination of glazing and shading is calculated bidirectionally as function of solar azimuth and solar height angle with a step-width of 5°. This means that a matrix of 1369 data points for every defined slat angle is used. The blind properties are calculated for slat angle-steps of 5°. This black box model is included within ESP-r (Frontini, 2009) and is used for this study in order to quantify the differences between the different systems. It enables the user to apply external control strategies for shading devices
Simulation variants In Table 1 the different configurations (regarding the external glazing Façade) are resumed. Two different Climates are considered and simulated (Freiburg and Rome) together with two different orientations: South and South-West (45° from the South). The weather file for both the Radiance and ESP-r simulation are generated with the Meteonorm program (Meteonorm, 2011).
Variant Climate Orientation Glass type Shading device Blind strategy
v01 Frankfurt, Rome S and SW
Glass-D ( solar control
glass )
- -
v02 Frankfurt, Rome S and SW Glass-C
(low-e glass) External VB Silver, 80mm Cut-Off (150W/m²)
v03 Frankfurt, Rome S and SW
Glass-D (solar control
glass)
Internal VB Silver, 50mm Cut-Off (150W/m²)
v05 Frankfurt, Rome S and SW Glass-C
(low-e glass) Internal Retrolux blind Defined by the
Manufacturer
v06 Frankfurt, Rome S and SW Glass-C
(low-e glass)
External VB Silver in Summer + Internal Rollo
Blind in Winter Cut-Off (150W/m²)
Figure 3: The five different simulated shading systems.
Proceedings of Building Simulation 2011: 12th Conference of International Building Performance Simulation Association, Sydney, 14-16 November.
- 2682 -
BOUNDARY CONDITION OF THE SIMULATIONS Construction and materials The building construction is supposed to be medium-heavy and the insulation standard is a typical value for building stock. The main characteristics are presented in Table 2.
Table 2: Construction specifications MATERIAL REFLECTION/
TRANSMISSION [-]
U-VALUE [W/m²K]
BOUND. CONDI-
TION
external wall partition ceiling / floor
0.50 0.50
0.80 / 0.20
0.54 0.7 2.7
exterior adiabatic adiabatic
Loads and Setpoints As internal gains for the thermal simulations, occupants and equipment are considered for 72 Wh/m²d during a work day. They are applied by a daily profile and added to the artificial lighting gains. For this simulation study the offices have a heating set point of 21°C and a cooling set point of 24°C. The heating and cooling is calculated as an ideal system. No humidification or dehumidification is considered. Schedules and seasons The working days are from Monday to Friday, the office times are from 8-18. Winter is defined for Frankfurt from 1st October until 30th of April. In Rome, the winter is from 1st November until 31st of January. In Winter, no cooling is used. Control algorithms - Blinds For the blinds, two control algorithms are applied: “Cut-off” and “Cut-off glare controlled”. Cut-off The cut-off position is defined as the maximum open angle position of the shading device, when the direct radiation from the sun is blocked entirely. The shading device is lowered, when the set point of the vertical irradiation on the external façade is exceeded. For this study, set points of 100W/m², 150W/m² and 200W/m² are investigated. If the vertical irradiation is lower than 50 W/m², the shading device is retracted. During the non-working hours in summer, the shading devices are completely lowered with closed slat-angle when the incident radiation is more than 50W/m². In winter, the blinds are fully retracted during non-working hours. Cut-off glare controlled This control algorithm is similar to the “cut-off” strategy except the fact that in addition to the cut-off criterium the DGP should not exceed a value higher
than 0.35. To achieve this, the blinds are closed until this glare criterium is also fullfilled. This could cause the blinds to be lowered, even when the radiation threshold is not exceeded. Control algorithms – Eletric lighting The lighting is switched on (only on/off control) when the internal illuminance on the work plane is less than 300 lux. As soon as the daylight level exceeds 300 lux, the electric lighting is switched off .
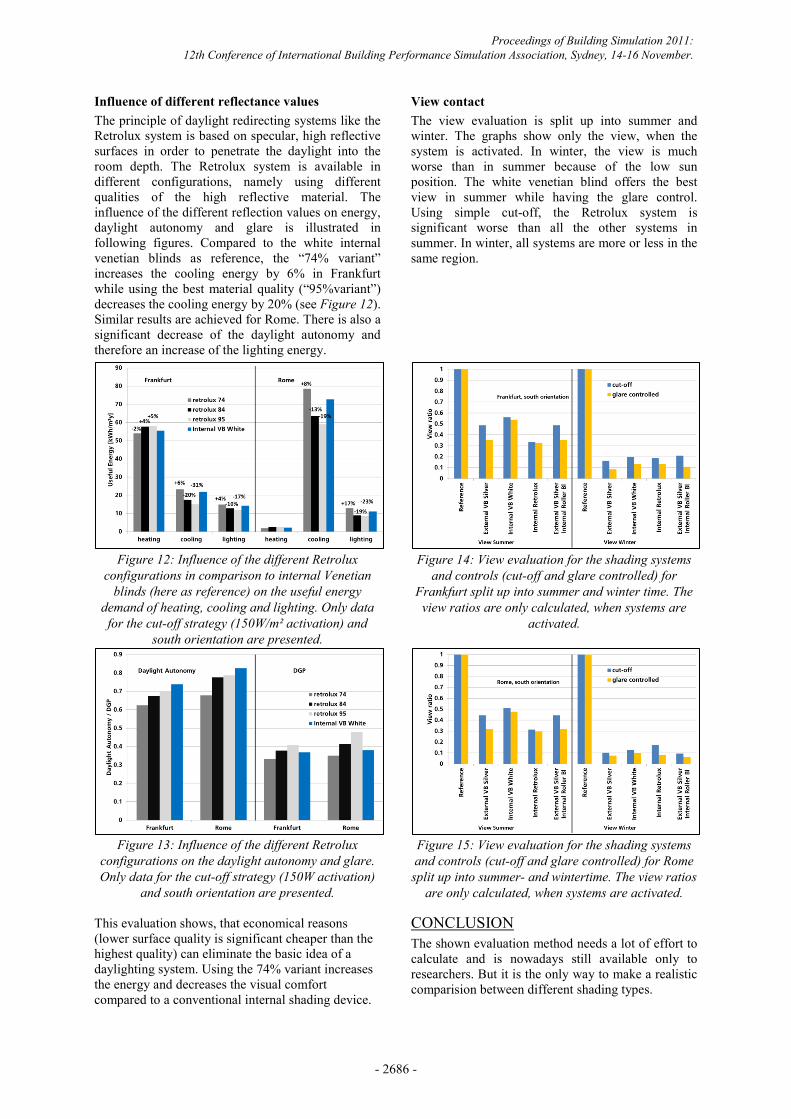
RESULTS Energy demand One of the important questions is: How do different types of shading concepts influence the energy demand and is there a principle change of the best solution, when the boundary conditions are changed (climate, orientation, control strategy, primary energy factors)? For the Mid-European climate (Frankfurt), the split shading solution (in summer external shading device, in winter internal roller blind, heat mirror glazing, (v06) shows a significantly lower useful energy demand than the other solutions (see Figure 4). The reduction compared to the reference case is about 29%. The other solutions are more or less in the same range for the total energy demand. There exists no significant difference to the reference case. For these solutions, a reduction of energy in one category is compensated by an increase in another. For Rome, the results are slightly different, caused by the dominating cooling energy. Therefore, the split shading variant is quite similar to the external shading device variant. Both of them show again a significant lower total energy demand compared to the reference case (reduction 29% resp. 23%). The Retrolux system reduces slightly the cooling energy compared to the other internal shading device, but the total energy demand is nearly the same.
Figure 4: Useful energy demand for lighting, heating
and cooling (shown as bars) for different shading options in “cut-off” mode for two climates and south orientation. The influence of a glare control strategy
on the total useful energy is plotted as a line. The activation level for the blinds is 150W/m²
If the glare controlled shading control is used instead of pure “cut-off” only slight changes of the total
Proceedings of Building Simulation 2011: 12th Conference of International Building Performance Simulation Association, Sydney, 14-16 November.
- 2683 -

energy demand occur (see green line in Figure 4). From this it can be concluded, that the investigated systems are robust regarding user interactions, if the user likes to close the blinds more than cut-off in order to prevent daylight glare. Influence of activation levels and orientation Different activation levels up to 200 W/m² do not influence the energy demand for both investigated climates (Figure 5).
Figure 5: Useful energy demand for lighting, heating
and cooling (shown as bars, activation level: 150W/m²) for different shadings in “cut-off” mode
for two climates and south orientation. The two lines display the total energy demand for different activation levels (100W/m² and 200W/m²).
Influence on heating system and primary energy In the following figure and table, the influence of the different shading options on end and primary energy is illustrated for the two selected heating/cooling systems and south orientation. The data show clearly that for those two selected heating/cooling systems, the general “ranking” of the shading and the general statements do not change compared to the useful energy. That means e.g. for Frankfurt, the split system is best compared to the other solutions, regardless which energy evaluation method is used. The other systems are more or less at the same level (see Table 3 and Table 4). Table 3: Influence on End Energy, control=cut-off, 150W/m² activation level (all values in kWh/m²a). Influence of south-west orientation
If the orientation is south-west instead of south, in general an increase of the energy demand can be seen for all variants. Besides this, no change of “ranking” of the systems can be noticed, that means that the systems behave similar regarding energy demand at least for those two orientations.
Figure 6: Useful energy demand for lighting, heating
and cooling (shown as bars activation level: 150W/m²) for different shadings in “cut-off” mode
for south and south-west orientation for Frankfurt. In addition to this, the influence of a glare control
strategy on the total useful energy is plotted as line.
Figure 7: Useful and end energy demand for lighting, heating and cooling for different shading options in
“cut-off” mode (activation level: 150W/m²).
RE
FER
EN
CE
EX
TE
RN
AL
VB
SI
LV
ER
INT
ER
NA
L V
B
WH
ITE
INT
ER
NA
L
RE
TR
OL
UX
EX
TE
RN
AL
VB
SI
ILV
ER
IN
TE
RN
AL
R
OL
LE
R B
LIN
D
FRANKFURT SOUTH
Useful Energy 88 85 87 88 62 End Energy HP 37 36 37 39 28 End Energy Gas 102 106 102 104 73
ROME SOUTH
Useful Energy 79 61 76 75 56 End Energy HP 37 31 37 37 29 End Energy Gas 40 36 40 40 29
Proceedings of Building Simulation 2011: 12th Conference of International Building Performance Simulation Association, Sydney, 14-16 November.
- 2684 -

Daylight autonomy The daylight autonomy has an impact on both, energy demand and visual comfort, at the same time. Therefore, it is obvious that a façade system should provide high daylight autonomy. Comparing the Blind systems, the split system is again the best solution and shows even higher daylight autonomy for 150 and 200 W/m² activation level than the solar control glazing without any shading (reference). The external shading and the white internal shading device are more or less at the same level whereas the Retrolux system shows significant lower daylight values. This is because the distance between the slats is much smaller than for all other investigated systems. An increase of the switching level leads to an increase of the daylight autonomy.
Figure 8 and Figure 9: The daylight autonomy for
the shading systems, controls (cut-off and glare controlled) and different activation levels for
Frankfurt (upper figure) and Rom (lower figure).
Daylight glare Shading devices claim to serve for both, solar control and glare protection at the same time. Figure 10 and Figure 11 show that the cut-off strategy may not offer enough glare protection, since the 95% occurrence value is higher than the proposed limit (Wienold, 2009) of the lowest glare protection category (this DGP limit is 0.45). Applying the glare controlled strategy, the best glare category (95% value below 0.35) can be achieved by all systems. The influence of glare controlled strategy on energy (Figure 4 ff) and on daylight autonomy (Figure 8 f) is small, since all shadings have high reflectance properties. Additionally, compared to the cut-off strategy, the slat angles of the devices are only slightly more closed and provide enough daylight.
Figure 10 and Figure 11: Glare evaluation for the shading systems, control and different activation
levels for Frankfurt and Rome. Displayed is the 95% occurrence DGP for the annual office time.
Table 4: Influence on Primary Energy, control=cut-off, 150W/m² activation level (all values in kWh/m²a)
RE
FER
EN
CE
EX
TE
RN
AL
V
B S
ILV
ER
INT
ER
NA
L V
B
WH
ITE
INT
ER
NA
L
RE
TR
OL
UX
EX
TE
RN
AL
V
B S
IIL
VE
R
INT
ER
NA
L
RO
LL
ER
B
LIN
D
FRANKFURT SOUTH
Useful Energy 88 85 87 88 62 Primary Energy HP 96 93 97 102 72 Primary Energy Gas 37 36 37 39 28
ROME SOUTH
Useful Energy 79 61 76 75 56 Primary Energy HP 87 74 87 88 69 Primary Energy Gas 97 84 97 99 76
Proceedings of Building Simulation 2011: 12th Conference of International Building Performance Simulation Association, Sydney, 14-16 November.
- 2685 -
Influence of different reflectance values The principle of daylight redirecting systems like the Retrolux system is based on specular, high reflective surfaces in order to penetrate the daylight into the room depth. The Retrolux system is available in different configurations, namely using different qualities of the high reflective material. The influence of the different reflection values on energy, daylight autonomy and glare is illustrated in following figures. Compared to the white internal venetian blinds as reference, the “74% variant” increases the cooling energy by 6% in Frankfurt while using the best material quality (“95%variant”) decreases the cooling energy by 20% (see Figure 12). Similar results are achieved for Rome. There is also a significant decrease of the daylight autonomy and therefore an increase of the lighting energy.
Figure 12: Influence of the different Retrolux
configurations in comparison to internal Venetian blinds (here as reference) on the useful energy
demand of heating, cooling and lighting. Only data for the cut-off strategy (150W/m² activation) and
south orientation are presented.
Figure 13: Influence of the different Retrolux
configurations on the daylight autonomy and glare. Only data for the cut-off strategy (150W activation)
and south orientation are presented. This evaluation shows, that economical reasons (lower surface quality is significant cheaper than the highest quality) can eliminate the basic idea of a daylighting system. Using the 74% variant increases the energy and decreases the visual comfort compared to a conventional internal shading device.
View contact The view evaluation is split up into summer and winter. The graphs show only the view, when the system is activated. In winter, the view is much worse than in summer because of the low sun position. The white venetian blind offers the best view in summer while having the glare control. Using simple cut-off, the Retrolux system is significant worse than all the other systems in summer. In winter, all systems are more or less in the same region.
Figure 14: View evaluation for the shading systems
and controls (cut-off and glare controlled) for Frankfurt split up into summer and winter time. The view ratios are only calculated, when systems are
activated.
Figure 15: View evaluation for the shading systems and controls (cut-off and glare controlled) for Rome split up into summer- and wintertime. The view ratios
are only calculated, when systems are activated.
CONCLUSION The shown evaluation method needs a lot of effort to calculate and is nowadays still available only to researchers. But it is the only way to make a realistic comparision between different shading types.
Proceedings of Building Simulation 2011: 12th Conference of International Building Performance Simulation Association, Sydney, 14-16 November.
- 2686 -

Shading systems often claim to own special features, but this evaluation shows, that the influence on the total energy demand is only small, when the system is mounted inside. Outside mounted systems offer in all investigated cases best solar protection. The visual comfort (glare and view) is mainly influenced by the control strategy of the blinds. Glare based control strategies have only a minor impact on the lighting energy and daylight automony. A better view evaluation method is needed, since the applied method does not take into account, that view to the horizontal or downwards may be more relevant than to the sky. For such a development, user assessments are necessary. Special daylight redirecting systems can improve energy demand compared to other internal mounted systems, but only if highly reflective material is used. Worse material properties are contraproductive and the advantage can completely disappear. But even if the 95% reflectivity material is used for Retrolux, it cannot reach the performance of an external mounted shading device – which should be the first choice for achieving high comfort sustainable buildings.
REFERENCES Ares, Agenzia Regionale per l’Edilizia Sostenibile,
http://www.aresfvg.it/index.php?q=en/node/95 Afnor, EN ISO 15099: thermal performance of
windows, doors and shading devices – detailed calculations; 2003.
Clarke, J. Energy Simulation in Buiding Design, second ed., Butterworth-Heinemann, 2001.
David M., Donn M., Garde F., Lenoir A., Assessment of the thermal and visual efficiency of solar shades, Building and Environment, 46 (7), 2011, pp 1489-1496
Florides G. A., et.al., Modeling of the modern houses of Cyprus and energy consumption analysis, Energy 25 (10), 2000, 915–937
Frontini, F. Kuhn, T.E., Herkel, S., Strachan, P. Kokogiannakis, G.,Proceedings International Building Simulation Conference (2009), Glasgow
Gemis, Global Emission Modell for Integrated Systems (GEMIS), 2011,
http://www.oeko.de/service/gemis/en/index.htm Hien W. N., et.al., Effects of double glazed facade on
energy consumption, thermal comfort and condensation for a typical office building in Singapore, Energy and Buildings, 37 (6), 2005, pp. 563–572.
Kuhn T.E., Herkel S., Frontini F., Strachan P., Kokogiannakis G., Solar control: A general method for modelling of solar gains through complex facades in building simulation programs, Energy and Buildings, 43 (1), (2011)
Kuhn T. E., Solar control: Comparsion of two new systems with the state of the art on the basis of a new general evaluation method for facades with venetian blindsnext term or other solar control systems, Energy and Buildings, 38 (6), 2006
Kuhn T. E., C. Bühler and W.J. Platzer, Evaluation of overheating protection with Sun-shading systems, Solar Energy, 69 (Supplement 6), 2001
Li D.H.W., Tsang E.K.W., An analysis of daylighting performance for office buildings in Hong Kong, Building and Environment 43 (9), 2008, pp. 1446–1458
Meteonorm, http://www.meteonorm.com, 2011 Nielsen M. V., Svendsen S., Jensen L. B.,
Quantifying the potential of automated dynamic solar shading in office buildings through integrated simulations of energy and daylight, Solar Energy, 85 (5), 2011, pp 757-768
Reinhart, C.F. and Walkenhorst, O., Validation of dynamic RADIANCE-based daylight simulations for a test office with external blinds. Energy & Buildings, 33 (7), (2001), 683-697.
Reinhart, C. F., Voss, K., Monitoring Manual Control of Electric Lighting and Blinds, Lighting Research and Technology, 35(3), (2003)
Schregle, R., Daylight Simulation with Photon Maps, Dissertation University of Saarbrücken, 2005
Simmler H., Binder B., Experimental and numerical determination of the total solar energy transmittance of glazing with venetian blind shading, Building and Environment, 43 (2), 2008, 197–204
Tzempelikosa A., Bessoudo M., Athienitis A.K., Zmeureanu R., Indoor thermal environmental conditions near glazed facades with shading devices – Part II: Thermal comfort simulation and impact of glazing and shading properties, Building and Environment, 45 (11), 2010, pp 2517-252
Tzempelikos A., Athienitis A.K., The impact of shading design and control on building cooling and lighting demand, Solar Energy, 81 (3), 2007, pp 369-382
Wienold, J., Evalglare: a new RADIANCE-based tool to evaluate glare in office spaces, 3rd International Radiance Workshop, (2004)
Wienold, J., Christoffersen, J., Towards a new daylight glare rating, LuxEuropa, (2005)
Wienold J., Dynamic daylight glare evaluation, Proceedings Building Simulation (2009a), Glasgow
Wienold J., Daylight glare in offices, Dissertation, Universität Karlsruhe, (2009)
Proceedings of Building Simulation 2011: 12th Conference of International Building Performance Simulation Association, Sydney, 14-16 November.
- 2687 -