climate change effects on agriculture in the midwest
TRANSCRIPT
Strategies for Adaptation and Mitigation

Jerry L. HatfieldLaboratory Director National Laboratory for Agriculture and the
EnvironmentDirector, Midwest Climate Hub2110 University BlvdAmes, Iowa 50011515-294-5723515-294-8125 (fax)[email protected]
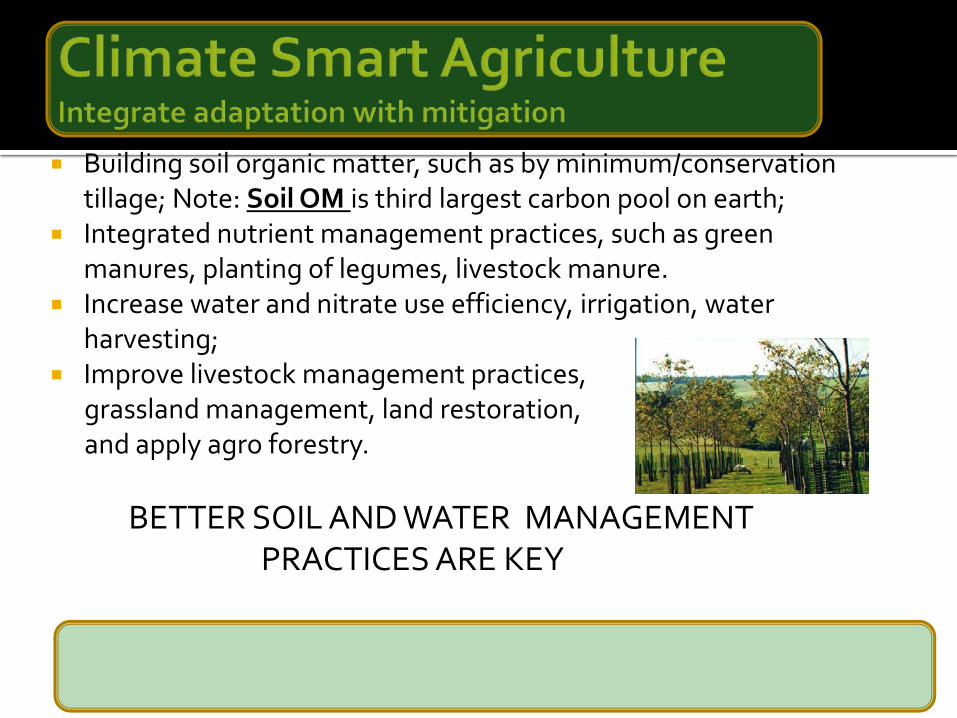
Building soil organic matter, such as by minimum/conservation tillage; Note: Soil OM is third largest carbon pool on earth;
Integrated nutrient management practices, such as green manures, planting of legumes, livestock manure.
Increase water and nitrate use efficiency, irrigation, water harvesting;
Improve livestock management practices, grassland management, land restoration,and apply agro forestry.
BETTER SOIL AND WATER MANAGEMENT PRACTICES ARE KEY

Inputs Temperature Precipitation Solar radiation Carbon dioxide
DirectGrowthPhenologyYield
IndirectInsectsDiseases Weeds
Soil is the underlying factor as a resource for nutrients and water
Climate disruptions have increased in past 40 years and projected to increase over the next 25 years. By mid-century and beyond, these impacts will be increasingly negative on most crops and livestock.
Many agricultural regions will experience declines in crop and livestock production from increased stress due to weeds, diseases, insect pests, and other climate change induced stresses.
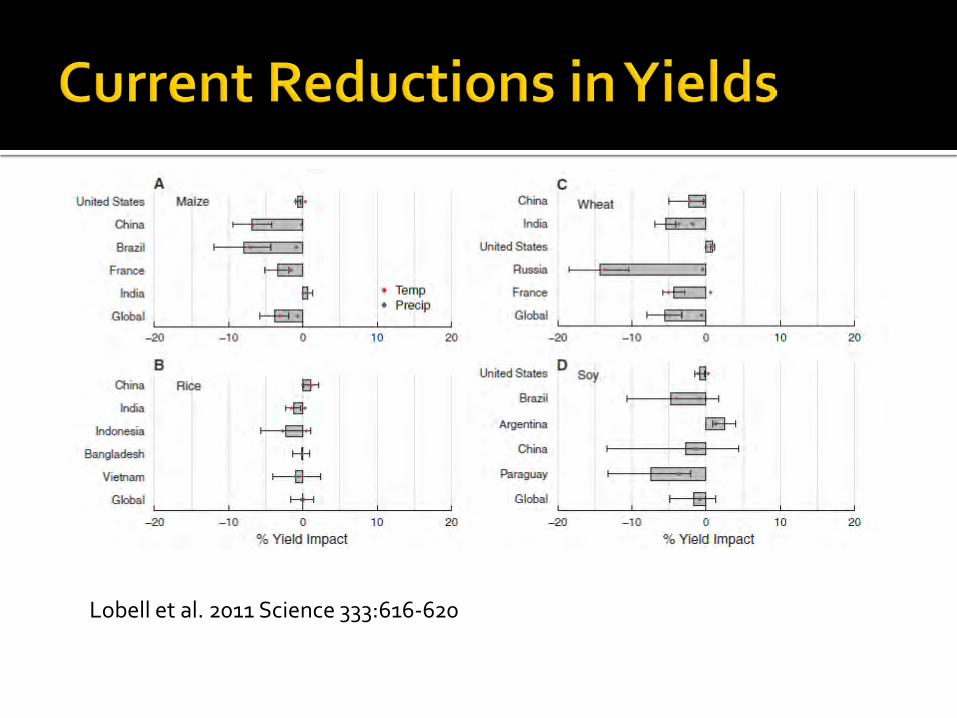
Lobell et al. 2011 Science 333:616-620
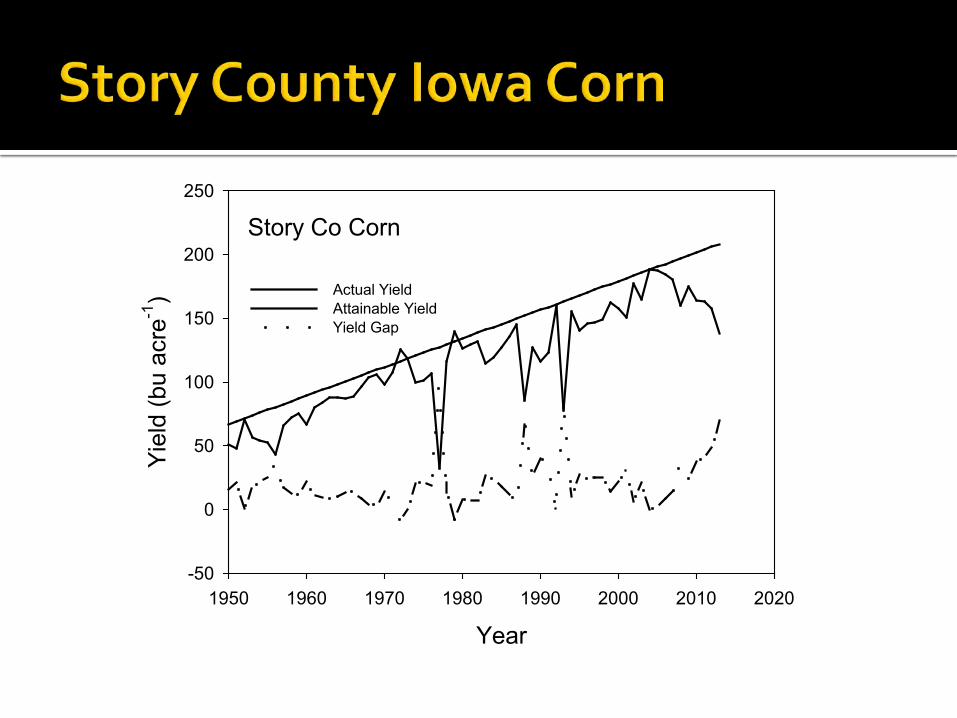
Story Co Corn
Year1950 1960 1970 1980 1990 2000 2010 2020
Yiel
d (b
u ac
re-1
)
-50
0
50
100
150
200
250
Actual Yield Attainable Yield Yield Gap

Christian Co Corn
Year1950 1960 1970 1980 1990 2000 2010 2020
Yiel
d (b
u ac
re-1
)
-50
0
50
100
150
200
250
Actual Yield Attainable YieldYield Gap
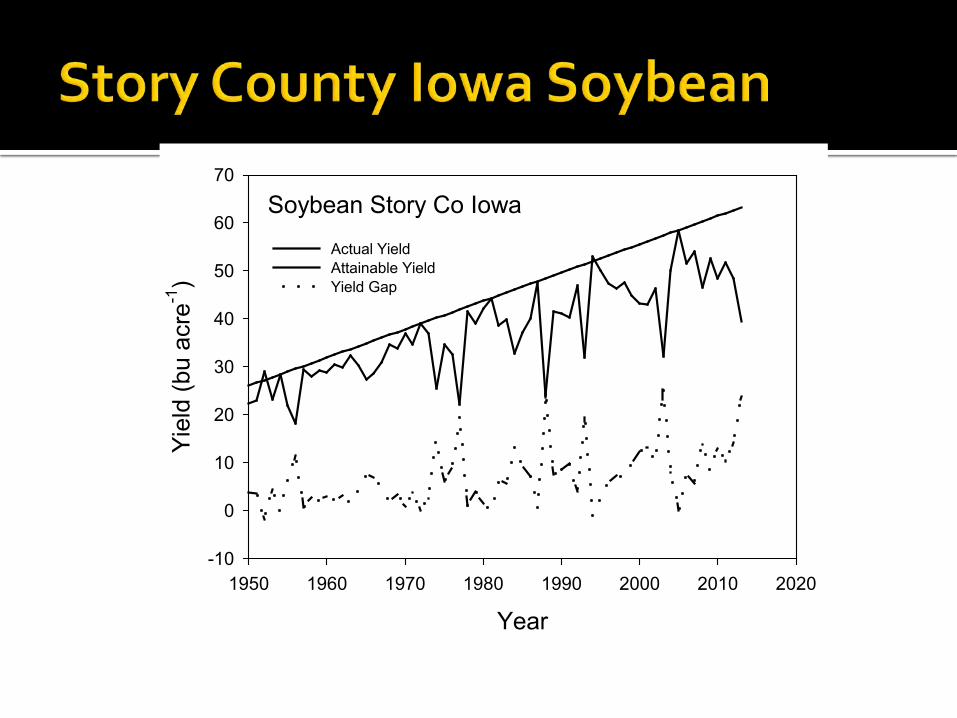
Soybean Story Co Iowa
Year1950 1960 1970 1980 1990 2000 2010 2020
Yiel
d (b
u ac
re-1
)
-10
0
10
20
30
40
50
60
70
Actual Yield Attainable Yield Yield Gap
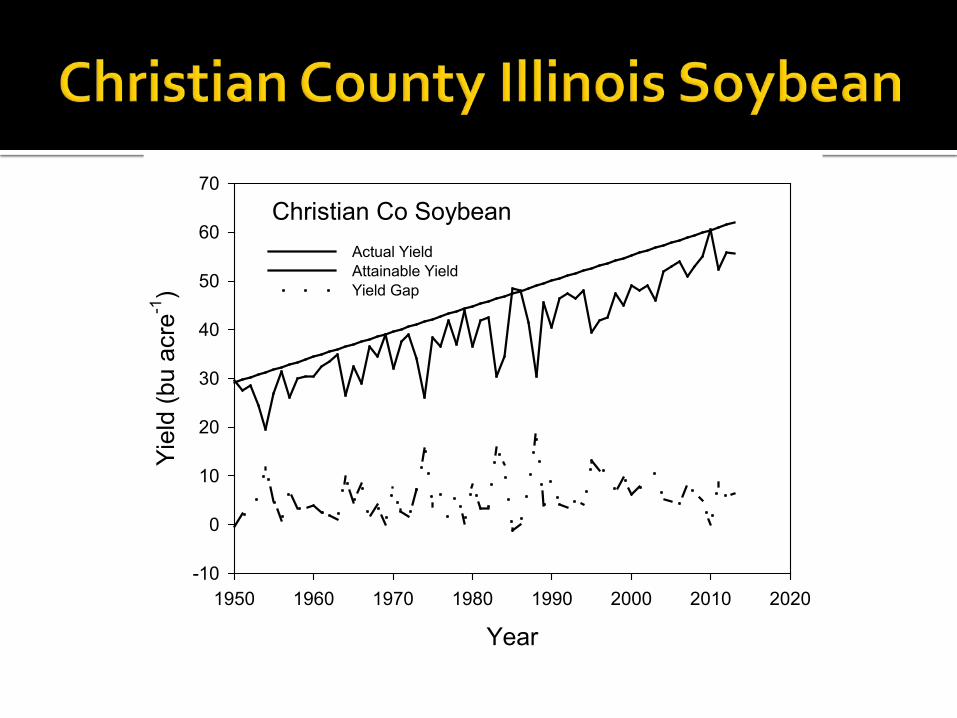
Christian Co Soybean
Year1950 1960 1970 1980 1990 2000 2010 2020
Yiel
d (b
u ac
re-1
)
-10
0
10
20
30
40
50
60
70
Actual Yield Attainable Yield Yield Gap

Iowa Maize Story County
Year1950 1960 1970 1980 1990 2000 2010 2020
Yiel
d (k
g ha
-1)
-2000
0
2000
4000
6000
8000
10000
12000
14000
Attainable YieldActual YieldYield Gap
Iowa Maize Story County
Fraction of Attainable Yield0.0 0.2 0.4 0.6 0.8 1.0
Cum
ulat
ive
Freq
uenc
y
0.0
0.2
0.4
0.6
0.8
1.0

Corn Hybrid RX730
Days after Planting0 20 40 60 80 100 120
Tota
l Col
lars
0
5
10
15
20
25
Normal TemperaturesWarm Temperatures
Corn Hybrid DK 61-72
Days after Planting0 20 40 60 80 100 120
Tota
l Col
lars
0
5
10
15
20
25
Normal TemperaturesWarm Temperatures
Corn Hybrid XL45A
Days after Planting0 20 40 60 80 100 120
Tota
l Col
lars
0
5
10
15
20
25
Normal TemperaturesWarm Temperatures
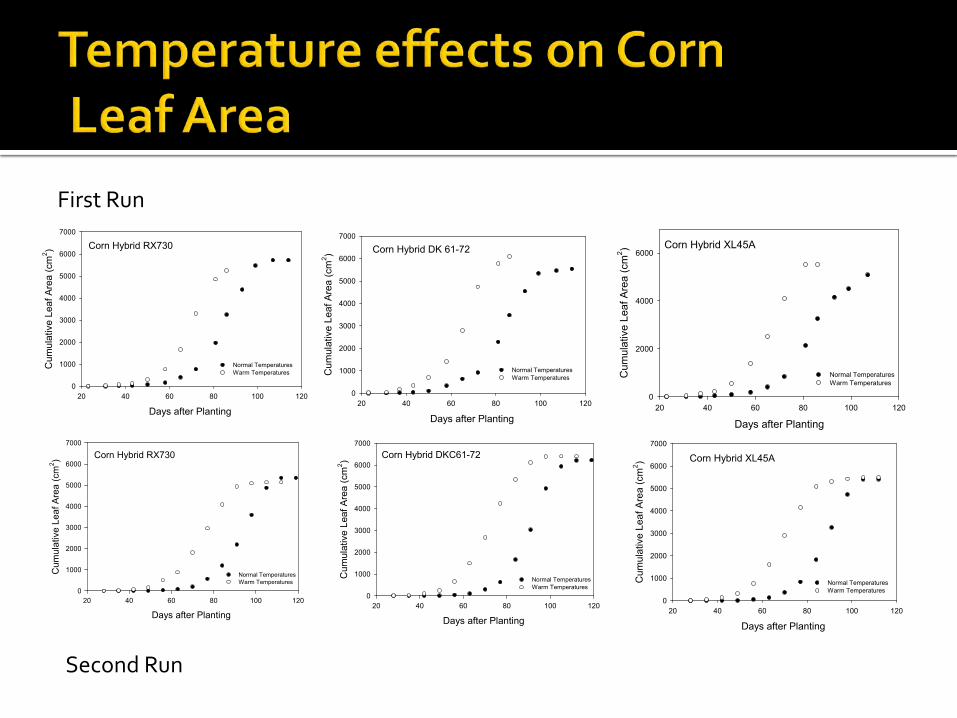
Rhizotron study with warm chamber 4C warmer than normal chamber with simulation of Ames IA temperature patterns.
2139 13700 0 7323 2168 12962 kg ha-1

Corn Hybrid RX730
Days after Planting20 40 60 80 100 120 140
Tota
l Col
lars
0
5
10
15
20
25
Normal Temperatures Warm Temperatures
Corn Hybrid DKC61-72
Days after Planting20 40 60 80 100 120
Tota
l Col
lars
0
5
10
15
20
25
Normal Temperatures Warm Temperatures
Corn Hybrid XL45A
Days after Planting 20 40 60 80 100 120
Tota
l Col
lars
0
5
10
15
20
25
Normal Temperatures Warm Temperatures
Rhizotron study with warm chamber 4C warmer than normal chamber with simulation of Ames IA temperature patterns.
599 4711 342 3053 0 4197 kg ha-1
Corn Hybrid RX730
Days after Planting 20 40 60 80 100 120
Cum
ulat
ive
Leaf
Are
a (c
m2 )
0
1000
2000
3000
4000
5000
6000
7000
Normal TemperaturesWarm Temperatures
Corn Hybrid DK 61-72
Days after Planting 20 40 60 80 100 120
Cum
ulat
ive
Leaf
Are
a (c
m2 )
0
1000
2000
3000
4000
5000
6000
7000
Normal Temperatures Warm Temperatures
Corn Hybrid XL45A
Days after Planting20 40 60 80 100 120
Cum
ulat
ive
Leaf
Are
a (c
m2 )
0
2000
4000
6000
Normal Temperatures Warm Temperatures
Corn Hybrid DKC61-72
Days after Planting 20 40 60 80 100 120
Cum
ulat
ive
Leaf
Are
a (c
m2 )
0
1000
2000
3000
4000
5000
6000
7000
Normal Temperatures Warm Temperatures
Corn Hybrid XL45A
Days after Planting 20 40 60 80 100 120
Cum
ulat
ive
Leaf
Are
a (c
m2 )
0
1000
2000
3000
4000
5000
6000
7000
Normal Temperatures Warm Temperatures
Corn Hybrid RX730
Days after Planting 20 40 60 80 100 120
Cum
ulat
ive
Leaf
Are
a (c
m2 )
0
1000
2000
3000
4000
5000
6000
7000
Normal TemperaturesWarm Temperatures
First Run
Second Run
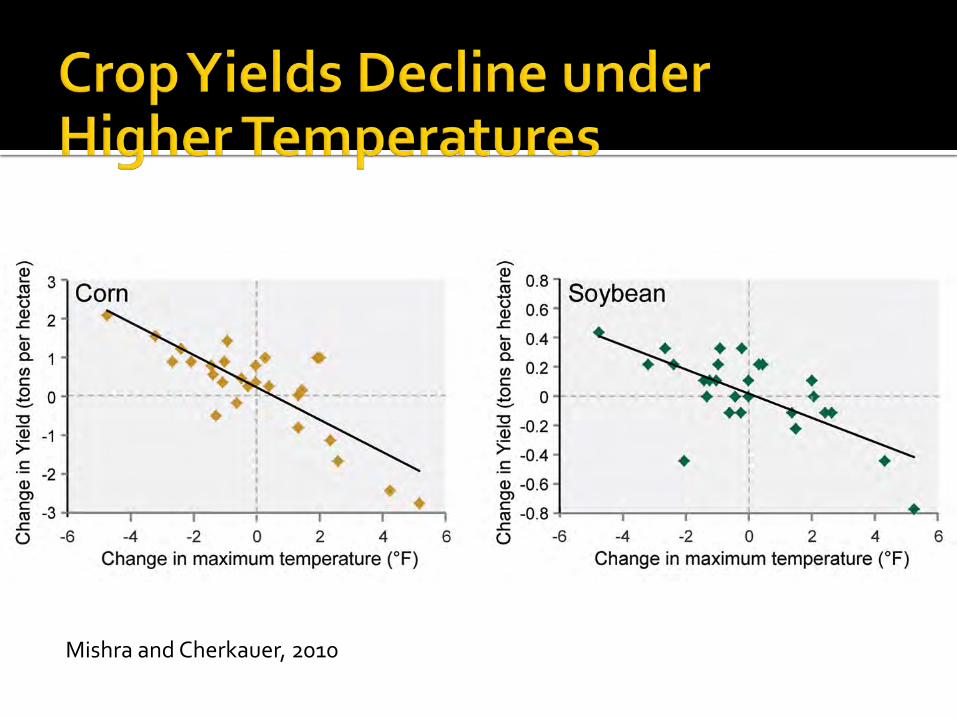
Mishra and Cherkauer, 2010

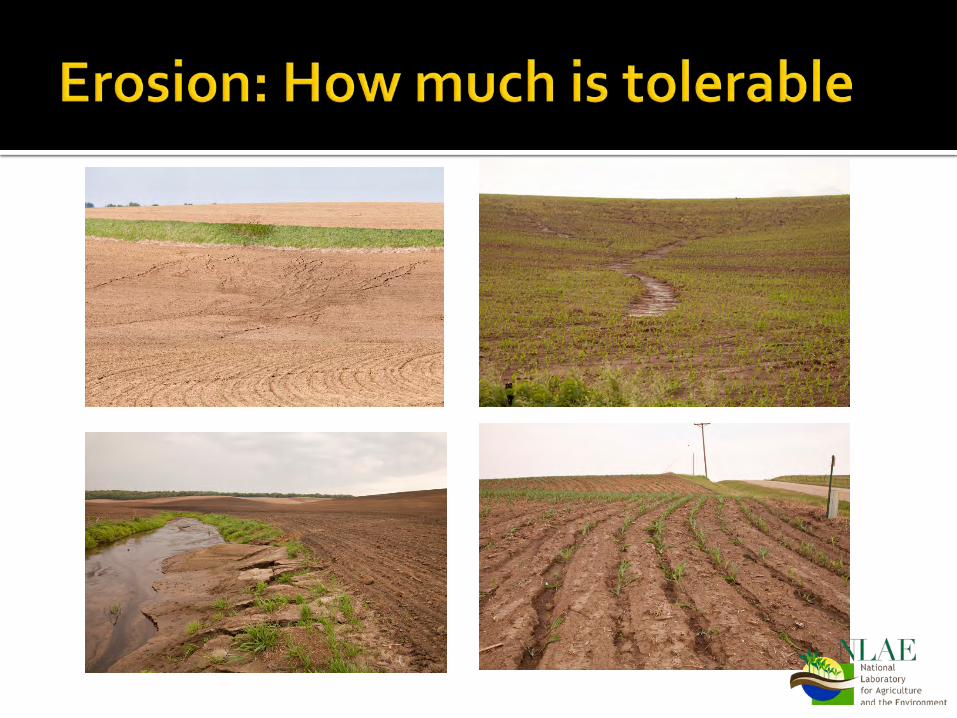
Current loss and degradation of critical soil and water assets due to increasing extremes in precipitation will continue to challenge both rainfed and irrigated agriculture unless innovative conservation methods are implemented
The rising incidence of weather extremes will have increasingly negative impacts on crop and livestock productivity because critical thresholds are already being exceeded
Mean NCCPI
0.2 0.3 0.4 0.5 0.6 0.7 0.8 0.9 1.0
Cou
nty
Yiel
d (g
m-2
)
180
200
220
240
260
280
300
320
340
KentuckyIowaNebraska
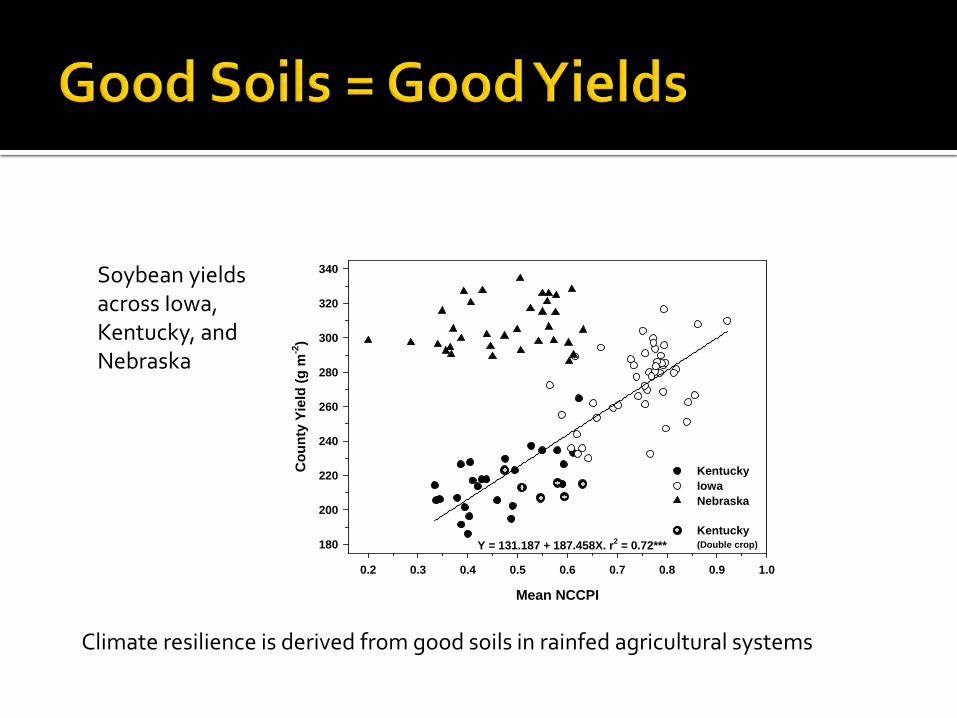
Kentucky(Double crop)Y = 131.187 + 187.458X. r2 = 0.72***
Soybean yields across Iowa, Kentucky, and Nebraska
Climate resilience is derived from good soils in rainfed agricultural systems
NCCPI-AG
0.4 0.6 0.8 1.0
Mea
n C
ount
y Yi
eld
(g m
-2)
500
600
700
800
900
1000
KentuckyIowa
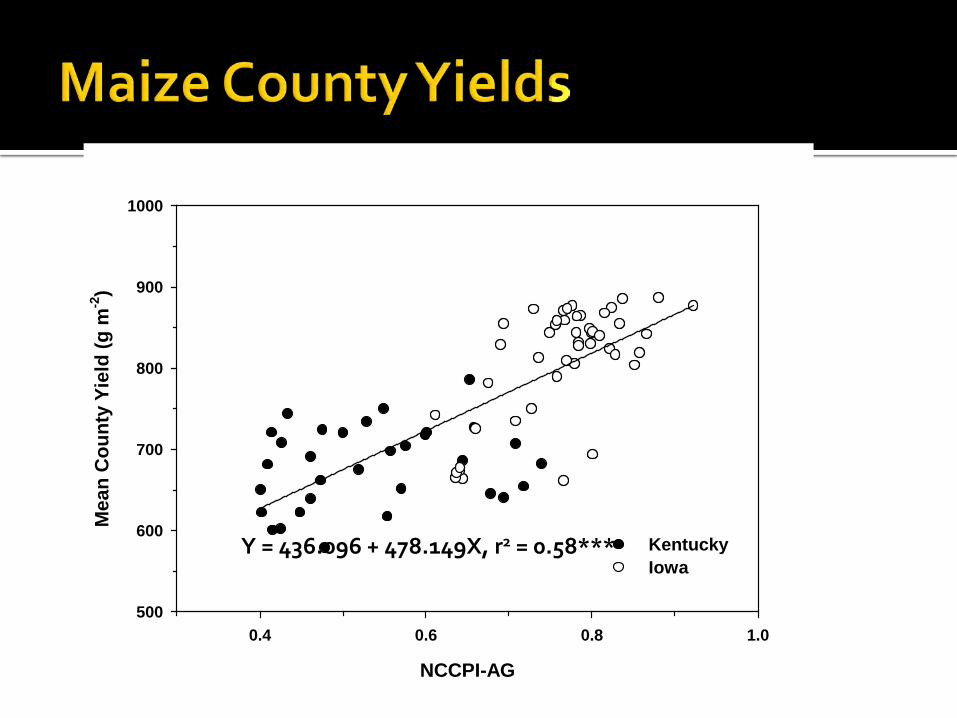
Y = 436.096 + 478.149X, r2 = 0.58***
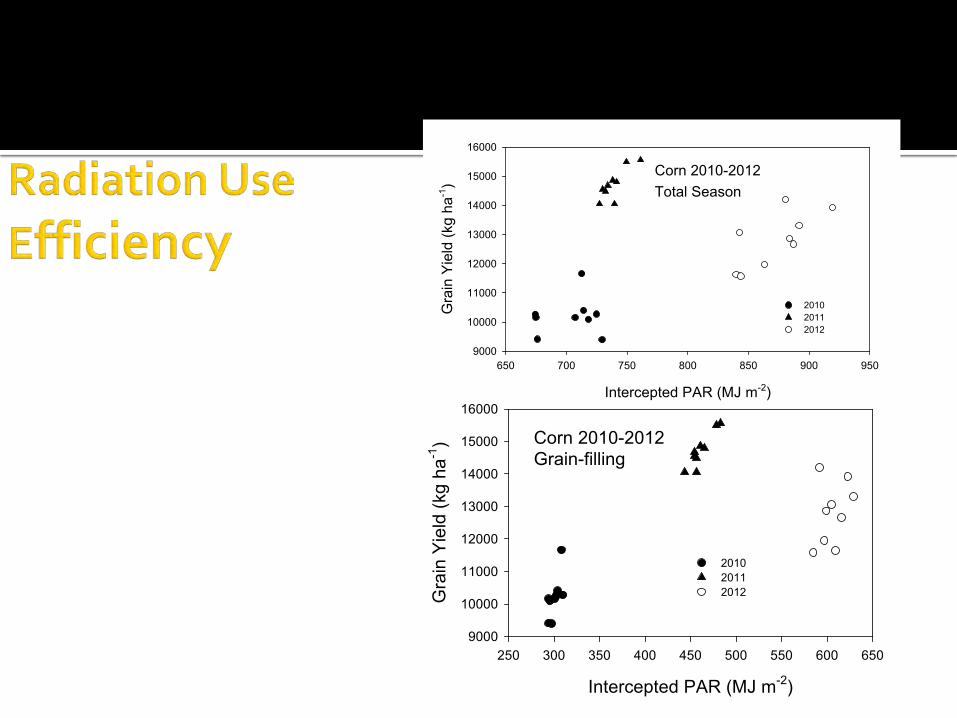
Corn 2010-2012Total Season
Intercepted PAR (MJ m-2)
650 700 750 800 850 900 950
Gra
in Y
ield
(kg
ha-1
)
9000
10000
11000
12000
13000
14000
15000
16000
201020112012
Corn 2010-2012Grain-filling
Intercepted PAR (MJ m-2)
250 300 350 400 450 500 550 600 650
Gra
in Y
ield
(kg
ha-1
)
9000
10000
11000
12000
13000
14000
15000
16000
201020112012
Agriculture has been able to adapt to recent changes in climate; however, increased innovation will be needed over the next 25 years.
Climate change effects on agriculture will have consequences for food security, both in the US and globally, through changes in crop yields and food prices and effects on food processing, storage, transportation, and retailing.


20092010
2011
2012
2013
0
2
4
6
8
10
12
14
16
18
20
0 5 10 15 20
July
-Aug
ust
Pre
cipi
tati
on (i
n)
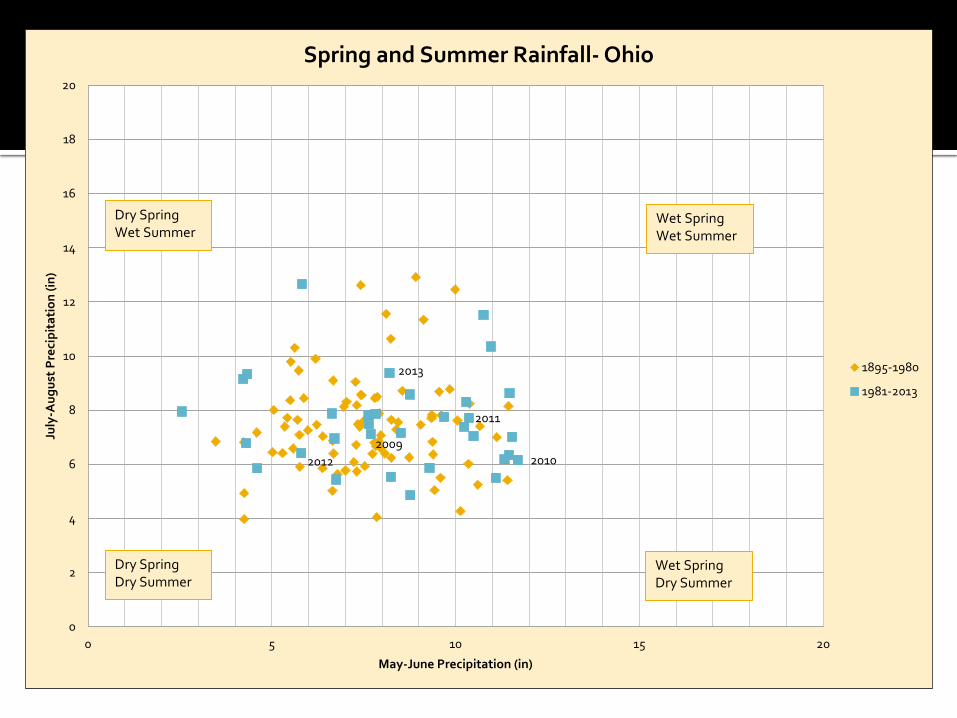
May-June Precipitation (in)
Spring and Summer Rainfall- Ohio
1895-1980
1981-2013
Dry SpringWet Summer
Wet SpringWet Summer
Dry SpringDry Summer
Wet SpringDry Summer

20082010
2011
2012 2013
0
5
10
15
20
0 5 10 15 20
July
-Aug
ust
Pre
cipi
tati
on (i
n)
May-June Precipitation (in)
Spring and Summer Rainfall- Illinois
1895-1980
1981-2013
Dry SpringWet Summer
Wet SpringWet Summer
Dry SpringDry Summer
Wet SpringDry Summer
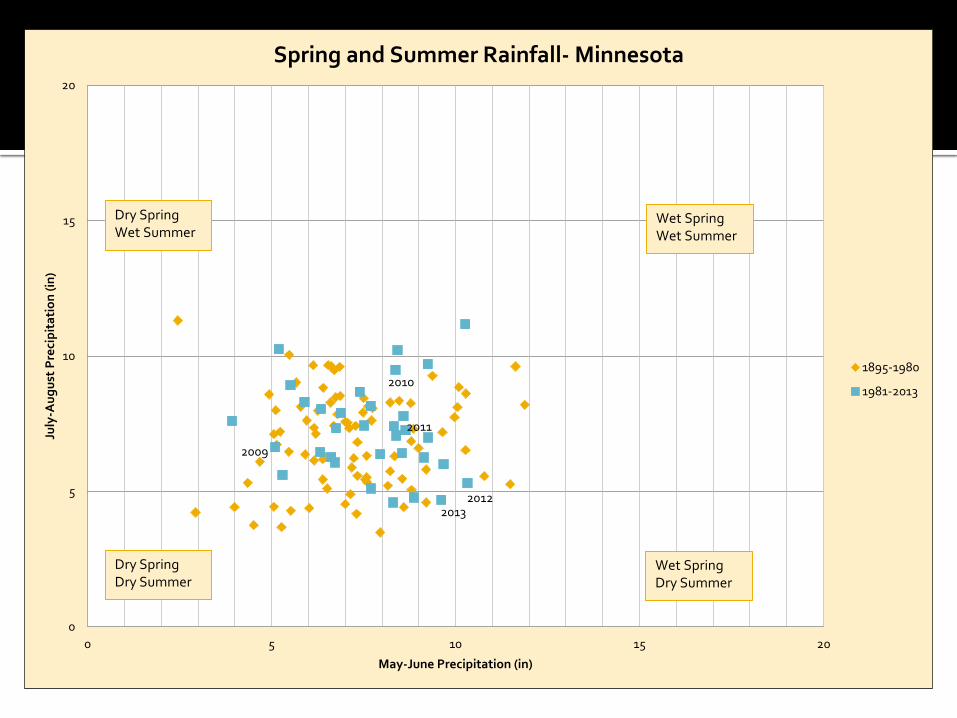
2009
2010
2011
20122013
0
5
10
15
20
0 5 10 15 20
July
-Aug
ust
Pre
cipi
tati
on (i
n)
May-June Precipitation (in)
Spring and Summer Rainfall- Minnesota
1895-1980
1981-2013
Dry SpringWet Summer
Wet SpringWet Summer
Dry SpringDry Summer
Wet SpringDry Summer
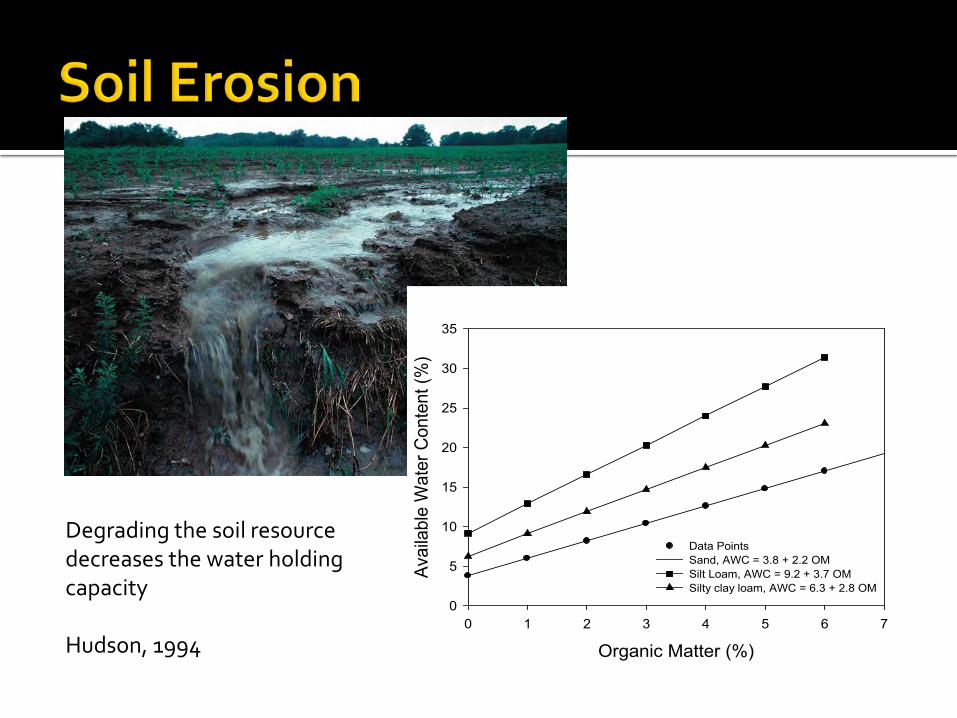
Organic Matter (%)0 1 2 3 4 5 6 7
Avai
labl
e W
ater
Con
tent
(%)
0
5
10
15
20
25
30
35
Data Points Sand, AWC = 3.8 + 2.2 OMSilt Loam, AWC = 9.2 + 3.7 OMSilty clay loam, AWC = 6.3 + 2.8 OM
Degrading the soil resource decreases the water holding capacity
Hudson, 1994
0
5
10
15
20
25
30
35
40
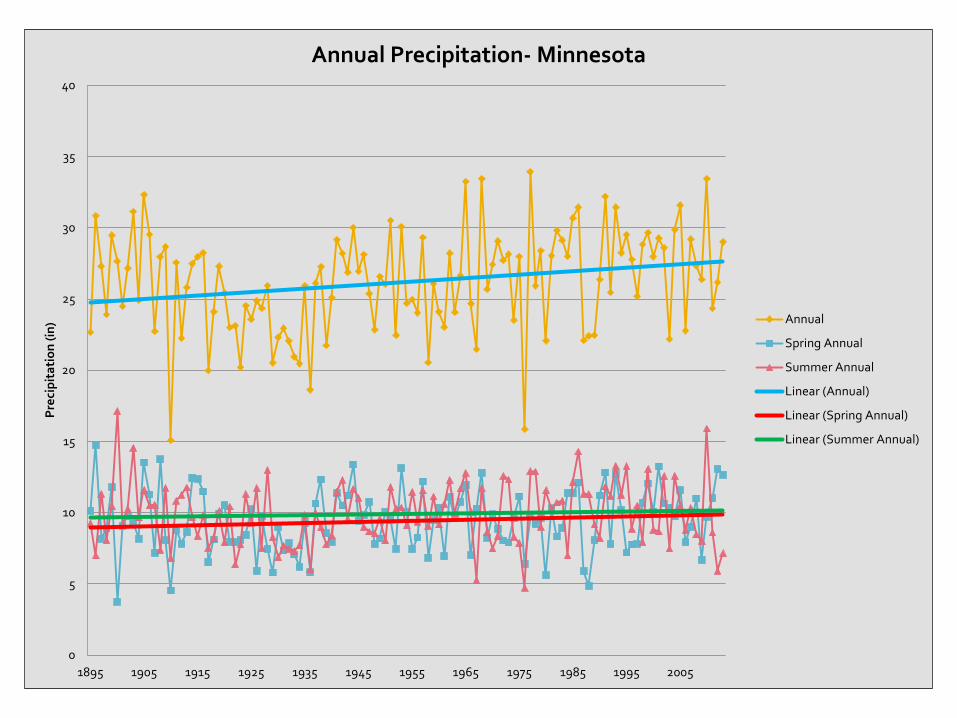
1895 1905 1915 1925 1935 1945 1955 1965 1975 1985 1995 2005
Pre
cipi
tati
on (i
n)Annual Precipitation- Minnesota
Annual
Spring Annual
Summer Annual
Linear (Annual)
Linear (Spring Annual)
Linear (Summer Annual)

0
5
10
15
20
25
30
35
40
45
50
1895 1905 1915 1925 1935 1945 1955 1965 1975 1985 1995 2005
Pre
cipi
tati
on (i
n)Annual Precipitation- Iowa
Annual
Spring Annual
Summer Annual
Linear (Annual)
Linear (Spring Annual)
Linear (Summer Annual)
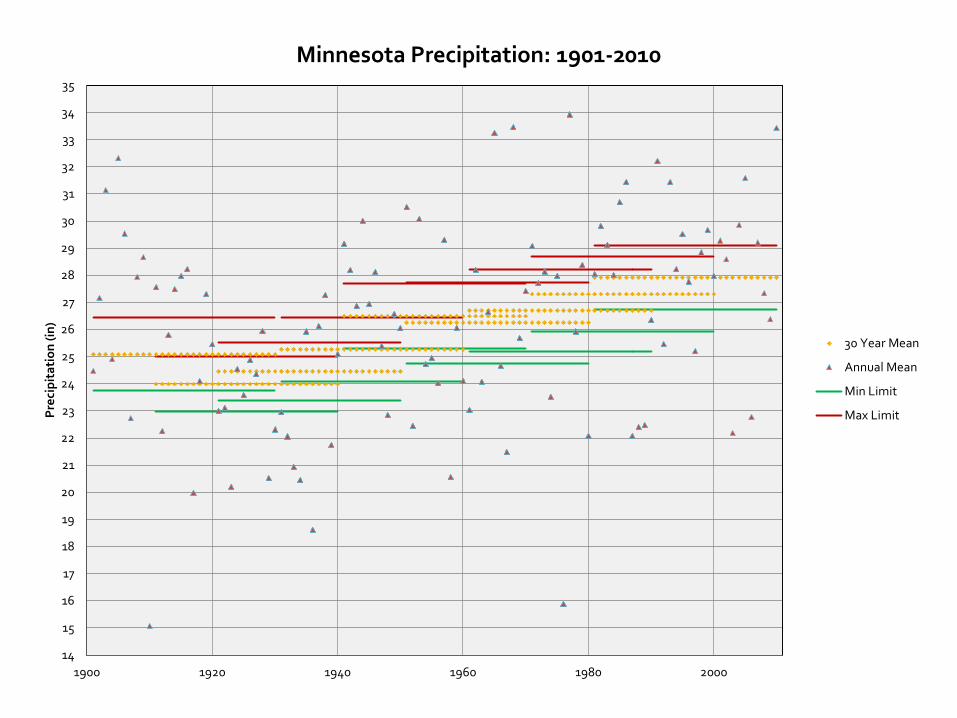
14
15
16
17
18
19
20
21
22
23
24
25
26
27
28
29
30
31
32
33
34
35
1900 1920 1940 1960 1980 2000
Pre
cipi
tati
on (i
n)Minnesota Precipitation: 1901-2010
30 Year Mean
Annual Mean
Min Limit
Max Limit

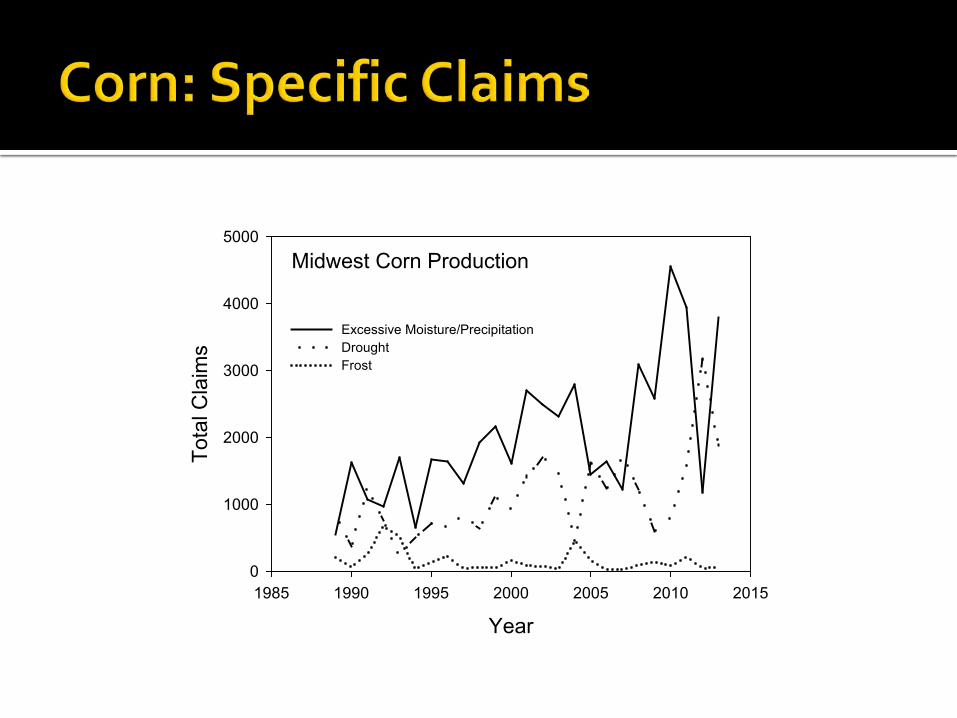
Midwest Corn Production
Year1985 1990 1995 2000 2005 2010 2015
Tota
l Cla
ims
0
1000
2000
3000
4000
5000
Excessive Moisture/PrecipitationDroughtFrost

Midwest Soybean Crop Insurance
Year1985 1990 1995 2000 2005 2010 2015
Tota
l Ins
uran
ce C
laim
s
0
2000
4000
6000
8000
10000
Insu
ranc
e Pa
yout
s ($
)
0.0
2.0e+8
4.0e+8
6.0e+8
8.0e+8
1.0e+9
1.2e+9
1.4e+9
1.6e+9
1.8e+9
Total ClaimsTotal Dollars in Claims
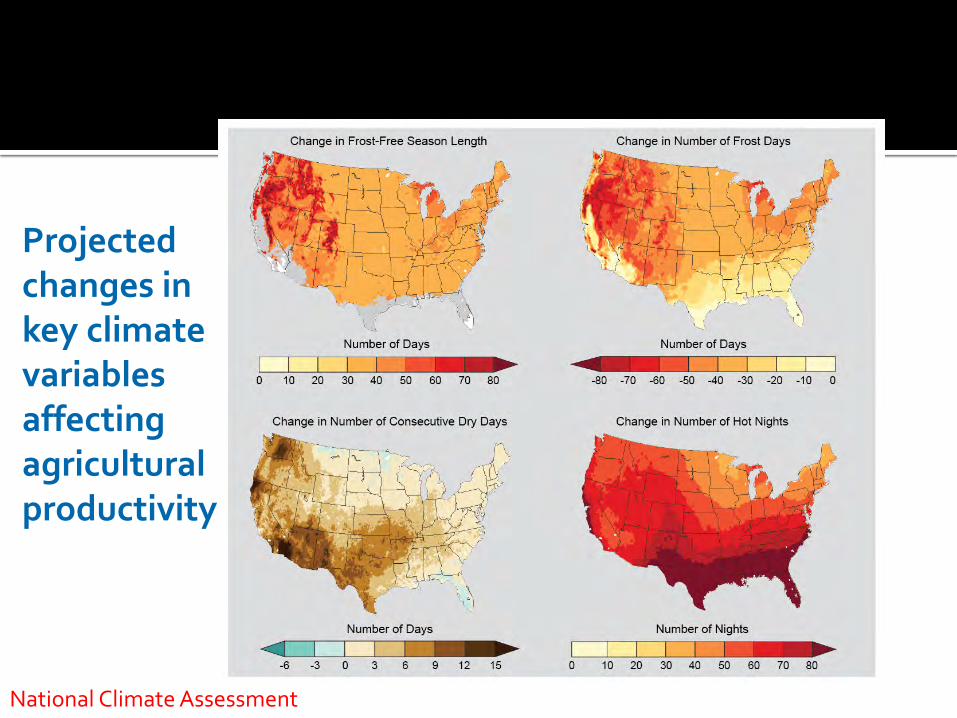
Projected changes in key climate variables affecting agricultural productivity
National Climate Assessment


54.8
55.2
55.6
56
56.4
56.8
57.2
57.6
58
58.4
58.8
59.2
59.6
60
60.4
60.8
61.2
61.6
62
62.4
62.8
63.2
63.6
64
64.4
1900 1920 1940 1960 1980 2000
Max
Tem
pera
ture
(F)
Iowa Max Temperature: 1901-2010
30 Year Mean
Annual Mean
Min Limit
Max Limit
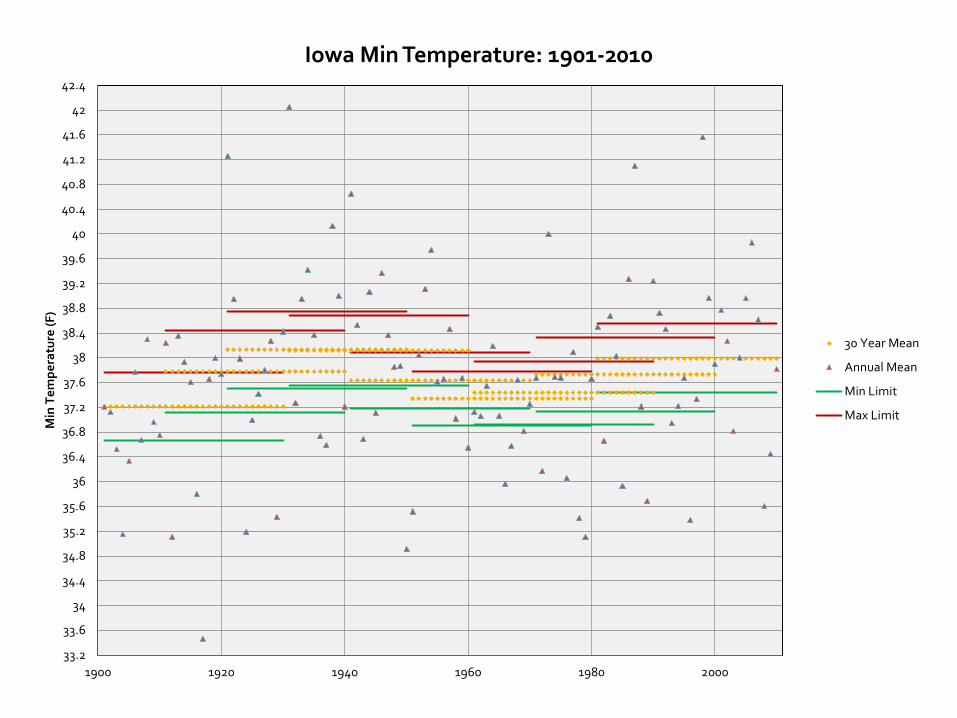
33.2
33.6
34
34.4
34.8
35.2
35.6
36
36.4
36.8
37.2
37.6
38
38.4
38.8
39.2
39.6
40
40.4
40.8
41.2
41.6
42
42.4
1900 1920 1940 1960 1980 2000
Min
Tem
pera
ture
(F)
Iowa Min Temperature: 1901-2010
30 Year Mean
Annual Mean
Min Limit
Max Limit

How cold does it get in the wintertime? Was it warm before the cold spell occurred? In the springtime when fruit crops start to grow, when
gardeners are planting, farmers start to plant corn –like to know a month beforehand if the temperature was going to get below 20F or 25F and for how long
Fall:▪ When harvesting freeze tender crops – what is the chance for
a freeze in the next week?▪ If growing hops and it freezes, the harvest is over in 24 hours
Prediction of dew point temps at night, In terms of cooling animals, it’s not how high during the day but how much it cools off at night, as well as the high dew points
When the animals can’t cool off at night, that’s problematic The only technique currently to effectively cool animal housing
is by sprinkling – which is useless when the dew points are already high (they don’t have air conditioning)
Heat stress is the most important for livestock▪ For dairy, there is heat stress above 65F▪ It is difficult to cool big birds with large feathers
Other issues▪ When livestock producers lose electrical power, they have minutes to
do something or you have dead animals▪ Transport of animals during summer requires special attention to
temperature and humidity conditions to ensure safe transport.

Has the range changed with the changing climate?
Will within season weather affect the dynamics of pests and disease populations?
Can we develop more effective prediction tools?

Linked together to protect and enhance the natural resources of soil, water, and air
The goal is to integrate information to deliver solutions to producers through a variety of outlets