climate change impacts and adaptation for coastal
TRANSCRIPT

UNCTAD National Workshop Saint Lucia 24 – 26 May 2017, Rodney Bay, Saint Lucia
“Climate Change Impacts and
Adaptation for Coastal Transport Infrastructure in Caribbean SIDS”
LISCoAsT – Large Scale Integrated Sea-level and Coastal Assessment Tool:
Application for the SIDS (II)
By
Michalis Vousdoukas
European Commission, Joint European Research Centre, Ispra, Italy
This expert paper is reproduced by the UNCTAD secretariat in the form and language in which it has been received. The views expressed are those of the author and do not necessarily reflect the views of the UNCTAD.

1
LISCoAsT – Large scale Integrated Sea-level and Coastal Assessment Tool: Application for the SIDSUNCTAD National Workshop Saint Lucia"Climate change impacts and adaptation for coastal transport infrastructure in Caribbean SIDS”
Michalis Vousdoukas, Lorenzo Mentaschi, Evangelos Voukouvalas, Luc
Feyen
European Commission, Joint Research Centre, Ispra, Italy
1
Disaster Risk Management UnitDirectorate E, Joint Research Centre, EC
Activity on river floods:
European/Global Flood Awareness System (EFAS/GLOFAS)
Climate change projections (Alfieri L., Rojas R., Feyen L)
Coastal floods group:
Michalis Vousdoukas, Lorenzo Mentaschi, Evangelos Voukouvalas, Dimitrios
Bouziotas, Tomas Montblanc, Georgia Kakoulaki, Francesco Dottori, Luc Feyen
2
2
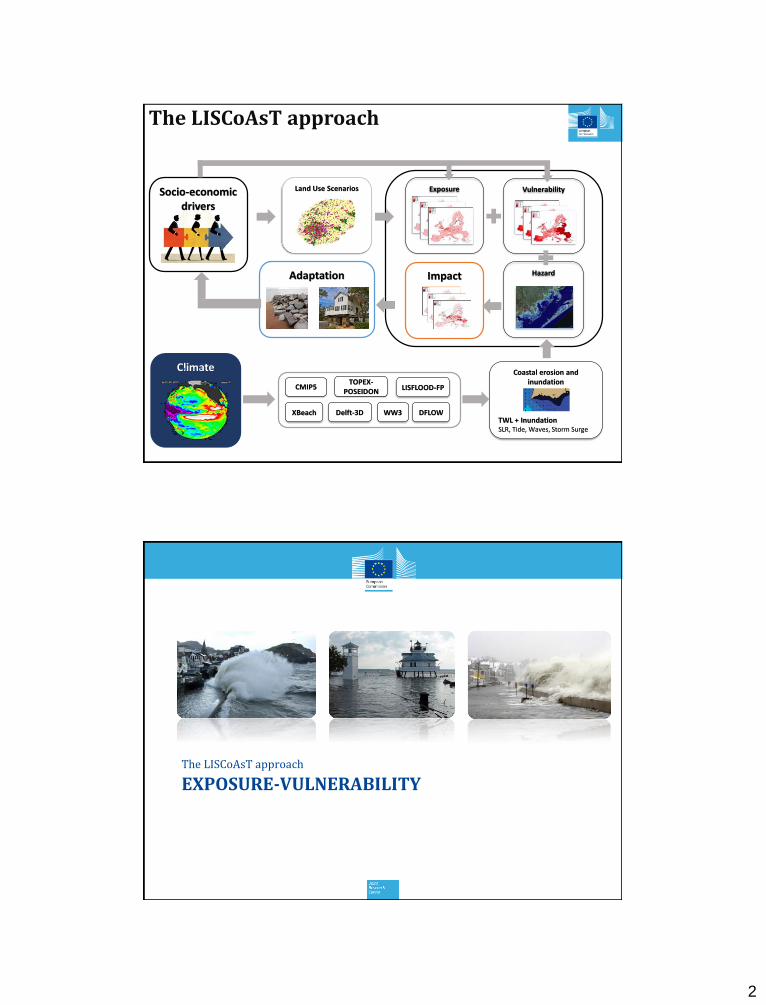
Impact
VulnerabilityExposure
Hazard
Coastal erosion and inundation
TWL + InundationSLR, Tide, Waves, Storm Surge
CMIP5TOPEX-
POSEIDON
Delft-3D WW3 DFLOWXBeach
LISFLOOD-FP
Socio-economic drivers
Land Use Scenarios
Adaptation
The LISCoAsT approach
EXPOSURE-VULNERABILITYThe LISCoAsT approach

3
5
➢ 2006 land use map, 100x100 m
➢ EU27 + EFTA + Turkey + Balkan
➢ 45 thematic classes
➢ Refined CORINE land use ▪ Soil Sealing Layer▪ TeleAtlas® ▪ Urban Atlas
➢ 2006 population map, 100x100 m
➢ EU27 + EFTA
➢ SSPs
Exposure: current land use and population
Batista e Silva, F., Lavalle, C., Koomen, E., 2013. A procedure to obtain a refined European land use/cover map. Journal of Land Use Science, 8 (3), pp. 255-283. Batista e Silva, F., J. Gallego, C. Lavalle, 2013. A high-resolution population grid map for Europe. Journal of Maps, 9, 16-28.
Mapping of large infrastructures and key economic assets
6
• Non renewable Power Plants (MW)
• Electricity distribution lines (km)
• Unesco cultural sites (number)
• Social infrastructure (number)
• Ports/Airports (No People Served)
• Transport networks (No People
Served)
• Urban transport (No People Served)
Railway networkTransmission lines Ports

4
PROJECTIONS OF COASTAL IMPACTS FOR EUROPE
Results
Projections of EAD for RCP4.5 and 8.5
Only direct impacts!

5
Projections of EA number of people affected
Only direct impacts!
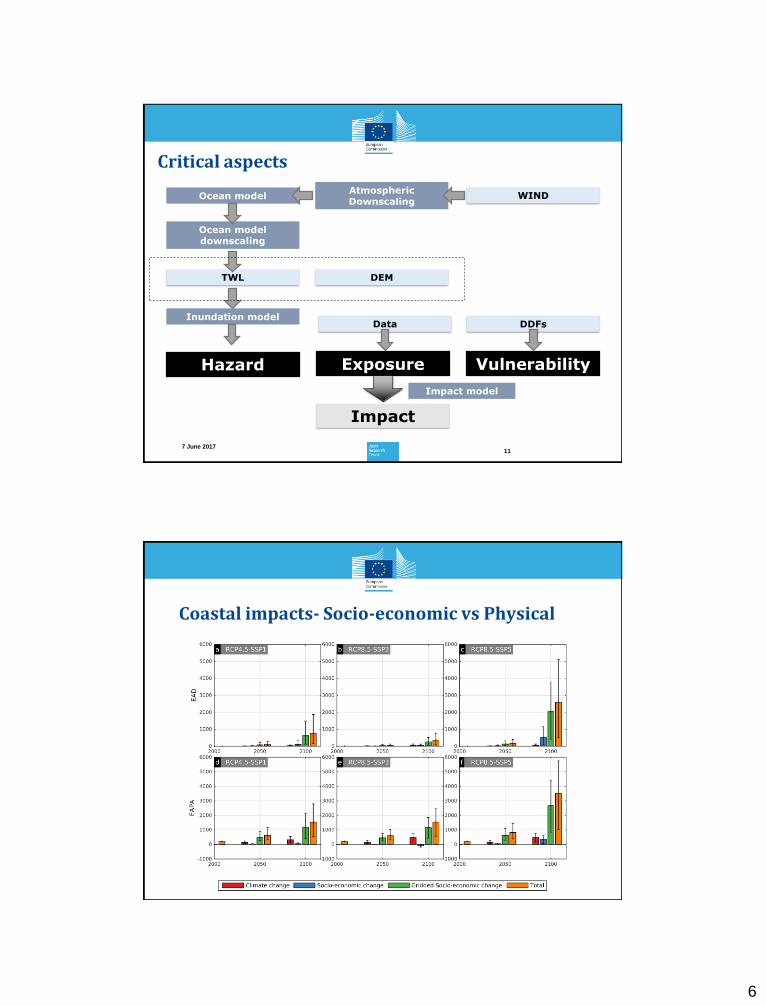
Critical aspects
• Temporal and spatial scales
• Consider all processes (tides, waves, storm surge, erosion, protection failure,
etc), or exclude the right ones ☺
• Data quality
• Find the right inundation model for the scale and data quality
• Exposure maps, stationary or dynamic
• Find the right impact assessment methodology
• Adaptation pathways
6
Critical aspects
117 June 2017
Hazard Exposure Vulnerability
Impact
WIND
DEM
Atmospheric Downscaling
Ocean model
Ocean model downscaling
TWL
Inundation modelData DDFs
Impact model
Coastal impacts- Socio-economic vs Physical

7
LISCOAST
• A flexible coastal impact assessment tool
• Process-based, large scale, but not oversimplified
• Developed, validated and applied first for Europe and then implemented on
global scale
• Building upon the group’s expertise on inland flooding forecasting and impact
assessment
• Collaborations with leading institutes of the field, smaller scale assessments for
validation, incentive for improvement
HAZARD PROJECTIONSThe LISCoAsT approach

8
Sea Level Rise and beyond
IPCC 2013
Global ocean mass
Global ocean water
volume
Groundwater & reservoirs
Gravity & solid earth effects
Thermal expansion
Regional sea level
Sea level extremes
Sea level impacts,
adaptation & vulnerability
Density & circulation
changes
Waves, tide & storm surges
Land Ice
Glaciers
Ice sheet surface mass
balance
Ice sheet dynamics
Sea level extremes: Global Storm Surge Model
Model used: DFLOWSimulated tidal, wind and pressure driven ocean circulation
Flexible meshNearshore resolution 0.11o x 0.05o
Offshore resolution 0.94o x 0.42o
9
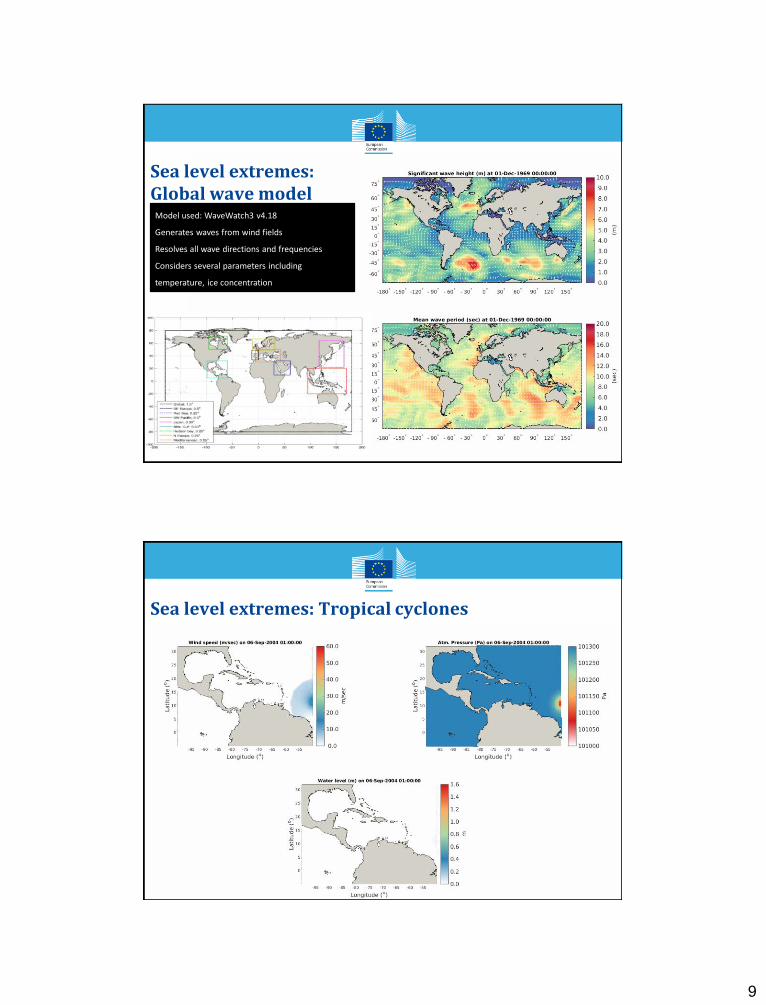
Sea level extremes: Global wave model
Model used: WaveWatch3 v4.18
Generates waves from wind fields
Resolves all wave directions and frequencies
Considers several parameters including
temperature, ice concentration
Sea level extremes: Tropical cyclones

10
Sea level extremes: Grid resolution effects
Sea level extremes: Forcing resolution effects

11
Caribbean TWL projections: Changes in frequency
Data to be available
Current Global Erosion Trends
https://global-surface-water.appspot.com

12
Long-term shoreline dynamics
Based on Pekel et al 2016, Nature
3000000 Landsat satellite images
Past 32 years
30 m resolutionc

13
Flood extent projections for St Lucia
Digital Elevation data

14
2D vs 3D inundation simulations
Coastal Inundation: type of model

15
Coastal Inundation on EU scale
• TWL components estimated
every 25 km of coast
• SRTM DEM
• Similarly coastline and all
data divided in 25 km long
segments, extending 50 km
inland
wavestormsurgetideMSLTWL RSLR

16
Validation for the Xynthia storm
Hit
Miss
False alarm
100
Fo
FoFmH
100/
Fo
FoFmF
100
FoFm
FoFmC
European scale application for the present-day 100-year event
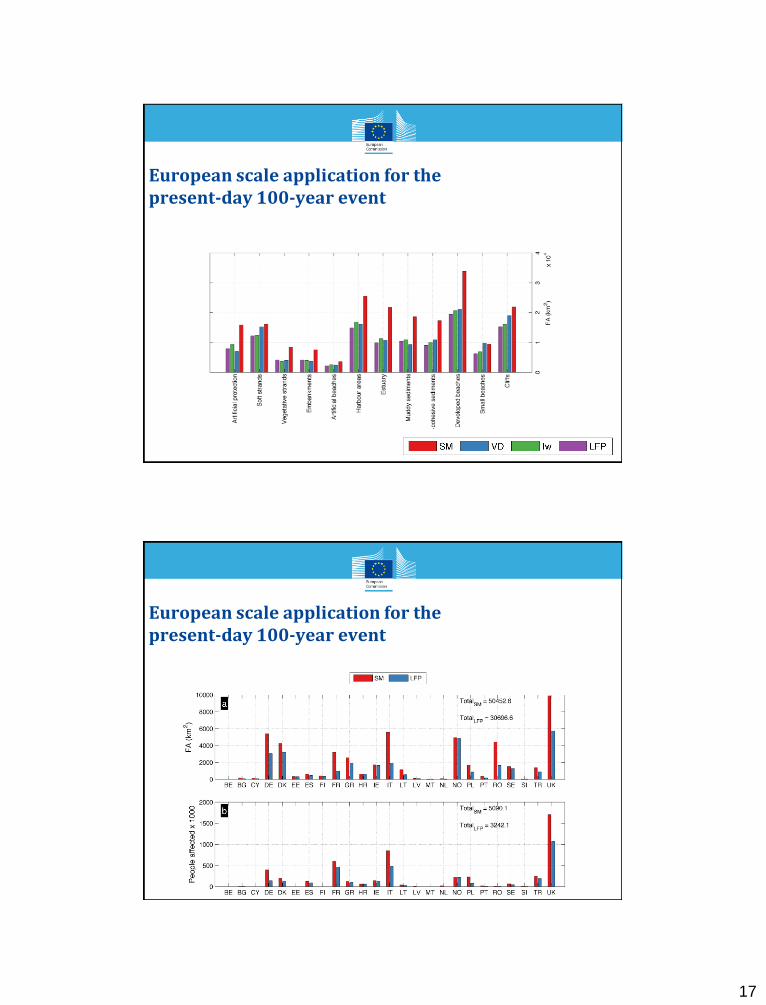
17
European scale application for the present-day 100-year event
European scale application for the present-day 100-year event

18
Coastal Inundation: considering waves
European scale application for the present-day 100-year event

19
Coastal impacts- Physical contributions
Coastal erosion and inundation
Hurricane Matthew, USGS

20
Intertidal topography
Monitoring storm events
Storms and morphology
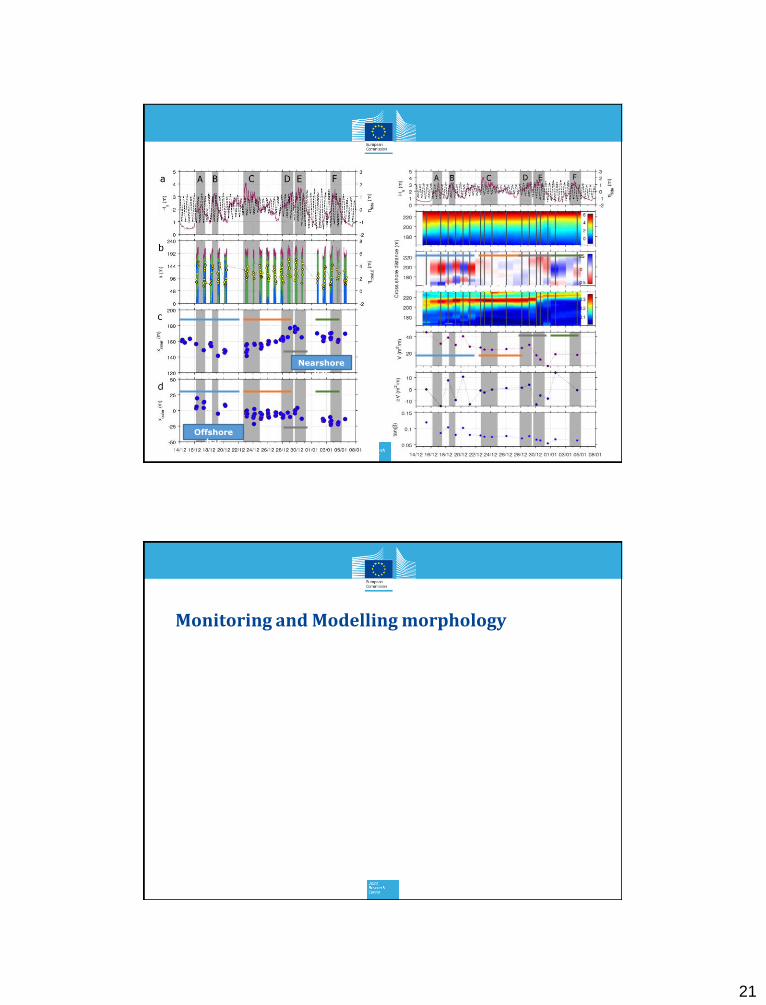
21
Nearshorebar
Offshore bar
Monitoring and Modelling morphology

22
There are simple solutions
• Design Disaster Risk Reduction procedures
• Schedule inspections/monitoring
• Identify available information sources
• Combine with local knowledge
• Understand the coastal systems and vulnerabilities
• Preparedness when there are anticipated impacts (protecting
critical/sensitive points, issuing warnings, evacuating in extreme
cases)
Thank you very much…