climate change questionaire 2019 - ryder · ryder system, inc. cdp climate change questionnaire...
TRANSCRIPT

Ryder System, Inc. CDP Climate Change Questionnaire 2019 Friday, August 2, 2019
Welcome to your CDP Climate Change Questionnaire 2019
C0. Introduction
C0.1
(C0.1) Give a general description and introduction to your organization.
Ryder System, Inc. (Ryder), a Florida corporation founded in 1933, is a global leader in commercial fleet management and supply chain solutions. We
operate primarily in three business segments: Fleet Management Solutions (FMS), Dedicated Transportation Services (DTS) and Supply Chain
Solutions (SCS). Ryder has received significant awards and recognition from customers, leading transportation and logistics industry associations,
business and regulatory communities. Recent examples include: Forbes: America’s Best Employers in Transportation and Logistics industry category
(2016-2018); FORTUNE: World’s Most Admired Companies Award in Trucking Industry (2016-2018); SupplyChainBrain - 100 Great Supply Chain
Partners award (2017); Trucking HR Canada – Top Fleet Employers (2018); Carbon Disclosure Project Carbon Disclosure Leadership Index (2012,
2015); Food Logistics: Top Green Providers award for green transportation and logistics solutions (2012 – 2017); Inbound Logistics - top 75 Green
Supply Chain Partners by Inbound Logistics (2009– 2017); Supply & Demand Chain Executive: Green Supply Chain Award for meeting green or
sustainable supply chain goals (2016-2017); 2020 Women on Boards W Company – Ryder was named a “W” company for having a board with more
than 20 percent women (2013, 2017); CivilianJobs.com’s Most Valuable Employers (MVE) for Military (2013 - 2017); Florida Diversity Council: Most
Powerful and Influential Women Award (2017); SmartWay Excellence Award (2017). The FMS business provides full service leasing (long-term),
commercial rental (short-term), as well as contract maintenance of trucks, tractors and trailers to customers principally in the U.S., Canada and the U.K.
The standard leasing business model offers customers different vehicle options (such as fuel-efficient or natural gas powered vehicle packages) with
attractive financing mechanisms. Because of increased demand for vehicle efficiency and reliability, companies that own and manage their own fleet of
vehicles have put greater emphasis on the quality of preventative maintenance for their vehicles. In addition, several trends have been increasing the
need for outsourcing: increased complexity and cost of buying and maintaining vehicles including technology, diagnostics, and training; labor issues
including a shortage of qualified truck drivers and mechanics; as well as increased regulation – e.g. more expensive emission controls needed for EPA-
compliant engines - and enforcement of safety requirements. The Dedicated Transportation Service (DTS) option provides vehicles and drivers as part
of a dedicate transportation solution in the US. Customers directly manage their overall freight movement but Ryder provides the equipment,
maintenance, and administrative services (including driver hiring, training, routing and scheduling, and fleet sizing) associated with maintaining the
1
Ryder System, Inc. CDP Climate Change Questionnaire 2019 Friday, August 2, 2019
customer’s private fleet. This combination of services allow us to provide high service levels and the most efficient routing to lower fuel costs due to
less idle time and fewer empty miles. A key difference between Dedicated Transportation Services and Full Service Lease is Ryder provides the drivers
for Dedicated. The SCS supply chain solution provides Distribution and Transportation Management services in North America and Asia. SCS
customers are looking for a total integrated solution that includes managing outsourced vehicles, drivers, freight routing, IT integration, warehouse and
distribution management, as well as other logistics engineering services. SCS provides a wide range of services relating to a customer’s distribution
operations, from designing the distribution network to managing distribution facilities. Customers can more precisely align inbound and outbound
shipments, synchronize returns with optimized fleet use and arrange backhauls to offset transportation costs and minimize empty miles that will directly
help lowering GHG emissions. The SCS Transportation Management business offers services relating to all aspects of a customer’s transportation
network. Ryder’s transportation specialists provide shipment planning and execution, through a series of technological and web-based solutions.
Ryder published an updated Corporate Sustainability Report in accordance with the Global Reporting Initiative (GRI) Standards Core option with
detailed emissions and activity data (http://rydercsr.com). For the 2019 CDP response year, updates are provided to emission data (sections C6, C7
and C8), but at the time of CDP publication, these were not fully audited. Ryder plans to resume full CDP reporting in 2020.
C0.2
(C0.2) State the start and end date of the year for which you are reporting data.
Start date End date Indicate if you are providing emissions data for past reporting years
Row 1 January 1, 2018 December 31, 2018 No
C0.3
(C0.3) Select the countries/regions for which you will be supplying data.
Canada
China, Hong Kong Special Administrative Region
Germany
Mexico
United Kingdom of Great Britain and Northern Ireland
United States of America
2

Ryder System, Inc. CDP Climate Change Questionnaire 2019 Friday, August 2, 2019
C0.4
(C0.4) Select the currency used for all financial information disclosed throughout your response.
USD
C0.5
(C0.5) Select the option that describes the reporting boundary for which climate-related impacts on your business are being
reported. Note that this option should align with your consolidation approach to your Scope 1 and Scope 2 greenhouse gas
inventory.
Operational control
C-TO0.7/C-TS0.7
(C-TO0.7/C-TS0.7) For which transport modes will you be providing data?
C1. Governance
C1.1
(C1.1) Is there board-level oversight of climate-related issues within your organization?
Yes
C1.1a
(C1.1a) Identify the position(s) (do not include any names) of the individual(s) on the board with responsibility for climate-related
issues.
3

- -
Ryder System, Inc. CDP Climate Change Questionnaire 2019 Friday, August 2, 2019
Position of
individual(s)
Please explain
Other, please i) The Board of Directors’ Corporate Governance Committee, a subcommittee of the full Board of Directors, is responsible for
specify overseeing public policy, public affairs and corporate responsibility including responsibility for Ryder’s environmental programs, which
Board/Executive address regulatory and business issues related to climate change impacts and strategy. ii) The Vice President of Environmental, Real
Board Estate, and Fuel Services maintains day-to-day operational responsibility for Environmental Programs including climate change
strategy and reports to the Executive Vice President, Chief Legal Officer and Corporate Secretary. An Environmental Report is
provided annually to the Corporate Governance Committee.
C1.1b
(C1.1b) Provide further details on the board’s oversight of climate-related issues.
Frequency with which
climate related issues are
a scheduled agenda item
Governance mechanisms
into which climate related
issues are integrated
Please explain
Scheduled – all meetings Reviewing and guiding major Ryder's Board of Directors’ Corporate Governance Committee oversees major plans of action as
plans of action important matters arise. For example, during the annual board meeting, environmental risk and
cost dashboards are discussed and action plans related to energy and resource conservation
are presented. This includes both specific program updates (e.g. energy efficiency projects) and
a general overview of greenhouse gas target performance.
Sporadic - as important
matters arise
Reviewing and guiding
business plans
Ryder's Board of Directors’ Corporate Governance Committee oversees reviewing and guiding
business plans as important matters arise. For example, over the last 6 years, Ryder's
alternative fuel strategy was developed in a top down approach by Ryder's leadership team.
Ryder's natural gas truck fleet has expanded into 16 states and 27 maintenance and repair
shops were retrofitted for natural gas maintenance. In addition, Ryder is expanding into the
electric vehicle market. In 2017, Ryder became the exclusive sales and lease partner of electric
trucks for Chanje.
4
-
Ryder System, Inc. CDP Climate Change Questionnaire 2019 Friday, August 2, 2019
C1.2
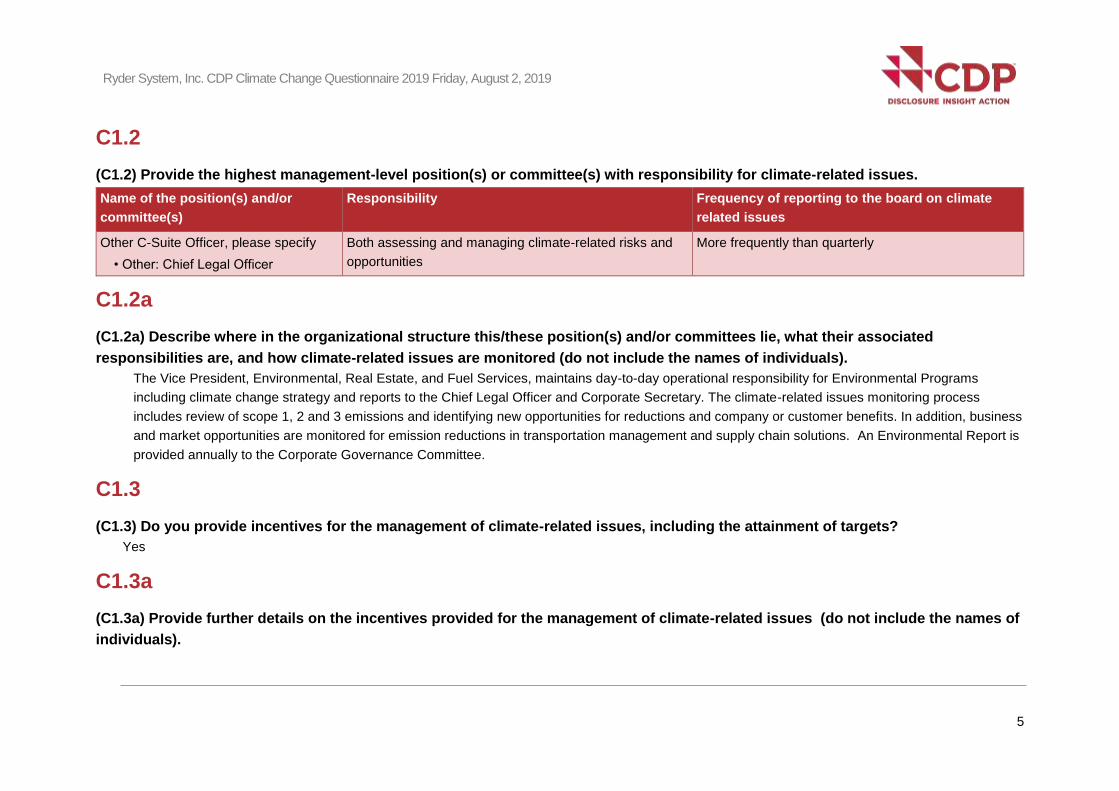
(C1.2) Provide the highest management-level position(s) or committee(s) with responsibility for climate-related issues.
Name of the position(s) and/or
committee(s)
Responsibility Frequency of reporting to the board on climate
related issues
Other C-Suite Officer, please specify
• Other: Chief Legal Officer
Both assessing and managing climate-related risks and
opportunities
More frequently than quarterly
C1.2a
(C1.2a) Describe where in the organizational structure this/these position(s) and/or committees lie, what their associated
responsibilities are, and how climate-related issues are monitored (do not include the names of individuals).
The Vice President, Environmental, Real Estate, and Fuel Services, maintains day-to-day operational responsibility for Environmental Programs
including climate change strategy and reports to the Chief Legal Officer and Corporate Secretary. The climate-related issues monitoring process
includes review of scope 1, 2 and 3 emissions and identifying new opportunities for reductions and company or customer benefits. In addition, business
and market opportunities are monitored for emission reductions in transportation management and supply chain solutions. An Environmental Report is
provided annually to the Corporate Governance Committee.
C1.3
(C1.3) Do you provide incentives for the management of climate-related issues, including the attainment of targets?
Yes
C1.3a
(C1.3a) Provide further details on the incentives provided for the management of climate-related issues (do not include the names of
individuals).
5
Ryder System, Inc. CDP Climate Change Questionnaire 2019 Friday, August 2, 2019
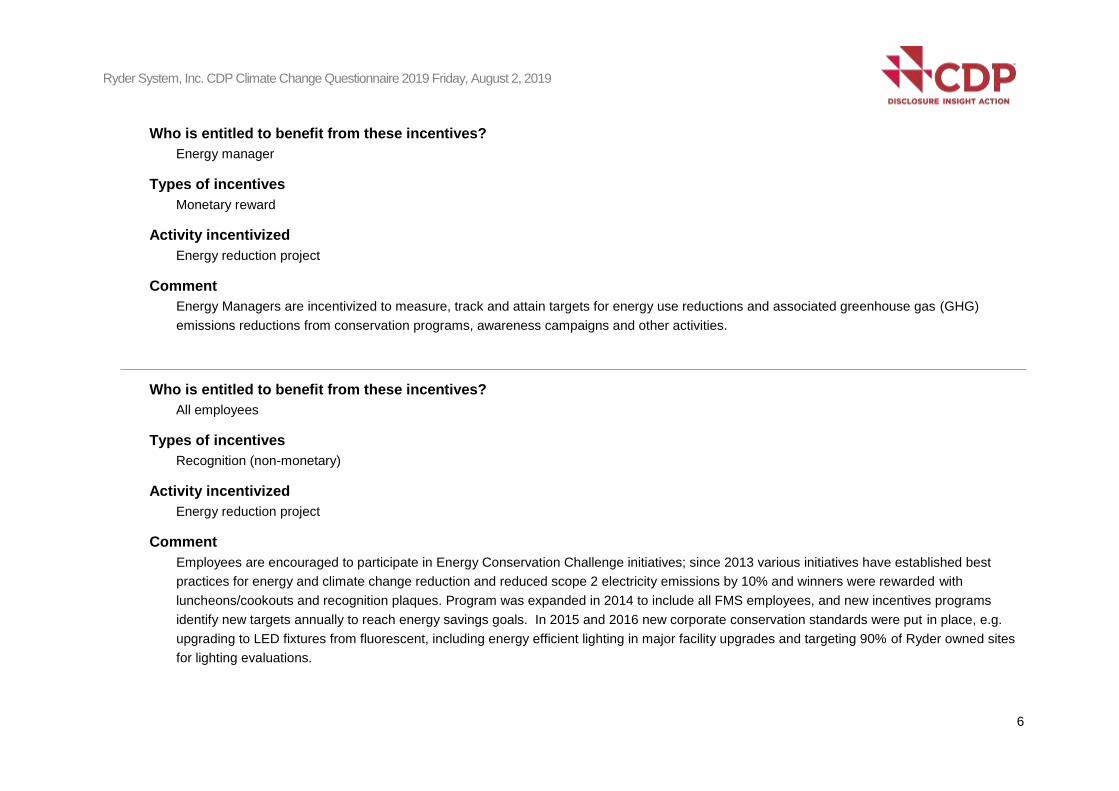
Who is entitled to benefit from these incentives?
Energy manager
Types of incentives
Monetary reward
Activity incentivized
Energy reduction project
Comment
Energy Managers are incentivized to measure, track and attain targets for energy use reductions and associated greenhouse gas (GHG)
emissions reductions from conservation programs, awareness campaigns and other activities.
Who is entitled to benefit from these incentives?
All employees
Types of incentives
Recognition (non-monetary)
Activity incentivized
Energy reduction project
Comment
Employees are encouraged to participate in Energy Conservation Challenge initiatives; since 2013 various initiatives have established best
practices for energy and climate change reduction and reduced scope 2 electricity emissions by 10% and winners were rewarded with
luncheons/cookouts and recognition plaques. Program was expanded in 2014 to include all FMS employees, and new incentives programs
identify new targets annually to reach energy savings goals. In 2015 and 2016 new corporate conservation standards were put in place, e.g.
upgrading to LED fixtures from fluorescent, including energy efficient lighting in major facility upgrades and targeting 90% of Ryder owned sites
for lighting evaluations.
6
Ryder System, Inc. CDP Climate Change Questionnaire 2019 Friday, August 2, 2019
C2. Risks and opportunities
C2.1
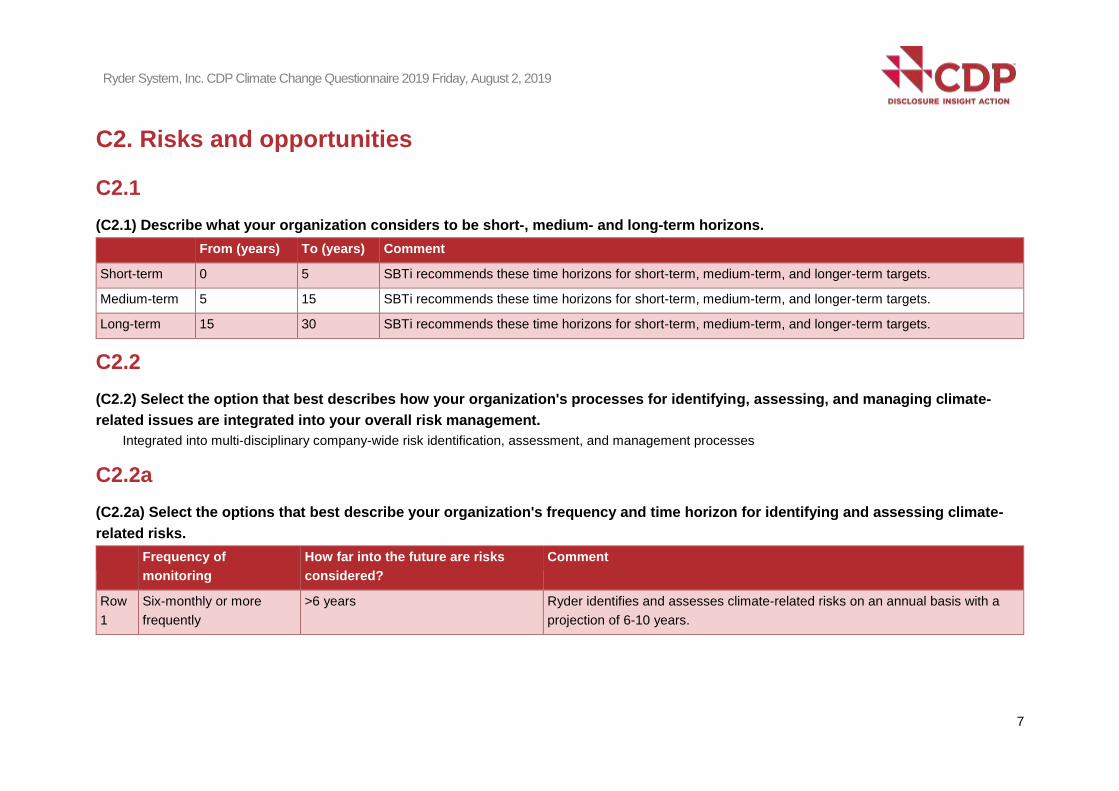
(C2.1) Describe what your organization considers to be short-, medium- and long-term horizons.
From (years) To (years) Comment
Short-term 0 5 SBTi recommends these time horizons for short-term, medium-term, and longer-term targets.
Medium-term 5 15 SBTi recommends these time horizons for short-term, medium-term, and longer-term targets.
Long-term 15 30 SBTi recommends these time horizons for short-term, medium-term, and longer-term targets.
C2.2
(C2.2) Select the option that best describes how your organization's processes for identifying, assessing, and managing climate-
related issues are integrated into your overall risk management.
Integrated into multi-disciplinary company-wide risk identification, assessment, and management processes
C2.2a
(C2.2a) Select the options that best describe your organization's frequency and time horizon for identifying and assessing climate-
related risks.
Frequency of
monitoring
How far into the future are risks
considered?
Comment
Row
1
Six-monthly or more
frequently
>6 years Ryder identifies and assesses climate-related risks on an annual basis with a
projection of 6-10 years.
7
Ryder System, Inc. CDP Climate Change Questionnaire 2019 Friday, August 2, 2019
C2.2b
(C2.2b) Provide further details on your organization’s process(es) for identifying and assessing climate-related risks.
a) Ryder's process for identifying and assessing climate-related risks includes evaluation, management, and on-going review of financial, regulatory,
customer, employment, insurance, and environmental risks, among others at both a company level and an asset level:
i) Company level, we utilize insurance risk management modelling systems used by underwriters and an integrated Environmental Management
System (EMS) to manage climate change risks; ensure compliance; promote business opportunity and growth; and create a competitive advantage
with environmental programs consistent with Ryder’s long-term business strategy.
ii) Asset level, we apply formal identification processes and assess climate change risks and opportunities of our assets: a) Facilities, we contract with
third party risk consulting firms to perform onsite surveys of operating facilities with financial incentives to support compliance. b) Vehicle fleet, we
identify efficiencies through our participation in the EPA SmartWay® Program and Ryder’s RydeSmart fleet tracking system. RydeSmart is an
integrated telematics platform helps customers monitor key vehicle attributes such as location, speed and idle time and real-time performance metrics.
In addition, Ryder pursues investments in low carbon technologies including electric and alternative fuel vehicles such as natural gas or electric trucks.
b) Ryder's process for assessing the potential size and scope of identified risks is to perform annual Risk Assessment Reviews for all identified risk
areas.
c) Ryder's process for determining the relative significance of climate-related risks in relation to other risks is to review the Likelihood/Probability and
Speed of Onset associated with climate change risks against other company risks taking into account current and future controls.
d) Ryder uses the ERM (enterprise-wide risk measure) framework for classifying and defining risk types.
e) Ryder's defines "substantive financial impact" or "strategic impact" to our business as either Moderate (1-5%), Medium (5-10%), High ( 10%) based
on risk potential financial impact to operating revenues.
C2.2c
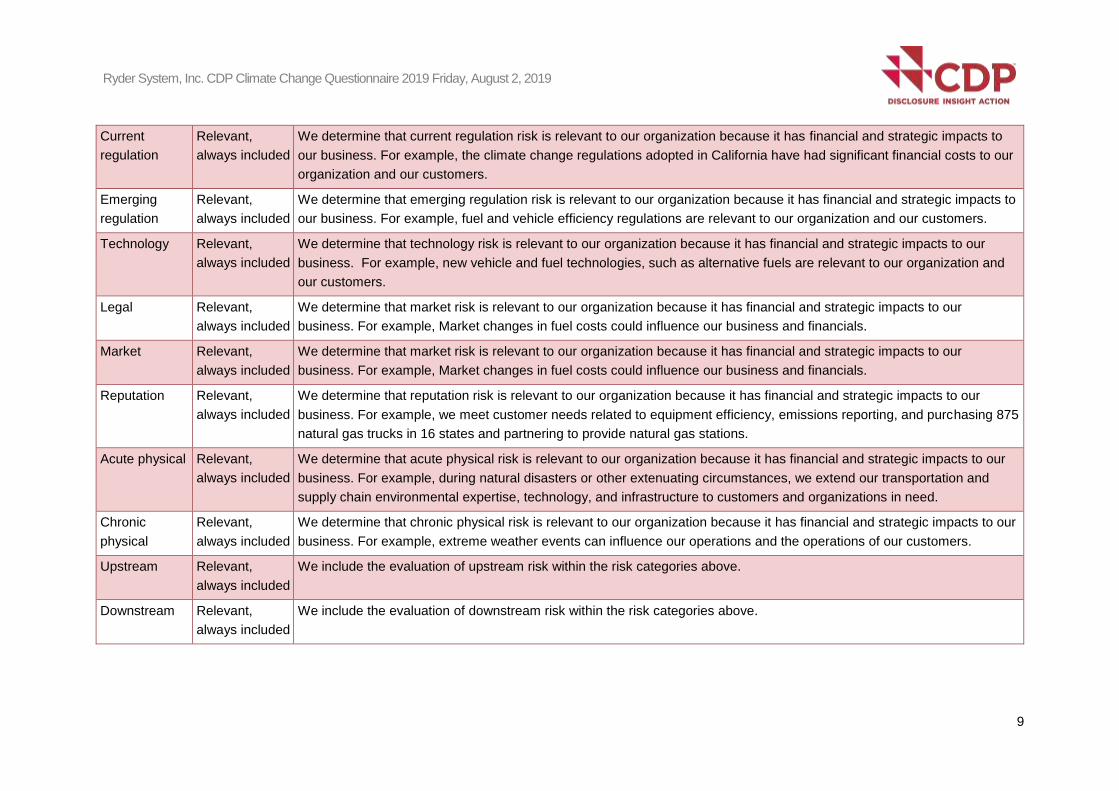
(C2.2c) Which of the following risk types are considered in your organization's climate-related risk assessments?
Relevance & Please explain
inclusion
8
Ryder System, Inc. CDP Climate Change Questionnaire 2019 Friday, August 2, 2019
Current
regulation
Relevant,
always included
We determine that current regulation risk is relevant to our organization because it has financial and strategic impacts to
our business. For example, the climate change regulations adopted in California have had significant financial costs to our
organization and our customers.
Emerging
regulation
Relevant,
always included
We determine that emerging regulation risk is relevant to our organization because it has financial and strategic impacts to
our business. For example, fuel and vehicle efficiency regulations are relevant to our organization and our customers.
Technology Relevant,
always included
We determine that technology risk is relevant to our organization because it has financial and strategic impacts to our
business. For example, new vehicle and fuel technologies, such as alternative fuels are relevant to our organization and
our customers.
Legal Relevant,
always included
We determine that market risk is relevant to our organization because it has financial and strategic impacts to our
business. For example, Market changes in fuel costs could influence our business and financials.
Market Relevant,
always included
We determine that market risk is relevant to our organization because it has financial and strategic impacts to our
business. For example, Market changes in fuel costs could influence our business and financials.
Reputation Relevant,
always included
We determine that reputation risk is relevant to our organization because it has financial and strategic impacts to our
business. For example, we meet customer needs related to equipment efficiency, emissions reporting, and purchasing 875
natural gas trucks in 16 states and partnering to provide natural gas stations.
Acute physical Relevant,
always included
We determine that acute physical risk is relevant to our organization because it has financial and strategic impacts to our
business. For example, during natural disasters or other extenuating circumstances, we extend our transportation and
supply chain environmental expertise, technology, and infrastructure to customers and organizations in need.
Chronic
physical
Relevant,
always included
We determine that chronic physical risk is relevant to our organization because it has financial and strategic impacts to our
business. For example, extreme weather events can influence our operations and the operations of our customers.
Upstream Relevant,
always included
We include the evaluation of upstream risk within the risk categories above.
Downstream Relevant,
always included
We include the evaluation of downstream risk within the risk categories above.
9

Ryder System, Inc. CDP Climate Change Questionnaire 2019 Friday, August 2, 2019
C2.2d
(C2.2d) Describe your process(es) for managing climate-related risks and opportunities.
a) We identify our risks and opportunities through our risk management processes. Ryder's Board of Directors’ Corporate Governance Committee
determines if the risks and opportunities should be mitigated, transferred, accepted, controlled, or capitalized upon based on our materiality thresholds
(levels of risk). b) Priorities are determined annually by the Environmental Services (ES) Senior Management Team based on a formal review of
overall company-wide risk management reviews. The ES team and Corporate Risk Managers evaluate priorities and determine materiality thresholds
(levels of risk) annually to ensure appropriate risk controls and response procedures are in place, including those risks related to climate
change. Changes are made annually as required. c) Ryder manages climate-related risks and opportunities through our processes for transitional and
physical risks. 1. For example, some of our transitional risks include a) regulatory risk, we proactively adopt continual improvement programs for
efficiencies and conservation before we are mandated to do so by regulations, b) reputation risk, we meet customer needs related to equipment
efficiency and emissions reporting, purchasing 875 natural gas trucks in 16 states and partnering to provide natural gas stations, and c) technology risk,
we identify efficiencies in our vehicle fleet through our participation in the EPA SmartWay® Program and Ryder’s RydeSmart fleet tracking system.
RydeSmart is an integrated telematics platform helps customers monitor key vehicle attributes such as location, speed and idle time and real-time
performance metrics. RydeSmart helps customers reduce fuel expenses by 20-25% and idle time by 20-30%. In addition, Ryder pursues investments
in low carbon technologies including electric and alternative fuel vehicles such as natural gas or electric trucks. 2. For Physical climate change risks, we
execute our protocols in place with our network of facilities, contingency and comprehensive EMS plans. We extend our transportation and supply
chain environmental expertise, technology, and infrastructure to customers and organizations in need.
C2.3
(C2.3) Have you identified any inherent climate-related risks with the potential to have a substantive financial or strategic impact on
your business?
Yes
C2.3a
(C2.3a) Provide details of risks identified with the potential to have a substantive financial or strategic impact on your business.
10
Ryder System, Inc. CDP Climate Change Questionnaire 2019 Friday, August 2, 2019
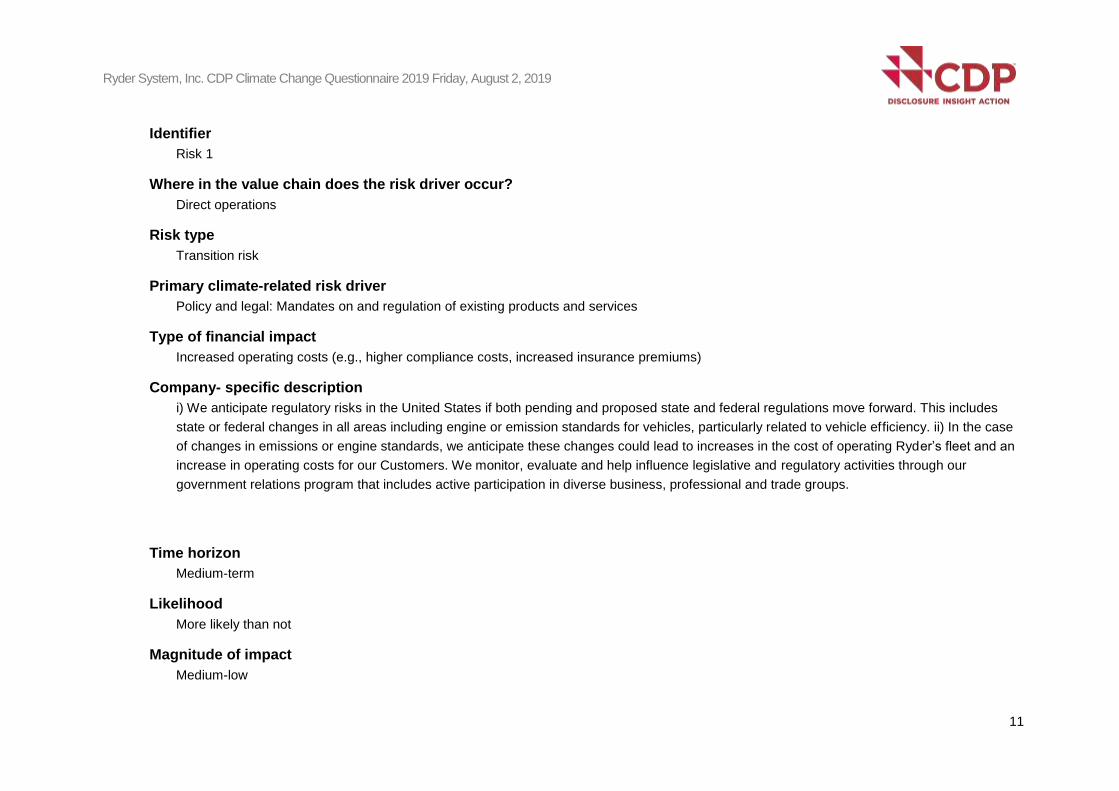
Identifier
Risk 1
Where in the value chain does the risk driver occur?
Direct operations
Risk type
Transition risk
Primary climate-related risk driver
Policy and legal: Mandates on and regulation of existing products and services
Type of financial impact
Increased operating costs (e.g., higher compliance costs, increased insurance premiums)
Company- specific description
i) We anticipate regulatory risks in the United States if both pending and proposed state and federal regulations move forward. This includes
state or federal changes in all areas including engine or emission standards for vehicles, particularly related to vehicle efficiency. ii) In the case
of changes in emissions or engine standards, we anticipate these changes could lead to increases in the cost of operating Ryder’s fleet and an
increase in operating costs for our Customers. We monitor, evaluate and help influence legislative and regulatory activities through our
government relations program that includes active participation in diverse business, professional and trade groups.
Time horizon
Medium-term
Likelihood
More likely than not
Magnitude of impact
Medium-low
11
Ryder System, Inc. CDP Climate Change Questionnaire 2019 Friday, August 2, 2019
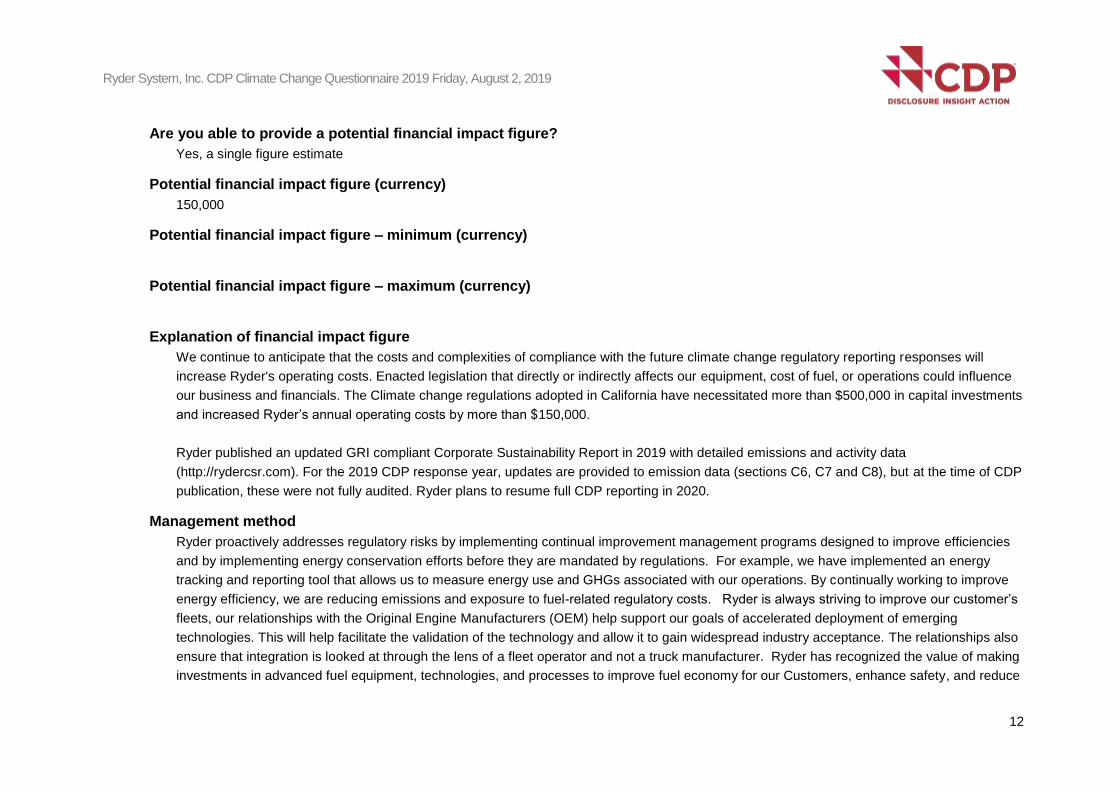
Are you able to provide a potential financial impact figure?
Yes, a single figure estimate
Potential financial impact figure (currency)
150,000
Potential financial impact figure – minimum (currency)
Potential financial impact figure – maximum (currency)
Explanation of financial impact figure
We continue to anticipate that the costs and complexities of compliance with the future climate change regulatory reporting responses will
increase Ryder's operating costs. Enacted legislation that directly or indirectly affects our equipment, cost of fuel, or operations could influence
our business and financials. The Climate change regulations adopted in California have necessitated more than $500,000 in capital investments
and increased Ryder’s annual operating costs by more than $150,000.
Ryder published an updated GRI compliant Corporate Sustainability Report in 2019 with detailed emissions and activity data
(http://rydercsr.com). For the 2019 CDP response year, updates are provided to emission data (sections C6, C7 and C8), but at the time of CDP
publication, these were not fully audited. Ryder plans to resume full CDP reporting in 2020.
Management method
Ryder proactively addresses regulatory risks by implementing continual improvement management programs designed to improve efficiencies
and by implementing energy conservation efforts before they are mandated by regulations. For example, we have implemented an energy
tracking and reporting tool that allows us to measure energy use and GHGs associated with our operations. By continually working to improve
energy efficiency, we are reducing emissions and exposure to fuel-related regulatory costs. Ryder is always striving to improve our customer’s
fleets, our relationships with the Original Engine Manufacturers (OEM) help support our goals of accelerated deployment of emerging
technologies. This will help facilitate the validation of the technology and allow it to gain widespread industry acceptance. The relationships also
ensure that integration is looked at through the lens of a fleet operator and not a truck manufacturer. Ryder has recognized the value of making
investments in advanced fuel equipment, technologies, and processes to improve fuel economy for our Customers, enhance safety, and reduce
12
Ryder System, Inc. CDP Climate Change Questionnaire 2019 Friday, August 2, 2019
operating costs as part of an overall strategy to improve transportation efficiencies. In addition to these risk management programs, we manage
potential regulatory risks by collaborating with trade and business associations to shape pending climate change- legislation and regulations at
the state, provincial, and federal level.
Cost of management
1,600,000
Comment
Our costs associated with compliance and reporting will increase, particularly if regulations increase the cost of compliance, fuel or electricity or
the cost associated with maintaining and servicing our vehicles due to new vehicle technologies and engines or emission control devices. Ryder
retains professional environmental consulting and legal expertise to measure, track, assess, and report implement programs to mitigate the
direct potential impact of regulations to Ryder and our customers, which cost more than $1.6 Million annually.
Identifier
Risk 2
Where in the value chain does the risk driver occur?
Direct operations
Risk type
Physical risk
Primary climate-related risk driver
Acute: Increased severity of extreme weather events such as cyclones and floods
Type of financial impact
Increased operating costs (e.g., higher compliance costs, increased insurance premiums)
Company- specific description
i) We consider our company to be exposed to physical risks such as natural disasters (e.g. flooding, tropical cyclones and storms, etc.) or
changing weather patterns that may be associated with climate change. There are no specific geographical areas that are more affected by
13

Ryder System, Inc. CDP Climate Change Questionnaire 2019 Friday, August 2, 2019
these physical risks than others, although our operations in coastal and near coastal areas (particularly in the Gulf or East Coast regions of
U.S.) may be at higher risk for hurricanes and tropical cyclones. ii) Our company is exposed to physical risks such as tropical cyclones in a
number of ways: a) increased costs and business disruption because our facilities or equipment (vehicle fleet) could be damaged during a
disaster, b) we may need to increase resources and modify operations in order to support our customers in the event of a disaster, or c) our
larger supply chains may be disrupted as a result of natural disasters that will temporarily interfere with our ability to maintain operations.
Time horizon
Medium-term
Likelihood
About as likely as not
Magnitude of impact
Medium
Are you able to provide a potential financial impact figure?
Yes, a single figure estimate
Potential financial impact figure (currency)
0.02
Potential financial impact figure – minimum (currency)
Potential financial impact figure – maximum (currency)
Explanation of financial impact figure
If these events should occur, they would present a direct risk and financial impact to our operations of 2% of operational costs. The financial
implications would include damage to our facilities, vehicles, or other equipment that would increase our operational cost. For example, in 2012,
Ryder incurred a charge of $8 million for property damage to vehicles owned by full service lease customers due to superstorm Sandy.
Additionally, company-owned units with a carrying value of $15.7 million were damaged or completely destroyed as a direct result of the storm.
14
Ryder System, Inc. CDP Climate Change Questionnaire 2019 Friday, August 2, 2019
Likewise, our Customer's business may be financially impacted as well and we will be required to execute emergency contingency plans to
ensure our customers will be able to operate. Risks could be greater than 2% of the expected business for any site for each week of downtime.
Management method
Ryder has multiple protocols in place, ready to execute when natural disasters strike. We actively manage risks with an extensive network of
facilities, contingency plans and comprehensive emergency management plans. We update plans annually, perform third party risk
assessments of our facilities, and have dedicated property risk control specialists inspect and recommend improvements. Compliance to the
engineering controls and recommendations is strongly monitored and locations receive financial incentives to comply with necessary
improvements. The Ryder Risk Management team has also developed an Asset Protection Manual for Ryder operating facilities. The manual
provides guidance on how to maintain optimum, safe working conditions year round and to prepare the facility for the annual Engineering
Surveys. We have a comprehensive fuel supply network through Ryder's Energy Distribution Company (REDCO), which responds quickly to
man-made or natural disruptions in fuel supply. For example, Ryder helps customers get ready for Hurricanes and other approaching storms by
implementing contingency plans in storm areas that include fuel management. Critical freight loads are moved early and inventory loads
repositioned in advance to avoid potential storm impacts.
Cost of management
0
Comment
There are zero ($0) added costs associated with methods used to prepare and implement plans for potential physical climatic risks because
responding to natural disaster risks is fundamental to the services Ryder already provides to its Customers.
Identifier
Risk 3
Where in the value chain does the risk driver occur?
Customer
Risk type
Transition risk
15
Ryder System, Inc. CDP Climate Change Questionnaire 2019 Friday, August 2, 2019
Primary climate-related risk driver
Reputation: Shifts in consumer preferences
Type of financial impact
Company- specific description
i) A potential risk is the need to expand existing business services to support customer-driven initiatives related to the measurement, reduction,
and reporting of their own emission outputs. ii) As our Customers increasingly consider and quantify the direct and indirect impacts associated
with their carbon emissions, as a transportation service provider, our company is required to respond with emission outputs related to the
services we provide and to assist Customers to also measure the emissions associated with the movement of inbound raw materials and
outbound products within their supply chain network. Our company’s response has taken varied forms including responding to supplier
questionnaires or assisting Customers in specifying the most fuel efficient vehicles or options to reduce fuel usage by using alternative powered
vehicles.
Time horizon
Medium-term
Likelihood
Likely
Magnitude of impact
Medium-low
Are you able to provide a potential financial impact figure?
Yes, a single figure estimate
Potential financial impact figure (currency)
0.15
Potential financial impact figure – minimum (currency)
16
Ryder System, Inc. CDP Climate Change Questionnaire 2019 Friday, August 2, 2019
Potential financial impact figure – maximum (currency)
Explanation of financial impact figure
The financial implications of these identified risks are impossible to quantify long-term as much depends on other risk areas previously
discussed (i.e., regulatory risks). However, the impact of risks that are not planned for will certainly be significantly greater than those that are
anticipated. For example, low carbon fuel standard regulations in CA that mandate use of new fuels could increase fuel costs 5-15% and new
federal fuel efficiency standards for heavy duty trucks beyond 2018 is expected to increase vehicle costs.
Management method
We manage the inherent risks through multiple approaches including education, reduced emissions equipment purchases, and by tracking and
reducing emissions for our clients. Our investment in diverse types of fuel-efficient equipment plays an important role in helping customers
reduce emissions. To advance alternative fuels, Ryder educates its customers with email, electronic and social media communications. Ryder
works with many Customers to quantify transportation carbon emissions and to develop carbon reduction strategies that work for their business.
For example, Ryder helped a customer to reduce their carbon footprint by 7% through implementation of a lean supply chain design.
Complexity of new technologies and how they interact with each other will create many challenges from uptime to reliability to cost. With our
combination of know-how, relationships, and experience, Ryder enables private fleet operators and companies to outsource these challenges to
us in order to drive fleet efficiency and compliance. Ryder has experience in deploying these technologies in different types of duty cycles, as
well as understanding the operating cost and residual value impacts this has. This is bundled together in the Ryder ChoiceLease product giving
operators the best of that industry knowledge, maintenance capabilities, and asset disposition to help them get the best value and recognize the
efficiencies.
Cost of management
0
Comment
Costs associated with risk management efforts have been minimal ($0) as efforts have not required additional resources or significant
investments. By leveraging existing management and reporting tools, Ryder is able to provide customers visibility into the “carbon footprint”
associated with their transportation activities. In the future, there may be increased costs associated with supporting customer-driven initiatives,
depending on the complexity of regulatory requirements that are adopted.
17

Ryder System, Inc. CDP Climate Change Questionnaire 2019 Friday, August 2, 2019
C2.4
(C2.4) Have you identified any climate-related opportunities with the potential to have a substantive financial or strategic impact on
your business?
Yes
C2.4a
(C2.4a) Provide details of opportunities identified with the potential to have a substantive financial or strategic impact on your
business.
Identifier
Opp1
Where in the value chain does the opportunity occur?
Direct operations
Opportunity type
Products and services
Primary climate-related opportunity driver
Development and/or expansion of low emission goods and services
Type of financial impact
Increased revenue through demand for lower emissions products and services
Company-specific description
i. Increasing complexity of vehicle technologies, continually changing maintenance requirements, and new United States federal and state
regulatory, fuel, and emissions standards will drive more companies to outsource their transportation needs to a third party like Ryder that has
the technical knowledge and expertise to handle these areas. ii. Ryder helps customers manage and reduce their own risks and costs by
18
Ryder System, Inc. CDP Climate Change Questionnaire 2019 Friday, August 2, 2019
providing guidance and direction to our customers on regulatory rules and regulations that may impact their business. For example, a small to
medium size fleet client may not have dedicated environmental and regulatory personnel, and it will be advantageous to this client to have our
compliance specialists stay abreast of frequent regulatory changes rather than attempting to monitor these changes themselves.
Ryder published an updated GRI compliant Corporate Sustainability Report in 2019 with detailed emissions and activity data
(http://rydercsr.com). For the 2019 CDP response year, updates are provided to emission data (sections C6, C7 and C8), but at the time of CDP
publication, these were not fully audited. Ryder plans to resume full CDP reporting in 2020.
Time horizon
Medium-term
Likelihood
Likely
Magnitude of impact
Medium-low
Are you able to provide a potential financial impact figure?
Yes, a single figure estimate
Potential financial impact figure (currency)
0.24
Potential financial impact figure – minimum (currency)
Potential financial impact figure – maximum (currency)
Explanation of financial impact figure
The increased complexity associated with responding to new regulations may create new opportunities in outsourced transportation
management and network optimization services. New fuel economy and fuel efficiency standards could impact vehicle performance, fuel costs,
19
Ryder System, Inc. CDP Climate Change Questionnaire 2019 Friday, August 2, 2019
and overall operating costs of our vehicles. For example, new vehicle emissions standards will increase equipment costs and estimated fuel
consumption of tractor-trailers could drop as much 24%. This decrease could in turn increase Ryder revenues associated with leasing this new
fuel efficient equipment.
Strategy to realize opportunity
i.Ryder has operated successfully in a highly regulated environment for years. We expect to see more GHG emissions regulations and are well
positioned to service our customers with expertise and support. Starting in 2009, we assembled an Alternative Fuels and Vehicles Strategy
Team to review alternative fuel platforms and to identify new market opportunities. In 2010, Ryder expanded these efforts with an Alternative
Fuel Natural Gas Council. In 2015, Ryder announced one of the largest investments in its advanced energy portfolio: the launch of a new online
NGV maintenance training program for its entire North American maintenance network. The program provides the technician workforce with
knowledge of NGV platforms and configurations to better serve customers who commit to converting all or part of their fleets.
ii. To date, Ryder vehicles travelled over 150 million miles, and replaced 23.1 million gallons of diesel fuel with lower emission natural gas.
Ryder partnered with Anheuser-Busch to replace 66 of the beer company’s diesel tractors with compressed natural gas (CNG) powered
engines. With one of the largest fleets in the US, Ryder plays a leadership role in the natural gas market. Additionally, Ryder added certified
clean idle vehicles to its fleet meeting the EPA 2010 emissions standard. Ryder invests in purchasing strategies including evaluation of the
environmental and performance standards of suppliers.
Cost to realize opportunity
100,000,000
Comment
We will continue to invest in state-of-the-art vehicles, fleet management and diagnostic technologies that expand these capabilities and
maximize vehicle performance, cargo routing, fuel usage, and driving skills. For example, Ryder has invested $100 million to offer Customers
natural gas vehicles; has 27 NGV compliant maintenance facilities and more than 6,200 NGV trained technicians and support employees in AR,
AZ, CA, FL, GA, LA, MD, MI, MN, NY, PA, TN, TX, UT, WI and Canada (Ontario and Quebec).
Identifier
Opp2
Where in the value chain does the opportunity occur?
20
Ryder System, Inc. CDP Climate Change Questionnaire 2019 Friday, August 2, 2019
Direct operations
Opportunity type
Products and services
Primary climate-related opportunity driver
Development of new products or services through R&D and innovation
Type of financial impact
Better competitive position to reflect shifting consumer preferences, resulting in increased revenues
Company-specific description
i) Changing consumer behavior, particularly interest in full-service transportation solutions, has increased interest in environmentally-sound
transportation solutions, presenting future business opportunities for Ryder.
ii) Ryder provides full-service transportation solutions, which helps customers outsource their transportation needs and lower their carbon
emissions.
Time horizon
Medium-term
Likelihood
About as likely as not
Magnitude of impact
Medium
Are you able to provide a potential financial impact figure?
Yes, a single figure estimate
Potential financial impact figure (currency)
0
21
Ryder System, Inc. CDP Climate Change Questionnaire 2019 Friday, August 2, 2019
Potential financial impact figure – minimum (currency)
Potential financial impact figure – maximum (currency)
Explanation of financial impact figure
Ryder is continually developing new services for our outsourced transportation management and network optimization services customers. New
technologies including the new application RyderGyde, offering Uber Solutions for Business, and Ryder COOP will add new revenue from these
services. The potential financial impact will be indirect ($0).
Strategy to realize opportunity
i) Ryder proactively invests developing new services for our outsourced transportation management and network optimization services
customers. We help customers manage and reduce their own emissions and climate change risks through new technologies, market leadership,
and research and development For example, Ryder developed the RyderGyde application for customers to allow them to manage their fleet or
a single vehicle anywhere and anytime using a customized Ryder phone APP. This helps our customers more efficiently identify Ryder
locations, view fleet details and compare fuel rates.
Cost to realize opportunity
0
Comment
The cost to realize the opportunity is $0 as it is build into Ryder's service offerings and represents an optimization of current services.
Identifier
Opp3
Where in the value chain does the opportunity occur?
Customer
22

Ryder System, Inc. CDP Climate Change Questionnaire 2019 Friday, August 2, 2019
Opportunity type
Markets
Primary climate-related opportunity driver
Use of public-sector incentives
Type of financial impact
Increased revenues through access to new and emerging markets (e.g., partnerships with governments, development banks)
Company-specific description
i) Changing consumer behavior, particularly related to business demand for energy efficient technologies, has increased interest in
environmentally sound transportation solutions, presenting future business opportunities for Ryder. ii) The growth of the natural gas vehicle
market is an example of one such opportunity. Ryder has obtained federal and state grants for NG equipment, and has used that funding to
offset incremental costs associated with NG vehicle technologies for our Customers.
Time horizon
Medium-term
Likelihood
Virtually certain
Magnitude of impact
Medium-low
Are you able to provide a potential financial impact figure?
Yes, a single figure estimate
Potential financial impact figure (currency)
0.15
Potential financial impact figure – minimum (currency)
23
Ryder System, Inc. CDP Climate Change Questionnaire 2019 Friday, August 2, 2019
Potential financial impact figure – maximum (currency)
Explanation of financial impact figure
Federal and state incentive projects provided Ryder with a tremendous opportunity to expand our natural gas truck program with 830 units,
generating additional revenues from these new vehicles. These natural gas vehicles will be 15-19% more fuel efficient for our rental and
commercial full service lease customers to operate than diesel-powered units.
Strategy to realize opportunity
i) Ryder purchased nearly 1,000 heavy-duty natural gas powered trucks for use across 16 states and Canada and has transitioned more than
70 Customers into NG equipment. In MI, one of the state’s largest recycling companies is leasing natural gas powered trucks from Ryder. Ultra-
low LNG / CNG emission trucks were deployed into Ryder’s US based leasing and rental operations network. To support these trucks, Ryder
has partnered with its fuel suppliers to provide new natural gas refueling stations and works closely with its customers to identify and utilize
existing natural gas refueling infrastructure. As part of Ryder’s core product offering, the Company maintains these vehicles at their FMS
maintenance facilities. Each maintenance facility is properly equipped for the repair of natural gas vehicles. ii) Today, Ryder’s natural gas fleet
has replaced more than 23.1 million gallons of diesel fuel with domestically produced low-carbon LNG / CNG. Based on estimates using CA’s
Carl Moyer program guidelines, the use of these natural gas vehicles has also reduced emissions by more than 52,904 MT CO2e. Ryder has
assisted more than 70 Customers converting to NG vehicles including Anheuser Busch, Blu LNG, CEVA, Dean Foods, Golden Eagle
Distributing, Northeast Foods and more. Ryder has developed a “Go To Market” outreach strategy that targets key national accounts and
customers and has delivered joint training with OEMs to national and local Ryder sales teams.
Cost to realize opportunity
95,000,000
Comment
Ryder invested more than $95 million annually in Maintenance infrastructure associated with NG vehicles combined.
C2.5
(C2.5) Describe where and how the identified risks and opportunities have impacted your business.
24

Ryder System, Inc. CDP Climate Change Questionnaire 2019 Friday, August 2, 2019
Impact Description
Products and
services
Impacted for some
suppliers, facilities, or
product lines
a) Ryder has assisted more than 70 Customers converting to NG vehicles including Anheuser Busch, Blu LNG,
CEVA, Dean Foods, Golden Eagle Distributing, Northeast Foods and more.
b) Ryder's low carbon products and services such efficient vehicles and alternative fuel vehicles have had a
medium-high impact on business.
Supply chain
and/or value
chain
Impacted for some
suppliers, facilities, or
product lines
a) We have a comprehensive fuel supply network through Ryder's Energy Distribution Company (REDCO),
which responds quickly to man-made or natural disruptions in fuel supply. For example, Ryder helps customers
get ready for Hurricanes and other approaching storms by implementing contingency plans in storm areas that
include fuel management. Critical freight loads are moved early and inventory loads repositioned in advance to
avoid potential storm impacts.
b) Ryder’s logistics and transportation support services have had a medium-high impact to the business such
as support to federal and state governments as well as to non-profit disaster relief agencies during times of
disaster.
Adaptation and
mitigation
activities
Impacted for some
suppliers, facilities, or
product lines
a) We have a comprehensive fuel supply network through Ryder's Energy Distribution Company (REDCO),
which responds quickly to man-made or natural disruptions in fuel supply. For example, Ryder helps customers
get ready for Hurricanes and other approaching storms by implementing contingency plans in storm areas that
include fuel management. Critical freight loads are moved early and inventory loads repositioned in advance to
avoid potential storm impacts.
b) Ryder’s logistics and transportation support services have had a medium-high impact to the business such
as support to federal and state governments as well as to non-profit disaster relief agencies during times of
disaster.
Investment in
R&D
Impacted for some
suppliers, facilities, or
product lines
a) Ryder invests in state-of-the-art vehicles, fleet management and diagnostic technologies that expand these
capabilities and maximize vehicle performance, cargo routing, fuel usage, and driving skills.
b) Ryder’s investment in R&D for new low carbon vehicles and technologies has had a medium-high impact to
the business.
25
Ryder System, Inc. CDP Climate Change Questionnaire 2019 Friday, August 2, 2019
Operations Impacted a) Our operations have reduced operating costs by investing in energy efficiency projects.
b) Ryder’s operational risks and opportunities have had a medium impact to the business.
Other, please
specify
We have not identified
any risks or
opportunities
No other risks or opportunities.
C2.6
(C2.6) Describe where and how the identified risks and opportunities have been factored into your financial planning process.
Relevance Description
Revenues Impacted for some a) Ryder has developed a “Go To Market” outreach strategy that targets key national accounts and
suppliers, facilities, or customers and has delivered joint training with OEMs to national and local Ryder sales teams.
product lines b) This outreach strategy has had a high impact on strategy and financial planning.
Operating costs Impacted a) Ryder has included compliance in our operating costs planning. In addition, we include potential
savings from efficiency projects.
b) Operating costs have had a medium-low impact to our strategy and financial planning.
Capital expenditures / Impacted for some a) Ryder invests in state-of-the-art vehicles, fleet management and diagnostic technologies that expand
capital allocation suppliers, facilities, or these capabilities and maximize vehicle performance, cargo routing, fuel usage, and driving skills.
product lines b) Capital expenditures/capital allocation has had a medium-high impact to our strategy and financial
planning.
Acquisitions and
divestments
Not impacted a) Identified risks and opportunities from acquisitions and divestments have not impacted strategy and
financial planning.
26
Ryder System, Inc. CDP Climate Change Questionnaire 2019 Friday, August 2, 2019
b) Acquisitions and divestments have had no impact to our strategy and financial planning.
Access to capital Not impacted a) Identified risks and opportunities from access to capital have not impacted strategy and financial
planning.
b) Access to capital has had no impact to our strategy and financial planning.
Assets Impacted for some
suppliers, facilities, or
product lines
a) The Ryder Risk Management team has developed an Asset Protection Manual for Ryder operating
facilities. The manual provides guidance on how to maintain optimum, safe working conditions year
round and to prepare the facility for the annual Engineering Surveys.
b) Assets have had a medium impact to our strategy and financial planning.
Liabilities Not impacted a) Identified risks and opportunities from liabilities have not impacted strategy and financial planning.
b) Liabilities have had no impact to our strategy and financial planning.
Other We have not identified any
risks or opportunities
No other risks or opportunities.
C3. Business Strategy
C3.1
(C3.1) Are climate-related issues integrated into your business strategy?
Yes
C3.1a
(C3.1a) Does your organization use climate-related scenario analysis to inform your business strategy?
No, but we anticipate doing so in the next two years
27
Ryder System, Inc. CDP Climate Change Questionnaire 2019 Friday, August 2, 2019
C-AC3.1b/C-CE3.1b/C-CH3.1b/C-CO3.1b/C-EU3.1b/C-FB3.1b/C-MM3.1b/C-OG3.1b/C-
PF3.1b/C-ST3.1b/C-TO3.1b/C-TS3.1b
(C-AC3.1b/C-CE3.1b/C-CH3.1b/C-CO3.1b/C-EU3.1b/C-FB3.1b/C-MM3.1b/C-OG3.1b/C-PF3.1b/C-ST3.1b/C-TO3.1b/C-TS3.1b) Indicate
whether your organization has developed a low-carbon transition plan to support the long-term business strategy.
In development, we plan to complete it within the next 2 years
C3.1c
(C3.1c) Explain how climate-related issues are integrated into your business objectives and strategy.
Ryder’s overall business strategy of growing fleet management and supply chain outsourcing integrates and advances our commitment to reducing
greenhouse gas (GHG) emissions. With increasing business growth, we are delivering more efficient, sustainable transportation solutions resulting in
emission reductions. i) Our business strategy has been influenced in our internal process for collecting and reporting information to influence energy
usage and identify energy savings, which is regularly updated and occurs across multiple platforms. Energy savings are pursued through improved fuel
economy, energy audits, energy tracking through internal software, employee engagement campaigns through regular communication with the field,
implementation and improvement of internal equipment standards. Our business strategy has also influenced how we track potential impacts from
diverse state or federal regulations, including climate change related regulations. ii) For example, since fuel usage is a fluctuating fleet expense,
Ryder is identifying ways to reduce fuel costs. Ryder is working closely with manufacturers to incorporate fuel efficiencies into trucks such as
aerodynamic features or researching and implementing low carbon technologies including electric or alternative fuel trucks. Through the Ryder
Resource Conservation programs, we linked our business strategy to an energy reduction target of 20% below 2009 by 2020. To reduce our facility
level energy usage, we launched a Ryder Energy Challenge Program in 2012 and expanded it to the Resource Conservation Program. External factors
influencing our strategy include customer needs for environmental metrics such as measuring GHG outputs associated with their transportation supply
chains. Our most substantial climate-related business decisions are reflected in vehicle investments, which is driven by the need for adaptation in using
fuel efficient vehicles plus an opportunity to develop green business as a differentiator versus competitors. iii) Primary climate change aspects
influencing our business strategy: a) Mitigating risks: reduce the potential financial impact from state or federal regulations, including climate change b)
Customer compliance: support regulatory issues for our customers. iv) The most important component of our short-term strategy influenced by climate
change is in response to market demands for cost-effective, environmentally friendly alternative fuel solutions. Our short-term strategy is to develop
fuel-efficient and low carbon offerings for our customers and help them track their GHG performance while tracking and improving our own
performance: a) Investing in fuel efficient vehicles: Our fleet provides new engine technologies and vehicles specified for optimum fuel efficiency. We
28
Ryder System, Inc. CDP Climate Change Questionnaire 2019 Friday, August 2, 2019
follow guidelines provided by the Environmental Protection Agency (EPA)’s SmartWay® Transport program. b) Optimize fleet performance: Ryder is
improving fuel-efficient vehicle offerings such as the redesigned fuel efficient MetroVan that reports 25 miles per gallon. In addition, Ryder’s fleet
program implements preventive maintenance schedules for even the most routine care, including checking tire conditions and inflation rates when
vehicles stop to refuel to ensure optimum performance. c) Reducing Idling time: Through Ryder's FleetCare and RydeSmart, fleet owners can
optimize routes and monitor idle times, all which mitigate rising fuel costs. d) Investing in new products and technologies: Ryder was the first national
maintenance service provider to convert its entire bulk oil program to low viscosity, high efficiency 10W-30 grade engine oil. Using the more efficient oil,
enables customers to achieve up to a 1.5 percent improvement in fuel economy translating into a collective reduction of 110,000 metric tonnes (MT)
CO2e annually. e) Recycling shop waste: We upgrade our facilities and implement new programs to reduce environmental impacts of automotive
waste on the environment. In 2017, we recycled 2.4 million gallons (gal) of used oil, 811,704 gal of oily water, 10,354 drums of used oil filters, 36,780
gal of solvent and 128,912 batteries, which is a reduction of almost 20,000 MT CO2e. f) Tracking GHG and energy: 1) Vehicle GHG performance: With
the help of SmartWay Verified Technologies, we offer our customers industry-leading vehicle performance, optimized fuel efficiency and reduced
carbon emissions. The EPA SmartWay® Program is a key sustainability initiative to promote energy efficiency and reduce GHG emissions. 2) Facility
energy use: our strategy is to monitor, track and reduce electricity use. Our Resource Conservation Program targets energy and water reduction at all
Ryder facilities. Locations have committed to saving energy with energy efficient shop improvements. Each shop adopts a Statement of Commitment
outlining their goals including conserve energy resources, incorporate energy efficiency into daily operations, invest in energy efficiency equipment and
upgrades, and engage all employees to save energy. v) The most important components of our long-term strategy influenced by climate change are
business strategies to ensure disaster preparedness, our capital investment to support and expand alternative fuel vehicles and infrastructure to
service our natural gas fleet. a) Our disaster preparedness strategies include third party risk onsite audits of operating facilities. Controls mitigate risks
that could lead to loss of property due to fire, windstorm, flood and other physical perils. Compliance is monitored for facility financial incentives. Our
Asset Protection Manual provides guidance to maintain optimum, safe working conditions year round and prepare facilities for annual Engineering
Surveys. b) Investments in low-carbon technologies include offering alternative fuel and advanced technology vehicles to our customer fleet as part of
a strategic process to advance natural gas ahead of regulatory drivers. Ryder’s market leadership in operating advanced vehicle technologies in
commercial truck applications also includes Ryder’s natural gas vehicle (NGV) and maintenance solutions offering. Ryder has made significant
investments to purchase close to 1,000 alternative fuel vehicles. Natural gas vehicles reduce fuel costs and well-to-wheel CO2 emissions by 25%. In
addition, Ryder will roll out electric pickup trucks to their customers in a new partnership with electric truck manufacturer Workhorse. The trucks will
have an estimated 75 mpg fuel efficiency rating in all electric operation. VI) Fuel efficiency is a key strategic advantage for our business and provides
us with both a short-term and long-term strategic advantage. By offering fuel-efficient vehicles and services to our customers, we develop long-
standing relationships that drive future revenue and business growth. This aspect of our service offering strengthens our customer relations and
business retention.
29

Ryder System, Inc. CDP Climate Change Questionnaire 2019 Friday, August 2, 2019
C3.1g
(C3.1g) Why does your organization not use climate-related scenario analysis to inform your business strategy?
i. Ryder is not using a single analysis specifically targeted at climate-related scenarios, because we implement a wide-ranging risk assessment
program that considers financial, market, weather and sustainability and other risks that are fully integrated in the business strategy review.
ii. Ryder is not planning to add a stand-alone climate related scenario analysis in the near future since our company is already applying a multi-prong
strategy approach. However, Ryder is continuously reviewing opportunities to improve current risk programs.
C4. Targets and performance
C4.1
(C4.1) Did you have an emissions target that was active in the reporting year?
Both absolute and intensity targets
C4.1a
(C4.1a) Provide details of your absolute emissions target(s) and progress made against those targets.
Target reference number
Abs 1
Scope
Scope 1+2 (location-based)
% emissions in Scope
15
30
Ryder System, Inc. CDP Climate Change Questionnaire 2019 Friday, August 2, 2019
Targeted % reduction from base year
20
Base year
2009
Start year
2012
Base year emissions covered by target (metric tons CO2e)
84,028
Target year
2020
Is this a science-based target?
No, and we do not anticipate setting one in the next 2 years
% of target achieved
100
Target status
Underway
Please explain
Ryder’s absolute target aims to reduce stationary emissions against a 2009 baseline and the goal is to achieve an emissions reduction of 20%
by 2020 for the FMS shops, focusing on electricity and natural gas consumption. FMS shops represent 71% of the Ryder portfolio facility count.
FMS 2009 Scope 1 and 2 emissions represent 15% of the total 2009 Scope 1 and 2 emissions. In 2012, Ryder launched a pilot energy
challenge for high energy use locations. Then in 2013, the Resource Conservation Program (RCP) was initiated to target FMS, SCS and Admin
locations across the US and Canada. Currently we are expanding internal processes to facilitate emission reduction projects on a larger
strategic scale for all owned sites being upgraded or newly constructed. A primary goal is to identify best practices for electricity and natural
gas reductions. The RCP framework includes three program keystones that will help managers reduce energy, water, sewer, and waste costs.
31
Ryder System, Inc. CDP Climate Change Questionnaire 2019 Friday, August 2, 2019
The first keystone is designed to implement resource saving programs; the second keystone will make resource use more efficient in operations
and processes while the third keystone will prepare for future business needs. The program encourages behavioral changes through employee
engagement and energy champions. No/Low cost changes are continually reviewed to encourage energy savings such as efficient shop
lighting. Shop Managers are constantly encouraged to adopt routine repair and maintenance programs, and utility energy audits are regularly
conducted. Employees are provided checklists and guidelines to stay current on energy saving measures including but not limited to:
temperature control for HVAC and appliances, lighting management tips, and equipment maintenance. The tools are distributed at monthly
meetings, dedicated energy conservation websites and targeted email roll-outs. Several campaigns have been designed to focus on seasonal
energy management improvements. Dashboards are provided to locations with current energy use. Energy efficiency education increased by
providing state and utility guidelines including rebate programs, allowing improved tracking, and creating energy webinars and educational
materials to reduce energy use. In 2017, Ryder began a zero-based budgeting process to increase resource conservation which includes
energy saving and conservation initiatives.
C4.1b
(C4.1b) Provide details of your emissions intensity target(s) and progress made against those target(s).
Target reference number
Int 1
Scope
Scope 1+2 (location-based)
% emissions in Scope
15
Targeted % reduction from base year
20
Metric
Metric tons CO2e per unit of service provided
32
Ryder System, Inc. CDP Climate Change Questionnaire 2019 Friday, August 2, 2019
Base year
2009
Start year
2009
Normalized base year emissions covered by target (metric tons CO2e)
0.94
Target year
2020
Is this a science-based target?
% of target achieved
100
Target status
Underway
Please explain
Ryder’s intensity target is to reduce emissions 20% by 2020 per unit of service provided (owned trucks). This target is measured by calculating
FMS business Scope 1 (stationary) and Scope 2 emissions – representing operations - divided by our total number of owned vehicles,
described as our “unit of service provided.” This target does not include our mobile scope 1 or scope 3 emissions. Ryder is currently
investigating science-based target methods for future greenhouse gas reduction goals.
Ryder completed 9 years of the total time to target completion and exceeded the target (0.75 MTCO2e/unit) with a current emission intensity of
0.47 MTCO2e/unit compared to the 2009 baseline (0.94 MTCO2e/unit).
Intensity target reductions will be obtained even if absolute emissions are increased due to our business growth in fleet services provided, which
is approximately 3.1% annually. Our absolute emissions include operation scope 1 stationary and scope 2 emissions, which – at 62,045
MTCO2e - already exceeded our target of 67,223 MT CO2e in 2020. Our original 20% intensity reduction target results in an absolute emission
33

Ryder System, Inc. CDP Climate Change Questionnaire 2019 Friday, August 2, 2019
decrease of 16,806 MTCO2e (or 3% reduction) and an intensity emission decrease of 0.19 MTCO2e per unit of service provided.
% change anticipated in absolute Scope 1+2 emissions
-11
% change anticipated in absolute Scope 3 emissions
0
C4.2
(C4.2) Provide details of other key climate-related targets not already reported in question C4.1/a/b.
C4.3
(C4.3) Did you have emissions reduction initiatives that were active within the reporting year? Note that this can include those in the
planning and/or implementation phases.
Yes
C4.3a
(C4.3a) Identify the total number of initiatives at each stage of development, and for those in the implementation stages, the
estimated CO2e savings.
Number of initiatives Total estimated annual CO2e savings in metric tonnes CO2e (only for rows marked *)
Under investigation 0 0
To be implemented* 1 189
Implementation commenced* 1 5,887
Implemented* 5 203,620
34
Ryder System, Inc. CDP Climate Change Questionnaire 2019 Friday, August 2, 2019
Not to be implemented 0 0
C4.3b
(C4.3b) Provide details on the initiatives implemented in the reporting year in the table below.
Initiative type
Energy efficiency: Building services
Description of initiative
Lighting
Estimated annual CO2e savings (metric tonnes CO2e)
3,342
Scope
Scope 2 (location-based)
Voluntary/Mandatory
Voluntary
Annual monetary savings (unit currency – as specified in C0.4)
663,787
Investment required (unit currency – as specified in C0.4)
6,290,784
Payback period
1-3 years
Estimated lifetime of the initiative
35
Ryder System, Inc. CDP Climate Change Questionnaire 2019 Friday, August 2, 2019
3-5 years
Comment
As of December 2017, Ryder had completed or in process, more than 219 projects to convert facilities from energy-intensive metal halides
lighting fixtures to efficient LED technology. In researching the optimal lighting specification, Ryder determined that the energy efficiency of the
metal halide declines by 30% after the 1st year of operation and continues to decline over the life of the lamp. This loss in energy efficiency
results in reduced lumens and lower light levels. LED lights last 5 times as long as fluorescent
lights and use at least 75% less energy than incandescent lighting and have an approximately 40% longer lifetime than fluorescent lights. LED
lamps do not contain mercury, which is an added benefit in environmental impacts. Therefore, Ryder’s customers, shareholders, and employees
all benefit from initiatives that produce significant reductions in energy consumption and therein reduced scope 2 GHG emissions.
Initiative type
Process emissions reductions
Description of initiative
Changes in operations
Estimated annual CO2e savings (metric tonnes CO2e)
12,616
Scope
Scope 3
Voluntary/Mandatory
Voluntary
Annual monetary savings (unit currency – as specified in C0.4)
68,159,038
Investment required (unit currency – as specified in C0.4)
272,636,152
36
Ryder System, Inc. CDP Climate Change Questionnaire 2019 Friday, August 2, 2019
Payback period
4 - 10 years
Estimated lifetime of the initiative
11-15 years
Comment
Ryder reduces emissions significantly through RydeSmart. In existence since 2008, this program delivers up to a 10-15% reduction in fuel
consumption through better routing, driving habits and reduced unauthorized use and idle time, directly leading to avoided scope 1 emissions
for our customers. RydeSmart is a full-featured GPS fleet location, tracking, and vehicle performance system which lowers operating expenses
and allows customers to know where their fleet is at all times. Vehicles can be easily monitored from a central location. RydeSmart allows
customers to pinpoint their vehicle location, get accurate mileage or performance data or find out which truck is closest to their location. Ryder
annually reduces approximately 12,616 MTCO2e of customers' scope 1 emissions with the RydeSmart telematics program. Units that are
equipped with RydeSmart achieved a 10% reduction in vehicle speeding, hard braking and reduced idling, resulting in 0.1 gallons/mile fuel
savings. The emission reduction estimates are based on fuel savings from RydeSmart, miles travelled, and average mileage. b) Emission
factors: Ryder established the SmartWay Tool as the technical basis and source for all mobile emission factors. Scope 1 and Scope 3 mobile
emissions are based on a factor of 22.2 lbs of CO2 per gallon of diesel fuel, as documented in the US EPA Office of Transportation and Air
Quality EPA 420-F-05-001 dated February 2005, and which is the basis for all SmartWay CO2 emission calculations.
Initiative type
Process emissions reductions
Description of initiative
Process materials selection
Estimated annual CO2e savings (metric tonnes CO2e)
129,561
Scope
Scope 1
37
Ryder System, Inc. CDP Climate Change Questionnaire 2019 Friday, August 2, 2019
Voluntary/Mandatory
Voluntary
Annual monetary savings (unit currency – as specified in C0.4)
8,646,713
Investment required (unit currency – as specified in C0.4)
16,551,553
Payback period
<1 year
Estimated lifetime of the initiative
3-5 years
Comment
Ryder is the first national maintenance service provider to convert its entire bulk oil program to low viscosity, high efficiency 10W-30 grade
engine oil. Using the more efficient oil, enables customers to achieve up to a 1.5 percent improvement in fuel economy translating into a
collective reduction of 130,000 metric tonnes (MT) CO2e annually.
Initiative type
Process emissions reductions
Description of initiative
New equipment
Estimated annual CO2e savings (metric tonnes CO2e)
51,320
Scope
Scope 1
38
Ryder System, Inc. CDP Climate Change Questionnaire 2019 Friday, August 2, 2019
Voluntary/Mandatory
Voluntary
Annual monetary savings (unit currency – as specified in C0.4)
6,664,105
Investment required (unit currency – as specified in C0.4)
95,000,000
Payback period
11-15 years
Estimated lifetime of the initiative
16-20 years
Comment
Value-added differentiation of the full service leasing, maintenance and commercial rental services, as well as continued commitment to offer
innovative products and solutions, such as natural gas vehicles, has been and will continue to be Ryder's emphasis. To date, Ryder has a
combined distance of over 150 million miles of natural gas vehicle experience where the Company has replaced more than 23.1 million gallons
of diesel fuel with lower emission domestically produced natural gas. In markets where Ryder has natural gas vehicles running in customer
operations, the company has engineered its maintenance facilities to be
compliant for the indoor services of natural gas vehicles. Ryder currently operates a fleet of 875 natural gas vehicles, and 27 natural gas
compliant maintenance facilities, with 12 additional facilities scheduled for upgrades. The calculation is based on Argonne Lab Data assuming
0.061 g/BTU for CNG versus 0.08 g/BTU for diesel. The differential results in emission reductions of 20% less emissions since 2014. Savings
were calculated by comparing costs of diesel versus CNG energy equivalent basis using the U.S. Department of Energy Clean Cities Alternative
Fuel Price Report (2017).
C4.3c
(C4.3c) What methods do you use to drive investment in emissions reduction activities?
Method Comment
39
Ryder System, Inc. CDP Climate Change Questionnaire 2019 Friday, August 2, 2019
Dedicated budget Ryder’s on-going commitment to assist companies, across multiple industries reduce fuel costs, lower carbon output, and meet their
for energy environmental objectives, is achieved through tracking emerging fleet technologies, incentive programs and government rebates to
efficiency deliver competitive rates for customers interested in alternative fuel vehicles. As an example, Ryder facility lighting upgrade projects
are incentivized by providing corporate project management support. The environmental corporate team solicits utility rebates to offset
costs and provides technical, project management support to complete upgrades. Over 219 energy efficient lighting projects have been
completed at an average per project upgrade cost of $28,725 and an average facility savings of 31,961 kWh. Facility lighting upgrades
result in safer and more efficient work spaces. Cost savings and incentives to operating facilities are sustained with oversight of project
budget estimates and management by the corporate environmental team.
C4.5
(C4.5) Do you classify any of your existing goods and/or services as low-carbon products or do they enable a third party to avoid
GHG emissions?
Yes
C4.5a
(C4.5a) Provide details of your products and/or services that you classify as low-carbon products or that enable a third party to avoid
GHG emissions.
Level of aggregation
Company-wide
Description of product/Group of products
The EPA SmartWay® Program is central to Ryder’s overall emission reduction strategy and is a key sustainability initiative to promote energy
efficiency and reduce greenhouse gas GHG emissions (GHG). With best-in-class SmartWay Verified Technologies, Ryder offers its customers
industry-leading vehicle performance, optimized fuel efficiency, and reduced carbon emissions. Ryder also reduces emissions significantly
through the RydeSmart telematics program. This program is designed to deliver up to a 10-15% reduction in fuel consumption through
40
Ryder System, Inc. CDP Climate Change Questionnaire 2019 Friday, August 2, 2019
improved routing, driving habits and reduction of unauthorized use and idle time, which directly leads to avoided scope 1 emissions for our
customers. The program has been in existence since 2008, delivering annual reductions since its inception. RydeSmart is a full-featured GPS
fleet location- tracking, and vehicle performance management system which lowers operating expenses and allows customers to know where
their fleet is at all times and monitor driver performance. Vehicles can be easily monitored from a central location, anytime, anywhere.
RydeSmart provides customers with the ability to pinpoint their vehicle location, get accurate mileage or performance data or find out which
truck is closest to their location.
Are these low-carbon product(s) or do they enable avoided emissions?
Avoided emissions
Taxonomy, project or methodology used to classify product(s) as low-carbon or to calculate avoided emissions
Other, please specify
SmartWay Tool
% revenue from low carbon product(s) in the reporting year
0.1
Comment
Ryder reduces approximately 12,616 MTCO2e of scope 1 emissions for our customers annually through the RydeSmart telematics program.
Emissions reductions are calculated based on the following methodology and assumptions: Ryder Full Service Lease units that are equipped
with RydeSmart achieved a 10% reduction in vehicle speeding and hard braking, and a 10% reduction in reduced idling, resulting in 0.1
gallons/mile fuel savings improvement. The emission reduction estimates are based on fuel savings from RydeSmart vehicles, calculated
based on total annual miles travelled, average miles per gallon of fuel use, and applying the 0.1 gallons/mile fuel savings. Ryder has established
the SmartWay Tool as the technical basis and source for all mobile emission factors. Scope 1 and Scope 3 mobile emissions are based on a
factor of 22.2 lbs of CO2 per gallon of diesel fuel, as documented in the US EPA Office of Transportation and Air Quality EPA 420-F-05-001
dated February 2005, and which is the basis for all SmartWay CO2 emission calculations. Ryder is computing CO2 emission reductions only.
CO2 has a GWP of 1.
Level of aggregation
41
Ryder System, Inc. CDP Climate Change Questionnaire 2019 Friday, August 2, 2019
Group of products
Description of product/Group of products
Alternative Fuel Fleet: Ryder has built an extensive natural gas vehicle network that allows customer to lease alternative fuel vehicles and use
Ryder natural gas fueling stations and repair facilities. Natural gas vehicles are built from the ground up to deliver better emissions performance
than conventional diesel vehicles. A natural gas fleet can help cut fuel costs, reduce carbon footprint and tap into more predictable fuel pricing.
In addition to lowering fuel costs, natural gas vehicles can reduce well-to-wheel CO2 emissions by as much as 25% and are powered by a more
secure source of domestic energy.
Are these low-carbon product(s) or do they enable avoided emissions?
Avoided emissions
Taxonomy, project or methodology used to classify product(s) as low-carbon or to calculate avoided emissions
Other, please specify
ANL: 0.061 g/BTU CNG vs 0.08 diesel
% revenue from low carbon product(s) in the reporting year
0.01
Comment
By 2017, Ryder had over 150 million miles using natural gas vehicles which is compared to the emissions created if these miles were run on
diesel fuel. The calculation is based on Argonne Lab Data assuming 0.061 g/BTU for CNG versus 0.08 g/BTU for diesel. The differential results
in emission reductions of 20% less emissions since 2014. Savings were calculated by comparing costs of diesel versus CNG energy equivalent
basis using the U.S. Department of Energy Clean Cities Alternative Fuel Price Report (2017). Revenue was 0.0001%, which did not fit in the
field above.
Level of aggregation
Group of products
Description of product/Group of products
42

Ryder System, Inc. CDP Climate Change Questionnaire 2019 Friday, August 2, 2019
Supply Chain Solutions (SCS): Through Ryder SCS services, customers can more precisely align inbound and outbound shipments,
synchronize returns with optimized fleet use and arrange backhauls that offset transportation costs and minimize empty miles.
Are these low-carbon product(s) or do they enable avoided emissions?
Avoided emissions
Taxonomy, project or methodology used to classify product(s) as low-carbon or to calculate avoided emissions
Other, please specify
SmartWay Tool
% revenue from low carbon product(s) in the reporting year
0.02
Comment
Ryder helped a customer to reduce their carbon footprint by 7% through implementation of a lean supply chain design that includes optimal
transportation and fleet solutions, including the use of a dedicated fleet. Through multi-stop truckload routing, total miles driven were reduced by
nearly 50%.
Level of aggregation
Group of products
Description of product/Group of products
Preventative Maintenance: Ryder offers customers quality preventive and ongoing maintenance to optimize vehicle and fleet performance.
Better-maintained vehicles are more efficient and burn less fuel. Ryder has an extensive program that implements rigorous preventive
maintenance schedules for even the most routine care by checking tire conditions and inflation rates every time vehicles stop to refuel.
Are these low-carbon product(s) or do they enable avoided emissions?
Avoided emissions
Taxonomy, project or methodology used to classify product(s) as low-carbon or to calculate avoided emissions
Other, please specify
43
Ryder System, Inc. CDP Climate Change Questionnaire 2019 Friday, August 2, 2019
SmartWay Tool
% revenue from low carbon product(s) in the reporting year
0.07
Comment
Ryder’s Total Tire Management program utilizes low rolling resistance fuel efficient original tires and retreads to meet our customer’s
requirements for energy savings vehicles. We outfit all of our trailers and most of our rental tractors with the same fuel efficient tires. Operating
on properly inflated fuel efficient tires can represent up to 4% in fuel savings compared to a similar vehicle operating on on-fuel efficient tires.
C5. Emissions methodology
C5.1
(C5.1) Provide your base year and base year emissions (Scopes 1 and 2).
Scope 1
Base year start
January 1, 2009
Base year end
December 31, 2009
Base year emissions (metric tons CO2e)
473,934
Comment
Scope 2 (location-based)
44
Ryder System, Inc. CDP Climate Change Questionnaire 2019 Friday, August 2, 2019
Base year start
January 1, 2009
Base year end
December 31, 2009
Base year emissions (metric tons CO2e)
96,177
Comment
Scope 2 (market-based)
Base year start
January 1, 2009
Base year end
December 31, 2009
Base year emissions (metric tons CO2e)
96,177
Comment
C5.2
(C5.2) Select the name of the standard, protocol, or methodology you have used to collect activity data and calculate Scope 1 and
Scope 2 emissions.
The Climate Registry: General Reporting Protocol
The Greenhouse Gas Protocol: A Corporate Accounting and Reporting Standard (Revised Edition)
45
Ryder System, Inc. CDP Climate Change Questionnaire 2019 Friday, August 2, 2019
Other, please specify
US EPA Office of Transportation and Air Quality Emission Facts EPA420 -F-05-001
C5.2a
(C5.2a) Provide details of the standard, protocol, or methodology you have used to collect activity data and calculate Scope 1 and
Scope 2 emissions.
US EPA Office of Transportation and Air Quality Emission Facts EPA420 -F-05-001
C6. Emissions data
C6.1
(C6.1) What were your organization’s gross global Scope 1 emissions in metric tons CO2e?
Reporting year
Gross global Scope 1 emissions (metric tons CO2e)
749,903
Start date
January 1, 2018
End date
December 31, 2018
Comment
46
Ryder System, Inc. CDP Climate Change Questionnaire 2019 Friday, August 2, 2019
C6.2
(C6.2) Describe your organization’s approach to reporting Scope 2 emissions.
Row 1
Scope 2, location-based
We are reporting a Scope 2, location-based figure
Scope 2, market-based
We are reporting a Scope 2, market-based figure
Comment
We continue our due diligence to obtain as much Market-Based information as possible from suppliers and from publicly available information.
C6.3
(C6.3) What were your organization’s gross global Scope 2 emissions in metric tons CO2e?
Reporting year
Scope 2, location-based
118,889
Scope 2, market-based (if applicable)
117,963
Start date
January 1, 2018
End date
December 31, 2018
47
Ryder System, Inc. CDP Climate Change Questionnaire 2019 Friday, August 2, 2019
Comment
We were able to obtain Market-Based factors for 17% of scope 2 emissions.
C6.4
(C6.4) Are there any sources (e.g. facilities, specific GHGs, activities, geographies, etc.) of Scope 1 and Scope 2 emissions that are
within your selected reporting boundary which are not included in your disclosure?
Yes
C6.4a
(C6.4a) Provide details of the sources of Scope 1 and Scope 2 emissions that are within your selected reporting boundary which are
not included in your disclosure.
Source
Heating Oil
Relevance of Scope 1 emissions from this source
Emissions are not relevant
Relevance of location-based Scope 2 emissions from this source
No emissions from this source
Relevance of market-based Scope 2 emissions from this source (if applicable)
No emissions from this source
Explain why this source is excluded
Heating oil usage for 8 locations was not available at the time we submitted this report and they represent approximately 0.25% (2,155 MTCO2)
of our total emissions (0.29% of scope 1), including the other omissions.
48
Ryder System, Inc. CDP Climate Change Questionnaire 2019 Friday, August 2, 2019
Source
Lighting Flat Rate Meters
Relevance of Scope 1 emissions from this source
No emissions from this source
Relevance of location-based Scope 2 emissions from this source
Emissions are not relevant
Relevance of market-based Scope 2 emissions from this source (if applicable)
Emissions are not relevant
Explain why this source is excluded
There are approximately 138 facilities that have outdoor lighting meters where actual kWh usage is not provided. The emissions were estimated
at 2,725 MTCO2. This represents 0.3% of the total Scope 1 and 2 inventory (2% of scope 2), including the other omissions.
Source
Refrigerants
Relevance of Scope 1 emissions from this source
Emissions are not relevant
Relevance of location-based Scope 2 emissions from this source
No emissions from this source
Relevance of market-based Scope 2 emissions from this source (if applicable)
No emissions from this source
Explain why this source is excluded
49

Ryder System, Inc. CDP Climate Change Questionnaire 2019 Friday, August 2, 2019
Relevance was determined from estimating the size of refrigerants emissions as compared to a materiality threshold of 5%. Since refrigerant
emissions make up 0.4% (3,663 MTCO2) of the scope 1 and 2 emissions (0.5% of scope 1), they are considered not material and therefore not
relevant. Ryder also considers if emissions are relevant by determining if Ryder can drive reductions, the cost-benefit of gathering data,
stakeholder expectations, and potential uses of the data (including the other omissions).
Source
HVAC
Relevance of Scope 1 emissions from this source
Emissions are not relevant
Relevance of location-based Scope 2 emissions from this source
No emissions from this source
Relevance of market-based Scope 2 emissions from this source (if applicable)
No emissions from this source
Explain why this source is excluded
HVAC emissions are excluded as they are not relevant to our emissions. Using TCR GRP’s screening method and assuming a conservative
1,165 A/C units (1 per site) and using R-407C refrigerants results in emissions of 17,778 MTCO2e. This is 2% of scope 1 and 2 (2.4% of scope
1) emissions and does not cause the materiality threshold of 5% to become exceeded (including the other omissions).
Source
CH4/N2O Emissions
Relevance of Scope 1 emissions from this source
Emissions are not relevant
Relevance of location-based Scope 2 emissions from this source
50
Ryder System, Inc. CDP Climate Change Questionnaire 2019 Friday, August 2, 2019
No emissions from this source
Relevance of market-based Scope 2 emissions from this source (if applicable)
No emissions from this source
Explain why this source is excluded
CH4 and N2O emissions are not estimated as they are considered deminimis. They represent approximately 0.1% of scope 1 and 2 emissions
(including the other omissions).
C6.5
(C6.5) Account for your organization’s Scope 3 emissions, disclosing and explaining any exclusions.
Purchased goods and services
Evaluation status
Relevant, calculated
Metric tonnes CO2e
230,126
Emissions calculation methodology
The WRI/WBCSD Scope 3 average-data method and supplier specific method were applied to calculate the category 1: purchased goods and
services. This category includes GHG emissions associated with the extraction, production and transportation of fuel purchased by Ryder
through REDCO. Fuel production and transportation emission factors from the Ecoinvent V3 database were generated in the SimaPro life cycle
assessment software using the IPCC 2007 GWP 100a characterization method.
Percentage of emissions calculated using data obtained from suppliers or value chain partners
0
Explanation
51
Ryder System, Inc. CDP Climate Change Questionnaire 2019 Friday, August 2, 2019
Ryder customers purchase fuel through REDCO resulting in GHG emissions from extraction, production and transportation to distributor. Non-
fuel purchased goods (e.g., tires, motor oil) are not relevant and not included in emissions calculations.
Capital goods
Evaluation status
Relevant, calculated
Metric tonnes CO2e
38,346
Emissions calculation methodology
The WRI/WBCSD Scope 3 average-data method was applied to calculate the category 2: Capital Goods. This category includes GHG
emissions associated with the production of trucks purchased by Ryder during the reporting year. The WRI/WBCSD Scope 3 average product
method was applied estimating emissions from purchased trucks using industry average lifecycle emission factors published by Ecoinvent V3.2
Truck Lifecycle Dataset.
Percentage of emissions calculated using data obtained from suppliers or value chain partners
100
Explanation
This includes upstream emissions from new trucks added to the Ryder fleet.
Fuel-and-energy-related activities (not included in Scope 1 or 2)
Evaluation status
Relevant, calculated
Metric tonnes CO2e
135,559
Emissions calculation methodology
52
Ryder System, Inc. CDP Climate Change Questionnaire 2019 Friday, August 2, 2019
The WRI/WBCSD Scope 3 average-data method and supplier-specific method were applied to calculate the category 3: fuel and energy related
activities not included in scope 1 or scope 2 emissions. This category assesses GHG emissions associated with fuel distributed to the Ryder
fleet using gallons of fuel retrieved through the internal database and used for scope 1 calculations. We used the average-data method to
calculate the upstream emissions of Ryder fuels used in their operations including extraction,
production, and transportation to storage. We used the supplier-specific method to calculate the upstream distribution of Ryder fuels used in
their operations from the bulk supplier to Ryder. Fuel production and transportation emission factors from the Ecoinvent V3 database were
generated in the SimaPro life cycle assessment software using the IPCC 2007 GWP 100a characterization method.
Percentage of emissions calculated using data obtained from suppliers or value chain partners
0
Explanation
Ryder's owned fleet consumes fuel in their U.S. and Canadian Operations. This accounts for GHG emissions from extraction, production and
transport to distributor and to Ryder locations for the RIL fleet.
Upstream transportation and distribution
Evaluation status
Relevant, calculated
Metric tonnes CO2e
1,720
Emissions calculation methodology
The WRI/WBCSD Scope 3 distance-based method was applied to calculate the category 4: upstream transportation and distribution emissions
from fuel Ryder sold to customers. This category assesses GHG emissions associated with fuel usage by customer fleet that is distributed
through Ryder REDCO. Excluded are emissions for fuel used in the Ryder owned fleet (this is included in category 3). Transportation emission
factors from the Ecoinvent V3 database were generated in the SimaPro life cycle assessment software using the IPCC 2007 GWP 100a.
Percentage of emissions calculated using data obtained from suppliers or value chain partners
0
53
Ryder System, Inc. CDP Climate Change Questionnaire 2019 Friday, August 2, 2019
Explanation
This is the transportation of customer sold fuels provided through REDCO in the U.S. and Canada. It includes GHG emissions from the
transportation from distributor to Ryder locations.
Waste generated in operations
Evaluation status
Relevant, calculated
Metric tonnes CO2e
3,755
Emissions calculation methodology
The average cost data method was applied to calculate category 5: Ryder waste hauling costs are approximately 0.024% of the waste vendor’s
total revenue. The vendor’s scope 1 and 2 emissions are 15,934,821 MTCO2e and therefore Ryder’s scope 3 category is approximately 3,755
MTCO2e.
Percentage of emissions calculated using data obtained from suppliers or value chain partners
50
Explanation
Ryder generated mixed solid waste is tracked and annual cost is reported. The scope 3 emissions are based on scope 1 and 2 emissions that
are reported by the waste hauler. The current cost incurred is approximately 66% of all company-wide MSW disposal and is extrapolated to all
operations.
Business travel
Evaluation status
Relevant, calculated
Metric tonnes CO2e
15,492
54

Ryder System, Inc. CDP Climate Change Questionnaire 2019 Friday, August 2, 2019
Emissions calculation methodology
TraveLeaders provides annual reporting that categorizes air travel as short, medium and long haul flights and computes varying amounts of
GHG emitted based on air mileage. The calculation methodologies are based on various widely accepted protocols that can all be traced back
or related to the GHG Protocol. They include The Climate Registry General Reporting Protocol and the EPA GHG Calculator. Also included in
this category are GHG emissions based on annual mileage and mpg reports from Ryder’s
preferred rental car partners.
Percentage of emissions calculated using data obtained from suppliers or value chain partners
100
Explanation
Ryder employs approximately 38,000 full time employees in North America. Ryder has made significant progress reducing air miles travelled
each year and reducing GHG emissions associated with employee travel miles. Ryder’s travel partner, TraveLeaders, developed real-time
measurements of each traveller based on airline travel. Ryder's preferred rental car companies provided the vehicle rental miles travelled.
Employee commuting
Evaluation status
Relevant, calculated
Metric tonnes CO2e
102,180
Emissions calculation methodology
Employee commuting patterns were surveyed in 2012 (Miami HQ). The responses showed that approximately 98.2% of HQ employees drive to
work alone/carpool with an average commuting distance of 42 miles. Assuming an average fuel efficiency and EPA gasoline emission factor of
8.78 kg/gal this translates into 3.65 MTCO2e/year/employee. In 2018, there were 38,000 employees in North America (excluding truck drivers)
resulting in 102,180 MTCO2e for commuting activities.
Percentage of emissions calculated using data obtained from suppliers or value chain partners
2
55
Ryder System, Inc. CDP Climate Change Questionnaire 2019 Friday, August 2, 2019
Explanation
The calculation is only a high level approximation based on a single commuter survey. Actual commuting patterns will vary significantly from
state to state.
Upstream leased assets
Evaluation status
Not relevant, explanation provided
Explanation
Ryder does not have significant upstream leased assets.
Downstream transportation and distribution
Evaluation status
Not relevant, explanation provided
Explanation
Ryder does not have significant sold products.
Processing of sold products
Evaluation status
Not relevant, explanation provided
Explanation
Ryder does not have significant sold products. Ryder sold fuel is included as a fuel purchased option with their leased vehicles and is included
in category 13 in addition to fuel purchased elsewhere (not from Ryder).
Use of sold products
Evaluation status
Relevant, calculated
56

Ryder System, Inc. CDP Climate Change Questionnaire 2019 Friday, August 2, 2019
Metric tonnes CO2e
550,960
Emissions calculation methodology
The category includes the emissions from the use of used trucks sold by Ryder in the reporting year. The trucks consumed energy resulting in
direct use-phase emissions. Ryder has established the SmartWay Tool as the technical basis and source for all mobile emission factors. Scope
1 and Scope 3 mobile emissions are based on a factor of 22.2 lbs of CO2 per gallon of diesel fuel, as documented in the US EPA Office of
Transportation and Air Quality EPA 420-F-05-001 dated February 2005, and which is the basis
for all SmartWay CO2 emission calculations.
Percentage of emissions calculated using data obtained from suppliers or value chain partners
0
Explanation
The sale of used trucks was added to Ryder’s scope 3 emissions. In 2018, Ryder held 6,900 trucks for sale. Based on average truck mileages,
this equates to using 539,522,163 gallons. With the 22.2 lb/gal emission factor, this is 550,960 MT CO2e. Ryder does not have any other
significant sold products. Ryder sold fuel is included as a fuel purchased option with their leased vehicles and is included in category 13 in
addition to fuel purchased elsewhere (not from Ryder).
End of life treatment of sold products
Evaluation status
Not relevant, explanation provided
Explanation
Ryder does not have significant sold products.
Downstream leased assets
Evaluation status
Relevant, calculated
57
Ryder System, Inc. CDP Climate Change Questionnaire 2019 Friday, August 2, 2019
Metric tonnes CO2e
9,599,291
Emissions calculation methodology
The WRI/WBCSD Scope 3 direct use-phase emissions method was applied to calculate the category 13: downstream leased assets emissions
from fuels combusted in Ryder leased vehicles. This category assesses fuel combustion and lifecycle GHG emissions associated with customer
trucks fuel usage. The category includes the emissions from the use phase of the leased products (combustion) and life cycle emission factor
for diesel production. Ryder has established the SmartWay Tool as the technical basis and source for all mobile emission factors. Scope 1 and
Scope 3 mobile emissions are based on a factor of 22.2 lbs of CO2 per gallon of diesel fuel, as documented in the US EPA Office of
Transportation and Air Quality EPA 420-F-05-001 dated February 2005, and which is the basis for all SmartWay CO2 emission calculations.
Percentage of emissions calculated using data obtained from suppliers or value chain partners
0
Explanation
This category accounts for GHG emissions resulting from the combustion of fuel used in customer leased vehicles in the U.S. and Canada.
Franchises
Evaluation status
Not relevant, explanation provided
Explanation
Ryder does not have any franchise operations.
Investments
Evaluation status
Not relevant, explanation provided
Explanation
Ryder does not own any GHG releasing investments.
58
Ryder System, Inc. CDP Climate Change Questionnaire 2019 Friday, August 2, 2019
Other (upstream)
Evaluation status
Not relevant, explanation provided
Explanation
Ryder does not have other scope 3 emissions.
Other (downstream)
Evaluation status
Not relevant, explanation provided
Explanation
Ryder does not have other scope 3 emissions.
C6.7
(C6.7) Are carbon dioxide emissions from biologically sequestered carbon relevant to your organization?
Yes
C6.7a
(C6.7a) Provide the emissions from biologically sequestered carbon relevant to your organization in metric tons CO2.
Row 1
Emissions from biologically sequestered carbon (metric tons CO2)
41,335
Comment
59
Ryder System, Inc. CDP Climate Change Questionnaire 2019 Friday, August 2, 2019
C6.10
(C6.10) Describe your gross global combined Scope 1 and 2 emissions for the reporting year in metric tons CO2e per unit currency
total revenue and provide any additional intensity metrics that are appropriate to your business operations.
Intensity figure
0.000103
Metric numerator (Gross global combined Scope 1 and 2 emissions)
868,793
Metric denominator
unit total revenue
Metric denominator: Unit total
8,409,215,000
Scope 2 figure used
Location-based
% change from previous year
9.4
Direction of change
Decreased
Reason for change
60
Ryder System, Inc. CDP Climate Change Questionnaire 2019 Friday, August 2, 2019
Revenue increased 9% to $8,409,215,000 in 2018 while we realized emissions reductions from our 4 major emission reduction activities:
Lighting Projects (4,927 MTCO2e/yr), Energy Conservation Program (10,578 MTCO2e/yr), High efficiency oil (10,672 MTCO2e) and Natural
Gas Fleet replacing diesel usage (895 MTCO2e).
Intensity figure
21.94
Metric numerator (Gross global combined Scope 1 and 2 emissions)
868,793
Metric denominator
full time equivalent (FTE) employee
Metric denominator: Unit total
39,600
Scope 2 figure used
Location-based
% change from previous year
3.68
Direction of change
Increased
Reason for change
FTE increased 4.6% to 39,600 in 2018 while we realized emissions reductions from our 4 major emission reduction activities: Lighting Projects
(4,927 MTCO2e/yr), Energy Conservation Program (10,578 MTCO2e/yr), High efficiency oil (10,672 MTCO2e) and Natural Gas Fleet replacing
diesel usage (895 MTCO2e).
Natural Gas Fleet replacing diesel usage (632 MTCO2e).
61
Ryder System, Inc. CDP Climate Change Questionnaire 2019 Friday, August 2, 2019
C-TS6.15
(C-TS6.15) What are your primary intensity (activity-based) metrics that are appropriate to your emissions from transport activities in
Scope 1, 2, and 3?
ALL
Scopes used for calculation of intensities
Intensity figure
Metric numerator: emissions in metric tons CO2e
Metric denominator: unit
Metric denominator: unit total
% change from previous year
Please explain any exclusions in your coverage of transport emissions in selected category, and reasons for change in
emissions intensity.
62
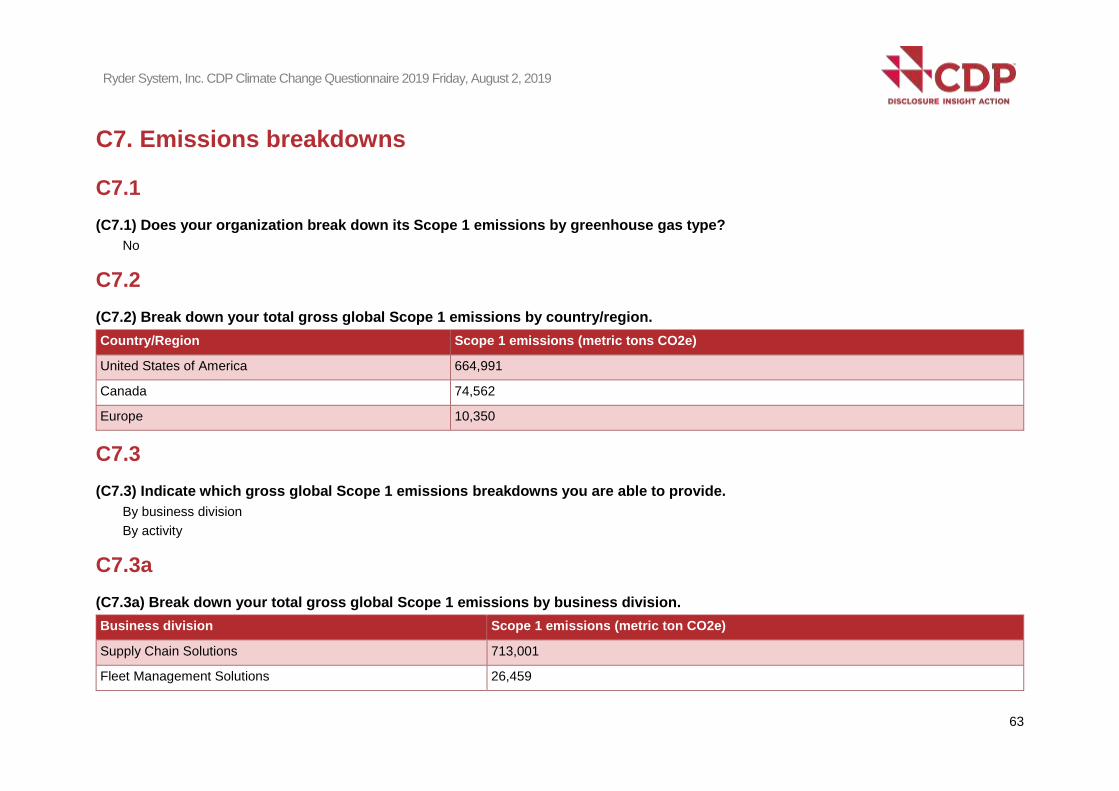
Ryder System, Inc. CDP Climate Change Questionnaire 2019 Friday, August 2, 2019
C7. Emissions breakdowns
C7.1
(C7.1) Does your organization break down its Scope 1 emissions by greenhouse gas type?
No
C7.2
(C7.2) Break down your total gross global Scope 1 emissions by country/region.
Country/Region Scope 1 emissions (metric tons CO2e)
United States of America 664,991
Canada 74,562
Europe 10,350
C7.3
(C7.3) Indicate which gross global Scope 1 emissions breakdowns you are able to provide.
By business division
By activity
C7.3a
(C7.3a) Break down your total gross global Scope 1 emissions by business division.
Business division Scope 1 emissions (metric ton CO2e)
Supply Chain Solutions 713,001
Fleet Management Solutions 26,459
63
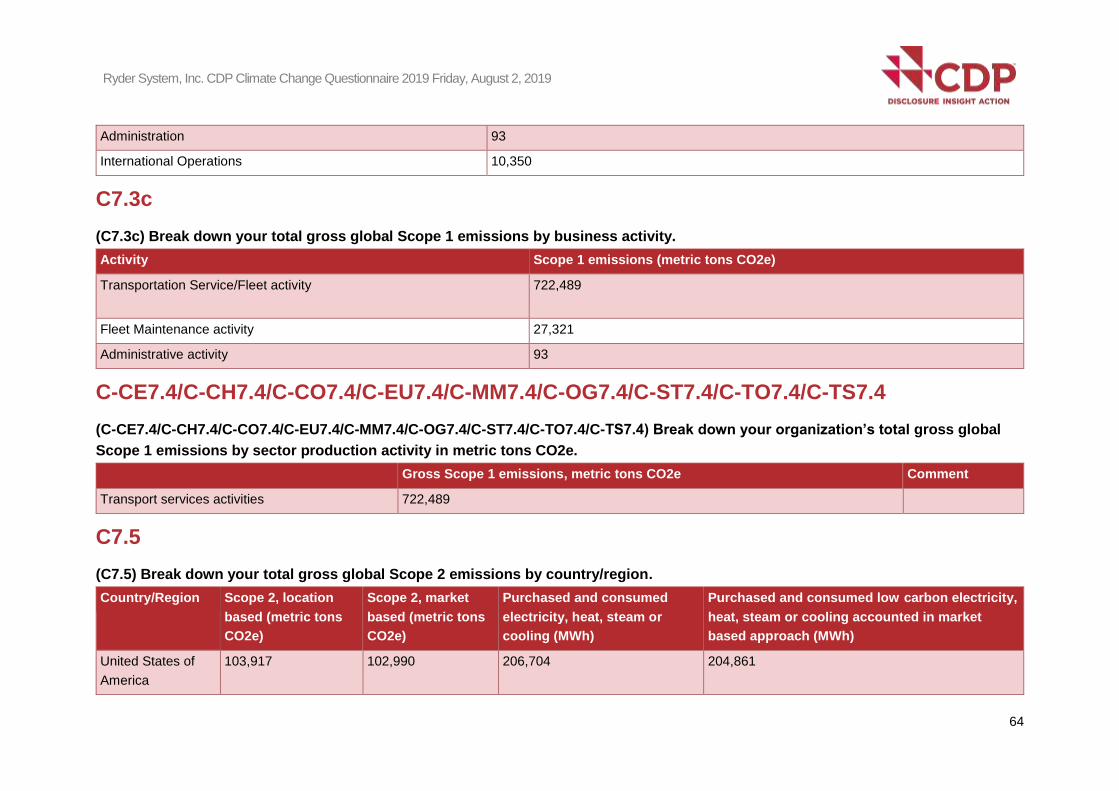
- - -
-
Ryder System, Inc. CDP Climate Change Questionnaire 2019 Friday, August 2, 2019
Administration 93
International Operations 10,350
C7.3c
(C7.3c) Break down your total gross global Scope 1 emissions by business activity.
Activity Scope 1 emissions (metric tons CO2e)
Transportation Service/Fleet activity 722,489
Fleet Maintenance activity 27,321
Administrative activity 93
C-CE7.4/C-CH7.4/C-CO7.4/C-EU7.4/C-MM7.4/C-OG7.4/C-ST7.4/C-TO7.4/C-TS7.4
(C-CE7.4/C-CH7.4/C-CO7.4/C-EU7.4/C-MM7.4/C-OG7.4/C-ST7.4/C-TO7.4/C-TS7.4) Break down your organization’s total gross global
Scope 1 emissions by sector production activity in metric tons CO2e.
Gross Scope 1 emissions, metric tons CO2e Comment
Transport services activities 722,489
C7.5
(C7.5) Break down your total gross global Scope 2 emissions by country/region.
Country/Region Scope 2, location
based (metric tons
CO2e)
Scope 2, market
based (metric tons
CO2e)
Purchased and consumed
electricity, heat, steam or
cooling (MWh)
Purchased and consumed low carbon electricity,
heat, steam or cooling accounted in market
based approach (MWh)
United States of
America
103,917 102,990 206,704 204,861
64

- -
- -
Ryder System, Inc. CDP Climate Change Questionnaire 2019 Friday, August 2, 2019
Canada 1,861 1,861 9,523 9,523
Mexico 11,341 11,341 20,620 20,620
Asia Pacific (or
JAPA)
282 282 548 548
Europe 1,489 1,489 4,185 4,185
C7.6
(C7.6) Indicate which gross global Scope 2 emissions breakdowns you are able to provide.
By business division
By activity
C7.6a
(C7.6a) Break down your total gross global Scope 2 emissions by business division.
Business division Scope 2, location based emissions (metric tons CO2e) Scope 2, market based emissions (metric tons CO2e)
Supply Chain Solutions 54,707 53,080
Fleet Management Solutions 44,098 44,835
Administration 6,973 6,966
International Operations 13,111 13,111
C7.6c
(C7.6c) Break down your total gross global Scope 2 emissions by business activity.
Activity Scope 2, location based emissions (metric tons CO2e) Scope 2, market based emissions (metric tons CO2e)
Transportation Service/Fleet activity 54,707 53,080
65
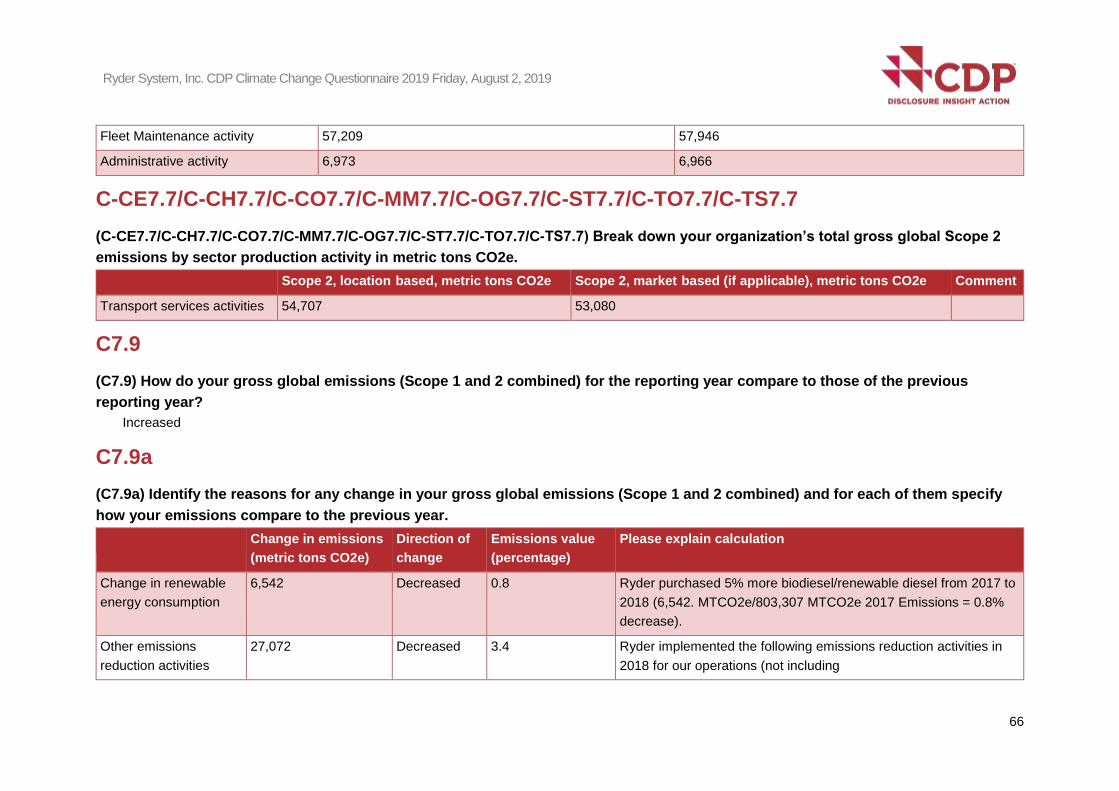
- -
Ryder System, Inc. CDP Climate Change Questionnaire 2019 Friday, August 2, 2019
Fleet Maintenance activity 57,209 57,946
Administrative activity 6,973 6,966
C-CE7.7/C-CH7.7/C-CO7.7/C-MM7.7/C-OG7.7/C-ST7.7/C-TO7.7/C-TS7.7
(C-CE7.7/C-CH7.7/C-CO7.7/C-MM7.7/C-OG7.7/C-ST7.7/C-TO7.7/C-TS7.7) Break down your organization’s total gross global Scope 2
emissions by sector production activity in metric tons CO2e.
Scope 2, location based, metric tons CO2e Scope 2, market based (if applicable), metric tons CO2e Comment
Transport services activities 54,707 53,080
C7.9
(C7.9) How do your gross global emissions (Scope 1 and 2 combined) for the reporting year compare to those of the previous
reporting year?
Increased
C7.9a
(C7.9a) Identify the reasons for any change in your gross global emissions (Scope 1 and 2 combined) and for each of them specify
how your emissions compare to the previous year.
Change in emissions
(metric tons CO2e)
Direction of
change
Emissions value
(percentage)
Please explain calculation
Change in renewable
energy consumption
6,542 Decreased 0.8 Ryder purchased 5% more biodiesel/renewable diesel from 2017 to
2018 (6,542. MTCO2e/803,307 MTCO2e 2017 Emissions = 0.8%
decrease).
Other emissions
reduction activities
27,072 Decreased 3.4 Ryder implemented the following emissions reduction activities in
2018 for our operations (not including
66
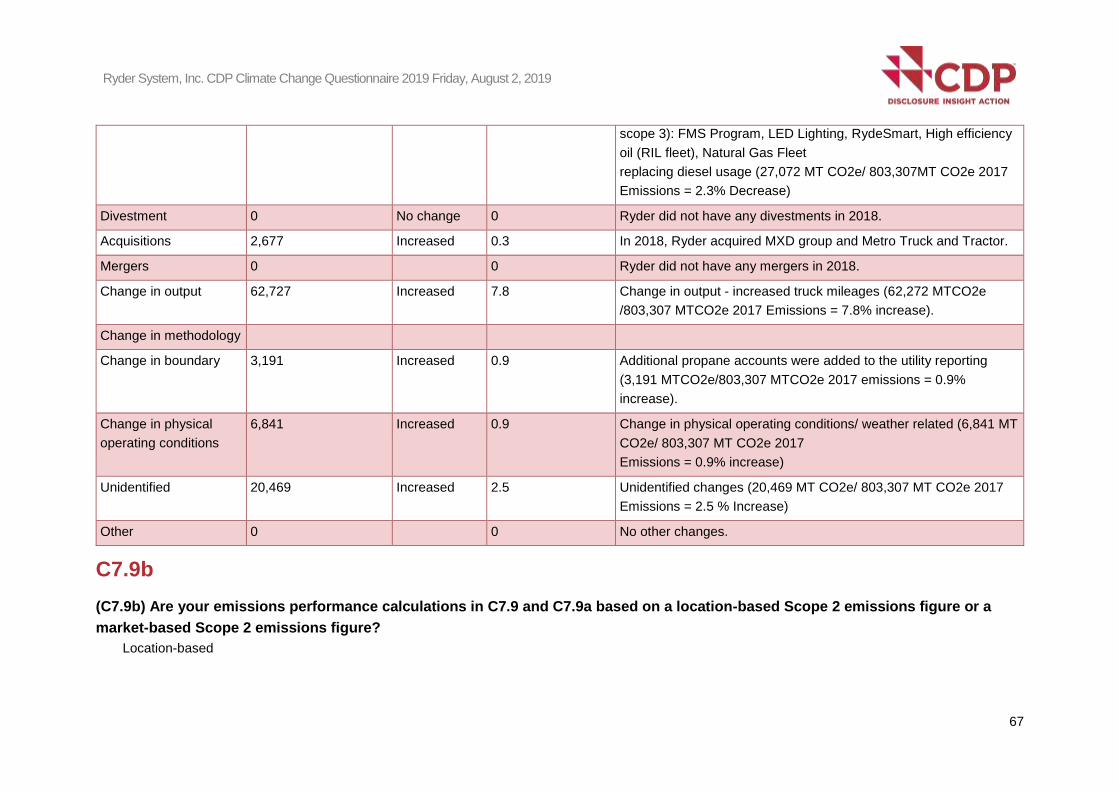
Ryder System, Inc. CDP Climate Change Questionnaire 2019 Friday, August 2, 2019
scope 3): FMS Program, LED Lighting, RydeSmart, High efficiency
oil (RIL fleet), Natural Gas Fleet
replacing diesel usage (27,072 MT CO2e/ 803,307MT CO2e 2017
Emissions = 2.3% Decrease)
Divestment 0 No change 0 Ryder did not have any divestments in 2018.
Acquisitions 2,677 Increased 0.3 In 2018, Ryder acquired MXD group and Metro Truck and Tractor.
Mergers 0 0 Ryder did not have any mergers in 2018.
Change in output 62,727 Increased 7.8 Change in output - increased truck mileages (62,272 MTCO2e
/803,307 MTCO2e 2017 Emissions = 7.8% increase).
Change in methodology
Change in boundary 3,191 Increased 0.9 Additional propane accounts were added to the utility reporting
(3,191 MTCO2e/803,307 MTCO2e 2017 emissions = 0.9%
increase).
Change in physical
operating conditions
6,841 Increased 0.9 Change in physical operating conditions/ weather related (6,841 MT
CO2e/ 803,307 MT CO2e 2017
Emissions = 0.9% increase)
Unidentified 20,469 Increased 2.5 Unidentified changes (20,469 MT CO2e/ 803,307 MT CO2e 2017
Emissions = 2.5 % Increase)
Other 0 0 No other changes.
C7.9b
(C7.9b) Are your emissions performance calculations in C7.9 and C7.9a based on a location-based Scope 2 emissions figure or a
market-based Scope 2 emissions figure?
Location-based
67
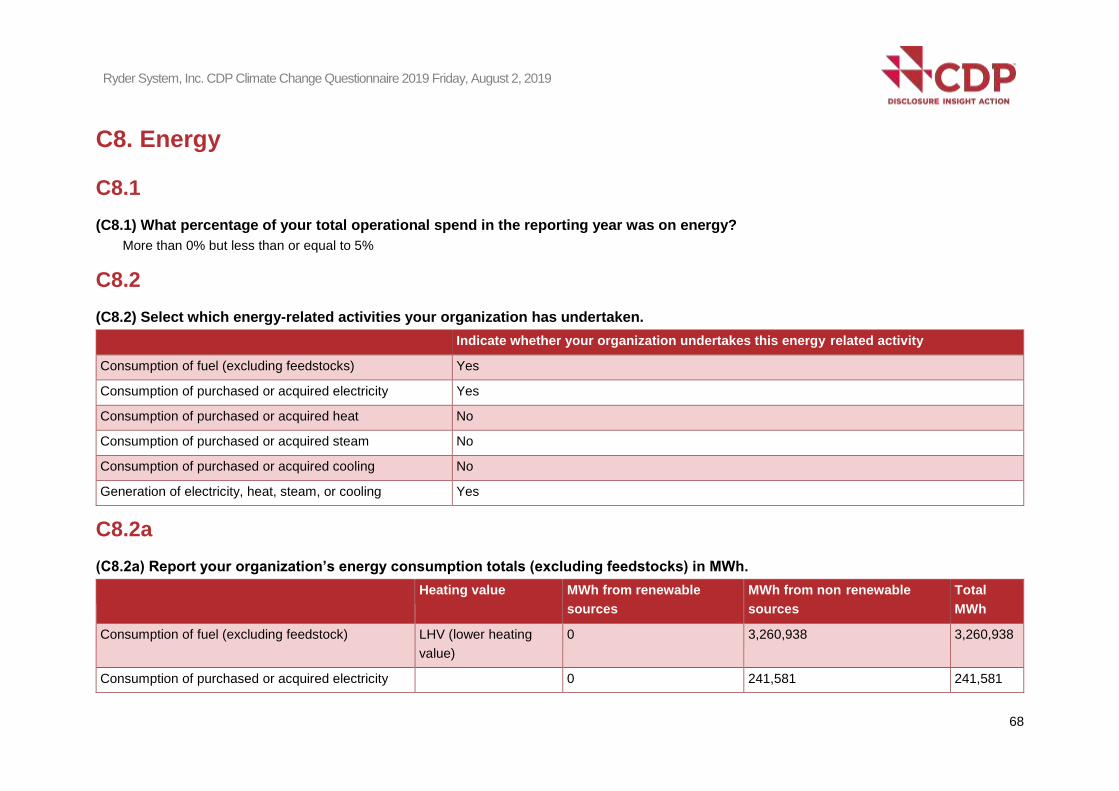
-
-
Ryder System, Inc. CDP Climate Change Questionnaire 2019 Friday, August 2, 2019
C8. Energy
C8.1
(C8.1) What percentage of your total operational spend in the reporting year was on energy?
More than 0% but less than or equal to 5%
C8.2
(C8.2) Select which energy-related activities your organization has undertaken.
Indicate whether your organization undertakes this energy related activity
Consumption of fuel (excluding feedstocks) Yes
Consumption of purchased or acquired electricity Yes
Consumption of purchased or acquired heat No
Consumption of purchased or acquired steam No
Consumption of purchased or acquired cooling No
Generation of electricity, heat, steam, or cooling Yes
C8.2a
(C8.2a) Report your organization’s energy consumption totals (excluding feedstocks) in MWh.
Heating value MWh from renewable
sources
MWh from non renewable
sources
Total
MWh
Consumption of fuel (excluding feedstock) LHV (lower heating
value)
0 3,260,938 3,260,938
Consumption of purchased or acquired electricity 0 241,581 241,581
68

Ryder System, Inc. CDP Climate Change Questionnaire 2019 Friday, August 2, 2019
Consumption of self-generated non-fuel renewable
energy
0 0
Total energy consumption 0 3,504,479 3,504,479
C8.2b
(C8.2b) Select the applications of your organization’s consumption of fuel.
Indicate whether your organization undertakes this fuel application
Consumption of fuel for the generation of electricity No
Consumption of fuel for the generation of heat Yes
Consumption of fuel for the generation of steam No
Consumption of fuel for the generation of cooling No
Consumption of fuel for co-generation or tri-generation No
C8.2c
(C8.2c) State how much fuel in MWh your organization has consumed (excluding feedstocks) by fuel type.
Fuels (excluding feedstocks)
Diesel
Heating value
LHV (lower heating value)
Total fuel MWh consumed by the organization
3,053,394
69
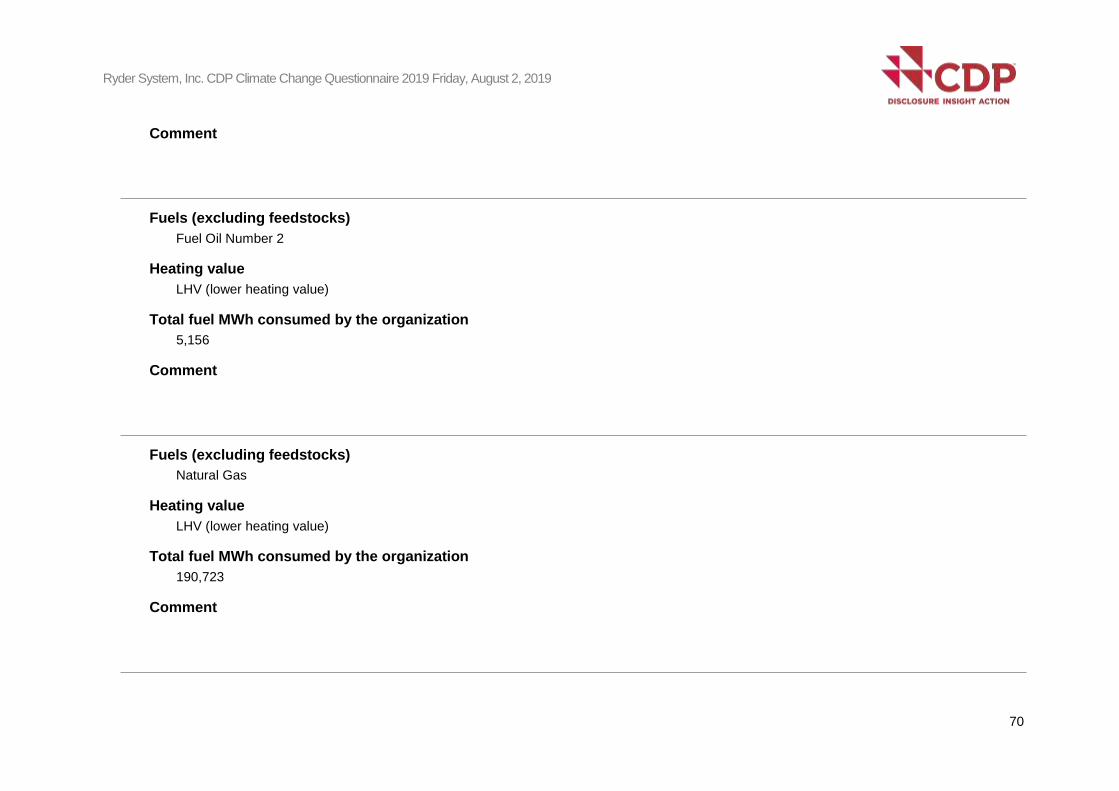
Ryder System, Inc. CDP Climate Change Questionnaire 2019 Friday, August 2, 2019
Comment
Fuels (excluding feedstocks)
Fuel Oil Number 2
Heating value
LHV (lower heating value)
Total fuel MWh consumed by the organization
5,156
Comment
Fuels (excluding feedstocks)
Natural Gas
Heating value
LHV (lower heating value)
Total fuel MWh consumed by the organization
190,723
Comment
70

Ryder System, Inc. CDP Climate Change Questionnaire 2019 Friday, August 2, 2019
Fuels (excluding feedstocks)
Propane Gas
Heating value
LHV (lower heating value)
Total fuel MWh consumed by the organization
13,625
Comment
C8.2d
(C8.2d) List the average emission factors of the fuels reported in C8.2c.
Diesel
Emission factor
22.2
Unit
lb CO2e per gallon
Emission factor source
U.S. EPA Office of Transportation and Air Quality Emission Facts document EPA 420-F-05-001 dated February 2005
Comment
Ryder has established the SmartWay Tool as the technical basis and source for all mobile emission factors. Diesel emissions are based on a
factor of 22.2 lbs of CO2 per gallon of diesel fuel, as documented in the US EPA Office of Transportation and Air Quality EPA 420-F-05-001
dated February 2005, and which is the basis for all SmartWay CO2 emission calculations.
Fuel Oil Number 2
71
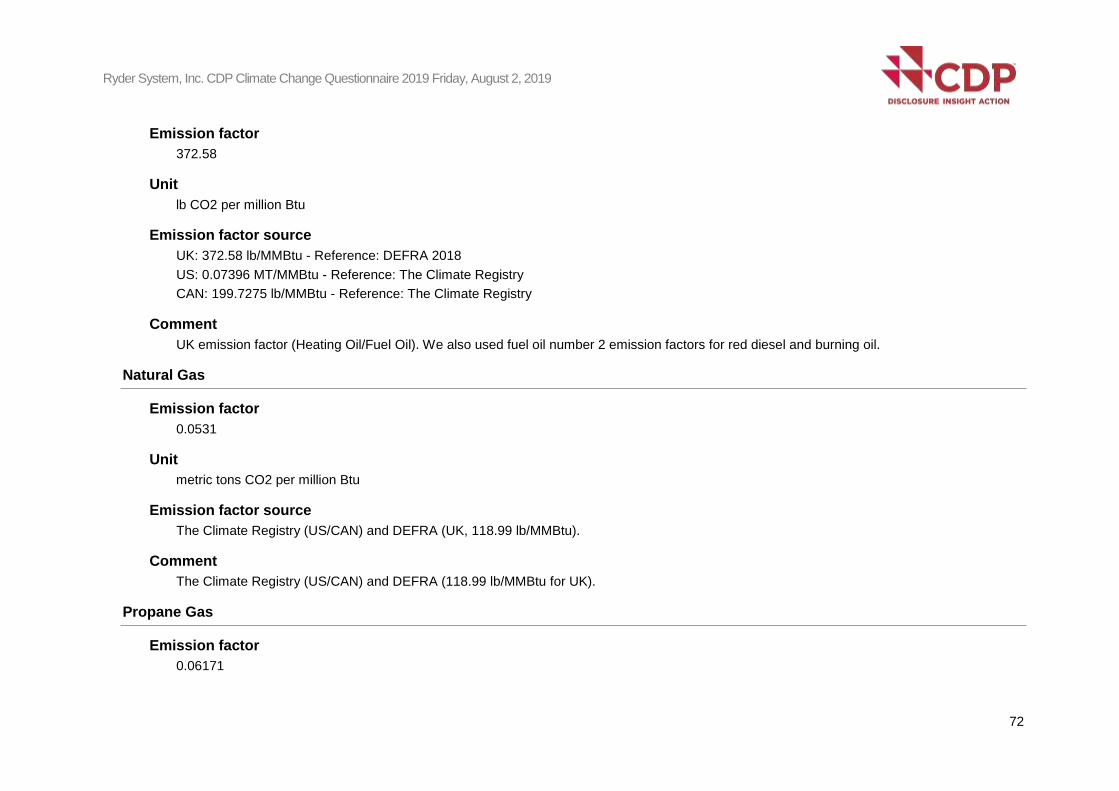
Ryder System, Inc. CDP Climate Change Questionnaire 2019 Friday, August 2, 2019
Emission factor
372.58
Unit
lb CO2 per million Btu
Emission factor source
UK: 372.58 lb/MMBtu - Reference: DEFRA 2018
US: 0.07396 MT/MMBtu - Reference: The Climate Registry
CAN: 199.7275 lb/MMBtu - Reference: The Climate Registry
Comment
UK emission factor (Heating Oil/Fuel Oil). We also used fuel oil number 2 emission factors for red diesel and burning oil.
Natural Gas
Emission factor
0.0531
Unit
metric tons CO2 per million Btu
Emission factor source
The Climate Registry (US/CAN) and DEFRA (UK, 118.99 lb/MMBtu).
Comment
The Climate Registry (US/CAN) and DEFRA (118.99 lb/MMBtu for UK).
Propane Gas
Emission factor
0.06171
72
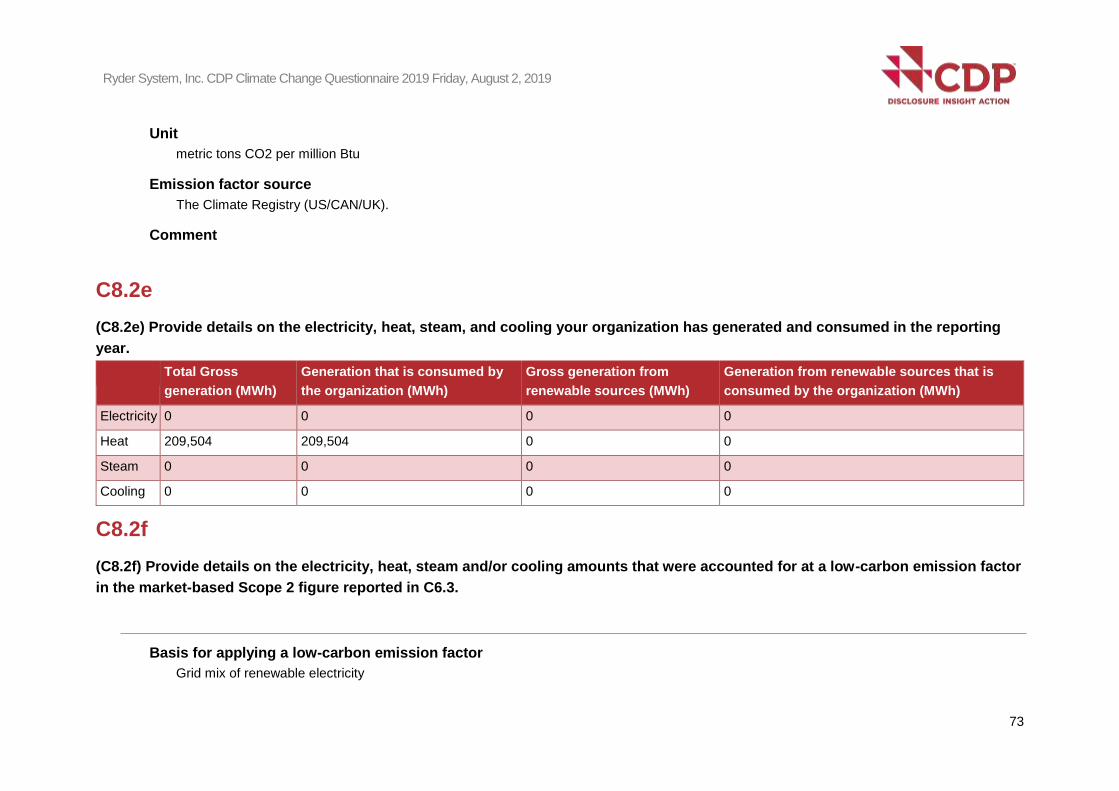
Ryder System, Inc. CDP Climate Change Questionnaire 2019 Friday, August 2, 2019
Unit
metric tons CO2 per million Btu
Emission factor source
The Climate Registry (US/CAN/UK).
Comment
C8.2e
(C8.2e) Provide details on the electricity, heat, steam, and cooling your organization has generated and consumed in the reporting
year.
Total Gross
generation (MWh)
Generation that is consumed by
the organization (MWh)
Gross generation from
renewable sources (MWh)
Generation from renewable sources that is
consumed by the organization (MWh)
Electricity 0 0 0 0
Heat 209,504 209,504 0 0
Steam 0 0 0 0
Cooling 0 0 0 0
C8.2f
(C8.2f) Provide details on the electricity, heat, steam and/or cooling amounts that were accounted for at a low-carbon emission factor
in the market-based Scope 2 figure reported in C6.3.
Basis for applying a low-carbon emission factor
Grid mix of renewable electricity
73
Ryder System, Inc. CDP Climate Change Questionnaire 2019 Friday, August 2, 2019
Low-carbon technology type
Other low-carbon technology, please specify
(average mix of renewable energy on grid)
Region of consumption of low-carbon electricity, heat, steam or cooling
North America
MWh consumed associated with low-carbon electricity, heat, steam or cooling
239,737
Emission factor (in units of metric tons CO2e per MWh)
0.51
Comment
Ryder has market-based emission factors that differ from location-based emission factors but did not have specific low carbon electricity
purchases in 2018.
C-TS8.4
(C-TS8.4) Provide any efficiency metrics that are appropriate for your organization’s transport products and/or services.
C9. Additional metrics
C9.1
(C9.1) Provide any additional climate-related metrics relevant to your business.
74
Ryder System, Inc. CDP Climate Change Questionnaire 2019 Friday, August 2, 2019
C-TO9.3/C-TS9.3
(C-TO9.3/C-TS9.3) Provide tracking metrics for the implementation of low-carbon transport technology over the reporting year.
C-TO9.6/C-TS9.6
(C-TO9.6/C-TS9.6) What is your investment in research and development (R&D), equipment, products and services and which part of
it would you consider a direct investment in the low-carbon transition?
C10. Verification
C10.1
(C10.1) Indicate the verification/assurance status that applies to your reported emissions.
Verification/assurance status
Scope 1 No third-party verification or assurance
Scope 2 (location-based or market-based) No third-party verification or assurance
Scope 3 No third-party verification or assurance
C10.2
(C10.2) Do you verify any climate-related information reported in your CDP disclosure other than the emissions figures reported in
C6.1, C6.3, and C6.5?
In progress
75

Ryder System, Inc. CDP Climate Change Questionnaire 2019 Friday, August 2, 2019
C11. Carbon pricing
C11.1
(C11.1) Are any of your operations or activities regulated by a carbon pricing system (i.e. ETS, Cap & Trade or Carbon Tax)?
No, and we do not anticipate being regulated in the next three years
C11.2
(C11.2) Has your organization originated or purchased any project-based carbon credits within the reporting period?
No
C11.3
(C11.3) Does your organization use an internal price on carbon?
No, and we do not currently anticipate doing so in the next two years
C12. Engagement
C12.1
(C12.1) Do you engage with your value chain on climate-related issues?
Yes, our customers
Yes, other partners in the value chain
C12.1b
(C12.1b) Give details of your climate-related engagement strategy with your customers.
76
Ryder System, Inc. CDP Climate Change Questionnaire 2019 Friday, August 2, 2019
Type of engagement
Collaboration & innovation
Details of engagement
Run a campaign to encourage innovation to reduce climate change impacts
% of customers by number
89
% Scope 3 emissions as reported in C6.5
89
Please explain the rationale for selecting this group of customers and scope of engagement
Ryder engages with its customers on GHG emissions and climate change strategies through several initiatives and offerings. i) Ryder’s
innovative ChoiceLease offers our customers the option to convert some or all of their fleet to greener, more fuel-efficient vehicles at any time.
Ryder’s alternative fuel fleet includes compressed and liquid natural gas vehicles, which are offered in select markets as well as hybrid vehicles,
which are available in most U.S. markets. Ryder customers are educated and provided a menu
of green-to-greener services, with some solutions requiring a higher initial capital investment to produce the maximum amount of emission
reductions long-term. Customers can also select optimum network designs for maximum fuel savings and emission reduction, and they can
incorporate carbon offsets to neutralize their transportation related emissions. Ryder’s strategy for prioritizing engagements is to meet customer
demand for low carbon solutions.
Impact of engagement, including measures of success
i. The impact of the engagement has been the successful creation of business opportunities and reduction in emissions. For example, Michigan-
based beverage container recycling company UBCR, LLC has operated its Ryder NGV fleet for more than 7 million miles since 2011. As an
early adopter of Ryder’s NGV solution, UBCR has reduced its greenhouse gas emissions by approximately 2,704 MTCO2e and replaced more
than one million gallons of diesel fuel with lower-emission, domestically produced
natural gas. Sixteen compressed natural gas vehicles, designed with the latest modifications and technological advances, will replace UBCR’s
entire truck fleet. ii. Ryder measures success as expanding business opportunities.
77
Ryder System, Inc. CDP Climate Change Questionnaire 2019 Friday, August 2, 2019
C12.1c
(C12.1c) Give details of your climate-related engagement strategy with other partners in the value chain.
i. Ryder maintains close relationships with the Original Engine Manufacturers (OEM) who help support deployment of emerging fuel efficient
technologies.ii. The relationships also ensure that integration is looked at through the lens of a fleet operator and not a truck manufacturer. Ryder has
recognized the value of making investments in advanced fuel equipment, technologies, and processes to improve fuel economy for our Customers,
enhance safety, and reduce operating costs as part of an overall strategy to improve transportation efficiencies.
ii. For example, Ryder and Freightliner have supplied compressed natural gas-fueled trucks to Indian River Transport Company. The CNG trucks are
used for 10 to 12 runs a day and run 24 hours a day. This was the request of Indian River Transport customers who were looking for smaller carbon
footprints, lower fuel costs and reduced noise level in the communities where these trucks are operating.
C12.3
(C12.3) Do you engage in activities that could either directly or indirectly influence public policy on climate-related issues through
any of the following?
Direct engagement with policy makers
C12.3a
(C12.3a) On what issues have you been engaging directly with policy makers?
Focus of
legislation
Corporate
position
Details of engagement Proposed legislative solution
Energy Support (a) Ryder directly supported advocacy efforts with policy makers on tax, vehicle GHG Ryder supports this legislation without
exceptions. efficiency emission standards and other incentives to promote the development and adoption of
new federal engine emission standards & the use of alternative truck technologies to
reduce fuel consumption (b) Ryder has worked with federal and state policy makers
throughout the US and Canada to recommend and define alternative fuel legislation.
Ryder works closely with government as well as trade associations like NGVA, ATA,
TRALA, US Chamber of Commerce, Business Round Table and other organizations to
78

Ryder System, Inc. CDP Climate Change Questionnaire 2019 Friday, August 2, 2019
provide policy makers with legislative comments that support the needs of both
business and the environment.
Mandatory
carbon
reporting
Support Ryder advocates directly with U.S policy makers on the NHTSA/EPA GHG standards
through its network of professional & trucking trade associations to provide for
emissions mitigation through decreased fuel consumption standards
Ryder supports federal, universal
standard and legislation for carbon
reporting versus state-specific
standards and requirements.
C12.3f
(C12.3f) What processes do you have in place to ensure that all of your direct and indirect activities that influence policy are
consistent with your overall climate change strategy?
Ryder’s Executive Vice President, Chief Legal Officer and Corporate Secretary is responsible for overseeing the company’s direct and indirect activities
that influence public policy development and government relations that are related to Ryder’s business across all services and geographies. Ryder’s
Vice President of Environmental, Real Estate, and Fuel Services maintains operational responsibility for environmental and sustainability programs
including climate change strategy and Ryder’s General Counsel oversees day to day activities related to Government Affairs. This executive reporting
alignment ensures that all of our direct and indirect activities that influence policy are integrated, aligned and consistent with our overall climate change
strategy.
C12.4
(C12.4) Have you published information about your organization’s response to climate change and GHG emissions performance for
this reporting year in places other than in your CDP response? If so, please attach the publication(s).
Publication
In voluntary sustainability report
Status
Complete
79
Ryder System, Inc. CDP Climate Change Questionnaire 2019 Friday, August 2, 2019
Attach the document
ryder-csr-2017-2018-1.pdf
Page/Section reference
Page 12
Content elements
Governance
Strategy
Risks & opportunities
Emissions figures
Emission targets
Other metrics
Comment
C14. Signoff
C-FI
(C-FI) Use this field to provide any additional information or context that you feel is relevant to your organization's response. Please
note that this field is optional and is not scored.
Ryder published an updated Corporate Sustainability Report in accordance with the Global Reporting Initiative (GRI) Standards Core option with
detailed emissions and activity data (http://rydercsr.com). For the 2019 CDP response year, updates are provided to emission data (sections C6, C7
and C8), but at the time of CDP publication, these were not fully audited. Ryder plans to resume full CDP reporting in 2020.
80

Ryder System, Inc. CDP Climate Change Questionnaire 2019 Friday, August 2, 2019
C14.1
(C14.1) Provide details for the person that has signed off (approved) your CDP climate change response.
Job title Corresponding job category
Row 1 Vice President, Environmental, Real Estate and Fuel Services Other, please specify
Vice President at Corporate Headquarters
SC. Supply chain module
SC0.0
(SC0.0) If you would like to do so, please provide a separate introduction to this module.
Ryder provides customized Ryder Dedicated Transportation Solutions (DTS) and Supply Chain Solutions (SCS). These customized solutions
determine which party controls the source of the emissions, which party has access to the source data on which to compute the emissions, if the
emissions are Scope 1, 2, or 3, and therefore how they should be allocated and reported.
In the Ryder Dedicated Transportation Solutions, our customers direct their product movement but Ryder owns and controls the equipment, fuel, and
administrative services (including driver hiring, training, routing, scheduling, and fleet sizing). As Ryder provides the fuel, hires the driver, and controls
the vehicle, the emissions originating from the vehicle fuel consumption are allocated to, and reported by, Ryder as Scope 1. These same emissions
would be reported as Scope 3 by our customers.
Ryder also provides Supply Chain Solutions (SCS). SCS product offerings include three categories: 1) Professional Services to identify efficiencies and
opportunities for supply chain integration; 2) Distribution Management to manage warehouse operations, product distribution networks, and 3)
Transportation Solutions which provide 3rd party freight and carrier management services.
Within Distribution Management, Ryder's client often owns or leases the physical brick and mortar distribution center. In these customer controlled
facilities, all utilities will be in the name of, and paid by, the client. In these cases, Ryder would not report Scope 1 and 2 utility-related emissions and
actually does not even have access to the source data on which to compute it.
Ultimately, the customized solutions determine which party controls, computes, and reports the respective emissions. Ryder will therefore report all
client emissions based on the specifics of these customized solutions.
81

Ryder System, Inc. CDP Climate Change Questionnaire 2019 Friday, August 2, 2019
SC0.1
(SC0.1) What is your company’s annual revenue for the stated reporting period?
Annual Revenue
Row 1 8,409,215,000
SC0.2
(SC0.2) Do you have an ISIN for your company that you would be willing to share with CDP?
Yes
SC0.2a
(SC0.2a) Please use the table below to share your ISIN.
ISIN country code (2 letters) ISIN numeric identifier and single check digit (10 numbers overall)
Row 1 US 7835491082
SC1.1
(SC1.1) Allocate your emissions to your customers listed below according to the goods or services you have sold them in this
reporting period.
Requesting member
AT&T Inc.
Scope of emissions
Scope 3
82
Ryder System, Inc. CDP Climate Change Questionnaire 2019 Friday, August 2, 2019
Allocation level
Company wide
Emissions in metric tonnes of CO2e
9,298
Uncertainty (±%)
2
Major sources of emissions
Ryder Dedicated Transportation Solutions - Fleet Operations
Verified
No
Allocation method
Allocation not necessary due to type of primary data available
Please explain how you have identified the GHG source, including major limitations to this process and
assumptions made
Ryder has established the SmartWay Tool as the technical basis and source for all mobile emission factors. The AT&T Scope 3 emissions are
based on a factor of 22.2 lbs of CO2 per gallon of diesel fuel, as documented in the US EPA Office of Transportation and Air Quality EPA 420-
F-05-001 dated February 2005, and which is the basis for all SmartWay CO2 emission calculations.
Requesting member
Diageo Plc
Scope of emissions
Scope 3
Allocation level
83
Ryder System, Inc. CDP Climate Change Questionnaire 2019 Friday, August 2, 2019
Company wide
Emissions in metric tonnes of CO2e
72
Uncertainty (±%)
2
Major sources of emissions
Stationary Scope 2 - Warehouse operation
Verified
No
Allocation method
Allocation not necessary due to type of primary data available
Please explain how you have identified the GHG source, including major limitations to this process and
assumptions made
Ryder operates one warehouse for Diageo which is considered under operational control. We receive electric utilities for this warehouse.
Emissions were calculated using the Mexico emission factor for electricity.
Requesting member
Fiat Chrysler Automobiles NV
Scope of emissions
Scope 3
Allocation level
Company wide
84
Ryder System, Inc. CDP Climate Change Questionnaire 2019 Friday, August 2, 2019
Emissions in metric tonnes of CO2e
1,630
Uncertainty (±%)
2
Major sources of emissions
Ryder Dedicated Transportation Solutions - Fleet Operations.
Verified
No
Allocation method
Allocation not necessary due to type of primary data available
Please explain how you have identified the GHG source, including major limitations to this process and
assumptions made
Ryder has established the SmartWay Tool as the technical basis and source for all mobile emission factors. The FIAT CHRYSLER Scope 3
emissions are based on a factor of 22.2 lbs of CO2 per gallon of diesel fuel, as documented in the US EPA Office of Transportation and Air
Quality EPA 420-F-05-001 dated February 2005, and which is the basis for all SmartWay CO2 emission calculations.
Requesting member
General Motors Company
Scope of emissions
Scope 3
Allocation level
Company wide
Emissions in metric tonnes of CO2e
85
Ryder System, Inc. CDP Climate Change Questionnaire 2019 Friday, August 2, 2019
1,097,032
Uncertainty (±%)
2
Major sources of emissions
3rd Party Carrier Managed Transportation for Powertrain Stamping and Assembly, and Ryder Operated Equipment assigned to the Material
Optimization Centers.
Verified
No
Allocation method
Allocation not necessary due to type of primary data available
Please explain how you have identified the GHG source, including major limitations to this process and
assumptions made
Ryder has established the SmartWay Tool as the technical basis and source for all mobile emission factors. GM Scope 3 emissions for Ryder
operated equipment are based on a factor of 22.2 lbs of CO2 per gallon of diesel fuel, as documented in the US EPA Office of Transportation
and Air Quality EPA 420-F-05-001 dated February 2005, and which is the basis for all SmartWay CO2 emission calculations. 3rd Party Carrier
Managed Transportation emissions are based on CO2 grams/mile as documented in the
US EPA SmartWay Carrier Performance data.
Requesting member
Koninklijke Philips NV
Scope of emissions
Scope 3
Allocation level
86
Ryder System, Inc. CDP Climate Change Questionnaire 2019 Friday, August 2, 2019
Company wide
Emissions in metric tonnes of CO2e
0
Uncertainty (±%)
0
Major sources of emissions
Ryder did not provide any Dedicated Transportation Solutions for Philips.
Verified
No
Allocation method
Other, please specify
Not applicable
Please explain how you have identified the GHG source, including major limitations to this process and
assumptions made
Requesting member
Kellogg Company
Scope of emissions
Scope 3
Allocation level
Company wide
87
Ryder System, Inc. CDP Climate Change Questionnaire 2019 Friday, August 2, 2019
Emissions in metric tonnes of CO2e
1,317
Uncertainty (±%)
2
Major sources of emissions
Ryder Dedicated Transportation Solutions - Fleet Operations.
Verified
No
Allocation method
Allocation not necessary due to type of primary data available
Please explain how you have identified the GHG source, including major limitations to this process and
assumptions made
Ryder has established the SmartWay Tool as the technical basis and source for all mobile emission factors. The Kellogg's Scope 3 emissions
are based on a factor of 22.2 lbs of CO2 per gallon of diesel fuel, as documented in the US EPA Office of Transportation and Air Quality EPA
420-F-05-001 dated February 2005, and which is the basis for all SmartWay CO2 emission calculations.
SC1.2
(SC1.2) Where published information has been used in completing SC1.1, please provide a reference(s).
GHG Protocol Table 14 Carbon Emissions Factors by Weight Distance
SC1.3
(SC1.3) What are the challenges in allocating emissions to different customers, and what would help you to overcome these
challenges?
88
Ryder System, Inc. CDP Climate Change Questionnaire 2019 Friday, August 2, 2019
Allocation
challenges
Please explain what would help you overcome these challenges
Other, please
specify
Determining
The challenge is not in allocating emissions to different customers. The challenge is in determining the appropriate emission factors for
ocean, air, and package transportation. Our primary 3rd party carriers are Less-Than-Truckload, Truckload, InterModal, and Rail. Our
data points are # of freight bills, weight, and miles. These are not the appropriate data points for air, ocean, and package. Separating
emission factors. downstream transportation activity by transportation mode, and establishing standardized emission factors by mode, would bring
consistency to the methodology and allow for evaluating transportation emissions across modes, industries, and sectors.
SC1.4
(SC1.4) Do you plan to develop your capabilities to allocate emissions to your customers in the future?
Yes
SC1.4a
(SC1.4a) Describe how you plan to develop your capabilities.
Ryder System has the capability to capture, measure, track, and analyze 3rd party carrier transportation management data for all of our clients and, as
such, is able to report Scope 3 downstream transportation emissions.
SC2.1
(SC2.1) Please propose any mutually beneficial climate-related projects you could collaborate on with specific CDP Supply Chain
members.
Requesting member
General Motors Company
Group type of project
89
Ryder System, Inc. CDP Climate Change Questionnaire 2019 Friday, August 2, 2019
Relationship sustainability assessment
Type of project
Assessing products or services life cycle footprint to identify efficiencies
Emissions targeted
Actions that would reduce both our own and our customers’ emissions
Estimated timeframe for carbon reductions to be realized
1-3 years
Estimated lifetime CO2e savings
Estimated payback
Details of proposal
Ryder Supply Chain Solutions has the technical expertise and capabilities to provide GM with carbon footprint metrics that will allow it to
measure, track, and monitor GHG by carrier and by mode. We would welcome the opportunity to incorporate these carbon footprint metrics in
the GM reporting platform.
SC2.2
(SC2.2) Have requests or initiatives by CDP Supply Chain members prompted your organization to take organizational-level
emissions reduction initiatives?
No
SC3.1
(SC3.1) Do you want to enroll in the 2019-2020 CDP Action Exchange initiative?
90
-
Ryder System, Inc. CDP Climate Change Questionnaire 2019 Friday, August 2, 2019
No
SC3.2
(SC3.2) Is your company a participating supplier in CDP’s 2018-2019 Action Exchange initiative?
No
SC4.1
(SC4.1) Are you providing product level data for your organization’s goods or services? No, I am not providing data
Submit your response
In which language are you submitting your response?
English
Please confirm how your response should be handled by CDP
Public or Non Public
Submission
I am submitting
to
Are you ready to submit the additional Supply Chain
Questions?
I am submitting my
response
Public Investors
Customers
Yes, submit Supply Chain Questions now
Please confirm below
I have read and accept the applicable Terms
91
Ryder System, Inc. CDP Climate Change Questionnaire 2019 Friday, August 2, 2019
92