clock drawing performance in cognitively normal … ej, et...clock drawing performance in...
TRANSCRIPT

Archives of Clinical Neuropsychology 23 (2008) 295–327
Clock drawing performance in cognitively normal elderly
Emily J. Hubbard a,b, Veronica Santini a, Christiaan G. Blankevoort c, Karin M. Volkers c,Melissa S. Barrup a, Laura Byerly a, Christine Chaisson a,b, Angela L. Jefferson a,
Edith Kaplan d,e, Robert C. Green a,b, Robert A. Stern a,∗a Alzheimer’s Disease Clinical and Research Program, Department of Neurology, Boston University
School of Medicine, Boston, MA, United Statesb Boston University School of Public Health, Boston, MA, United States
c Institute of Human Movement Sciences, University of Groningen, Netherlandsd Suffolk University, Boston, MA, United States
e Boston University School of Medicine, Boston, MA, United States
Accepted 12 December 2007
Abstract
The Clock Drawing Test (CDT) is a common neuropsychological measure sensitive to cognitive changes and functional skills(e.g., driving test performance) among older adults. However, normative data have not been adequately developed. We report thedistribution of CDT scores using three common scoring systems [Mendez, M. F., Ala, T., & Underwood, K. L. (1992). Developmentof scoring criteria for the Clock Drawing Task in Alzheimer’s Disease. Journal of the American Geriatrics Society, 40, 1095–1099;Cahn, D. A., Salmon, D. P., Monsch, A. U., Butters, N., Wiederholt, W. C., & Corey-Bloom, J. (1996). Screening for dementia of theAlzheimer type in the community: The utility of the Clock Drawing Test. Archives of Clinical Neuropsychology, 11(6), 529–539],among 207 cognitively normal elderly. The systems were well correlated, took little time to use, and had high inter-rater reliability.We found statistically significant differences in CDT scores based on age and WRAT-3 Reading score, a marker of education quality.We present means, standard deviations, and t- and z-scores based on these subgroups. We found that “normal” CDT performanceincludes a wider distribution of scores than previously reported. Our results may serve as useful comparisons for clinicians wishingto know whether their patients perform in the general range of cognitively normal elderly.© 2007 National Academy of Neuropsychology. Published by Elsevier Ltd. All rights reserved.
Keywords: Clock Drawing Test; Clock drawing; Normal aging; Normative data; Scoring systems; Neuropsychological tests; Elderly; Alzheimer’sdisease; Mild cognitive impairment; Dementia; Cognitive decline; Cognitive screening
The Clock Drawing Test (CDT) has been extolled as an inexpensive, fast, “non-threatening” (Shulman, Shedletsky,& Silver, 1986), and easily administered measure of cognitive function, especially in the elderly (e.g., Brodaty &Moore, 1997; Cahn et al., 1996; Freedman et al., 1994). A multifaceted and multidimensional measure, the CDT isthought to test visuoconstructive and visuospatial skills, symbolic and graphomotor representation, auditory languageskills, hemiattention, semantic memory, conceptual abilities, and executive function including organization, planning,
∗ Corresponding author at: Alzheimer’s Disease Clinical and Research Program, Boston University School of Medicine, Robinson Complex, Suite7800, 715 Albany Street, Boston, MA 02118-2526, United States. Fax: +1 617 414 1197.
E-mail address: [email protected] (R.A. Stern).
0887-6177/$ – see front matter © 2007 National Academy of Neuropsychology. Published by Elsevier Ltd. All rights reserved.doi:10.1016/j.acn.2007.12.003

296 E.J. Hubbard et al. / Archives of Clinical Neuropsychology 23 (2008) 295–327
and parallel processing (Freedman et al., 1994; Libon, Malamut, Swenson, Prouty Sands, & Cloud, 1996; Mendez, Ala,& Underwood, 1992; Rouleau, Salmon, Butters, Kennedy, & McGuire, 1992; Shulman, 2000; Spreen & Strauss, 1998).Deficits in these areas reflect possible frontal and temporoparietal disturbances that are often exhibited in AD (Freedmanet al., 1994; Samton et al., 2005; Spreen & Strauss, 1998), and that may not easily be detected by commonly usedcognitive screening tests such as the Mini-Mental State Exam (MMSE) (Brodaty & Moore, 1997; Folstein, Folstein, &McHugh, 2001). Studies have reported associations between the CDT and other cognitive measures, including thosethat measure semantic memory (Libon et al., 1996), the Rey–Osterrieth Complex Figure (Osterrieth, 1944; Rey, 1941)Symbol Digits Modalities Test (Mendez et al., 1992; Smith, 1973), and the MMSE (Brodaty & Moore, 1997; Folsteinet al., 2001; Mendez et al., 1992; Shulman, 2000). An advantage of the CDT over many other cognitive measures isits lack of reliance on verbal abilities (Spreen & Strauss, 1998; Sunderland et al., 1989), making it a useful screeningtool for dementia in non-English speaking populations (e.g., Cacho et al., 1996; Lam et al., 1998) and in patientswith aphasia or other loss of verbal expression. Furthermore, the measure’s good test–retest reliability (Mendez etal., 1992; Spreen & Strauss, 1998; Watson, Arfken, & Birge, 1993) and high intra- and inter-rater reliabilities acrossclinicians and non-clinicians have led to widespread use of the CDT in neuropsychological screening batteries (Kozora& Munro, 1994; Mendez et al., 1992; Rouleau et al., 1992; Spreen & Strauss, 1998; Sunderland et al., 1989; Tuokko,Hadjistavropoulous, Rae, & O’Rourke, 2000).
Perhaps the most common method of interpreting CDT performance is “clinical judgment”. That is, many usersof the CDT, including neurologists, psychiatrists, geriatricians, and neuropsychologists, use it to provide a “quick‘cognitive scan’ and to demonstrate a patient’s difficulties to family members” (Fischer & Loring, 2004, p. 553),presumably making a clinical judgment without using a standardized scoring approach. There are obvious limitationsto this approach, including poor inter-clinician agreement and the fact that most clinicians have not administered theCDT to enough healthy controls to create their own internal norms. Moreover, without some standardized scoringmethod, the utility of the CDT in research would be significantly limited. Therefore, over the past two decades, morethan a dozen scoring systems for the CDT have been developed (Freedman et al., 1994; Freund, Gravenstein, Ferris,Burke, & Shaheen, 2005; Libon et al., 1996; Manos, 1999; Mendez et al., 1992; Roth et al., 1986; Rouleau et al.,1992; Royall, Cordes, & Polk, 1998; Samton et al., 2005; Shulman et al., 1986; Sunderland et al., 1989; Tuokko,Hadjistavropoulous, Miller, & Beattie, 1992; Watson et al., 1993; Wolf-Klein, Silverstone, Levy, & Brod, 1989).
Some authors have emphasized the need for brief, quantitative scoring approaches that clinicians can easily use andinterpret (cf. Juby, Tench, & Baker, 2002; Samton et al., 2005; Shulman, 2000; van der Burg et al., 2004; Wolf-Kleinet al., 1989). However, the conversion of a multifaceted, multidimensional test into a single number score tends tosacrifice both the sensitivity and specificity of the instrument, both of which must be high for the test to functionas an adequate screening tool (Fischer & Loring, 2004; Greenhalgh, 1997). For example, a scale that measures only“critical” aspects of the CDT may not detect subtle differences between healthy subjects and those with mild formsof cognitive impairment (Schramm et al., 2002; Seigerschmidt, Mosch, Siemen, Forstl, & Bickel, 2002; Tuokkoet al., 1992). A single-score quantitative approach may also compromise the test’s ability to effectively distinguishbetween different error types, which might be critical in discriminating between Alzheimer’s disease and other typesof cognitive dysfunction (e.g., Huntington’s disease (Rouleau et al., 1992), frontotemporal dementia (Blair, Kertesz,McMonagle, Davidson, & Bodi, 2006), or ischemic vascular dementia (Libon et al., 1996)). Original sensitivity andspecificity values are often determined by comparing very healthy subjects to those with severe impairment, a practicethat is not reflective of clinical realities and may overestimate the CDT’s utility as a screening instrument (Lee,Swanwick, Coen, & Lawlor, 1996). To increase the likelihood of detecting errors in clock drawing, other researchershave promoted the use of scoring approaches with multiple scales that rate quantitative and qualitative features ofthe production (Libon et al., 1996). However, these scoring systems are potentially more time-consuming for theclinician.
A major limitation to the existing quantitative and qualitative CDT scoring approaches is that there is little, ifany, normative data available. In particular, there is a dearth of data describing cognitively normal older adults’CDT performance across commonly employed scoring systems. Moreover, normative data from a well-characterizedpopulation are lacking, possibly accounting for differences in sex, education, and race across meaningful age intervals.
Regardless of the continued lack of a standardized, simple, reliable, valid, and commonly accepted scoring systemfor clock drawings (Mendez et al., 1992; Storey, Rowland, Basic, & Conforti, 2001), many researchers still encourageits cautious use and interpretation as a supplement to other neuropsychological measures of cognitive decline (e.g.,Shulman, 2000; Sunderland et al., 1989). It has gained widespread clinical use (Freedman et al., 1994), and despite

E.J. Hubbard et al. / Archives of Clinical Neuropsychology 23 (2008) 295–327 297
ample recommendations to the contrary, has still been recommended as a primary (and single) screening measure ofa critical decline in functioning. For example, the CDT is recommended as a major component in the assessment ofdriving safety among older adults by the National Highway Traffic Safety Administration (NHTSA) in conjunctionwith the American Medical Association (Wang, Kosinski, Schwartzberg, & Shanklin, 2003).
The purpose of this study was to collect data on commonly used qualitative and quantitative CDT scoring methods in awell-characterized population of cognitively healthy older adults. Our goals were to: (1) examine pertinent demographicvariables in relation to CDT performance; (2) provide normative data for these scoring systems; and (3) provide abetter understanding of the psychometric properties of the various scoring systems evaluated, including their inter-rater reliability, their interrelation to one another, and their clinical utility. Clinicians may use these data to determinewhether their patients’ CDT performances fall within the normal range of scores for cognitively healthy elderlyindividuals with similar demographic characteristics. They may be further guided in their selection of a particular CDTscoring system that most adequately suits their clinical or research needs.
1. Methods
1.1. Subjects
The study population consisted of volunteers enrolled in the patient control registry for the Boston UniversityAlzheimer’s Disease Core Center (BU ADCC). The data collection for this study was approved by the local institutionalreview board and all participants provided written informed consent. As previously described (Jefferson et al., 2006;Jefferson, Wong, Gracer, Green, & Stern, 2007), all participants are at least 55 years old and are evaluated annuallywith physical and neurological examinations, informant interviews, and neuropsychological tests. All diagnoses aremade at multi-disciplinary consensus meetings. Although the CDT is regularly administered as part of the neurologicalexamination, CDT scores are not included in the consensus diagnosis of objective cognitive impairment; that is,a diagnosis of mild cognitive impairment (MCI), dementia, or other cognitive disorder is not made solely on thebasis of CDT performance. In addition, all members of the consensus diagnostic conference are blinded to CDTscores.
As part of the registry’s neuropsychological evaluation, all participants are administered the Wide-Range Achieve-ment Test-3 (WRAT-3) Reading subtest (Wilkinson, 1993) as a measure of estimated pre-morbid intelligence.Additional measures include the MMSE (Folstein et al., 2001) as a screen of cognitive impairment, and the GeriatricDepression Scale (GDS) (Yesavage et al., 1983) as a self-report measure of depression. In addition, all participantscomplete a Clinical Dementia Rating (CDR) interview (Hughes, Berg, Danziger, Coben, & Martin, 1982; Morris,1993).
For the current study, only participants who received a consensus diagnosis of non-case were included. This diagnosisincludes participants who have completely normal performance (i.e., ≤1.5 standard deviations of normative data) onneuropsychological tests (without consideration of the CDT) (n = 207). This group of non-case participants was furtherdivided into “Controls” (CTL), those without any self- or informant-report of cognitive, behavioral, or functionalcomplaint (n = 168), and “Controls-Complaint” (CTL-C), those with self and/or informant complaints (n = 39). Allparticipants for the current study had a global CDR = 0, an MMSE score ≥26, and a GDS score <20. The distributionsof demographic variables and performance on the MMSE, WRAT-3 Reading test, and GDS in the normative sampleare shown in Table 1.
1.2. Procedures
The CDT is part of the ADCC registry annual visit. Trained examiners administer the test in the following stan-dardized fashion: a sheet of 8.5 in. × 11 in. white paper is folded in half such that a pre-drawn clock (set to 10 after11) on the left side of the paper is concealed. For the Command condition, the examiner states, “I want you to drawthe face of a clock, put in all the numbers where they should go, and set the hands at 10 after 11”. Once the subjecthas completed the Command condition, the examiner turns the paper over, exposing the pre-drawn clock on the otherside for the Copy condition, and states, “I want you to copy this clock exactly as you see it. Try to make your drawinglook exactly as this drawing”. The subject is allowed to make erasures, and may attempt to draw each clock twotimes.

298 E.J. Hubbard et al. / Archives of Clinical Neuropsychology 23 (2008) 295–327
Table 1Descriptive statistics, all subjects (n = 207)
Mean (S.D.) Median Range
Age at visit (years) 71.3 (8.4) 72 55–98# Years education 16.6 (2.7) 17 11–24
Mean scoresWRAT-3 Reading raw scorea 52.3 (3.2) 53 39–57WRAT-3 Reading adjusted scorea 113.1 (6.1) 115 84–122MMSE 29.4 (0.8) 30 26–30GDSb 3.3 (4.2) 2 0–17
n % % U.S. population age 55 and olderc
SexFemale 134 64.7 54.8Male 73 35.3 45.2
RaceWhite 174 84.1 85.9Black/African American 31 15.0 9.2Asian 1 0.5 3.5Other 1 0.5 1.5
a WRAT scores were unavailable for two subjects (n = 205).b GDS scores were unavailable for four subjects (n = 203).c Source: Census Bureau (2006).
1.3. Selection of clock drawing scoring systems
We selected scoring criteria from three different scoring systems: those developed by Mendez et al. (1992), Freundet al. (2005), and Cahn et al. (1996), which includes their adaptation of the quantitative score approach reported byRouleau et al. (1992). We will refer to these three systems as Mendez, Freund, and Cahn, respectively. These scaleswere selected because they provide a combination of qualitative and quantitative scales for evaluation of the CDT, aswell as for other specific reasons enumerated below.
The Mendez system was included because it has one of the largest Receiver Operating Characteristic (ROC) (Lusted,1971) curve areas compared to other CDT scoring systems, as well as excellent inter- and intra-rater reliability (Storeyet al., 2001). It is also one of the most detailed quantitative scoring systems available. The Mendez scale awards amaximum of 20 points based on the presence of various clock features (mostly related to the correct quantity andpositioning of numbers and hands) and the absence of intrusive marks. The authors report that normal elderly subjects(n = 26) do not miss more than two points, versus subjects with Alzheimer’s disease (n = 46) who miss at least threepoints. Furthermore, this scoring system takes “less than a minute” to complete (Mendez et al., 1992).
The Freund system was included because of its recommended use by the NHTSA, in conjunction with the AmericanMedical Association, as a primary component in the assessment of driving safety among older adults (Wang et al., 2003).It should be noted that a newer version of the Freund scale was used for the present study than the one recommendedin the NHTSA manual. The Freund scale assigns up to seven points based on three categories: time (three points),numbers (two points), and spacing (two points), with a score of 7 being perfect. Among older community membersreferred for driving evaluations, loss of more than two points on the scale was a predictor of unsafe driving based on aSTISIM Drive Simulator test (Freund et al., 2005).
The Cahn system is comprised of multiple parts: a quantitative scale, a qualitative scale, and a global score. The10-point quantitative scale was first presented by Rouleau et al. (1992) and is a revision of the scoring originallypresented by Sunderland et al. (1989). A high score on the quantitative scale indicates good performance. Cahn etal. (1996) added a qualitative scale, which assigns one point to each of eight possible errors. Thus, a high qualitativescore is indicative of poor performance. Finally, the Cahn global score is calculated by subtracting the qualitative score(number of errors) from the quantitative score, for a possible range of −8 (worst) to 10 (best). A global score ≤6 (acombination of a quantitative score ≤7 and a qualitative score ≥1) is highly sensitive and specific in differentiating

E.J. Hubbard et al. / Archives of Clinical Neuropsychology 23 (2008) 295–327 299
normal subjects and those with dementia of the Alzheimer type, and was better than either of the individual scoresalone (Cahn et al., 1996).
Many additional scoring systems were not evaluated in this study. Some systems have less favorable sensitivity andspecificity in cognitive screening than those selected for this investigation (cf. Brodaty & Moore, 1997; Storey et al.,2001; Yamamoto et al., 2004). Also, some authors base their scoring criteria on the use of a pre-drawn clock circle(Manos, 1999; Shulman et al., 1986; Watson et al., 1993; Wolf-Klein et al., 1989) and, in some cases, the administrationdoes not require subjects to draw the hands on the clock (e.g., Watson et al., 1993; Wolf-Klein et al., 1989).
Clocks were also evaluated as to whether the “center” (i.e., a central point or intersection of the clock hands) waspresent and whether this center was displaced more than a specified number of millimeters horizontally or verticallyfrom the measured center of the clock face. These types of errors have been found to be uncommon in cognitivelynormal elderly (Freedman et al., 1994). These errors were reported as a three-point quantitative scale modified fromFreedman et al. (1994).
1.4. Clock scoring
In order to assure that raters scored clocks from healthy subjects with minimal bias, retrospective scoring wascompleted for a total of 579 clocks from the entire sample of ADCC participants. This consisted of 216 non-cases, 206subjects diagnosed with MCI, 115 with possible or probable Alzheimer’s disease, and 42 with “ambiguous” or otherdiagnoses. CDT productions from the subjects’ most recent ADCC registry visits were utilized.
Scoring was completed by a group of five research assistants blinded to the participants’ diagnoses. One raterscored each clock using all of the scoring systems. All scoring system training was conducted by the ADCC’s seniorneuropsychologist (RAS) for each rater. The raters found it necessary to further specify certain qualitative aspects of thesystems to enhance inter-rater agreement. The compiled scoring systems used for this study, including supplementalmodifications, are included in Appendix A.
Inter-rater reliability was assessed by comparing CDT scores from two raters who each scored the same 50 clocksfrom subjects sampled randomly from all diagnostic groups (the controls used for the normative analysis presented here,as well as subjects with other diagnoses, such as MCI or probable Alzheimer’s disease) to assure adequate variabilityin scores. For every clock scored, each rater used all scoring systems arranged in random order.
In order to establish whether repeated use of the scales increased the speed of scoring (i.e., if there was a learningcurve), we compared the mean time required to score both the Command and Copy conditions of the first and last 50clocks scored by a single rater, using each of the scoring systems arranged in random order. As with the 50 clocks usedin the inter-rater reliability analysis, these 100 clocks were sampled from a range of all ADCC subjects.
1.5. Statistical analysis
We used a significance level of 0.05 for all analyses unless otherwise indicated. All cognitively normal subjects(n = 207) who met inclusion criteria were incorporated in the majority of analyses. We excluded two participants fromanalyses involving race: one who self-identified as Asian and one who self-identified as “other”, resulting in a samplesize of 205 (n = 31 “Black/African American”, hereafter referred to as African American, and n = 174 “White”).
Because the Command condition is more commonly administered (that is, some clinicians give only the Commandcondition and not the Copy condition), we created norms based on the Command condition and used the resultingdemographic sub-groupings to present Copy condition norms as well. Here we present descriptive statistics and othergeneral information for both the Command and Copy conditions.
1.5.1. Correlations among CDT scoresWe performed Pearson and Spearman correlation analyses to examine the association between the different CDT
scoring systems. To avoid type I errors due to multiple correlations, we set a conservative alpha level of 0.01.
1.5.2. Differences in the normative sample and CDT scoresIn order to identify whether differences in cognitive complaint status, race, or sex might be related to differences
in CDT scores, we compared performance on the CDT and other measures across these subgroups using independentsamples t-tests and Pearson chi-square tests. Mann–Whitney U-tests were used to evaluate differences on the Center

300 E.J. Hubbard et al. / Archives of Clinical Neuropsychology 23 (2008) 295–327
scoring system. We evaluated differences in CDT scores according to education by dividing the sample into fiveeducation levels: less than a high school degree, high school graduate, some college, college graduate, and post-collegeeducation. Differences in CDT scores by education level were determined using one-way ANOVAs and Tukey’s HSDpost hoc test.
1.5.3. Impact of demographic variables on CDT performanceTo determine meaningful normative subgroups, we evaluated the degree to which demographic variables accounted
for variance in CDT scores. We performed a stepwise multiple linear regression for each CDT Command conditiontotal score. Variables included in the models were: age, years of education, WRAT-3 Reading raw score, MMSE, sex,and race.
For each model, plots of the residuals against the predicted (fitted) values suggested that the assumption of constantvariability for residuals underlying regression modeling was not consistently met. Additionally, the Cahn modelsviolated the regression assumption of equality of error variance. We therefore report the results of the regressionanalyses with the caveat that they should not be assumed to be a complete picture of the relations between CDTscores and other variables. They were, however, useful for guiding our further evaluation of these interactions as wedetermined normative subgroups.
1.5.4. Development of normsThe next step in establishing normative data was to determine how and where to subdivide the different vari-
ables contributing to differences in CDT performance. We used the following iterative process, beginning with thevariable that accounted for the greatest proportion of variance in CDT scores in the linear regression models. Thesample was divided into potentially clinically meaningful subgroups. One-way ANOVAs and Tukey’s post hoc com-parisons were performed to determine which subgroups differed significantly from each other. This was repeatedusing numerous different subgroup combinations until the most parsimonious division was determined—that is,the fewest possible subgroups that showed the most statistically significant differences in CDT scores, and witha statistically sufficient number of subjects per subgroup. Once this was determined, we performed independent-samples t-tests and chi-square tests to evaluate whether other variables (e.g., education, race, WRAT-3 Readingscores) differed significantly between the subgroups. To determine whether other variables attenuated the subgroupdifferences in CDT scores, we entered potential covariates into type III sum of squares models of between-subjectseffects.
Once this process had been completed for the first variable, we repeated the process using other variables that hadshown an association with CDT scores. After the subgroupings for two variables were determined, we performed 2 × 2ANOVAs to see whether all subgroups remained significant and whether there were interactions between them. Wecontinued this process until all meaningful groupings had been determined, and used the resulting subgroups to presentnormative data.
1.5.5. Center qualitative featuresAnalyses of the Center score were conducted separately as a categorical, qualitative measure because the three-
point Center scale was limited in range. We performed nonparametric correlations (Spearman’s rho) to evaluate theassociation between the qualitative features of the clock center and the variables that had been significant in the linearregression models, using a conservative alpha level of 0.01 due to multiple correlations. Once the normative subgroupshad been determined, we evaluated differences in quantitative or qualitative center scores across the subgroups usingMann–Whitney U-tests.
2. Results
2.1. Inter-rater reliability
The ICC coefficients for each CDT system are presented in Table 2. For every scoring system except the Cahnqualitative scale, ICC coefficients were in the “almost perfect” range for inter-rater reliability (Landis & Koch, 1977)for both Command and Copy conditions. The Cahn qualitative scale was the only scale that did not show almost perfect

E.J. Hubbard et al. / Archives of Clinical Neuropsychology 23 (2008) 295–327 301
Table 2Summary of intraclass correlation analysis, CDT Command and Copy conditions
Intraclass correlation coefficienta,***
Command condition Copy condition
Freund total 0.80 0.80Mendez total 0.95 0.92Cahn quantitative 0.95 0.88Cahn qualitative 0.61 0.59Cahn global 0.91 0.82
a Single measures, two-way mixed effects model where people effects are random and measures effects are fixed; type A intraclass correlationcoefficients using an absolute agreement definition.*** All p < 0.001.
correspondence between raters: its Command condition ICC would be considered “substantial” and its Copy conditiononly “moderate” (Landis & Koch, 1977).
2.2. Time to score
Mean times to score using each system are displayed in Table 3. The “Cahn Scale” includes the time to com-plete the quantitative and qualitative scales and to calculate the global score. As seen in Table 3, the Freundscale scoring took the least amount of time, while the Mendez and Cahn scales took about twice as long asFreund.
Time to implement decreased significantly with practice for all four systems (see Table 3). The Mendez and Cahnscales showed the largest decrease in scoring time (approximately 30 s, or 1/3 of the total original scoring time, werereduced with practice). The Freund scale remained the least time-consuming after practice.
2.3. Clock scores—normative subjects
Descriptive statistics for all CDT total scores across the entire normative sample are shown in Table 4.
2.4. Correlations among CDT scores
The results of the Pearson correlations were not significantly different than the results obtained using the Spearmancorrelations; therefore, we report the results of the more robust parametric (Pearson) correlations in Table 5. All CDTCommand condition scores were significantly correlated with each other. The strongest correlations between systemswere for the Freund and Mendez scales, which accounted for 57.6% of each other’s variance.
Table 3Mean time to score per system and comparison of change over time for clocks scored by one rater
Time to score (s) Comparison (Ind.-samples t-test)
First 50 clocks Last 50 clocks Overall (all 100 clocks) t-Value Significance
Mean S.D. Range Mean S.D. Range Mean S.D. Range
Freund 45.3 11.6 26–75 37.9 15.8 20–95 41.6 14.3 20–95 2.64a 0.010Mendez 92.2 26.6 49–175 63.3 14.3 39–102 77.7 25.8 39–175 6.78b <0.001Cahn total 95.7 21.6 56–151 62.5 13.8 39–106 79.1 24.5 39–151 9.16c <0.001Center 28.2 10.0 9–53 16.5 12.4 4–68 22.4 12.6 4–68 5.17a <0.001
a d.f. = 98 (equal variances assumed).b d.f. = 75 (equal variances not assumed).c d.f. = 83 (equal variances not assumed).

302 E.J. Hubbard et al. / Archives of Clinical Neuropsychology 23 (2008) 295–327
Table 4CDT total scores for the entire normative sample, Command and Copy conditions (n = 207)
Command condition Copy condition Possible range
Mean S.D. Median Range Mean S.D. Median Range
Freund 5.1 0.8 5 2–7 5.0 0.6 5 2–7 0–7Mendez 18.0 1.1 18 13–20 17.9 1.0 18 15–20 0–20
CahnQuantitative 8.6 1.0 9 3–10 8.7 0.8 9 4–10 0–10Qualitative 1.7 0.8 2 0–5 1.9 0.7 2 0–4 0–8Global 6.9 1.5 7 −1 to 10 6.8 1.3 7 0–10 −8 to 10
Center total 2.9 0.4 3 1–3 2.9 0.3 3 1–3 1–3
Table 5Correlations among CDT Command condition total scores
Pearson correlation coefficients***
Freund Mendez Cahn quantitative Cahn qualitative
Mendez 0.76 – – –Cahn quantitative 0.57 0.63 – –Cahn qualitative −0.44 −0.50 −0.37 –Cahn global 0.62 0.69 0.87 −0.78
*** p < 0.001.
2.5. Differences in the normative sample and CDT scores
2.5.1. Cognitive complaintsCTL subjects were younger, on average, than CTL-Cs (CTL: 70.6 years, S.D. 8.0, range 55–89; CTL-C: 74.3
years, S.D. 9.0, range 56–98; t(205) = −2.53, p = 0.012; equal variances assumed, Levine’s Test for Equality ofVariance, F = 0.183, p = 0.669). The CTLs also had a lower mean GDS score (CTL: 2.7, S.D. 4.7 vs. CTL-C: 5.8,S.D. 3.1; t(46) = −3.85, p < 0.001; equal variances not assumed, Levine’s Test for Equality of Variance, F = 20.60,p < 0.001). The two subgroups did not differ significantly on mean MMSE, WRAT-3 Reading raw or adjustedscores, or on any of the CDT Command or Copy condition scores. Therefore, we considered all 207 “non-cases”as one group for the purpose of establishing norms, regardless of the existence of a self or informant comp-laint.
2.5.2. RaceIn our sample, African Americans were younger than Whites, had fewer years of education, and had lower WRAT-
3 Reading raw and adjusted scores (Table 6). MMSE and GDS scores did not differ between groups. There weresignificant differences in CDT Command condition total scores between Whites and African Americans for the Cahnqualitative and Cahn global scores (Table 6). The two groups also differed on the Copy condition for the Mendez andCahn qualitative scores (Table 6). We therefore examined possible racial differences in our subsequent, more detailedanalysis of CDT scores.
2.5.3. SexThe only significant between-group difference by sex was mean education level (17.5 years, S.D. 2.5 for males;
16.1 years, S.D. 2.6 years for females, t(205) = 3.62, p < 0.001). There were no differences between males and femaleson CDT Command condition total scores. There was a significant difference in mean Cahn quantitative Copy con-dition scores in an independent samples t-test between men (mean 8.5, S.D. 1.1) and women (mean 8.8, S.D. 0.6),t(101) = −2.61, p = 0.041).

E.J. Hubbard et al. / Archives of Clinical Neuropsychology 23 (2008) 295–327 303
Table 6Racial group differences
White African-American Test statistic Significancen = 174 n = 31
Mean (S.D.)
Age at visit (years) 71.8 (8.0) 68.5 (9.4) t(203) = 2.01a 0.045# Years Ed. 16.8 (2.6) 15.4 (2.8) t(203) = 2.73a 0.007WRAT-3 raw score 52.8 (2.7) 49.1 (3.9) t(201) = 6.66a <0.001WRAT-3 adjusted score 114.3 (4.9) 106.6 (8.2) t(34) = 5.08a <0.001MMSE at visit 29.4 (0.8) 29.3 (1.0) t(203) = 0.36a 0.717GDS at visit 3.2 (3.6) 4.1 (4.0) t(199) = −1.24a 0.217
n (%) Test statistic Significance
SexFemale 64 (36.8) 8 (25.8) χ2(1) = 1.39b 0.238Male 110 (57.5) 23 (74.2)
CDT scores—Command conditionFreund 5.1 (0.8) 5.0 (1.0) t(203) = 0.35a 0.724Mendez 18.0 (1.0) 17.6 (1.3) t(36) = 1.72a 0.094Cahn quantitative 8.7 (1.0) 8.4 (1.2) t(203) = 1.31a 0.191Cahn qualitative 1.6 (0.7) 2.1 (1.1) t(203) = −2.67a 0.008Cahn global 7.0 (1.4) 6.3 (2.0) t(203) = 2.29a 0.023Center 2.9 (0.4) 2.9 (0.4) U[205] = 2597.5c 0.571
CDT scores—Copy conditionFreund 5.0 (0.7) 5.0 (0.5) t(202) = −0.07a 0.942Mendez 18.0 (1.0) 17.6 (0.8) t(202) = 2.02a 0.045Cahn Quantitative 8.7 (0.8) 8.6 (0.8) t(202) = 0.68a 0.498Cahn Qualitative 1.9 (0.7) 2.2 (0.6) t(202) = −2.12a 0.036Cahn global 6.8 (1.3) 6.4 (1.1) t(202) = 1.67a 0.097Center 2.9 (0.4) 3.0 (0.2) U[204] = 2472.5c 0.180
Note: n = 205 in this sample because two participants who identified as neither “White” nor “Black/African American” were excluded from the raceanalyses.
a Independent samples t-test for equality of means.b Pearson chi-square, two-sided asymptotic significance.c Mann–Whitney U-test.
2.5.4. EducationCDT Command condition scores differed significantly by education level only for the Cahn global score (F(3,
203) = 2.98, p = 0.033). Post hoc tests showed that the significant differences in Cahn global scores were between theleast-educated group (high school or less) and both the college graduates and those with post-college education.
2.6. Impact of demographic variables on CDT performance: multiple linear regression
No multiple linear regression model was able to account for more than about 10% of the variance of any CDTscoring system. For the Freund and Mendez systems, age and WRAT-3 Reading raw scores were the only significantpredictors of Command condition total scores. For the Cahn system, age was a significant predictor of scores on allthree of the subscales. The MMSE predicted some of the variance in the quantitative scale, and race was a significantpredictor of the qualitative scale; however, age and WRAT-3 Reading were again the only significant predictors of theCahn global score.
WRAT-3 Reading raw score accounted for the apparent influences of MMSE, education, and race in the majorityof the multiple regression analyses. A stepwise linear regression using WRAT-3 Reading raw score as the dependent

304 E.J. Hubbard et al. / Archives of Clinical Neuropsychology 23 (2008) 295–327
Table 7Comparisons between age groups split at 75 years
Mean (S.D.) Between group comparisons
Age 55–74 Age 75–98 Test statistica Significance (two-tailed)n = 135 n = 72
# Years education 16.8 (2.6) 16.3 (2.8) t(205) = 1.51 0.133MMSE at visit 29.5 (0.7) 29.2 (0.9) t(205) = 3.19 0.002GDS at visit 3.1 (3.6) 3.7 (3.7) t(201) = −1.22 0.226WRAT-3 raw score 52.1 (3.3) 52.6 (3.1) t(203) = −1.21 0.229WRAT-3 adjusted score 112.4 (6.7) 114.6 (4.6) t(202) = −2.48 0.014
Group n (%) χ2-Valueb Asymp. Sig. (two-sided)
Racec
White 112 (83.6) 62 (87.3) 0.52 0.477African American 22 (16.4) 9 (12.7)
SexMale 48 (35.6) 25 (34.7) 0.01 0.905Female 87 (64.4) 47 (65.3)
Cognitive complaintCTL 113 (83.7) 55 (76.4) 1.64 0.200CTL-C 22 (16.3) 17 (23.6)
Mean (S.D.) Between group comparisons
CDT Command condition scoresFreund 5.2 (0.8) 4.8 (0.8) F = 7.7 0.006Mendez 18.1 (1.0) 17.7 (1.1) F = 8.1 0.005Cahn
Quantitative 8.8 (0.9) 8.3 (1.2) F = 10.4 0.002Qualitative 1.5 (0.8) 2.0 (0.7) F = 18.0 <0.001Global 7.2 (1.4) 6.3 (1.6) F = 19.9 <0.001
a Independent samples t-tests for equality of means and unadjusted one-way ANOVAs.b d.f. = 1 for all chi-square tests.c For race analyses, n = 205.
variable showed that race, years of education, and age were the most significant predictors of WRAT-3 Reading, togetheraccounting for 26.4% of its variance. Race alone accounted for 17.7% of the variance in WRAT-3 Reading scores.Therefore, in our subsequent determination of normative data based on our sample, we considered the influences of ageand WRAT-3 Reading raw scores, but also separately analyzed the effects of age, education, and race since WRAT-3Reading data are often unavailable clinically.
2.7. Development of norms
2.7.1. AgeWe began by determining meaningful subgroups for age because it had been the only universal predictor of CDT
scores in the linear regression models. The best age group division was a split at age 75 (<75 vs. ≥75 years) for allthree scoring systems (Table 7).
When we compared the two age groups split at 75 years, we found that MMSE was significantly different betweenthe older and younger participants. No significant differences were found between age groups for cognitive complaint(CTL vs. CTL-C), WRAT-3 Reading raw score, race (White vs. African American), or sex (Table 7).
Because of the between-group age differences in MMSE and the association between WRAT-3 Reading andCDT performance, we adjusted for WRAT-3 Reading raw scores and MMSE to determine whether these vari-ables had any impact on the age group differences in CDT scores. Age remained statistically significant whenWRAT-3 or MMSE were covaried. WRAT-3 Reading raw scores were significant covariate factors in the type

E.J. Hubbard et al. / Archives of Clinical Neuropsychology 23 (2008) 295–327 305
Table 8Differences between subjects with low and high levels of education
Education levela Independent samples t-test
Low (n = 58) High (n = 149) t d.f. Sig. (two-tailed)
Mean S.D. Mean S.D.
Age at visit 73.0 8.4 70.6 8.2 1.87 205 0.062MMSE at visit 29.2 0.9 29.5 0.8 −2.49 205 0.014GDS at visitb 3.8 4.1 3.1 3.5 1.08 201 0.283WRAT-3 Reading raw scorec 51.1 3.1 52.7 3.1 −3.46 203 0.001
Group n (%) n (%) Total n Chi-square tests
χ2-Valued Asymp. Sig. (two-sided)
Age <75 vs. 75+55–74 32 (23.7) 103 (76.3) 135 3.58 0.05875–98 26 (36.1) 46 (63.9) 72
RaceWhite 43 (24.7) 131 (75.3) 174 7.27 0.007African American 15 (48.4) 16 (51.6) 31
SexMale 10 (13.7) 63 (86.3) 73 11.47 0.001Female 48 (35.8) 86 (64.2) 134
Cognitive complaintCTL 47 (28.0) 121 (72.0) 168 0.001 0.977CTL-C 11 (28.2) 28 (71.8) 39
a “Low Education” = no college degree; “High Education” = college degree or higher.b For the GDS, n = 58 among those with “low” education level and n = 145 among those with “high” education.c For the WRAT-3 Reading score, n = 58 among those with “low” education and n = 147 among those with “high” education.d d.f. = 1 for all chi-square tests.
III sum of squares models of between-subjects effects for all CDT scores, with the exception of the Freundscale.
2.7.2. EducationWe dichotomized participants into those with less than a college degree (“low education”) and those with at
least a college degree (“high education”). Significant differences emerged between the low and high educationgroups on the Cahn global (t(205) = −2.48, p = 0.014) and quantitative (t(205) = −2.22, p = 0.027) Command con-ditions (Table 8). Because this categorization (low vs. high education) showed larger and more robust differencesbetween CDT scores than the original five education levels, we used the dichotomization for the remaining educationanalyses.
Differences emerged between the two education groups for sex, race (White vs. African American), MMSE andWRAT-3 Reading raw and adjusted scores (Table 8). The education differences between the Cahn quantitative andglobal scales remained significant when race and sex were included as covariates. When WRAT-3 Reading raw scorewas covaried, however, neither Cahn quantitative nor Cahn global scores remained significantly different between thetwo education groups.
In a 2 × 2 ANOVA including both age (split at 75 years) and education (high vs. low) as independent variablesand comparing CDT scores between groups, education was only a significant factor in the models for the Cahnquantitative (F(1, 203) = 4.27, p = 0.040) and Cahn global (F(1, 203) = 4.49, p = 0.035) Command condition scores.The interaction between the age group split at 75 years and the high/low education levels was not significant for any ofthe CDT Command condition scores. Again, when WRAT-3 Reading raw score was included as a covariate, educationwas no longer significant in the between-subjects analysis for any of the CDT scores, while age at visit remainedsignificant for all of them. This result was consistent when MMSE was used as a covariate instead of WRAT-3 rawscore.

306 E.J. Hubbard et al. / Archives of Clinical Neuropsychology 23 (2008) 295–327
Without data on a subject’s WRAT-3 scores, educational differences may appear to influence performance oncomponents of the Cahn scoring system. We therefore provide means and standard deviations for the Cahn scoresbased on education and separately based on WRAT-3 Reading raw scores.
2.7.3. SexTo determine if dichotomizing the sample at age 75 years would lead to interactions between age and sex on the
CDT scores, we performed a 2 × 2 ANOVA using both age split at 75 years and sex as independent variables. No sexdifferences were detected for any of the clock scores, nor was the interaction between sex and age split significant forany CDT score.
2.7.4. RaceWhen we analyzed the overall effect of race on CDT Command condition scores in an ANCOVA, and adjusted for
WRAT-3 Reading raw score, race did not have a significant effect on any of the CDT scores. When years of educationor high/low education level were used as a covariate instead of WRAT-3 Reading raw score, the Cahn qualitativescore remained significantly different between Whites and African Americans (covarying years of education: F(1,202) = 5.36, p = 0.022; covarying high/low education level: F(1, 202) = 5.57, p = 0.019).
Because we planned to report normative scores based on education level for the Cahn scales, we evaluated the effectof race in a 2 × 2 × 2 factorial ANOVA including age (split at 75 years), education (high vs. low), and race (Whitevs. African American) as independent variables. Age and education were significant factors for all three Cahn scales.Race was a significant factor in both the qualitative and global scales, but not for the quantitative scale. The interactionbetween education and race was significant for all three scales.
2.7.5. WRAT-3 Reading scoresThe most significant differences in CDT scores emerged when WRAT-3 Reading raw scores were split at 49 (scores
of 39–48 compared to scores of 49–57). However, because of the resulting large difference in sample size betweenthese groups (i.e., only 22 subjects had WRAT-3 Reading raw scores <49), this division was deemed inappropriate.Splitting WRAT-3 Reading raw scores at 52 instead (comparing scores of 39–51 to scores of 52–57) also resulted insignificant differences for the Mendez, Cahn quantitative, and Cahn global scores, but not for the Freund or for Cahnqualitative scores. The sample size was more evenly distributed between these two groups (WRAT-3 Reading rawscores <52: n = 67; ≥52: n = 138). Furthermore, in a 2 × 2 ANOVA of CDT scores by the age split at 75 years andWRAT-3 Reading raw scores split at 52, both age and WRAT-3 Reading raw scores were significant factors in everymodel except WRAT-3 Reading raw score in the Cahn qualitative model, which had not been significant before. Therewere no statistically significant interaction effects between age and WRAT-3 Reading raw score in any of the modelsat the WRAT-3 Reading split at 52.
2.8. Presentation of norms
Based on the above iterative processes, we present the following means and standard deviations for the CDT scores:unadjusted scores split by age (55–74 and 75–98) for every CDT scoring system (Table 9); scores split by age andWRAT-3 Reading raw score (<52 and ≥52) for every system (Table 10); and Cahn (quantitative, qualitative, and global)scores split by age, education, and race (Table 11). Appendix B presents the standardized (t- and z-) scores for the rawscores on every CDT scoring system using these demographic groupings.
2.9. Center score analysis
Among the 207 normative subjects, every clock in both the Command and Copy conditions featured a center. Inthe Command condition, 19 (9.2%) of the clocks had centers that were displaced horizontally more than 5 mm. Eleven(5.3%) were displaced vertically; 9 of which (81.8%) were shifted more than 7 mm above the center, and 2 (18.2%)more than 5 mm below the center. Only four clocks (1.9%) had both horizontal and vertical displacement. In the Copycondition, 12 centers (5.8%) were horizontally displaced, and 10 (4.8%) were vertically displaced; of these, two clocks(1.0%) were both horizontally and vertically displaced. The vertical displacement was primarily below center in theCopy condition (6 out of 10, or 60% of those vertically displaced); only four centers were shifted up more than 7 mm.

E.J. Hubbard et al. / Archives of Clinical Neuropsychology 23 (2008) 295–327 307
Table 9Norms by age split at 75 years, unadjusted
Age at visit (years)
55–74a 75–98b
Mean Std. Dev. Range Mean Std. Dev. Range
CommandFreund 5.2 0.8 2–7 4.8 0.8 3–7Mendez 18.1 1.1 15–20 17.7 1.1 13–20
CahnQuantitative 8.8 0.9 5–10 8.3 1.2 3–10Qualitative 1.6 0.8 0–5 2.0 0.7 0–4Global 7.2 1.4 2–10 6.3 1.6 −1 to 9
CopyFreund 5.1 0.6 3–7 4.9 0.8 2–6Mendez 18.0 1.0 15–20 17.8 0.9 15–20Cahn
Quantitative 8.8 0.7 5–10 8.5 1.0 4–10Qualitative 1.9 0.7 0–4 2.0 0.8 1–4Global 6.9 1.2 1–10 6.5 1.4 0–9
a Age 55–74: Command condition, n = 135; Copy condition, n = 134.b Age 75+: n = 72, both conditions.
There were no significant correlations between age, WRAT-3 Reading raw score, or years of education and qualitativecenter scores. Mann–Whitney U-tests indicated no significant differences in quantitative or qualitative center scoresbetween the normative subgroups, with one exception. In the Copy condition, the proportion of subjects who verticallydisplaced the center of the clock was significantly greater among those with a WRAT-3 Reading score <52 comparedto those with a WRAT-3 Reading ≥52 (Table 12).
Table 10Norms: age split at 75 × WRAT-3 raw score
Age 55–74 Age 75–98
WRAT-3 Reading Raw Score WRAT-3 Reading Raw Score
39–51 (n = 48) 52–57 (n = 87)a 39–51 (n = 19) 52–57 (n = 51)
Mean S.D. Mean S.D. Mean S.D. Mean S.D.
CommandFreund 5.0 1.0 5.2 0.7 4.6 1.0 4.9 0.8Mendez 17.8 1.1 18.3 1.0 17.2 1.5 17.9 0.8
CahnQuantitative 8.6 1.1 8.9 0.8 7.8 1.7 8.5 0.9Qualitative 1.7 0.9 1.5 0.8 2.2 1.1 2.0 0.5Global 6.9 1.6 7.5 1.2 5.6 2.5 6.5 1.1
CopyFreund 5.1 0.6 5.1 0.6 4.7 1.1 5.0 0.6Mendez 17.9 0.9 18.0 1.0 17.7 1.1 17.8 0.8
CahnQuantitative 8.7 0.9 8.8 0.6 8.3 1.5 8.6 0.7Qualitative 1.9 0.7 1.9 0.7 2.2 0.9 2.0 0.7Global 6.7 1.4 7.0 1.1 6.2 2.0 6.7 1.1
a n = 86 for Copy condition.

308 E.J. Hubbard et al. / Archives of Clinical Neuropsychology 23 (2008) 295–327
Table 11Cahn scores split by age, education, and race
Age <75 vs. 75+
55–74 75–98
Education Levela Education Levela
Low (n = 22) High (n = 90)b Low (n = 21) High (n = 4))
Mean S.D. Mean S.D. Mean S.D. Mean S.D.
Race = WhiteCommand condition
Quantitative 8.9 0.6 8.8 1.0 8.1 1.1 8.5 1.1Qualitative 1.5 0.6 1.5 0.8 2.0 0.5 2.0 0.7Global 7.4 0.8 7.3 1.4 6.2 1.4 6.5 1.5
Copy conditionQuantitative 8.7 0.6 8.8 0.7 8.8 0.5 8.5 1.1Qualitative 1.9 0.6 1.8 0.7 2.0 0.8 2.0 0.8Global 6.8 0.9 7.0 1.3 6.8 1.0 6.5 1.5
Age <75 vs. 75+
55–74 75–98
Education Levela Education Levela
Low (n = 10) High (n = 12) Low (n = 5) High (n = 4)
Mean S.D. Mean S.D. Mean S.D. Mean S.D.
Race = African AmericanCommand condition
Quantitative 8.3 1.1 8.8 1.0 7.2 1.5 8.8 1.3Qualitative 2.2 1.3 1.8 0.9 2.8 0.8 1.8 1.0Global 6.1 1.9 7.1 1. 6 4.4 2.2 7.0 1.8
Copy conditionQuantitative 8.6 1.0 8.7 0.8 8.6 0.6 8.5 0.6Qualitative 2.1 0.6 2.2 0.8 2.6 0.6 2.0 0.0Global 6.7 1.0 6.9 1.3 6.7 1.0 6.5 1.4
a “Low Education” = no college degree; “High Education” = college degree or higher.b n = 89 for Copy condition.
3. Discussion
This paper presents normative data from a sample of 207 cognitively normal elderly aged 55–98 using threepreviously published CDT scoring systems. The three systems generally correlate well with each other, have high inter-rater reliability, and require only about a minute each to complete. However, in this sample of cognitively healthy elderlyvolunteers who underwent extensive evaluative and diagnostic procedures, previously published recommendations forwhat constitutes “normal performance” for all three systems were too narrow in range and overly strict, even in spiteof the relatively high level of education in this sample.
3.1. Features of the scoring systems
3.1.1. Inter-rater reliabilityThe Mendez system showed the highest inter-rater reliability on both the Command and Copy conditions, though
all of the systems were near-perfect with the exception of the Cahn qualitative scale. The Mendez was the most reliablescale, likely because of its very explicit scoring criteria, while the Cahn qualitative scale was the least reliable, likely

E.J.H
ubbardetal./A
rchivesofC
linicalNeuropsychology
23(2008)
295–327309
Table 12Differences in vertical center displacement between WRAT-3 raw score groups, Copy condition
Center vertically displaced? Qualitative vertical center score Test statisticsa
WRAT-3 raw score WRAT-3 raw score Verticaldisplacement
Qualitativevertical score
39–51 52–57 39–51 52–57
Freq. % Freq. % Freq. % Freq. %
Yes 7 10.4 3 2.2 Shifted up 1 1.4 3 2.2 Mann–Whitney U-test 4210.50 4219.50No 60 89.6 134 97.8 Shifted down 6 9.0 0 0.0 Wilcoxon W 6488.50 6497.50Total 67 100.0 137 100.0 No displacement 60 89.6 134 97.8 Z −2.56 −2.50
Total 67 100.0 137 100.0 Asymp. Sig. (two-tailed) 0.010 0.012
a Grouping variable: WRAT-3 raw split at 5.

310 E.J. Hubbard et al. / Archives of Clinical Neuropsychology 23 (2008) 295–327
because of its subjective nature. Regardless, our findings suggest that all three of these systems can be used consistentlyacross different raters with adequate (and brief) training.
3.1.2. Time to scoreEach system took less than 1 min to implement; however, the Freund system remained the quickest even after
practice (mean of 42 s per clock). The brevity of scoring suggests that any of these systems could be implemented inclinical practice without excessive burden, and that the clinician would benefit from using a scoring system rather thanrelying solely on clinical judgment.
3.1.3. Correlations between CDT scoresThe three systems are moderately to highly correlated, with the strongest correlation observed between the Mendez
and Freund systems. This latter finding is likely due to the scales’ overlap in evaluating similar aspects of clock drawing.
3.2. CDT scores
3.2.1. Overall CDT scoresMedian CDT scores among our sample were within the normal ranges estimated by the systems’ authors. However,
there was variation in performance using each CDT scoring system, which would lead many of our normal subjectsto be misclassified as cognitively impaired using previously published cutoffs. Our findings suggest that the rangeof “normal” performance is much greater than previously reported using smaller sample sizes and comparing clockdrawing abilities between diagnostic groups (Cahn et al., 1996; Freund et al., 2005; Mendez et al., 1992).
3.2.2. Impact of demographic and testing variablesWe found no difference in MMSE, WRAT-3 Reading, or any CDT scores between the CTL and CTL-C subgroups.
However, CTL-Cs were, on average, older and had higher GDS scores than the CTLs. This finding is consistentwith previous research documenting an association between increased memory complaints and depression even in theabsence of objective cognitive decline (Derouesne et al., 1999; Grut et al., 1993; Spitznagel & Tremont, 2005).
CDT performance was significantly worse among older subjects for all three scoring systems. This finding was bestcaptured using a cutoff age of 75 years (i.e., <75 vs. ≥75), a result consistent with other studies reporting the naturaldeterioration of clock drawing ability among healthy adults with increasing age (Freedman et al., 1994; Kozora &Munro, 1994; Paganini-Hill, Clark, Henderson, & Birge, 2001; Spreen & Strauss, 1998).
Education level was not significantly related to CDT scores using the Freund or Mendez systems, but did relate toscores using the Cahn system. Likewise, racial differences appeared correlated with clock drawing performance basedon the Cahn system, with Whites performing better and committing fewer qualitative errors than African Americans.However, the WRAT-3 Reading test, a marker of education quality (Manly, Jacobs, Touradji, Small, & Stern, 2002),attenuated any educational and racial differences in CDT scores. Thus, WRAT-3 Reading explained differences inCDT scores more effectively than did racial and educational differences combined. These results are consistent withManly et al.’s (Manly, Byrd, Touradji, & Stern, 2004) finding that quality of education, as operationalized by WRAT-3Reading scores, is an important predictor of cognitive performances among African Americans.
Previous studies have found few, if any, differences in CDT scores across racial and ethnic categories (cf. La Rue,Romero, Ortiz, Liang, & Lindeman, 1999; Marcopulos & McLain, 2003). Instead, educational differences appear tohave a greater effect on clock drawing (Marcopulos & McLain, 2003). As noted, however, norms based on years ofeducation may not adequately reflect differences in the quality of education received across racial groups, and racialdifferences in cognitive performances may be observed even when education level is considered (Howieson, Loring,& Hannay, 2004; La Rue et al., 1999; Manly et al., 2002, 2004). Manly and her co-workers (Manly, 2006; Manly &Echemendia, 2007) further argue that presenting race-specific norms can be problematic because it may discourageconsideration of other underlying factors for which race is merely a proxy (e.g., socioeconomic status differences).Thus, although we present norms separated by race and education, we recommend the use of the tables based onWRAT-3 Reading raw scores if possible, as this measure better accounts for CDT performance differences than doracial or educational differences. Because the WRAT-3 is not routinely administered in many clinical settings and isunlikely to be used as part of a quick CDT screening, norms based on education and race may be the most appropriateway to evaluate CDT performance if the Cahn system is used.

E.J. Hubbard et al. / Archives of Clinical Neuropsychology 23 (2008) 295–327 311
Fig. 1. Examples of qualitative differences detected by each scoring system. a. Received a low score (4) on Freund due to spacing and correctionmarkings (rater considered this “intrusive marks”), but a “normal” score on the Mendez (18) and Cahn global (9) scales. b. Received a perfect scoreon the Mendez scale (20) but missed points on Freund (6) and Cahn global (8) due to spacing errors. c. Received a “normal” score on Freund (5)and Mendez (18), but a poor score on Cahn (5) because of clock face distortion and spacing errors. d. Received a “normal” score on Freund (5) andMendez (19), but a low score on Cahn (4) due to spacing and incorrect hand placement.
Ultimately, no regression model was able to account for more than 10.1% of the total variance in CDT scores,suggesting that, overall, CDT performance is not dramatically affected by these demographic variables. While thereare significant differences in scores between the normative subgroups presented here, the absolute differences betweenthe groups are not substantial.
3.3. Qualitative features of clock drawing
A comparison of the qualitative features of the Command condition clocks that received very different scores acrossthe three systems revealed some particular differences between the scoring systems (Fig. 1). The Freund scale quantifieserrors in the spacing of numbers relative to each other and to the edge of the clock face and is most affected by thepresence of tics or other intrusive marks on the clock. The Freund scale does not, however, detect whether the time iscorrectly indicated (i.e., if the long and short hands are switched, but the hands still point to both the “2” and “11”, theclock may still receive a perfect score).
The Cahn system assesses spatial errors as part of the quantitative score and in two particular questions on thequalitative scale. One question regards specific planning deficits (i.e., unnecessarily large gaps before the 12, 3, 6 or9 on the clock), a feature not measured separately from other spacing errors on the other two scoring systems. Cahnis the only system of the three that explicitly requires the hands to be correctly set to 11:10. It is also the only systemthat evaluates the overall shape of the clock face, as the Mendez system only requires that there be a “closure figure”present, and the Freund system assumes that there is a clock circle but does not evaluate features of the circle itself.Finally, although all three systems measure whether the numbers are placed within the clock circle, this is a somewhatmore significant error in the Cahn system because a subject loses points from both the quantitative and qualitativesubscales if the numbers are outside of the circle.
Like Freund, the Mendez system does not require that the hands be correctly set as long as there are two handsof unequal length that point to the “2” and the “11”. Unlike Freund and Cahn, the Mendez scale only detects majorspacing errors (“most symbols are distributed as a circle without major gaps”) instead of the finer aspects of numberplacement (Freund requires that the numbers be “spaced equally or nearly equally from each other” as well as fromthe edge of the circle, and Cahn begins subtracting points if there is anything beyond “minimal error in the spatialarrangement”). Because of this feature, many “normal” clocks receive lower scores using Cahn or Freund than theywould using Mendez due to minor spacing errors.
Only one subject obtained a perfect score across all three scoring systems (Fig. 2). Using the scoring cutoffsestablished by the systems’ authors, 36 of our cognitively normal subjects’ clocks would be considered abnormal usingthe Freund scale, 58 using Mendez, and 66 using Cahn. The NHTSA, which makes recommendations about drivingbased on an older eight-point version of Freund’s scale, recommends that a driving intervention is necessary if a subjectdemonstrates “any incorrect element” on the Freund system. Assuming the NHTSA would make the same statementregarding the seven-point Freund scale, only 7 of our 207 cognitively healthy study participants would not be referredfor a driving intervention.
There were some consistent features among the clocks drawn by this normative sample. Because the Mendez scalemeasures 20 specific aspects of clock drawings, trends in these features can be used to generalize about normative
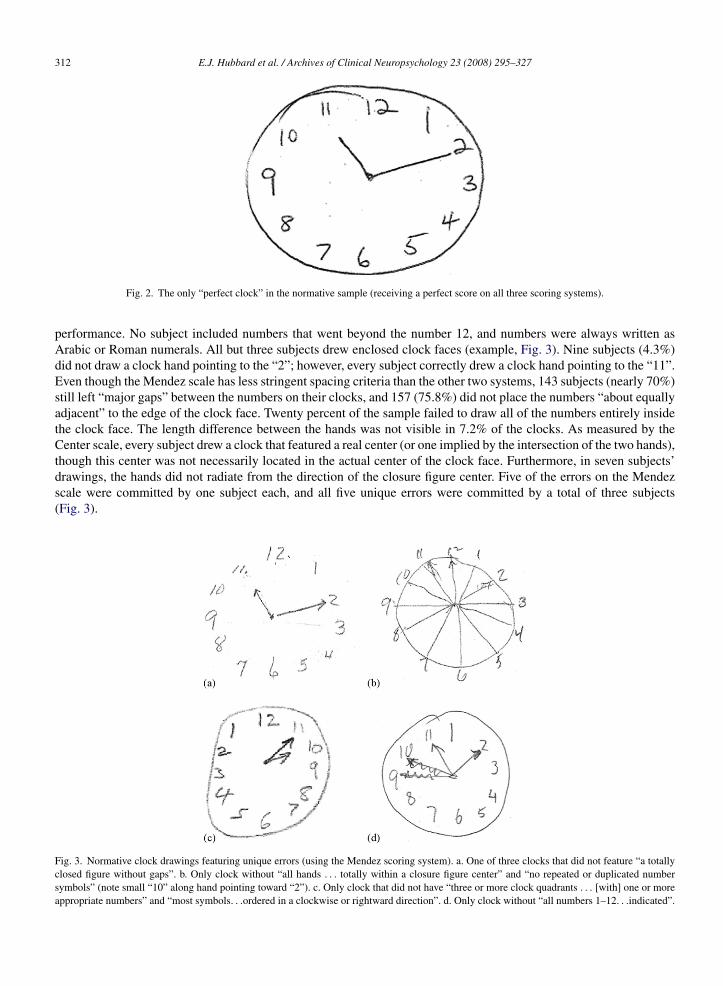
312 E.J. Hubbard et al. / Archives of Clinical Neuropsychology 23 (2008) 295–327
Fig. 2. The only “perfect clock” in the normative sample (receiving a perfect score on all three scoring systems).
performance. No subject included numbers that went beyond the number 12, and numbers were always written asArabic or Roman numerals. All but three subjects drew enclosed clock faces (example, Fig. 3). Nine subjects (4.3%)did not draw a clock hand pointing to the “2”; however, every subject correctly drew a clock hand pointing to the “11”.Even though the Mendez scale has less stringent spacing criteria than the other two systems, 143 subjects (nearly 70%)still left “major gaps” between the numbers on their clocks, and 157 (75.8%) did not place the numbers “about equallyadjacent” to the edge of the clock face. Twenty percent of the sample failed to draw all of the numbers entirely insidethe clock face. The length difference between the hands was not visible in 7.2% of the clocks. As measured by theCenter scale, every subject drew a clock that featured a real center (or one implied by the intersection of the two hands),though this center was not necessarily located in the actual center of the clock face. Furthermore, in seven subjects’drawings, the hands did not radiate from the direction of the closure figure center. Five of the errors on the Mendezscale were committed by one subject each, and all five unique errors were committed by a total of three subjects(Fig. 3).
Fig. 3. Normative clock drawings featuring unique errors (using the Mendez scoring system). a. One of three clocks that did not feature “a totallyclosed figure without gaps”. b. Only clock without “all hands . . . totally within a closure figure center” and “no repeated or duplicated numbersymbols” (note small “10” along hand pointing toward “2”). c. Only clock that did not have “three or more clock quadrants . . . [with] one or moreappropriate numbers” and “most symbols. . .ordered in a clockwise or rightward direction”. d. Only clock without “all numbers 1–12. . .indicated”.

E.J. Hubbard et al. / Archives of Clinical Neuropsychology 23 (2008) 295–327 313
3.4. Center scoring criteria
Most healthy elderly subjects drew a center that was within Freedman et al.’s (1994) normative range, with 5.8–9.2%of subjects displacing the center more than 5 mm to the left or right, and 4.8–5.3% drawing the center more than 5 mmbelow or 7 mm above the actual center of the clock face. However, these scoring criteria only provided an absolutemeasurement of displacement, rather than a measure proportional to the size of the clock face itself. That is, a 5–7 mmdisplacement allows a much smaller margin of error for a subject who draws a clock that is 13 cm in diameter than for asubject who draws a 5 cm-diameter clock. Freedman et al. used these displacement indices to evaluate a condition wherean 11.7-cm diameter circle was pre-drawn for the test subjects. Though it is important to note that some horizontaland vertical center displacement was present among healthy elderly subjects in the present study, a more accuratemeasurement of the center displacement could have been made if it were based on distances proportional to the size ofthe clock face. In terms of the CDT’s clinical utility, however, the calculation of a proportional measurement is likelyto add significantly to the time required to complete scoring and may be impractical. Of note here is that no healthyelderly subject drew a clock without a central intersection of the hands or a central mark.
3.5. CDT scoring systems: selection for clinical use
The choice of a scoring system ultimately depends on the specific needs and goals of the clinician or researcher.For example, a person interested in obtaining detailed information about many specific qualitative aspects of clockdrawing might use the Mendez system. For a quick CDT screen that is highly sensitive to spatial errors without muchqualitative detail, the Freund system might be the preferred choice. The most thorough information about some ofthe most essential aspects of clock drawing, such as correct hand positioning and the clock’s gestalt, is probably bestobtained using the three-part Cahn scale. Ultimately, all three systems have high inter-rater reliability and correlate wellwith each other; thus, the final decision about which system to choose will likely depend on the consumer’s preferencesabout detail and time.
3.6. Limitations and further research
3.6.1. EducationA limitation of this study is the fact that our sample was highly educated compared to the general older adult U.S.
population, and therefore we were unable to evaluate the effect of a wide range of educational experiences on CDTperformance. Several studies examining the effect of education on clock scores suggest the presence of a “ceilingeffect”; that is, healthy elderly obtain very high scores regardless of their education level, so little to no educationeffects are observed (Lam et al., 1998; Ratcliff, Dodge, Birzescu, & Ganguli, 2003; Shulman, 2000). Because of theproposed ceiling effect, additional normative data including healthy subjects with fewer years of education may notproduce vastly different results than those presented here, where education appeared to have a minor, if any, influenceon CDT performance. However, this issue appears unresolved and merits further investigation.
3.6.2. Longitudinal versus cross-sectional dataBecause this was a cross-sectional study, it is possible that there were cohort differences (e.g., education, culture)
between the older and younger subjects which led to differences in CDT performance (Howieson et al., 2004). Therefore,our results should not be interpreted as determining the effect of aging on CDT performance. On the other hand, ina longitudinal community study of initially non-demented adults aged 65 and older, Ratcliff et al. (2003) found that46.6% of participants’ CDT ability declined over a 10-year period. Longitudinal analysis of CDT productions by acognitively normal aging sample would be required to evaluate whether the observed decline in clock drawing abilitywith age is applicable to the individual level.
3.6.3. Addenda to published scoring systemsThe high inter-rater reliability seen in the present study is likely due in part to the “Supplemental Scoring Criteria”
which were used in conjunction with the published scoring systems. Thus, the intraclass correlations reported here arelikely to be higher than if only the original scoring criteria had been employed. We therefore encourage the use of themore specific scoring criteria to improve consistency across different raters in clinical and research settings.

314 E.J. Hubbard et al. / Archives of Clinical Neuropsychology 23 (2008) 295–327
4. Conclusion
Clearly, most healthy elderly subjects cannot draw clocks that would be considered “perfect” using any of thescoring systems evaluated in this study. Although there may be some generalizations about what can be considered anormal clock based on these data, it is important to note that if a subject’s clock shows an error or feature not seenamong this cohort, it does not necessarily mean that the person is impaired. Likewise, if a clock drawing falls into therange of “normal” performance, this does not necessarily implicate that the subject is cognitively normal.
The goals of this study were to provide normative data for cognitively healthy elderly subjects using several publishedCDT scoring systems, accounting for meaningful demographic and test variables, and to evaluate the clinical utilityof three common CDT scoring systems. This is the first presentation of such information based solely on cognitivelynormal elderly volunteers. Knowledge about what to expect from an unimpaired elderly individual is critical becausethe failure to account for variations in normal performance has serious consequences for healthy elderly who present forcognitive evaluation. Therefore, these results have implications for screening and diagnostic practices as well as clinicalresearch outcomes. For example, current standards for CDT performance using the Freund scale might lead to 97%of our normative sample being referred for an on-road driving evaluation (Wang et al., 2003). Such recommendationsmust consider normal performance, especially if they lead to consequences that unnecessarily limit independence ineveryday activities.
Although CDT performance is generally high among cognitively healthy elderly volunteers, some variation indrawing abilities, affected by variables such as age and quality of education, will be observed and should not be assumedto be abnormal. Continued research comparing well-characterized samples of cognitively healthy participants and thosesuffering from various degrees of cognitive decline and other disorders may further elucidate whether particular featuresof clock drawing are characteristic of cognitive impairment.
Acknowledgements
This work was supported by NIH Grants P30-AG13846 (Boston University Alzheimer’s Disease Core Center),M01-RR00533 (Boston University General Clinical Research Center), R03-AG026610 (ALJ), R03-AG027480 (ALJ),K12-HD043444 (ALJ), and K23-AG030962 (ALJ), K24 AG27841 (RCG).
Appendix A. Compiled CDT scoring sheets used for data collection
Scoring criteria for Freund et al. (2005) quantitative scaleA. Instructions: score out of seven points, even if no numbers are present
Element Criteria Score
Command Copy
1. Time (maximum: three points) One hand points to “2” (or symbol representative of 2) 0 1 0 1Exactly two hands 0 1 0 1Absence of intrusive marks, e.g., writing or hands indicating incorrecttime, hand points to number 10; tic marks, time written in text (11:10;10 after 11)
0 1 0 1
Sum of time elements /3 /3
2. Numbers (maximum: two points) Numbers are inside the clock circle (may touch perimeter, but may notextend outside of circle)
0 1 0 1
All numbers 1–12 are present, no duplicates or omissions 0 1 0 1Sum of number elements /2 /2
3. Spacing (maximum: two points) Numbers spaced equally or nearly equally from each other 0 1 0 1Numbers spaced equally or nearly equally from the edge of the circle 0 1 0 1
Sum of spacing elements /2 /2
B. Clock Drawing Command and Copy Score Table

E.J. Hubbard et al. / Archives of Clinical Neuropsychology 23 (2008) 295–327 315
Element Command Copy
1. Time 0 1 2 3 0 1 2 32. Numbers 0 1 2 0 1 23. Spacing 0 1 2 0 1 2
Total /7 /7
.
Scoring Criteria for Clock Drawing Interpretation Scale (Mendez et al., 1992)A. Clock Drawing Command and Copy Score Table (score “1” per element present)
Element Command Copy
1. There is an attempt to indicate a time in any way 0 1 0 12. All marks or items can be classified as either part of a
closure figure, a hand, or a symbol for the clocknumbers
0 1 0 1
3. There is a totally closed figure (closure figure); nogap is greater than 0.25 in.
0 1 0 1
Score only if symbols for clock numbers are present4. A “2” is present and is pointed out in some way for
the time0 1 0 1
5. Most symbols are distributed as a circle withoutmajor gaps: Score “0” if more than one number is notplaced in a circular fashion; Score “0” if a “majorgap” is twice the size of the smallest gap separatingtwo consecutive numbers
0 1 0 1
6. Three or more clock quadrants have one or moreappropriate numbers: 12–3, 3–6, 6–9, 9–12 perrespective clockwise quadrant
0 1 0 1
7. Most symbols are ordered in a clockwise or rightwarddirection
0 1 0 1
8. All symbols are totally within a closure figure (maynot touch the perimeter of the circle)
0 1 0 1
9. An “11” is present and is pointed out in some way fora time
0 1 0 1
10. All numbers 1–12 are indicated 0 1 0 111. There are no repeated or duplicated number symbols 0 1 0 112. There are no substitutions for Arabic or Roman
numerals0 1 0 1
13. The numbers do not go beyond the number 12 0 1 0 114. All symbols lie about equally adjacent to a closure
figure edge0 1 0 1
15. Seven or more of the same symbol type are orderedsequentially
0 1 0 1
Score only if one or more hands are present16. All hands radiate from the direction of a closure
figure center, or from a point that is approximately inthe middle of the clock face
0 1 0 1
17. One hand is visibly longer than another hand (do notuse ruler to determine)
0 1 0 1
18. There are exactly two distinct and separable hands 0 1 0 119. All hands are totally within a closure figure 0 1 0 120. There is an attempt to indicate a time with one or
more hands0 1 0 1
Total / /
.
Scoring criteria for Cahn et al.’s (1996) quantitative scale

316 E.J. Hubbard et al. / Archives of Clinical Neuropsychology 23 (2008) 295–327
Element Criteria Score
Command Copy
1. Integrity of the clock face(maximum: two points)
Present without gross distortion 2 2Incomplete or some distortion 1 1Absent or totally inappropriate 0 0
Note: clock face is considered distorted if “smashed” horizontally or vertically, or if face is extremely slanted
2. Presence and sequencing ofnumbers (maximum: four points)
All present in the right order and at most minimal error in thespatial arrangement (only one number is displaced, or only onevery large or very small gap between numbers)
4 4
All present but errors in spatial arrangement 3 3Numbers missing or added but no gross distortions of theremaining numbers; OR numbers placed in counterclockwisedirection; OR all numbers present but gross distortion in spatiallayout (i.e., hemineglect, numbers outside of the clock)
2 2
Missing or added numbers and gross spatial distortions 1 1Absence or poor representation of numbers 0 0
3. Presence and placement of thehands (maximum: four points)
Hands are in the correct position and the size difference is respected 4 4Slight errors in the placement of the hands or no representation ofthe size difference between the hands
3 3
Major errors in the placement of the hands (significantly out ofcourse including 10–11)
2 2
Only one hand or poor representation of two hands 1 1No hands or perseveration on hands 0 0
B. Clock Drawing Command and Copy Score Table
Element Command Copy
1. Integrity of the clock face 0 1 2 0 1 22. Presence and sequencing of numbers 0 1 2 3 4 0 1 2 3 43. Presence and placement of the hands 0 1 2 3 4 0 1 2 3 4
Total /10 /10
Scoring Criteria for Cahn et al.’s (1996) qualitative error scaleInstructions: If no numbers present: score out of eight points; give no errors for error types regarding numbers
Error type Criteria Error present
Command Copy
1. Stimulus bound response The tendency of the drawing to be dominated or guided by a singlestimulus. There may be three types of stimulus bound errors: (a) thehands may be set for 10–11 instead of 10 after 11; (b) time is writtenbeside the 11 or between 10 and 11 on clock; and (c) the hands are absentor are pointed toward “10” and/or “11”. This type of error is alsoconsidered to be a conceptual error
0 1 0 1
2. Conceptual deficit This error type reflects a loss or deficit in accessing knowledge of theattributes, features, and meaning of a clock. Included in this category aremisrepresentation the clock itself (a clockface without numbers orinappropriate use of numbers) and misrepresentation of the time on theclock (the hands are either absent or inadequately represented or the timeis written on the clock)
0 1 0 1
3. Perseveration The continuation or the recurrence of activity without an appropriatestimulus. In clock drawing, this error is seen in the presence of more thantwo hands and abnormal prolongation of numbers (writing beyond “12”)
0 1 0 1
4. Neglect of left hemispace All attributes of the clock are written on the right half of the clockface.Possible neglect of the right hemispace was also evaluated but this typeof error was never observed
0 1 0 1

E.J. Hubbard et al. / Archives of Clinical Neuropsychology 23 (2008) 295–327 317
Error type Criteria Error present
Command Copy
5. Planning deficit This error type is represented by gaps before the 12, 3, 6, or 9 dependingon the strategy used in drawing
0 1 0 1
6. Nonspecific spatial error A deficit in the spatial layout of numbers, without any specific pattern inspatial disorganization
0 1 0 1
7. Numbers written on outside of clock Numbers written either around the perimeter of the circle or on the circleitself (including touching the perimeter)
0 1 0 1
8. Numbers written counterclockwise Arrangement of numbers with the “12” at the top of the clockface andthen continuing around in a counterclockwise fashion
0 1 0 1
Total: (score “1” per error type present) /8 /8
Scoring Criteria for Cahn et al.’s (1996) global Clock Drawing Test (CDT) ScaleA. Instructions: this score takes into account not only the presence and correctness of the features of the clock,
but also the number of error types made and strategies used in the construction of the clock. Score is determined bysubtracting the Cahn qualitative error score from the Cahn quantitative Score. Maximum score is 10; minimum scoreis −8
B. Global Clock Drawing Score Table
Center scoring criteria (Freedman et al., 1994)
Criteria Element present
Command Copy
Clock has a center (drawn or inferred/extrapolated at the point where twohands meet)
0 1 0 1
No horizontal displacement: center is displaced from the vertical axis within5.0 mm (3/16 in) to the right or left of the axis
0 1 0 1
No vertical displacement: center is displaced from the horizontal axis within5.0 mm (3/16 in) below or 7.0 mm (5/16 in) above the axis
0 1 0 1
Total /3 /3
Qualitative vertical displacement
Command CopyShifted up Shifted upShifted down Shifted downNo displacement No displacementNo center No center
.

318 E.J. Hubbard et al. / Archives of Clinical Neuropsychology 23 (2008) 295–327
Appendix B. t- and z-scores
z-Scores and t-scores by age group: Freund system
Command condition total Copy condition total
Age 55–74 Age 75+ Age 55–74 Age 75+
Score z-Score t-Score Score z-Score t-Score Score z-Score t-Score Score z-Score t-Score
0–1 −5.12 −1.25 – – – – – – – – –2 −3.89 11.06 0–2 −3.45 15.54 – – – 0–2 −3.85 11.483 −2.66 23.37 3 −2.23 27.70 0–3 −3.70 12.99 3 −2.52 24.754 −1.43 35.68 4 −1.01 39.86 4 −1.92 30.77 4 −1.20 38.025 −0.20 47.99 5 0.20 52.03 5 −0.15 48.54 5 0.13 51.296 1.03 60.30 6 1.42 64.19 6 1.63 66.32 6 1.46 64.567 2.26 72.62 7 2.64 76.35 7 3.41 84.09 7 2.78 77.83
Source: Freund et al. (2005).
z-Scores and t-scores by age group: Mendez system
Command condition total Copy condition total
Age 55–74 Age 75+ Age 55–74 Age 75+
Score z-Score t-Score Score z-Score t-Score Score z-Score t-Score Score z-Score t-Score
0–13 −4.89 1.09 0–13 −4.39 6.12 – – – – – –14 −3.94 10.62 14 −3.45 15.47 0–14 −4.01 9.86 0–14 −4.27 7.2615 −2.99 20.15 15 −2.52 24.82 15 −3.00 20.03 15 −3.15 18.5316 −2.03 29.67 16 −1.58 34.16 16 −1.98 30.19 16 −2.02 29.8017 −1.08 39.20 17 −0.65 43.51 17 −0.96 40.36 17 −0.89 41.0818 −0.13 48.73 18 0.29 52.86 18 0.05 50.53 18 0.23 52.3519 0.83 58.26 19 1.22 62.20 19 1.07 60.70 19 1.36 63.6220 1.78 67.79 20 2.15 71.55 20 2.09 70.87 20 2.49 74.89
Source: Mendez et al. (1992).
z-Scores and t-scores by age group: Cahn quantitative and qualitativea scales
Command condition Copy Condition
Age 55–74 Age 75+ Age 55–74 Age 75+
Quantitativescale total
z-Score t-Score Quantitativescale total
z-Score t-Score Quantitativescale total
z-Score t-Score Quantitativescale total
z-Score t-Score
– – – 0–3 −4.53 4.67 – – – – – –– – – 4 −3.68 13.22 – – – 0–4 −4.72 2.850–5 −4.05 9.45 5 −2.82 21.76 0–5 −5.13 −1.28 5 −3.68 13.236 −2.98 20.16 6 −1.97 30.30 6 −3.77 12.33 6 −2.64 23.617 −1.91 30.88 7 −1.12 38.85 7 −2.41 25.93 7 −1.60 33.998 −0.84 41.59 8 −0.26 47.39 8 −1.05 39.54 8 −0.56 44.389 0.23 52.30 9 0.59 55.93 9 0.31 53.15 9 0.48 54.76
10 1.30 63.01 10 1.45 64.48 10 1.68 66.76 10 1.51 65.14
Qualitativescale total
z-Score t-Score Qualitativescale total
z-Score t-Score Qualitativescale total
z-Score t-Score Qualitativescale total
z-Score t-Score
0 1.87 68.74 0 3.02 80.23 0 2.65 76.54 0 2.70 77.031 0.66 56.64 1 1.53 65.32 1 1.25 62.48 1 1.37 63.702 −0.55 44.53 2 0.04 50.41 2 −0.16 48.43 2 0.04 50.373 −1.76 32.42 3 −1.45 35.51 3 −1.56 34.37 3 −1.30 37.044 −2.97 20.32 4 −2.94 20.60 4 −2.97 20.32 4 −2.63 23.715–8 −4.18 8.21 5–8 −4.43 5.69 5–8 −4.37 6.26 5–8 −3.96 10.37

E.J. Hubbard et al. / Archives of Clinical Neuropsychology 23 (2008) 295–327 319
z-Scores and t-scores by age group: Cahn global scale
Cahn scales: Command condition Cahn scales: Copy condition
Age 55–74 Age 75+ Age 55–74 Age 75+
Global score z-Score t-Score Global score z-Score t-Score Global score z-Score t-Score Global score z-Score t-Score
– – – −8 to (−1) −4.57 4.35 – – – – – –– – – 0 −3.94 10.62 − – – −8 to 0 −4.83 1.75−8 to 1 −4.44 5.60 1 −3.31 16.89 −8 to 1 −4.85 1.48 1 −4.09 9.142 −3.73 12.72 2 −2.68 23.17 2 −4.03 9.74 2 −3.35 16.533 −3.02 19.84 3 −2.06 29.44 3 −3.20 18.00 3 −2.61 23.924 −2.30 26.96 4 −1.43 35.71 4 −2.37 26.26 4 −1.87 31.325 −1.59 34.07 5 −0.80 41.98 5 −1.55 34.52 5 −1.13 38.716 −0.88 41.19 6 −0.17 48.26 6 −0.72 42.79 6 −0.39 46.107 −0.17 48.31 7 0.45 54.53 7 0.10 51.05 7 0.35 53.498 0.54 55.43 8 1.08 60.80 8 0.93 59.31 8 1.09 60.889 1.26 62.55 9 1.71 67.08 9 1.76 67.57 9 1.83 68.2710 1.97 69.67 10 2.33 73.35 10 2.58 75.83 10 2.57 75.67
Source: Cahn et al. (1996).a Note: a high score on the quantitative scale is indicative of good performance, and a low score of poor performance. A high score on the
qualitative scale indicates poor performance, while a low score indicates good performance. For the global score, which is the difference betweenthe quantitative and qualitative scales, a high score indicates good performance and a low score indicates poor performance.
t- and z-scores by age and WRAT-3 raw score, Freund Scale
Command condition
Age 55–74 Age 75+
WRAT-3 raw score = 39–51 WRAT-3 raw score = 52–57 WRAT-3 raw score = 39–51 WRAT-3 raw score = 52–57
Score z-Score t-Score Score z-Score t-Score Score z-Score t-Score Score z-Score t-Score
– – – – – – 0 −4.76 2.36 – – –0–1 −4.39 6.14 – – – 1 −3.72 12.77 0–1 −5.09 −0.892 −3.30 16.99 0–2 −4.35 6.50 2 −2.68 23.17 2 −3.79 12.083 −2.22 27.85 3 −3.00 19.96 3 −1.64 33.57 3 −2.49 25.064 −1.13 38.70 4 −1.66 33.43 4 −0.60 43.98 4 −1.20 38.045 −0.05 49.55 5 −0.31 46.90 5 0.44 54.38 5 0.10 51.026 1.04 60.40 6 1.04 60.37 6 1.48 64.78 6 1.40 64.007 2.12 71.25 7 2.38 73.84 7 2.52 75.19 7 2.70 76.97
Copy condition
Age 55–4 Age 75+
WRAT-3 raw score = 39–51 WRAT-3 raw score = 52–57 WRAT-3 raw score = 39–51 WRAT-3 raw score = 52–57
Score z-Score t-Score Score z-Score t-Score Score z-Score t-Score Score z-Score t-Score
– – – – – – 0 −4.53 4.70 – – –– – – – – – 1 −3.57 14.27 – – –0–2 −5.59 −5.93 0–2 −5.39 −3.89 2 −2.62 23.83 0–2 −4.69 3.093 −3.79 12.09 3 −3.63 13.67 3 −1.66 33.39 3 −3.11 18.944 −1.99 30.11 4 −1.88 31.22 4 −0.70 42.95 4 −1.52 34.785 −0.19 48.12 5 −0.12 48.78 5 0.25 52.52 5 0.06 50.626 1.61 66.14 6 1.63 66.33 6 1.21 62.08 6 1.65 66.467 3.42 84.16 7 3.39 83.89 7 2.16 71.64 7 3.23 82.31

320 E.J. Hubbard et al. / Archives of Clinical Neuropsychology 23 (2008) 295–327
t- and z-scores by age and WRAT-3 raw score, Mendez scale
Command condition total
Age 55–74 Age 75+
WRAT-3 raw score = 39–51 WRAT-3 raw score = 52–57 WRAT-3 raw score = 39–51 WRAT-3 raw score = 52–57
Score z-Score t-Score Score z-Score t-Score Score z-Score t-Score Score z-Score t-Score
– – – – – – 0–11 −4.21 7.91 – – –– – – – – – 12 −3.53 14.74 – – –0–13 −4.31 6.87 – – – 13 −2.84 21.58 – – –
14 −3.41 15.95 0–14 −4.51 4.85 14 −2.16 28.41 0–14 −4.62 3.7915 −2.5 25.03 15 −3.48 15.25 15 −1.47 35.25 15 −3.43 15.6916 −1.59 34.11 16 −2.44 25.64 16 −0.79 42.09 16 −2.24 27.617 −0.68 43.19 17 −1.4 36.03 17 −0.11 48.92 17 −1.05 39.518 0.23 52.27 18 −0.36 46.42 18 0.58 55.76 18 0.14 51.419 1.14 61.35 19 0.68 56.81 19 1.26 62.59 19 1.33 63.320 2.04 70.43 20 1.72 67.2 20 1.94 69.43 20 2.52 75.21
Copy condition total
Age 55–74 Age 75+
WRAT-3 raw score = 39–51 WRAT-3 raw score = 52–57 WRAT-3 raw score = 39–51 WRAT-3 raw score = 52–57
Score z-Score t-Score Score z-Score t-Score Score z-Score t-Score Score z-Score t-Score
– – – 0–13 −4.93 0.69 0–13 −4.32 6.84 – – –0–14 −4.14 8.64 14 −3.94 10.57 14 −3.40 15.95 0–14 −4.61 3.90
15 −3.07 19.31 15 −2.95 20.46 15 −2.49 25.06 15 −3.40 16.0216 −2.00 29.99 16 −1.97 30.34 16 −1.58 34.18 16 −2.19 28.1417 −0.93 40.66 17 −0.98 40.23 17 −0.67 43.29 17 −0.97 40.2618 0.13 51.33 18 0.01 50.11 18 0.24 52.40 18 0.24 52.3819 1.20 62.01 19 1.00 60.00 19 1.15 61.51 19 1.45 64.5020 2.27 72.68 20 1.99 69.89 20 2.06 70.62 20 2.66 76.62
t- and z-scores by age and WRAT-3 raw score, Cahn scales
Command condition
Age 55–74 Age 75+
WRAT-3 raw score = 39–51 WRAT-3 raw score = 52–57 WRAT-3 raw score = 39–51 WRAT-3 raw score = 52–57
Quantitativescale total
z-Score t-Score Quantitativescale total
z-Score t-Score Quantitativescale total
z-Score t-Score Quantitativescale total
z-Score t-Score
– – – – – – 0–1 −4.11 8.92 – – –– – – – – – 2 −3.50 14.97 – – –– – – – – – 3 −2.90 21.02 – – –0–4 −4.14 8.62 – – – 4 −2.29 27.07 0–4 −4.95 0.455 −3.23 17.65 0–5 −4.83 1.74 5 −1.69 33.12 5 −3.85 11.546 −2.33 26.68 6 −3.59 14.13 6 −1.08 39.17 6 −2.74 22.627 −1.43 35.71 7 −2.35 26.51 7 −0.48 45.22 7 −1.63 33.708 −0.53 44.73 8 −1.11 38.90 8 0.13 51.27 8 −0.52 44.789 0.38 53.76 9 0.13 51.28 9 0.73 57.33 9 0.59 55.87
10 1.28 62.79 10 1.37 63.67 10 1.34 63.38 10 1.70 66.95

E.J. Hubbard et al. / Archives of Clinical Neuropsychology 23 (2008) 295–327 321
Qualitativescale total
z-Score t-Score Qualitativescale total
z-Score t-Score Qualitativescale total
z-Score t-Score Qualitativescale total
z-Score t-Score
0 1.94 69.36 0 1.87 68.71 0 2.02 70.21 0 4.23 92.261 0.82 58.17 1 0.58 55.79 1 1.08 60.84 1 2.09 70.922 −0.30 46.97 2 −0.71 42.87 2 0.15 51.48 2 −0.04 49.583 −1.42 35.77 3 −2.00 29.95 3 −0.79 42.11 3 −2.18 28.244 −2.54 24.57 4 −3.30 17.03 4 −1.73 32.75 4–8 −4.31 6.905 −3.66 13.37 5–8 −4.59 4.11 5 −2.66 23.39 – – –6–8 −4.78 2.17 – – – 6 −3.60 14.02 – – –– – – – – – 7–8 −4.53 4.66 – – –
Global score z-Score t-Score Global Score z-Score t-Score Global score z-Score t-Score Global score z-Score t-Score
– – – – – – −8 to (−5) −4.25 7.46 – – –– – – – – – −4 −3.85 11.46 – – –– – – – – – −3 −3.45 15.46 – – –– – – – – – −2 −3.05 19.46 – – –– – – – – – −1 −2.65 23.46 – – –−8 to 0 −4.22 7.80 – – – 0 −2.25 27.47 – – –1 −3.60 13.96 – – – 1 −1.85 31.47 – – –2 −2.99 20.11 −8 to 2 −4.44 5.60 2 −1.45 35.47 −8 to 2 −4.21 7.853 −2.37 26.27 3 −3.62 13.75 3 −1.05 39.47 3 −3.28 17.244 −1.76 32.43 4 −2.81 21.90 4 −0.65 43.47 4 −2.34 26.625 −1.14 38.58 5 −2.00 30.05 5 −0.25 47.47 5 −1.40 36.016 −0.53 44.74 6 −1.18 38.20 6 0.15 51.47 6 −0.46 45.407 0.09 50.90 7 −0.37 46.35 7 0.55 55.48 7 0.48 54.798 0.71 57.05 8 0.45 54.50 8 0.95 59.48 8 1.42 64.179 1.32 63.21 9 1.26 62.64 9 1.35 63.48 9 2.36 73.5610 1.94 69.37 10 2.08 70.79 10 1.75 67.48 10 3.29 82.95
Copy condition
Age 55–74 Age 75+
WRAT-3 raw score = 39–51 WRAT-3 raw score = 52–57 WRAT-3 raw score = 39–51 WRAT-3 raw score = 52–57
Quantitativescale total
z-Score t-Score Quantitativescale total
z-Score t-Score Quantitativescale total
z-Score t-Score Quantitativescale total
z-Score t-Score
– – – – – – 0–2 −4.34 6.59 – – –– – – – – – 3 −3.65 13.46 – – –– – – – – – 4 −2.97 20.34 – – –0–5 −4.11 8.90 – – – 5 −2.28 27.21 0–5 −4.99 0.126 −2.98 20.17 0–6 −4.50 4.95 6 −1.59 34.08 6 −3.61 13.947 −1.86 31.45 7 −2.92 20.83 7 −0.90 40.96 7 −2.22 27.778 −0.73 42.72 8 −1.33 36.71 8 −0.22 47.83 8 −0.84 41.609 0.40 53.99 9 0.26 52.58 9 0.47 54.70 9 0.54 55.42
10 1.53 65.27 10 1.85 68.46 10 1.16 61.58 10 1.92 69.25
Qualitativescale total
z-Score t-Score Qualitativescale total
z-Score t-Score Qualitativescale total
z-Score t-Score Qualitativescale total
z-Score t-Score
0 2.67 76.67 0 2.64 76.37 0 2.59 75.85 0 2.72 77.231 1.29 62.90 1 1.22 62.19 1 1.42 64.16 1 1.33 63.342 −0.09 49.14 2 −0.20 48.02 2 0.25 52.46 2 −0.05 49.463 −1.46 35.38 3 −1.61 33.85 3 −0.92 40.77 3 −1.44 35.574 −2.84 21.61 4 −3.03 19.68 4 −2.09 29.07 4 −2.83 21.685–8 −4.21 7.85 5–8 −4.45 5.51 5 −3.26 17.37 5–8 −4.22 7.79– – – – – – 6–8 −4.43 5.68 – – –

322 E.J. Hubbard et al. / Archives of Clinical Neuropsychology 23 (2008) 295–327
Global score z-Score t-Score Global Score z-Score t-Score Global score z-Score t-Score Global score z-Score t-Score
– – – – – – −8 to (−2) −4.12 8.79 – – –– – – – – – −1 −3.62 13.84 – – –– – – – – – 0 −3.11 18.89 – – –−8 to 1 −4.20 8.03 – – – 1 −2.61 23.94 – – –2 −3.46 15.41 −8 to 2 −4.46 5.42 2 −2.10 28.99 −8 to 2 −4.40 5.953 −2.72 22.79 3 −3.56 14.38 3 −1.60 34.05 3 −3.46 15.434 −1.98 30.17 4 −2.67 23.34 4 −1.09 39.10 4 −2.51 24.915 −1.25 37.55 5 −1.77 32.29 5 −0.58 44.15 5 −1.56 34.396 −0.51 44.93 6 −0.87 41.25 6 −0.08 49.20 6 −0.61 43.877 0.23 52.31 7 0.02 50.21 7 0.43 54.25 7 0.33 53.358 0.97 59.69 8 0.92 59.17 8 0.93 59.31 8 1.28 62.829 1.71 67.06 9 1.81 68.12 9 1.44 64.36 9 2.23 72.3010 2.44 74.44 10 2.71 77.08 10 1.94 69.41 10 3.18 81.78
t- and z-scores, Cahn scales, Race × Age × Ed: Command condition, Race = White
Age 55–74 Age 75+
No college degree College grad or higher No college degree College grad or higher
Quantitativescale total
z-Score t-Score Quantitativescale total
z-Score t-Score Quantitativescale total
z-Score t-Score Quantitativescale total
z-Score t-Score
– – – – – – 0–3 −4.64 3.60 0–3 −4.88 1.23– – – 0–4 −4.90 1.00 4 −3.74 12.62 4 −3.98 10.16– – – 5 −3.88 11.18 5 −2.84 21.65 5 −3.09 19.080–6 −5.11 −1.12 6 −2.86 21.37 6 −1.93 30.67 6 −2.20 28.017 −3.33 16.73 7 −1.84 31.55 7 −1.03 39.69 7 −1.31 36.948 −1.54 34.58 8 −0.83 41.74 8 −0.13 48.71 8 −0.41 45.869 0.24 52.43 9 0.19 51.92 9 0.77 57.73 9 0.48 54.79
10 2.03 70.28 10 1.21 62.11 10 1.68 66.76 10 1.37 63.72
Qualitativescale total
z-Score t-Score Qualitativescale total
z-Score t-Score Qualitativescale total
z-Score t-Score Qualitativescale total
z-Score t-Score
0 2.44 74.41 0 1.88 68.76 0 3.92 89.23 0 2.98 79.811 0.76 57.63 1 0.60 55.97 1 1.91 69.14 1 1.49 64.912 −0.92 40.85 2 −0.68 43.18 2 −0.10 49.04 2 0.00 50.003 −2.59 24.06 3 −1.96 30.39 3 −2.11 28.95 3 −1.49 35.094–8 −4.27 7.28 4 −3.24 17.60 4–8 −4.11 8.85 4 −2.98 20.19– – – 5–8 −4.52 4.81 – – – 5–8 −4.47 5.28
Global Score z-Score t-Score Global Score z-Score t-Score Global Score z-Score t-Score Global Score z-Score t-Score
– – – – – – −8 to 0 −4.54 4.63 −8 to 0 −4.26 7.43– – – −8 to 1 −4.51 4.93 1 −3.80 11.96 1 −3.60 14.01– – – 2 −3.80 12.03 2 −3.07 19.29 2 −2.94 20.60– – – 3 −3.09 19.13 3 −2.34 26.62 3 −2.28 27.19−8 to 4 −4.28 7.19 4 −2.38 26.24 4 −1.61 33.95 4 −1.62 33.775 −3.03 19.75 5 −1.67 33.34 5 −0.87 41.28 5 −0.96 40.366 −1.77 32.31 6 −0.96 40.45 6 −0.14 48.60 6 −0.31 46.957 −0.51 44.86 7 −0.24 47.55 7 0.59 55.93 7 0.35 53.538 0.74 57.42 8 0.47 54.66 8 1.33 63.26 8 1.01 60.129 2.00 69.98 9 1.18 61.76 9 2.06 70.59 9 1.67 66.7110 3.25 82.53 10 1.89 68.87 10 2.79 77.92 10 2.33 73.29

E.J. Hubbard et al. / Archives of Clinical Neuropsychology 23 (2008) 295–327 323
t- and z-scores, Cahn scales, Race × Age × Ed: Command condition, Race = African American
Age 55–74 Age 75+
No college degree College grad or higher No college degree College grad or higher
Quantitativescale total
z-Score t-Score Quantitativescale total
z-Score t-Score Quantitativescale total
z-Score t-Score Quantitativescale total
z-Score t-Score
– – – – – – 0–1 −4.18 8.20 – – –– – – – – – 2 −3.51 14.94 – – –– – – – – – 3 −2.83 21.68 0–3 −4.57 4.300–4 −4.06 9.41 0–4 −4.69 3.07 4 −2.16 28.43 4 −3.77 12.255 −3.12 18.85 5 −3.72 12.78 5 −1.48 35.17 5 −2.98 20.206 −2.17 28.29 6 −2.75 22.49 6 −0.81 41.91 6 −2.19 28.157 −1.23 37.73 7 −1.78 32.20 7 −0.13 48.65 7 −1.39 36.098 −0.28 47.17 8 −0.81 41.91 8 0.54 55.39 8 −0.60 44.049 0.66 56.61 9 0.16 51.62 9 1.21 62.14 9 0.20 51.99
10 1.60 66.05 10 1.13 61.33 10 1.89 68.88 10 0.99 59.93
Qualitativescale total
z-Score t-Score Qualitativescale total
z-Score t-Score Qualitativescale total
z-Score t-Score Qualitativescale total
z-Score t-Score
0 1.67 66.71 0 2.02 70.21 0 3.35 83.47 0 1.83 68.281 0.91 59.11 1 0.87 58.66 1 2.15 71.51 1 0.78 57.832 0.15 51.52 2 −0.29 47.11 2 0.96 59.56 2 −0.26 47.393 −0.61 43.92 3 −1.44 35.57 3 −0.24 47.61 3 −1.31 36.944 −1.37 36.33 4 −2.60 24.02 4 −1.43 35.66 4 −2.35 26.505 −2.13 28.73 5 −3.75 12.47 5 −2.63 23.70 5 −3.39 16.056 −2.89 21.14 6–8 −4.91 0.93 6 −3.82 11.75 6–8 −4.44 5.617 −3.65 13.54 – – – 7–8 −5.02 −0.20 – – –8 −4.41 5.95 – – – – – – – – –
Global score z-Score t-Score Global score z-Score t-Score Global score z-Score t-Score Global score z-Score t-Score
– – – – – – −8 to (−5) −4.29 7.10 – – –– – – – – – −4 −3.83 11.66 – – –– – – – – – −3 −3.38 16.22 – – –−8 to (−2) −4.24 7.63 – – – −2 −2.92 20.79 – – –−1 −3.71 12.87 – – – −1 −2.46 25.35 −8 to (−1) −4.38 6.180 −3.19 18.10 −8 to 0 −4.53 4.72 0 −2.01 29.92 0 −3.83 11.661 −2.67 23.33 1 −3.89 11.11 1 −1.55 34.48 1 −3.29 17.142 −2.14 28.56 2 −3.25 17.50 2 −1.10 39.05 2 −2.74 22.613 −1.62 33.79 3 −2.61 23.90 3 −0.64 43.61 3 −2.19 28.094 −1.10 39.02 4 −1.97 30.29 4 −0.18 48.17 4 −1.64 33.575 −0.58 44.25 5 −1.33 36.68 5 0.27 52.74 5 −1.10 39.056 −0.05 49.48 6 −0.69 43.07 6 0.73 57.30 6 −0.55 44.527 0.47 54.71 7 −0.05 49.47 7 1.19 61.87 7 0.00 50.008 0.99 59.94 8 0.59 55.86 8 1.64 66.43 8 0.55 55.489 1.52 65.17 9 1.23 62.25 9 2.10 71.00 9 1.10 60.9510 2.04 70.40 10 1.86 68.65 10 2.56 75.56 10 1.64 66.43

324 E.J. Hubbard et al. / Archives of Clinical Neuropsychology 23 (2008) 295–327
t- and z-scores, Cahn scales, Race × Age × Ed: Copy condition, Race = White
Age 55–74 Age 75+
No college degree College grad or higher No college degree College grad or higher
Quantitativescale total
z-Score t-Score Quantitativescale total
z-Score t-Score Quantitativescale total
z-Score t-Score Quantitativescale total
z-Score t-Score
0–4 −4.89 1.07 – – – – – – 0–4 −4.27 7.335 −3.86 11.42 0–5 −4.71 2.90 5 −3.32 16.846 −2.82 21.77 6 −3.43 15.75 0–6 −5.49 −4.90 6 −2.37 26.357 −1.79 32.12 7 −2.14 28.59 7 −3.54 14.64 7 −1.41 35.858 −0.75 42.47 8 −0.86 41.44 8 −1.58 34.18 8 −0.46 45.369 0.28 52.82 9 0.43 54.28 9 0.37 53.72 9 0.49 54.87
10 1.32 63.17 10 1.71 67.13 10 2.33 73.26 10 1.44 64.38
Qualitativescale total
z-Score t-Score Qualitativescale total
z-Score t-Score Qualitativescale total
z-Score t-Score Qualitativescale total
z-Score t-Score
0 3.13 81.29 0 2.52 75.20 0 2.39 73.90 0 2.61 76.071 1.49 64.90 1 1.14 61.44 1 1.20 61.95 1 1.29 62.872 −0.15 48.51 2 −0.23 47.68 2 0.00 50.00 2 −0.03 49.683 −1.79 32.12 3 −1.61 33.92 3 −1.20 38.05 3 −1.35 36.484 −3.43 15.73 4 −2.98 20.16 4 −2.39 26.10 4 −2.67 23.295–8 −5.07 −0.66 5–8 −4.36 6.40 5 −3.59 14.14 5 −3.99 10.09– – – – – – 6–8 −4.78 2.19 6–8 −5.31 −3.10
Global score z-Score t-Score Global score z-Score t-Score Global score z-Score t-Score Global score z-Score t-Score
– – – −8 to (−4) −4.66 3.40 – – – – – –– – – −3 −3.86 11.39 – – – – – –– – – −2 −3.06 19.38 – – – – – –– – – −1 −2.26 27.37 – – – −8 to 0 −4.35 6.47– – – 0 −1.46 35.37 – – – 1 −3.69 13.13– – – 2 −0.66 43.36 −8 to 2 −4.90 0.96 2 −3.02 19.79−8 to 3 −4.21 7.90 3 0.13 51.35 3 −3.88 11.16 3 −2.36 26.454 −3.11 18.93 4 0.93 59.34 4 −2.86 21.35 4 −1.69 33.115 −2.00 29.95 5 1.73 67.33 5 −1.85 31.55 5 −1.02 39.776 −0.90 40.98 6 2.53 75.32 6 −0.83 41.75 6 −0.36 46.437 0.20 52.00 7 3.33 83.31 7 0.19 51.94 7 0.31 53.098 1.30 63.03 8 4.13 91.30 8 1.21 62.14 8 0.97 59.759 2.41 74.06 9 4.93 99.29 9 2.23 72.33 9 1.64 66.4010 3.51 85.08 10 5.73 107.28 10 3.25 82.53 10 2.31 73.06
t- and z-scores, Cahn scales, Race × Age × Ed: Copy condition, Race = African American
Age 55–74 Age 75+
No college degree College grad or higher No college degree College grad or higher
Quantitativescale total
z-Score t-Score Quantitativescale total
z-Score t-Score Quantitativescale total
z-Score t-Score Quantitativescale total
z-Score t-Score
0–4 −4.76 2.39 – – – – – – – – –5 −3.73 12.74 0–5 −4.71 2.90 – – – – – –6 −2.69 23.09 6 −3.43 15.75 0–6 −4.75 2.53 0–6 −4.33 6.707 −1.66 33.44 7 −2.14 28.59 7 −2.92 20.79 7 −2.60 24.028 −0.62 43.79 8 −0.86 41.44 8 −1.10 39.05 8 −0.87 41.349 0.41 54.14 9 0.43 54.28 9 0.73 57.30 9 0.87 58.66
10 1.45 64.49 10 1.71 67.13 10 2.56 75.56 10 2.60 75.98

E.J. Hubbard et al. / Archives of Clinical Neuropsychology 23 (2008) 295–327 325
Qualitativescale total
z-Score t-Score Qualitativescale total
z-Score t-Score Qualitativescale total
z-Score t-Score Qualitativescale totala
z-Score t-Score
0 3.70 86.99 0 2.60 75.95 0 4.75 97.47 – – –1 1.94 69.38 1 1.40 63.97 1 2.92 79.21 – – –2 0.18 51.76 2 0.20 52.00 2 1.10 60.95 – – –3 −1.59 34.15 3 −1.00 40.02 3 −0.73 42.70 – – –4 −3.35 16.53 4 −2.20 28.04 4 −2.56 24.44 – – –5–8 −5.11 −1.09 5 −3.39 16.06 5–8 −4.38 6.18 – – –– – – 6–8 −4.59 4.08 – – – – – –– – – – – – – – – – – –– – – – – – – – – – – –
Global score z-Score t-Score Global score z-Score t-Score Global score z-Score t-Score Global score z-Score t-Score
−8 to 1 −4.67 3.33 −8 to 1 −4.18 8.15 – – – – – –2 −3.82 11.82 2 −3.42 15.76 −8 to 2 −4.00 10.00 – – –3 −2.97 20.30 3 −2.66 23.37 3 −3.00 20.00 – – –4 −2.12 28.79 4 −1.90 30.98 4 −2.00 30.00 −8 to 4 −4.33 6.705 −1.27 37.27 5 −1.14 38.59 5 −1.00 40.00 5 −2.60 24.026 −0.42 45.76 6 −0.38 46.20 6 0.00 50.00 6 −0.87 41.347 0.42 54.24 7 0.38 53.80 7 1.00 60.00 7 0.87 58.668 1.27 62.73 8 1.14 61.41 8 2.00 70.00 8 2.60 75.989 2.12 71.21 9 1.90 69.02 9 3.00 80.00 9 4.33 93.3010 2.97 79.70 10 2.66 76.63 10 4.00 90.00 10 6.06 110.62
a Note: for African Americans aged 75+ who were college graduates or higher, the mean qualitative score was 2.0 and the S.D. was 0.0 (n = 4).Therefore, no t- or z-score information could be provided for this subgroup.
References
Blair, M., Kertesz, A., McMonagle, P., Davidson, W., & Bodi, N. (2006). Quantitative and qualitative analyses of clock drawing in frontotemporaldementia and Alzheimer’s disease. Journal of the International Neuropsychological Society, 12, 159–165.
Brodaty, H., & Moore, C. M. (1997). The Clock Drawing Test for dementia of the Alzheimer’s type: A comparison of three scoring methods in amemory disorders clinic. International Journal of Geriatric Psychiatry, 12, 619–627.
Cacho, J., Garcıa-Garcıa, R., Arcaya, J., Gay, J., Guerrero-Peral, A. L., Gomez-Sanchez, J. C., et al. (1996). El test del reloj en ancianos sanos.Revista de Neurologıa, 24, 1525–1528.
Cahn, D. A., Salmon, D. P., Monsch, A. U., Butters, N., Wiederholt, W. C., & Corey-Bloom, J. (1996). Screening for dementia of the Alzheimertype in the community: The utility of the Clock Drawing Test. Archives of Clinical Neuropsychology, 11(6), 529–539.
Census Bureau, U. S. (2006). Current Population Survey, 2006 Annual Social and Economic Supplement. Retrieved 2 May 2007, fromhttp://www.census.gov/population/www/socdemo/education/cps2006.html.
Derouesne, C., Thibault, S., Lagha-Pierucci, S., Baudouin-Madec, V., Ancri, D., & Lacomblez, L. (1999). Decreased awareness of cognitive deficitsin patients with mild dementia of the Alzheimer type. International Journal of Geriatric Psychiatry, 14, 1019–1030.
Fischer, J., & Loring, D. (2004). Construction. In M. Lezak, D. Howieson, & D. Loring (Eds.), Neuropsychological assessment (4th Ed., pp.531–568). New York: Oxford University Press.
Folstein, M. F., Folstein, S. E., & McHugh, P. R. (2001). Mini-Mental State Examination (MMSE). Lutz, FL: Psychological Assessment Resources,Inc.
Freedman, M., Leach, L., Kaplan, E., Winocur, G., Shulman, K., & Delis, D. C. (1994). Clock Drawing: A neuropsychological analysis. New York:Oxford University Press.
Freund, B., Gravenstein, S., Ferris, R., Burke, B. L., & Shaheen, E. (2005). Drawing clocks and driving cars: Use of brief tests of cognition to screendriving competency in older adults. Journal of General Internal Medicine, 20, 240–244.
Greenhalgh, T. (1997). How to read a paper: Papers that report diagnostic or screening tests. British Medical Journal, 315, 540–543.Grut, M., Jorm, A., Fratiglioni, L., Forsell, Y., Viitanen, M., & Winblad, B. (1993). Memory complaints of elderly people in a population survey:
Variation according to dementia stage and depression. Journal of the American Geriatrics Society, 41, 1295–1300.Howieson, D., Loring, D., & Hannay, J. (2004). Neurobehavioral variables and diagnostic issues. In M. Lezak, D. Howieson, & D. Loring (Eds.),
Neuropsychological assessment (4th Ed., pp. 286–334). New York: Oxford University Press.Hughes, C., Berg, L., Danziger, W., Coben, L., & Martin, R. (1982). A new clinical scale for the staging of dementia. British Journal of Psychiatry,
140, 566–572.Jefferson, A. L., Wong, S., Bolen, E., Ozonoff, A., Green, R. C., & Stern, R. A. (2006). Cognitive predictors of HVOT performance differ between
individuals with mild cognitive impairment and normal controls. Archives of Clinical Neuropsychology, 21, 405–412.Jefferson, A. L., Wong, S., Gracer, T. S., Green, R. C., & Stern, R. A. (2007). Geriatric performances on the Boston Naming Test-30 item even
version. Applied Neuropsychology, 14, 1–9.

326 E.J. Hubbard et al. / Archives of Clinical Neuropsychology 23 (2008) 295–327
Juby, A., Tench, S., & Baker, V. (2002). The value of clock drawing in identifying cognitive executive dysfunction in people with a normalMini-Mental State Examination score. Canadian Medical Association Journal, 167(8), 859–864.
Kozora, E., & Munro, C. C. (1994). Qualitative features of clock drawing in normal aging and Alzheimer’s Disease. Assessment, 1(2), 179–187.La Rue, A., Romero, L., Ortiz, I., Liang, H., & Lindeman, R. (1999). Neuropsychological performance of Hispanic and non-Hispanic older adults:
An epidemiolgic survey. Clinical Neuropsychologist, 13(4), 474–486.Lam, L. C. W., Chiu, H. F. K., Ng, K. O., Chan, C., Chan, W. F., Li, S. W., et al. (1998). Clock-face drawing, reading and setting tests in the screening
of dementia in Chinese Elderly Adults. Journal of Gerontology: Psychological Sciences, 53B(6), 353–357.Landis, J., & Koch, G. (1977). The measurement of observer agreement for categorical data. Biometrics, 33, 159–174.Lee, H. L., Swanwick, G. R. J., Coen, R. F., & Lawlor, B. A. (1996). Use of the Clock Drawing Task in the diagnosis of mild and very mild
Alzheimer’s Disease. International Psychogeriatrics, 8(3), 469–476.Libon, D. J., Malamut, B. L., Swenson, R., Prouty Sands, L., & Cloud, B. S. (1996). Further analyses of clock drawings among demented and
nondemented older subjects. Archives of Clinical Neuropsychology, 11(3), 193–205.Lusted, L. (1971). Decision-making studies in patient management. New England Journal of Medicine, 284(8), 416–424.Manly, J. J. (2006). Deconstructing race and ethnicity: Implications for measurement of health outcomes. Medical Care, 44, S10–S16.Manly, J. J., & Echemendia, R. (2007). Race-specific norms: Using the model of hypertension to understand issues of race, culture, and education
in neuropsychology. Archives of Clinical Neuropsychology, 22, 319–325.Manly, J. J., Jacobs, D., Touradji, P., Small, S., & Stern, Y. (2002). Reading level attenuates differences in neuropsychological test performance
between African American and White elders. Journal of the International Neuropsychological Society, 8, 341–348.Manly, J. J., Byrd, D. A., Touradji, P., & Stern, Y. (2004). Acculturation, reading level, and neuropsychological test performance among African
American elders. Applied Neuropsychology, 11(1), 37–46.Manos, P. (1999). Ten-point clock test sensitivity for Alzheimer’s disease in patients with MMSE scores greater than 23. International Journal of
Geriatric Psychiatry, 14, 454–458.Marcopulos, B. A., & McLain, C. A. (2003). Are our Norms “Normal”? A 4-year follow-up study of a biracial sample of rural elders with low
education. Clinical Neuropsychologist, 17(1), 19–33.Mendez, M. F., Ala, T., & Underwood, K. L. (1992). Development of scoring criteria for the Clock Drawing Task in Alzheimer’s Disease. Journal
of the American Geriatrics Society, 40, 1095–1099.Morris, J. (1993). Clinical dementia rating (CDR): Current version and scoring rules. Neurology, 43, 2412–2414.Osterrieth, P. (1944). Le test de copie d’une figure complexe. Archives de Psychologie, 30, 206–356.Paganini-Hill, A., Clark, L., Henderson, V., & Birge, S. (2001). Clock Drawing: Analysis in a retirement community. Journal of the American
Geriatrics Society, 49, 941–947.Ratcliff, G., Dodge, H., Birzescu, M., & Ganguli, M. (2003). Tracking cognitive functioning over time: Ten-year longitudinal data from a community-
based study. Applied Neuropsychology, 10(2), 76–88.Rey, A. (1941). L’examen psychologique dans les cas d’encephalopathie traumatique. Archives de Psychologie, 28, 286–340.Roth, M., Tym, E., Mountjoy, C. Q., Huppert, F. A., Hendrie, H., Verma, S., et al. (1986). CAMDEX—A standard instrument for the diagnosis of
mental disorder in the elderly with special reference to the early detection of dementia. British Journal of Psychiatry, 149, 698–709.Rouleau, I., Salmon, D. P., Butters, N., Kennedy, C., & McGuire, K. (1992). Quantitative and qualitative analyses of clock drawings in Alzheimer’s
and Huntington’s Disease. Brain and Cognition, 18, 70–87.Royall, D. R., Cordes, J. A., & Polk, M. (1998). CLOX: An executive clock drawing task. Journal of Neurology, Neurosurgery and Psychiatry, 64,
588–594.Samton, J. B., Ferrando, S. J., Sanelli, P., Karimi, S., Raiteri, V., & Barnhill, J. W. (2005). The Clock Drawing Test: Diagnostic, functional, and
neuroimaging correlates in older medically ill adults. Journal of Neuropsychiatry and Clinical Neurosciences, 17, 533–540.Schramm, U., Berger, G., Muller, R., Kratzch, T., Peters, J., & Frolich, L. (2002). Psychometric properties of Clock Drawing Test and MMSE or
Short Performance Test (SKT) in dementia screening in a memory clinic population (Abstract). International Journal of Geriatric Psychiatry,17(3), 254–260.
Seigerschmidt, E., Mosch, E., Siemen, M., Forstl, H., & Bickel, H. (2002). The clock drawing test and questionable dementia: Reliability andvalidity. International Journal of Geriatric Psychiatry, 17, 1048–1054.
Shulman, K. (2000). Clock-drawing: Is it the ideal cognitive screening test? International Journal of Geriatric Psychiatry, 15, 548–561.Shulman, K., Shedletsky, R., & Silver, I. (1986). The challenge of time: Clock-drawing and cognitive function in the elderly. International Journal
of Geriatric Psychiatry, 1, 135–140.Smith, A. (1973). Symbol digit modalities test. Los Angeles: Western Psychological Services.Spitznagel, M., & Tremont, G. (2005). Cognitive reserve and anosognosia in questionable and mild dementia. Archives of Clinical Neuropsychology,
20, 505–515.Spreen, O., & Strauss, E. (1998). A compendium of neuropsychological tests: Administration, norms and commentary (2nd Ed.). New York: Oxford
University Press.Storey, J. E., Rowland, J. T. J., Basic, D., & Conforti, D. A. (2001). A comparison of five clock scoring methods using ROC (receiver operating
characteristic) curve analysis. International Journal of Geriatric Psychiatry, 16, 394–399.Sunderland, T., Hill, J., Mellow, A., Lawlor, B. A., Gundersheimer, J., Newhouse, P. A., et al. (1989). Clock drawing in Alzheimer’s Disease: A
novel measure of dementia severity. Journal of the American Geriatrics Society, 37, 725–729.Tuokko, H., Hadjistavropoulous, T., Miller, J. A., & Beattie, B. L. (1992). The clock test: A sensitive measure to differentiate normal elderly from
those with Alzheimer Disease. Journal of the American Geriatrics Society, 40, 579–584.Tuokko, H., Hadjistavropoulous, T., Rae, S., & O’Rourke, N. (2000). A comparison of alternative approaches to the scoring of Clock Drawing.
Archives of Clinical Neuropsychology, 15(2), 137–148.

E.J. Hubbard et al. / Archives of Clinical Neuropsychology 23 (2008) 295–327 327
van der Burg, M., Bouwen, A., Stessens, J., Ylieff, M., Fontaine, O., de Lepeleire, J., et al. (2004). Scoring clock tests for dementia screening: Acomparison of two scoring methods. International Journal of Geriatric Psychiatry, 19, 685–689.
Wang, C. C., Kosinski, C. J., Schwartzberg, J. G., & Shanklin, A. V. (2003). Physician’s guide to assessing and counseling older drivers. Washington,DC: National Highway Traffic Safety Administration.
Watson, Y., Arfken, C., & Birge, S. (1993). Clock completion: An objective screening test for dementia. Journal of the American Geriatrics Society,41, 1235–1240.
Wilkinson, G. (1993). Wide-range achievement test (WRAT-3) (3rd Ed.). Richmond Hill, Ontario, Canada: Psycan Corporation.Wolf-Klein, G. P., Silverstone, F. A., Levy, A. P., & Brod, M. S. (1989). Screening for Alzheimer’s Disease by Clock Drawing. Journal of the
American Geriatrics Society, 37, 730–734.Yamamoto, S., Mogi, N., Umegaki, H., Suzuki, Y., Ando, F., Shimokata, H., et al. (2004). The Clock Drawing Test as a valid screening method for
mild cognitive impairment. Dementia and Geriatric Cognitive Disorders, 18, 172–179.Yesavage, J., Brink, T., Rose, T., Lum, O., Huang, V., Adey, M., et al. (1983). Development and validation of a geriatric depression screening scale:
A preliminary report. Journal of Psychiatric Research, 17, 37–49.