cloud economics, from genesis to scale
TRANSCRIPT

Rotem YossefAWS Business Development Manager
Cloud Economics
June 15, 2016
From Genesis to ScaleVittaly TavorVP Product
Cloudyn
Amir AramaHead of SaaS Cloud Strategy
HPE
In the beginning . . .
…there was TCO
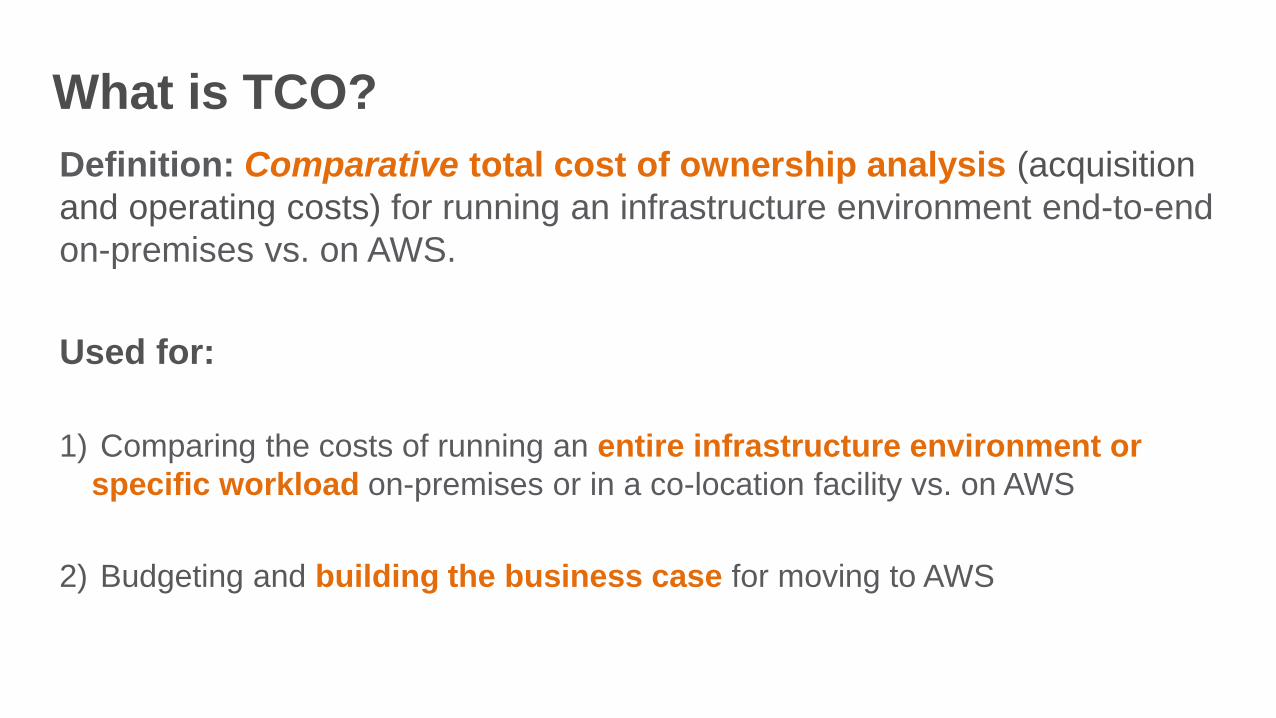
What is TCO?
Definition: Comparative total cost of ownership analysis (acquisition
and operating costs) for running an infrastructure environment end-to-end
on-premises vs. on AWS.
Used for:
1) Comparing the costs of running an entire infrastructure environment or
specific workload on-premises or in a co-location facility vs. on AWS
2) Budgeting and building the business case for moving to AWS
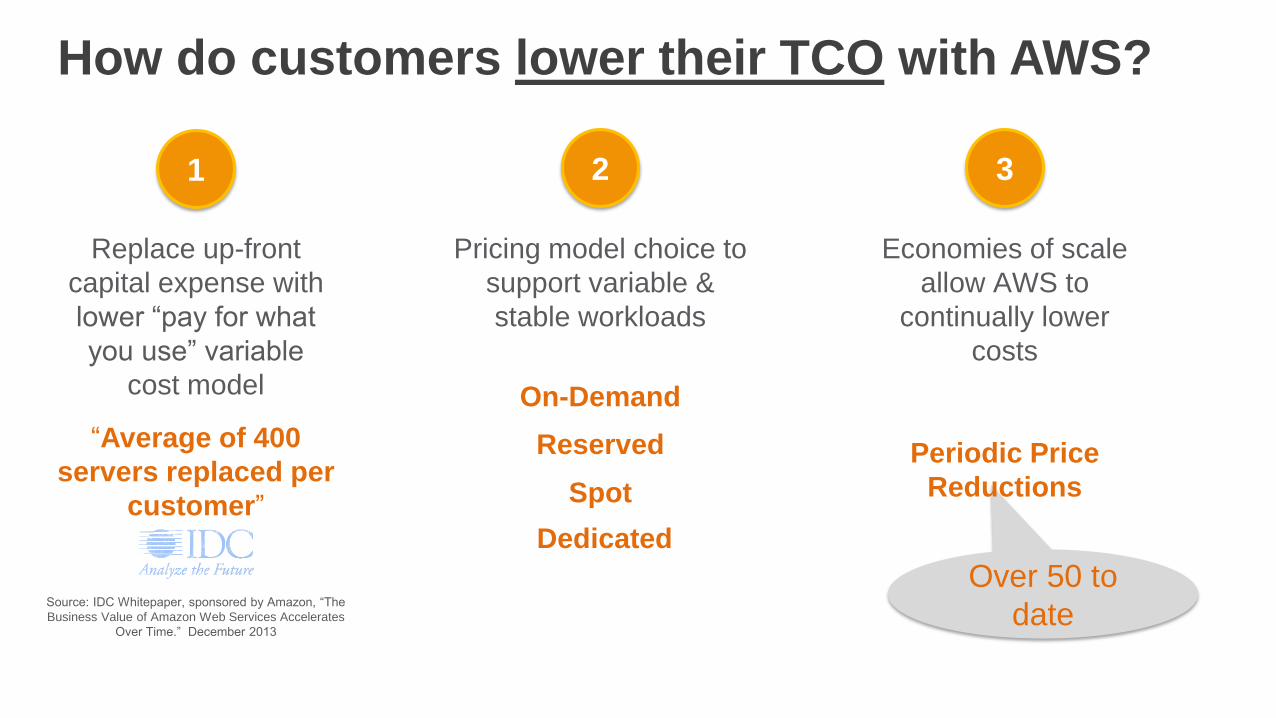
How do customers lower their TCO with AWS?
Over 50 to
date
1
“Average of 400
servers replaced per
customer”
Replace up-front
capital expense with
lower “pay for what
you use” variable
cost model
3
Periodic Price
Reductions
Economies of scale
allow AWS to
continually lower
costs
2
Pricing model choice to
support variable &
stable workloads
On-Demand
Reserved
Spot
Dedicated
Source: IDC Whitepaper, sponsored by Amazon, “The
Business Value of Amazon Web Services Accelerates
Over Time.” December 2013
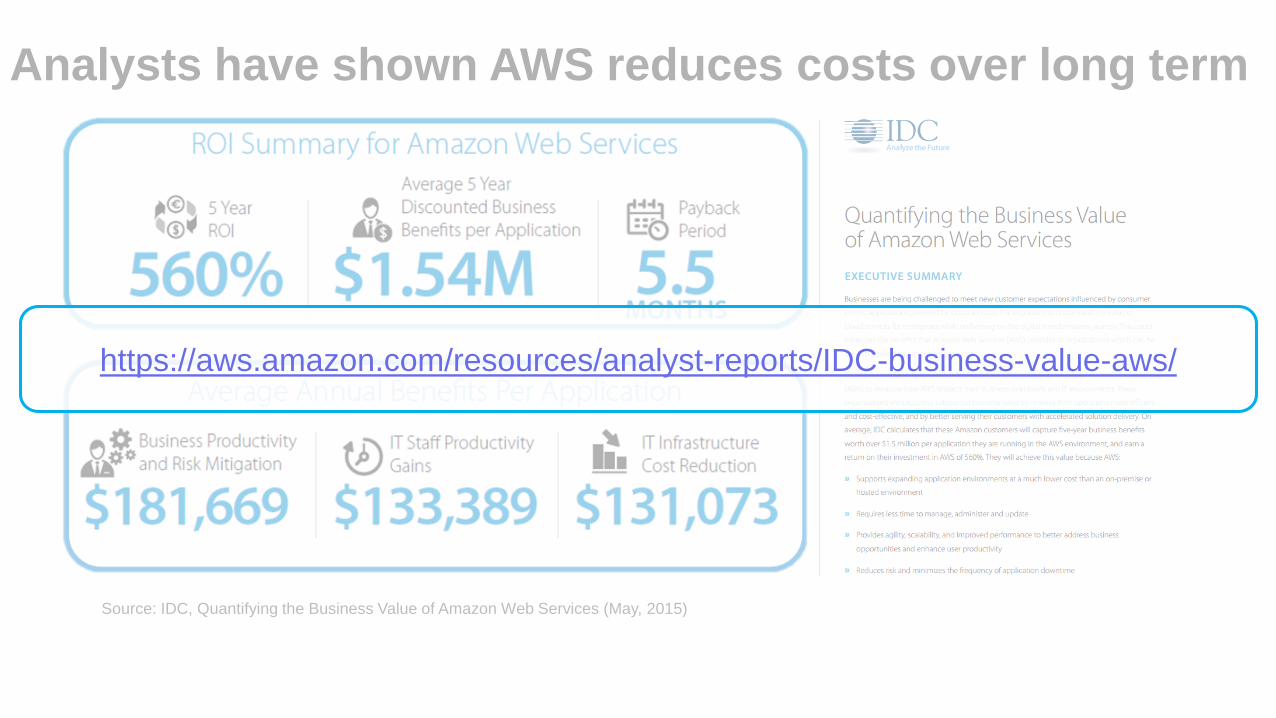
Analysts have shown AWS reduces costs over long term
Source: IDC, Quantifying the Business Value of Amazon Web Services (May, 2015)
https://aws.amazon.com/resources/analyst-reports/IDC-business-value-aws/
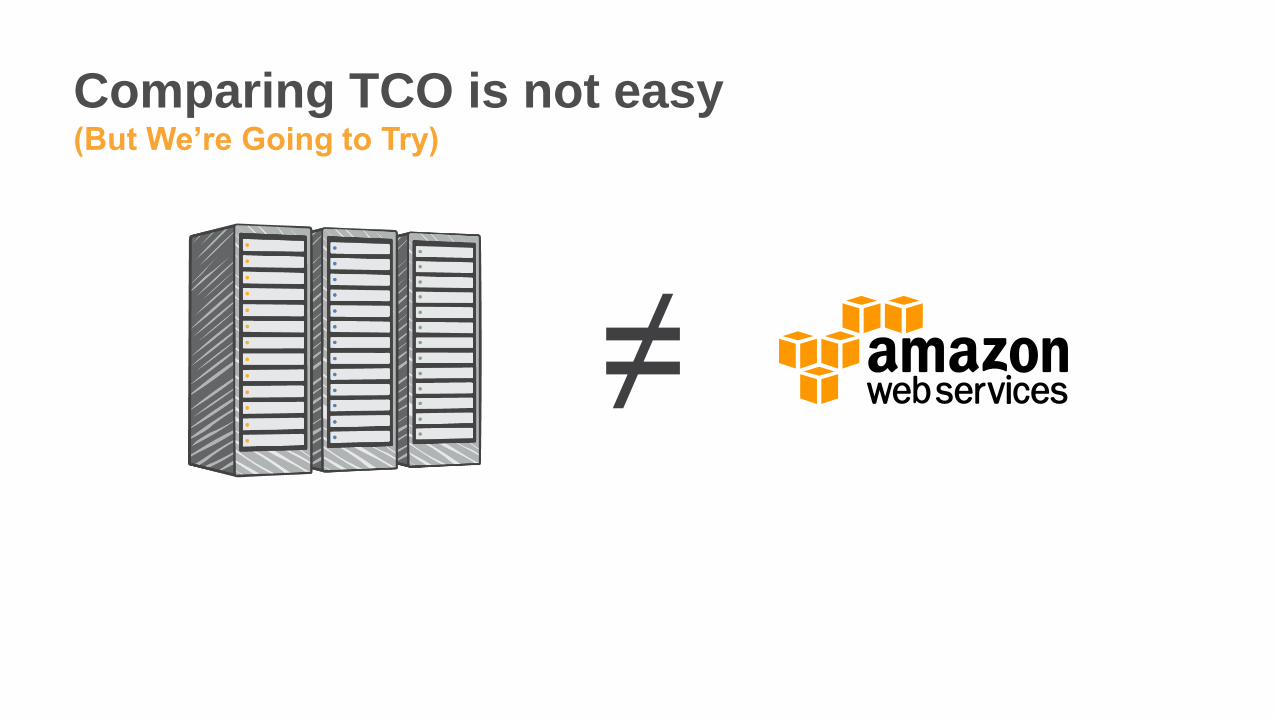
Comparing TCO is not easy(But We’re Going to Try)
≠
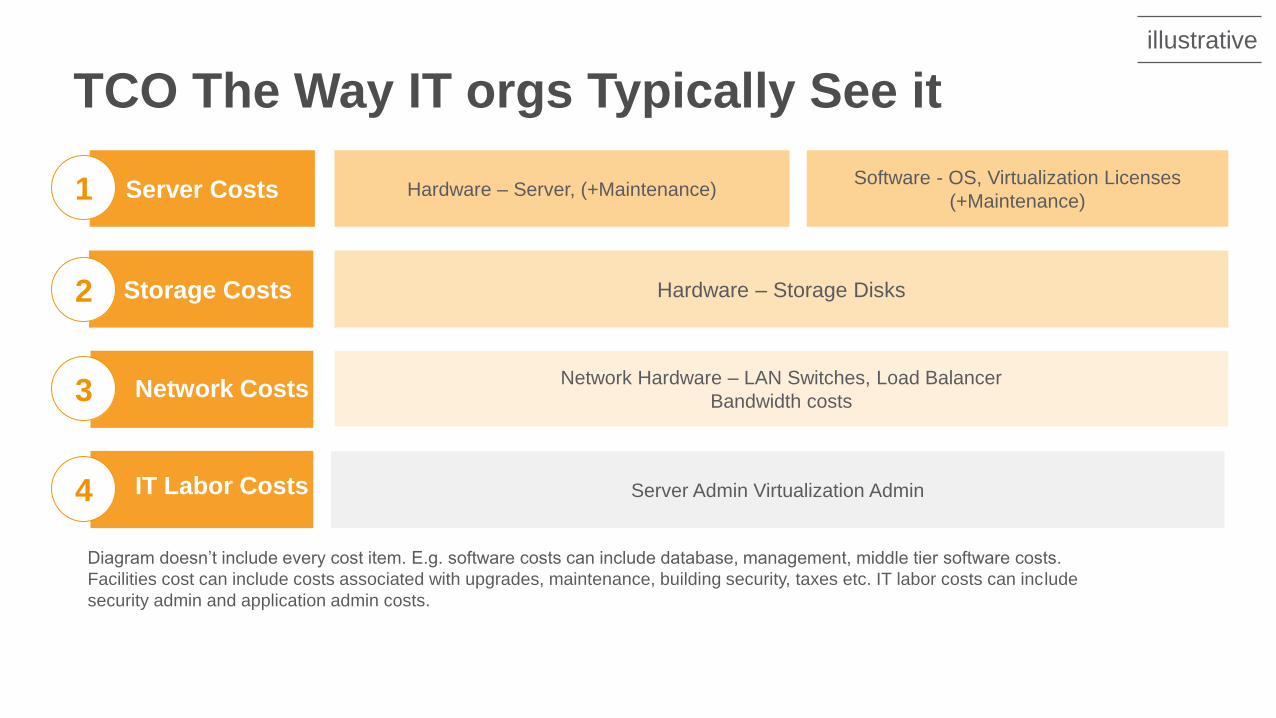
TCO The Way IT orgs Typically See it
Storage Costs
Server Costs Hardware – Server, (+Maintenance)Software - OS, Virtualization Licenses
(+Maintenance)
Hardware – Storage Disks
Network Hardware – LAN Switches, Load Balancer
Bandwidth costs
Server Admin Virtualization Admin4
Diagram doesn’t include every cost item. E.g. software costs can include database, management, middle tier software costs.
Facilities cost can include costs associated with upgrades, maintenance, building security, taxes etc. IT labor costs can include
security admin and application admin costs.
Network Costs
IT Labor Costs
1
2
3
illustrative
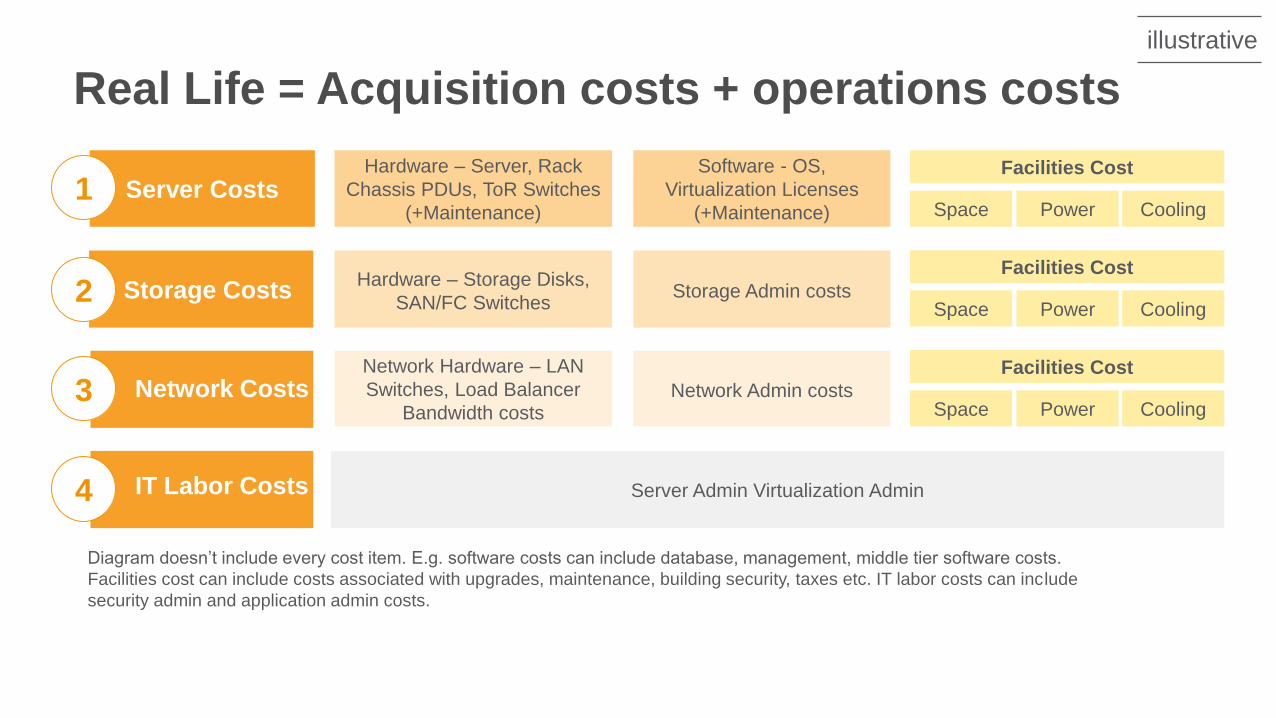
Real Life = Acquisition costs + operations costs
illustrative
Hardware – Server, Rack
Chassis PDUs, ToR Switches
(+Maintenance)
Software - OS,
Virtualization Licenses
(+Maintenance)
Facilities Cost
Hardware – Storage Disks,
SAN/FC SwitchesStorage Admin costs
Network Hardware – LAN
Switches, Load Balancer
Bandwidth costsNetwork Admin costs
Server Admin Virtualization Admin
Diagram doesn’t include every cost item. E.g. software costs can include database, management, middle tier software costs.
Facilities cost can include costs associated with upgrades, maintenance, building security, taxes etc. IT labor costs can include
security admin and application admin costs.
Space Power Cooling
Facilities Cost
Space Power Cooling
Facilities Cost
Space Power Cooling
Server Costs
Storage Costs
Network Costs
IT Labor Costs
Storage Costs
Server Costs
4
Network Costs
IT Labor Costs
1
2
3
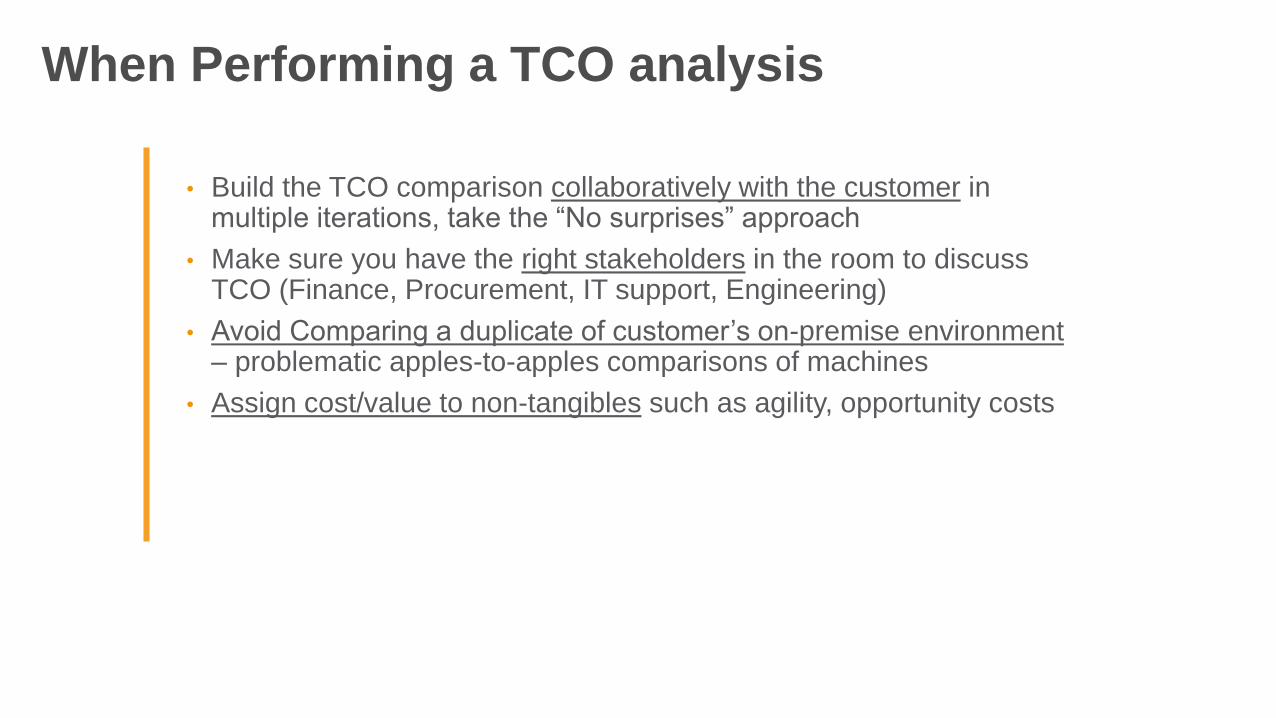
When Performing a TCO analysis
• Build the TCO comparison collaboratively with the customer in multiple iterations, take the “No surprises” approach
• Make sure you have the right stakeholders in the room to discuss TCO (Finance, Procurement, IT support, Engineering)
• Avoid Comparing a duplicate of customer’s on-premise environment– problematic apples-to-apples comparisons of machines
• Assign cost/value to non-tangibles such as agility, opportunity costs
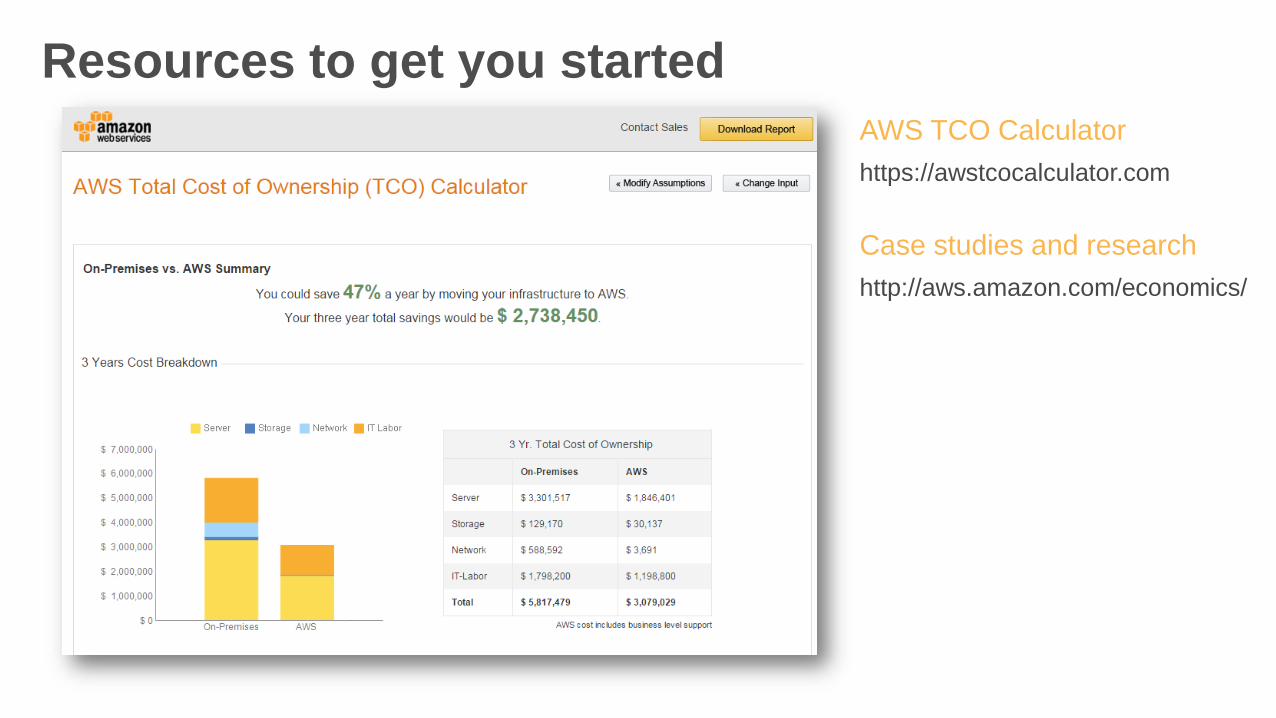
Resources to get you started
AWS TCO Calculator
https://awstcocalculator.com
Case studies and research
http://aws.amazon.com/economics/

So you’re feeling pretty good.
Until your CFO shows up with the bill.

Cost optimization is…
going from…
to…
pay for what you use
pay for what you need
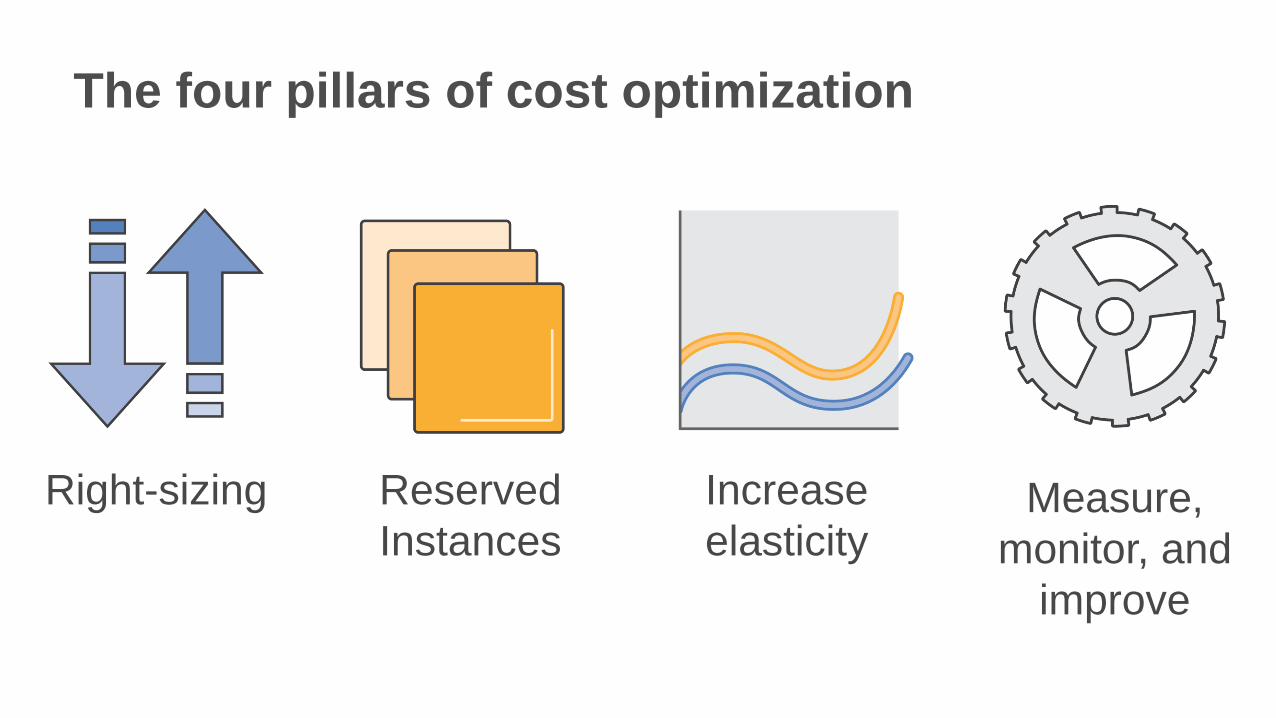
The four pillars of cost optimization
Right-sizing Reserved
Instances
Increase
elasticityMeasure,
monitor, and
improve
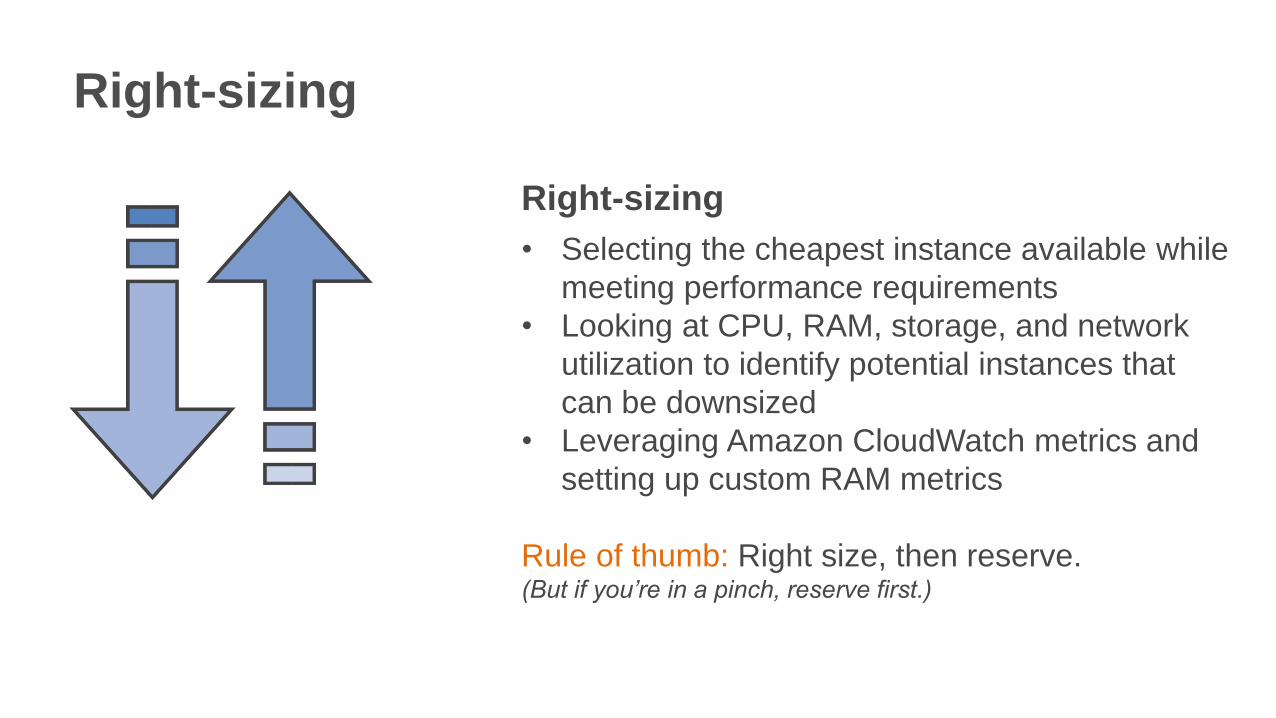
Right-sizing
Right-sizing
• Selecting the cheapest instance available while
meeting performance requirements
• Looking at CPU, RAM, storage, and network
utilization to identify potential instances that
can be downsized
• Leveraging Amazon CloudWatch metrics and
setting up custom RAM metrics
Rule of thumb: Right size, then reserve.(But if you’re in a pinch, reserve first.)
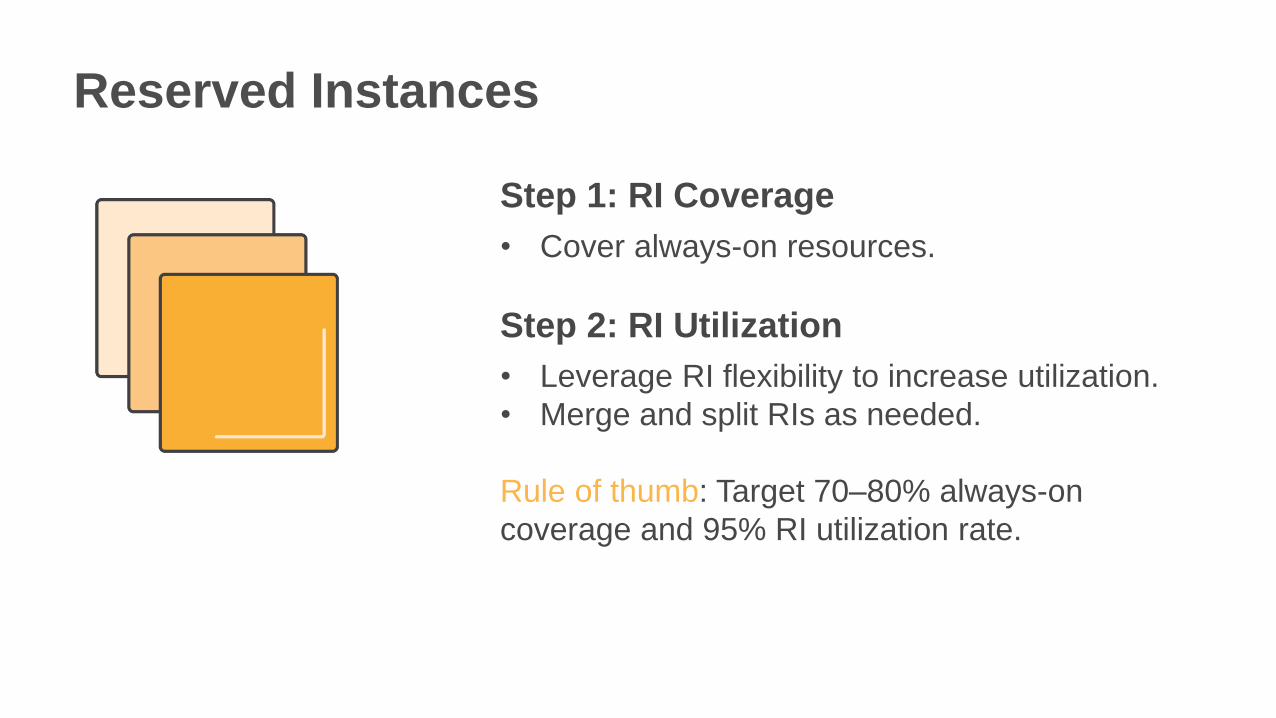
Reserved Instances
Step 1: RI Coverage
• Cover always-on resources.
Step 2: RI Utilization
• Leverage RI flexibility to increase utilization.
• Merge and split RIs as needed.
Rule of thumb: Target 70–80% always-on
coverage and 95% RI utilization rate.

Increase elasticity
Turn off nonproduction instances
• Look for dev/test, nonproduction instances that
are running always-on and turn them off.
Autoscale production
• Use Auto Scaling to scale up and down based
on demand and usage (for example, spikes).
Rule of thumb: Shoot for 20–30% of Amazon EC2
instances running on demand to be able to handle
elasticity needs.
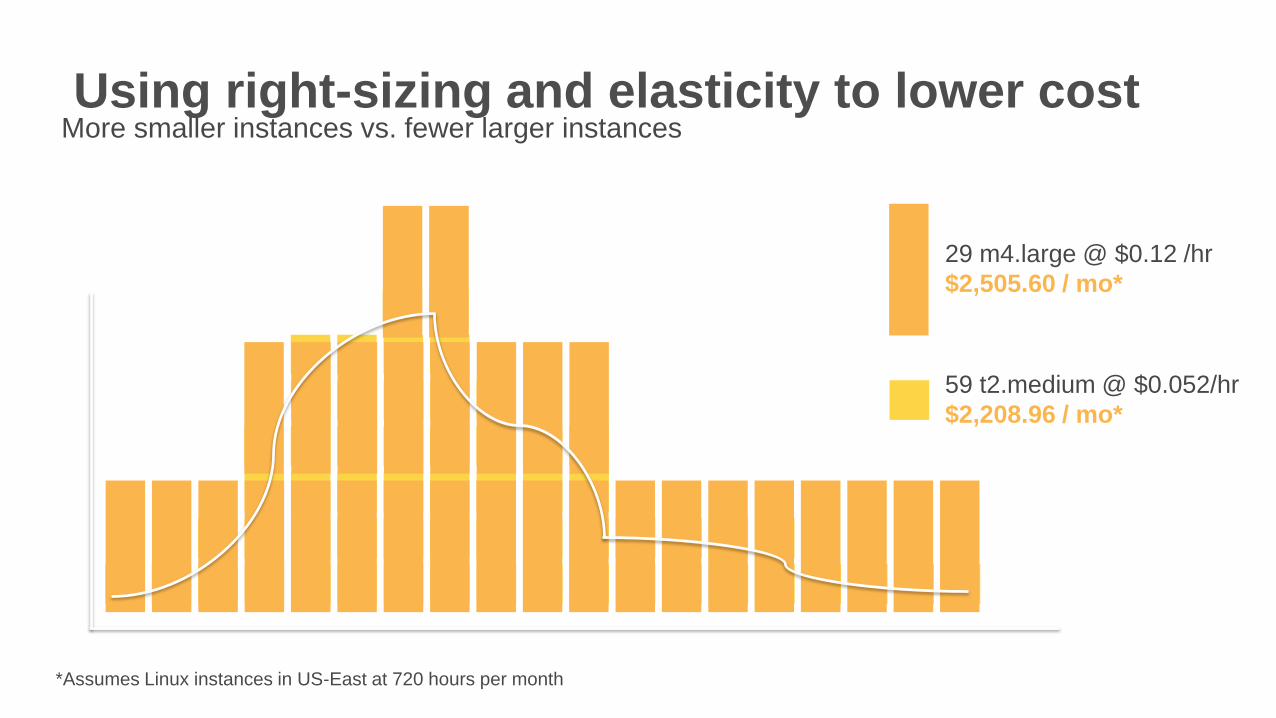
Using right-sizing and elasticity to lower cost More smaller instances vs. fewer larger instances
29 m4.large @ $0.12 /hr
$2,505.60 / mo*
59 t2.medium @ $0.052/hr
$2,208.96 / mo*
*Assumes Linux instances in US-East at 720 hours per month
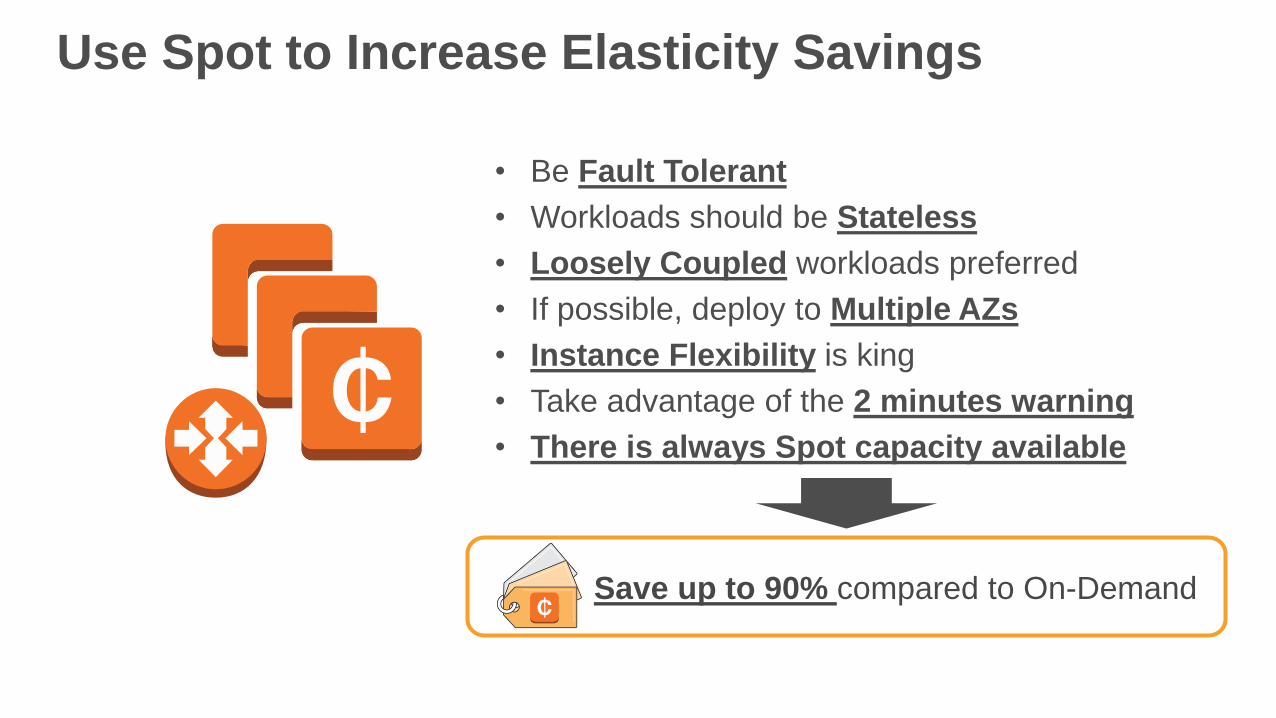
Use Spot to Increase Elasticity Savings
• Be Fault Tolerant
• Workloads should be Stateless
• Loosely Coupled workloads preferred
• If possible, deploy to Multiple AZs
• Instance Flexibility is king
• Take advantage of the 2 minutes warning
• There is always Spot capacity available
Save up to 90% compared to On-Demand
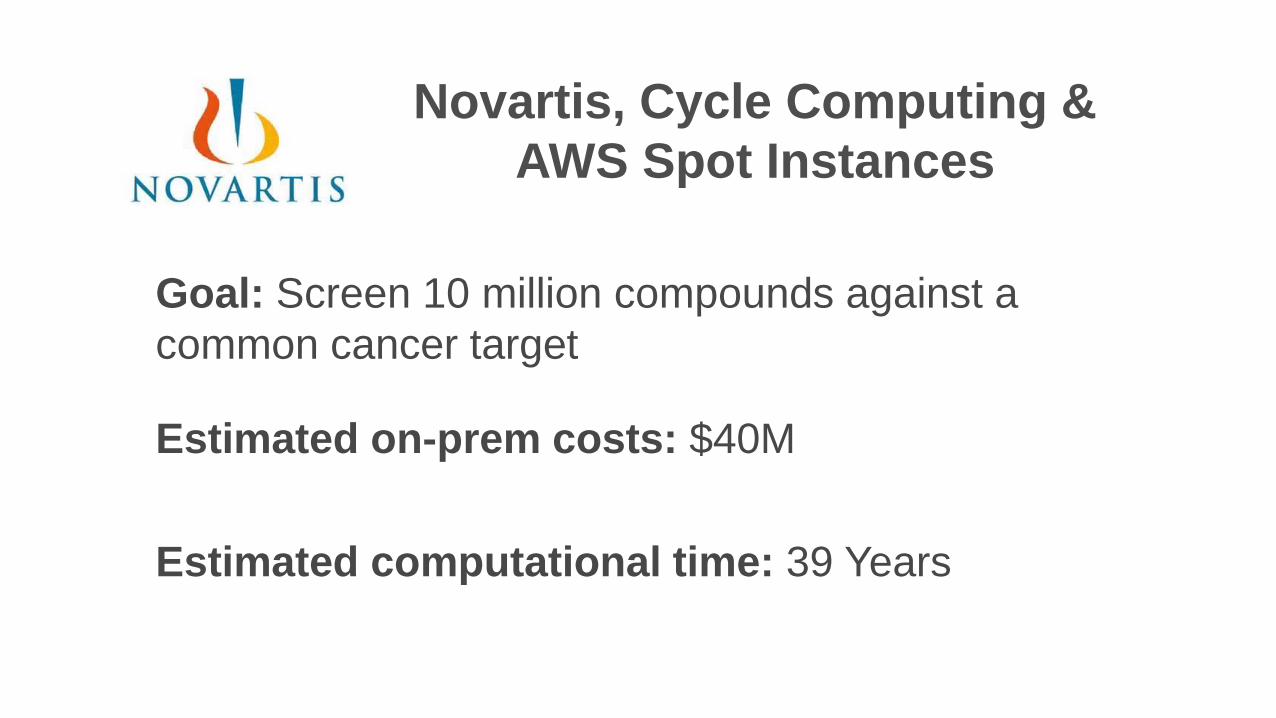
Novartis, Cycle Computing &
AWS Spot Instances
Goal: Screen 10 million compounds against a
common cancer target
Estimated on-prem costs: $40M
Estimated computational time: 39 Years
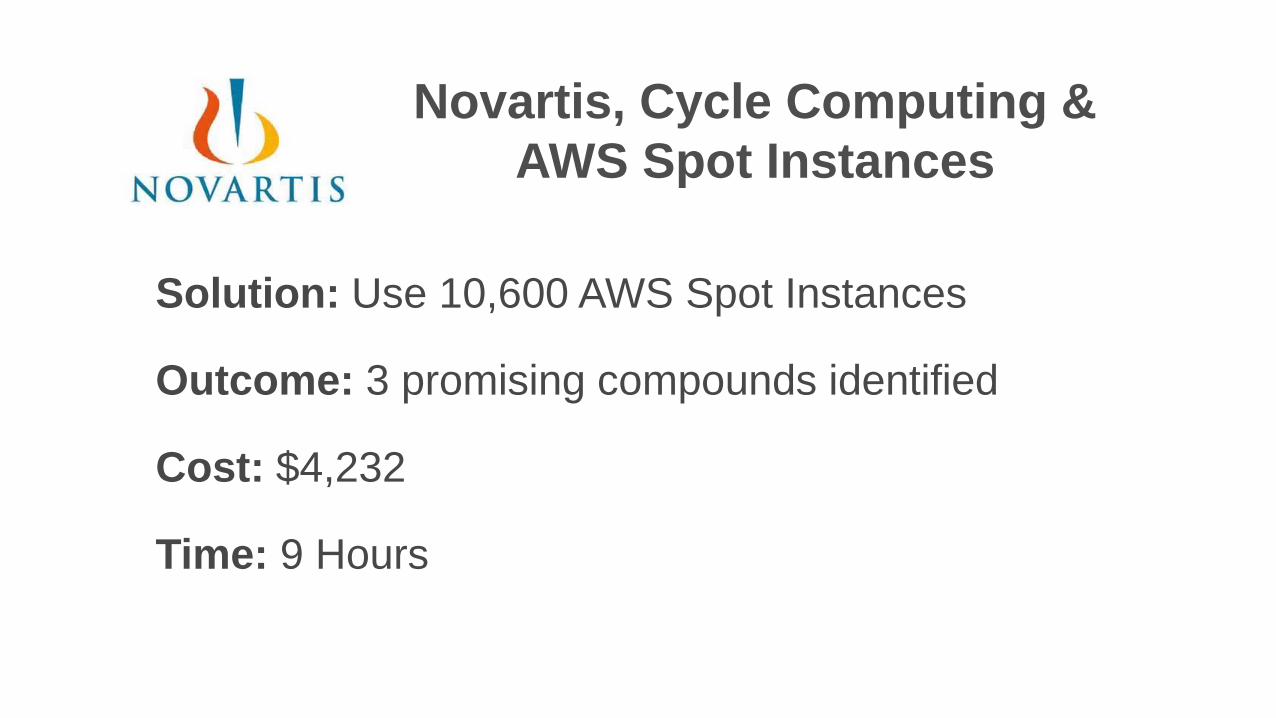
Solution: Use 10,600 AWS Spot Instances
Outcome: 3 promising compounds identified
Cost: $4,232
Time: 9 Hours
Novartis, Cycle Computing &
AWS Spot Instances
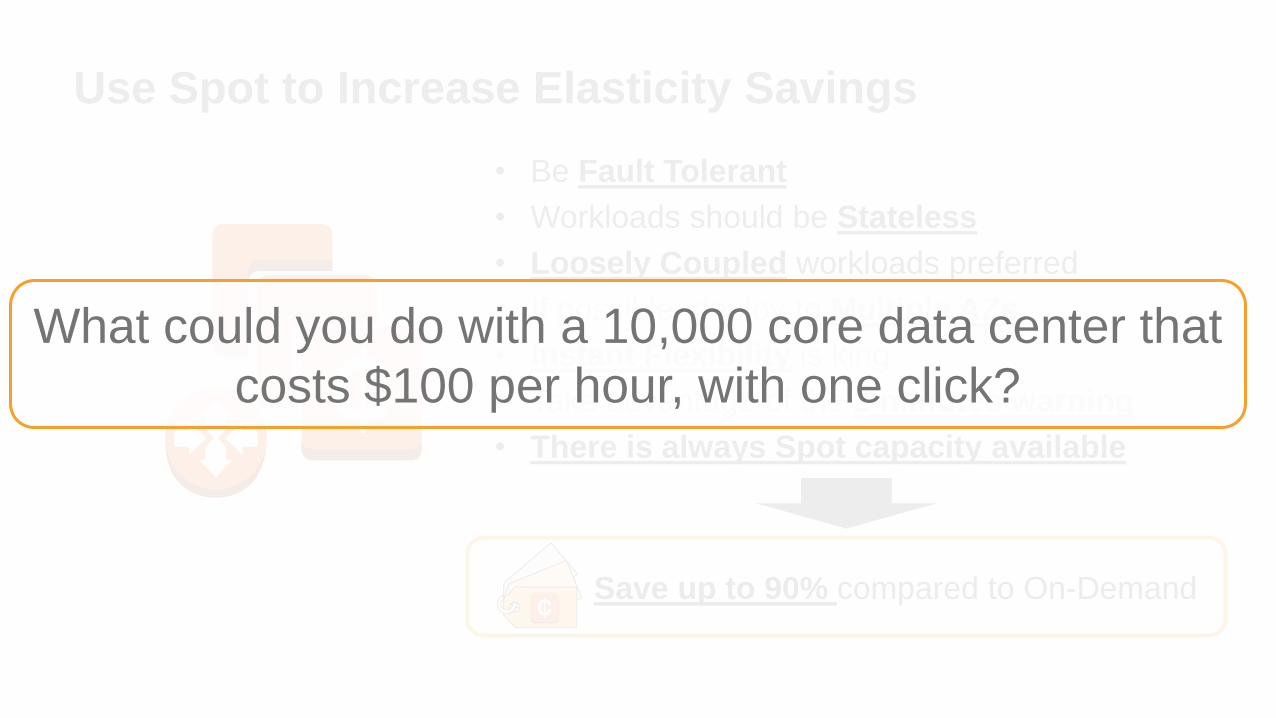
• Be Fault Tolerant
• Workloads should be Stateless
• Loosely Coupled workloads preferred
• If possible, deploy to Multiple AZs
• Instant Flexibility is king
• Take advantage of the 2 minutes warning
• There is always Spot capacity available
Use Spot to Increase Elasticity Savings
Save up to 90% compared to On-Demand
What could you do with a 10,000 core data center that
costs $100 per hour, with one click?
Cost optimization governance
(Remember the fourth pillar?)
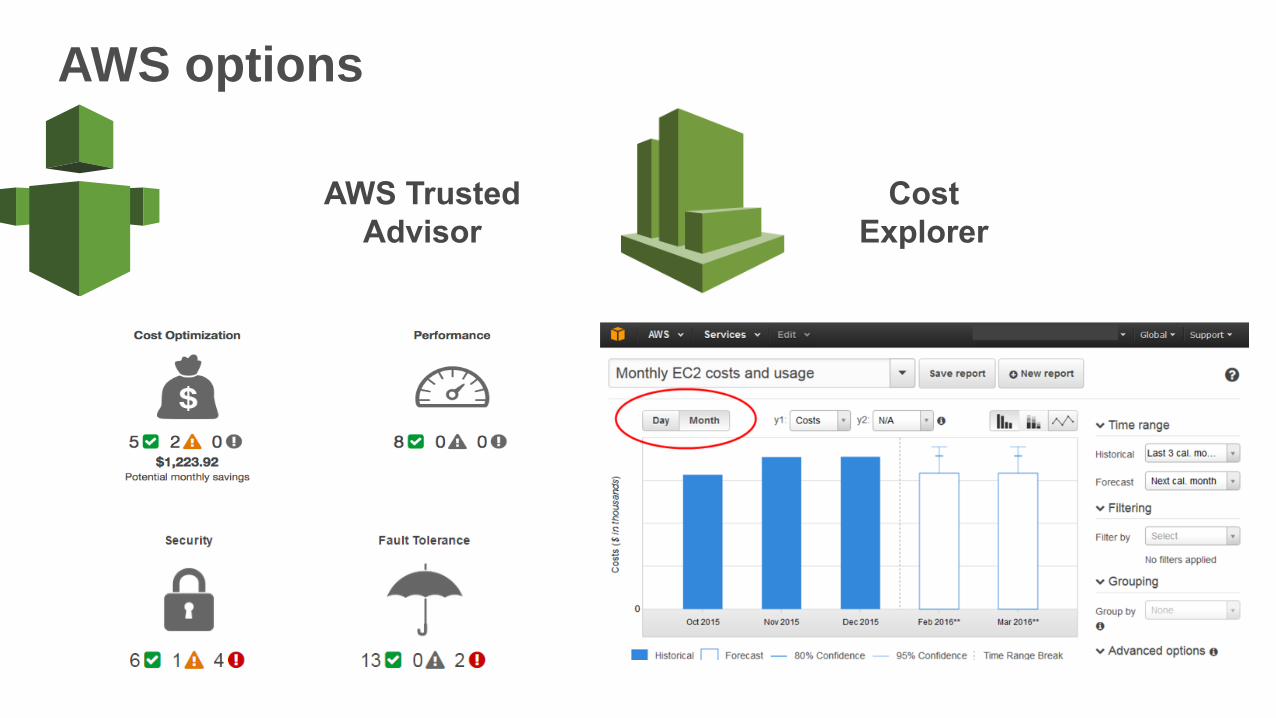
AWS options
Partner Ecosystem
HPE Software Public Cloud Governance Process
Amir Arama – HPE SaaS Public Cloud Strategy & SolutionVittaly Tavor – Cloudyn co-founder & VP Product May 2016
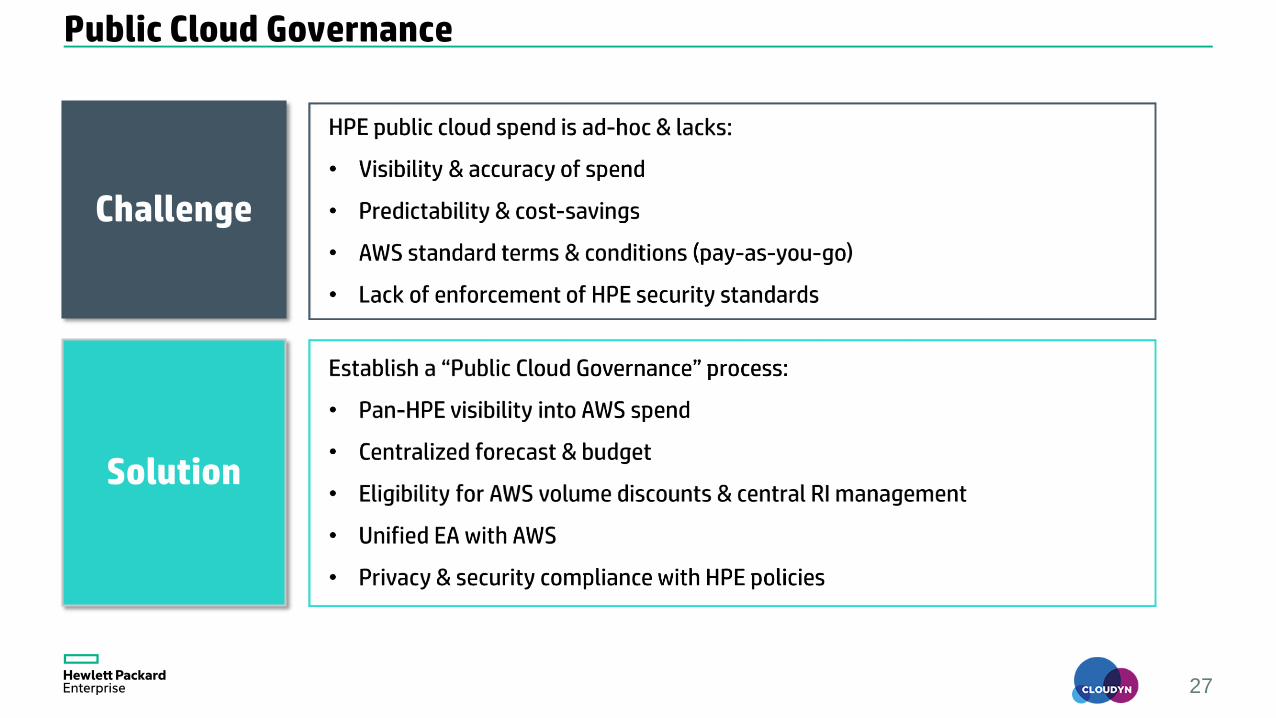
Public Cloud Governance
Challenge
Solution
27

Public Cloud Governance AWS Accounts Structure
HPE Master Billing Account
BU 1
Prod
Non-prod
BU 2
Prod
Non-prod
BU 3
Prod
Non-prod
BU4
Prod
Non-prod
BU 5
Prod
Non-prod
BU 6
Prod
Non-prod
BU 7
Prod
Non-prod
HPE Public Cloud Team
Cross Charge BU’s
Cloudyn: Cloud Mgmt. Tool
• All AWS accounts will be linked to HPE SW Master Billing Account. • BU-level cross charges will be generated by HPE Public Cloud Team using Cloudyn.• RIs will be purchased centrally and allocated using Cloudyn.• Cross-charge will include the use of shared resources.• Cloudyn will be the billing source.
29
Cloudyn Manages Cloud Deployments
Allowing customers to fully realize their cloud potential
34
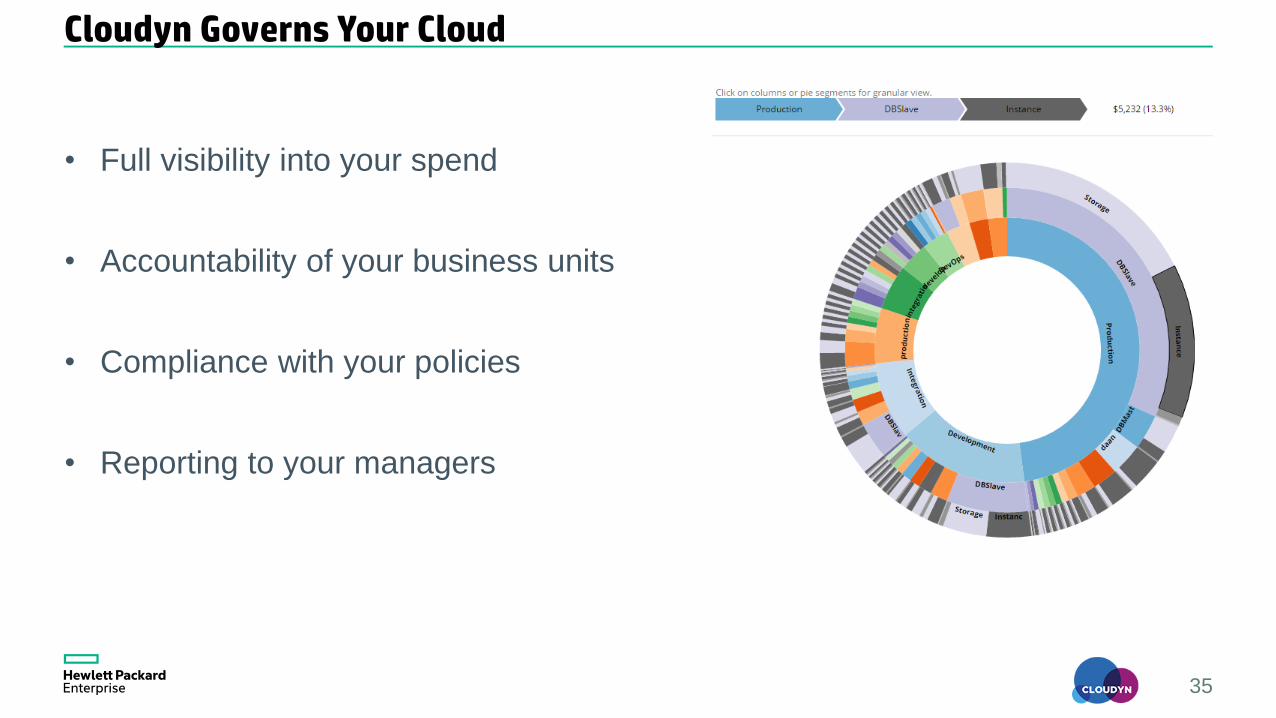
Cloudyn Governs Your Cloud
35
• Full visibility into your spend
• Accountability of your business units
• Compliance with your policies
• Reporting to your managers
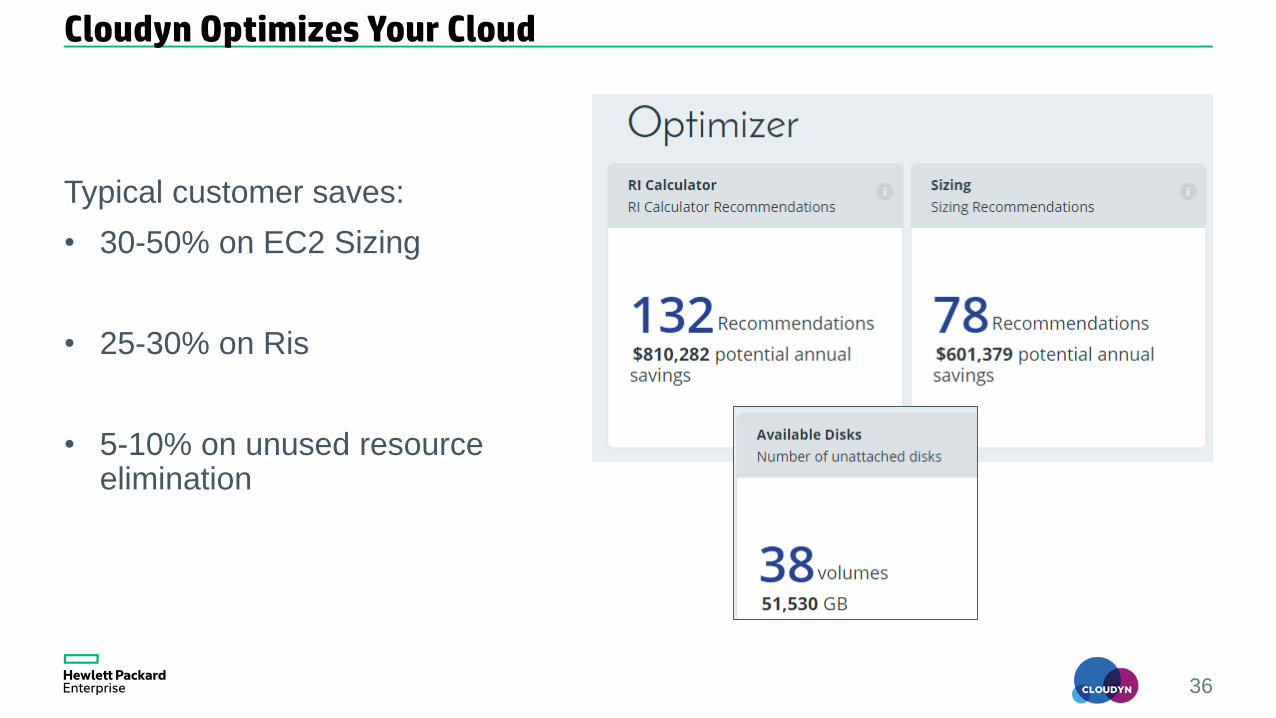
Cloudyn Optimizes Your Cloud
36
Typical customer saves:
• 30-50% on EC2 Sizing
• 25-30% on Ris
• 5-10% on unused resource elimination
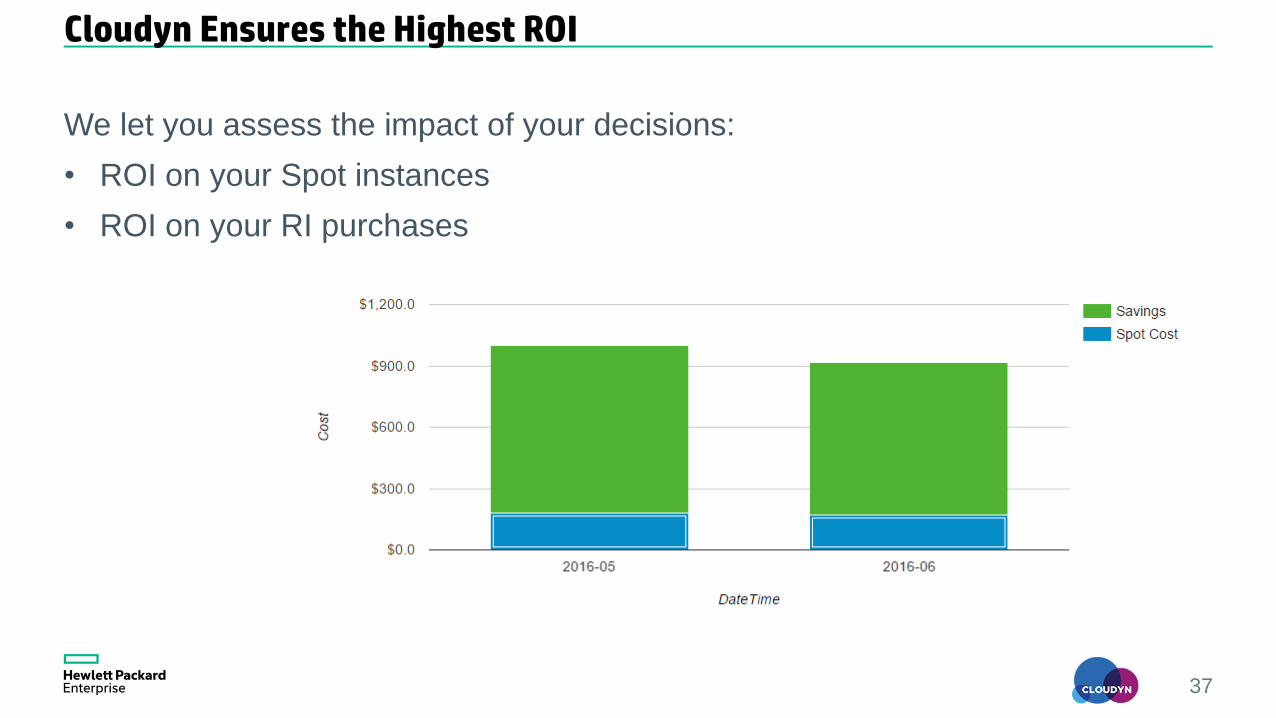
Cloudyn Ensures the Highest ROI
37
We let you assess the impact of your decisions:
• ROI on your Spot instances
• ROI on your RI purchases