trade barrier elimination, economics of scale and market
TRANSCRIPT
Signifikan: Jurnal Ilmu Ekonomi
Volume 6 (2), October 2017
P-ISSN: 2087-2046; E-ISSN: 2476-9223
Page 189 - 216
http://journal.uinjkt.ac.id/index.php/signifikan 189 DOI: 10.15408/sjie.v6i2.5279
Trade Barrier Elimination, Economics of Scale and Market Competition: Computable General Equilibrium Model
Widyastutik1, Suahasil Nazara2, Rina Oktaviani3, Djamester Simarmata4 1, 3, Bogor Agricultural University, 2, 4 Universitas Indonesia
[email protected], [email protected], [email protected], [email protected]
Abstract
The ASEAN and its dialogue partner countries agreed to reduce trade barriers in the services sector,
one of which is sea transport services. The purpose of this study is to estimate the equivalent tax of
non-tariff barriers in the sea transport services. Besides that, this study is going to analyze the
economic impacts of the regulatory barriers elimination in the sea transport services of ASEAN and its
dialogue partner countries. Using the gravity model, it can be identified that trade barriers of sea
transport services sector of ASEAN and dialogue partner countries are still relatively high. Additionally,
by adopting IC-IRTS model in Global CGE Model (GTAP), the simulation results show consistent results
with the theory of pro-competitive effects. The greater gain from trade is obtained in the CGE model
assuming IC-IRTS compared to PC-CRTS. China gains a greater benefit that is indicated by the highest
increase in welfare and GDP followed by Japan and Australia.
Keywords: trade barrier, economics of scale, market competition, gravity model
Abstrak
Negara anggota ASEAN dan mitra dialognya telah sepakat untuk menurunkan hambatan
perdagangan pada sector jasa, salah satunya pada jasa transportasi laut. Tujuan dari penelitian ini
ialah untuk melakukan estimasi pajak ekuivalen dari hambata non-tarif pada jasa transportasi laut.
Selain itu, penelitian ini akan menganalisis dampak ekonomi dari peraturan penghilangan hambatan
pada jasa transportasi laut di negara ASEAN dan mitra dialognya. Berdasarkan model gravitasi, dapat
diidentifikasi bahwa hambatan perdagangan pada sektor jasa transportasi lau antara negara ASEAN
dengan mitra dialognya masih relatif tinggi. Selanjutnya, dengan mengadopsi model IC-IRTS pada
model CGE Global (GTAP), hasil simulasi menunjukkan konsistensiantara hasil dengan teori pro-
persaingan. Manfaat perdagangan terbesar pada model CGE lebih besar dengan asumsi IC-IRTS
dibandingkan dengan PC-CRTS. Cina mendapatkan manfaat terbesar dari perdagangan ini, hal ini
diindikasikan dengan peningkatkan kesejahteraan dan PDB, yang kemudian diikuti dengan Jepang dan
Australia.
Kata Kunci: hambatan perdagangan, skala ekonomi, persaingan pasar, model gravitasi
Received: April 17, 2017; Revised: May 30, 2017; Approved: June 15, 2017
Trade Barrier Elimination, Economics of Scale, and...
Widyastutik, Suahasil Nazara, Rina Oktaviani, Djamester Simarmata
190 http://journal.uinjkt.ac.id/index.php/signifikan
DOI: 10.15408/sjie.v6i2.5279
INTRODUCTION
The characteristics of the services sector trade are different from trade in
goods. For instance, the services sector is not produced and stored for later
consumption. In addition to that, production and consumption are carried out
simultaneously (Stern and Hoekman, 1988). Some services sectors are tangible such as
restaurant services. However, most of the services sector are intangible and do not
subject to tariffs. Consequently, there are many barriers in the form of restrictions in
services sector trade when interaction happened between producers and consumers,
in comparison to tariff barriers that commonly occur in trade in goods1. Barriers to
trade in services are implemented by the government through regulation (Kalirajan,
2000). Sheperd and Marrel (2009) stated that it is very difficult to quantify the impacts
of policy on trade in services. The size of the ad valorem tariffs that are transparent in
goods market is very rarely found in the services sector. Therefore, alernative
measures have been developed to address the issue. Sheperd and Marrel (2009) used
the trade cost approach to calculate the restriction index in the service sector. High
regulatory barriers reflect restriction index itself.
Regulation in the services sector is expected to reduce the asymmetric
information. This protection needs to be done in order to deal with the political
demands of developed countries to undertake liberalization in the services sector.
Inappropriate regulation will be easily intervened by political decisions. The regulation
becomes obstacle because it increases transaction costs, and hence it is ultimately
charged to the consumer in the form of higher prices of services. Hertel et.al. (1999)
stated in one of the models that excessive regulation contributes to a very high
increase in costs (cost escalating). Another argument states that excessive regulation is
equivalent to tax that will increase economic rents (Dee, et.al. 2003).
The reduction of trade barriers to the provision of services among ASEAN
countries conducted through the mechanisms, which are regulated in the ASEAN
Framework Agreement on Services (AFAS), signed by the ASEAN Economic Ministers
1 Hoekman and Braga (1997) distinguished types of barriers: (1) quotas, local content, and prohibitions; (2) price-
based instruments; (3) standards, licensing, and procurement; and (4) discriminatory access to distribution networks.
Hoekman (2011) classified types of barriers : (1) Market Access (MA), and (2) National Treatment (NT), then
applied differently to 4 modes of supply in services (a) cross-border trade, (b) consumption abroad, (c) commercial
presence, and (d) presence of natural persons. Deadorf and Stern (2004) distinguished types of barriers: (1)
discriminatory on entry/establishment and operations (2) non-discriminatory on entry/establishment and operations.
The barriers applied to domestic and foreign service providers.
http://journal.uinjkt.ac.id/index.php/signifikan 191 DOI: 10.15408/sjie.v6i2.5279
Signifikan Vol. 6 (2), Oktober 2017
on 15 December 1995 in Bangkok, Thailand. To follow up the agreements, the
Coordinating Committee on Services (CCS) has been established to manage services
liberalization negotiations within the framework of AFAS which includes eight sectors2.
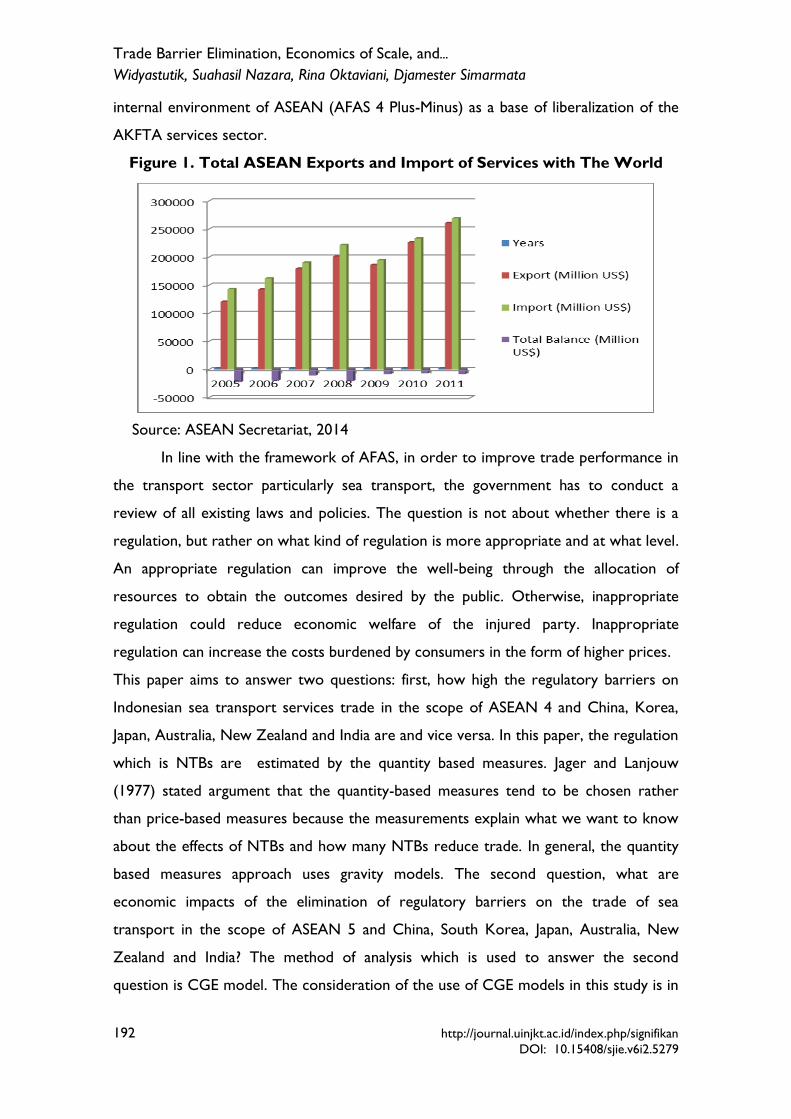
As an illustration, trade in services accounts for ¼ of ASEAN trade. This sector is very
important in facilitating trade in goods and Foreign Direct Investment. Growth of
exports of services by ASEAN averaged 14 percent per annum. Growth of imports of
services averaged 11 percent per annum. Meanwhile, The ASEAN total export and
import of services with the world generally increased over the period 2005 to 2011
with a slight reduction in 2009, it was partly due to a spill-over effect of the global
financial crisis in 2008. For both exports and imports, the main contributors were
transportation, business services, and travel, which comprised over 80 percent of the
total in both cases (ASEAN Secretariat, 2011).
Transport services sector, especially sea transport has an important role in the
ASEAN trade. This is mainy due to the fact that the ASEAN region consists of vital
sea lanes, destinations and transit points for world trade carried by ships. For example,
25 percent of the world’s oil trade and 2,500 LNG/LPG tankers pass through this
region every year. The prosperity of ASEAN Member Countries greatly depends on
the efficiency, viability and safety of the shipping, port facilities and sea trade routes.
Nowadays, Southeast Asia is taking advantage of its strategic location being at the sea
cross roads by improving the efficiency of its ports and shipping services
(www.aseansec.org).
Not only at the level of ASEAN, in 2012, a free trade agreement involving the
ASEAN, China, South Korea, Japan, Australia, New Zealand and India were concluded
(The Regional Comprehensive Economic Partnership) . The Free trade agreement was
agreed on the final day of the Summit of the 21stASEAN in Phnom Penh, 15-20
November 2012. This agreement is called the Regional Comprehensive Economic
Partnership. In association with the implementation of the ASEAN-China FTA in
services, China has submitted a request to liberalize Indonesia's 10 service sectors
including sea transports. Similiarly, Indonesia also includes the sea transport as the base
offer for the sectors included in the first commitment of the ASEAN-China FTA in
services. Meanwhile, ASEAN and Korea have agreed to use the commitments in the
2 The eight sectors are air and sea transport, business, construction, telecommunications, tourism, financial, health,
and logistics services
Trade Barrier Elimination, Economics of Scale, and...
Widyastutik, Suahasil Nazara, Rina Oktaviani, Djamester Simarmata
192 http://journal.uinjkt.ac.id/index.php/signifikan
DOI: 10.15408/sjie.v6i2.5279
internal environment of ASEAN (AFAS 4 Plus-Minus) as a base of liberalization of the
AKFTA services sector.
Figure 1. Total ASEAN Exports and Import of Services with The World
Source: ASEAN Secretariat, 2014
In line with the framework of AFAS, in order to improve trade performance in
the transport sector particularly sea transport, the government has to conduct a
review of all existing laws and policies. The question is not about whether there is a
regulation, but rather on what kind of regulation is more appropriate and at what level.
An appropriate regulation can improve the well-being through the allocation of
resources to obtain the outcomes desired by the public. Otherwise, inappropriate
regulation could reduce economic welfare of the injured party. Inappropriate
regulation can increase the costs burdened by consumers in the form of higher prices.
This paper aims to answer two questions: first, how high the regulatory barriers on
Indonesian sea transport services trade in the scope of ASEAN 4 and China, Korea,
Japan, Australia, New Zealand and India are and vice versa. In this paper, the regulation
which is NTBs are estimated by the quantity based measures. Jager and Lanjouw
(1977) stated argument that the quantity-based measures tend to be chosen rather
than price-based measures because the measurements explain what we want to know
about the effects of NTBs and how many NTBs reduce trade. In general, the quantity
based measures approach uses gravity models. The second question, what are
economic impacts of the elimination of regulatory barriers on the trade of sea
transport in the scope of ASEAN 5 and China, South Korea, Japan, Australia, New
Zealand and India? The method of analysis which is used to answer the second
question is CGE model. The consideration of the use of CGE models in this study is in
http://journal.uinjkt.ac.id/index.php/signifikan 193 DOI: 10.15408/sjie.v6i2.5279
Signifikan Vol. 6 (2), Oktober 2017
line with the thinking that in the future the service sector will lead to the free market,
which is similiar to goods markets. Therefore, the interaction among economic actors
becomes complex and difficult to be understood with a partial equilibrium model, so
the use of CGE is considered to be more appropriate. In addition, the general
equilibrium approach is believed to be better in analyzing intersectoral linkages, well as
macroeconomic conditions. Moreover, it is also suitable for analyzing issues on the
foreign trade policy as stated by De Melo (1988) and Yeah et.al. (1994).
Historically, the characteristics of service industry consist a mix of “network
externalities” (such as telecommunications, finance, and transport), full of regulation
(such as communication, insurance, professional services), and also the mix of both
either naturally or because of policy barriers to entry. In the case of the services
sector, there is a margin sector which facilitate transactions among agents such as
transportation, communication, distribution (Deardorff, 2001). It implies the existence
of market power through either an oligopoly, monopoly,monopsony, or oligopsony.
Market forces will drive the price difference between companies and consumers,
between savers and investors and the economic agents that are heavily relied on
network communications and transportation. The GTAP model is modified by
changing the assumption of PC-CRTS with IC-IRTS which refers to the study by
Francois (1998). IC-IRTS in the GTAP model have been used by Pannenungi (2004) in
the case of the ASEAN free trade area with China to accommodate the greater
benefits that are sometimes not realized as a result of free trade within the trading
block or multilateral tradeThe contribution of this paper is to quantify trade barriers in
the sea transport of Indonesia with ASEAN countries and dialog partners. This case is
still rarely done by other researchers. Additionally, It is expected to be useful as the
basis for policy makers. More importantly, this paper accommodates IC-IRTS in the
GTAP model in accordance with the characteristics of the transport services
sector, which represents a mix of network externalities and full of regulation.
Services sector, such as transport services, communication, finance. distribution,
and business services have significant roles on Global Value Chain (GVC). The services
sector stands as the important part in production process and sales. In the GVC
related approach, it can be seen that the production stages were levied with Value
Trade Barrier Elimination, Economics of Scale, and...
Widyastutik, Suahasil Nazara, Rina Oktaviani, Djamester Simarmata
194 http://journal.uinjkt.ac.id/index.php/signifikan
DOI: 10.15408/sjie.v6i2.5279
Added tax (VAT). The problems of VAT in GVC has been considerd as an important
and timely topic.
The paper is organized as follows. In the following section, this paper provides
the previous quantitative studies about different methods used to estimate barriers to
trade in services and the impacts of the regulatory barriers elimination on the macro
and sectoral economic performance. Subsequently, the current condition of ASEAN
trade in services and introduction of commitment of ASEAN member and Indonesia
regulation on the sea transport are presented in the next section. Then, the following
section illustrates research methodologies, i.e. gravity model and the CGE model with
assumption of imperfect competition and improved economies of scale. The last
section of the paper shows the results and followed by a summary and conclusion for
policy-making purposes.
Some studies have estimated regulatory barriers in the services sector and
analyzed the continued impact using econometric models and general equilibrium
models. However, the estimation of regulatory barriers on the trade in ASEAN 5 sea
transport and other FTA partners using gravity models has never been done.
Moreover, there is no CGE model application that accommodates the increasing
returns to scale and imperfect competition market (IC-IRTS) in the ASEAN 5 sea
transport and FTA partners until now. The contributions of this paper are (1) The
equivalent tariff estimation of NTBs in sea transport ASEAN 5 and other FTA partners
used as the GTAP update, (2) The accommodation of increasing returns to scale and
imperfect competition market (IC-IRTS). Additionally, the author also makes
adjustments in the GTAP model derived from the 3th version used by
Francois (1998) to be implemented into the 8th version of GTAP model (with the
aggregation of countries and sectors that are more in accordance with the purposes of
the study).
METHOD
Gravity model first developed by Tinbergen (1962) that based on Isard (1954).
Several studies use gravity models to estimate the tariff equivalent of NTBs in the
services sector. One of the benefits is this model works well when bilateral trade
regressed on GDP. According to Rose (2002) standard gravity model only includes
natural logarithm of income and distance variable. The size of the market or the
http://journal.uinjkt.ac.id/index.php/signifikan 195 DOI: 10.15408/sjie.v6i2.5279
Signifikan Vol. 6 (2), Oktober 2017
economy measured by GDP, population, or GDP per capita. Besides the economic size
and the distance, there are some possible factors that affect trade such as cultural
phenomena (e.g, whether the countries share a common languages), similiar geography
(e.g., whether none, one or both are landlock), and the historical nature of the
relationship between countries (e.g., whether colonized the other one) included in the
model (Rose, 2002; Winchester, 2008).
This research also uses FTA dummy variable to capture the effect of the FTA
on membership imports in the sea services sector. Based on literature, gravity model
application for trade of goods includes these variables to measure the impacts of the
FTA, but it is not clear whether it is approproate for analyzing trade the services
sector, since most of the cooperation agreement focuses on trade in goods rather
than services. For the case of ASEAN, despite the economic integration of ASEAN
region started in 2015, liberalization negotiations of services (8 services sector) has
been started since 1995 including the transportation services sector.
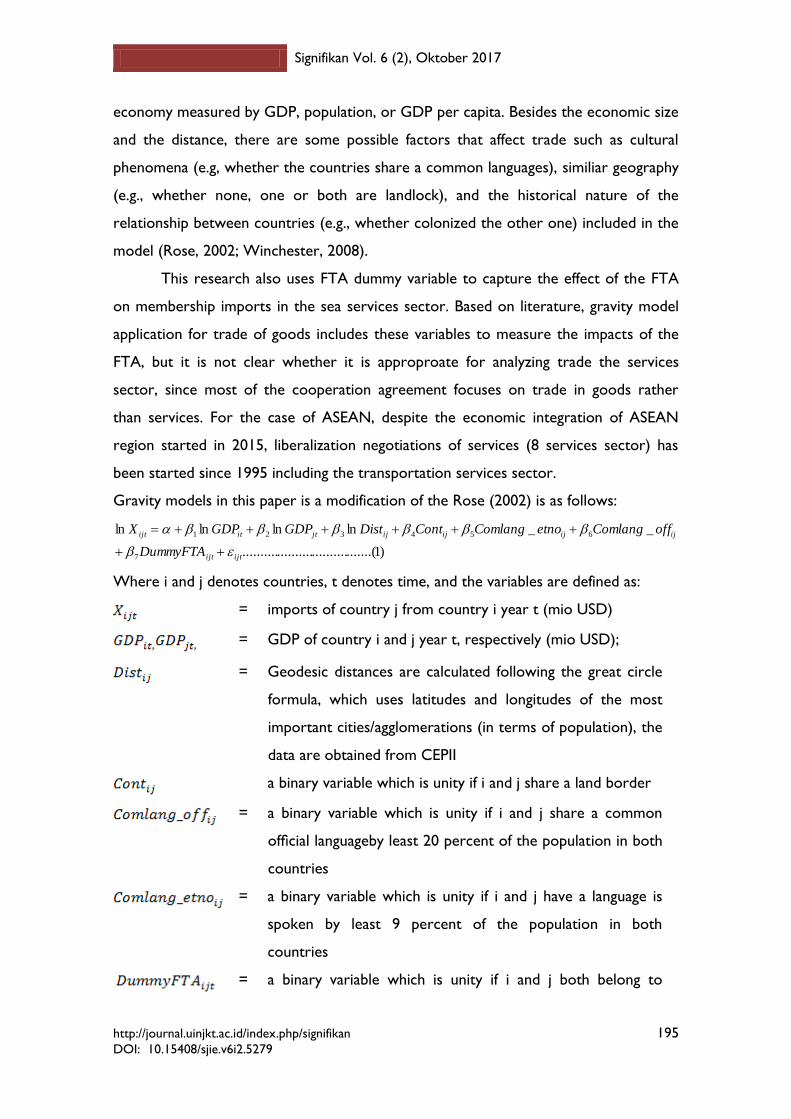
Gravity models in this paper is a modification of the Rose (2002) is as follows:
)1.......(..............................
__lnlnlnln
7
654321
ijtijt
ijijijijjtitijt
DummyFTA
offComlangetnoComlangContDistGDPGDPX
Where i and j denotes countries, t denotes time, and the variables are defined as:
= imports of country j from country i year t (mio USD)
= GDP of country i and j year t, respectively (mio USD);
= Geodesic distances are calculated following the great circle
formula, which uses latitudes and longitudes of the most
important cities/agglomerations (in terms of population), the
data are obtained from CEPII
a binary variable which is unity if i and j share a land border
= a binary variable which is unity if i and j share a common
official languageby least 20 percent of the population in both
countries
= a binary variable which is unity if i and j have a language is
spoken by least 9 percent of the population in both
countries
= a binary variable which is unity if i and j both belong to
Trade Barrier Elimination, Economics of Scale, and...
Widyastutik, Suahasil Nazara, Rina Oktaviani, Djamester Simarmata
196 http://journal.uinjkt.ac.id/index.php/signifikan
DOI: 10.15408/sjie.v6i2.5279
regional trade agreement k,
In the gravity model of sea transport services imports, the high GDP of
importing countries indicate the high level of demand for sea transport services (which
are produced by domestic and imported), while the high GDP exporting countries is
positively related to the ability to export more services. In this study, the size of the
economy on the equation of sea services import is proxied by GDP of importers and
exporters. The distance is the distance of geography. The distance between the
exporters and importers has a negative impact on trade in goods, but the empirical
results on the literature are ambiguous for the services sector case (Walsh, 2006;
Callaghan and Uprasen, 2008). Some researches indicate that the services sector is
relatively little affected by distance rather than manufactured and agriculture goods
because of its intangible characteristics.
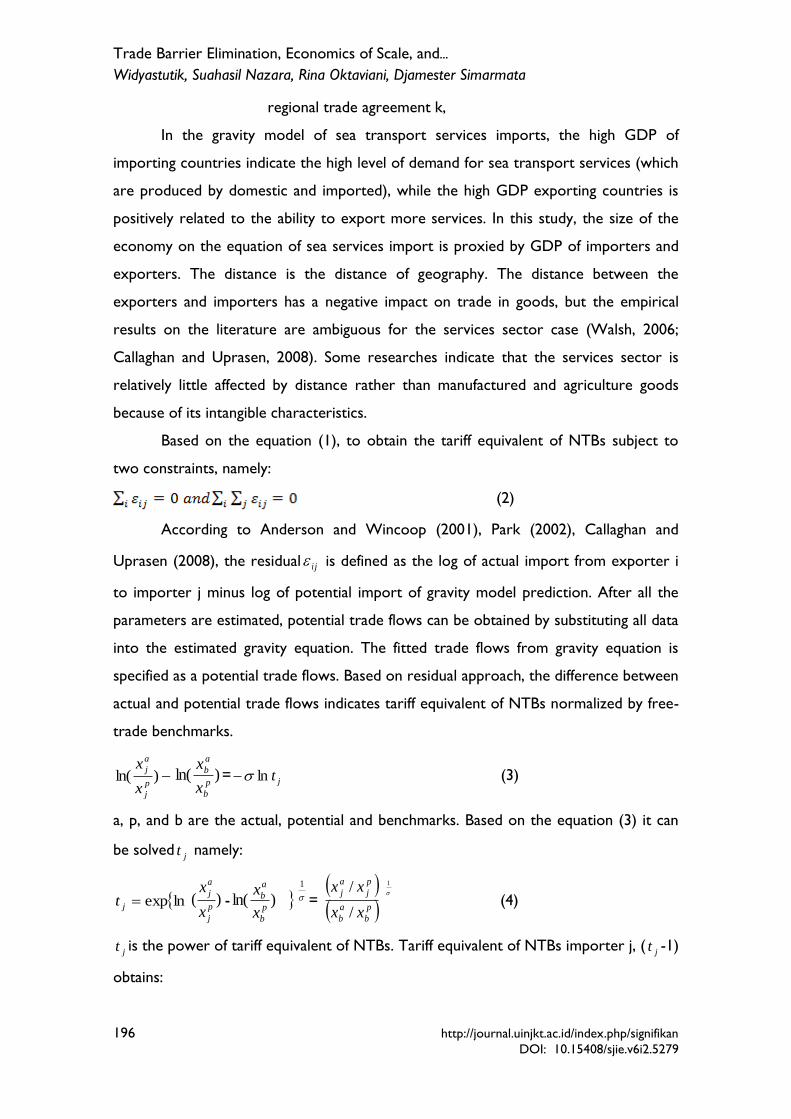
Based on the equation (1), to obtain the tariff equivalent of NTBs subject to
two constraints, namely:
(2)
According to Anderson and Wincoop (2001), Park (2002), Callaghan and
Uprasen (2008), the residual ij is defined as the log of actual import from exporter i
to importer j minus log of potential import of gravity model prediction. After all the
parameters are estimated, potential trade flows can be obtained by substituting all data
into the estimated gravity equation. The fitted trade flows from gravity equation is
specified as a potential trade flows. Based on residual approach, the difference between
actual and potential trade flows indicates tariff equivalent of NTBs normalized by free-
trade benchmarks.
)ln(p
j
a
j
x
x)ln(
p
b
a
b
x
x= jtln (3)
a, p, and b are the actual, potential and benchmarks. Based on the equation (3) it can
be solvedjt namely:
lnexpjt )(p
j
a
j
x
x- )ln(
p
b
a
b
x
x
1
= p
b
a
b
p
j
a
j
xx
xx
/
/
1
(4)
jt is the power of tariff equivalent of NTBs. Tariff equivalent of NTBs importer j, (jt -1)
obtains:

http://journal.uinjkt.ac.id/index.php/signifikan 197 DOI: 10.15408/sjie.v6i2.5279
Signifikan Vol. 6 (2), Oktober 2017
(jt -1)=
p
b
a
b
p
j
a
j
xx
xx
/
/- 1 (5)
The type of data used in the gravity model is secondary data. This panel data
combines time series and cross section data. Time series data used is the import of
sea transportand GDP in 2001, 2004, and 2007. Cross section data consist of five
ASEAN countries covering imports of Sea transport in Indonesia, Malaysia, the
Philippines, Thailand and Singapore and ASEAN partner countries, namely China,
Republic of Korea, Japan, Australia, New Zealand and India and vice versa. The
services sector in these five countries has the highest contribution to GDP. Thus these
five ASEAN countries and six countries of ASEAN partners in this study are
considered as a major trade pact because it has 1/3 of world GDP and 3.5 billion
people.
GTAP does not accommodate the specific barriers in the services sector.
Regulatory barriers associated as tariff equivalent of NTBs will be used as the update
rate in the GTAP (Malcolm, 1998). Transportation services sector is made up of a
network which is subject to monopoly/oligopoly (Matto, et.al, 2008), so this paper
modifies in the GTAP model by changing assumptions PC-CRTs with IC-IRTS which
refers to the study of Francois (1998). Next section will simulate and analyze the
economic impact of the elimination of barriers to trade regulations in the sea services
sector.
This study modifies the GTAP model assumptions to capture the behavior of
the transportation services sector due to government intervention. As a simplification,
in measuring the elasticity of demand (DELAST), Francois (1998) used non-nested
Armington assumption that import-competing goods can directly compete with
imported goods from each country. In IRTS, net scale is simply as SCALE = CDR / (1-
CDR). CDR data use the data used in Francois (1998) and Francois and Roland-Holst
(1996) so that the output scale changes can be easily obtained by multiplying the
SCALE with changes in the value added of sectors concerned. In IC implementation,
equation mark up (mu) is adapted to GTAP so we get the following equation:
(1/(1+SCALE(i,r)))/(1-CVRATIO(i,r)/DELAST(i,r)) (6)
Based on the above equation scale of economies is directly related to the
mark-up. The main elements of the markup is found on CVRATIO (i, r), which is a
Trade Barrier Elimination, Economics of Scale, and...
Widyastutik, Suahasil Nazara, Rina Oktaviani, Djamester Simarmata
198 http://journal.uinjkt.ac.id/index.php/signifikan
DOI: 10.15408/sjie.v6i2.5279
conjectural variation per number of firm- from 0 (for the PC) to 1 (for Monopoly) and
DELAST (i, r). DELAST depends on the market share (ZETA) and Armington
Domestic Demand Elasticity of Substitution (CESUBD). Francois (1998) treated mark-
ups as taxes that affect the price and quantity as below:
ps(i,r) = to(i, r) +pm (i,r)-mu(i,r) (7) or
pm(i,r) = ps(i,r) – to (i,r)+mu(i,r) (8)
The price mechanism that higher than mark-ups affects output and other
variables. The change from CRTS to IRTS is done by changing the SCALE = 0 become
SCALE = CDR / (1-CDR). While the change from the PC into the IC is done by
changing CVRATIO from 0 to greater than 0. Data change is done by changing
GTAPDAT.HAR or Header Array file which is used for GEMPACK. The equation used
to endogenized and calculate the price markups over marginal cost includes in the
GTAP Technical Paper No. 14 provided in the form of a zip file and as the experiment
conducted by Francois (1998), while the experiment of Elbehri and Hertel (2004) is
available in IRTSPROF version. All sectors are treated as oligopolistic with scale
economics, while agricultural is assumed to be perfectly competitive for purpose of
this study.
There are two stages to perform the region and sector aggregation. First, we
compile the aggregation-mapping file between sectors contained in the standard GTAP
model with the desired sector in the research. Second, the mapping processed with
DataAgg program of the 8th version GTAP so that resulted header array files,
parameters, and settings matching to the aggregation of sectors and regions desired.
One contribution of this study is limited to make adjustments on the GTAP model
derived from 3rd version used by Francois (1998) to be implemented the 8th version
GTAP model (with more country and sector aggregation in accordance with the
purposes of the study) and to update sea transport sector services tariffs. The value of
CDR and Conjectural Variation (CV) ratio is adjusted with the aggregation of sectors
and regions, referring to Francois (1998), Francois and Roland-Holst (1997), and
Elbehri and Hertel (2004). The contribution of this research are: (1) The 3rd version
GTAP model used Francois (1998) is implemented in the 8th version GTAP model, (2)
the GTAP data base does not accommodate barriers in the services sector so we
update the sea transport tariffs.
http://journal.uinjkt.ac.id/index.php/signifikan 199 DOI: 10.15408/sjie.v6i2.5279
Signifikan Vol. 6 (2), Oktober 2017
In this study, excessive regulation is indicated as a tariff equivalent of NTBs that
in the GTAP is equivalent with import tariffs (tms). Therefore the simulation applied in
the GTAP is the elimination of regulatory cost barriers. This elimination is equivalent
to the elimination of import tariffs - tms (i, r, s) that is reciprocally all of regions.
RESULT AND DISCUSSION
Empirical Result of Gravity Equation and The Tariff Equivalent of NTBs
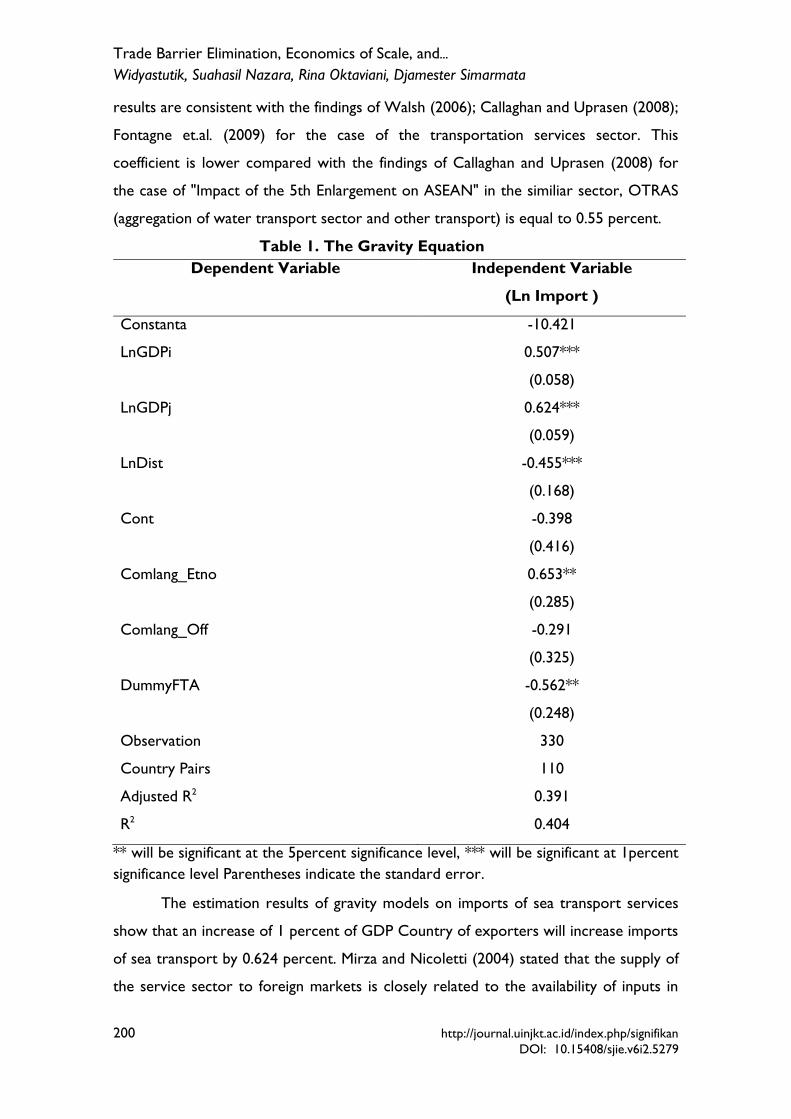
The estimation results of REM in bilateral trade flows by across country gravity
equation models in the sea transport are presented in Table 1. The coefficient of R2 is
0.404 percent. This result indicates two things: (1) economic variables in the gravity
equation of sea transport imports are less able to explain the pattern of trade
properly, (2) the small value of R2 shows that there are non-economic variables that
affects trade. This condition indicates the magnitude of the intervention on the import
of sea services sector. R2 coefficient of sea transport import in this paper is smaller
than the studies of Park (2002), Walsh (2006), and Callaghan and Uprasen (2008),
Fontagne et al. (2011). Considering to protect the domestic industry, the country
often intervene with the implementation of the regulatory barriers policies for the
services sector both in the form of barriers to market access and national treatment as
well as the implementation of the Cabotage Principle. Cabotage is the principle of
discriminatory policies against foreign suppliers and the protection against domestic
transport services. This principle is indicated to affect market access so that the
provision of sea transport by foreigners to be down. This regulatory affects the volume
of transactions, number of operators, and number of labor and foreign capital
ownership which will affect services exports and imports of both goods and other
services.
Based on the estmationmates, GDP variable of importers and exporters, the
distance, and ASEAN dummy variables significantly influence the import of the sea
transport on the significance level of 1 percent, while Comlang_etno variable is
significant at 5 percent significance level. The estimation results of gravity models on
imports of sea transport show that an increase of 1 percent of GDP Country
importers will increase imports of sea transport services amounting to 0.507 percent.
On the other hand,demand size indicated by the high GDP of importers state shows
the high demand for sea transport (both produced by domestic and imported). These
Trade Barrier Elimination, Economics of Scale, and...
Widyastutik, Suahasil Nazara, Rina Oktaviani, Djamester Simarmata
200 http://journal.uinjkt.ac.id/index.php/signifikan
DOI: 10.15408/sjie.v6i2.5279
results are consistent with the findings of Walsh (2006); Callaghan and Uprasen (2008);
Fontagne et.al. (2009) for the case of the transportation services sector. This
coefficient is lower compared with the findings of Callaghan and Uprasen (2008) for
the case of "Impact of the 5th Enlargement on ASEAN" in the similiar sector, OTRAS
(aggregation of water transport sector and other transport) is equal to 0.55 percent.
Table 1. The Gravity Equation
Dependent Variable Independent Variable
(Ln Import )
Constanta -10.421
LnGDPi 0.507***
(0.058)
LnGDPj 0.624***
(0.059)
LnDist -0.455***
(0.168)
Cont -0.398
(0.416)
Comlang_Etno 0.653**
(0.285)
Comlang_Off -0.291
(0.325)
DummyFTA -0.562**
(0.248)
Observation 330
Country Pairs 110
Adjusted R2 0.391
R2 0.404
** will be significant at the 5percent significance level, *** will be significant at 1percent
significance level Parentheses indicate the standard error.
The estimation results of gravity models on imports of sea transport services
show that an increase of 1 percent of GDP Country of exporters will increase imports
of sea transport by 0.624 percent. Mirza and Nicoletti (2004) stated that the supply of
the service sector to foreign markets is closely related to the availability of inputs in
http://journal.uinjkt.ac.id/index.php/signifikan 201 DOI: 10.15408/sjie.v6i2.5279
Signifikan Vol. 6 (2), Oktober 2017
both the domestic and foreign markets. GDP of exporters boosts the capacity for
production, which will further increase the export of sea transport services. This is
consistent with the characteristics of the services sector. The country that has a high
GDP will produce the services product. Hayami and Godo (2005) stated that the
economic activity of developed countries (advanced economies) would shift from the
industrial sector to the service sector in response to high economic growth.
Distance has a negative and significant relationship at the level of 1 percent on
the exports and imports of sea transport. This negative relationship is consistent with
research of Lejour, et.al. (2001) for the case of the EU, Park (2002), Fontagne, et al.
(2009) for the case of the sea transport, but has a different direction with the findings
of Walsh (2006) and Fontagne et al. (2011). Some studies show an ambiguous effect in
the service sector, because the product does not physically transport services from
one location to another. However, given the transport sector is the service sector that
is relatively physically transport goods from one location to another, then in this model
range has a negative relationship with the import of sea transport.
At least 9 percent of common language used by the two countries increase
trade, as it shows an economically and statistically significant relationship. Language has
been found to be significant in gravity model assessments of sea transport trade flows
and this effect could be expected to be particularly strong in services, as common
language should greatly facilitate many transactions. There is an evidence to suggest
that a common language variable may also capture other effects such as cultural or
institutional similarities between countries. This should be borne in mind when
interpreting the results of the model. Instead of at least 20 percent similarity language
used by residents and the border between the two countries do not significantly
increase trade. Although the five ASEAN countries are still in Malaysia, but only
Malaysia and Indonesia, which have a similar language. Therefore Comlang_etno is
more significant than Comlang_off. Likewise for sharing the border, only Indonesia has
borders with Singapore and Malaysia. The other five ASEAN members do not have
borders with other FTA partner countries. Rose (2002); and Walsh (2006); Fontagne,
et al. (2011) only use common languages variable that indicates the value of one if the
two countries share a common (official) language and zero otherwise. Research results
of Rose (2002) showed that sharing a language increase of trade by economically and

Trade Barrier Elimination, Economics of Scale, and...
Widyastutik, Suahasil Nazara, Rina Oktaviani, Djamester Simarmata
202 http://journal.uinjkt.ac.id/index.php/signifikan
DOI: 10.15408/sjie.v6i2.5279
statistically significant amounts. While studies Fontagne, et al. (2011) showed on
average, a common language appears to have a positive effect on trade while, belonging
to the same zone, such as ASEAN (bilsa) or Latin America (Bilac), does not favor trade
between countries. Although rather counterintuitive, this result demonstrates that
trade in services mainly concerns developed country pairs or pairs with at least one
developed country partners. The exception is that the business services sector (obs) in
Asia (well documented in the literature), which shows a positive impact of free-trade
agreements on trade. Walsh study (2006) showed the dummy of common languages
does not significantly increase trade in transport services sector.
DummyFTA is used to capture the effects of membership of a country in FTA
cooperation in sea transport services exports equation. DummyFTA significantly and
negatively affects the imports of the sea transport. Significance of FTA membership in
the equation of the sea transport import because the value of transportation services
is closely linked to trade in physical goods that most liberalized in ASEAN and FTA
partners. Negative sign indicates that the demand for goods trade is not capable for
causing "knock on effect" in import of sea transport services. The significance of
dummyFTA is consistent with research of Walsh (2006) in the case of transport
services for Europa Union (EU) membership, but it has different sign. The EU
membership has a positive impact on trade in goods that implies the existence of "a
knock-on effect" on the demand for goods transport services in the EU. The negative
sign is in line with research of Uprasen and Callaghan and Uprasen (2008) for dummy
CEECS in the case of air transport services.
Furthermore, the predictive model of sea transport services import equation is
used to calculate regulatory barriers as tariff equivalents of NTBs. The elasticity of
subsitution refers to the previous research from Francois (2001) which uses 1.26 as
the elasticity of the services sector trade. Free trade benchmark is the import of
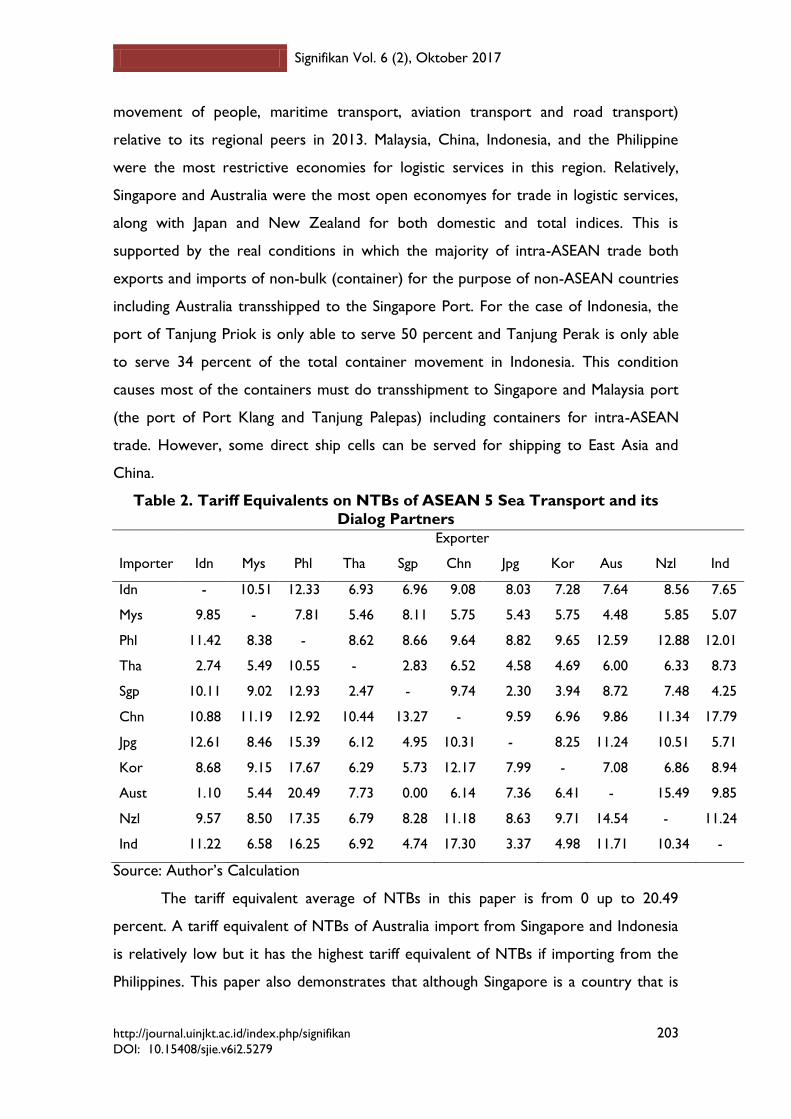
Australia from Singapore. Table 2 shows the tariff equivalents of NTBs in equation of
five ASEAN transport services sectors imports and other FTA partners.
The Tariff equivalents of NTBs in sea transport imports between Australia and
Singapore have the lowest value. This is consistent with Wong and Hollweg (2015)
asSingapore continued to have the most efficient regulations and procedures in the
logistic sectors (six primary categories of restrictions on customs, investment,
http://journal.uinjkt.ac.id/index.php/signifikan 203 DOI: 10.15408/sjie.v6i2.5279
Signifikan Vol. 6 (2), Oktober 2017
movement of people, maritime transport, aviation transport and road transport)
relative to its regional peers in 2013. Malaysia, China, Indonesia, and the Philippine
were the most restrictive economies for logistic services in this region. Relatively,
Singapore and Australia were the most open economyes for trade in logistic services,
along with Japan and New Zealand for both domestic and total indices. This is
supported by the real conditions in which the majority of intra-ASEAN trade both
exports and imports of non-bulk (container) for the purpose of non-ASEAN countries
including Australia transshipped to the Singapore Port. For the case of Indonesia, the
port of Tanjung Priok is only able to serve 50 percent and Tanjung Perak is only able
to serve 34 percent of the total container movement in Indonesia. This condition
causes most of the containers must do transshipment to Singapore and Malaysia port
(the port of Port Klang and Tanjung Palepas) including containers for intra-ASEAN
trade. However, some direct ship cells can be served for shipping to East Asia and
China.
Table 2. Tariff Equivalents on NTBs of ASEAN 5 Sea Transport and its
Dialog Partners
Importer
Exporter
Idn Mys Phl Tha Sgp Chn Jpg Kor Aus Nzl Ind
Idn - 10.51 12.33 6.93 6.96 9.08 8.03 7.28 7.64 8.56 7.65
Mys 9.85 - 7.81 5.46 8.11 5.75 5.43 5.75 4.48 5.85 5.07
Phl 11.42 8.38 - 8.62 8.66 9.64 8.82 9.65 12.59 12.88 12.01
Tha 2.74 5.49 10.55 - 2.83 6.52 4.58 4.69 6.00 6.33 8.73
Sgp 10.11 9.02 12.93 2.47 - 9.74 2.30 3.94 8.72 7.48 4.25
Chn 10.88 11.19 12.92 10.44 13.27 - 9.59 6.96 9.86 11.34 17.79
Jpg 12.61 8.46 15.39 6.12 4.95 10.31 - 8.25 11.24 10.51 5.71
Kor 8.68 9.15 17.67 6.29 5.73 12.17 7.99 - 7.08 6.86 8.94
Aust 1.10 5.44 20.49 7.73 0.00 6.14 7.36 6.41 - 15.49 9.85
Nzl 9.57 8.50 17.35 6.79 8.28 11.18 8.63 9.71 14.54 - 11.24
Ind 11.22 6.58 16.25 6.92 4.74 17.30 3.37 4.98 11.71 10.34 -
Source: Author’s Calculation
The tariff equivalent average of NTBs in this paper is from 0 up to 20.49
percent. A tariff equivalent of NTBs of Australia import from Singapore and Indonesia
is relatively low but it has the highest tariff equivalent of NTBs if importing from the
Philippines. This paper also demonstrates that although Singapore is a country that is
Trade Barrier Elimination, Economics of Scale, and...
Widyastutik, Suahasil Nazara, Rina Oktaviani, Djamester Simarmata
204 http://journal.uinjkt.ac.id/index.php/signifikan
DOI: 10.15408/sjie.v6i2.5279
traditionally open to trade, but it has the high tariff barriers equivalent of NTBs for
imports from the Philippines and Indonesia.
The value of tariff equivalent of NTBs in this study is not much different from
the findings of Park (2002). Study of Park (2002) using data from the 5th version GTAP
in the transport services sector showed that Singapore also becomes the benchmark
country. Tariff equivalent of NTBs in the sea transport for some countries are
Indonesia at 22.52 percent, Malaysia and Thailand amounted to 15.72 percent, the
Philippines at 17.43 percent, China amounted to 28.44 percent, Australia at 16.45
percent, New Zealand at 6.15 percent, Japan at 18.17 percent, Korea amounted to
8.73 percent, and India at 32.93 percent.
However the study results of Walsh (2006) using the service imports sourced
from the OECD's statistics on international trade in services showed the relatively
higher average of import tariff. Indonesia has an average import tariff equivalent of
124.8 percent, Malaysia amounted to 119.6 percent, Philippines amounted to 122.7
percent, Singapore at 83.5 percent, Thailand amounted to 120.9 percent, New Zealand
amounted to 82.8 percent, Australia amounted to 56.3 percent, China amounted to
121.3 percent, and India amounted to 113.7 percent. The tariff equivalent of NTBs of
Japan is 0. Callaghan and Uprasen (2008) study showed that the tariff equivalent of
NTBs of OTRAS (other transport and water transport) sector is lower when the EU-
15 as an importer than the CEECs-10 as an importer. Tariff equivalent of NTBs EU-15
as importers is amounted to 6.72 percent and the CEECs-10 as the importer is
amounted to 45.80.
The Simulation Result of CGE Model
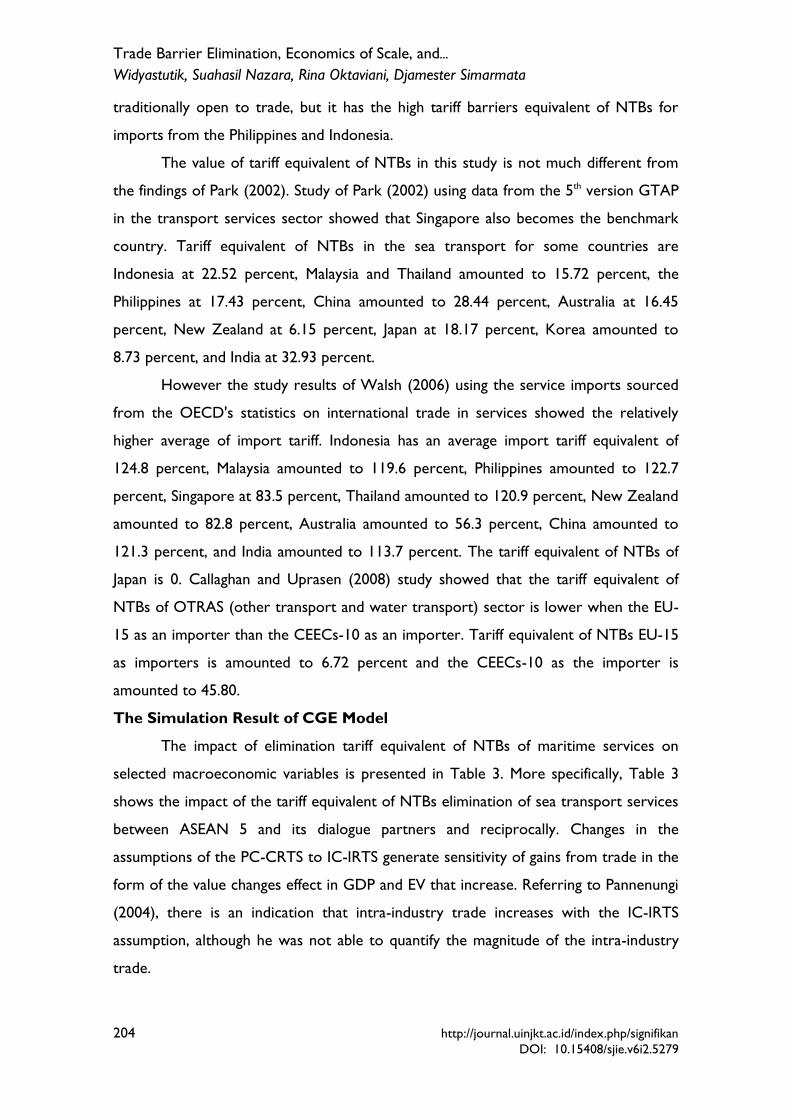
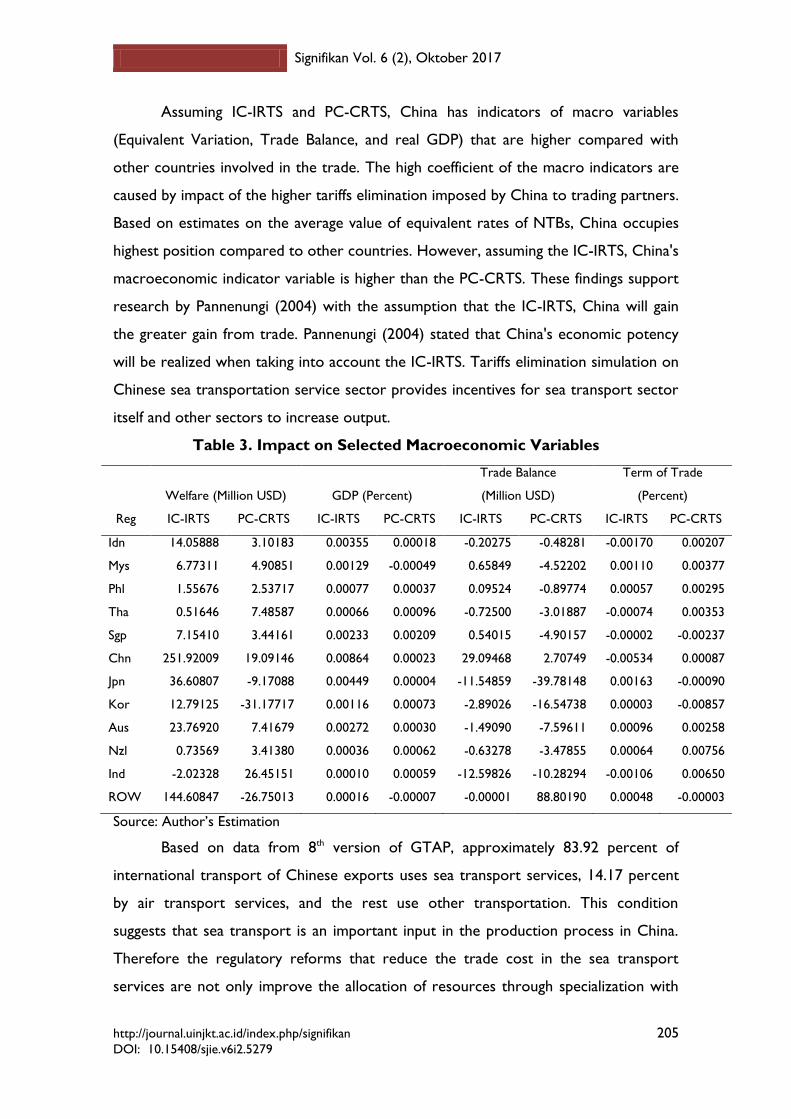
The impact of elimination tariff equivalent of NTBs of maritime services on
selected macroeconomic variables is presented in Table 3. More specifically, Table 3
shows the impact of the tariff equivalent of NTBs elimination of sea transport services
between ASEAN 5 and its dialogue partners and reciprocally. Changes in the
assumptions of the PC-CRTS to IC-IRTS generate sensitivity of gains from trade in the
form of the value changes effect in GDP and EV that increase. Referring to Pannenungi
(2004), there is an indication that intra-industry trade increases with the IC-IRTS
assumption, although he was not able to quantify the magnitude of the intra-industry
trade.
http://journal.uinjkt.ac.id/index.php/signifikan 205 DOI: 10.15408/sjie.v6i2.5279
Signifikan Vol. 6 (2), Oktober 2017
Assuming IC-IRTS and PC-CRTS, China has indicators of macro variables
(Equivalent Variation, Trade Balance, and real GDP) that are higher compared with
other countries involved in the trade. The high coefficient of the macro indicators are
caused by impact of the higher tariffs elimination imposed by China to trading partners.
Based on estimates on the average value of equivalent rates of NTBs, China occupies
highest position compared to other countries. However, assuming the IC-IRTS, China's
macroeconomic indicator variable is higher than the PC-CRTS. These findings support
research by Pannenungi (2004) with the assumption that the IC-IRTS, China will gain
the greater gain from trade. Pannenungi (2004) stated that China's economic potency
will be realized when taking into account the IC-IRTS. Tariffs elimination simulation on
Chinese sea transportation service sector provides incentives for sea transport sector
itself and other sectors to increase output.
Table 3. Impact on Selected Macroeconomic Variables
Reg
Welfare (Million USD) GDP (Percent)
Trade Balance
(Million USD)
Term of Trade
(Percent)
IC-IRTS PC-CRTS IC-IRTS PC-CRTS IC-IRTS PC-CRTS IC-IRTS PC-CRTS
Idn 14.05888 3.10183 0.00355 0.00018 -0.20275 -0.48281 -0.00170 0.00207
Mys 6.77311 4.90851 0.00129 -0.00049 0.65849 -4.52202 0.00110 0.00377
Phl 1.55676 2.53717 0.00077 0.00037 0.09524 -0.89774 0.00057 0.00295
Tha 0.51646 7.48587 0.00066 0.00096 -0.72500 -3.01887 -0.00074 0.00353
Sgp 7.15410 3.44161 0.00233 0.00209 0.54015 -4.90157 -0.00002 -0.00237
Chn 251.92009 19.09146 0.00864 0.00023 29.09468 2.70749 -0.00534 0.00087
Jpn 36.60807 -9.17088 0.00449 0.00004 -11.54859 -39.78148 0.00163 -0.00090
Kor 12.79125 -31.17717 0.00116 0.00073 -2.89026 -16.54738 0.00003 -0.00857
Aus 23.76920 7.41679 0.00272 0.00030 -1.49090 -7.59611 0.00096 0.00258
Nzl 0.73569 3.41380 0.00036 0.00062 -0.63278 -3.47855 0.00064 0.00756
Ind -2.02328 26.45151 0.00010 0.00059 -12.59826 -10.28294 -0.00106 0.00650
ROW 144.60847 -26.75013 0.00016 -0.00007 -0.00001 88.80190 0.00048 -0.00003
Source: Author’s Estimation
Based on data from 8th version of GTAP, approximately 83.92 percent of
international transport of Chinese exports uses sea transport services, 14.17 percent
by air transport services, and the rest use other transportation. This condition
suggests that sea transport is an important input in the production process in China.
Therefore the regulatory reforms that reduce the trade cost in the sea transport
services are not only improve the allocation of resources through specialization with
Trade Barrier Elimination, Economics of Scale, and...
Widyastutik, Suahasil Nazara, Rina Oktaviani, Djamester Simarmata
206 http://journal.uinjkt.ac.id/index.php/signifikan
DOI: 10.15408/sjie.v6i2.5279
comparative advantages, but also significantly contributes as a "knock on effect" in the
economy. Research conducted Limao and Venables (2000) showed that the increase in
the quality of infrastructure can reduce transportation costs by 40 percent for the
country surrounded by sea and 60 percent for landlocked countries. Efficiency in port
reduces shipping costs more than 12 percent, equivalent to a distance of 5000 Miles.
This is evidenced by China. The transportation sector becomes supporting
infrastructure in international trade since 1990. Regulatory reform affects the
production of the transportation services sector. Development of the world's cargo is
currently around 80 percent and it is mostly transported by ship. China is able to take
advantage of these conditions. China port capacity increased from 300 million tons in
1985 to 2.9 billion tons in 2005. In 2011 the Port of Shanghai (China) ranked first with
traffic cargo loading as many as 29 million Twenty Equivalent Units (TEUs) and Ningbo-
Zhoushan (China) ranked second. Since 2002, China has been reforming its economy
towards the third stage of the socialist economy. This reform is a form of a reduction
in control on the market and prices for more products, and hence most products are
determined by market. The scope of enhanced performance is the administration
thereby providing good services to the market. As the impact at the end of 2007, 64.3
percent of China's products are market-determined, whereas in 1992 the government
determines almost 90 percent of China’s products. Because of the trade openness, the
percentage of China's trade to GDP in 1999 amounted to 37.97 percent and rose
sharply in 2008 amounted to 62.09 percent (World Development Indicators, 2010). A
policy called "open policy" (kaifang) is a policy that is very different from the policy of
Mao Zedong.
Pannenungi (2004) stated, with IC-IRTS assumption that China's gain is smaller
than ASEAN in the ACFTA. Using data from 8th version of GTAP, the question of why
the Chinese are interested in the benefits of ACFTA although relatively smaller
compared with ASEAN has been missed. Economic factors remain a consideration for
China why are interested in ACFTA. China look forward to the future that ASEAN has
the endowments for production (natural resources and cheap labor), additionally the
market is considered as the entry point to trade with other countries. Assuming IC-
IRTS, the regulatory reform in the sector of sea transport services benefit China more
than in the five ASEAN countries as well as other ASEAN trading partners. China has
http://journal.uinjkt.ac.id/index.php/signifikan 207 DOI: 10.15408/sjie.v6i2.5279
Signifikan Vol. 6 (2), Oktober 2017
predicted that Indonesia together with Philippines and Japan as an island nation located
in the Asia Pacific region has a key role in the growth in this region (Asian
Development Bank and World Bank, 2000). This economic potency has strategic value,
in line with the shifting center of world economic activity since the end of the 20th
century from the Atlantic to Asia-Pacific. Trade of Asia-Pacific countries nearly 70
percent of total world trade and more than 75 percent of traded goods transported by
sea, especially through the Malacca Strait, Lombok Strait, Makassar Strait, and other
Indonesia sea. ASEAN countries, especially Indonesia is the entrance to trade with
Asia-Pacific countries and others.
Assuming IC-IRTS, respectively Japan, Australia and Indonesia is the next
country after China, which has a high welfare with regulatory reform in the sea
transport services sector. In terms of the increase in real GDP, Indonesia ranked
second after China followed by Australia. Other ASEAN countries that have high
welfare and real GDP are Singapore and Malaysia. Increased welfare and the country's
real GDP show that sensitivity of gain is greater when the regulatory reform in the sea
transport services sector with the IC-IRTS assumption. Alejandro et al. (2010) showed
that the main ports in Southeast Asia (except Indonesia's Tanjung Priok port) are
Singapura, Klang and Tanjung Palepas in Malaysia. IC-IRTS assumptions encourage
monopolists to lead to a competitive price so that output expands higher than the PC-
CRTS assumptions.
The elimination of regulatory barriers in the services sector of sea
transportation affects the welfare, the trade balance and terms of trade of India. The
impact of the decline in welfare in India with IC-IRTS assumption is in line with
research of Elbehri and Hertel (2004) for the case of the EU-Morocco FTA. EU-
Morocco FTA shows that the implementation of general equilibrium with oligopoly and
economies of scale in the case of the EU-Morocco FTA gives adverse impact on
Morocco, worsening terms of trade, reducing the output of the company in an industry
dominated by economies of scale, the occurrence of trade diversion import costs
which is relatively lower to non-EU suppliers, and worsening the aggregate demand for
labor. Value changes in China's total trade balance showed a surplus, which is very high
in the event of changes in assumptions of PC-CRTS to IC-IRTS. Assuming IC-IRTS,
ASEAN countries that have a surplus balance of trade are Malaysia, Singapore, and
Trade Barrier Elimination, Economics of Scale, and...
Widyastutik, Suahasil Nazara, Rina Oktaviani, Djamester Simarmata
208 http://journal.uinjkt.ac.id/index.php/signifikan
DOI: 10.15408/sjie.v6i2.5279
Philippines. On the oter hand, the balance of trade of Indonesia, Thailand and other
countries are deficit. The negative value changes of the trade balance in several
countries including Indonesia show that strength of Indonesian export supply has not
been able to respond an opportunities of trade barriers elimination. Elimination policy
of trade barriers in the form of duties is more potential to increase the growth rate of
imports than exports. Assuming IC-IRTS, in the case of Indonesia's trade balance only
sector of sea transport services, textile and wearing apparel, trade, and utility
construction has a positive trade balance. Referring to the term used by Pannenungi
(2004), these three sectors are winner sectors in the event of regulatory barriers
elimination of sea transport services sector, while other sectors are losers sectors.
Assuming IC-IRTS, Indonesia, Singapore, Thailand, India and even China have
decreased the TOT. When the trade liberalization is imposed, the effect of the
economics of scale and market competition is the increase of imports from foreign
services providers. These conditions encourage the monopolist to lead to a
competitive price. Under more complex specifications of market forces and industry
structure, pro-competitive effects relate to increased economies of scale and
decreased cost. This condition explains that export prices decrease relatively to
import prices in IC-IRTS condition. The largest decline of terms of trade occurs in
China. This condition shows that pro-competitive effects related to increased
economies of scale and cost-down in China is greater than in other countries.
Impacts on The Structure of Production
Assuming IC-IRTS, the elimination of regulatory barriers in sectors of sea
transport services only provides incentives increased output in the four sectors in
Indonesia. In addition to sea transport sector (0.18282 percent), textiles and apparel
(0.37481 percent), utility_construction (0.00039 percent), as well as trade (0.00448
percent), other sectors experience a contraction. The sectors that experienced the
highest output contraction are heavy-manufacture (petroleum, coal product; chemical,
rubber, plastic products; mineral product; ferrous metal; metals; metal product;
electronic equipment; machinery and equipment. Import of heavy-manufacturing of
Indonesia from ASEAN countries and dialogue partners increase. The threats of
imports are not able to provide incentives for the monopolist in Indonesia to boost

http://journal.uinjkt.ac.id/index.php/signifikan 209 DOI: 10.15408/sjie.v6i2.5279
Signifikan Vol. 6 (2), Oktober 2017
output. Pro-competitive effects do not occur in heavy-manufacturing sector and other
sector contracted.
These sectors are food processing, utility construction, other transport and
other services. This condition is different from other ASEAN countries. Assuming IC-
IRTS, the output in almost all sectors in Malaysia has expanded. The sectors that have
expanded in Malaysia are agriculture, mining, food processing, light manufacturing,
heavy manufacturing, sea transport, air transport, other transport, communication, and
other services. The rest experiences contraction. The number of sectors that have
been experience expansion in Thailand, Singapore, and the Philippines are higher in
comparison to the sectors in Indonesia. This condition shows that Indonesian sea
transport sector has not been able to become a "knock on effect" for all sectors in the
economy compared to other ASEAN countries.
Figure 2. Trade of Intra and Extra ASEAN Services Sector
Source: ASEAN Secretariat, 2014
ASEAN trade services sector has increased both in the scope of the intra and
extra ASEAN during the period 2005 to 2011 except 2008. However extra ASEAN
trade in services is more dominating than the intra ASEAN. The progress of services
trade intra and extra ASEAN can be seen in Figure 2. Transportation, travel, and other
business services subsectors accounted for the majority of ASEAN’s service exports
and imports. These three sectors comprised 85% of total service exports and 80% of
imports in 2011. Exports of transportation, travel, and other business services
subsectors increased in 2007 until 2008 and decreased in 2009 because of global
financial crisis in 2008. Financial services and computer and information services also
played a large role in ASEAN services trade.
Trade Barrier Elimination, Economics of Scale, and...
Widyastutik, Suahasil Nazara, Rina Oktaviani, Djamester Simarmata
210 http://journal.uinjkt.ac.id/index.php/signifikan
DOI: 10.15408/sjie.v6i2.5279
One of the key pillars of the AEC Blueprint is the free flow of trade in services.
The AEC Blueprint focuses on five priority services sectors. They are air transport, e-
ASEAN, health and care, tourism, and logistics services. In transport services, most
ASEAN countries have taken a relatively liberal approach to many aspects of maritime
regulation, but none meet the Blueprint target of allowing at least 51% foreign
ownership by 2010 in all sea transport services. Shepherd and Pasadilla (2012) also find
that most countries have not met the minimum foreign ownership requirement for
logistics services. The AEC Blueprint target stipulates air transport services that
foreign ownership limits to be raised to 70 % by 2010, for domestically established air
transport services companies. Effective liberalization of trade in air transport services
requires the reform of both investment laws and withholding clauses in air transport
services agreements; substantial ownership by an ASEAN community of interests
rather than substantial domestic ownership is thus the target for this sector.
CONCLUSION
Using residual approach of gravity models, the average tariff equivalent of NTBs
in marine transportation service sector of member countries of ASEAN 5 and dialogue
partners ranges from 0% to 20.49%. In line with the pro-competitive effects theory of
trade policy, the simulation results in this paper show the greater gain from trade
obtained in CGE models assuming IC-IRTS compared to PC-CRTS. Assuming IC-IRTS,
China becomes the winner indicated by the highest increase in welfare and GDP
followed by Japan and Australia. In total, value changes in China's trade balance had a
very high surplus when PC-CRTS assumptions are changed becomes IC-IRTS.
Assuming IC-IRTS, Indonesia followed by Malaysia and Singapore are the ASEAN-5
countries that have a high level of welfare because of the elimination of barriers to
trade regulations of marine transportation services. Based on the pro-competitive
effects in the case of small countries, the elimination of import tariff equivalent on
marine transport services sector will improve the welfare higher than the assumptions
PC-CRTs. This condition shows that the impact of the elimination of barriers to trade
regulations in marine transportation services sectors of Indonesia only provides
incentives to increase output and export performance in the services sector of marine
transportation, textile and wearing apparel, trade, and utility construction. Indonesian
http://journal.uinjkt.ac.id/index.php/signifikan 211 DOI: 10.15408/sjie.v6i2.5279
Signifikan Vol. 6 (2), Oktober 2017
marine transport services sector has not been able to become a "knock on effect" in
the economy.
Estimation result of tariff equivalents of NTBs shows that regulatory barriers in
the sea transport sector of ASEAN-5 and the dialogue partner country is still high.
ASEAN member countries have significant difference of commitment. To fulfill the
agreement in the AEC Blueprint, some ASEAN members still must strive to achieve
the targets that have been agreed. ASEAN has a variety of capacities and priorities for
each of the services sector. Members of ASEAN such as Singapore are very liberal and
advocated free market access. On the other hand, countries such as Indonesia, the
Philippines, and Thailand have large domestic market, which tends to be protected.
The success of regulatory reform in the marine transportation services sectors of
ASEAN-5 and dialogue partners depends on the political will of the governments of
each country to fulfill the AEC Blueprint agreement. Regulatory reform in the sea
transport services sector is highly relevant to the efficiency of the regional supply
chain. The efforts needed consist: Firstly, enhancing ASEAN trade facilitation and
dialogue partners. The cooperation between ASEAN countries and dialogue partner is
needed to overcome regulatory externalities such as differences in regulations related
to the standards that will reduce the gain from trade as the international oligopoly in
the trade of marine transportation services. Secondly, members of ASEAN and its
dialogue partners should optimize the implementation of National Single Windows
ASEAN.
Increasing the dwelling time at the port causes negative impacts to the
economy, namely: First, reducing competitiveness. Delays will hamper the efforts of
Indonesia to become an integrated part of the global supply chain, Second, increasing
cost. Low productivity means the ship will lean time in the ports. The longer the time
to lean, the higher direct operating costs and the opportunity cost. Accommodative
deregulation of port and restructuring of the order of port becomes the primary
consideration for improving the management of port of ASEAN countries in general
and Indonesia in particular. Fair competition climate will be able to realize a modern
port services and global competitiveness. Modernization of port facilities and improving
the quality of service performance of port will provide multiplier effects in other
sectors, so that the expectations of higher national economic growth will be achieved.
Trade Barrier Elimination, Economics of Scale, and...
Widyastutik, Suahasil Nazara, Rina Oktaviani, Djamester Simarmata
212 http://journal.uinjkt.ac.id/index.php/signifikan
DOI: 10.15408/sjie.v6i2.5279
REFERENCES
Anderson, J.E. & E.V. Wincop. (2001). Gravity with Gravitas: A Solution to the Border
Puzzle. NBER Working Paper No.8079.
Callaghan, B., A. & U. Uprasen. (2008). Impact of the 5th EU Enlargement on ASEAN.
Euro-Asia Centre (EAC), Working Paper. Ireland: Kemmy Business School
University of Limerick, Ireland.
Dee, P., K. Hanslow. & T. Phamduc. (2003). Measuring the cost of barriers to trade in
services, in Ito, T. and Krueger, A. (eds), Services Trade in the Asia-Pacific
Region. NBER-East Asia Seminar on Economics, Volume 11, University of Chicago
Press, Chicago, pp. 11–43.
De Melo, J. (1988). CGE Models for The Analysis of Trade Policy in Developing
Countries. Policy Research Working Paper Series 3, The World Bank.
Elbehri, A., & T. Hertel. (2004). A Comparative Analysis of The EU-Morocco FTA vs
Multilateral Liberalization. GTAP Working Paper No.30. Revised 2006. Center for
Global Trade Analysis, Purdue University.
Francois, J.F. (1998). Scale Economies and Imperfect Competition in the GTAP Model.
GTAP Technical Paper No. 14.
Francois, J. (2001). The Next WTO Round: North-South Stakes in New Market Access
Negotiations. Adelaide: Centre for International Economic Studies.
Francois, J.F., dan D.W. Roland-Host. (1996). Trade Policy, Scale Economies and Imperfect
Competition in Applied Model. Cambridge: Cambridge University Press.
Hayami, Y & Y. Godo. (2005). Development Economics. From the Poverty to The Wealth of
Nations (3rd Ed). Oxford: Oxford University Press.
Hertel, T., K. Anderson., J. Francois. & W. Martin. (1999). Agriculture and Non-
Agricultural Liberalisation in the Millennium Round. Paper presented at the
Global Conference on Agriculture and the New Trade Agenda from a Development
Perspective: Interests and Options in the WTO 2000 Negotiations, World
Bank and WTO, Geneva, 1-2 October.
Isard, W. (1954). Location Theory and Trade Theory: Short-Run Analysis. Quarterly
Journal of Economics, 68: 305-322.
Kalirajan, K. (2000). Restrictions on Trade in Distribution Services. Productivity
Commissions Staff Research Paper. Canbera: Ausinfo.

http://journal.uinjkt.ac.id/index.php/signifikan 213 DOI: 10.15408/sjie.v6i2.5279
Signifikan Vol. 6 (2), Oktober 2017
Lejour, A.M., R.A. de Mooij. & R. Nahuis. (2001). EU: Enlargement: Economic
Implication for Countries and Industries. CPB Document 11. CPB Netherland
Bureau for Economic Policy Analysis.
Limao, N. & A.J. Venables. (1999). Infrastructure, Geographical, Disadvantage, and
Transport Cost. Policy Research Working Paper. The World Bank Development
Research Group Trade.
Matto, A., R.M. Stern., & G. Zanini. (2008). A Handbook of International Trade in
Services. Oxford: Oxford University Press.
Pannenungi, M.A. (2004). Model CGE dengan Skala Ekonomi yang Meningkat dan
Persaingan Tidak Sempurna: Aplikasi pada Studi Kawasan Perdagangan ASEAN-
China (CGE Model With Increasing Economic of Scale and Incompetitive
Market: Aplication in ASEAN-China Trade Are). (Unpublished Dissertation).
Depok: Universitas Indonesia.
Park, S.C. (2002). Measuring Tariff Equivalent in Cross Border Trade in Services. KIEP
Working Paper 02-15, Korea Institute for International Economic Policy.
Rose, A.K. (2002). Estimating Protectionism through Residuals from The Gravity
Model. Working Paper. California: University of California Berkeley.
Sheperd, B. & E.V.D. Marrel. (2010). Trade in Services in The APEC Region: Pattern,
Determinants, and Policy Implications. APEC Policy Support.
Stern, R. & B. Hoekman. (1988). The Service Sector in Economic Structure and in
International Transactions. in L. Castle and C. Findlay (eds.), Pacific Trade in
Services. Sydney: Allen & Unwin.
Tinbergen, J. (1962). Shaping the World Economy: Suggestion for an International Economic
Policy. Appendix VI. New York: The Twentieth Century Fund.
Walsh, K. (2006). Trade in Services: Does Gravity Hold? A Gravity Model Approach to
Estimating Barriers to Services. Institute for International Integration Studies (IIIS)
Discussion Paper. No 183/October 2006.
Winchester, N. (2008). Is There Are Dirty Little Secret? Non Tariff Barriers and The
Gain From Trade. Economics Discussion Papers. New Zealand: University of
Otago.
Wong, M., H. & C.H. Hollweg. (2015). Regulatory Restrictions in Logistic Services of
ASEAN+6 Economies in ASEAN and Regional Free Trade Agreements. Edited

Trade Barrier Elimination, Economics of Scale, and...
Widyastutik, Suahasil Nazara, Rina Oktaviani, Djamester Simarmata
214 http://journal.uinjkt.ac.id/index.php/signifikan
DOI: 10.15408/sjie.v6i2.5279
Christoper Findlay. Routledge-ERIA Studies in Development Economics.
London: Taylor and Francis Group.
Yeah, K.L., J.F. Yanagida., & H. Yamauchi. (1994). Evaluation of External Market Effects
and Government Intervention in Malaysia Agriculture Sector: A Computable
General Equilibrium Framework. Agric, Econ. 11(2-3): 237-256.

http://journal.uinjkt.ac.id/index.php/signifikan 215 DOI: 10.15408/sjie.v6i2.5279
Signifikan Vol. 6 (2), Oktober 2017
Appendix 1. Percentage Changes in Production
Industry Simulasi Idn Mys Phl Tha Sgp Chn Jpn Kor Aus Nzl Ind Row
Agriculture IC-IRTS -0.00189 0.00989 -0.00085 0.00117 -0.00823 0.01481 0.00056 0.00077 0.00466 0.00192 -0.00089 0.00020
PC-CRTS -0.00023 -0.00555 -0.00010 -0.00405 -0.00513 -0.00014 -0.00438 -0.00112 -0.00474 -0.02288 -0.00137 0.00085
Mining IC-IRTS -0.01976 0.03027 -0.00814 0.01440 0.00954 -0.03535 0.00508 0.01170 0.00535 0.00622 0.00496 0.00343
PC-CRTS -0.00173 -0.00828 -0.00362 -0.00743 -0.00753 -0.00201 -0.01332 -0.00899 -0.00332 -0.00661 -0.00682 0.00041
ProcFood IC-IRTS -0.01104 0.21834 -0.00755 -0.00357 -0.08080 -0.00613 0.00076 0.00086 0.00274 0.00027 0.00310 0.00003
PC-CRTS 0.00181 -0.00018 -0.00243 -0.00941 0.00004 0.00022 -0.00137 -0.00220 -0.00259 -0.02633 -0.00134 0.00058
TextWapp IC-IRTS 0.37481 -6.40641 -0.19529 -0.22693 0.21583 0.37289 -0.35058 -0.45498 -0.88029 -0.14264 -0.09383 -0.08985
PC-CRTS -0.00948 -0.00874 -0.01459 -0.02753 -0.03763 0.00111 -0.00770 -0.00752 -0.01125 -0.04254 -0.01496 0.00277
LightMnfc IC-IRTS -0.01727 0.01964 -0.00293 0.00453 -0.00866 -0.01713 0.00159 0.00205 0.00789 0.00383 0.00697 0.00253
PC-CRTS -0.00147 -0.00443 0.00111 -0.01059 -0.02358 0.00170 -0.00936 -0.00677 -0.00344 -0.02477 -0.00828 0.00190
HeavyMnfc IC-IRTS -0.03978 0.10947 0.02364 0.02964 0.00751 -0.04771 0.01011 0.02310 0.01879 0.00538 0.01001 0.00449
PC-CRTS -0.00425 -0.01621 -0.01464 -0.01112 -0.02829 0.00141 -0.00846 -0.00106 -0.00809 -0.03287 -0.00494 0.00210
Util_Cons IC-IRTS 0.00039 -0.00403 0.00025 0.00051 0.00126 0.00019 0.00164 0.00002 0.00270 0.00193 0.00257 0.00016
PC-CRTS 0.00125 -0.00280 0.00190 0.00328 0.00577 0.00056 0.00205 0.00134 0.00199 0.00757 0.00163 -0.00040
Airtransp IC-IRTS -0.00864 0.03598 -0.00020 0.00524 -0.00084 -0.00744 -0.00102 0.00169 0.00320 0.00076 0.00223 0.00032
PC-CRTS -0.00261 0.04844 -0.00601 -0.01582 -0.01381 -0.00002 -0.00687 -0.00215 -0.00253 -0.00321 -0.00552 0.00166
Seatransp IC-IRTS 0.18282 0.02414 0.04718 0.03583 0.01471 0.00470 0.00936 0.02172 -0.00280 0.03734 0.01025 -0.00402
PC-CRTS 0.12381 0.53733 1.72818 1.12269 0.72542 -0.04448 0.30064 0.88400 0.24775 1.44211 0.35115 -0.15584
Otherstransp IC-IRTS -0.00294 0.00433 0.00085 0.00459 -0.00042 -0.00370 0.00029 0.00298 0.00133 0.00090 -0.00090 0.00032
PC-CRTS 0.00070 0.00009 0.00000 -0.00400 0.00787 0.00148 0.00217 0.00726 0.00762 -0.01506 -0.00039 -0.00111
Trade IC-IRTS 0.00448 0.02050 0.00232 0.00066 -0.00095 -0.00253 0.00006 0.00029 0.00146 -0.00027 -0.00085 0.00003
PC-CRTS 0.00171 -0.00500 -0.00271 -0.00265 -0.00815 0.00050 -0.00113 -0.00284 0.00005 -0.00467 0.00067 0.00017
Communicat IC-IRTS -0.00617 0.00153 -0.00071 0.00080 -0.00523 -0.00038 0.00015 -0.00026 0.00156 0.00030 0.00165 0.00018
PC-CRTS -0.00078 0.04358 -0.00263 -0.00481 -0.02350 -0.00055 0.00046 -0.00248 0.00047 -0.00644 -0.00327 0.00035
FinInBis IC-IRTS -0.00647 -0.00843 -0.00229 -0.00174 -0.00612 0.00261 -0.00002 -0.00081 0.00131 0.00034 0.00160 0.00013
PC-CRTS -0.00149 0.00785 -0.00184 -0.00724 -0.01600 0.00093 0.00129 0.00003 0.00044 -0.00658 -0.01025 0.00039
Tourism IC-IRTS -0.00343 -0.00113 0.00073 -0.00347 -0.00208 0.00274 0.00033 -0.00129 0.00337 0.00029 -0.00035 0.00024
PC-CRTS -0.00105 -0.00574 -0.00130 -0.00621 -0.00856 0.00023 -0.00100 -0.00179 -0.00185 -0.01284 -0.00789 0.00017
OthServices IC-IRTS -0.00047 0.00582 0.00073 0.00117 -0.00084 0.00499 0.00086 0.00210 0.00326 0.00056 0.00014 0.00021
PC-CRTS 0.00000 -0.00399 0.00075 -0.00207 -0.00968 0.00013 -0.00144 -0.00452 -0.00113 -0.00224 -0.00026 -0.00001
Trade Barrier Elimination, Economics of Scale, and...
Widyastutik, Suahasil Nazara, Rina Oktaviani, Djamester Simarmata
216 http://journal.uinjkt.ac.id/index.php/signifikan
DOI: 10.15408/sjie.v6i2.5279
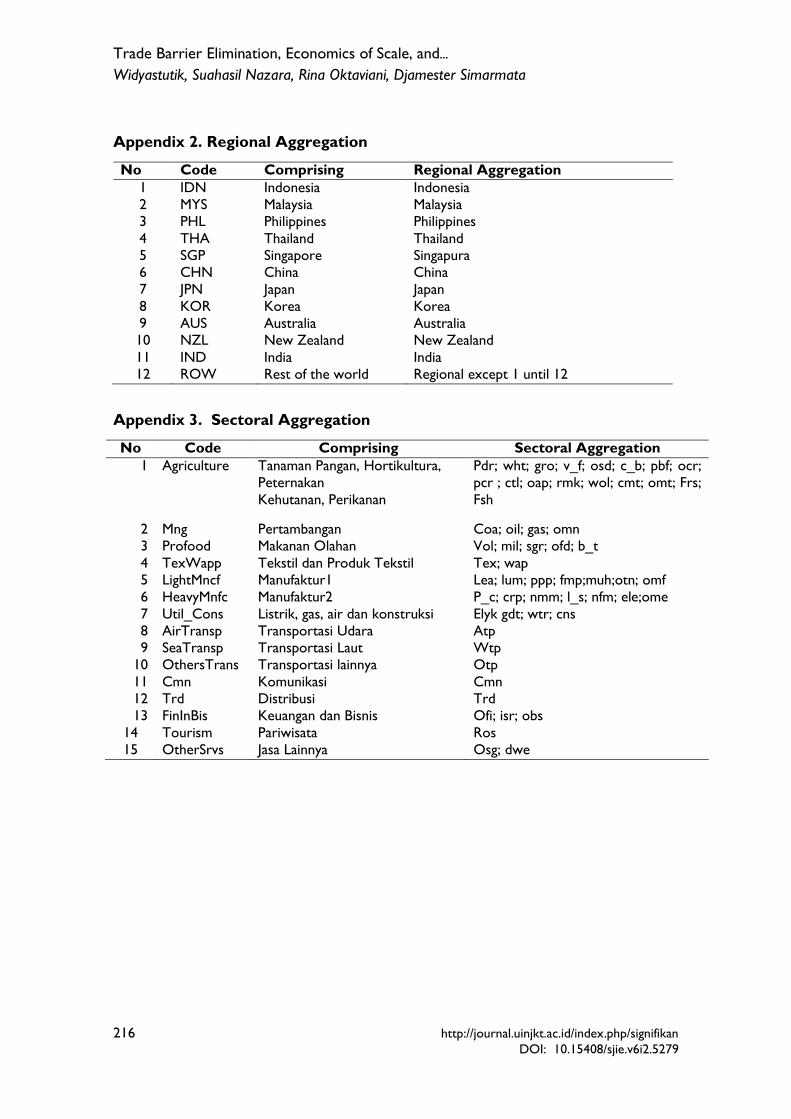
Appendix 2. Regional Aggregation
No Code Comprising Regional Aggregation
1 IDN Indonesia Indonesia
2 MYS Malaysia Malaysia
3 PHL Philippines Philippines
4 THA Thailand Thailand
5 SGP Singapore Singapura
6 CHN China China
7 JPN Japan Japan
8 KOR Korea Korea
9 AUS Australia Australia
10 NZL New Zealand New Zealand
11 IND India India
12 ROW Rest of the world Regional except 1 until 12
Appendix 3. Sectoral Aggregation
No Code Comprising Sectoral Aggregation
1
Agriculture
Tanaman Pangan, Hortikultura,
Peternakan
Kehutanan, Perikanan
Pdr; wht; gro; v_f; osd; c_b; pbf; ocr;
pcr ; ctl; oap; rmk; wol; cmt; omt; Frs;
Fsh
2 Mng Pertambangan Coa; oil; gas; omn
3 Profood Makanan Olahan Vol; mil; sgr; ofd; b_t
4 TexWapp Tekstil dan Produk Tekstil Tex; wap
5 LightMncf Manufaktur1 Lea; lum; ppp; fmp;muh;otn; omf
6 HeavyMnfc Manufaktur2 P_c; crp; nmm; l_s; nfm; ele;ome
7 Util_Cons Listrik, gas, air dan konstruksi Elyk gdt; wtr; cns
8 AirTransp Transportasi Udara Atp
9 SeaTransp Transportasi Laut Wtp
10 OthersTrans Transportasi lainnya Otp
11 Cmn Komunikasi Cmn
12 Trd Distribusi Trd
13 FinInBis Keuangan dan Bisnis Ofi; isr; obs
14 Tourism Pariwisata Ros
15 OtherSrvs Jasa Lainnya Osg; dwe