coastal subsidence in kapoho - hawai'i department...
TRANSCRIPT
Coastal Subsidence in Kapoho, Puna, Island and State of Hawaii
Prepared for: Hawaii County Planning Department
By
Dennis J. Hwang Reinwald O’Connor & Playdon
With Contributions from:
Dr. Benjamin Brooks University of Hawaii
January, 2007

2
Coastal Subsidence in Kapoho, Puna, Island and State of Hawaii
Prepared for: Hawaii County Planning Department
The preparation of this report was financed in part by the Coastal Zone Management Act of 1972, as amended, administered by the Office of Ocean and Coastal Resource
Management, National Ocean Service, National Oceanic and Atmospheric Administration, United States Department of Commerce, through the Office of
Planning, State of Hawai`i.
A publication of the County of Hawai`i pursuant to National Oceanic and Atmospheric Administration Award No. NA04NOS4190038 or NA03NOS4190082 and funds provided by the Office of Planning, Department of Business, Economic
Development and Tourism, State of Hawai`i.
3
Table of Contents
Chapter 1 - Introduction .................................................................................................. 5 Chapter 2 – Subsidence and Other Coastal Hazards at Kapoho ................................. 9
2.1 Ongoing Subsidence at Kapoho............................................................................... 9 2.2 Historical Episodic Subsidence at Kapoho ............................................................ 10 2.3 Hurricane Risk ....................................................................................................... 10 2.4 Tsunami Risk ......................................................................................................... 13 2.5 Earthquake Risk ..................................................................................................... 13 2.6 Lava Risk ............................................................................................................... 15
Chapter 3 – Issues with the Shoreline Certification Process ...................................... 17
3.1 Field Trip – August 17, 2005................................................................................. 17 3.2 Field Trip – July 10, 2006...................................................................................... 23 3.3 Discussion .............................................................................................................. 26
3.3.1 Shoreline Certification Issues at Kapoho........................................................ 27 3.4 Proposed Options ................................................................................................... 32
3.4.1 Surface Connection......................................................................................... 32 3.4.2 Using the Transition to Gravity Flow ............................................................. 33 3.4.3 Relying on an Increased Use of the Vegetation Line ..................................... 35 3.4.4 Using Arbitrary Natural or Man-made Monuments ....................................... 36 3.4.5 Datums, Elevation, Topography, Wave Events .............................................. 36 3.4.6 Waiver............................................................................................................. 37
3.5 Conclusion and Recommendations........................................................................ 38 Chapter 4 – Coastal Hazard Mitigation and Issues with the Special Management Area .................................................................................................................................. 40
4.1 Permitting New Development for Zoning Changes, General and Community Plan Amendments and Subdivision ...................................................................................... 40 4.2 Infrastructure Improvements.................................................................................. 44
4.2.1 Raising or Rebuilding Waiopae Road............................................................. 44 4.2.2 Wastewater Issues........................................................................................... 45
4.3 Lot Transfer ........................................................................................................... 45 4.3.1 Due Diligence of the Buyer ............................................................................ 45 4.3.2 Disclosure by the Seller .................................................................................. 46
4.4 Home Construction ................................................................................................ 46 4.5 Hazard Noticed – Remedial Options Evaluated .................................................... 49
4.5.1 Raising the Height of Existing Seawalls......................................................... 49 4.5.2 Building New Seawalls................................................................................... 50 4.5.3 Legal Status of Existing Seawalls................................................................... 51 4.5.4 Land Exchange................................................................................................ 51 4.5.5 Land Acquisition............................................................................................. 54
Chapter 5 – Conclusion and Summary......................................................................... 55
4
Appendix 1 - Summary and Analysis of Relevant Studies.......................................... 58 Appendix 2 - Summary and Analysis of Interviews, Meetings or Site Visits with Affected Stakeholder and Agencies............................................................................... 60 Appendix A – Measuring Ground Motion and Estimating Relative Sea Level Change at Kapoho, Hawai’I Using Synthetic Aperture Radar Interferometry (InSAR) ............................................................................................................................ 64

5
Chapter 1 – Introduction
This report covers the Kapoho Beach Lots and Kapoho Vacationland Hawaii subdivisions (Figure 1-1). The Kapoho Beach Lots subdivision was approved on July 21, 1952. The Kapoho Vacationland Hawaii subdivision was approved on May, 19, 1962. Both subdivisions are zoned RS-10, which allows for single family residential development on lots at least 10,000 square feet. At the time that these areas in Puna were being developed, there was little concern for the lack of infrastructure in place, and the surrounding geological risks such as earthquakes, flooding, lava or subsidence.1 These geological risks are directly or indirectly related. During the 1975 earthquake in Kalapana, the subject area is reported to have subsided .8 ft (from USGS – Hawaii Volcano Observatory, 1995). Since then there have been numerous reports of monthly inundation of properties, difficulty in determining the shoreline and complications with administering the Special Management Area because of the frequent inundation. Figure 1-1 – Study area includes the Kapoho Vacationland Hawaii and Kapoho Beach Lots subdivisions in the Puna District of Hawaii. 1 For insight into the subdivision process for the Puna area at that time, the reader is referred to Chapter 8 of the book Land and Power. In the book, there is history of the post World War II land development process in the Puna area. It is reported that may units in the area were bought by out of state investors, site unseen. In particular light is shed on the Royal Gardens Subdivision, which in 1983, lava flows entered the development and destroyed 22 homes.

6
This study commenced in July of 2005 to help address the many shoreline and hazard issues associated with the Kapoho area. This report helps to determine the extent of inundation and provide suggested solutions, alternatives and options. This is not an easy task, since the area is at high risk from natural hazards, which is compounded by the issue of subsidence. In addition, many homeowners and landowners have invested much time and money into their property. Many are attached to the property, both financially and emotionally. A major task of this study was to determine the magnitude of the subsidence problem so that options and alternatives could be created that are related to the dynamics of the area. Thus it was very important to determine if he subsidence at Kapoho was simply episodic such as occurred during the 1975 Kalapana event, or if there is a possibility that the subsidence is continuous and episodic. The later would be significantly more difficult to plan for. Prior to this study, there was some evidence of on going subsidence in a letter from the Hawaii Volcano Observatory2 and in documents from the Hawaii County Planning Department. However, the information was not sufficiently specific in terms of the methodology and location to determine if on going subsidence was applicable to the study area. Thus planning decisions based on this evidence for the Kapoho Beach Lots and Vacationland area could not be made. During the spring of 2006, a six month extension to the study contract was granted so that the data collection from satellite measurements to determine the extent, level, or magnitude of subsidence could be further evaluated. This would allow the period of study to be extended from 26 months to 37 months (satellite measurements from February 2003 to March 2006). With the extended period of study, a greater level of confidence in the measurements was allowed, as well as providing insight into any subsidence trends, or temporal variability. This report is divided into three parts to meet the three main objectives of the study. Each of these objectives are covered in a specific chapter of this report. In Chapter 2 and Appendix A, the subsidence was measured by satellite and analyzed to determine if the problem is episodic only, or episodic and continuous. Specifically, 2 September 17, 2001 Letter from Don Swanson of the United States Geological Observatory to Don Swanson of the Hawaii County Planning Department. Based on leveling surveys along Highway 137 in 1976, 1986, 1987, 1989, and 1995, the Highway dropped about 0.4-0.5 inches each year relative to Hilo, totaling 8.25 inches between 1976 and 1995. When combined with relative sea-level rise at Hilo of .16 inches per year, the relative sea-level rise for the area near the highway should be .56-.66 inches per year. Thus total subsidence along the highway was about 13-16 inches in the 24 year period after 1976. In the letter, there is a question if the measurements along the highway are representative of the coastline. Although no firm answer is provided, it is stated that the measurements are probably reasonable estimates of the shoreline as well. Since a definite answer is not provided for the shoreline area, it was a major point of this study to determine if the coastal area is also subsiding on an ongoing basis. This was confirmed in this report (See report and Appendix A).

7
was the subsidence at Kapoho isolated to the 1975 Kalapana earthquake, or has there been ongoing continuous subsidence after that event. A study by Dr. Benjamin Brooks using Synthetic Aperture Radar Interferometry or (InSAR) was used to determine if the Kapoho areas is actively subsiding. This was one of the many critical aspects of this report and drives, to a certain extent, the recommendations in later chapters. Chapter 2 was written to address the goal in the scope of work related to coastal hazard mitigation:
Establish mitigative measures to address the hazards from tsunami and storm wave action and additional catastrophic events facing the existing and potential residential development within the study area.
In order to establish mitigative measures, it is necessary to ascertain the relative risks of natural hazards for the area. This was a key component of this report. The InSAR study found that the Kapoho area maybe subject to continuous subsidence of ~0.8 to 1.7 cm/yr +/- 0.8 cm/yr (2 standard deviations).3 Since subsidence can have a significant influence on other coastal hazards, risks were discussed for earthquakes, hurricanes, tsunamis, and other natural hazards. Hazard mitigation measures for the Kapoho area are also discussed, but presented primarily in Chapter 4. Chapter 3 is devoted to the shoreline certification process, and resolving the issues currently faced by the residents and local government in obtaining a certification when there is monthly or yearly inundation of areas. Specifically the chapter addresses the objective in the scope of work to:
Determine the shoreline or identify a methodology to determine the shoreline in the study area. These recommendations shall consider the economic, environmental and legal ramifications resulting from the existing and potential expansion of residential development and seawall improvements within the study area.
This Chapter incorporates many of observations that were made during numerous field trips to the site. These field trips provided insight into the difficulty and challenges in implementing the shoreline certification process in the Kapoho area. In addition to the field observations, numerous reports are discussed and recommendations are provided for how the shoreline could be determined. Several options are discussed in this Chapter. One is to use more natural and man-made monuments that approximate the “upper reach of the wash of the waves” and exclude gravity flow as a component of the shoreline determination. This may result in more development pressure on the mauka side of Waiopae Road, which
3 Two standard deviations provides a 95% confidence interval that the true subsidence is within the bracketed accuracy estimation.

8
maybe a concern due to the risk of flooding and subsidence in the area. Appropriate hazard mitigation measures are thus recommended. Another option is to use the mauka edge of the roadway as an arbitrary cutoff for determining the shoreline (similar to using the face or edge of a seawall or revetment). A third option is to encourage the State to base the shoreline with increased emphasis on evidence such as the vegetation line. For this option, the State would have the final say on its use. Finally the option of using a shoreline certification based on tidal flooding having connection with the open ocean is suggested as a viable alternative. While this policy followed by the Hawaii County Planning Department has been criticized as leading to an impasse, this option has also served to indirectly restrict development in high flood areas. Given the nature of the subsidence found in this report, this may be the safest and most sound option in the long-run.
In Chapter 4, the many issues dealing with the administration of the Special Management Area are presented, including permits for new seawalls, extending the height of existing seawalls, wastewater disposal, and permits for new structures or existing structures. These are common issues faced by the residents and the Planning Department for Hawaii County. The difficulty in administration is compounded by the shoreline certification process (Chapter 3) and the risk of hazards in the area, such as subsidence (Chapter 2). If development and construction does proceed in areas subject to periodic inundation or subsidence, general guidelines or suggestions are provided. Chapter 4 addresses the goal in the scope of work, which is to:
Evaluate the need to amend the special management area and shoreline setback laws and/or rules regarding new structures and new structures and seawalls with the study area. Recommendations shall consider the economic, environmental and legal ramifications resulting from the existing and potential expansion of residential development and seawall improvements within the study area.
The recommendations and options in this report are driven by interviews with scientists, Kapoho residents, as well as government agencies such as the Department of Land and Natural Resources, Army Corp of Engineers, the Department of Health, and the Hawaii County Planning Department. During the course of the study – two formal site visits were made and two community meetings were held. At all times, input was sought on possible solutions, concepts, strategies and options.

9
Chapter 2 – Subsidence and Other Coastal Hazards at Kapoho
One of the main objectives of this report and study was to determine the nature of subsidence in the Kapoho area and answer the key question -- is the subsidence episodic only -- or episodic and continuous? Once the nature of subsidence was determined, it would be possible to fit it into the overall determination of hazard risk in the Kapoho area, and create mitigation measures that are suited to the characteristics of this site. The development of mitigation measures for the area is dependant on the hazard risk and is covered in Chapter 4, which deals with administration of the Special Management Area. In this Chapter, insight into the hazard risk is provided. 2.1 Ongoing Subsidence at Kapoho A major portion of this project was to gather the information necessary that would be vital for planning purposes. Most importantly, it was necessary to determine if the subsidence at Kapoho was ongoing, and if so, what is the magnitude of the change. Dr. Ben Brooks and his team from the Pacific GPS Facility at the School of Ocean and Earth Science and Technology, University of Hawaii was contacted to assist for this issue. Using Synthetic Aperture Radar Interferometry (InSAR) techniques and radar data from the European Space Agency’s Envisat, an estimate for subsidence at Kapoho could be determined for the period from February 12, 2003 to March 8, 2006. The full body of the report, explaining the methodology, the results and limitations is found in Appendix A. This section contains a very brief description of the major findings. From the InSAR study, the immediate Kapoho region experienced average downward vertical motions, with respect to Hilo of between ~ -0.7 and -1.6 cm/yr +/-0.6 cm/yr. The 0.6 cm/yr. represents 2 standard deviations. Combined with the rising sea levels measured in Hilo and believed to be representative for Kapoho, the relative sea level rise for Kapoho has thus been estimated to be ~0.8 to 1.7 cm/yr +/- 0.8 cm/yr (2 standard deviations). Several key points should be made from the study. First, the subsidence at Kapoho is at least an order of magnitude greater than the sea-level change recorded at the Hilo tide station. So local land motion dominates over relative sea-level change for this particular area and time interval. Also the authors do not attribute the subsidence to any particular cause as this was outside the scope of the study. Finally the authors note, and this report concurs that the area should continue to be monitored since so much is at stake. It is not known if there are variations in the rate of subsidence over time and to what extent the continuous subsidence relieves stress that over time may cause episodic larger events (see next section). In other

10
words the interaction between the ongoing subsidence and historical episodic events is not well understood. 2.2 Historical Episodic Subsidence at Kapoho Information on historical subsidence in the area came from two sources. From the book “Volcanoes in the Sea – The Geology of Hawaii,”4 there was extensive subsidence of the southeast coast of the island of Hawaii during both the 1975 and 1868 earthquakes. For the 1868 event, subsidence was as high as 2 meters at Apua Point and .8 meters at Kaimu. For the 1975 event, subsidence varied from 3.5 meters at Keahou Landing to .24 meters at Kapoho.5 Sources from both the Hawaii Volcano Observatory as well as the U.S. Geological Survey concluded that the earthquakes of 1975, 1868 and a larger earthquake in 1823 were not isolated random events. Instead, they appear to be related to a long-series of similar earth movements that have created the fault systems in the area. As gravity and magma induced stresses build up in the area, the entire south flank tears loose along the active fault system and slides seaward, causing large earthquakes. From an interview with Don Swanson, Asta Mikilius, and Paul Okubo from the Hawaii Volcano Observatory on February 28, 2006, it was found that there was also major subsidence reported for the 1823 earthquake and minor subsidence for an event in 1989. While it is very difficult to predict earthquake and subsidence events, it was suggested that a magnitude 7.0 earthquake could be expected every 30 years and something larger every 100 years. From the history of the area, as well as applicable reports, episodic earthquakes causing considerable ground shaking as well as significant subsidence have occurred in the past and should be expected in the future. It is recommended in this report that subsidence continue to be monitored. It is not known if the continuous subsidence documented in this report since 1975 (Section 2.1) serves to relieve stress on the fault system, and thus diminish the magnitude or frequency of future episodic events. 2.3 Hurricane Risk Subsidence of the coastline will serve to increase the risk from future flooding and wave events from a hurricane or a tsunami. Each of these risks are covered with greater detail in this Chapter. Regarding hurricane risk, all islands in Hawaii are susceptible to this hazard. However there are two key points to be made in this 4 Macdonald, G.A., Abbott, A.T., and Peterson, F.L., 1983. Volcanoes in the Sea – The Geology of Hawaii. University of Hawaii Press, Honolulu. 5 USGS – Hawaii Volcano Observatory, 1995.

11
report. First, there is a misperception that the island of Kauai is most susceptible to hurricanes because it has been hit directly by Hurricanes Iniki in 1992 and Iwa in 1982. Figure 2-1, from the Oahu Civil Defense Agency displays relative hurricane risk for the Hawaiian Islands. Most of the hurricanes are formed in the east Pacific and travel west before curving north to threaten the Hawaiian Islands. Given the origin of these systems is in the east Pacific, the island of Hawaii, being closer to the source is just at high a risk of being hit as Kauai, if not more.
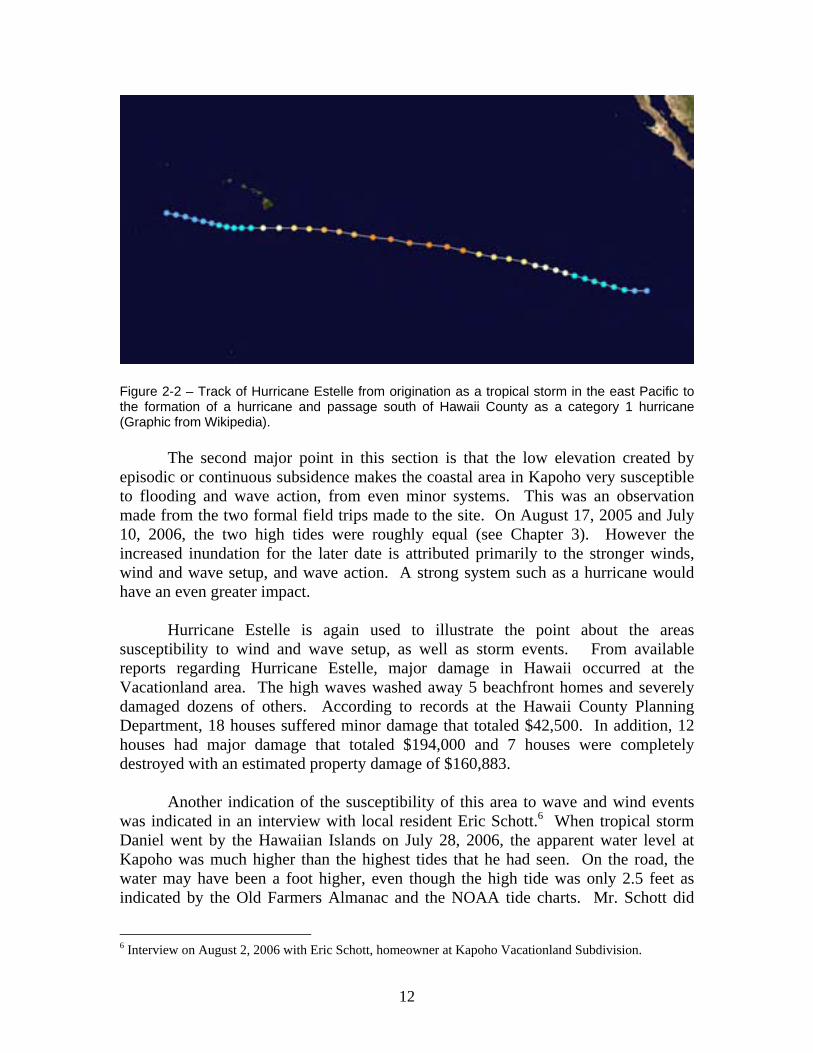
Figure 2-1 - Relative Hurricane Risk for the Hawaiian Islands – Contours show the number of times a hurricane passes within 75 nautical miles every ten years (Oahu Civil Defense Agency, 2003). Contours show the risk is greatest for Hawaii County, while Maui and Oahu have slightly greater risk than Kauai. Hurricane Estelle is a good example of the typical track for hurricanes in the Pacific. On July 22, 1986, the eye of Estelle passed over 100 miles south of Hawaii County (see Figure 2-2). In addition to the high spring tide, high waves generated from Estelle, crashed on the shores of the Big Island. There is no reason, from Figures 2-1 and 2-2 that Kauai would be more susceptible to hurricanes than Hawaii County.
12
Figure 2-2 – Track of Hurricane Estelle from origination as a tropical storm in the east Pacific to the formation of a hurricane and passage south of Hawaii County as a category 1 hurricane (Graphic from Wikipedia). The second major point in this section is that the low elevation created by episodic or continuous subsidence makes the coastal area in Kapoho very susceptible to flooding and wave action, from even minor systems. This was an observation made from the two formal field trips made to the site. On August 17, 2005 and July 10, 2006, the two high tides were roughly equal (see Chapter 3). However the increased inundation for the later date is attributed primarily to the stronger winds, wind and wave setup, and wave action. A strong system such as a hurricane would have an even greater impact. Hurricane Estelle is again used to illustrate the point about the areas susceptibility to wind and wave setup, as well as storm events. From available reports regarding Hurricane Estelle, major damage in Hawaii occurred at the Vacationland area. The high waves washed away 5 beachfront homes and severely damaged dozens of others. According to records at the Hawaii County Planning Department, 18 houses suffered minor damage that totaled $42,500. In addition, 12 houses had major damage that totaled $194,000 and 7 houses were completely destroyed with an estimated property damage of $160,883. Another indication of the susceptibility of this area to wave and wind events was indicated in an interview with local resident Eric Schott.6 When tropical storm Daniel went by the Hawaiian Islands on July 28, 2006, the apparent water level at Kapoho was much higher than the highest tides that he had seen. On the road, the water may have been a foot higher, even though the high tide was only 2.5 feet as indicated by the Old Farmers Almanac and the NOAA tide charts. Mr. Schott did
6 Interview on August 2, 2006 with Eric Schott, homeowner at Kapoho Vacationland Subdivision.

13
accompany the survey team on August 17, 2005, when the high tide reached 3.17 feet, but the wave and wind conditions were much less. 2.4 Tsunami Risk According to the Atlas of Natural Hazards in the Hawaiian Coastal Zone,7 the Kapoho area has a high tsunami ranking. The Kapoho area is vulnerable to both local and distant tsunamis. For local tsunami activity, the history of tsunamis coincides with the history of earthquakes in the area (See Section 2.2). According to the Atlas of Natural Hazard, during the 1868 earthquake, a tsunami was generated that washed away 180 houses on the Kau-Puna coast and drowned 46 people. The port town of Keauhou, near Halape, was completely destroyed and is no longer found on maps. During the 1975 Kalapana earthquake, a tsunami was also generated along the coast and two campers were killed by the wave at the Halape Campgrounds in Kau, boats and piers were damaged in Hilo, houses were destroyed on the Punaluu coast, and fishing boats were sunk in Keahou Harbor south of Kona. For distant tsunamis, between 1812 and 1975, there have been 22 tsunamis that have had damaging consequences to the Hawaiian shoreline. These tsunamis came from tectonically active areas in regions of the Pacific, including Alaska, the Aleutian Islands, Chile, Japan and Tonga. Not all have affected the southeast coast of Hawaii county. The most notable that did include the tsunamis in 1946 (20 ft. runup), 1952 (10 ft.), 1957 (10 ft.) and 1960 (13 ft.).8 Both hurricane and tsunami risk are factors that are considered on the Flood Insurance Rate Map (“FIRM”) under the National Flood Insurance Program. From the FIRMs, sections of the coast are designated as flood prone (A zone) or wave prone (V zone) and appropriate construction measures are proposed, including elevating on piers and columns in the V zone. This elevation may protect against tsunami waves, if the elevation is sufficiently high. However, subsidence is not factored into the development of the applicable elevations, so over time, buildings may be placed at higher risk as subsidence proceeds. For this reason, the concept of free board or building extra elevation into the structure is strongly recommended (see Chapter 4). 2.5 Earthquake Risk The evaluation of earthquake risk in the Kapoho area is very important, because earthquake shaking is one factor that needs to be accounted for if structures
7 Atlas of Natural Hazards in the Hawaiian Coastal Zone, Fletcher, C.H., Grossman, E.E., Richmond, B.M., and Gibbs, A.E., 2002, prepared for State of Hawaii Office of Planning, NOAA, USGS, and UH SOEST. 8 From Atlas of Natural Hazards in the Hawaiian Coastal Zone

14
are built for wave or flood risks by elevating on piers or columns. For example, the higher a house is elevated on a pier or column, the more stress the pier or column will be subject to during earthquake shaking. The building of a house on a pier or column can create a top heavy structure and a “soft” story (the area between the ground surface and the base of the elevated structure). The stress on the columns and piers would be a function of many factors including the amount of elevation and the weight on top. These are especially important factors for Kapoho because of the possibility that any new structures may need to be elevated even higher due to subsidence (i.e., building in freeboard as discussed in Section 2.4). In Figure 2-3, earthquake risk for the Hawaiian Islands is expressed as a percentage of gravity for events that have a 10% chance of exceedance every 50 years. Earthquake risk is the greatest for the southeast portion of Hawaii County, including the Kapoho area. This is attributed to the active volcano in the vicinity. Because Hawaii has the greatest earthquake risk, it is in seismic zone 4 under the Uniform Building Code. Kauai is in seismic zone 1, Oahu seismic zone 2a and Maui zone 2b. While it was outside the scope of this study to analyze the adequacy of the building codes for Hawaii County, the building department should make sure that any structures elevated on piers and columns to mitigate the damage from flooding or wave action under the National Flood Insurance Program should also be able to handle anticipated earthquake risk. As expressed previously, this is important because there will be a tendency to build higher on piers and columns given the subsidence recorded in the area. Some measures to increase column strength can be found in the Federal Emergency Management Agency’s Coastal Construction Manual and includes the use of cross bracing or knee bracing (see Chapter 4).

15
Figure 2-3 – Earthquake Risk in Hawaii – This map from the U.S. Department of the Interior – U.S. Geological Survey shows earthquake risk is greatest for Hawaii County, and specifically the southeast portion of the island that includes Kapoho. The colors express the peak horizontal acceleration as a percent of gravity for events with a 10% probability of exceedance in 50 years. 2.6 Lava Risk That the Kapoho area is subject to lava risk is illustrated by Figure 2-4, which shows the area of study and the boundaries of the 1960 lava flow. In the Puna district, lava has destroyed housing in numerous areas including Kapoho, the Royal Gardens Subdivision, Kalapana Village, Kalapana Gardens, and Kapaahu. The lava, earthquake activity and subsidence are all related to the east rift zone of Kilauea. Lava is a risk that should be planned for and the Hawaii Volcano Observatory is a good source of information for this hazard. It is instructive that after many homeowners were displaced due to the destruction of their homes by lava, the State was involved in providing options for relocation. A similar solution could be developed for the Kapoho area given the proper guidelines are provided. This however, was outside the scope of this report, but is recommended that there be follow up on this issue.

16
Figure 2-4 – Map of the Kapoho Vacationland and Beach Lots subdivisions with the boundaries of the 1960 lava flow for comparison. The Kapoho area is subject to lava risk. Accretion by lava is the major mechanism for the coastline to build out.

17
Chapter 3 – Issues with the Shoreline Certification Process
The objective for this Chapter was to: “Determine the shoreline or identify a methodology to determine the shoreline in the study area. These recommendations shall consider the economic, environmental and legal ramifications resulting from the existing and potential expansion of residential development and seawall improvements within the study area. One important difficulty to consider in determining the shoreline for this area is that the episodic and continuous subsidence has allowed the ocean at high water levels to interfinger with existing development. As one moves along the coast, the level of development changes, as well as the elevation, and thus the level of inundation. All of this serves to complicate potential solutions. In order to gain insight into the shoreline certification process, and other shoreline issues at Kapoho, numerous field trips were made to the site. 3.1 Field Trip – August 17, 2005 A field trip was made on August 17, 2005, to the Kapoho Vacationland Subdivision. Present on that day were Dennis Hwang, Dr. Ben Brooks, Dr. Chris Foster, Larry Brown from the Hawaii County Planning Department, geology graduate student Chris Conger, and local resident Eric Schott. The team was there to observe the high tide predicted on the NOAA tide charts for Hilo to be at 3.1 feet above Mean Lower Low Water (MLLW) at 2:15 pm. This was one of the highest tides of the year, as only one day in June, three days in July and two days in August had higher predicted tides in 2005, with the maximum in 2005 being at 3.3 feet above MLLW. The purpose of the trip was not to identify the shoreline as defined, but to observe one of the higher tide events for the year, which would provide insight on methodologies to identify the shoreline in this difficult area of study. Some observations from the field trip were:
Accretion - There was no sign of active accretion of sand along the coastline. The coast is made of rocky material (pahoehoe lava rock) and thus accretion, such as occurs on some sandy beaches in the State by the buildup of loose sediment was not present. The area to the east of the Kapoho Vacationland and Kapoho Beach Lots subdivisions did experience lava accretion by the 1960 lava flow (Figure 2-4). The possibility of episodic accretion by lava remains and the Hawaii Volcano Observatory should be consulted regarding the risks for this particular area. Subsidence Rates - The major information on subsidence rates is derived by previous studies, prior measurements of nearby areas, and a current study

18
using Synthetic Aperture Radar Interferometry (“InSAR”) which was conducted by Dr. Ben Brooks and is discussed in detail in this report. This information is found in Chapter 2 and Appendix A of this report. From field observations alone, it is not possible to derive information on subsidence rates, although it is possible to infer that subsidence has occurred in the past. For instance, numerous manmade structures were flooded by the observed high tide event.
Currents – Associated with the incoming high tide were tidal currents. The speed of these currents was not measured, as this was outside the scope of the study. Generally, the currents would follow low spots and channels in the rocky lava flows and the roadway as the tide rose. Ripples on the surface indicted the current flow. Generally the deeper the channel, the more force associated with the moving water.
Waves – During the August 17, 2005 site visit, it was generally calm and the waves broke offshore over a shallow fringing shoal. Once crossing the shoal area, the combination of shallow water and intermittent lava barriers serve to limit wave action. In addition, wave action is depth limited by the formula (height of a breaking wave = .78 (depth of the water). Many of the inland areas, including the shallow low spots on Waiopae Road that became channels during high tide were inundated by water that was measured in inches, and thus wave action, especially mauka of the road is expected to be negligible, absent a larger increase in water level, perhaps associated with a storm event or future subsidence. Since storm events are not to be included in the shoreline certification process by definition, the high tide line at this section of Kapoho gives a good indication of the upper reach of the wash of the waves. However in later site visits, the important role of wind and wave action and possible increase in water levels associated with setup from these forces was noted as significant. So although the shoreline certification process does not account for storm events, these events play a significant role in hazard risk for the area. Given the low lying areas of Kapoho due to subsidence, future wave action from large and small events would be expected to have an even greater impact in the future. Water Quality - There has been some concern about the water quality of the near shore waters, but no water quality measurements were taken as this was beyond the scope of this report. However, the observation of the incoming water flooding properties with visible cesspools on site indicates that if there is any leaching of the cesspools, this could lead to a direct contribution to some of the tide pools in the Waiopae Marine Life Conservation District. In the Kapoho Reef watch study, leaching form cesspools was identified as the major potential source for enterococci bacteria (Appendix 1). Any new development
19
that does not protect the wastewater from flood inundation will likely contribute to offshore water quality degradation. Wastewater issues are the subject of additional studies as noted in Section 4.2.2.
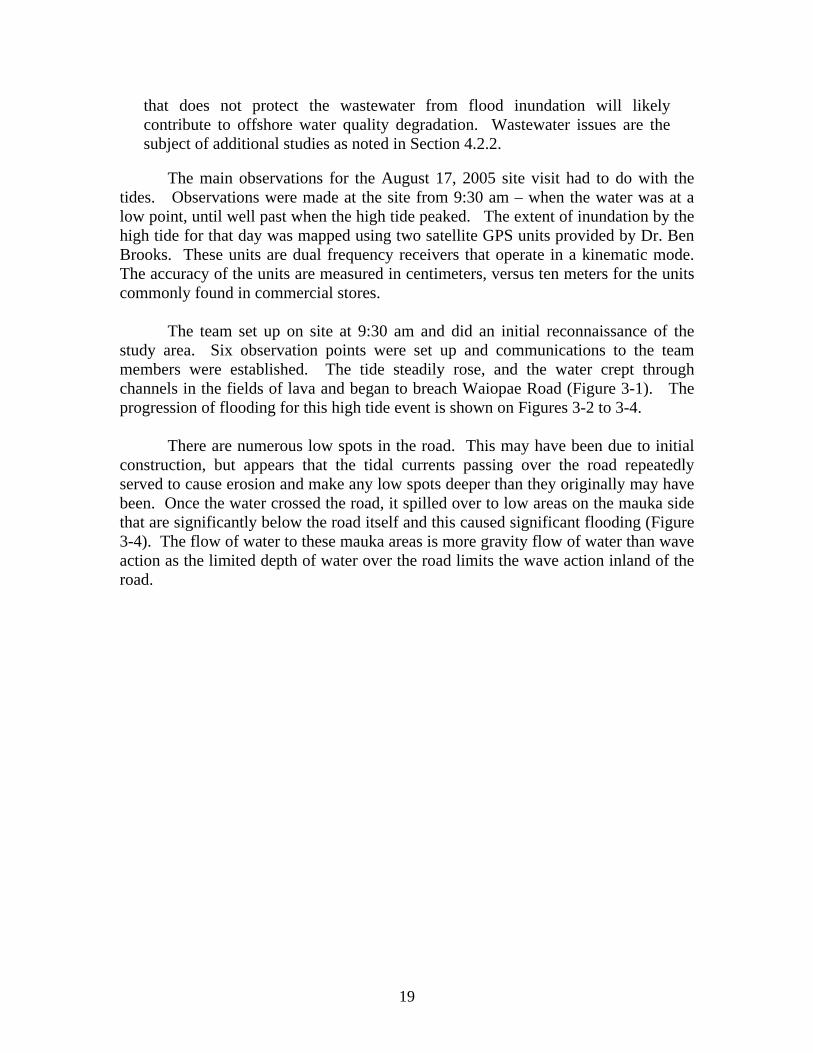
The main observations for the August 17, 2005 site visit had to do with the tides. Observations were made at the site from 9:30 am – when the water was at a low point, until well past when the high tide peaked. The extent of inundation by the high tide for that day was mapped using two satellite GPS units provided by Dr. Ben Brooks. These units are dual frequency receivers that operate in a kinematic mode. The accuracy of the units are measured in centimeters, versus ten meters for the units commonly found in commercial stores. The team set up on site at 9:30 am and did an initial reconnaissance of the study area. Six observation points were set up and communications to the team members were established. The tide steadily rose, and the water crept through channels in the fields of lava and began to breach Waiopae Road (Figure 3-1). The progression of flooding for this high tide event is shown on Figures 3-2 to 3-4. There are numerous low spots in the road. This may have been due to initial construction, but appears that the tidal currents passing over the road repeatedly served to cause erosion and make any low spots deeper than they originally may have been. Once the water crossed the road, it spilled over to low areas on the mauka side that are significantly below the road itself and this caused significant flooding (Figure 3-4). The flow of water to these mauka areas is more gravity flow of water than wave action as the limited depth of water over the road limits the wave action inland of the road.

20
Figure 3-1 - At 12:30 pm on August 17, 2005, water is beginning to cross the channels in the lava makai of Waiopae Road. The lava topography, with numerous high and low areas, results in the creation of tidal channels, tidal pools and tidal islets. This area would be considered the inner pool area as designated in the Kapoho Reef watch study.

21
Figure 3-2. 12:57 PM. The incoming tide has filled the tidal channels and has crossed Waiopae Road in four low spots.
Figure 3-3 - 1:26 PM. – The tide is continuing to rise. Once crossing the road, the water spills over to lower areas mauka of the roadway, and floods properties mauka of the road.
22
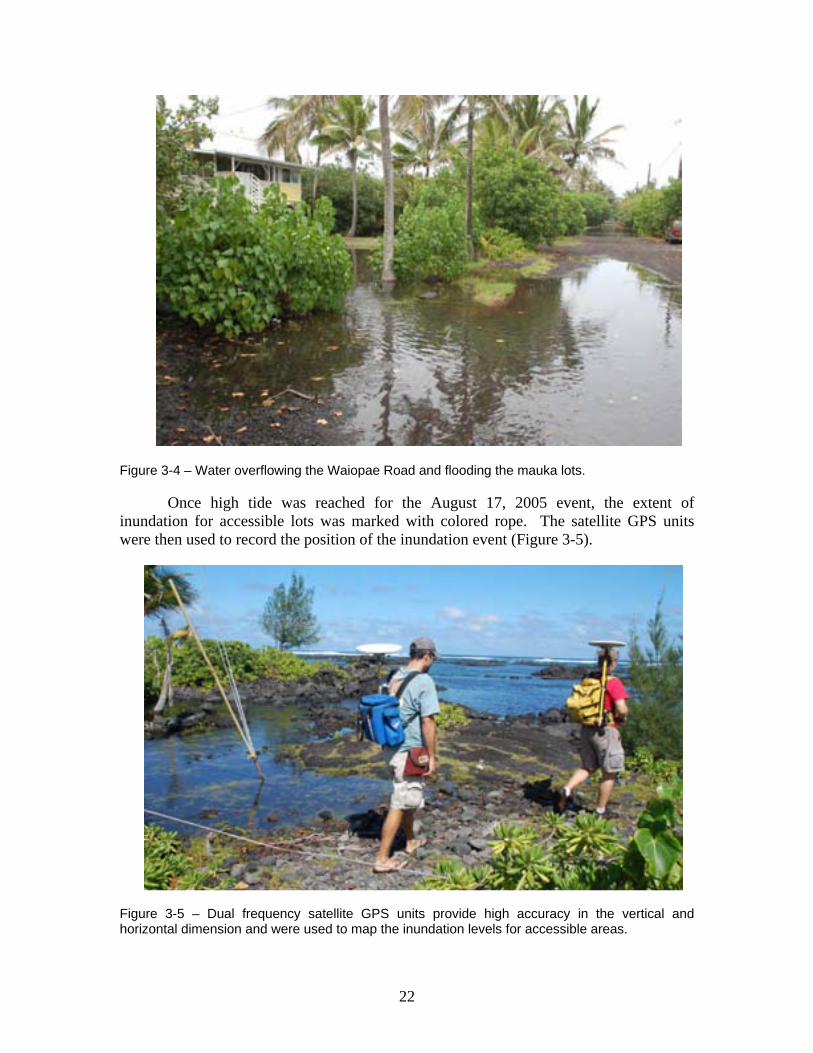
Figure 3-4 – Water overflowing the Waiopae Road and flooding the mauka lots. Once high tide was reached for the August 17, 2005 event, the extent of inundation for accessible lots was marked with colored rope. The satellite GPS units were then used to record the position of the inundation event (Figure 3-5).
Figure 3-5 – Dual frequency satellite GPS units provide high accuracy in the vertical and horizontal dimension and were used to map the inundation levels for accessible areas.

23
From the data (Figure 3-6), there were four areas (marked by arrows) where water breached the roadway on that date. The thickness of the arrows is a rough indication of the magnitude of the breach. Note also that the inundation in some areas may have gone further in than the first row of houses mauka of Waiopae Road. However the mixing of water with tidal ponds, the limited access and thick brush prevented any significant determination for the more inland lots.
Figure 3-6 - Inundation recorded on August 17, 2005 with the use of two satellite GPS units (RVR1 and RVR2). High Tide was 3.17 meters from NOAA tide charts. Wind speed was 6.6 meters per second and significant wave heights were 1.97 meters as measured from the ocean buoy southeast of Hilo. Arrows indicate where breaches in the road occurred. The width of the arrows is a qualitative indication of the size of the channel. The close proximity of the GPS units confirm the recorded position. For later discussion in this Chapter, only RVR2 will be utilized. The August 17, 2005 data was then compared with another high tide event on July 10, 2006 when the tide charts indicated a 3.13 high tide. This would be almost the same as the predicted tide for August 17, 2005 (3.17 high tide). It would be of interest to see how the extent of inundation changed over 11 months. Given that the July 10, 2006 high tide event was slightly lower, all things remaining the same, the inundation should be slightly less. 3.2 Field Trip – July 10, 2006 Although the contract for Kapoho called for only one site visit, two were made. On July 10, 2006 another field trip to the Kapoho Vacationland subdivision was made with Dennis Hwang, Dr. James Foster, his assistant technical helper Shanna Dacanay, and Hawaii County Planner Larry Brown. The purpose of this site visit was to

24
observe tidal inundation again, almost one year later at a similar tidal event (3.13 vs. 3.17 predicted high tides). Any differences in tidal inundation from the previous year could be determined. Also, the channels that breached the roadway and flooded the lots mauka of Waiopae Rd. would be observed to determine if there was a clear delineation where runup gave way to gravity flow, which may be important with regard to defining the shoreline (see later sections of this report). With regard to the channels crossing the roadway, three distinct channels were observed, with the largest being in the middle of the study area. This is different then on August 17, 2005, when 4 channels were observed. Apparently a greater amount of inundation on July 10, 2006, caused two of the channels to coalesce and make one larger one. For the middle channel, the depth of water reached 16 inches at the highest tide. The channel to the west reached 6 inches in depth, and the one to the east, a little under 2 inches (1 and 15/16 inch) depth. Figure 3-7 shows the level of inundation measured for the July 10, 2006 event.
Figure 3-7 - Inundation recorded on July 10, 2006 with the use of one satellite GPS unit. High Tide was 3.13 meters from NOAA tide charts. Wind speed was 9.4 to 11 meters per second and significant wave heights were 2.75 to 2.69 meters as measured from the ocean buoy southeast of Hilo. As far as a difference in inundation, Figure 3-8 compares the inundation for the two different time periods. On this Figure, the difference in inundation is difficult to visualize. From the field however, the difference in inundation was more noticeable.

25
Figure 3-8 - Comparison of the inundation events, RVR2 taken on August 17, 2005 with the inundation recorded on July 10, 2006. From the plots, there are slight differences in inundation that are difficult to ascertain at the map scale. Field observations and pictures show a greater level of inundation for the July event. From the pictures in Figures 3-9 and 3-10, the extent of inundation increased for the July, 2006 event. At this point, it is believed that the major contributing factor was the stronger wind and wave setup which was observed for the more recent event, as opposed to the small amount of subsidence that may have occurred. However, given the relatively shallow depth of the channel (less than 2 inches), this particular area maybe especially sensitive to flooding caused by any drop that would make the channel deeper. This would be expressed as increased inundation. Observing inundation in this area may be an obvious indicator that subsidence may be getting worse since the current channel is relatively shallow, so any increase of only a few centimeters over many years may be readily apparent. The observation of increased inundation with increased wind and wave setup for only a minor increase in wave action indicate that given the very shallow areas along this coast, stronger wave and storm events can have a significant impact.

26
Figure 3-9 – Inundation near the intersection of Waiopae Road and Kaheka Street on August 17, 2005. Maximum inundation is recorded by a cord. Predicted high tide is 3.17 feet above MLLW.
Figure 3-10 – Maximum inundation on July 10, 2006. Although the predicted high tide was less, at 3.13 above MLLW, the inundation is greater. This is attributed to stronger wind and wave setup, but subsidence could have also played a role. Depth of water at the maximum channel depth is 1 and 15/16 of an inch or about 5 cm.
3.3 Discussion In this effort to map the high tide line on August 17, 2005 and July 10, 2006,
several observations and conclusions can be made. While the purpose of these field trips were to observe the high tide event, it is conceivable that property owners and agencies could have, or may have used these events to determine the shoreline for a specific parcel using the traditional methods as outlined in the State’s shoreline certification procedures. Thus the observations have several implications that relate

27
to the applicability and problems of the shoreline certification process in general and also for this area. These issues are covered in more detail below.
3.3.1 Shoreline Certification Issues at Kapoho There are many issues and intricacies with the shoreline certification process
in general, and in particular for the Kapoho area. Before the study for Kapoho proceeded, there was a semi-impasse with the shoreline certification process. The Department of Land and Natural Resources was hesitant to certify shorelines in Kapoho area because of the implication of certifying shorelines that are mauka of established existing lots. If the shoreline certification was an indication of a property line, there was concern that the State may be claiming ownership of land that is located makai of the shoreline. Because shoreline certifications were not being performed in the Kapoho-Vacationland area, the County Planning Department was using surface connection to the ocean as a means to process applications. For example, when an application for a Special Management Area permit was received, the Planning Department would ask for a determination if there was a surface connection with the ocean. If there was, the outline of the surface connection would be determined and a setback would be measured from that outline.
There are two key points to raise. First, a shoreline certification by itself, does
not determine ownership of land. The explanation for this was provided in a consultants report reviewing the shoreline certification process.9 Although the shoreline may be indicative of where a property line is located, there is a formal procedure to change the boundaries based on erosion of land. Until this process occurs, there is no change in ownership of land. However, the shoreline certification is indicative of jurisdiction. Mauka of the shoreline, jurisdiction lies with the counties and makai, it rests with the State. So although a shoreline may shift mauka for a particular property, the land may still be privately owned although jurisdiction may change from the county to the State. In this scenario, the private property owner, if building a structure on their property, may need a Conservation District Use Application (CDUA) from the State, whereas before, a Special Management Area permit would have been required from the county. Only if the State, or the landowner went through formal procedures to change the boundary, would there be such a shift in property ownership.
Related to this point, the DLNR has changed their policy in November of
2006, to accept applications for certifying the shoreline in the Kapoho-Vacationland area. If the lot is found to be makai of the shoreline, the DLNR will not certify the shoreline survey, but will send out a letter stating the subject property is considered
9 Fletcher, C.H., and Hwang, D.J., 1994. Shoreline Certification Review and Recommendations. Office of State Planning – Coastal Zone Management Program, p. 76.

28
“submerged” lands and therefore in the Conservation District.10 Any activity on that lot would require approval from the DLNR through the CDUA process. Because of this shift in policy from the DLNR, the Hawaii County Planning Department will no longer be involved in their past practice of making observations on surface connection. It was also indicated that the DLNR will be using surface connection as a means to help determine the position of the shoreline. In this regard, the minimum tide that they will use to determine the shoreline is 2.8 feet above MLLW.
With the recent shift in DLNR policy, the emphasis of this section has changed
slightly. Previously, the Hawaii County Planning Department was active in helping to determine which lots had surface connection and sought advice on how to determine this within the framework of the shoreline certification process. Now, the DLNR will take applications for shoreline certification and any advice on determining the shoreline given in this report could affect the State process more than the county. Nevertheless, this will still affect the county indirectly, especially if applications for permits are taken for future development by the DLNR.
While the administrative procedural impasse dealing with the shoreline
certification process appears to have been resolved at the time of this writing, there still remains the issue of where is the shoreline? Before continuing this discussion, it is necessary to go into the current definitions of the shoreline. There are three definitions that are relevant. At the State level, there is a definition in the statutes and the one in the Department of Land and Natural Resources regulations. At the county level, there is a definition in the Special Management Area regulations for Hawaii County. These definitions are provided:
In the statues, the Coastal Zone Management Act has the following definition
for the shoreline (Hawaii Revised Statutes § 205A-1): “Shoreline” means the upper reaches of the wash of the waves, other than storm and seismic waves, at high tide during the season of the year in which the highest wash of the waves occurs, usually evidenced by the edge of vegetative growth, or the upper limit of debris left by the wash of the waves. For the former shoreline certification rules for the Department of Land and
Natural Resources § 13-222-2): “Shoreline” means the upper reach of the wash of the waves, other than storm or tidal waves, at high tide during the season of the year in which the highest wash of the waves occurs, usually evidenced by the edge of
10 Part of the reason for this is the State cannot certify a shoreline unless it is located on the applicant’s property.

29
vegetative growth, or where there is no vegetation in the immediate vicinity, the upper limit of debris left by the wash of the waves. This definition has been modified on June 3, 2006 to match that found in the
State Coastal Zone Management Act. Thus there is no longer a preference to use the vegetation line in the State rules, and the debris line, and vegetation line are to be given equal weight as evidence for the “upper reach of the wash of the waves.” The definition in the Hawaii County Special Management Area Rules § 9.4 uses the same exact definition as found in the Coastal Zone Management Act.
The concern for the former State regulatory definition had been that it placed a
preference on the vegetation line over the debris line, whereas the definition in the Coastal Zone Management Act places equal emphasis on both. With the recent modification of the State rules to match the statute, no preference is given to the vegetation line or the debris line.
In recent conversations with the State DLNR, they indicate that no marker
(vegetation line or debris lines) will be used exclusively and all are potential indicators for the position of the shoreline.11 This is also in conformity with the recent Supreme Court decision, Diamond and Bronstein v. State of Hawai’i, Board of Land and Natural Resources and Carl Stephens. In this October 24, 2006 opinion, the Court held that there is no per se rule giving primacy of the vegetation line over the debris line in determining the “upper reach of the wash of the waves.”
From observations made during the field trips there are several issues with the
shoreline certification process, especially for the Kapoho area and in light of the recent Supreme Court decision. These problem areas are discussed below.
The major problem with relying on the “upper reach of the wash of the
waves,” is that it can lead to highly variable, and difficult to document results within a short distance. This can lead to determinations that do not make sense in the administration of a coastal area. This is especially true for Kapoho. Some of these abnormal results have been taken care of by statute or rule, but not all. Below are a few examples of the abnormalities that can result from the current definition of the shoreline, and the existing or proposed regulatory exclusions to address these anomalies.
1) In recognizing that the upper reach of the wash of the waves may result in
wave inundation significantly inland from an existing house, the exclusion was added to not consider storm or seismic waves (tsunamis). This would prevent the result of a shoreline being placed thousands of feet inland from existing houses.
11 Interview with OCCL – DLNR and UH Sea Grant extension agent Chris Conger on November 21, 2006.

30
2) Because high winter surf is not considered a storm or tsunami, and yet inundation can occur hundreds of feet inland from existing houses, exclusion has been proposed, and practiced in the field by professional surveyors and even the State Surveyor that the high winter surf must be annually recurring. Again, this is to avoid the result that places the shoreline hundreds of feet inland from an existing house. Taken literally, the shoreline could be placed along some North Shore beaches on Oahu, inland of the coastal road and makai houses.
3) In the past, the shoreline has been placed at the toe of a revetment or base
of a seawall, even though the true upper reach of the wash of the waves would be significantly inland of these structures. This exclusion is to prevent the result where the seawalls or revetments, even if legally permitted, would eventually become significantly seaward of the shoreline.12
4) Because there are instances where the coastal slope may dip away from the
ocean, and there is the potential for inundation to move significantly inland not by the force of wave action and runup, but by gravity flow downhill, a further exclusion has been proposed for this situation.13 This is significant in the Kapoho area and discussed briefly in a review of the shoreline certification process for the State Legislature. This issue will be revisited shortly.
5) In the Kapoho area, the current practice of using upper reach of the wash of
the waves or surface connection to the ocean to define the shoreline can also lead to abnormal results. For instance in Figure 3-11, a two foot wide channel is shown that crosses Waiopae Road. Although the boundaries of the channel can be accurately mapped to the nearest centimeter using the latest sophisticated instruments, the information would of little value if the measurements have no regulatory use. If surface connection is the valid criteria for this area, then a two foot portion of the road would be under state jurisdiction, and the dry portion of the road under the county of Hawaii. Although surface connection can lead to abnormal results for this small channel, it would be more reasonable if the channel became deeper, wider and more persistent over time. However at what point is the channel sufficiently large to take on regulatory significance?
From the above scenarios, it is apparent that a strict literal application of the shoreline definition, especially that which relies on wave runup or the upper 12 The current practice at the DLNR is to place the shoreline at the upper reach of the wash of the waves, even if it is mauka of a structure. 13 State of Hawaii – Department of Land and Natural Resources, “Requesting a Review and Analysis of the Issues Surrounding the Shoreline Certification Process for the Purpose of Establishing Shoreline Setbacks,” Report to the Twenty-Third Legislature Regular Session of 2006. 19 pages.

31
reach of the wash of waves can lead to unusual results. For example, if the shoreline is too far back in relation to existing structures, either exclusion has been created, or has been proposed, or the literal interpretation has not been followed in the field. The examples given for: (i) storm or seismic waves; (ii) large winter waves that are not annually recurring; and (iii) water that flows inland from gravity flow, as opposed to wave runup illustrate this point. A sense of reasonableness to the conditions at the site is often utilized that takes place in the interpretation of the shoreline. However, two other complicating factors are at play. The recent Supreme Court decision indicates that there will be less flexibility in determining the “upper reach of the wash of the waves.” If there are any changes in the shoreline certification process, rules at the State level would need to be changed and the State rules are already under a high level of scrutiny. Also the indication of active subsidence in Kapoho suggests that the State and county should not be flexible in determining the shoreline in this area because it can lead to increased development pressure in an area that is actively subsiding and subject to frequent flooding. So although options for shoreline certification are given in the last part of this Chapter, it is up to the county and/or State to determine if they will be pursued. These options are not necessarily recommendations since it is not the purpose of this report to set policy.
Figure 3-11 - During the high-tide event of August 17, 2005 – water crossed the makai ocean lots, and then the road, causing significant flooding of the mauka lots (right) as water spilled over from the road. Using surface connection to the ocean as a criteria to determine the shoreline can result in portion of the road being under State jurisdiction, while the majority is under county jurisdiction.
Submerged Land?State Jurisdiction?
Shoreline?County Jurisdiction

32
3.4 Proposed Options Four main options were identified to address the shoreline certification issues in this area, specifically with regard to the location of the shoreline. Each of these options has advantages and disadvantages. It should be remembered that the difficulty in developing options is partly due to the past subsidence in the area that allows the ocean to interfinger with current development. It should also be noted that these options were originally developed for the County to consider, but with the recent shift in the State policy on shoreline certifications, it is unknown the extent that the State will follow these options. The four options presented are: (i) use of the current county practice of surface connection; (ii) rely on an increased use of the vegetation line; (iii) use the transition from runup or wash of the waves to gravity flow; and (iv) set an arbitrary boundary such as the mauka edge of Waiopae road. 3.4.1 Surface Connection One possibility for the shoreline determination is to use the current practice of surface connection to determine the shoreline. In the past, the County of Hawaii has used a 2.8 high tide to determine the extent of inundation and then where a setback should be measured from. Now that the State will be actively conducting shoreline certifications, they have indicated that the surface connection is a viable methodology and that they will also use a 2.8 high tide as their main criteria. The surface connection methodology is technically valid since a rising high tide at Kapoho generally has little wave action under non-storm conditions. This is due to shallow areas being flooded and the height of a wave is depth limited. Thus a high tide at Kapoho will give a reasonable approximation of the maximum inundation during a year, absent very large storm waves. For many of the ponds found on lots mauka of Waiopae Road, and in particular the lots that were two rows removed from the road, it is very difficult to determine if the ponds have a surface connection to the ocean or if the water level was raised by tidal influence by subsurface connection. This could have an impact on the administration of the area, since submerged lands would fall under the jurisdiction of the DLNR while those ponds or water bodies that are simply tidally influenced should be treated as a wetland with jurisdiction under the Army Corps of Engineers. The difficulty in determining the status of many of the ponds is due to many factors. First, there is thick vegetative cover in many areas, which makes access and observations to the area extremely difficult. Second, many of the ponds are very large, and it is difficult to trace throughout the boundary of the pond, which may be on several properties, if there is any possible surface connections. Even a small channel can provide the necessary connection. Finally, owing to the undulating lava topography, a circuitous route is possible for a channel to link the pond with the

33
ocean. To thus determine the status of the very inland waters would be very time consuming and beyond the scope of this study. There are several advantages and disadvantages of surface connection. Some advantages are that it is technically sound and can be implemented within the current regulatory and statutory framework with no modification to existing laws. Also it was the practice followed by the Hawaii County Planning Department and soon to be followed by the State. Finally, if controlling development for hazard mitigation purposes is important, using the surface connection method will identify risky areas that are vulnerable to future flooding, wave action and subsidence. The disadvantage of using surface connection is that it can lead to unusual results as seen for Figure 3-12. If surface connection is utilized, some discretion should be provided to the implementing agency, whether it is the county or the State. Also surface connection, while being the most conservative of the four options discussed in this report, may still not be conservative or restrictive enough. For example, tides higher than a 2.8 foot high tide can occur and cause greater problems than the tides used for certification purposes. The same can be said of storm or other very high wave events, which are excluded in the shoreline determination by definition, but in real life can cause significant hazard risk. Also there is the possibility of tides less than 2.8 MLLW accompanied by high non-storm waves causing much greater inundation than a 2.8 tide by itself. 3.4.2 Using the Transition to Gravity Flow In the review of the shoreline certification process by DLNR for the 23rd Legislature, a report for improved administration of the shoreline certification process was submitted. This report was put together with the input of environmental groups (Sierra Club), business groups (Land Use Research Foundation), administrative organizations (DLNR, CZM – Office of Planning) and technical organizations (University of Hawaii – Geology Department & Sea Grant). In the report, the situation was recognized that the water position setting the shoreline should be based on wave energy run-up and not gravity flow or funneling through narrow passages.14 A definition for run-up was proposed that would replace the “upper reach of the wash of the waves.” The proposed definition was:
“run-up” means that the water position setting the shoreline must be derived exclusively by wave energy run-up and not aided by gravity or funneling through narrow passages. Where it is unclear to what extent the gravity flow played a part in the run-up, the transition from run-up to gravity flow shall be interpreted as shoreline (based on evidence, expert knowledge, and reasonable expectation).
14 DLNR report, proposed definition of runup on page 13 of the report.
34
In the DLNR report, it was proposed to specifically change the definition of the shoreline to add the term run-up and exclude gravity flow. When a bill was submitted to change the definition, controversy prevented its passage. However, with the existing definition of the shoreline, the case can be made that the State and counties can already, under their existing discretion, exclude gravity flow. During the shoreline certification process there is much discretion, and the State Surveyor looks at much evidence including the vegetation line and debris lines to determine the “upper reach of the wash of the waves.” The surveyor is to determine the upper reach of the wash of the waves, and this implies that the limit of the force of a wave, or the limit of wave wash or runup will determine the shoreline. Examination of Waiopae Road during maximum flooding events, such as at high tide, will allow the surveyor to identify where water flow is by wave runup (to be included) and not gravity flow downhill. So given reasonable discretion in the interpretation of the existing shoreline definition, gravity flow can be excluded. Although there may not be a need to modify the shoreline definition to exclude gravity flow, given the recent Supreme Court decision, it may make the State surveyor more hesitant to exclude gravity flow without changes in the definitions as described above. Given the current sensitivity with the shoreline definition, changing the definition in the State statutes would be hard to do. The definition could be changed in the rules at the State level and the county level, but this would also be difficult because of the issue, whether warranted or not, about the consistency with the controlling State statute. Nevertheless gravity flow, could be considered in the shoreline determination because supposedly debris lines would be caused by the upper reach of the wash of the waves, or run-up, while gravity flow would leave evidence looking different (e.g., no debris lines).
From comments received by the State Surveyor’s office, Department of
Accounting and General Services, gravity flow could possibly be excluded and is characterized where water is flowing downhill at an elevation above sea-level. For example in the case where wave washes up a beach face, overtops the dune and the water flows downhill by gravity, the portion flowing down hill could conceivably be excluded as evidence of the shoreline. Conversely, runup (water rushing up the slope of a beach) or current (water moving downhill because the bathymetry is below sea level) should be included in the location of the shoreline.
In our observations of the water flow at Kapoho, it appears that in a few places along the mauka edge of Waiopae Road, water is flowing by gravity flow as opposed to runup or current flow. However it is not always possible to determine along the entire length of the road if the water is flowing mauka because of spillage and gravity flow or run-up and currents. Generally for the larger breach and channel in Figures 3-7 to 3-9, the water is flowing by run-up or current, whereas for the smaller and shallower channels, gravity flow may play a role in the extent of inundation. Thus, in a few locations, such as near the intersection of Waiopae and Kaheka, where flood
35
inundation is less extensive, the shoreline could be considered seaward of the road (e.g., where there are seawalls or natural coastal vegetation). The advantage of excluding gravity flow as a solution is that it is technically sound since gravity flow is not related to runup (or wave runup or the “upper reach of the wash of the waves”). This was rightfully recognized by several technical organizations. It is also politically acceptable solution since it utilizes a definition proposed by various administrative, technical, environmental and business groups. For example, the State Surveyors office was part of the review team that recommended the exclusion for gravity flow – presumably for technical and practical reasons. Finally it provides some discretion to the implementing agency to account for situations as seen in Figure 3-9. The disadvantage is that the transition is not always easy to identify. Also excluding gravity flow will increase development pressure in areas already being flooded and possibly getting worse. Finally, it is up to the State surveyor to make the final decision on gravity flow issues, and given the current scrutiny of the shoreline definition on a State wide basis, they may require a change in the State statute or regulations or both. Under the current regulatory environment, this would be difficult to do, although this report indicates it may be within the State’s discretion to exclude gravity flow without a change in the rules or statutes. 3.4.3 Relying on an Increased Use of the Vegetation Line In determining the “upper reach of the wash of the waves,” the evidence can still be by traditional markers such as the vegetation line or debris line. Where no debris exists, naturally occurring vegetation can be used as a marker, or evidence. At Kapoho, it is difficult to identify debris lines and this is apparently because the major inundation observed for shoreline determinations has been by rising tides rather than wave action. With the paucity of information provided by debris lines, key evidence would come from observation of inundation from high tide events, or the presence of certain types of vegetation. However, using vegetation alone can be tricky since certain types survive seawater inundation and thus are not good indicators of the shoreline. Sea grasses found along the makai side of Waiopae Road would be a poor indicator of the shoreline because they are salt tolerant and survive monthly or even daily inundation. Conversely, naupaka to a lesser extent, and especially milo trees are a good indicator as their tolerance for salt water is less or non-existent. There are some milo trees seaward of Waiopae Road at the east end near Kaheka St. These trees are a good indication that the elevation at that location is sufficiently high so that inundation is currently not a problem and that the shoreline should be seaward of their presence.

36
The advantage of using vegetative evidence is that there would be no need to change existing rules or statues. A disadvantage is that given the recent Supreme Court decision, all evidence should be considered to determine the “upper reach of the wash of the waves,” so there can be no per se rule, policy or determination that the vegetation should take preference over other evidence. However, given the lack of obvious debris line evidence in the area, vegetation does appear to be an important indicator. Also, to what extent vegetation is used by the State to determine the shoreline is up to the State surveyors office, but the use of trees that survive only in fresh water appear to be valid evidence of a shoreline. 3.4.4 Using Arbitrary Natural or Man-made Monuments Due to the anomalous results possible from the use of the shoreline definition in general, and in particular for Kapoho, one option could be for a greater reliance on manmade or natural features. Effort could be made to emphasize a readily recognizable feature (natural or manmade) that approximates the “upper reach of the wash of the waves” such as the mauka edge of Waiopae Road. An analogy to this option would be the past practice of using the edge or base of a seawall or a revetment as an indicator of the “upper reach of the wash of the waves, even though the real upper reach would be much farther inland. Using the mauka edge of Waiopae Road in certain locations as the maximum inland extent of the shoreline may make sense for several reasons. It could be a practical solution since all lots similarly situated from a development perspective can be treated roughly the same. This is opposed to having one lot mauka of the road being unaffected, while the other being unbuildable, for the simple reason that a two foot channel of water spills over from the road. There is also precedence for such a solution because it makes analogy to the past practice of setting the shoreline at the edge or the base of the seawall or revetment.
A disadvantage of using the mauka edge of the road is that it would require a change to the shoreline rules at the State level. This would be difficult to do. Also, since the practice of using the toe of a revetment or seawall has been discontinued, the possibility of using the edge of the road as a shoreline would be more difficult to rationalize or justify. Finally, to treat all properties similarly situated from a development perspective may underestimate flooding and inundation risk since it does not account for the level of flooding on each particular property, which is dependent on relative sea-level and the elevation of the property.
3.4.5 Datums, Elevation, Topography, Wave Events Several possibilities were considered to address the shoreline certification process in Kapoho, including increased use of detailed runup information, use of water level datums and elevation. For the following reasons, these concepts were not deemed feasible.
37
Using another method such as a set datum, elevation or topography to determine the shoreline is ruled out in this study because it would require extensive changes at the statutory and regulatory level. Also, on-going subsidence would make the use of a set datum or elevation outdated after many years. Another difficulty would be the significant topography changes within the same property. The case can be made that the shoreline at Kapoho should not be determined by high tide events, but high wave events. Under the current shoreline definition, this would exclude storm and seismic (tsunami) events but not seasonal high surf from distant swells. Actually, under the definition both high tide and wave run-up should be considered. It was outside the scope of this study, but it is generally felt that high tide events are most useful for Kapoho area because wave runup is limited by wave height which is limited by the depth of water over Waiopae Road. Supposedly, further studies could have been conducted that made a comparison of high tide events with lesser tides coinciding with high non-storm surf. This was outside the scope of the study. Furthermore, the need to even do this illustrates some of the problems with the shoreline certification process. A thesis or dissertation should not be needed to determine the shoreline, because it only determines the baseline from which other regulatory or development standards apply (e.g., the setback).15 3.4.6 Waiver The Hawaii County Department of Planning could also use their power of waiver, under their SMA rules. Under Section 9-10(B)(9) – A shoreline survey (is required) when the parcel abuts the shoreline, except that the Director may waive the submission of the survey when the proposed development is clearly and unmistakably located on a shoreline parcel at a considerable distance from the shoreline. It could be argued that the areas mauka of Waiopae Road subject to flooding by gravity flow are a considerable distance from the shoreline. Also under the Hawaii County shoreline setback rules, Section 11-4(c) the Planning Department may waive the certification requirement in cases in which there may be unusual physical circumstances or conditions of the land. The case can be made that these circumstances apply to Kapoho given the subsidence, natural topography and existing development. Perhaps the waiver would be acceptable if the shoreline was occasionally flooding but stable. However, the problem of using the waiver in the Kapoho area is that if an area is flooding, it is likely to get worse from ongoing subsidence. It may be possible to resolve this issue by considering the level of flooding and projecting future flooding problems by using a rate of subsidence and the slope of the land.
15 In the 1994 report on Shoreline Certification Review and Recommendations, it was recommended that the shoreline be interpreted in a way that is simple to identify and administrate. Thus increased emphasis on the vegetation line was proposed. Fletcher and Hwang – 1994.

38
However, this can be difficult to do since the rate of subsidence in this report is based on three years of data and ideally the area should continue to be monitored. Also, while there is a general regional slope of 3.5 X 10⁻⁴ degrees, there is much variation from lot to lot. So while attempting to plan for ongoing subsidence events is theoretically possible to do, it is difficult to do in practice and episodic events such as a large earthquake, hurricane, tsunami or subsidence event further complicate this option. When the Hawaii County Planning Department was conducting observations for certain applications to determine surface connection, the State Surveyor, Reid Siarot, indicated that their Department may be open to a waiver of the shoreline certification process for those lands mauka of Waiopae Road. Now that ongoing subsidence has been indicated, and the DLNR is taking the lead again in shoreline determinations, it remains to be seen if this is an option they would entertain.16 3.5 Conclusion and Recommendations The shoreline recommendations and options discussed in this section may be viable, but it is the final say of the State Surveyor to determine the manner by which shorelines will be certified. The State Surveyor’s office will examine each certification on a case by case basis. So, although the proposals in this report appear sound, a check should be made at the applicable agencies (DLNR, County of Hawaii Planning Department and Army Corps of Engineers). The option to exclude gravity flow in determination of the shoreline would affect primarily a few houses immediately mauka of Waiopae Road. If gravity flow were excluded, development pressure will likely increase for a few areas. This has pluses and minuses. On one hand, the investment that landowners have placed in the property can be partly recovered. Interviews with some landowners have indicated that their main concern is whether they can build on some of the vacant lots in this area. On the other hand, the area is subject to flooding, tsunamis and hurricanes and therefore, some of the areas are at high risk from natural disasters. Ongoing subsidence will increase this risk. Thus hazard mitigation and disaster risk reduction will need to be addressed in a more robust manner. This is covered in subsequent sections of this report.
Of course each lot will have to be examined on a case by case basis, and rough generalizations are applied. For many of the lots makai of Waiopae Road, the clarification of the shoreline to exclude gravity flow should not affect these lots greatly. There will still be an issue of flooding of these lots, and whether they can be built on. However, it should be noted that the lots makai of Waiopae Road, but towards Kaheka
16 Also by interview with the Army Corps of Engineers, the Corps is unlikely to claim an open water connection for the channels crossing Waiopae Road (Figure 2-7), although they will treat tidal ponds makai of the road as wetlands.

39
Street are sufficiently high so that the shoreline can be interpreted, using natural coastal vegetation, as seaward of those houses.
Many of the options presented are not mutually exclusive. For example, the recent Supreme Court decision indicates that during a shoreline certification, all relevant evidence for the “upper reach of the wash of the waves should be included.” This would include inundation as indicated by determining surface connection and flooding during a high tide event, as well as vegetation that is not salt tolerant. Whether inundation by gravity flow is relevant evidence could be a factor for the State surveyor to determine.

40
Chapter 4 – Coastal Hazard Mitigation and Issues with the Special Management Area
This Chapter covers specific issues that the Planning Department for the County of Hawaii asked to be addressed related to administration of the Special Management Area, the shoreline setback and coastal hazard mitigation. The major issues that the Planning Department asked to be addressed fit into one or more of the various stages of development as shown in Figures 4-1 and 4-2. These issues include:
(i) Permitting new development for zoning changes, general and community plan amendments and subdivision. What does the county do for new permits for development? (Stages 1-4)
(ii) Infrastructure Improvements – such as building, maintaining or raising
Waiopae Road to reduce inland flooding. Another key infrastructure issue is wastewater disposal at Kapoho. (Stage 5)
(iii) Lot Transfer – the process of buying or selling existing lots and houses.
This is a major issue at Kapoho, especially with regard to disclosure. (Stage 6)
(iv) Building new homes with appropriate hazard mitigation measures to
reduce the risk of flooding, wave action and earthquake motion. (Stage 7)
(v) Addressing hazard mitigation issues after the fact, or after the area has been developed without the use of the preferred mitigation measures – (e.g., new seawalls, raising the height of existing seawalls, legal status of existing sea walls, land swaps). (Stage 8)
Since the Kapoho area is highly susceptible to natural hazards, and the area is already developed, the later part of this Chapter discusses additional solutions and options that can be pursued by the affected parties.
4.1 Permitting New Development for Zoning Changes, General and Community Plan Amendments and Subdivision
Given the history of natural hazards in the area, the potential for future hazards, as well as the geological setting, (Chapter 2), it is very important to plan for future events at Kapoho. Because of the issue of episodic and ongoing subsidence, the proper siting of coastal structures is especially important. The best time to address hazard mitigation measures and the use of siting to reduce risk from future flooding and wave risks is during the early stages of

41
development (i.e., zone changes, general and community plan amendments and the subdivision process). This report recommends that the issue of natural hazards be planned for at all stages of development as explained in the “Hawaii Coastal Hazard Mitigation Guidebook.”17 This is especially important if hazard mitigation measures for both siting and construction are to be implemented (Figure 4-1).
Figure 4-1 – From the Hawaii Coastal Hazard Mitigation Guidebook. Given the number of natural hazards in the Kapoho area, both siting and construction measures for hazard mitigation are recommended. Siting measures are best addressed at the early stages of development, e.g., during zoning, general and community plan changes and the process of subdivision.
The earlier in the development process hazard mitigation issues are addressed, the easier it will be to implement the measures for several reasons such as property rights, and market value of the property (Figure 4-2). Thus this report recommends planning for natural hazards at Kapoho and adjacent areas very early in the development process. Figure 4-2 – From the Hawaii Coastal Hazard Mitigation Guidebook. As each stage in development proceeds, the landowner invests more time and money into the project. This serves to increase the market value of the property (column 1) and the investment backed expectations of the landowner (column 2), which is related to property rights. This will result in the community having less input into the project and the number of options the government has to reduce hazard risks will diminish (e.g., buying the property).
17 Report prepared for the Office of Conservation and Coastal Lands, DLNR, Coastal Zone Management Program, Office of Planning, State of Hawaii; University of Hawaii Sea Grant College Program; and the Pacific Services Center and Coastal Services Center of NOAA.

42
For this reason, it is also suggested that the issue of hazards be addressed through an assessment of hazard risk for Kapoho and adjacent areas. The hazard assessment can address issues specific to a particular area on a case by case basis. A guideline for a hazard assessment is found in Figure 4-5 of the Hawaii Coastal Hazard Mitigation Guidebook. The question may arise under what authority an assessment of hazards can be requested to the potential applicant of a project. The county should have sufficient authority under their SMA rules, the EIS process or their subdivision regulations. Under both the SMA and EIS process, the objectives and policies in HRS-205A are applicable and include the policy to “Reduce hazard to life and property from tsunami, storm waves, stream flooding, erosion, subsidence, and pollution.”18 Under the Hawaii County Subdivision regulations, “A lot shall be suitable for the purposes for which it is intended to be sold. No area subject to periodic inundation which endangers the health or safety of its occupants may be subdivided for residential purposes.”19 From the same code is found, “The lot size, width, shape and orientation, and the minimum building setback lines shall be appropriate for the location of the subdivision, the type of development and the uses contemplated.”20 So initially, there may be little need to amend the Special Management Area or shoreline setback laws for siting changes in the early stages of development. Although the need may not be critical, it may be a good practice to amend the rules to provide additional notice to landowners on restrictions that may be in place due to the problems with subsidence. Once hazards are assessed, there will be many remaining issues and questions. At least two options are presented in this report. First, the county could try and restrict development in flood inundation areas through the zoning process or before subdivision. Some parameters that can be used include an estimated local rate of subsidence, a time period related to the life expectancy of the structure or useful life of a project or subdivision, and a local or regional slope. With this information, a potential inundation zone, or setback in the future could be roughly estimated and the area protected from future development. Information in this report is provided on one way to implement a setback since a regional slope is provided as well as a local rate of subsidence based on three years of data. The setback option would be protective, but also restrictive. One disadvantage of the setback option is that it can lead to a very large area that cannot be developed. One advantage is that the large area may be needed because while it may be possible to account for steady ongoing subsidence, it will be difficult to account for catastrophic events like episodic subsidence, hurricanes and
18 Hawaii CZM Act – HRS Section 205A – 2(b)(6)(A). Applicable portions are emphasized in italics. 19 Hawaii County Code Section 23-37 20 Hawaii County Code Section 23-32

43
earthquakes. Unfortunately the Kapoho area appears to be subject to the steady predictable changes as well as the episodic, unpredictable ones. Another option is to utilize a concept initially proposed by the County of Hawaii Planning Director Chris Yuen, that is of a rolling easement. The rolling easement concept was initially developed in Texas and is described in a Maryland Law Review article by James Titus.21 Under the rolling easement concept, the landward migration of the coastline cannot be stopped by hardening such as with seawalls or revetments (Figure 4-3). Before development proceeds the expectation is built into the project that the landowner cannot stop the sea if there is a landward migration that threatens structures. Once the shoreline moves sufficiently inland, so that the property line is landward of the structure, the landowner is required to remove the structure. Thus the land areas near the shoreline can be developed, but any migration sufficiently inland will result in the structures removal.
Figure 4-3 – The rolling easement concept allows construction near the shore, but requires the landowner to recognize prior to development the unstable nature of the shoreline. As the shoreline migrates inland in this example, the landowner is prevented from stabilizing the shoreline artificially. Eventually when the footprint of the property is on public land, it is required that the house be removed. From Titus, J.G., 1998.
The advantages of the rolling easement are the disadvantages of the setback and vice versa. The rolling easement allows the shore to be developed, so that there is economic utility. Conversely, it can allow development very close to the ocean in places that are vulnerable to future hurricanes, tsunamis, episodic subsidence and even minor storms. Another disadvantage of the rolling easement is that it may be
21 Titus, J.G., Rising Seas, Coastal Erosion, and the Takings Clause: How to Save Wetlands and Beaches without Hurting Property Owners, Maryland Law Review, 1998, vol. 57, pg. 1279.

44
difficult for homeowners to abandon their property after a certain triggering event as they may become emotionally and financially attached to the property. This maybe overcome by creating a very strong investment backed expectation into the property before building that the useful life of the property will end when the shoreline migrates sufficiently inland. This expectation would have to survive different ownership, so that disclosure during the sale of property is vital (see Section 4.3). It is also possible that a hybrid of a setback and rolling easement could be employed in different percentages. In choosing between the options, or a mix of the options, at least two factors to consider are:
1) What stage of development the project is in. If the project has already been zoned, subdivided and infrastructure is in, it may be more difficult legally to employ the setback.
2) What is the threat to life, as opposed to property? If developing closer
to shore will place inhabitants at risk, a more conservative approach would be appropriate, versus if only property was at risk. Things to consider would be the ability to evacuate and the frequency of occurrence of natural disaster events.
There are many examples of subdivisions in the Puna District that were
developed with little consideration for the hazards in the area (Kapoho, Royal Gardens, Kalapana, and Kapaahu). The problems in these areas provide a reminder of the importance for planning for hazards during the zoning, general and community planning and subdivision stages of development, when land-use tools such as a setback or rolling easement are most effective.
4.2 Infrastructure Improvements
There are two infrastructure improvement issues that the Hawaii County
Planning Department and the residents of Kapoho specifically asked to be addressed. These relate to the raising of Waiopae Road to prevent flooding mauka of the road and also wastewater disposal issues.
4.2.1 Raising or Rebuilding Waiopae Road During the October 19, 2006 community meeting for the Kapoho community, numerous residents brought up the possibility of raising or repairing Waiopae Road to serve as a barrier to prevent flooding of inland properties. While raising or repairing the road can provide some protection to properties mauka of the roadway, a concern was raised by other residents in attendance about the impact to properties makai of the roadway and the possibility of increased flooding. This was expressed by homeowners in the audience that were situated makai of Waiopae Road.
45
If the roadway is raised or repaired to act as a barrier, which on its face seems as a viable solution, it is recommended that either the properties makai of the roadway provide consent or they be encouraged to move off the property by the mechanism of a land swap or buyout (see later sections of this Chapter). Alternatively, it maybe possible that a study examining flooding can determine and certify that there would be no adverse impact on lots makai of the improvement. Without an official study on this specific issue, it should be assumed that the improvements that build up Waiopae road will increase flooding on the makai lots.
4.2.2 Wastewater Issues At the beginning of the Kapoho study, wastewater issues were of concern to the residents and were one of the outstanding issues to be addressed. Since the start of this study, Senate Bill 2480 was approved by the State legislature and appropriated $150,000 specifically to study wastewater options for both the Kapoho Vacationland and Beach Lots area. Since this major funding was approved and released by the Governor’s office specifically for wastewater issues, the importance of addressing wastewater, which is a very small component of this report is minimized. It is suggested however that the factor of subsidence be considered in the future study commissioned by Senate Bill 2480. This Bill was introduced by Senator Russell Kokubun.
4.3 Lot Transfer In the interview with numerous residents and other government organizations,
it became apparent that many landowners and homeowners in Kapoho bought their properties without conducting the proper due diligence. Some lot owners bought their properties without seeing prior severe flooding events. Whenever there is an exchange of property, there are two separate issues related to the due diligence of the buyer and the disclosure of key information from the seller. This may vary if a house is being sold or just an empty lot is up for sale.
4.3.1 Due Diligence of the Buyer Whenever coastal property is bought, the buyer should make their own
investigation into the characteristics of a property. Some guidelines for that investigation come from the following two publications, “Hawaii Coastal Hazard Mitigation Guidebook” and “Purchasing Coastal Real Estate in Hawaii.”22 The key issues to look out for are the elevation of the property and the susceptibility to erosion, flooding, subsidence or other natural hazards. If the potential purchaser does not know the signs to look out for, they should consider hiring a professional geologist or coastal engineer to conduct a hazard assessment of the property. In the 22 Available from the University of Hawaii Sea Grant College Program.
46
long run, this may wind up saving the purchaser considerable money. For the Kapoho area, the key issue to investigate is the susceptibility of the property to high tide events and how flooding risk may change in the future, if there is ongoing or episodic subsidence.
4.3.2 Disclosure by the Seller There are State laws related to the disclosure of material information when a
house is sold. Under the Mandatory Seller Disclosures in Real Estate Transactions Act,23 there is a requirement that the seller or seller’s agent disclose all material facts that would affect the value of the property. Subsidence would be such a material fact. Unfortunately there are certain gaps in the law, and empty lots without a structure are not covered. There is anecdotal evidence that empty lots at Kapoho have been sold to uninformed buyers who later discover the extent of flooding problems in the area. This is unfortunate because these buyers, with their purchase create an expectation that they will be able to develop the lots. Whether this expectation is reasonable or not is another matter.
Because of this serious gap, it is recommended, and the county of Hawaii will
propose strengthening of the disclosure requirements at the county level. This would be preferable versus trying to amend the State law. Also, a requirement for disclosure could be put in as a condition for a SMA permit. This would be under the discretion that the department has in administering the SMA program and following the objectives and policies in the Hawaii Coastal Zone Management Act related to hazard mitigation.24 It is always possible to amend the county SMA rules as a precaution, but for the disclosure requirement only, this should be in the Department’s discretion. If however, there are many new provisions that are required related to subsidence, the SMA rules should be amended.
4.4 Home Construction This report recommends that both hazard mitigation measures for siting and
construction be employed (Figure 4-1). If construction is to proceed, the issue of future flooding, wave action, subsidence and earthquakes should be addressed (Chapter 2). Unfortunately, while many of the hazard mitigation measures for construction reinforce each other, there are some that don’t. For example, raising a structure to avoid flood or wave action may make it more prone to damage from earthquakes. If the structure is raised even higher to account for subsidence, there will be increased stress on the columns and piers from earthquakes.
All of this needs to be considered, if there is construction. Some of these
issues maybe addressed under the county’s national flood insurance program. Under 23 Hawaii Revised Statutes Section 508D 24 Hawaii Revised Statutes Section 205A
47
this program, the structures near the coast are to be elevated above the 100-year base flood elevation and construction standards are to address wave action in V zones and flooding in A zones. The base flood elevations are found on Flood Insurance Rate Maps or FIRMS. Unfortunately the FIRMS do not take into account subsidence of the land. If there is subsidence, the hydrodynamics of the coastal area will change and will put coastal properties at greater risk from coastal flooding and wave action. This can be compensated somewhat by building higher (i.e., adding freeboard), so that the property can still withstand the 100-year flood or wave event, even with future subsidence of the land. The freeboard can be estimated by using a local subsidence rate and a yearly number appropriate for property (e.g., the life expectancy of the property).
The requirement to build for wave and flood action under the National Flood
Insurance Program is directed by the Engineering Department within the Department of Public Works. Building higher with freeboard is not a requirement, but recommended and encouraged under the National Flood Insurance Program.25 In order to require freeboard tied to subsidence, it maybe necessary to implement this requirement through the SMA process and amend the applicable SMA rules. This would then require action by the Building Department of the Department of Public Works and not the Engineering Department.
When structures are elevated to account for wave, flooding and subsidence,
they are especially prone to earthquake shaking. As can be seen from Figure 2-2, the area is very prone to earthquakes. Some measures to deal with elevated piers or columns and earthquake shaking is to build stronger piers or columns or reinforce them with knee bracing or cross bracing.26 Some examples of structures with knee and cross bracing are provided in Figures 4-1 and 4-2.
Indirectly, the requirement to build for earthquake shaking is addressed in the
building code for Hawaii County. In this code, whatever is built must be designed by a structural engineer to address shaking associated with seismic zone 4. Once the structure is determined, then a structural engineer would design the structure to withstand shaking associated with seismic zone 4.
25 In fact a reduction in flood insurance rates is provided for building with freeboard, with greater reduction for elevating higher. 26 See Chapters 10,11 and 12 of the Federal Emergency Management Agency’s Coastal Construction Manual.

48
Building Coastal Homes to Resist Ground Shaking
Knee Braces
Cross Braces
Figure 4-1 – Examples of Coastal Homes with Knee Braces and Cross Braces to strengthen columns or piers that are needed to elevate houses for flood or wave protection (from FEMA CCM).
Figure 4-2 – Example of structure in Hilo designed for wave and flood action with modified knee braces on columns.

49
4.5 Hazard Noticed – Remedial Options Evaluated Many of the coastal areas at Kapoho have already been constructed without a
full appreciation of all hazards that are subject in the area. Thus this section is devoted to solutions for existing home and lot owners, as well as those the Hawaii County Planning Department can help to implement. These measures range from conventional measures such as increased protection from seawalls to unconventional measures such as a land swap. 4.5.1 Raising the Height of Existing Seawalls One issue that the County of Hawaii Planning Department asked to be addressed was to provide guidance on raising the height of existing seawalls. During site visits to the Kapoho Beach Lots subdivision, the waves struck very close to the top of existing seawalls. This is an issue that would be expected with the indication of active subsidence. Also from the site visits, the commonly known environmental impact of a seawall causing a beach to narrow or disappear should not be a concern at Kapoho, due to the fact that the shoreline is rocky. So the major issue with raising the height of seawalls has to do with if it is technically feasible. If there are requests to raise the height of seawalls, this should be accompanied with a coastal engineering study that indicates it is technically sound. Seawall design varies, and many seawalls are broad at the base, and taper towards the top (Figure 4-3). The width of the wall, and the size of the stone are often determined by the height of the design wave. If the design wave were to change to a greater height, because of subsidence, it may not be possible with sound engineering principles to just raise the wall without reinforcing the base. This is outside the scope of the study and it is recommended that a qualified coastal engineer approve such a change on a case by case basis. Many seawalls have a uniform width from the base to the top and are anchored by an L-shaped arm that is buried at the base in the sand or substrate. For these walls, the technical hurdles of raising the height may be less, but again it is recommended that a qualified coastal engineer approve such a change in a report that accompanies the permit application.

50
Figure 4-3 – Typical Gravity Seawall Design (from United States Army Corps of Engineers -Pacific Ocean Division) with a broad base and narrow top. The request for a coastal study to accompany a change in the design or build of a seawall should be within the County’s current regulatory authority so no new change in regulations would be anticipated. An important issue is how ongoing and episodic subsidence are factored into the design. Probably the former can be addressed by making assumptions on the length of use of the property and a preliminary subsidence rate. With this report, a local subsidence rate is provided and can be used until the rate is further refined by future or additional monitoring. More difficult would be to plan for future episodic events. 4.5.2 Building New Seawalls There may also be requests for new seawalls in the Kapoho Area. The analysis for this issue is somewhat similar to that for raising the height of existing seawalls. The concern about impact to a sandy beach should be of no concern, due to the rocky shoreline. One legitimate concern, however, is that any new seawall can divert flooding of the area to a new location. Due to this potential problem it is recommended that applications for new seawalls be accompanied by a coastal engineering report that states that flooding will not be increased elsewhere to the detriment of nearby property owners. The county Planning Department should have sufficient authority to requests this study so no new regulations would be required.
51
In the design of the seawall, the potential for subsidence should also be considered, otherwise there may be future requests to extend the height of the seawall, after the fact. It would be more efficient and economical to build the wall to the correct design height initially, than to attempt to modify the design at a later date. For both this section and 4.5.1, the county should balance the important need for the homeowner to protect themselves, with the risk of hazards as discussed in Chapter 2 of this report. 4.5.3 Legal Status of Existing Seawalls The Hawaii County Planning Department asked that this report help determine the legal status of the seawalls for the Beach Lots and Vacationland subdivisions. A review of the files did not allow a determination of which lots had seawalls which were legally permitted. For most of the files, there was no determination. On November 29, 1983, a complaint was made to the Planning Department by then Hawaii County Civil Defense Director Harry Kim regarding several properties in the Beach Lots and Vacationland subdivisions for an apparent violation of the shoreline setback law. The complaint called for further investigation of at least 31 properties. For many of these properties, this complaint is the only information in the folder and thus the question if the seawalls were properly permitted cannot be determined by the files alone, since the results of any other investigation of the structures that may have been done are not known. Seawalls built before June 22, 1970, the effective date of the applicable shoreline setback rules, are grand fathered in and deemed to be legal. An investigation was made at the R.M. Towill Company for aerial photographs that existed in the area for the period from 1965 to 1975. A 1977 aerial photograph was identified and then blown up 8 times to determine if there were existing walls at that time. Generally, the high altitude of the aerial photograph did not allow a determination if there were seawalls for most of the properties. For two of the west lots makai of Waiopae Road, existing walls were identified in 1977. If these seawalls existed before 1970, they would be legally existing walls. Although it could be surmised that the close proximity in time between 1977 and 1970 makes it likely that these walls existed beforehand, this cannot be certain since there could have been many activities along the shoreline after the 1975 Kalapana earthquake. 4.5.4 Land Exchange In studying the Kapoho area, both in the field and from existing reports, two observations stand out. First the area is very susceptible to natural hazards (Chapter 2). It would be hard to find a coastal area in the State of Hawaii that has greater risk. The area is at risk not only from slow ongoing processes, but major catastrophic events. Problems from a hazard mitigation standpoint and administrative standpoint are compounded because subsidence has allowed the development in the area to interfinger with the ocean.

52
Equally striking from the site visits is the beauty of the area, specifically the tidal pools, clear water and suitability of the area as a Marine Life Conservation District, of which there is currently one on site. While it was outside the scope of this report to work out the details of a land exchange, such an option should be investigated. One option of many is to obtain an appropriation from the legislature to study the feasibility and work the details of a land swap. This appropriation could be similar to the one passed in the 2006 legislative session which provided funds to study wastewater issues. However it is felt that deciding the future long term course for Kapoho should be just as important. The land exchange concept was very briefly mentioned in the October 19, 2006 community meeting. It was an option briefly commented on by a few attendees. They were in favor of this option and asked that it be addressed, but skeptical. This is understandable given the tremendous complexities associated with this option. With regard to a land exchange, a few points require clarification. Raising this option should not be implied or indicate that the State or county have a duty to pay compensation for properties at risk, or currently subject to wave action or flooding. Conceivably the State or county could take a hard approach under their considerable police power to protect life and property from natural disasters. However, the land exchange is an option that could be used to facilitate and expedite moving residents out of harms way before the area experiences a major hurricane, tsunami or episodic earthquake event with subsidence. A land exchange could be, or should be purely voluntary with the landowner having the option to keep their property, or exchange it for other areas that are inland. The incentive for the landowner to move would be if the regulatory scheme for inundated properties eventually resulted in not being able to build on the property at all. For example, a potential impasse may exist for some of the makai lots because of the extensive flooding on some of the properties. Yet the State is unlikely to claim land that is submerged. Part of this is due to the anomalous results possible given the topography on some of the lots (Figure 4-4). This topography could result in different portions of the same lot having different ownership status. If the State does not claim ownership of the lots, then they would remain as private property. Yet they may not be able to be built without a shoreline certification, or a SMA permit or a Conservation District Use Application permit, which maybe very difficult. This illustrates the impasse that exists for certain lot owners’ makai of Waiopae Road. A land exchange at either the State or county level could remove problem properties from this current limbo.

53
Figure 4-4 – On some makai lots at Kapoho, the land is submerged during extreme high tides, but the State is unlikely to make a claim for ownership of the land. One reason is that the natural topography on the lot results in portions being submerged while other parts or “islets” are dry and theoretically remain private property. It would be unlikely that the State would claim such land when there could be different ownership status for specific portions on the same lot. The land may remain private property while the possibility of building on it through a SMA or CDUA permit would be difficult.
Because of the potential impasse due to flooding, the State or county need not offer prime coastal real estate in exchange, but instead land of reasonable value that can be used as an incentive to move away from a hazard prone area. In considering the fairness of the exchange, the value of a particular Kapoho parcel in question should factor in its susceptibility and frequency to flooding, both in the present and the future. Finally, if a land exchange ever materialized, a possible strategy would be to target those properties that currently have the most severe flooding problem or are at a certain stage of development (e.g., empty lots that are about to be built on, or severely flooded existing homes). These would be some of the issues that could be addressed if the feasibility of the land swap concept were evaluated. In considering some type of land exchange, the process that was utilized to move displaced residents in the Puna District from land that was destroyed by lava should be considered as one of many options. For example, the Kikala-Keokea subdivision was created and leased to Kalapana residents displaced by lava flows.

54
4.5.5 Land Acquisition Another option from the land exchange, and one that maybe quicker to implement is to acquire certain problem properties. This acquisition can be offered as a voluntary incentive for the landowner to move from harms way. The history of flooding and the susceptibility to future events should be considered in calculating a fair amount to offer. At the time of completion of this report, a meeting was held with Senator Russell Kokubun, the originator of Senate Bill 2480 which commissioned the study of wastewater issues at Kapoho (see Appendix 2). The purpose was be to explore alternatives for Kapoho at the State level similar to those covered in Sections 4.5.4 and 4.5.5. Since the Legislature was instrumental in commissioning the study of wastewater problems at Kapoho, they could eventually be involved in initiating a study on the long-term solutions of the Kapoho area. This would have to be further explored. From these discussions, it was indicated that the DLNR and Board of Land and Natural Resources (BLNR) have the primary responsibility with respect to shoreline issues, subsidence and mitigating these impacts. Therefore an appropriate strategy would be that after landowners become informed of the facts of the surrounding subsidence, they could inquire with the DLNR and BLNR regarding appropriate options. It would be up to the DLNR/BLNR to investigate these requests and explore alternatives. One of the options could be to seek more resources from the legislature to gain more information, or propose a land exchange or land acquisition. Another alternative proposed by Senator Kokubun was to have a third party intervene such as the Nature Conservancy or Trust for Public Lands. These organizations could possibly purchase properties with a high natural resource value and in doing so, provide tax relief to the sellers. Subsequently, the state, county or federal government can then purchase these lands for park or other similar uses.

55
Chapter 5 – Conclusion and Summary
If subsidence continues at Kapoho, over time the area will become more vulnerable to events such as a major, or even a minor tsunami, hurricane or tropical storm. In addition, the area is subject to earthquake risk and associated shaking, potential major subsidence and a local tsunami. Unfortunately, the three major hazards (hurricane, tsunami and earthquake) are relatively independent and from past historical frequency, likely to occur in a persons lifetime. From the research conducted for this report, the following key points are provided:
1) Based on InSAR studies conducted at the University of Hawaii, the relative sea level rise for Kapoho has been estimated to be ~0.8 to 1.7 cm/yr+/- 0.8 cm/yr (2 standard deviations) over the last three years. This figure is in agreement with separate GPS measurements taken for nearby areas by the Hawaii Volcano Observatory.
2) The Kapoho area has a history of ongoing slow subsidence and more rapid
subsidence associated with major earthquakes (1823, 1868 and 1975).
3) It is recommended that the area continue to be monitored with InSAR, satellite GPS and tide gauges. The relationship between ongoing subsidence and episodic subsidence is not well known. In addition, continued monitoring will allow further refinement in the measurement for any subsidence.
4) The subsidence in the past has allowed the ocean at Kapoho to interfinger
with existing development. This complicates development decisions and makes existing development more vulnerable to hazards such as storms, hurricanes and tsunamis.
5) The Kapoho area is at high risk from hurricanes and tsunamis (distant and
local). Because of the low elevation from the subsidence, the vulnerability from major as well as minor events such as storms increases.
6) This report recommends that hazard mitigation issues be given serious
consideration during all stages of development for the area.
7) Some of the complications with shoreline certification in the past will be alleviated now that the State has changed policy and agreed to conduct certifications in the Kapoho area.
56
8) Based on the recent Supreme Court decision, it is recommended that all evidence be used to determine the shoreline (“upper reach of the wash of the waves”), including debris lines, specific types of vegetation that are not salt tolerant and observations of inundation based on high tide events (surface connection).
9) Observations on inundation based on surface connection are a valid
approximation to determine the shoreline. However this method may underestimate the upper reaches of the wash of the waves because of: (i) tides higher than 2.8 above MLLW, and (ii) wave and wind setup that may cause the inundation for lesser tides to exceed higher tides. Nevertheless, most wave action is depth limited.
10) Inundation based on gravity flow could conceivably be excluded from the
determination of the shoreline. Although this should be within the State’s discretion, if a rule change is sought by the State, this would delay this option.
11) Excluding gravity flow would facilitate development in some areas, but
would expose these developments to increased flooding if ongoing subsidence continues.
12) Since subsidence is active, care should be taken not to change the shoreline
certification process in a way that increases exposure of inhabitants and residences to actively flooding areas.
13) Based on site visits, there are three to four distinct areas where the water
breaches Waiopae Road during high tide. From site visits and interviews, the extent of inundation appears to be affected by wind and wave setup.
14) Hazard mitigation measures for Kapoho should include those for siting and
construction.
15) For siting, a hazard assessment that factors in subsidence should be conducted for new zoning, general and community planning amendments and subdivisions at Kapoho and adjacent areas. This will allow better planning of the area for future hazard risk and greater protection to future inhabitants. Siting measures such as a setback should be given equal, if not greater consideration over a rolling easement, especially in these early stages of developments.
16) In the case of an existing lot that floods, development of a new house should
be discouraged, but if it occurs, the proper measures should be employed (flood and wave construction, flood insurance, freeboard, earthquake

57
reinforcing, and disclosure of hazard risks). Implementation of the rolling easement concept should be considered for new houses on existing lots.
17) Because of subsidence, freeboard should be added to piers and columns.
Under the National Flood Insurance Program, the freeboard is not mandatory but incentive based with discounts provided in insurance for extra elevation.
18) The requirement for freeboard may require an amendment to the county
SMA regulations. If amendments are made, the requirement for adequate disclosure during a lot transfer or home transfer should also be included.
19) Consideration should be given to sending a request to FEMA to modify
their flood insurance maps based on subsidence. This would require a letter of map revision.
20) If structures are elevated with freeboard because of subsidence, the design
should account for shaking as required under the building code, which requires structures to be built to Seismic Zone 4. Strengthening of columns and piers, as well as knee or cross bracing may be required.
21) The county and State should work on a voluntary program of land exchange,
and or acquisition to expedite and encourage moving residents or potential residents out of harms way. When the risk of future disasters are considered, the cost for such a program could be very cost effective.
22) The wastewater study commissioned by the State legislature for Kapoho
should factor in subsidence.
23) Requests for new seawalls or to extend the height of existing seawalls should be accompanied with a coastal engineering study.
To facilitate the implementation of hazard mitigation measures, a program for land exchange or acquisition of property should be investigated by the State, county and landowners. Eventually, the State DLNR/BLNR could seek resources from the Legislature regarding additional investigation on the mechanics of a land exchange or acquisition program, or actual implementation of a program. Acquisition of property can also be initiated by organizations such as the Trust for Public Lands and the Nature Conservancy.

58
Appendix 1 - Summary and Analysis of Relevant Studies Applicable or For the Study Area
Federal Emergency Management Agency. 2000. Coastal Construction Manual –
Principles and Practices of Planning, Siting, Designing, Constructing, and Maintaining Residential Buildings in Coastal Areas, Vols. 1-3.
The Coastal Construction Manual provides measures to reduce the risk from all coastal hazards during the construction stage, and partly through siting. Many measures in the CCM are used in this report.
Fletcher, C.H. and Hwang, D.J. 1994. Shoreline Certification Review and Recommendations, Office of State Planning – Coastal Zone Management Program, p. 76.
This report reviews the shoreline certification process in Hawaii and makes several recommendations; the primary one is to use an increased emphasis on the vegetation line during shoreline certifications. This recommendation is discussed in this report.
Fletcher, C.H., Grossman, E.E., Richmond, and B.M., Gibbs, A.E. 2002. Atlas of Natural Hazards in the Hawaiian Coastal Zone, U.S. Department of the Interior, U.S. Geological Survey, University of Hawaii, State of Hawaii Office of Planning, National Oceanic and Atmospheric Administration, p. 182.
The Atlas creates a risk ranking scheme for all coastal areas in Hawaii based on the risk from tsunamis, stream flooding, high waves, erosion, sea-level rise, and volcanic-seismic activity. These risk maps are used in this report to provide a preliminary estimate of the hazard risk in the Kapoho area. This Atlas should be used as a preliminary guide to assess hazard risk for new development along the coast.
Hwang, D.J. 2005. Hawaii Coastal Hazard Mitigation Guidebook. Prepared for the Office of Conservation and Coastal Lands, Department of Land and Natural Resources; Coastal Zone Management Program – Office of Planning; University of Hawaii Sea Grant College Program; and the Pacific Services Center and Coastal Services Center of the National Oceanic and Atmospheric Administration, p. 216.
This report identifies coastal hazards of concern in Hawaii, develops a multi-hazard zonation scheme and recommends hazard mitigation measures for construction and siting based on the stage of development. These concepts are applied in this report. It is recommended that this report be utilized in future development decisions along the coastline.
Hawaii Community Foundation, Vacationland Hawaii Community Association, Kapoho-Kai Water Association, University of Hawaii-Hilo, State of Hawaii Department of Land and Natural Resources. Kapoho Reef Watch – Annual Report One – Summer 2004 – Featuring Human Use Surveys, Water Quality Monitoring, Biological Monitoring of

59
Fish, Algae and Invertebrates; Water Quality Restoration – at the Waiopae Tide Pools Marine Life Conservation District and Control Area.
There were many important findings in the Kapoho Reef Watch study. In terms of visitors, approximately 46,000 visitors were counted using the tide pools during the year one study. The busy times were from May to August. There was on average about 3.4 people per parked car and about 12,820 cars. With regard to water quality, Enterococci bacteria (EC) exceeded acceptable safe levels in many of the tide pools as define by the State Department of Health and the EPA. Cesspool leaching is the most likely contributor of EC to the tide pools.
State of Hawaii, Department of Land and Natural Resources. 2005. Requesting a Review and Analysis of the Issues Surrounding the Shoreline Certification Process for the Purpose of Establishing Shoreline Setbacks. Report to the Twenty-Third Legislature Regular Session of 2006 in Response to Senate Concurrent Resolution 51, Senate Draft 1 – Regular Session of 2005.
This report makes short-term and long-term recommendations to change the shoreline certification process. The two most notable areas are to change the state administrative rules definition of the shoreline to match that in the Hawaii Revised Statutes. This would then place a more equal weighting on evidence for the shoreline on both the debris line and vegetation line. More relevant to this study is the long-term recommendation to replace “upper reach of the wash of the waves,” with “run-up,” and to exclude from this definition inundation aided by gravity flow or funneling through narrow passages. This recommendation, or a permutation of it is presented in this report as an option.

60
Appendix 2 - Summary and Analysis of Interviews, Meetings or Site Visits with Affected Stakeholder and Agencies
August 3, 2005 – Interview with John Green – landowner in the Kapoho Vacationlands Subdivision. Major concern for the landowner is being able to build after buying the lot. When he visited the property, he did not see the property at a high tide. He was not informed of need for a shoreline survey. The need for a shoreline survey is preventing him from building on the property. He gave approval to go on site. August 17. 2005 – Field observations at the Kapoho Vacationland Subdivision with Dr. Ben Brooks, Dr. James Foster, Chris Conger, Larry Brown, Eric Schott and Dennis Hwang. Observe the 3.1 high tide at the Vacationland Subdivision. Six station areas are established to observe the extent of inundation. Measure inundation limits for accessible areas with the use of high resolution satellite GPS units. October 14, 2005 – Interview with Chris Yuen – Director of the Department of Planning – County of Hawaii - Discussed the theory of land swaps and the need for more work in this area. Possibilities and hurdles were discussed at the county and State level. January 9, 2006 – Meeting with Chris Conger, Reid Siarot, Dolan Eversole Morris Atta and Sam Lemmo at the DLNR office. Discuss the shoreline certification process and the field observations at Kapoho from the August 17, 2005 field survey. Discussion about participation in the February 8, 2006 community event for Kapoho. February 8, 2006 – Meeting at the Hawaii Volcano Observatory with volcanologist Don Swanson, Asta Mikilius, Paul Okubo, and Hawaii County Planner Larry Brown. Discuss the history of volcanoes and subsidence in the areas. Measurements taken by field surveys on subsidence rates is provided for a nearby area. An explanation is provided of a previous letter to the Hawaii County Planning Department by Don Swanson on measured subsidence in the area. A report is given on the cause and distribution of earthquakes and subsidence in the area. February 8, 2006 – Meeting at the Pahoa Community Center to give a regulatory review of issues to the residents of Kapoho. Present at the community meeting were the Department of Health, Army Corps of Engineers, Department of Land and Natural Resources, Hawaii County Department of Planning and Dennis Hwang. PowerPoint Presentations were given by the participants. Questions were raised to the panelists and answers provided. A brief review of the findings during the August 17, 2005 site visit were provided. The residents were then informed that the InSAR study was being conducted to measure subsidence, but no detailed results were out yet. An offer was made to meet any resident that wanted to discuss the Kapoho area and any individual concerns during a site visit to the area during the next morning.
61
February 9, 2006 – Interview with residents of Kapoho that wished to discuss individual concerns and issues. Invitation made at the February 8th community meeting to anyone interested in meeting. Meet with Linda and Kirk Flanders and discussed coastal vegetation suitable for use as a shoreline indicator, the reef structure and history of the area. July 12, 2006 – Status report with Hawaii County Planning. Present were Director - Christopher Yuen, Deputy Director Brad Kurakawa and county planner Larry Brown. The justification for obtaining an extension for the Kapoho study was provided. The main reason being the need to expand the time range of the InSAR data to get a better handle on potential subsidence. The concern for potential ongoing subsidence was raised. A status report was given on the expected timetable for products, preliminary findings, and a site visit. Preliminary maps of the inundation event of August 17, 2005 were shown for form and content. Discussion followed on the issue of raising the road. July 12, 2006 – Field Survey at the Kapoho Vacationland Subdivision. Present Dr. James Foster, Larry Brown, Shanna Dacanay and Dennis Hwang. Observe the 3.13 high tide predicted from the NOAA tide charts. See if there are any changes in the extent of inundation, compared to a similar 3.17 high tide event on August 17, 2005. Measure and observe channels crossing the road for depth and possible transition from runup to gravity flow. July 31, 2006 – Interview with Harold Yee of the Department of Health, head of the Wastewater Branch. Of the three general systems for wastewater collection at Kapoho, cesspool, septic tank and a sewer or community wastewater collection system, the later should have the least technical challenges. Both the cesspool and the septic tank could have a hard time with proper flushing if they are close to the water level. Mr. Yee indicated that an appropriation to study wastewater issues at Kapoho was approved at the State legislature. August 2, 2006 – Interview with Eric Schott, homeowner at Kapoho Vacationland Subdivision. Senate Bill 2480 was approved by the State legislature to study wastewater options for both the Kapoho Vacationland and Beach Lots area. At the time of the discussion, the money had not yet been released by the Governor. Also tropical storm Daniel went by the Hawaiian Islands on July 28 and the water level at Kapoho was much higher than the highest tides. On the road, the water may have been a foot higher, even though the tide was only 2.5 as indicated by the Old Farmers Almanac and the NOAA tide charts. This should not have implications in terms of shoreline certification since storm waves are exempt, yet it indicates how vulnerable the area is to storm events.

62
October 19, 2006 – Community meeting at Pahoa High School – The main purpose of the meeting was to inform the public, and the residents of Kapoho, of the results of the INSAR study and to discuss preliminary direction of the Subsidence Report. Dr. Benjamin Brooks showed a PowerPoint on the concepts behind INSAR. He compared the results of the study with independent measurements from high resolution GPS taken by the Hawaii Volcano Observatory. The match was very good for the existing two locations. Measurements taken by INSAR over a three-year period indicate subsidence relative to Hilo at about 1 cm or 10 mm per year. Since Hilo is experiencing relative sea level rise of 2 mm per year, the relative sea-level rise measurements over the three-year period of study gives a rate of about 1.1 cm or 11 mm per year at Kapoho. This is consistent with the 30-year trend revealed by independent measurements taken by the Hawaii Volcano Observatory. Dennis Hwang gave a PowerPoint that covered preliminary direction of the three major areas of the report. With regard to risks of hazards, the area is very vulnerable to hurricanes, tsunamis, and earthquakes. Subsidence makes mitigation of these risks even more difficult. Subsidence appears to be both episodic (1838, 1868, and 1975 events) and continuous (INSAR study). The second major area of the report dealt with options to deal with the shoreline certification process. Four options were considered including: (i) using the existing method of surface connection, (ii) encouraging the State to rely on an increased emphasis of the vegetation line, (iii) using the transition to gravity flow and (iv) setting an arbitrary boundary such as the mauka edge of the road. Options iii through iv would provide the county greater flexibility in granting building permits but the down side is that this could increase development pressure in the areas of severe flooding and subsidence. The third major part of the study dealt with various issues in the Special Management Area. It was suggested that: (i) the area continue to be monitored for subsidence, (ii) an engineering report accompany applications for new seawalls or to heighten existing seawalls; (iii) zoning and subdivision changes factor in flooding and subsidence; (iv) the wastewater study to be done under legislative appropriation consider subsidence. There was much discussion about building a new house on existing lots and developing the right strategy, considering the frustration felt by landowners as well as the hazard risks. If new houses are built, it was suggested there be sufficient elevation, with freeboard for subsidence and that the structure can also accommodate anticipated earthquake forces.

63
December 18, 2006 to January 25, 2007 – Discussions with Senator Russell Kokubun regarding possible solutions at the Kapoho area. Options were discussed regarding a follow up long term study, land exchange and land acquisition. It was suggested that an appropriate course of action would be for the landowner or community to become knowledgeable about the issues at the area. They could then inquire with the DLNR and Board of Land and Natural Resources (BLNR) regarding solutions. The DLNR/BLNR could then investigate and propose resolutions which could include seeking resources from the Legislature to gain more information or initiate a land exchange or acquisition.

64
Appendix A – Measuring Ground Motion and Estimating Relative Sea Level Change at Kapoho, Hawai’i Using Synthetic Aperture Radar Interferometry (InSAR) by Dr. Benjamin A.
Brooks, Christin Shacat and Dr. James Foster

1
Measuring Ground Motion and Estimating Relative Sea Level Change at Kapoho, Hawai`i Using Synthetic Aperture Radar Interferometry
(InSAR)
A report prepared by
Dr. Benjamin A. Brooks
Christin Shacat Dr. James Foster
Contact information: Pacific GPS Facility School of Ocean and Earth Science and Technology
University of Hawaii 1680 East-West Rd. Honolulu, HI 96822
25 November, 2006

2
Executive Summary To gather more information about the state of current land motions in and around the Kapoho region, the Pacific GPS Facility was contacted by Dennis Hwang of the law firm of Reinwald O'Connor & Playdon to carry out a study in the region using Synthetic Aperture Radar Interferometry (InSAR) techniques. After an initial search, we determined that data from the WINSAR archive (http://winsar.stanford.edu/main.php) , of which the University of Hawai`i is a member, covered the Kapoho region from February 2003 to July 2005 at close to monthly intervals. As we processed the data and realized that we were getting interpretable results, we requested and received an extension to process ~ 6 months worth of additional data, resulting in a total time span of February 12, 2003 to March 8, 2006. The results indicate that the immediate Kapoho region experienced average downward vertical motions, with respect to Hilo, of ~-0.7 to -1.6 ± 0.6 (2 standard deviations) cm/yr for the three years of data processed. Our InSAR results are in very good agreement with GPS and leveling results collected by the Hawaiian Volcano Observatory since 1975. Our study neither addresses the cause of the measured land motion, nor predicts its future behavior. The measured land motion is an order of magnitude larger than the ~ mm/yr level decadal sea-level increase in the Hawaiian Islands (Caccamise et al., 2005) and so it appears that local land motion exerts the dominant control on relative sea-level change in Kapoho which we determine to be ~ 0.8 to 1.7 ± 0.8 (2 standard deviations) cm/yr. Additionally, we carried out repeat GPS surveys of the high-tide mark in the Kapoho region on in August, 2005 and June, 2006. We note specifically here that while there are slight differences in the high-tide position observed on the different times, we make no attempt to interpret these differences nor to suggest their causative factors. We calculate regional slope from the first survey to be 3.5x10⁻⁴ degrees.

3
Introduction Measuring Sea Level Change Mitigating the effects of sea level rise is a major societal challenge for the 21st century. Recent satellite altimeter observations indicate that the rate of global sea level (GSL) rise is ~3 mm/yr since the mid-1990s (Leuliette et al., 2004), an increase above the 1-2 mm/yr 20th century rate determined from tide gauges (see summary in (Church et al., 2001)). This apparent acceleration heightens concerns not only of the pace of shoreline encroachment, but also of the damaging impacts of extreme water level events associated with high waves and storms that are expected to increase as coastal sea levels rise. Accurate assessment of sea level rates therefore is an important concern for coastal managers and policy makers concerned with the protection of lives and property along the coast. Local determination of the rate of change of relative sea level (RSL), or the water level relative to the adjacent land, is likely to differ considerably from the GSL rate, which is referenced ideally to the earth’s center of mass or geoid. This is due in part to ocean variability, which leads to decadal and longer period fluctuations that dominate RSL rates at these time scales (Douglas, 2001). Even if sufficient data are available to differentiate secular trends from ocean variability, vertical land motion (VLM) can contribute to RSL trends at a level comparable to the ocean. A prominent contributor to VLM is the rebound of the continents associated with the reduction in land ice mass following the last ice age, or post-glacial rebound (PGR). RSL measured along many high latitude coasts is falling over time (Woodworth, 1990) and direct GPS measurements have been used to confirm the PGR contribution (Scherneck et al., 2001). PGR is a geologic time scale phenomenon that appears as a secular trend component in tide gauge observations. Models have been developed to estimate PGR rates (Tushingham and Peltier, 1991), which are important primarily for high latitude locations. At mid- to low-latitudes, other processes tend to dominate the coastal VLM signals. Local deformations due to ground water or oil extraction, the settling of landfill, earthquakes, and other volcanic or tectonic effects are likely to have short spatial scales and nonlinear and abrupt behavior in time; consequently they are much more difficult to model than PGR. A single VLM measurement at an unstable location is unlikely to represent motion over a larger area, unlike a PGR-dominated site. Continuous GPS (CGPS) measurements at tide gauges and/or tide gauge benchmarks provides a means of correcting for VLM signals in sea level records (Bevis et al., 2002; Mitchum, 1998). This allows for an estimate of VLM at the tide gauge, but not of the surrounding region. Dense CGPS networks such as the Southern California Integrated GPS Network (SCIGN) can provide information on regional relative ground motion; however, even a network as extensive as SCIGN is essentially a collection of point measurements that are sparse relative to VLM spatial scales and along the coast where information is needed in determining RSL . In a recent publication of ours (Brooks et al., In Press) we demonstrated how the emerging technique of satellite-based InSAR (Burgmann et al., 2000) combined with traditional tide

4
gauge observations, could provide RSL estimates for a coastal region with unprecedented spatial resolution. For the Los Angeles basin region we produced a map of VLM rates from 1992-2000 with horizontal resolution of 20 meters and vertical resolution of a few millimeters. The map allowed us to estimate VLM in the immediate vicinity of a centrally located tide gauge and yielded a regional assessment of RSL for two continuous coastal strips of ~15 and 45km length. Synthetic Aperture Radar Interferometry (InSAR) Applying InSAR for space-based deformation mapping of sub-cm scale ground motions is now an accepted technique worldwide and it has been reviewed extensively by other authors to which we refer readers for an in-depth explanation (Burgmann et al., 2000; Hanssen, 2001; Rosen et al., 2000). For the purposes of this report, we give a brief review here. There are currently a number of satellite platforms which provide radar data such as the European Space Agency’s ERS-2 and Envisat (http://earth.esa.int/ers/), the Canadian Space Agency’s Radarsat (http://www.space.gc.ca/asc/eng/satellites/radarsat1/default.asp), and the Japanese Aerospace Exploration Agency’s recently launched ALOS (http://www.jaxa.jp/missions/projects/sat/eos/alos/index_e.html). For this study we used Envisat. Envisat is in a sun-synchronous polar orbit with a mean altitude of 800 km and a 35 day repeat time. InSAR uses radar images acquired from repeat satellite orbits (either ascending or descending) to measure the range change along the radar’s line-of-sight (LOS) by interfering and phase-differencing of time-separated images and removal of the topographic phase with a digital elevation model (DEM). Envisat can acquire SAR data in 7 different imaging modes, each with different LOS; here we used image mode 2 with a LOS of ~19-27º from vertical. The high angle of incidence means that the LOS range-change values are most sensitive to vertical changes. When only either ascending or descending data are used there is a fundamental non-uniqueness between LOS range change and vertical motion and additional data are needed to asses the horizontal contribution of motion to LOS range change. In this study we used descending data only. For the Kapoho region we verified that there is a negligible effect of horizontal motion on range change because horizontal GPS velocities from the Kapoho region are not different than zero at the 95% confidence level (Miklius et al., 2005). The InSAR technique is limited by the degree of interferometric coherence for targets on the ground between acquisitions. In addition to temporal (Rosen et al., 2000; Zebker and Villas nor, 1992) and seasonal decorrelation (Lu and Freymueller, 1998; Wicks et al., 1998), geometrical baseline decorrelation for distributed scattering targets is proportional to the component of the baseline perpendicular to the line of sight. Because the combination of path length difference along the line of sight due to deformation, variations in atmospheric path delay, and noise generally exceed half a wavelength, the interferometric phase must be unwrapped to resolve spatial and temporal ambiguities (Goldstein et al., 1988). Geodetically Measured Subsidence History of Kapoho Because of its proximity to Kilauea Volcano’s lower east rift zone, ground motion near Kapoho has been monitored over the last half of the 20th century by a combination of geodetic methods including leveling and GPS (Delaney et al., 1998). The largest individual

5
signal was due to the M 7.2 Nov. 29, 1975 Kalapana earthquake which had an epicenter ~30km southwest of Kapoho (Lipman et al., 1985). This event, the largest Hawai`i earthquake in over a century, produced between 20 and 30 cm of subsidence at Kapoho (Lipman et al., 1985). Since the time of the Kalapana earthquake and 1996, repeated surveys showed that point measurements from Kilauea’s lower east rift zone near Kapoho averaged 1-2 cm/yr. of subsidence between 1976 and1996 (Delaney et al., 1998). Data, Processing, & Results From the WInSAR archive we acquired a total of 21 descending Envisat scenes. The data were in image mode IS2 and in track 429, frame 3213. Table 1, below, lists the data and shows perpendicular baseline differences with respect to the December 8, 2004 scene.
# Orbit Date Bperp (m) ∆T (days) 1 4992 20030212 -585.82 -6652 6996 20030702 -77.77 -5253 7998 20030910 496.21 -4554 8499 20031015 650.98 -4205 9000 20031119 -736.15 -3856 9501 20031224 570.67 -3507 10002 20040128 563.72 -3158 10503 20040303 -142.25 -2809 11505 20040512 -374.64 -210
10 12006 20040616 274.74 -17511 12507 20040721 385.02 -14012 13509 20040929 -108.91 -7013 14010 20041103 339.24 -35
*14 14511 20041208 0.00 015 15012 20050112 -201.25 3516 16515 20050427 909.07 14017 18519 20050914 529.58 28018 19020 20051019 410.01 31519 19521 20051123 178.26 35020 20022 20051228 -103.83 38521 21024 20060308 -165.95 455
Table 1. Envisat scene list. Data are all descending pass, image mode IS2, track 429, frame 3213. #, identification number; Orbit, orbit reference number; Date, acquisition date (yyyymmdd); Bperp, perpendicular baseline with respect to December 8, 2004 scene; ∆T, time difference with respect to December 8, 2004 scene. We used GAMMA software (Werner et al., 2000) to process the data from the raw radar echoes to the final deformation rate map. Our creation of interferograms is straightforward and follows established practice (Werner et al., 2000) including spatially unwrapping each interferogram using a minimum cost flow algorithm (Chen and Zebker, 2000). Additionally, we refined baseline estimates by minimizing in a least-squares sense the deviations between observed and model assuming that baseline errors cause long spatial wavelength phase errors that are linearly dependent on the distance between points.

6
From the 21 scenes acquired, a total of 210 separate pairs could be formed to make interferograms. We inspected each of these individually and found that the interferograms with perpendicular baselines greater than 300 meters started to exhibit slight degradation of coherent phase in some areas of interest, notably Hilo. Accordingly, we limited our further analysis to only those interferograms made with pairs separated by perpendicular baselines of less than 300 meters. Our resulting data set then comprised 71 total interferograms and, of these, 8 interferograms could be formed from entirely independent scenes. Our previous experience with InSAR and meteorology (Foster et al., 2006; Foster et al., 2003) has shown us that there can be high levels of atmospheric water vapor at any given time over in Hawai`i. Thus, for a data set of only 8 interferograms, an analysis could be significantly biased if only 1 or 2 scenes contained significant atmospheric anomalies, especially if those scenes covered the longer temporal baselines most important for determining LOS range change. As a result, we prefer to analyze the data set of 71 interferograms rather than 8, even though the larger data set does include some redundant information in the form of scenes being used more than once to form interferograms. We calculated average LOS range change by estimating in a least-squares sense, for each pixel with coherent signal in each of the images, a linear deformation rate (linear regression of phase versus time). This technique is often referred to in the literature as ‘stacking’ and it is regarded as an effective means of removing atmospheric water vapor anomalies which may degrade a data set (Sandwell and Price, 1998). Because atmospheric anomalies are typically not correlated over the monthly time intervals of this data set, a linear regression will be an effective means of removing the atmospheric signal from the resultant land motion map. In Figure A.1, we show a map of the average range change rate from the full data set of 71 interferograms for the entire processed scene. In this analysis, to allow further analysis of sea-level change, all values are reported with respect to a reference point at the Hilo airport which is very near the Hilo GPS station. Notable features of the deformation map include the well-studied deformation associated with Kilauea volcano. In Figure A.2a we show a zoom of the results from the Kapoho area in addition to the standard deviation of the range change rate for each pixel. Generally it appears that Kapoho LOS range change rates are from between ~ -0.8 to -1.7cm/yr with standard deviations uniformly in the ~ -3mm/yr range (Figure A.2b). A more conservative error estimate of two standard deviations would yield values of ~ -6mm/yr. Our InSAR results are in very good agreement with GPS and leveling results collected by the Hawaiian Volcano Observatory since 1975. As mentioned above, and shown in Figure A.4, sites from Kilauea’s lower east rift zone near Kapoho averaged 1-2 cm/yr. of subsidence between 1976 and1996 (Delaney et al., 1998). Error Analysis Data Decimation We assess the robustness of our result empirically by repeatedly decimating the data stack and re-running the linear regression. In Figure A.3.1 we show the results of 14 different

7
iterations of the decimation process which comprises randomly decimating the data stack by 5 scenes each time. From a total of 71 to a total of 26 scenes the results are similar in that over the entire Kapoho region values of LOS range change with respect to Hilo range between ~ -0.8cm/yr to ~-1.7cm/yr or ~ -0.7 to -1.6cm/yr when projected onto the vertical (as discussed above, horizontal motion in Kapoho from GPS is essentially negligible).

8

9

10

11

12
Correspondingly standard deviation of displacement rate ranges from -0.3cm/yr to -0.7cm/yr as the number of scenes in the stack decrease from 71 to 26 (Figure A.3.2). This increase in result variability with fewer scenes is to be expected and is due to the increasing probability of atmospheric anomalies influencing the result when smaller numbers of interferograms are used. As a result we find that average vertical motion of the Kapoho region for the time period studied was between -0.7 and -1.6cm ± 0.6 cm/yr (2 standard deviations). This result is in excellent agreement with the independent leveling and GPS results reported by Delaney et al. (1998) who found subsidence rates on the order of 1-2 cm/yr (Figure A.4). Consideration of Lava Flow Cooling It is clear from the deformation maps (Figure A.2) that the zones of coherence where we can achieve reliable land motion estimates are the 1955 and 1960 lava flows, respectively (Richter et al., 1970; Trusdell et al., 2005). Because the principal area of interest, the Kapoho vacationland lots, are not situated on the flows themselves it is natural to ask if the recently emplaced flows may be still experiencing some cooling and so reflect different surficial motion than that actually experienced ~100-200 meters away at Kapoho vacationland lots. We find this scenario highly improbable for the following reasons:
1) Neither flow exhibits a spatial patterns that we would expect from cooling lavas such as greater subsidence towards the central (and presumably thicker) portions of the flows.
2) Numerical models of lava flow emplacement (e.g. Patrick et al., 2004) suggest that it is highly unlikely that, more than 40 years after their emplacement, the lavas would still retain any molten material. Patrick et al. (2004) showed using 3 numerical different cooling models (validated with observational data) that an initially 100m thick lava flow would be entirely solid by less than 35 years. Because of the cooling effects of cracks and water percolation it is likely that these are upper-end estimates for solidification rates. Moreover, Richter et al. (1970) showed at locations away from the 1960 vents that the flow thickness does not exceed ~ 30 m. Because a 30m thick flow would cool significantly faster than the 100m thick flow modeled by Patrick et. al (2004) we conclude it is highly improbable that the 1955 and 1960 flows are still cooling.
Estimating Relative Sea Level Change for Kapoho Our strategy for estimating the relative sea level change at Kapoho comprises referencing the Kapoho region land-motion to Hilo via the InSAR map and then using the long-term tide gauge record of water level changes at Hilo to yield a RSL rate at Kapoho. In so doing, we make the assumption that between Hilo and Kapoho the water level changes are constant. This assumption is verified by Caccamise et al. (2005) who show that although Hawai`i is a place of strong steric sea-level trends (due to ocean thermal expansion), the contribution to water level changes between Kapoho and Hilo would be less than 0.025 cm/yr.
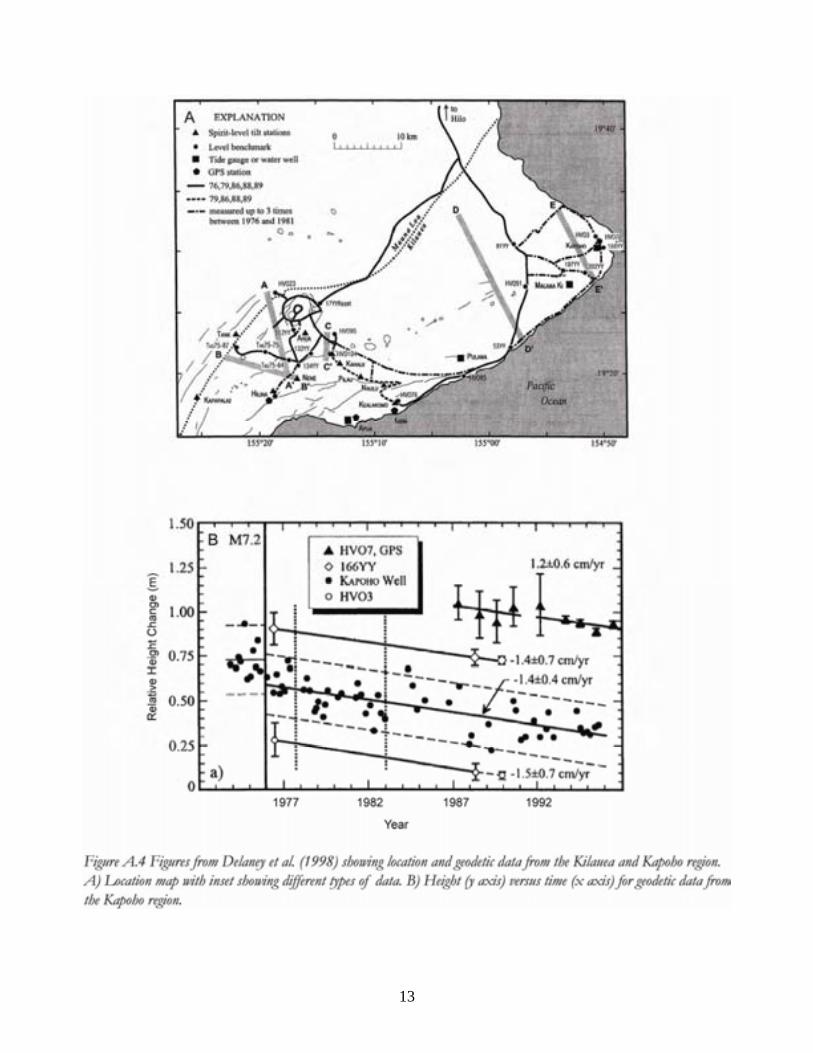
13

14
Caccamise et al. (2005) reported -0.21±0.06 cm/yr vertical motion of the continuous GPS station, ‘HILO’ (Figure A.5) with respect to a reference frame in which stations around the Pacific margin are held fixed. However, over baselines as long as those used in the Caccamise et al. (2005) study, it is unlikely that absolute vertical velocities are know to better than ~ 2 mm/yr and so for the purposes of this report we take the Hilo velocity to be -0.21±0.2 cm/yr. To convert the Hilo tide gauge sea-level trend (tgHILO= 0.31 cm/yr) to the RSL trend at Kapoho (rslKAPOHO), we first compute the VLM trend at the Hilo CGPS site (vlmHILO). Caccamise et al. (2005) cited historic leveling data to show that there is negligible motion between the CGPS site and the National Ocean Services (NOS) tide gauge (500m separation), so LHILO is an accurate proxy for VLM at the Hilo tide gauge. We use the convention that a negative VLM rate corresponds to a net downward displacement over time. rslHILO = tgHILO + vlmHILO = 0.31 cm/yr – 0.21 ± 0.2 cm/yr. = 0.1 ± 0.2 cm/yr. Then the InSAR vertical displacement rate at Kapoho is subtracted from rslHILO, which gives the RSL trend at Kapoho, rslKAPOHO = rslHILO - vlmKAPOHO. In Table 2 we give the estimates for the range of VLM values at Kapoho.
rslHILO (± 0.2 cm/yr) vlmKAPOHO (± 0.6 cm/yr) RslKAPOHO (± 0.8 cm/yr) 0.1 -0.7 0.8 0.1 -1.6 1.7
Table 2. Estimation of relative sea level (rsl) rates at Kapoho for maximum and minimum vertical land motion values (vlm) observed with InSAR. As noted in the text, rslKAPOHO = rslHILO - vlmKAPOHO. Conclusion & Recommendation We analyzed InSAR data from the Envisat platform to estimate average vertical land motion values of Kapoho with respect to Hilo of between ~ -0.7 and -1.6 cm/yr ± 0.6 cm/yr (2 standard deviations) for the time period of February 2003 to march 2006. Using these values and the long-term Hilo tide gauge record, we estimate that relative sea level changes at Kapoho are ~ 0.8 to 1.7 cm/yr ± 0.8 cm/yr (2 standard deviations). The important conclusion is that VLM values at Kapoho are likely at least an order of magnitude greater than the sea-level change recorded at the Hilo tide gauge and so local land motion dominates the relative sea-level change rate over these short time periods. Our analysis says nothing about the cause of subsidence at Kapoho or whether the observed VLM will continue in the future, though we note that it has now been more than 30 years since the Kalapana earthquake and we would expect it be unlikely that the region is still experiencing such large postseismic effects (i.e. Scholz, 1990). We recommend continued monitoring using a combination of InSAR, continuous GPS, and tide gauge techniques in the region. More InSAR acquisitions will allow reduction of the errors; installation of a single continuous GPS station on the coast at Kapoho would allow

15

16
for high resolution time series monitoring of VLM; the tide gauge data would allow direct measurement of sea-level change at Kapoho and then allow any measurements to be reference strictly locally. Appendix: GPS High Tide Surveys We carried out ground-based surveys of the high tide position in Kapoho at two different times: August 17, 2005 and July 10, 2006. The surveys comprised laying out a string marking the high tide point and walking the string backpacks and dual frequency capable GPS equipment (Trimble NetRS receivers with Zephyr antennae). On the first survey both Drs. Brooks and Foster of the PGF carried dual frequency equipment. On the second survey Dr. Foster carried dual frequency equipment and Shanna-Lei Dacanay carried a hand-held unit. The data were processed in the PGF labs using PAGES software from the National Geodetic Survey. The locations of the high tide positions are shown in Figure A.6. There are many oceanographic factors which could contribute to the different location of the high tide between the two survey dates and so we ascribe no significance to the different positions shown in the plots. From the first year’s survey results, we find a best-fitting plane to the data in a least-squares sense and then calculate the regional slope as 3.5x10⁻⁴ degrees.

17
References Cited Bevis, M., Scherer, W., and Merrifield, M.A., 2002, Technical Issues and Recommendations
Related to the Installation of Continuous GPS Stations at Tide Gauges: Marine Geodesy, v. 25, p. 87-99.
Brooks, B.A., Merrifield, M., Foster, J., Werner, C., Gomez, F.B., M., and Gill, S., In Press, Space Geodetic Determination of Spatial Variability in Relative Sea Level Change, Los Angeles Basin: Geophysical Research Letters.
Burgmann, R., Rosen, P.A., and Fielding, E.J., 2000, Synthetic Aperture Radar interferometry to measure Earth's surface topography and it's deformation: Ann. Rev. Earth Planet. Sci., v. 28, p. 169-209.
Caccamise, D.J.I., Merrifield, M.A., Beivs, M., Foster, J., Firing, Y., Schenewerk, M.S., Taylor, F.W., and Thomas, D.T., 2005, Sea level rise at Honolulu and Hilo, Hawaii: GPS estimates of differential land motion: Geophysical Research Letters, v. 32, p. doi:10.1029/2004GL021380.
Chen, C., and Zebker, H., 2000, Network approaches to two-dimensional phase unwrapping: intractability and two new algorithms: Journal of the Optical Society of America, v. 17, p. 401-414.
Church, J., Gregory, J., Huybrechts, P., Kuhn, M., Lambeck, K., Nhuan, M., Qin, D., and Woodworth, P., 2001, Changes in sea level, in Houghton, J., Ding, Y., Griggs, D., Noguer, M., Linden, P.v.d., Dai, X., Maskell, K., and Johnson, C., eds., Climate Change 2001: The Scientific Basis. Contribution of Working Group I to the Third Assessment Report of the Intergovernmnetal Panel on Climate Change: Cambridge, UK, Cambridge University Press, p. 639-694.
Delaney, P.T., Denlinger, R.P., Lisowski, M., Miklius, A., Okubo, P.G., Okamura, A.T., and Sako, M.K., 1998, Volcanic spreading at Kilauea, 1976-1996: Journal of Geophysical Research, v. v. 103, p. p. 18,003-18,023.
Douglas, B., 2001, Sea level changes in the era of the recording tide gauge, in Douglas, B., Kearney, M., and Leatherman, S., eds., Sea Level Rise: History and Consequences, Acadmic Press, p. 37-64.
Foster, J., Brooks, B., Cherubini, T., Shacat, C., Businger, S., and Werner, C.L., 2006, Mitigating atmospheric noise for InSAR with a high resolution weather model: Geophys. Res. Lett., v. 33, p. doi:10.1029/2006GL026781.
Foster, J., Zhang, Y., Bevis, M., Chen, Y.L., and Businger, S., 2003, The Kau'u storm (November 2000): Imaging precipitable water using GPS: Journal of Geophysical Research D: Atmospheres, v. 108, p. ACL 11-1 - ACL 11-15.
Goldstein, R.M., Zebker, H.A., and Werner, C.L., 1988, Satellite radar interferometry: Two-dimensional phase unwrapping: Radio Science, v. 23, p. 713-720.
Hanssen, R.F., 2001, Radar Interferometry: Data Interpretation and Error Analysis: Dordrecht, Kluwer Academic Publishers, 308 p.
Leuliette, E.W., Nerem, R.S., and Mitchum, G.T., 2004, Calibration of TOPEX/Poseidon and Jason altimeter data to construct a continuous record of mean sea level change: Mar. Geodesy, v. 27, p. 79-94.
Lipman, P.W., Lockwood, J.P., Okamura, R.T., Swanson, D.A., and Yamashita, K.M., 1985, Ground Deformation Associated with the 1975 Magnitude-7.2 Earthquake and Resulting Changes in the Activity of Kilauea Volcano, Hawaii: US Geological Survey Professional Paper 1276, p. 45 pp.
18
Lu, Z., and Freymueller, J.T., 1998, Synthetic aperture radar interferometry coherence analysis over Katmai volcano group, Alaska: Journal of Geophysical Research, B, Solid Earth and Planets, v. 103, p. 29,887-29,894.
Miklius, A., Cervelli, P., Sako, M., Lisowski, M., Owen, S., Segall, P., Foster, J., Kamibayashi, K., and Brooks, B.A., 2005, Global Positioning System Measurements on the Island of Hawai`i: 1997 through 2004: USGS Open-File Report 2005-1425.
Mitchum, G.T., 1998, Monitoring the Stability of Satellite Altimeters with Tide Gauges: Journal of Atmospheric and Oceanic Technology, v. 15, p. 721-730.
Patrick, M.R., Dehn, J., and Dean, K., 2004, Numerical modeling of lava flow cooling applied to the 1997 Okmok eruption: Approach and analysis: Journal of Geophysical Research, v. 109, p. doi:10.1029/2003JB002537.
Richter, D.H., Eaton, J.P., Murata, K.J., Ault, W.U., and Krivoy, H.L., 1970, Chronological narrative of the 1959-1960 eruption of Kilauea Volcano, Hawaii, 73 p.
Rosen, P.A., Hensley, S., Joughin, I.R., Li, F.K., Madsen, S.N., Rodriguez, E., and Goldstein, R.M., 2000, Synthetic Aperture Radar Interferometry: Proceed. of the IEEE, v. 88.
Sandwell, D.T., and Price, E.J., 1998, Phase gradient approach to stacking interferograms: Journal of Geophysical Research, v. 103, p. 30,183-30,204.
Scherneck, H.-G., Johansson, J.M., Vermeer, M., Davis, J.L., Milne, G.A., and Mitrovica, J.X., 2001, BIFROST project: 3-D crustal deformation rates derived from GPS confirm postglacial rebound in Fennoscandia: Earth Planets Space, v. 53, p. 703-708.
Scholz, C.H., 1990, The mechanics of earthquakes and faulting: Cambridge, Cambridge University Press, 439 pp. p.
Trusdell, F.A., Wolfe, E.W., and Morris, J., 2005, Digital database of the geologic map of the Island of Hawai'i, U.S. Geological Survey Data Series 144
Tushingham, A.M., and Peltier, W.R., 1991, Ice-3G: a new global model of Late Pleistocene deglaciation based upon geophysical predictions of post-glacial relative sea level change: J. Geophys. Res., v. 96, p. 4497-4523.
Werner, C., Wegmüller, U., Strozzi, T., and Wiesmann, A., 2000, GAMMA SAR and Interferometric Processing Software, ERS-ENVISAT Symposium: Gothenborg, Sweden.
Wicks, C.W., Jr., Thatcher, W.R., and Dzurisin, D., 1998, Migration of fluids beneath Yellowstone Caldera inferred from satellite radar interferometry: Science, v. 282, p. 458-462.
Woodworth, P., 1990, A search for accelerations in records of European mean sea level: Intl. J. Climatology, v. 10, p. 129-143.
Zebker, H.A., and Villasenor, J., 1992, Decorrelation in interferometric radar echoes: EEE Trans. Geo. Rem. Sensing, v. 30, p. 950-959.