cold stores
TRANSCRIPT

8/12/2019 cold stores
http://slidepdf.com/reader/full/cold-stores 1/24

8/12/2019 cold stores
http://slidepdf.com/reader/full/cold-stores 2/24
Prepared By:B. PrakashGraduate StudentandR. Paul SinghProfessor of Food Engineering
Department of Biological and Agricultural Engineering
University of California
Davis, CA 95616
Prepared For:
California Energy Commission Public Interest Energy Research (PIER) Program
Pramod KulkarniContract Manager
Rajesh KapoorProject Manager
NameManagerNAME OF OFFICE
Martha Krebs, Ph.D.Deputy Director
ENERGY RESEARCH & DEVELOPMENT DIVISION
B.B BlevinsExecutive Director
DISCLAIMER
This report was prepared as the result of work sponsored by the
California Energy Commission. It does not necessarily representthe views of the Energy Commission, its employees or the Stateof California. The Energy Commission, the State of California, itsemployees, contractors and subcontractors make no warrant,express or implied, and assume no legal liability for theinformation in this report; nor does any party represent that theuses of this information will not infringe upon privately ownedrights. This report has not been approved or disapproved by theCalifornia Energy Commission nor has the California EnergyCommission passed upon the accuracy or adequacy of theinformation in this report.
ii

8/12/2019 cold stores
http://slidepdf.com/reader/full/cold-stores 3/24
Acknowledgements
Authors thank California Energy Commission for financial support for this study.
Citation
B. Prakash and Singh, R. Paul. 2008. Energy Benchmarking of Warehouses for Frozen Foods.
Public Interest Energy Research (PIER) Program Contract and Research Project Reports.
California Energy Commission, PIER Program.
i

8/12/2019 cold stores
http://slidepdf.com/reader/full/cold-stores 4/24

8/12/2019 cold stores
http://slidepdf.com/reader/full/cold-stores 5/24

8/12/2019 cold stores
http://slidepdf.com/reader/full/cold-stores 6/24
Abstract
This study developed a theoretical energy benchmarking model for frozen food warehouses. Themodel takes into account of location, season, size of the warehouse and involved three steps.
First, heat entering into the refrigerated storage space from all possible sources such as walls,
infiltration of warmer air through doors, people activity, forklift activity, product inflows, lights,evaporator fans and defrosters were determined. Second, electrical power to run the refrigeration
system to remove the heat gain from the building is computed. Third, electric consumption by all
the electrical appliances including the refrigeration cycle equipments are summed to determinetotal electric power consumption
The study concluded that:1. It is possible to estimate the electric power consumption in frozen warehouse using
theoretical thermal energy balance. Predicted and actual SEC values of SEC differed byonly 11% in a frozen warehouse which was selected for validation.
2. Lighting devices affect SEC values substantially. By using 20% more efficient lights i.e.using lighting levels of 8 W/m
2 in place of 10 W/m
2, SEC can be reduced by 2.30
kWh/m3 (~ 10%).
3. Product thermal energy load can affect SEC substantially. If all of the products are brought in at 20ºC (68ºF), they can increase SEC by about 60%.
4. Compared to other thermal energy loads, infiltration thermal energy load is usually small.
It contributes less than 5% to total SEC.
The model was implemented in FlashTM
(Adobe Systems Inc.) environment ant it can be
conveniently accessed online at http://bae.engineering.ucdavis.edu/warehouseenergy.swf . Usageof this tool as a theoretical benchmark is expected to assist the warehouse industry in becomingmore energy efficient.
Keywords: Refrigerated warehouse, energy saving, benchmarking, frozen warehouses, web-tool
iv

8/12/2019 cold stores
http://slidepdf.com/reader/full/cold-stores 7/24
Executive Summary
Warehouses for storage of frozen foods are one of the largest energy consumers among the food
industry. Increasing energy costs have been driving this vital sector of the industry to look for better practices and technologies so as to reduce its energy use. The major challenge in this
sector is lack of suitable energy consumption benchmark data. Most of the available
benchmarking studies are survey-based, which though, give a broad outline of energyconsumption of one warehouse compared to the other, are limited in determining potential for
improvements, if best known industrial practices are applied. Moreover since individual
warehouses differ in operating conditions, size and location, comparing two different warehouses
becomes mostly inappropriate. These limitations in survey-based studies necessitateddevelopment of a theoretical benchmark which provides an achievable expectation for a given
warehouse.
In this research, a model is developed which predicts the heat loads and the energy usage of a
warehouse on a monthly and annual basis. The model takes into account of location, season, size
of the warehouse and the product throughputs to run the simulations and provides results specificto that particular warehouse. This model also displays the distribution of different kinds of
thermal energy loads and how they affect overall energy usage. The model was implemented in
FlashTM
(Adobe Systems Inc.) environment and can be accessed online at
http://bae.engineering.ucdavis.edu/warehouseenergy.swf . Usage of this tool as a theoretical benchmark is expected to assist the warehouse industry in becoming more energy efficient.
1

8/12/2019 cold stores
http://slidepdf.com/reader/full/cold-stores 8/24
1.0 Introduction
Refrigerated warehouses play an essential role in the food delivery chain from the field to the
consumer. Most of the perishable commodities must be refrigerated soon after harvest. In theUS, the gross refrigerated storage capacity totals about 90.9 million m
3 (USDA, 2006). Out of
this, usable refrigeration capacity (the actual volume used for storing commodity) is 73.1 millionm
3. The usable freezer space (storage temperature lower than -18 ºC) constitutes about 78% of
this space and rest is used as cooler space (storage temperature between -18 ºC and 10 ºC).
California alone has 228 refrigerated warehouses with a gross storage capacity of 11.3 millionm
3 and a usable storage space of 9.1 million m
3. The total refrigeration load of refrigerated
warehouses in California is estimated to be about 120,000 tons of refrigeration and the electric
power consumption is about 360 MW (CIFAR, 2004). The magnitude of energy spent in the
warehouses makes it important to study and improve the efficiency of their electric powerconsumption. Benchmarking is the first step in this direction. It allows warehouses to compare
their usage with best known practices and thus helps them learn about newer methods to improvetheir efficiency.
Singh (2006) conducted a survey to benchmark the Specific Electricity Consumption (SEC),
(kWh/ft3) in refrigerated warehouses in California. He developed a web-based benchmark tool to
compare the electric use of a warehouse based upon the survey. This benchmarking tool allowed
the warehouses to compare their performance with other warehouses in California. Being a
survey based tool it has its limitations, for example it can not account for the effects of local
weather conditions or product inflows. Moreover, it also does not say anything about the best possible yet attainable energy consumption values which the warehouses should aspire to
achieve. Development of a theoretical benchmarking tool can address these issues. In addition, it
can also identify the areas, where improvements can be made.
Computing the theoretical electrical consumption is a vast task for the warehouse engineers.
Obvious difficulties are lack of information about the suitable equations and the complexity ofcalculation. It restricts them to estimate their effectiveness and improve their operations. This
obstacle can be overcome by developing a computer-based model in which an operator can enter
the raw data as input and can get the final results. Further making it web-based makes itconvenient to update weather data on annual basis.
The goal of the research was to develop a web-based benchmarking tool which can estimate the
energy usage of a frozen warehouse based upon theoretical computations of the different heat
loads. In such a tool, the user would input the basic data such as location, size of warehouses andthe warehouse operating conditions and the tool would output estimates of the electric
consumption and benchmark the SEC values.
Poulsen (1986) discussed the effect of storage temperature, ambient temperature and storagevolume on total energy consumption of a refrigerated warehouse. There are few published
studies (ETSU, 1992; Bosma, 1995; Elleson and Freund, 2004; Werner et al, 2005; Singh, 2006)
to benchmark energy use among refrigeration warehouses in different parts of the world. All of
2

8/12/2019 cold stores
http://slidepdf.com/reader/full/cold-stores 9/24

8/12/2019 cold stores
http://slidepdf.com/reader/full/cold-stores 10/24
Figure 1: Specific Electricity Consumption (SEC) of refrigerated warehouses operating in
New Zealand, UK, Netherlands and US
4
8/12/2019 cold stores
http://slidepdf.com/reader/full/cold-stores 11/24
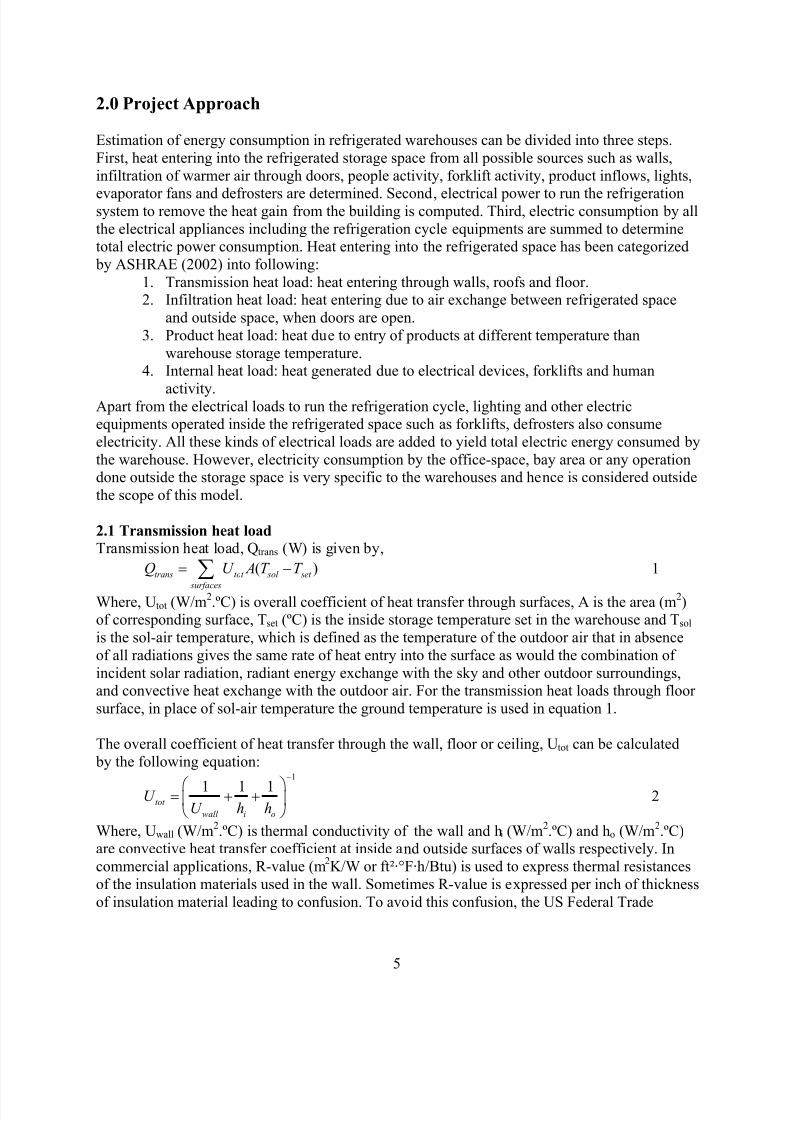
2.0 Project Approach
Estimation of energy consumption in refrigerated warehouses can be divided into three steps.
First, heat entering into the refrigerated storage space from all possible sources such as walls,
infiltration of warmer air through doors, people activity, forklift activity, product inflows, lights,
evaporator fans and defrosters are determined. Second, electrical power to run the refrigerationsystem to remove the heat gain from the building is computed. Third, electric consumption by all
the electrical appliances including the refrigeration cycle equipments are summed to determinetotal electric power consumption. Heat entering into the refrigerated space has been categorized
by ASHRAE (2002) into following:
1. Transmission heat load: heat entering through walls, roofs and floor.2. Infiltration heat load: heat entering due to air exchange between refrigerated space
and outside space, when doors are open.
3. Product heat load: heat due to entry of products at different temperature than
warehouse storage temperature.4. Internal heat load: heat generated due to electrical devices, forklifts and human
activity.Apart from the electrical loads to run the refrigeration cycle, lighting and other electricequipments operated inside the refrigerated space such as forklifts, defrosters also consume
electricity. All these kinds of electrical loads are added to yield total electric energy consumed by
the warehouse. However, electricity consumption by the office-space, bay area or any operationdone outside the storage space is very specific to the warehouses and hence is considered outside
the scope of this model.
2.1 Transmission heat load
Transmission heat load, Q (W) is given by,trans
1 ( )trans tot sol set
surfaces
Q U A T " #$ T
Where, Utot (W/m2.ºC) is overall coefficient of heat transfer through surfaces, A is the area (m
2)
of corresponding surface, Tset (ºC) is the inside storage temperature set in the warehouse and T sol
is the sol-air temperature, which is defined as the temperature of the outdoor air that in absence
of all radiations gives the same rate of heat entry into the surface as would the combination of
incident solar radiation, radiant energy exchange with the sky and other outdoor surroundings,and convective heat exchange with the outdoor air. For the transmission heat loads through floor
surface, in place of sol-air temperature the ground temperature is used in equation 1.
The overall coefficient of heat transfer through the wall, floor or ceiling, U tot can be calculated
by the following equation:1
1 1 1tot
wall i o
U U h h
#
% &" ' '() *
+ 2
Where, Uwall (W/m2.ºC) is thermal conductivity of the wall and hi (W/m
2.ºC) and ho (W/m
2.ºC)
are convective heat transfer coefficient at inside and outside surfaces of walls respectively. In
commercial applications, R-value (m2K/W or ft!·°F·h/Btu) is used to express thermal resistances
of the insulation materials used in the wall. Sometimes R-value is expressed per inch of thickness
of insulation material leading to confusion. To avoid this confusion, the US Federal Trade
5

8/12/2019 cold stores
http://slidepdf.com/reader/full/cold-stores 12/24
8/12/2019 cold stores
http://slidepdf.com/reader/full/cold-stores 13/24
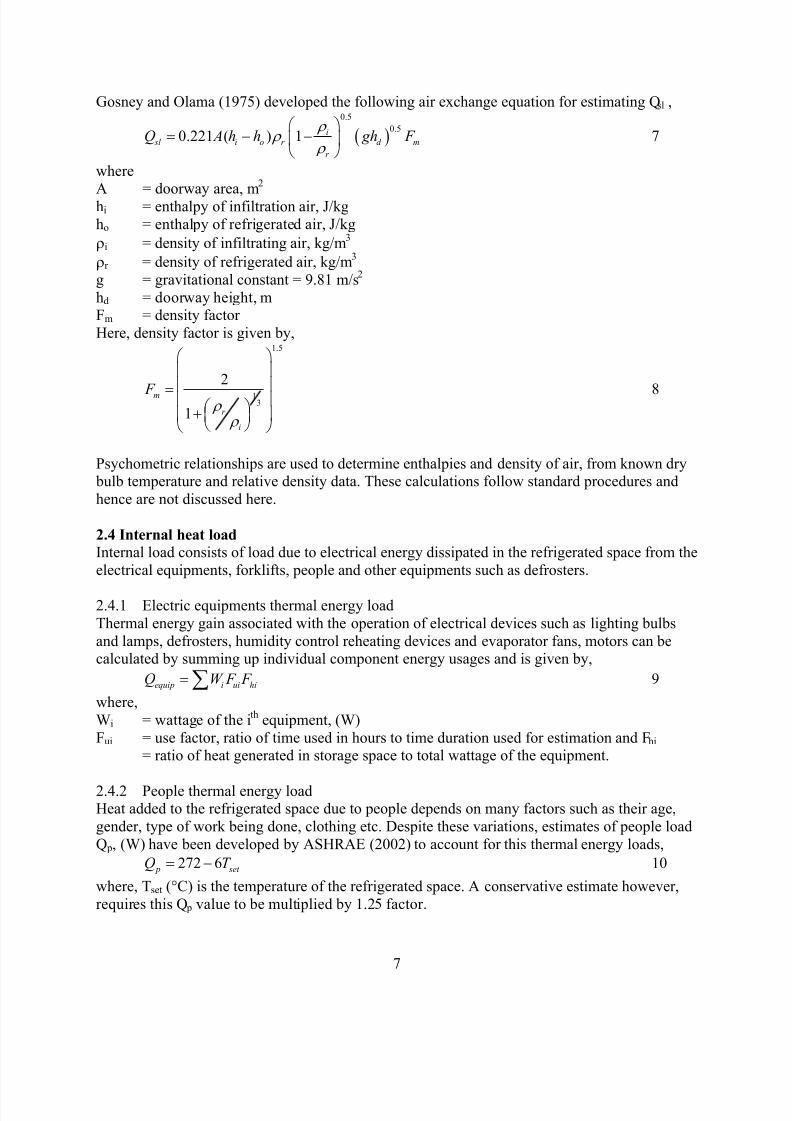
Gosney and Olama (1975) developed the following air exchange equation for estimating Qsl ,
, -0.5
0.50.221 ( ) 1 i
sl i o r d
r
Q A h h gh .
. .
% &" # #( +
) * m F 7
where
A = doorway area, m
2
h = enthalpy of infiltration air, J/kgi
h = enthalpy of refrigerated air, J/kgo
= density of infiltrating air, kg/m3.i
.r = density of refrigerated air, kg/m3
2g = gravitational constant = 9.81 m/s
h = doorway height, md
Fm = density factor
Here, density factor is given by,1.5
13
2
1
m
r
i
F .
.
% &( +
(" ( % &'( +( +) *) *
++
F
set T
8
Psychometric relationships are used to determine enthalpies and density of air, from known dry bulb temperature and relative density data. These calculations follow standard procedures and
hence are not discussed here.
2.4 Internal heat load
Internal load consists of load due to electrical energy dissipated in the refrigerated space from the
electrical equipments, forklifts, people and other equipments such as defrosters.
2.4.1 Electric equipments thermal energy load
Thermal energy gain associated with the operation of electrical devices such as lighting bulbs
and lamps, defrosters, humidity control reheating devices and evaporator fans, motors can becalculated by summing up individual component energy usages and is given by,
9equip i ui hiQ W F " $where,
W = wattage of the ith
equipment, (W)i
Fui = use factor, ratio of time used in hours to time duration used for estimation and Fhi = ratio of heat generated in storage space to total wattage of the equipment.
2.4.2 People thermal energy loadHeat added to the refrigerated space due to people depends on many factors such as their age,
gender, type of work being done, clothing etc. Despite these variations, estimates of people load
Q , (W) have been developed by ASHRAE (2002) to account for this thermal energy loads, p
10272 6 p
Q " #
where, Tset (°C) is the temperature of the refrigerated space. A conservative estimate however,
requires this Q value to be multiplied by 1.25 factor. p
7

8/12/2019 cold stores
http://slidepdf.com/reader/full/cold-stores 14/24
2.4.3 Latent internal thermal energy load
Some of water vapor present inside the warehouse gets frozen around the evaporator coils.
Similarly liquid water used for cleaning or for other purposes may get frozen. These statechanges of vapor and liquid involve latent heats removal, which need to be considered while
calculating total thermal energy load. However, since these are usually very small compared tothe total refrigeration loads, it is usually neglected for load calculations (ASHRAE, 2002).
2.5 Refrigeration system
Once all the four forms of thermal energy gains are computed, they sum up to give the total
refrigeration load. This load is taken away from the product storage space by the refrigerantsthrough refrigeration cycle. Refrigeration cycle has four major components, Compressor,
Condenser, Expansion valve and Evaporator. Out of these, compression, condensation and
evaporation stages require external energy supply. To compress the refrigerant to higher pressure, compressor uses electrical power. Condenser and evaporators in themselves do not
require any external energy supply, however, fans employed to improve heat transfer consume
significant amount of electrical power. In addition to these, some electrical power is consumed torun the pumps employed to circulate the cooling water in the condenser and refrigerant in the
refrigeration system. Total electric load in refrigerated system, E (W) is given by,refsys
11refsys comp fp E E E " '
Where,= Electric Power consumed by compressor, (W)Ecomp
Efp = Electric Power consumed by fans and pumps in refrigeration system, (W)
2.5.1 Compressors
In the refrigeration cycle, compressor is responsible for consuming most of the electrical power.
The work done by the refrigerant, Wcomp (W) can be calculated from enthalpies values of
refrigerant and the its flow rate, m (kg/s),!
123 2(compW m H H !
" # )
where,
= Enthalpy of refrigerant at end of compression stroke, (J/kg)H3
= Enthalpy of refrigerant at beginning of compression stroke, (J/kg)H2
m!
= refrigerant flowrate which depends on the cooling load rate R load (W) and can be
calculated as,
2 1
Load Rm
H H
!
"
#
13
where,
H = enthalpy of refrigerant at exit from the condenser(J/kg).1
Enthalpy of refrigerants can be obtained from the empirical equations developed by Cleland
(1994) for different refrigerants. Once work done by refrigerant during compression is found, it
can be used to determine the compressor electric power requirement, E (W)comp
8

8/12/2019 cold stores
http://slidepdf.com/reader/full/cold-stores 15/24
comp
comp
comp
W E
/ " 14
where,
= efficiency of compressor./comp
2.5.2 Fans and pumps
Average electric load of fans and pumps, Efp (W) is simply given by the sum of product of their
wattage and use factor.
fp i E W " $ ui F 15
where,= wattage of the i
th equipment, (W)Wi
Fui = use factor, ratio of time used in hours to time duration used for estimation
2.6 Total Energy Consumption
The total electric consumption is sum of electric loads in running the refrigeration cycle and
electric driven lights and other equipments used inside the storage volume. Fans, lights, forklifts,defrosters, mechanical and other electrical equipments used inside the storage space affect the
energy consumption twice: Energy must be consumed to run these devices and then energy must
be consumed to remove the heat, that these devices produces during their operation in the storagespace. The total electric power consumption, Etot (W) can be given by
16tot refsys i ui E E W F " ' $where,
= electrical power consumed by refrigeration system, (W)Erefsysth
= Wattage of i element, (W)Wi
Fui = Use factor defined as ratio of duration used to the duration for which computation ismade
i = index for different electricity powered devices that are not part of refrigeration systemsuch as lights, defrosters etc.
Once this electric power consumption is computed on wattage basis, it can be summed over
period of time such as a month or year to obtain monthly or annual consumption values. SpecificElectricity Consumption, SEC (kWh/m3), is an indicator of storage efficiency (usually on annual
basis) and is given by
tot t ime uc E F F
SEC V
" 17
where,
V = storage volume is in m3,
= factor to convert the power to energy (seconds) andFtime
Fuc = factor used to take care of unit conversions from SI units to commercial units.
2.7. Model Development
The model is implemented as a web-tool so that it can be used conveniently by anybody
connected to internet inside web browsers. In the background it uses an ActionScriptTM
to do all
the computations. Target users of this tool are warehouse operators who are interested inestimating the electricity usage inside the warehouse and use this knowledge to take decisions
9

8/12/2019 cold stores
http://slidepdf.com/reader/full/cold-stores 16/24
such as whether replacing a door or the lighting lamps with the improved type would result inenergy savings? They can change the variables in the tool and see how it affects the electricity
consumption. Figures 2 and 3 show input screens, where the user enters warehouse data into the
tool and Figure 4 shows the result values. The web-tool can be accessed online at
http://bae.engineering.ucdavis.edu/warehouseenergy.swf
Figure 2: Screen in web-tool asking user to specify location, storage temperature, size and
insulation used in the warehouse
10

8/12/2019 cold stores
http://slidepdf.com/reader/full/cold-stores 17/24
Figure 3: Screen in web-tool asking user to specify doors, refrigeration system,
bay area temperature and humidity
Figure 4: Screen in the web-tool showing the energy consumption values in the warehouse
11

8/12/2019 cold stores
http://slidepdf.com/reader/full/cold-stores 18/24

8/12/2019 cold stores
http://slidepdf.com/reader/full/cold-stores 19/24
3.0 Project Outcomes
For model validation, complete information about warehouse construction, their operation and product throughputs is required. Unfortunately, such information is not available in literature.
Therefore a warehouse located in the northern California, which was primarily used as a frozenwarehouse was studied. The data collected were dimensions of warehouse, insulation propertiesof walls, roofs and floors, product storage area, door sizes and types, lighting, product flows,
refrigeration system components and monthly electricity consumption.
After substituting values for all variables in the model, the SEC was calculated and it was25.07 kWh/m3
. The actual SEC, as computed by dividing energy bills by the gross volume ofwarehouse was 28.25 kWh/m
3. Annually averaged power consumption was 606 kW theoretically
and 690 kW actually. These gaps of theoretical and actual values can be attributed to the lack of
information about electric consumption of defrosters, heaters, forklifts and office space electricalappliances; infiltration thermal energy load variables; exact product flow information and
refrigeration system of the warehouse.
The contribution of all thermal energy loads and electric loads in this warehouse isdescribed in Table 2. Contribution to total electric consumption was found to be highest due to
internal load (mainly lighting and evaporator fans). Electrical appliances affect the electric
consumption in two ways. First, they need electricity for their operation and also, electricity isrequired to remove the heat generated by them in the storage space.
Table 2 Contribution of kinds of thermal energy loads to total thermal energy load and
total electric consumption
Kind of heat loads % of total heat load % of total electric
consumption
Transmission 36 19Infiltration 0 0
Product 14 7
Internal (Electricappliances)
50 74
3.1 Effect of warehouse size on SEC : To see the effect of size on SEC values, different valuesof volume and area are entered into the model and the SEC values were calculated, which is
shown in Figure 5. Volume and area are varied in such a way that the volume to area ratio
remains unchanged and is equal to 11.3 m. Other inputs were taken from default values. The plotshows that SEC is higher for smaller volume warehouses. This is because the ratio of surface
area exposed to solar radiation to storage volume is higher for small size warehouses leading tohigher transmission thermal energy load per unit volume and consequently higher SEC.
13

8/12/2019 cold stores
http://slidepdf.com/reader/full/cold-stores 20/24
22
24
26
28
30
32
0 50000 100000 150000 200000 250000 300000
Volume (cubic m)
Figure 5: Dependence of SEC on size of warehouse
3.2 Effect of warehouse location on SEC : Air Temperature and solar radiation falling on the
walls of warehouse vary from location to location and thus affects the transmission thermalenergy loads. Four locations in California are selected to study the effect of location on SEC
value. The transmission thermal energy loads and SEC for these locations is shown in Table 3.
As the table shows, there is not much affect of location on SEC. It is because the temperature
difference across the walls is very high (on average about 33ºC) compared to differences inannually averaged location temperature (1-2 ºC) on these locations. Since temperature difference
across the wall surfaces are directly proportional to transmission thermal energy load, the effect
of location is found to be negligible. In this analysis the inside temperature of wall, i.e. storage
temperature, is assumed to be -18ºC (0 ºF).Table 3: Effect of four locations on SEC (Storage Temperature = -18ºC)
Annually Averaged
Temperature (ºC)
Annual averaged transmission
thermal energy loads (kW)
SEC (kWh/m3)
Davis 14.76 213.279 23.59
Tracy 15.40 210.235 23.52
Fresno 16.38 224.181 23.80
San Diego 16.23 225.960 23.84
3.3 Effect of storage temperature on SEC: Inside set temperature affects the refrigerationloads considerably. It affects the transmission, infiltration and product loads. To find the effect of
storage temperature, seven values of storage temperature were entered in the model keeping restof the variables as set at default values and corresponding SEC values were found. The
relationship between SEC and storage temperature is shown in Figure 6. The plot shows that
SEC increases linearly with drop in storage temperature. This is because only transmissionthermal energy load varies in these cases, which is directly proportional to the temperature
14

8/12/2019 cold stores
http://slidepdf.com/reader/full/cold-stores 21/24
difference across wall surfaces and this is directly proportional to the storage temperature for anygiven location.
23
24
25
26
27
28
29
-30-25-20-15-10-50
Temperature (Degree C
Figure 6: Effect of storage temperature on SEC
3.4 Effect of Lighting Devices on SEC : Lighting devices affect the electricity consumption in
two ways. First they need electric power to operate and then electric power is again required (in
form of electric consumption for refrigeration system) to remove the heat they generate in thestorage space. By using more efficient lamps, the electricity consumption can be lowered. More
efficient lights consume lesser wattage per unit luminous intensity. To quantify the effect of
varying lighting devices, SEC is calculated from the model by keeping all inputs as default valueand varying lighting wattage levels. Lighting wattage levels are varied from 5 W/m2 floor area to
15 W/m2 floor area and the corresponding SEC is shown in Table 4. Lighting the warehouse
requires a lot of electric power and its effect on SEC is substantial. This means that by usingmore efficient lights i.e. lighting devices having high luminous intensity to wattage ratio a lot of
power can be saved. When lighting wattage levels are decreased from 10 to 8 W/m2 (or 20%
reduction) then the decrease in electricity consumption is about 10%. Thus by using this tool, a
warehouse operator can find how much power can be saved by replacing the lighting devices,fans, doors or adding an insulation layer.
Table 4 : Effect of lighting wattage levels on SEC
Lighting wattage level (W/m2) Lighting thermal energy
loads (kW)SEC (kWh/m
3)
5 94 18.26
8 150 21.61
10 188 23.91
12 225 26.10
15 281 29.45
15

8/12/2019 cold stores
http://slidepdf.com/reader/full/cold-stores 22/24
3.5 Effect of Product Thermal Energy Loads on SEC : When food products are brought in at
higher temperatures than the storage temperature, they add heat to the storage space whichincreases the refrigeration load and consequently the SEC. To quantify the effect of product
thermal energy load, amount of products brought in at higher temperatures (20ºC or 68ºF) wasvaried from 0% to 100% of total annual storage capacity and corresponding SEC values obtained
from the model are listed in Table 5. For this analysis, the product is assumed to be tomato pasteand its moisture content was taken as 0.40 kg water/kg product. This table clearly illustrates the
magnitude of impact product thermal energy loads can make on SEC. As the percentage of
products brought in at higher temperature was varied from 0% to 100% the SEC increased by61%.
Table 5 : Effect of product thermal energy load on SEC
Percentage of products brought
in at higher than storagetemperature (%)
Annually Averaged Product
thermal energy load (kW)
SEC (kWh/m3)
0 0 23.52
5 39 24.26
10 78 24.97
15 116 25.67
20 155 26.38
30 233 27.83
40 310 29.24
50 388 30.69
100 775 37.82
3.6 Effect of Infiltration heat loads on SEC : When doors of the refrigerated storage space are
held open, there is an air exchange between inside cooler air and outside warmer air from bay
area. This air exchange increases the heat in the storage space and that affects the refrigerationload and eventually SEC. To quantify the effect of this thermal energy load, also known as
infiltration thermal energy load, amount of time door kept open is varied from 1% to 100% of
total daily time and its effect on SEC is calculated. To accomplish this, the number of timesdoors are opened daily is selected as 24 (say hourly once) and duration of time held open (each
time) is varied from 1% to 100% of the 60 minutes. The door is assumed to have no protective
devices to reduce air infiltration. For this analysis, one door of dimensions 2.14 m by 4.28 m is
considered. Annually averaged infiltration thermal energy load and SEC values in correspondingsituations are shown in Table 6. This table shows that even when doors are kept open for all the
time, the increase in SEC is only 7% of SEC when there is no air infiltration thermal energy load.If number of doors used are more, or their sizes are bigger their impact on SEC can be even
bigger. Depending upon their impact on SEC, the warehouse operators can make decisions on
installing the doors with protective devices such as strip doors or air curtain doors which has potential of reducing the infiltration thermal energy load by 90%.
16

8/12/2019 cold stores
http://slidepdf.com/reader/full/cold-stores 23/24
Table 6 : Effect of Infiltration thermal energy load on SEC
3Percentage of time doorsremain open (%)
Annually averaged infiltrationthermal energy load (kW)
SEC (kWh/ft )
0 0 23.52
10 9 23.70 20 18 23.84
50 46 24.33
100 92 25.11
4.0 Conclusions and Recommendations
In this study a theoretical energy benchmarking model was developed for frozen warehouses.
From this study, we can conclude the following:
5. It is possible to estimate the electric power consumption in frozen warehouse using
theoretical thermal energy balance. Predicted and actual SEC values of SEC differed byonly 11% in a frozen warehouse which was selected for validation.
6. Lighting devices affect SEC values substantially. By using 20% more efficient lights i.e.
using lighting levels of 8 W/m2 in place of 10 W/m
2, SEC can be reduced by 2.30
kWh/m3 (~ 10%).
7. Product thermal energy load can affect SEC substantially. If all of the products are
brought in at 20ºC (68ºF), they can increase SEC by about 60%.8. Compared to other thermal energy loads, infiltration thermal energy load is usually small.
It contributes less than 5% to total SEC.
17

8/12/2019 cold stores
http://slidepdf.com/reader/full/cold-stores 24/24